
Healthcare Reform: What’s Ahead and What’s Your Plan? Blair Childs, Senior Vice President,...
30
Healthcare Reform: What’s Ahead and What’s Your Plan? Blair Childs, Senior Vice President, Public Affairs March 15, 2011
-
Upload
rafe-benson -
Category
Documents
-
view
217 -
download
0
Transcript of Healthcare Reform: What’s Ahead and What’s Your Plan? Blair Childs, Senior Vice President,...

Healthcare Reform:What’s Ahead and What’s Your Plan?
Blair Childs, Senior Vice President, Public Affairs
March 15, 2011

• 2,500 hospitals, 72,000 non-acute sites
• Nation’s largest clinical/operational/supply chain comparative databases
• $36 billion in annual spend
• Malcolm Baldrige National Quality Award
• Three time recipient of Ethisphere’s Most Ethical Companies award
• Award winning programs addressing environmentally sustainable sourcing
OwnersAffiliates
Cost ReductionCost Reduction Quality Improvement
Quality Improvement
Risk Mitigation
Risk Mitigation
Execution EngineExecution Engine
The Premier performance improvement allianceHarnessing the power of collaboration
AdvocacyAdvocacy
2

Today’s discussion
• The environment :– “D, D & D” and the healthcare imperative
• The big power shift – Implications and priorities: 2011 – 2012– Will healthcare reform be repealed?
• Health reform implementation– Timeline and general direction
• Where is this headed and what should you do?
3

The Environment: Worry
• ~9% unemployment• 2010 - Federal spending 24% of GDP (highest since WWII)
– Tax revenues 15% of GDP
• 2001 Debt = 33% of GDP; 2010 Debt = 62% of GDP• If remain on current course:
– Deficit remains high through decade and debt will increase to 90% of GDP by 2020
– 2025 - all Federal revenues will only cover interest payments, Medicare, Medicaid, SS
– 2035 - debt will outstrip entire economy
The big deficit driver is healthcare, even w/o reform
4

Debt as a percent of GDP: Deficit Commission
5

President’s National Commission on Fiscal Responsibility and Reform
• Final recommendations received at least 11 of 18 votes– $4 trillion in deficit reduction through 2020– Limit federal health spending to GDP+1% after 2020
Exceeding the targets would trigger action by the President and Congress– Fix Medicare doc payments (SGR) and pay for it by:
Cutting payments to doctors, other health providers, and drug companies Reduce excess payments to hospitals for GME Cut Medicare payments for bad debts
Increasing cost-sharing in Medicare Passing legal reform
– Expand cost-containment demonstration and pilot projects by 2015– Eliminate provider (hospital) carve-outs from IPAB
6

7
Election implications
• 2012 • Jobs and deficit • Healthcare focus: costs
– Transparency– Pay for value (not volume); Test and scale: Innovation Center– Medical malpractice reform
• Implementation, oversight & investigations• Coverage expansion?• Republicans well positioned, but could flip again
– 2012 Senate (23D/10R); Redistricting (195 R; 49 D;92 split;92 Comm), economy, jobs, Tea Party
– Open seats: Bingaman (NM); Lieberman (CT), Conrad (ND), Kyl (AZ), Hutchinson (TX), Webb (VA); Akaka (HI) – (5Ds – 2Rs)
We are not going back to the way things were.Best to proceed as though no change has occurred.

Partisan Control of Legislatures 2011
8

Presidential reelection and unemployment
9

10
Largest State Budget Shortfalls on Record
*Reported to dateSource: Center on Budget and Policy Priorities survey, revised December 2010.

11
State Deficits for FY 2011
ALCA CT DE GA IA IL KS LA M
E MI
MO NC NH
NM NY OK PA SC TN UT VA WI
WY
8.3
36.6
21.621.6
28.9
1.7
11.5
20.2
26.2
12
18.9
3.4
41.5
9.4 8.7 8.8
12.5
9.6
34.7
14.4
9.2
26
9.4
16.1
30.3
9.6
24.1
38.3
6.2
54
15.3
11.3
14.8
32.4
15.613.9
25.6
8.8 9.810.2
14.6
30.2
8.8
21.623.9
3.6
10.3
Percentage shortfall in state and D.C. budgets for fiscal year 2011.
*California based on remaining 2010 shortfall and projected 2011 budget; Oregon has a two-year budget. Source: Center on Budget and Policy Priorities | cbpp.org

The overarching strategic umbrella of healthcare reform
Cuts to Existing FFS System• Market basket reductions• DHS cuts• Nonpayment for anything
preventable or unnecessary
Disrupt Existing System• Bundled Payments• Innovation Center • Demonstrations• ACOs
Track 1 Track 2


• Winners and losers
• Accountability & transparency
• People-centered primary care
• E-health and other innovations
• New focus on population health and social determinants
• Risk-based, value-driven reimbursement (P4P)
• Cost reductions
• Quality across the continuum and focus on transitions
• Smaller hospitals with more intensive care
• New roles of public and private sector (partnerships?)
Future state
Intensivecare
Non-Acute/specialty care
Primary & preventative care
TODAY1766
Intensive care
Non-Acute/specialty care
Primary & preventative care
TOMORROW

15
Payment reform across the payment silos

Jan Feb March April May June July Aug Sep Oct Nov Dec
Hospital value-based purchasing (Proposed)
1/7/11
Program integrity -additional provider
screening (Final)
1/21/11
Annual inpatient update
+ Readmission reduction program
(Proposed )
Medicaid HACs
(Proposed)
Accountable care
organizations(Proposed)
Exchange(Proposed)
Annual Inpatient update +
Readmission reduction program
(Final
Transparency reports (PPSA) (Procedures)
Target dates for release of proposed and final regulations in 2011 implementing provisions of the Affordable Care Act (these are fluid and
likely to move)
Long-term and CLASS
Act(Proposed)
Uniform explanation of
benefits, coverage, definitions (Proposed)
Accountable care
organizations(Final)
State Innovation –
Review & approval process
(Proposed)
Regulations implementing reform: 2011
Hospital value-based purchasing
(Final)
Annual outpatient
update(Proposed)
Annual outpatient
update(Final)

17
Proposed Inpatient Value-Based Purchasing Rule
• Rewards for achievement or improvement
• Budget neutral payment changes begin October 1, 2012 by reducing base operating payments for each discharge by– 1% in FY 2013, – 1.25% in FY 2014, – 1.5% in FY 2015, – 1.75% in FY 2016, and– 2% in FY 2017.
• Quality measures from Hospital Compare measure set – 25 measures (17 process/8 HCAHPS dimensions) in FY 13, and– Adds 20 measures (3 mortality, 8 HACs, and 9 IQI/PSIs) in FY 14

Simulated Impact of CMS VBP Proposed Rule
Number of
Hospitals
Total Base Operating
DRG Payments
2011($ millions)
1% Base Operating
DRG Payments($ millions)
Net VBP Payment ($ millions)
All 3,222 86,457 865 0.0
Urban 2,305 76,514 765 +0.7
Rural 917 9,943 99 -0.7
Large Urban DSH 1763 61,741 617 -13.5
Major Teaching 242 17,426 174 -6.5Premier members:
HQID 201 7,960 80 +6.8
Non-HQID 984 30,061 301 -19.8
QUEST members 143 6,424 3.2 +3.5
non-QUEST members 992 29,658 297 -15.918

Announcement of IC and Patient Safety Initiative
• Announcement anticipated early April• Expected to lay out priorities and process for Innovation
Center• Public/private, HAC/readmissions reduction effort to help
hospitals before 6% payment tied to these measures• Pledge by hospitals, consumers, business, to support• Unclear on measurement system and incentive program
structure. $1.5B tied to program. • Goal: 40% reduction in HACs by 2013 and 20% reduction
in readmissions. • Opportunity for organizations and hospitals to work with
hospitals to improve performance.
19

Collaboratives drive top performance
Process Improvement(Evidence-Based
Care)
Systematic improvement (Inpatient value) Population total value
Payer Partners
► Insurers
► Employers
► States
► CMS
2.0
20

A representative sample of U.S. hospitals
QUEST charter members include urban/rural, large/small and teaching/non-teaching facilities across 31 states
WA
IL
WI
LA
AR
MO
IA
MN
TX
OK
KS
NE
SD
NDMT
WY
CO
NM
ID
UT
AZ
NV
CA
ORMA
RICT
NJDEMD
SC
NC
VAWV
PA
VTNH
ME
FL
GAALMS
TN
KY
MI
OHIN
DCMO
NY
Bed size ranges:22% - 150 beds or less
29% - 151-300 beds25% - 301-450 beds
24% - 451 or more beds
70% Disproportionate
share
33% Safety Net38% teaching
14% rural

Year 1 18 Months Year 2 30 months
Lives saved 8,043 14,649 22,164 25,235
Dollars saved $577M $1.036B $2.13B $2.85B
Patients receiving EBC 24,818 41,130 43,741 63,094
QUEST collaborative driving improvementsYear 1 – 30 month results
22
Evidence-Based Care
Mortality Cost of Care
25% 25%
50%
71%
49%
59%
94%
68% 71%
% of Hosptials in the QUEST Top Performacne Threshold (TPT)
Baseline
Year 1
Year 2
Baseline Year 1 Year 2
6
33
76
# Hospitals Achieving QUEST TPT in all 3
Dimensions
22

Payor Partners
► Insurers
► CMS
► Employers
► States
ACO model: Six core components
A group of providers willing and capable of accepting accountability for the total cost and quality of care for a defined population.
Core Components
• People Centered
• Health Home
• High-Value Network
• Population Health
• ACO Leadership
• Payor Partnerships
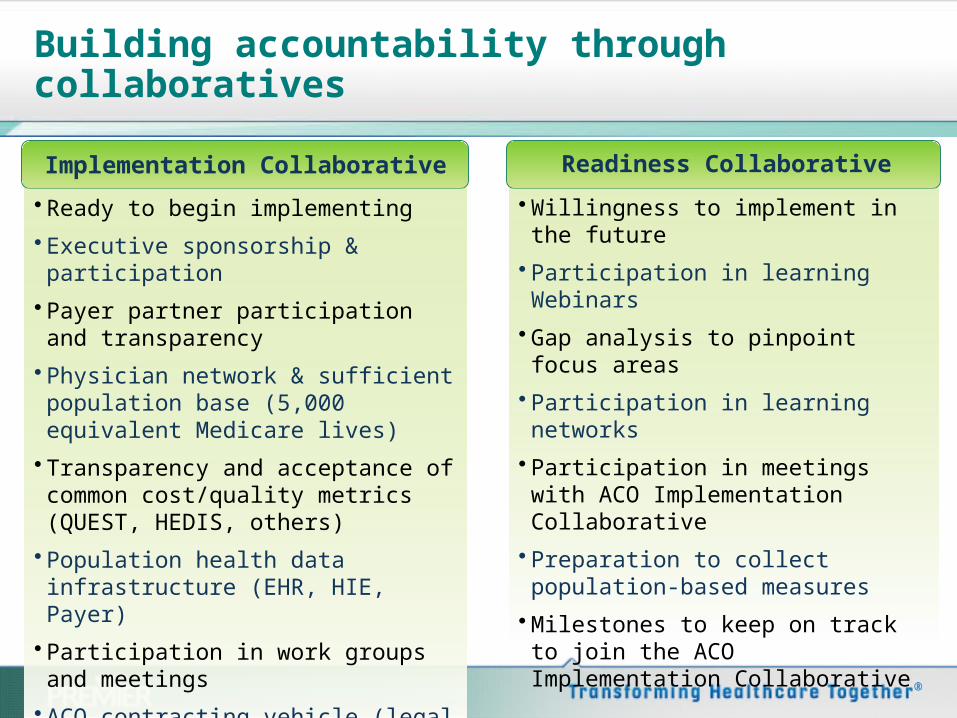
Building accountability through collaboratives
Implementation Collaborative
• Ready to begin implementing
• Executive sponsorship & participation
• Payer partner participation and transparency
• Physician network & sufficient population base (5,000 equivalent Medicare lives)
• Transparency and acceptance of common cost/quality metrics (QUEST, HEDIS, others)
• Population health data infrastructure (EHR, HIE, Payer)
• Participation in work groups and meetings
• ACO contracting vehicle (legal entity)
Readiness Collaborative
• Willingness to implement in the future
• Participation in learning Webinars
• Gap analysis to pinpoint focus areas
• Participation in learning networks
• Participation in meetings with ACO Implementation Collaborative
• Preparation to collect population-based measures
• Milestones to keep on track to join the ACO Implementation Collaborative

Collaborative participants

Bundled payment for single episode of care
Bundled payment for chronic care
Clinically integrated PHO
Employed and independent physicians
Employed physicians only
Varying degrees of integration
Less integrated More integrated

Payor partners
Employers
IBM
Caterpillar
UNITE HERE Local 54 representing:
• Trump Entertainment Resorts, Inc.
• Harrah’s Entertainment
• Hilton Hotels Corp.
• MGM Mirage
Provider-Sponsored Plans Private Plans
Anthem/WellPoint Cigna Blue Cross Plans Coventry HealthSpring/Bravo Medica United Aetna BCBS MT HMSA Horizon BCBS New West BCBS MA
Government Payors
GeisingerPresbyterian New MexicoBaystateSummaBillings Clinic
CMSState Medicaid plansS-CHIP plansVA

Components and Capabilities
People Centered FoundationA. Involve People in Decisions that Affect their Health Care B. Provide People with Easy Access to Health Care C. Activate Individuals to Take Responsibility for their Own Health D. Regularly Assess and Address Individuals' and Population's Needs E. Measure and Improve the Experience of People within the ACO Population
Health HomeA. Deliver People Centered Primary CareB. Optimize Chronic, Acute and Preventative CareC. Manage Population Segments to Optimize Health StatusD. Coordinate Care Across ContinuumE. Health Home Value Care Systems F. Drive Continuous Improvement in Practice Population OutcomesG. Develop New Care Models to Improve Specific Clinical Conditions Across the Spectrum of Care
High Value NetworkA. Deliver High Value Specialist CareB. Deliver High Value Outpatient Facility ServicesC. Deliver High Value Inpatient ServicesD. Deliver High Value Post-Acute Care E. Integrate and Coordinate Care Across the SpectrumF. Drive Continuous Improvement in ACO Population Outcomes G. Develop New Care Models to Improve Specific Clinical Conditions Across the Spectrum of Care
Population Health Data Management
A. Capture and Analyze Data from Multiple SourcesB. Applications and Systems that Enable Population Health ManagementC. Information Exchanges and Communication Pathways for ACO Patients & Participants
ACO LeadershipA. Use Reimbursement to Align ACO Participants with ACO ObjectivesB. Provide ACO Wide Results Reports to all ParticipantsC. Communicate Consistently and Routinely to all ParticipantsD. Provide Strategic Management of ACO EntityE. Manage ACO as a Combined Physician Hospital EntityF. Provide Centralized Medical Management FunctionsG. Report on and Facilitate Management of Total Medical CostH. Manage Intra-ACO Transfer Prices / Costs I. Manage Financial Performance of ACOJ. Oversee Triple Aim Outcomes for Entire Population K. Effectively Manage the Operational Transitions Required to Create an ACO L. Develop an Organizational Culture Consistent with an ACO SystemM. Train Physicians and Other Leaders in Leadership Development in Order to Foster Effective Leadership in a New ACO System N. Enable ACO Contracting O. Evaluate, Analyze, Establish Appropriate Legal StructureP. Educate and Appropriately Manage Interactions Across and Between ACO PartiesQ. Impact and Monitor ACO Regulatory and Legislative Environment
Payor PartnershipA. Negotiate and Manage ACO Contract with Payer Partners B. Design aligning incentive systems for ACO members that may be administered by Payer PartnerC. Collaborate with Payer Partners to Manage Population Experience

Wh
ere
is th
is a
ll head
ed
?
Fe
de
ral b
ud
get w
ill co
ntin
ue
to
pre
ssu
re h
ea
lthc
are
co
st re
du
ctio
n
–K
eeping healthcare spending at the center of the political debate
Re
form
in so
me fo
rm is
he
re to
sta
y
–B
ut, there will be 10 years of fixes
and adjustments
Re
form
s will re
du
ce h
os
pital v
olu
me
&
mak
e w
inn
ers
an
d lo
sers
–R
eadmission and H
AC
penalties, efficiency m
easures, bundled paym
ent, AC
Os, dem
os
201
3 - w
aters
he
d y
ear; 2
011
un
clea
r
AC
Os
an
d IC
will re
main
prio
rity an
d
gro
w in
imp
orta
nce
1.A
CO
s will roll out on at least tw
o tracks
2.R
ule design will be critical
Sta
te issu
es
an
d fo
cu
s pro
vid
es a
n
op
po
rtun
ity a
nd
co
uld
be fu
ture
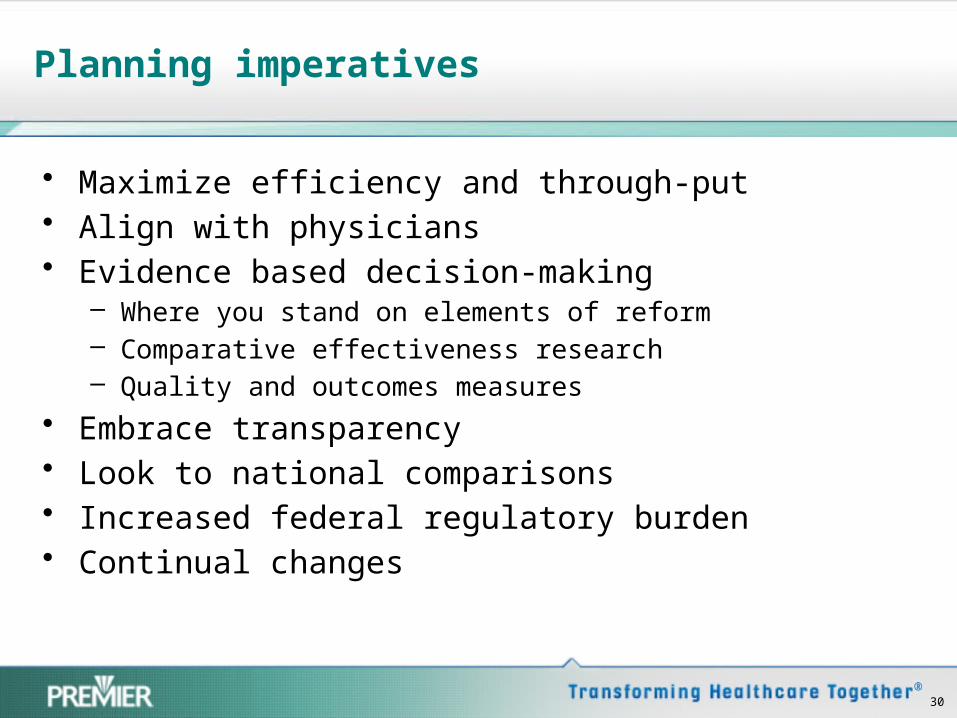
Planning imperatives
• Maximize efficiency and through-put• Align with physicians • Evidence based decision-making
– Where you stand on elements of reform– Comparative effectiveness research– Quality and outcomes measures
• Embrace transparency• Look to national comparisons• Increased federal regulatory burden• Continual changes
30