Healthcare Medtronic Inc. (NYSE: MDT) … devices, favorable in ... machines, diagnostic imaging...
35
Important disclosures appear on the last page of this report. Page 1 Krause Fund Research Spring 2017 Healthcare Recommendation: HOLD Analysts Wenzhe Zhang [email protected] Wenxiong Ye [email protected] Wangye Xu [email protected] Company Overview Medtronic Plc, formerly Medtronic Inc., is the world’s leading medical technology and Service Company. They develop, manufacture, and market a wide range of medical devices, therapies and services for the treatment of diseases such as heart disease, spinal conditions, neurological disorders, vascular disease, orthopedic disorders and diabetes. Medtronic reported a revenue of 28.8 billion in the FY2016. Stock Performance Highlights 52 week High $89.27 52 week Low $69.35 Beta 0.85 Average Daily Volume 4.6 m Share Highlights Market Capitalization 110 b Shares Outstanding 1.39 b Book Value per share $36.08 EPS (FY2016) $2.51 P/E Ratio 28.37 Dividend Yield 2.15% Dividend Payout Ratio 60.56% Company Performance Highlights ROA 3.86% ROE 7.90% Sales $28.8 b Key Management Ratios Current Ratio 3.29 Debt to Equity 0.6 Inventory Turnover Ratio 2.38 Total payout ratios 140.55% Medtronic Inc. (NYSE: MDT) April 18, 2017 Current Price: $80.36 Target Price Range: $82.00-$87.00 Investment Thesis We believe that Medtronic’s current market leadership in medical devices, favorable in industry trends and stable revenue growth will be beneficial to Medtronic future growth. Based on the DCF model, we think Medtronic’s stock is fairly priced, and consequently we issue a “HOLD” rating for Medtronic. Investment Positive Favorable demographics in aging: The global aging population increases the demand for medical devices as older people tend to have more chronical diseases and actively seek for medical treatment. Favorable demographics in income: The rising middle class population also contributes to the increasing demand for medical devices. As people get wealthier, they have a higher possibility of getting hypertension and other related diseases due to changing lifestyles. Potential deregulation and tax cut: Even though the appeal of Obamacare has failed. But that doesn’t mean there won’t be major policy changes in the future. We still believe Trump’s deregulation and tax cut in general as promised during election. Diversified product lines: Medtronic has over 10 mergers over the past two years. These mergers has helped diversify Medtronic’s product lines. Investment Negative Rising competition: Medtronic faces rising competitions in high-tech products from not only domestic competitors, but also foreign companies such as Siemens from Germany and Hitachi from Japan Continuing Pricing Pressures: Medtronic also faces pricing pressures from hospitals as the hospitals are trying to control their capital expenditures. One Year Stock Performance
Transcript of Healthcare Medtronic Inc. (NYSE: MDT) … devices, favorable in ... machines, diagnostic imaging...
Important disclosures appear on the last page of this report. P a g e 1
Krause Fund Research Spring 2017 Healthcare Recommendation: HOLD Analysts
Wenzhe Zhang [email protected] Wenxiong Ye [email protected] Wangye Xu [email protected]
Company Overview Medtronic Plc, formerly Medtronic Inc., is the world’s leading medical technology and Service Company. They develop, manufacture, and market a wide range of medical devices, therapies and services for the treatment of diseases such as heart disease, spinal conditions, neurological disorders, vascular disease, orthopedic disorders and diabetes. Medtronic reported a revenue of 28.8 billion in the FY2016. Stock Performance Highlights 52 week High $89.27 52 week Low $69.35 Beta 0.85 Average Daily Volume 4.6 m Share Highlights Market Capitalization 110 b Shares Outstanding 1.39 b Book Value per share $36.08 EPS (FY2016) $2.51 P/E Ratio 28.37 Dividend Yield 2.15% Dividend Payout Ratio 60.56% Company Performance Highlights ROA 3.86% ROE 7.90% Sales $28.8 b Key Management Ratios Current Ratio 3.29 Debt to Equity 0.6 Inventory Turnover Ratio 2.38 Total payout ratios 140.55%
Medtronic Inc. (NYSE: MDT)
April 18, 2017
Current Price: $80.36 Target Price Range: $82.00-$87.00
Investment Thesis We believe that Medtronic’s current market leadership in medical devices, favorable in industry trends and stable revenue growth will be beneficial to Medtronic future growth. Based on the DCF model, we think Medtronic’s stock is fairly priced, and consequently we issue a “HOLD” rating for Medtronic. Investment Positive Favorable demographics in aging: The global aging population increases the demand for medical devices as older people tend to have more chronical diseases and actively seek for medical treatment. Favorable demographics in income: The rising middle class population also contributes to the increasing demand for medical devices. As people get wealthier, they have a higher possibility of getting hypertension and other related diseases due to changing lifestyles. Potential deregulation and tax cut: Even though the appeal of Obamacare has failed. But that doesn’t mean there won’t be major policy changes in the future. We still believe Trump’s deregulation and tax cut in general as promised during election. Diversified product lines: Medtronic has over 10 mergers over the past two years. These mergers has helped diversify Medtronic’s product lines. Investment Negative Rising competition: Medtronic faces rising competitions in high-tech products from not only domestic competitors, but also foreign companies such as Siemens from Germany and Hitachi from Japan Continuing Pricing Pressures: Medtronic also faces pricing pressures from hospitals as the hospitals are trying to control their capital expenditures. One Year Stock Performance

Important disclosures appear on the last page of this report. P a g e 2
Executive Summary Medtronic Plc, a Dublin-based company, is a leading medical technology and equipment firm with multiple product lines in the health care supplies & service industry. Based on the DCF model, we think Medtronic’s stock is fairly priced, and consequently we issue a “HOLD” rating for Medtronic.
Macroeconomic Outlook Gross Domestic Product Gross Domestic Product (GDP) is a measure of the value of all goods and services produced by an economy in a given year. It reflects the productivity and purchasing power of an economy and therefore has a significant influence on the confidence of both consumers and businesses. One of the major component of GDP is government spending. Since the early 1980s, the U.S. has been the largest healthcare spender in percentage of GDP, and the healthcare expenditure in percentage of GDP has steadily grew since 1980, from around 9% in 1980 to 17.8% in 2015. The growth rate has been stable since the year of 2009, fluctuating around 17% of total GDP. Therefore, GDP is a good metric for healthcare sector.
Source: Centers for Medicare and Medicaid Services [1] Real GDP is inflation-adjusted GDP. As to March 2017, the real GDP is 1.9%, which is relatively stable compared to previous months, fluctuating around 2%. We predict the real GDP growth rate will continue this trend and fluctuate around 2%. Even though the U.S. economy is recovering from the 2008 financial crisis, we are reluctant to give a higher growth rate regarding the uncertainty of Trump’s economic policies.
Source: U.S. Bureau of Economic Analysis [2] Demographics Demographics refers to the study a specific population group based on factors such as age, sex and others. It reflects the characteristics of a certain group of population and therefore can be used in policy development and market research. Demographics in age and income are important factors that drive the growth of the U.S. healthcare sector. In 2015, people aged 65 and over accounts for 14.9% of U.S. population and are expected to grow to 22.1% by 2050. Additionally, the percentage of people aged 80 and over is 3.8% of total U.S. population and is expected to grow to 8.2%1. As more and more people age, the demand for healthcare increases because older people tend to have more chronical diseases. These chronical diseases are usually hard to treat in nature, which encourages healthcare companies to spend more money on research and development in order to find a treatment.
Source: US Administration on Aging As income keeps increasing, more and more people enter middle class. In 2030, the middle class is estimated to constitute 65% of world population. The increase in income will gradually change people’s lifestyle and can potentially cause many chronical diseases such as hypertension, diabetes and obesity. As a result, the demand for long-term healthcare will increase too. The shrinking poor people also marks that more people will gain access to healthcare.

Important disclosures appear on the last page of this report. P a g e 3
Source: Brooking Institution Government Regulation The U.S. healthcare sector is heavily regulated both at state and federal levels. The health insurers, the retail pharmacies, the physicians and the hospitals are usually overseen by the state government. Medical device and drug manufacturers and distributors are regulated by the federal government. The major federal regulatory agency is the Food and Drug Administration (FDA). Manufacturers must obtain Food and Drug Administration (FDA) approval of their products before they can sell them in the U.S. and export them abroad. The approval of medical devices are relatively easier compared to pharmaceuticals because they do not need to go through a stringent review before commercialization. But the process could still take a long time due to documentation and examination. The oversea regulatory environment for healthcare products vary among countries. In general, developed countries such as Japan, Australia and most of the European countries because they share similar protocols. Specifically for EU countries, individual firm only need to get one approval from EU to operate in all EU countries. However, our team is worried about how Brexit will influence the exports of healthcare to EU countries. We predict that the exports pf healthcare to Britain in the following years will be more difficult as individual firm will have a gain a separate approval. Capital Markets Overview The U.S. healthcare sector is an appealing area for investors. Even though this sector is heavily regulated by the government and experience continuous pricing pressures, the market keeps growing and new products keeps emerging. Additionally, the Trump
Administration has failed in appealing Obamacare. In the short run, we believe that there won’t be any major policy changes in the healthcare sector. Therefore, our team believes that it is a good time to invest in the healthcare sector.
Industry Analysis Industry Overview Our team identifies Medtronic in the Healthcare Equipment & Supplies industry. The healthcare equipment & supplies industry consists of companies engaged in manufacturing and distribution of medical equipment and supplies. It is segmented on the basis of product lines by the U.S. Census Bureau for the purpose of estimating the size and shape of the industry. The segments are as follows:2
• In-Vitro Diagnostic Substances Manufacturing: It includes chemical, biological or radioactive substances used for diagnostic test performed in test tubes, Petri dishes, machines and other diagnostic test-type devices.
• Electro-medical and Electrotherapeutic Apparatus Manufacturing: It includes pacemakers, patient-monitoring systems, MRI machines, diagnostic imaging equipment (including informatics equipment) and ultrasonic scanning devices.
• Irradiation Apparatus Manufacturing: It includes X-ray devices and other diagnostic imaging as well as computed tomography equipment (CT).
• Surgical and Medical Instrument Manufacturing: It includes anesthesia apparatus, orthopedic instruments, optical diagnostic apparatus, blood transfusion devices, syringes, hypodermic needles and catheters.
• Surgical Appliances and Supplies Manufacturing: It includes artificial joints and limbs, stents, orthopedic appliances, surgical dressings, disposable surgical drapes, hydrotherapy appliances, surgical kits, rubber medical and surgical gloves, and wheelchairs.
• Dental Equipment and Supplies Manufacturing: It includes dental hand instruments, plaster, drills, amalgams, cements, sterilizers and dental chairs.
• Ophthalmic Goods Manufacturing: It includes eyeglass frames, lenses and related optical and magnification products.
Important disclosures appear on the last page of this report. P a g e 4
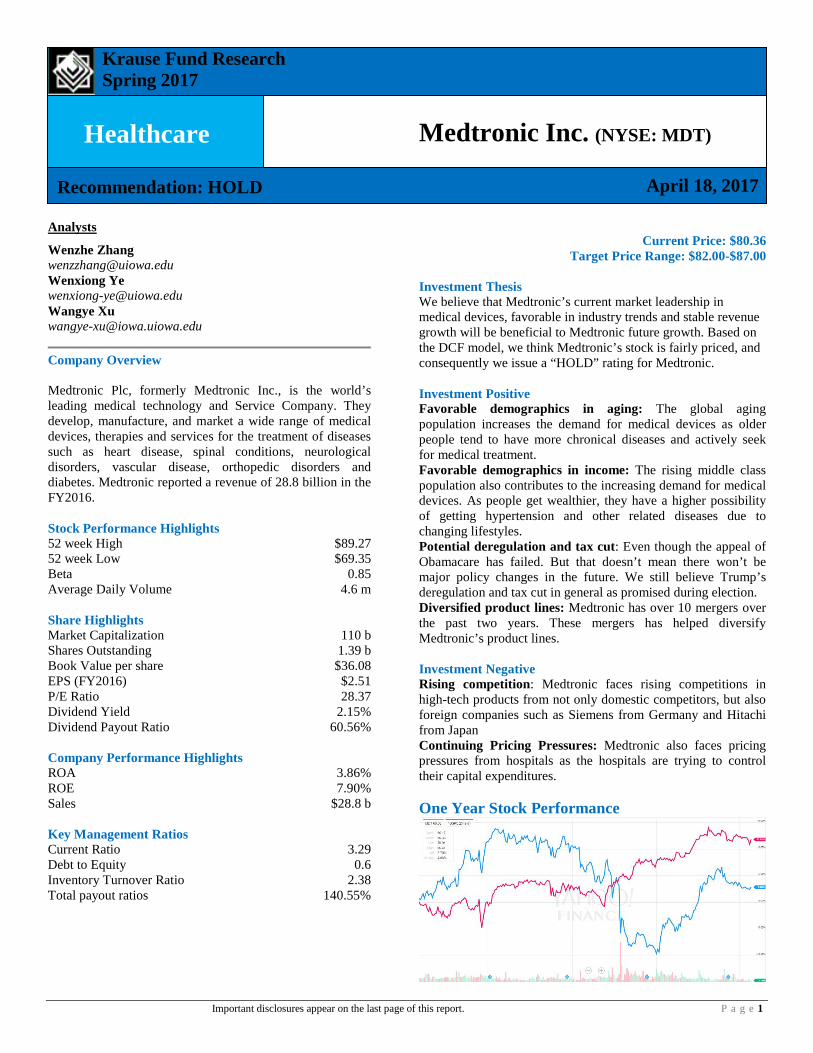
Industry Trends Pricing Pressures Continue The medical device companies have faced continuous pricing pressure from hospitals as hospitals are seeking to control their capital expenditure. From 2003 to 2013, the prices of medical device increase at an average annual rate of 0.9%, which is far lower than the 4.8% growth rate of CPI for medical care services and 4.5% growth rate of CPI for medical care.3
The price pressure of medical devices mainly come from two sources. The first one is the Patient Protection and Affordable Care Act (ACA). The legislation has urged medical device companies to focus on cutting cost and developing affordable products to meet the growing demand of the market. The other comes from the competitive bidding program issued by the Centers for Medicare & Medicaid Services (CMS). This program directly leads to a low rate caused by low-ball bids. We predict the growth rate for medical device prices will continue to be low as 1% to 1.2% because the Trump Administration has failed in appealing Obamacare. In the short run, there won’t be any major changes on ACA and CMS policies.
Source: AdvaMed [2] Growth in Wearable Medical Device Market Wearable devices fall on the category of diagnostic and therapeutic devices and are primarily used to monitor and record a patient’s physiology, provide diagnostics, and inform the patient of the appropriate medical response. The wearable medical device market includes not only medical devices, but also mobile applications. Under FDA’s guidance, the mobile applications are used to diagnose, treat or prevent diseases, so they are considered to be medical devices and are under the regulation of FDA. In February 2015, the FDA came up a set of rules to regulate this market because of the unfounded claims that mobile apps can treat diseases.
Even though the wearable medical devices gained popularity over the past 5 years, there are still concerns among the consumers. One concern is the price. The consumers deem the current wearable devices values do not worth their prices. Another concern is the potential leak of personal information. Growing Markets in Emerging Market The medical devices market is growing in less developed countries and regions such as China, India, Latin America and the Middle East. In 2016, the Asian market generates a revenue of $68.7 billion. It’s estimated that the Asia Pacific region will generate $88.6 billion by 2020. China The medical device market in China will increase due to the health care reform initiated by the Chinese Government. Under this big environment, companies will have easier access to the Chinese healthcare market. In 2015, China has a 1.4 billion population. The aging population the increase of wealth of the Chinese people increase the demand for advanced medical devices. Foreign companies with technology advantage and treatment advantages will be willing expand their business to China. India The Indian medical device industry is relatively small compared to China, which is valued at 4.9 billion.4 However, the Indian market has a huge potential to grow in the following years. Our team estimates a 15% to 20% growth rate from the perspective of rising Indian middle class, the demand for high-end medical devices and regulatory environment. Due to foreign direct investment and the exports of information technology, the number of Indian middle class is increasing. According to a report by Deloitte, India is projected to be the world’s last middle class consumer market by 2030, surpassing China and the U.S.5
Currently, the domestic produced medical devices are low-tech products. These products are not able to be used to monitor and treat complex chronical diseases, and thus creates a high demand for foreign advanced medical devices. In addition, the medical device industry in India is largely unregulated. Presently, only 14 medical products are notified and regulated as medical devices. The political environment in India creates a better investment opportunity for foreign medical device companies. Competition The U.S. medical device industry faces competitions in high-tech products not only from domestic companies, but also from foreign companies such as Siemens and Braun from Germany, Hitachi and

Important disclosures appear on the last page of this report. P a g e 5
Toshiba from Japan, and Philips from Netherlands. These foreign companies manufacture a significant amount medical devices in the United States. For the low technology products, domestic firms face competitions from low-cost manufacturers in China, India, Brazil and Mexico. To remain competitive in the market, the U.S. medical devices companies need to focus on innovation and differentiate their products. Currently, the medical device manufactures has market capitalization of 42.5 Billion. The top four industry players generate 69.8% of total industry revenue in 2016, representing a high level of market share concentration.
Source: IBISWORLD Porter’s Five Forces Bargaining Power of Suppliers-- Low The Global market allows the industry to access on various supplier materials and in differently industrialized economies. It is a large number of the supplier companies cross the world. Also, the conventional product are ease of substitutability, so the suppliers to the industry have low bargaining power. Bargaining Power of Buyers-- Moderate Buyer of the industry are physicians, hospitals and nursing homes. Sometimes the companies have long-term contracts with those large volume buyers. The buyers have more consolidated than the companies in the industry because the manufacturer tried to build supply relationship with the buyers to maintain their market share. Threat of New Entrants-- Low The industry has high barriers to entry in form of the government regulatory restrictions, high R&D cost, and the 2.3% excise tax which issued by the IRS on Dec, 2012. In addition, the smaller new entrants have difficulties competing with the larger companies due to the market share competition, R&D cost, and bargaining power. The large companies have the strong brand identities and it is difficulties to competing with them. Threat of Substitute Products or Services-- Moderate Since some medical product are easy of substitutability by the price advantage. But in fact, high-technology medical products are new-innovative products and often protected by patents. However, the barriers for
entry will not stop substitute products from evolving to competing with the existing product. But the large companies can acquire the small companies with the substitute products which can use the technology from the substitute products to improve their original products. On the other hands, some medical products, the demand for the products in general is strong and growing. Therefore, the substitutes can largely affect the market share of the products in the market. Competitive Rivalry-- High There are many firms in the medical device industry competing with each other for the same Market. The existing competition is very strong due to the technological challenges and low product differentiation in some key markets.
Company Analysis Company Description Medtronic Plc, formerly Medtronic Inc., is the world’s leading medical technology and Service Company. They develop, manufacture, and market a wide range of medical devices, therapies and services for the treatment of diseases such as heart disease, spinal conditions, neurological disorders, vascular disease, orthopedic disorders and diabetes. The company operates in four segments: Cardiac and Vascular Group, Minimally Invasive Therapies Group, Restorative Therapies Group and Diabetes Group.6 The Cardiac and Vascular segment provides a broad spectrum of minimally invasive products and therapies for coronary artery disease, abdominal and thoracic aortic aneurysms, and peripheral vascular disease and heart valve disorders. The Minimally Invasive Technologies Group offers a comprehensive range of advanced surgical technologies and general surgical products, medical supplies, respiratory and monitoring solutions, and venous solutions. The Diabetes group develops, manufactures, and markets advanced diabetes management devices and solutions. The Restorative Therapies segment encompasses the Spinal, Neuromodulator, Surgical Technologies and Neurovascular businesses. SWOT Analysis Strength The Cardiac and Vascular segment is the most important component in Medtronic’s revenue compositions. Medtronic has been in this segment for

Important disclosures appear on the last page of this report. P a g e 6
a long time, and, consequently, its products hold a significant market share in this segment. According to the GlobalData, Medtronic had market shares about had market share of approximately 46.7%, 37.7%, 28.3% in the global cardiac rhythm management devices, cardiovascular prosthetic devices, prosthetic heart valves, respectively.7 Medtronic also spend a substantial amount of money in innovations in order to maintain its advantages in competitions. Weakness Medtronic reported a declining pattern in the Spine division in past three fiscal year. The total revenue was 2.9 billion in the FY2016, which is more than 10% of its revenue of FY2016. The continuing declining pattern in this important division is a signal showing the total revenue in the future may be negatively affected by this division. Product safety concerns are also could be a downside for Medtronic. Customers of Medtronic reported more than 10,000 adverse events to FDA in the between April 2016 and June 2016. (GlobalData) Consequently, the recalls and litigation made Medtronic pays a large amount of money to settle. Opportunities Diabetes group is expected to have an increasing demand in the future, which is likely to benefit Medtronic’s future revenue. The market of diabetes device and equipment is projected to be 27.4 billion by BY2020, according to GlobalData research. Therefore, the diabetes group revenue can be a major driver in the future although the diabetes group is a relative small segment in FY2016. Medtronic received FDA approvals on the new products, and, consequently, it help Medtronic to introduce its products in the US and oversea. The potential deregulations on FDA approval process will also benefit Medtronic in many aspects. Threats Medtronic is involved in patent litigation with other entities. If Medtronic fails to protect its patents or fails to be successful in the lawsuits and ligations, it may be negatively impacted. If its competitors have the most advanced technology, it might lose revenue in this intense industry. Moreover, Medtronic may see more pressures on pricing competitions in the future.
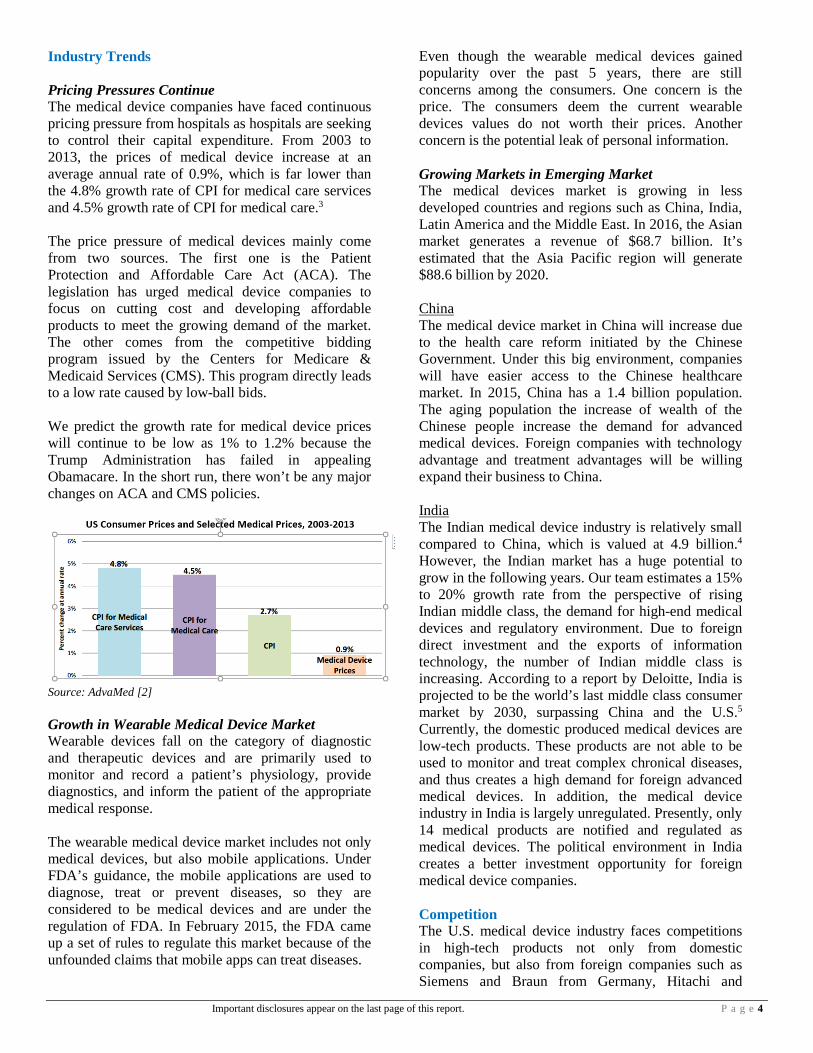
Revenue Decomposition
Source: Medtronic 2016 10K Medtronic reported a revenue of 28.8 billion in the FY2016. The Cardiac and Vascular Group contributed the most significant portion of the total revenue—10.2 billion of total revenue. Minimally Invasive Therapies Group, which was originally from the Covidien’s operating, contributed 33.1% of total revenue in FY 2016. Restorative Therapies Group and Diabetes Group contributed 7.2 billion or 25% of total revenue and 1.9 billion or 6.46% of total revenue of FY 2016, respectively.8 Cardiac and Vascular The Cardiac and Vascular segment classifies its products into three divisions: Cardiac Rhythm & Heart Failure (CRHF), Coronary & Structural Heart (CSH) and Aortic and Peripheral Vascular (APV). The Cardiac and Vascular Group is the core business in Medtronic’s operation and it contributed the most significant portion of the total revenue 35.36% of total revenue in FY2016. Within the Cardiac and Vascular Group, the CRHF division contributed the largest portion of revenue, which is around 5.46 billion. According to the Medtronic 2016 conference call, the global CRHF market will be growing at a low to mid-single CAGR in next five years.8 Considering that Medtronic is about to launch some transformative innovation in this CRHF market, we think the Medtronic’s CRHF division is going to grow at a mid to high-single-digit pace. The APV revenue increased over 50% in the FY 2016 with the launch of new products. Considering the innovative products that are about to launch in next two years, we think the APV division may continue to grow at double-digit rate.
Important disclosures appear on the last page of this report. P a g e 7
Source: Medtronic 2016 10K Revenue Decomposition within Group 2016 2017E Cardiac Rhythm & Heart Failure
5465 5648
Y/Y Growth 4.19% 3.36% Coronary & Structural Heart
3093 3155
Y/Y Growth 1.81% 2.0% Aortic & Peripheral Vascular
1638 2063
Y/Y Growth 51.95% 25.97% Total Cardiac and Vascular Group
10196 10867
Y/Y Growth 8.92% 6.58% Source: Medtronic 2016 10K Forward Looking Forecast We think the revenue of the Cardiac and Vascular Group will keep a steady growth rate in the foreseeable future, considering the new innovative products. Medtronic has been a major player in the Cardiac and Vascular Group for years although it may face more intense competition from other firms, such as Johnson & Johnson and Abbott Laboratories. The mature market and heavy competitions will slow Medtronic’s revenue growth in this group. As Medtronic expands into emerging markets, it may gain additional revenue from the emerging market in this segment. Therefore, we anticipate that the revenue growth rate in the FY 2017 will be around 6-7%. Minimally Invasive Therapies Group
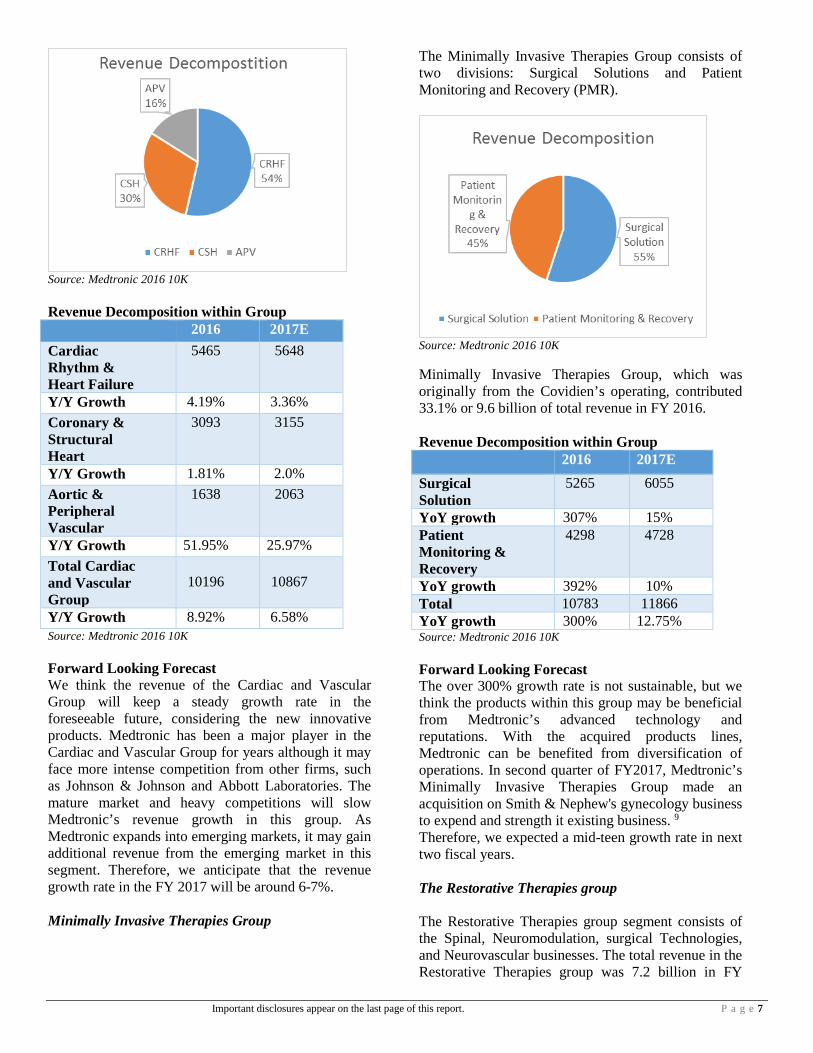
The Minimally Invasive Therapies Group consists of two divisions: Surgical Solutions and Patient Monitoring and Recovery (PMR).
Source: Medtronic 2016 10K Minimally Invasive Therapies Group, which was originally from the Covidien’s operating, contributed 33.1% or 9.6 billion of total revenue in FY 2016. Revenue Decomposition within Group 2016 2017E Surgical Solution
5265 6055
YoY growth 307% 15% Patient Monitoring & Recovery
4298 4728
YoY growth 392% 10% Total 10783 11866 YoY growth 300% 12.75% Source: Medtronic 2016 10K Forward Looking Forecast The over 300% growth rate is not sustainable, but we think the products within this group may be beneficial from Medtronic’s advanced technology and reputations. With the acquired products lines, Medtronic can be benefited from diversification of operations. In second quarter of FY2017, Medtronic’s Minimally Invasive Therapies Group made an acquisition on Smith & Nephew's gynecology business to expend and strength it existing business. 9 Therefore, we expected a mid-teen growth rate in next two fiscal years. The Restorative Therapies group The Restorative Therapies group segment consists of the Spinal, Neuromodulation, surgical Technologies, and Neurovascular businesses. The total revenue in the Restorative Therapies group was 7.2 billion in FY

Important disclosures appear on the last page of this report. P a g e 8
2016. According to the 2016 Medtronic conference call, the Restorative Therapies group is going to be a 10 billion in the FY2021 with a CAGR of 5-6%. 8
Source: Medtronic 2016 10K Revenue Decomposition within Group 2016 2017E Spine 2924 2866 YoY Growth -1.5% -2.0% Neuromodulation 1926 1984 YoY Growth -2.5% 1.5% Surgical Technologies
1773 1870
YoY Growth 5.5% 5.0% Neurovascular 587 646 YoY Growth 344% 30% Total 7210 7338 YoY Growth 6.8% 3.4% Source: Medtronic 2016 10K Two products—Spine and Neuromodulator, within this segment had a negative growth rate in the FY2016. The negative growth rate shows the weak demand and intense pricing competitions in past fiscal year. Consequently, we think the revenue growth may still be weak for those two divisions in the FY17, as the pricing pressure keeps existing. Another division—Neurovascular—shows an over 300% revenue increase since the Neurovascular division was acquired from Medina Medical at FY 2015.9 Apparently, the growth rate is not sustainable in the future, instead we expect a 30% growth in the FY2017, considering the strong demand navigation capital equipment, disposables, and the O-arm O2 surgical imaging system.11
Forward Looking Forecast In conclusion, we anticipate a growth rate of 3.4% in this group in the FY2017. The anticipated FY17 growth rate is much lower than 2016’s because the revenue decline trend for two division will continue and the 300% growth rate may seems unrealistic in FY2017. Diabetes Group Revenue Decomposition within Group 2016 2017E Total sales
1864 2088
YoY growth
5.8% 12%
Source: Medtronic 2016 10K The revenue of diabetes group in the FY 2016 was 1.86 billion, which is a relatively small portion of Medtronic’s total revenue. However, we think the diabetes group could be a strong driver for Medtronic in the future. The major products of the Diabetes Group include Integrated Diabetes Management solutions including integrated insulin pumps and CGM systems; professional CGM systems; and CareLink therapy management software to help patients and their health care providers control diabetes. According to the article written by Elbert S. Huang, MD, MPH, the total numbers of people with diabetes in the US will raise from 23.7 million to 44.1 million in 2034.10 Consequently, the total spending on diabetes will be tripled in next 20 years, reaching above 500 billion (2007 dollars) in the United States.10 Those data are only about the US, and the worldwide diabetes patients and spending would be much larger in nominate dollar. Consequently, the Diabetes Group may be benefited from trend. Last fiscal year, the majority revenue of diabetes group was from “Type 1& Sensor” business.8 Medtronic plans to focus more on the diabetes management business. The 1.8 billion revenue was primarily generated from US market, yet Medtronic is about to engage intensively in the emerging market in the foreseeable future, transferring this US-focused business into a global business. Moreover, Medtronic also has specific strategy designed to boost its revenue in diabetes group. According to Medtronic’s conference call, the medical-device company is going to focus on the rapidly growing segment, which has high growth potential, rather than the maturity segment in the

Important disclosures appear on the last page of this report. P a g e 9
future. Pumps & Sensors segment, which is expected to have high demand in the future, will be the key segment that Medtronic is about to focus on. 8 Therefore, we think the potential of diabetes group is abundant, and it will become a major part of future revenue driver. We anticipated a mid-teens growth in the FY17. In the fiscal year 2018 to 2022, we think the diabetes group will enter a blooming growth stage as many people will be seeking for diabetes treatment. Therefore, we are positive about the growth of diabetes, and thus we anticipate a double-digit growth in fiscal year 2018 to 2020. Forward Looking Forecast We think the diabetes group will reach a blooming stage in the future since more patient will need treatment and diabetes management devices in the foreseeable future. Therefore, we anticipated a low to mid-two-digit growth rate in next three fiscal years. In the CV year, we anticipate a growth rate around 4% in the diabetes group, although this group is projected to have rapid growth between FY2017 to FY2020. We think that pricing pressure will raise and more competitors will enter this market as the demand in this group continue to raise. Therefore, considering the intense competitions in the future, we think 4% of growth rate in the CV year is appropriate. Forward Looking Revenue Forecast
Based on the discussion above, we are expecting a high-single-digit growth rate for next three fiscal years, considering the emerging market expansion, innovative products, and favorable potential-customers trend. After the rapidly growing stage, we think Medtronic will enter a transitional stage between FY2020 and FY2022. We anticipate the growth rate will be mid-single-digit in the transitional stage as the pressures from competitors will raise. We anticipate the company will reach mature stage on both revenue growth and market expansion around the fiscal year of 2023 as the competition may be continuously intense. We anticipate a continuing
growth rate of 3% in total revenue for the fiscal year of 2023 and afterward. Productions Innovation Medtronic spent a substantial amount of capital in new therapy innovation. According to Medtronic’s 2016 conference call, the company is expected to launch over 80 new productions over next three years. Those new productions are expected to be the new catalysts in boosting Medtronic’s revenue in the future. Those new products will allow Medtronic to differentiate itself from intense competitions. For example, Medtronic is about the release a products called “Minimed Connect” that will stream patients’ real-time data and allows patients to access to the cognitive analysis of real-time data.8 Innovative and differentiate products will allow Medtronic to attractive more customers from its competitors. Medtronic is expected to generate around 4 billion revenue from those new productions from FY17 to FY 21, according to its 2016 conference call. Markets Analysis
Source: Medtronic 2016 10K In the FY 2016, the US market is still the largest market for Medtronic’s revenue, which contributed about 57% of total revenue. Non-US developed markets contribute about 30% of total revenue in the FY 2016, and the emerging market was only about 13% of total revenue in FY2016.9 Medtronic has competitive advantages in the emerging market in many aspects. For example, Medtronic has the most advanced technology among the local competitors. For example, they have partnership with IBM Watson Health to allow its patients to have

Important disclosures appear on the last page of this report. P a g e 10
predictive analytics.8 With the advanced technology and patents, Medtronic is more likely to gain market shares in the emerging market. Considering the rapid economic development in some majority emerging markets, such as India and China, we think the emerging market may become a significant driver in revenue growth in the future.
Source: Medtronic 2016 Medtronic plc Investor and Analyst Meeting Within the emerging market, the Great China region contribute the most significant part in emerging market revenue—around 40% of emerging market revenue was contributed by the Great China region. In order to serve emerging market better, Medtronic has 5 R&D centers and 4 training centers in emerging market. Medtronic is trying to localize its products into the emerging market through physician education, and local reimbursement and tendering strategies.13 For example, considering emerging markets’ situations, Medtronic has developed some localized products, such as the ValleyLab LS10 single channel vessel sealing generator, which was designed simplified use and affordability.9 Moreover, Medtronic also localized manufacturing in emerging market and maintain positive long-term partnership with local government and distributors.13
Additionally, Medtronic also optimized the distribution channel in emerging market in order to raise operating margin and operating efficiency in emerging market. Consequently, as the emerging market’s demands for advance medical devices raise, Medtronic will generate more revenue from the emerging markets. We anticipate that the emerging market would generate a 100 to 150 basis points increase in total revenue in next five fiscal years.
EPS and Payout
Cash dividend payout ratio is calculated by EPS/ Cash dividend declared. All data are on GAAP basis. Source: Medtronic 2016 10K The basic EPS was $2.51, $2.44, and $3.06 in the fiscal years of 2016, 2015, 2014, respectively. The basic EPS growth for 2016 and 2015 was 2.9% and -20.2%, respectively. Although the basic shows a declining pattern in recent five fiscal years, it does not mean Medtronic did a poor jobs in margin management. Instead, the 2015 acquisition of Covidien changed both the capital structure and operation structure within the medical-device company. Therefore, financial date before the acquisition are not representative. Two major reasons that decrease the FY2016 EPS were the new issuance of common stocks and addition amortization from acquisition of Covidien. In the FY2016, 300 millions of shares were issued to acquire Covidien’s operation. In the fourth quarter of FY2016, Medtronic realized a full year impact of amortization of intangibles acquired with Covidien, resulting a one billion increase in amortization expense in FY2016.9 EPS Forecast

Important disclosures appear on the last page of this report. P a g e 11
We expect the EPS to grow annually at a low-double-digits for next three fiscal years, considering the revenue growth, normalized amortization expense, and shares repurchased. Payout Analysis and Forecast Conversely, the company also paid a solid dividend in past five years. Its cash dividend payout ratio kept growing at a steady pace, raising from around 30% to more than 60% from FY2014 to FY 2016. The company paid a $1.52 dividend per share in the fiscal year of 2016 with a cash-dividend payout ratio of 61.29%. Moreover, Medtronic also repurchase shares from the market for a substantial amount in recent years. In FY2015 and FY2016, the medical-device company spend 1.27 billion and 2.34 billion on repurchase stocks from the market. Furthermore, the total payout ratio excess 100% for both FY2015 and FY 2016, indicating that Medtronic pays more than its net income of that year. However, we think the total payout ratio is sustainable since Medtronic has excess cash on hand and sustainable free cash flow, and we think it will maintain the high payout ratio in next a few fiscal years. The guidance of next year EPS from the conference call shows that the company may pay more dividends or spend more on share repurchase program since its CFO stated that Medtronic will return 50% of its free cash flow and return 5 billion dollars through dividend and repurchase by the end of FY 2018.11 We think the guideline is realistic since Medtronic’s balance sheet is solid, and the company has ability to maintain or even increase its payout in next a few fiscal years. The steady growth of quarter dividend is a signal that investors are willing to see and is also a signal showing the strength of future expectation. We think the Dublin-based company will continuously pay high dividend and spend substantial amount of cash on repurchasing stocks. We anticipate the company will payout 60-65% of its net income as dividend in the future. Corresponding to the growth rate of EPS, the growth rate of cash dividend per share is projected to be low-double-digit for next three fiscal years.
We think the company may maintain it repurchase payout FY2017 and FY 2018 but it might decrease the repurchase payout if the company would like to make significant acquisitions in the future. Recent Development After the acquisition of Covidien, the company moved its headquarters to Ireland, receiving a lower corporate tax rate than it did in the United States. Compared with US cooperate tax of 35%, the corporate tax rate of Medtronic was 12.5% in 2016, and the effective tax rate are anticipated to decrease to 17% in FY of 2017 according to the Q2 FY17 conference call.13 The lower tax should be able to bring more free cash flow to the company and, consequently, benefit the company and its shareholders. Under Trump’s administration, the medical device is likely to first benefit from the tax cut, according to business insider.17 Competition and Risks Medtronic is located in a highly intense industry with rapid changes from advanced technologies. Therefore, Medtronic needs to create or acquire advanced technologies, incorporate this technology into products, and get regulatory approval in a timely manner to stay competitive in the medical device industry. To keep its advantages on technology, Medtronic have made several acquisitions in FY2016, for example, Medtronic acquired Twelve, Inc., RF Surgical Systems, Inc., and Medina Medical in FY2016.9 These acquisitions allow Medtronic to enlarge its products segment with brand new products, to have competitive advantages in the competition of medical-device market, or to center a new segment. The advanced technology allows Medtronic to charge a premium on its supreme products and maintain a high operating margin. If Medtronic could not keep up

Important disclosures appear on the last page of this report. P a g e 12
with the advanced technology in the future, the company may lose revenue and the margin may shrink. This industry is heavily relying on the patents. If Medtronic fail to protect its patents or fail to be successful in litigation may results a negative impact on market share and future revenue.9 The repeal on ACA could lead to decrease the patient who visit hospitals, clinics, and third-party health care providers, which is major customers of Medtronic. Consequently, it will in turns decrease future revenue of Medtronic. Catalysts for growth Aging Population Growth In 2012, the number of Americans aged 65 or over was 43.1 million persons, or approximately 13% of the total population in United State, but in 2050, the number of Americans aged 65 or over is expected to be twice the ageing population in 2010. The projected aging population is 83.7 million in 2050, approximately 20.2 percent of total population.9 Consequently, the increase of the senior population is driving up the demand for healthcare. As the number of people aged 65 or older increases, additional healthcare resources and services is needed to serve the demand in the future. The trend will boost Medtronic’s sustainable sales in the future. Acquisitions on Technology Medtronic makes acquisitions to gain access to the most advanced technologies. This strategy also allows Medtronic to secure possible new patents and prevent possible future competitions. In the past two years, Medtronic has made a substantial amount of acquisitions, which boosted its revenue in its last fiscal year. With the acquisitions, Medtronic either improved it original products or engage in a new segment. Generating revenue from new products or new segment is the most effective way to make progress in revenue growth. Therefore, we think acquisitions on new technology can be a significant driver in the future. Trend of Chronic Diseases The obesity rate is projected to raise to 50% by 2030 in the US while the obesity may bring a lot of chronic diseases to individuals.20 Consequently, more and more patients will seek treatment and solution for chronic diseases, and the demand for medical devices will soar correspondingly in the future. Therefore, the unfavorable trend may boost Medtronic’s business positively.
Deregulation and Tax Cut Under Trump’s administrative, healthcare sector is likely to have deregulation and tax cut in recent year.12 We think that both the deregulation and tax cut are very meaningful to Medtronic. If Trump makes the FDA approval process less burdensome in the future, Medtronic is likely to get benefits from the faster approval process. Tax cut can also be a key factor that influents the intrinsic value of Medtronic. According to the sensitivity model, if the marginal tax for Medtronic is lowered 4%, the intrinsic value of the stock will more than 5 dollars (or 6%). In his election campaign, Trump made a clear promise to slash the corporate tax from 35% to 15%. We think the corporate tax cut may happen. If a desirable tax cut does arrive, Medtronic will save a substantial amount on tax, which will in turn stimulated the intrinsic value of its stock.
Valuation Discussion Income& Expense forecast In the valuation model, we used two-year stock price changes to calculate the beta since the capital structure has been changed significantly after the acquisition of Covidien. We use currently 30-year Treasury bond return as our risk-free rate and 5.0% as market risk premium. We use the YTM on the most recent 30-year debt as our cost of debt, which is about 4.64% at end of FY2016. As a result, the market value weighted average cost of capital is 6.4% at end of FY2016. Forecasting Cost of Goods Sold In the first three years, we keep COGS (including depreciation) as a constant percentage of 32% of the total revenue, which is close to it previous cost level, since we think Medtronic can maintain costs control as the company optimize its supply chain management. We expect the company to spend more in the following years as the costs of raw material, especially the crude oil, are likely to increase. Additionally, the depreciation will also raise as the PP&E (net) increase. Therefore, we forecast a slightly higher percentage for COGS in the CV year. Forecasting R&D Expense We keep the R&D spending as a constant percentage as total revenue. We think the R&D is a key component in its business, and Medtronic is not likely to decrease its R&D expense in foreseeable future. Therefore, we keep it a constant percentage of sales, which is 7.9%, which is calculated based on previous 2-year average. Facing the intense competition in mid-term and long-term future, Medtronic is projected to

Important disclosures appear on the last page of this report. P a g e 13
increase its budget of R&D to keep its leading position in this industry, so we set 8.05% of total sales as R&D expense in the CV year and afterward. Forecasting SG&A and Other Expenses SG&A expense is settled as a constant percentage of sales as well. We internationally set a progressively decreasing trend for SG&A since we anticipate Medtronic will optimize its management and will have more bargain ability on routine office supply costs. Based on the past two-year trend, we established a constant percentage of sales for other minor costs and expense as those cost could be highly unpredictable. Forecasting Other Key Accounts In forecasting DTA and DTL, we intentionally keep them from major change in order to keep NOPLAT from additional noise. The change of DTL and DTA may pull up more pull down the NOPLAT and its growth rate significantly but it does not add value to its business. Therefore, we keep the change of deferred liability account in the NOPLAT calculation in a relatively small amount. We increase long-term debt, as well as short-term borrowing, in next a few fiscal years, considering the low-interest environment and steady cash flow payout. Dividend Discount Model Our DDM model shows the intrinsic value of Medtronic is $60.77 per share. However, the trading price for Medtronic is about $80 per share. These differences are generated from the fact that the DDM model only take cash dividend payout into consideration. However, Medtronic keep repurchasing its stock from secondary market in past several fiscal years. In the FY2016, Medtronic paid 3.4 billion as cash dividend to its shareholders, and it also repurchase a substantial amount of stocks, which worth 2.6 billion at the time of repurchase. Therefore, failing to consider the effects of repurchase program seriously underestimate the real total payout level of Medtronic, and in turns underestimate the real value of its stock in the DDM model. If we adjust the DDM model by putting all cash payout into consideration, we should end up with a much higher intrinsic value today, since the total payout level is much higher than cash dividend payout level. DCF Model Analysis The DCF model shows a consistent result as the real trading price today, which is around 82.34 dollars per share. The intrinsic value tells us that the market fairly values Medtronic’s stock on the secondary market but there is still a slight upside for Medtronic.
Moreover, the intrinsic in based on the above assumptions. If Medtronic could make small improvement on key items, such as operating margin, its intrinsic value may be boosted in a large scale, and vice versa. ROIC Analysis Based on our DCF model, we anticipate that Medtronic will continuingly delivery a relatively high ROIC in the forecasted fiscal years.
The ROIC is expected to be much higher than the WACC in the forecast. The WACC is projected to be constant of 6.4% in the future, while the ROIC is fluctuating around from 15.26% to 18.01% in the forecasted period. As the ROIC keep being higher than the WACC, the company will be continuing adding value to its shareholders’ equity. Relative P/E Model The relative P/E model indicate that the value of Medtronic is about $60.39 per share, which is close to what DDM model suggests. Both DDM and relative P/E model suggest that the Medtronic is seriously overvalued, and we should issue a “SELL” rating for it. However, we do not believe that it is overvalued. As we discussed about the flaws of DDM model in valuating Medtronic, we believe the relative P/E model does not indicate the real value of Medtronic. The average P/E ratio among the peers is about 20, while the P/EPS2016 ratio for FY2016 was over 30. This indicates that the market is viewing Medtronic as a growing stock with substantial potential in the future, while the peers, such as JNJ and ABT, are generally in the mature stages. As Medtronic keep growing to mature stage, its P/E ratio may drop to mid-teens level in the CV year. Therefore, we believe Medtronic’s stock is worth more than what P/E model indicates. Sensitivity Analysis The first table was designed to test Medtronic’s two operating variables, which are SG&A as percentage of revenue and R&D as percentage of revenue in the CV year. The result shows that the both variables have massive impact to the intrinsic value. For example, if the cost of SG&A as percentage of revenue decrease 0.2% in the CV year, the intrinsic value will increase

Important disclosures appear on the last page of this report. P a g e 14
from $82.34 to $101.29(23% increase). If the cost of SG&A as percentage of revenue increase 0.2%, the intrinsic value will decrease from $82.34 to $70.38 (15% decrease). The R&D variable has similar impact on the intrinsic value. Therefore, we think the operation management on cost control is real a key to maintain its intrinsic value. If the company fails to maintain an efficient cost control in the CV year, the value of Medtronic may be destroyed. The second table was design to test the impact of risk-free rate and another operating variable in the CV year. As other two operating variables did, the COGS as percentage of revenue has great impact on the intrinsic value. Moreover, the risk-free rate has even greater impacts on the intrinsic value. A 2% decrease in the risk-free rate can make the intrinsic value raise to over $400, and increase in risk-free rate may destroy value significantly. In current rate-hiking environment, we anticipate the potential rate hikes may have negative impact on intrinsic value. The third table was designed to test two key ratio in the CV year. The results show that both ROIC and NOPLAT growth rate in the CV year have some impacts on Medtronic, although the impacts are not as significant as previous operating variables’. The fourth table was desired to test the Beta and equity risk premium in our model. The results show that both factors have significant impacts on the final intrinsic value. If the Beta decreases to 0.65, and equity risk premium decrease to 3%, then the intrinsic value will be doubled. We believe that both variables are important in our DCF model since the discount factor is one of the most important variables that have direct impact on the intrinsic. The last table tests the impacts of marginal tax rate and cost of debt. The results show that both two factors have moderate impacts on the intrinsic value. If Medtronic have tax cut in the future, its intrinsic value will increase in a moderate manner. It also shows that the potential tax cut will benefit Medtronic’s intrinsic value.

Important disclosures appear on the last page of this report. P a g e 15
Reference
1. Snyder, K. (2016, October). Industry Surveys Health Care Equipment & Supplies. Retrieved January 31, 2017, from http://www.netadvantage.standardandpoors.com/NASApp/NetAdvantage/loadIndustrySurvey.do?task=loadIndustriesPage
2. (n.d.). 2016 Top Market Report Medical Devices. Retrieved April 17, 2017, from http://www.trade.gov/topmarkets/pdf/Medical_Devices_Executive_Summary.pdf
3. Donahoe, G., & King, G. (2015, June). Estimates
of Medical Device. Retrieved April 17, 2017, from http://www.advamed.org/sites/default/files/resource/994_100515_guy_king_report_2015_final.pdf
4. The medical device industry in India. (n.d.). Retrieved April 17, 2017, from http://www.skpgroup.com/data/resource/skp_the_medical_device_industry_in_india_.pdf
5. India matters: Winning in growth markets. (n.d.).
Retrieved April 17, 2017, from https://www2.deloitte.com/content/dam/Deloitte/uk/Documents/about-deloitte/deloitte-uk-about-india-matters.pdf
6. Stock Report Medtronic PLC. (2017, February
11). Retrieved February 15, 2017, from http://www.netadvantage.standardandpoors.com/NASApp/NetAdvantage/sr/showStockReport.do
7. Medtronic Plc (MDT) - Financial and
Strategic SWOT Analysis Review. (2017, February). Thomson One, 65-68.
8. Medtronic plc Investor and Analyst Meeting.
(2016, June 6). Retrieved February 15, 2017, from http://phx.corporate-ir.net/phoenix.zhtml?c=76126&p=irol-EventDetails&EventId=5227048
9. Medtronic, Plc (2016) Form 10-K
10. Huang, E. S., Basu, A., O'Grady, M., &
Capretta, J. C. (2009, December 01). Projecting the Future Diabetes Population Size and Related Costs for the U.S. Retrieved April 18, 2017, from
http://care.diabetesjournals.org/content/32/12/2225
11. Q2 FY17 EARNINGS CALL
COMMENTARY. (2016, November 22). Retrieved February 15, 2017, from http://phx.corporate-ir.net/phoenix.zhtml?c=76126&p=irol-EventDetails&EventId=5227210
12. Carey, N., & Cornwell, S. (2016, December
09). Under Trump, the medical device industry will likely be the first to benefit from tax cuts. Retrieved February 15, 2017, from http://www.businessinsider.com/r-under-trump-congress-likely-to-pull-plug-on-medical-device-tax-2016-12
13. Sullivan, M. (2013, November 08). If Ireland
Is Not A Tax Haven, What Is It? Retrieved April 18, 2017, from https://www.forbes.com/sites/taxanalysts/2013/11/06/if-ireland-is-not-a-tax-haven-what-is-it/#4524e7433774
14. Ortman,, J. M., Velkoff,, V. A., & Hogan, H.
(2014, May). An Aging Nation: The Older Population in the United States. Retrieved April 18, 2017, from https://www.census.gov/prod/2014pubs/p25-1140.pdf
15. Wang YC, McPherson K, Marsh T, Gortmaker
SL, Brown M. Health and economic burden of the projected obesity trends in the USA and the UK. Lancet. 2011;
Important disclosures appear on the last page of this report. P a g e 16
Important Disclaimer This report was created by students enrolled in the Security Analysis (6F:112) class at the University of Iowa. The report was originally created to offer an internal investment recommendation for the University of Iowa Krause Fund and its advisory board. The report also provides potential employers and other interested parties an example of the students’ skills, knowledge and abilities. Members of the Krause Fund are not registered investment advisors, brokers or officially licensed financial professionals. The investment advice contained in this report does not represent an offer or solicitation to buy or sell any of the securities mentioned. Unless otherwise noted, facts and figures included in this report are from publicly available sources. This report is not a complete compilation of data, and its accuracy is not guaranteed. From time to time, the University of Iowa, its faculty, staff, students, or the Krause Fund may hold a financial interest in the companies mentioned in this report
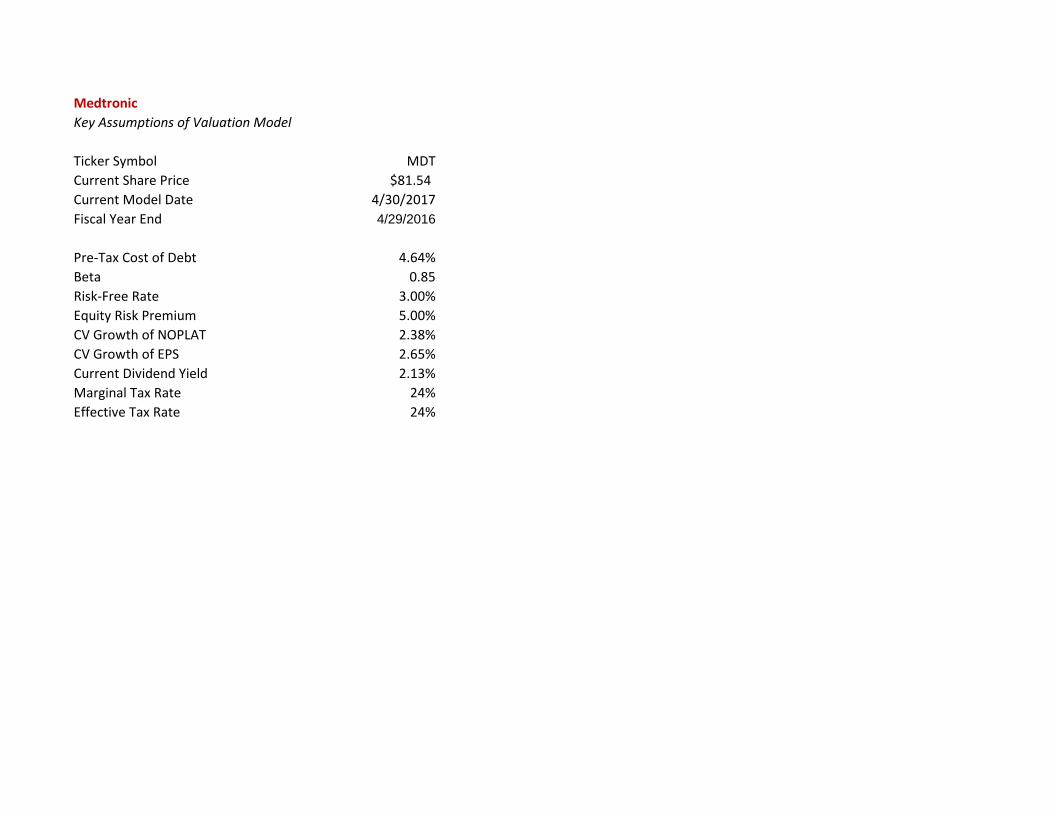
MedtronicKey Assumptions of Valuation Model
Ticker Symbol MDTCurrent Share Price $81.54Current Model Date 4/30/2017Fiscal Year End 4/29/2016
Pre-Tax Cost of Debt 4.64%Beta 0.85Risk-Free Rate 3.00%Equity Risk Premium 5.00%CV Growth of NOPLAT 2.38%CV Growth of EPS 2.65%Current Dividend Yield 2.13%Marginal Tax Rate 24%Effective Tax Rate 24%
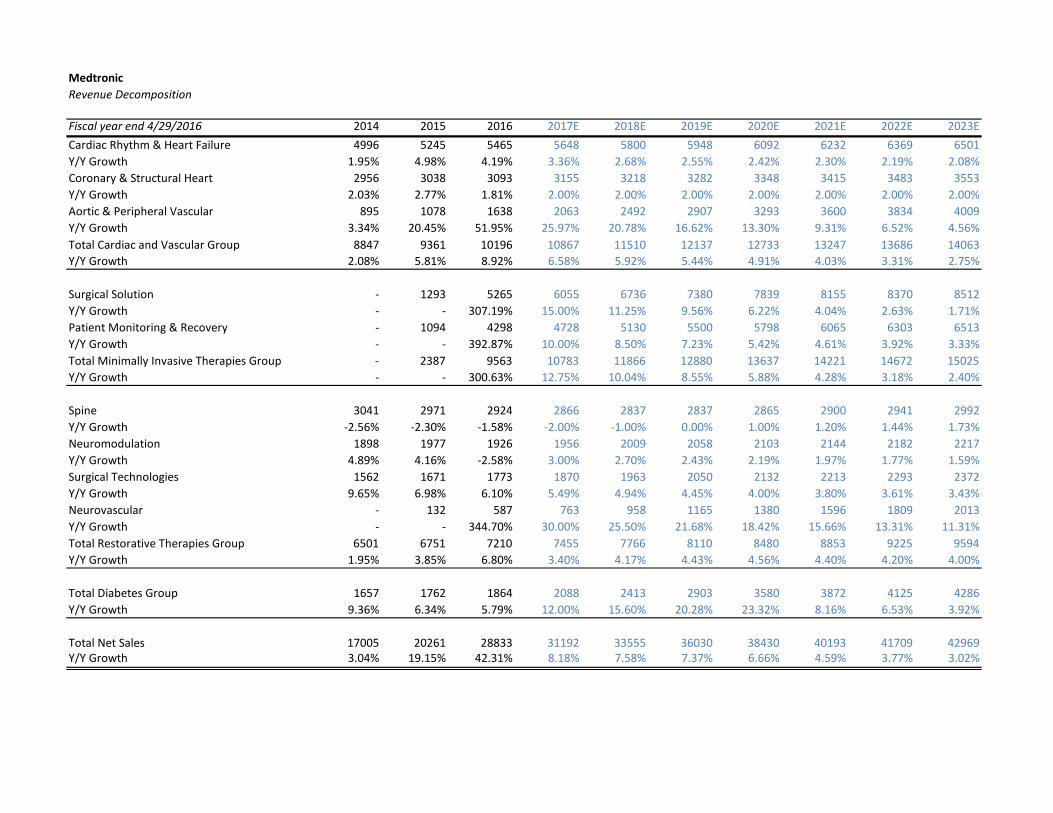
MedtronicRevenue Decomposition
Fiscal year end 4/29/2016 2014 2015 2016 2017E 2018E 2019E 2020E 2021E 2022E 2023ECardiac Rhythm & Heart Failure 4996 5245 5465 5648 5800 5948 6092 6232 6369 6501Y/Y Growth 1.95% 4.98% 4.19% 3.36% 2.68% 2.55% 2.42% 2.30% 2.19% 2.08%Coronary & Structural Heart 2956 3038 3093 3155 3218 3282 3348 3415 3483 3553Y/Y Growth 2.03% 2.77% 1.81% 2.00% 2.00% 2.00% 2.00% 2.00% 2.00% 2.00%Aortic & Peripheral Vascular 895 1078 1638 2063 2492 2907 3293 3600 3834 4009Y/Y Growth 3.34% 20.45% 51.95% 25.97% 20.78% 16.62% 13.30% 9.31% 6.52% 4.56%Total Cardiac and Vascular Group 8847 9361 10196 10867 11510 12137 12733 13247 13686 14063Y/Y Growth 2.08% 5.81% 8.92% 6.58% 5.92% 5.44% 4.91% 4.03% 3.31% 2.75%
Surgical Solution - 1293 5265 6055 6736 7380 7839 8155 8370 8512Y/Y Growth - - 307.19% 15.00% 11.25% 9.56% 6.22% 4.04% 2.63% 1.71%Patient Monitoring & Recovery - 1094 4298 4728 5130 5500 5798 6065 6303 6513Y/Y Growth - - 392.87% 10.00% 8.50% 7.23% 5.42% 4.61% 3.92% 3.33%Total Minimally Invasive Therapies Group - 2387 9563 10783 11866 12880 13637 14221 14672 15025Y/Y Growth - - 300.63% 12.75% 10.04% 8.55% 5.88% 4.28% 3.18% 2.40%
Spine 3041 2971 2924 2866 2837 2837 2865 2900 2941 2992Y/Y Growth -2.56% -2.30% -1.58% -2.00% -1.00% 0.00% 1.00% 1.20% 1.44% 1.73%Neuromodulation 1898 1977 1926 1956 2009 2058 2103 2144 2182 2217Y/Y Growth 4.89% 4.16% -2.58% 3.00% 2.70% 2.43% 2.19% 1.97% 1.77% 1.59%Surgical Technologies 1562 1671 1773 1870 1963 2050 2132 2213 2293 2372Y/Y Growth 9.65% 6.98% 6.10% 5.49% 4.94% 4.45% 4.00% 3.80% 3.61% 3.43%Neurovascular - 132 587 763 958 1165 1380 1596 1809 2013Y/Y Growth - - 344.70% 30.00% 25.50% 21.68% 18.42% 15.66% 13.31% 11.31%Total Restorative Therapies Group 6501 6751 7210 7455 7766 8110 8480 8853 9225 9594Y/Y Growth 1.95% 3.85% 6.80% 3.40% 4.17% 4.43% 4.56% 4.40% 4.20% 4.00%
Total Diabetes Group 1657 1762 1864 2088 2413 2903 3580 3872 4125 4286Y/Y Growth 9.36% 6.34% 5.79% 12.00% 15.60% 20.28% 23.32% 8.16% 6.53% 3.92%
Total Net Sales 17005 20261 28833 31192 33555 36030 38430 40193 41709 42969Y/Y Growth 3.04% 19.15% 42.31% 8.18% 7.58% 7.37% 6.66% 4.59% 3.77% 3.02%

MedtronicCash Flow Statement
Fiscal year end 4/29/2016 2007 2008 2009 2010 2011 2012 2013 2014 2015 2016(in millions)Operating Activities:
Net income 2802 2231 2070 3099 3096 3617 3467 3065 2675 3538Depreciation and amortization 583 637 699 772 804 833 819 850 1306 2820Amortization of debt discount and issuance - - 154 167 171 85 104 8 76 29Other operating gain or loss 98 117 - - - -218 - - - 163Acquisition-related items - 390 621 11 44 45 -74 110 634 218Provision for doubtful accounts 31 31 23 36 47 66 51 43 35 49Deferred income taxes -272 -89 -171 144 153 14 -7 -207 -926 -460Stock-based compensation 185 217 213 225 198 161 152 145 439 375Change in operating assets and liabilities,
Accounts receivable, net -326 -461 108 -271 -342 -252 1 -70 -413 -435Inventories -24 30 -212 158 -101 -185 93 -39 -282 -186Accounts payable and accrued liabilities 17 61 510 225 -37 300 422 -117 1616 -65Other operating assets and liabilities -70 272 -147 130 -532 155 -215 444 643 -403
Certain litigation charges and payment, net -45 92 10 -565 240 -151 70 755 767 -314Net cash provided by operating activities 2979 3489 3878 4131 3741 4470 4883 4959 4902 5218
2979Investing Activities:
Acquisitions, net of cash acquired -8 -4221 -1624 -350 -1332 -556 -820 -385 -14884 -1213Additions to property, plant, and equipment -573 -513 -498 -573 -501 -484 -457 -396 -571 -1046
Purchase(sales) of market security, net -943 2124 -115 -3687 275 -1987 -1810 -2784 -1692 4518Other investing activities, net -177 -180 -503 -149 -176 365 -14 -29 89 -14
Net cash provided by (used in) investing -1701 -2790 -2740 -4759 -1734 -2662 -3101 -3594 -17058 2245
Financing Activities:Acquisition-related contingent consideration - - - - - -118 -18 -1 -85 -22Change in short-term borrowings, net 45 543 -633 -444 619 165 -720 127 -1 7Issuance(payment) of long-term debt, net -1880 288 950 2980 -1603 1186 766 1429 18674 -5132
Repayment (Proceeds) of short-term borrowings, net - - - - - -750 -72 -125 0 0Dividends to shareholders -504 -565 -843 -907 -969 -1021 -1055 -1116 -1337 -2139
issuance(repurchase) of ordinary shares, net -708 -1141 -343 -865 -1055 -1344 -980 -1246 -1271 -2339Other financing activities 36 40 24 - - - -22 14 -31 82
Net cash (used in) provided by financing -3011 -835 -845 764 -2006 -1882 -2101 -918 15949 -9543
Effect of exchange rate changes on cash -5 -60 -82 -7 62 -71 7 37 -353 113Net change in cash and cash equivalents -1738 -196 211 129 63 -145 -312 484 3440 -1967Cash and cash equivalents at beginning 2994 1256 1060 1271 1254 1317 1172 919 1403 4843Cash and cash equivalents at end of period 1256 1060 1271 1400 1317 1172 860 1403 4843 2876

MedtronicCash Flow Statement
Fiscal year end 4/29/2016 2017E 2018E 2019E 2020E 2021E 2022E 2023E(in millions)Operating Activities:Net income 3955 4356 4784 5046 5206 5338 5390Depreciation and amortization 2071 2099 2240 2404 2532 2617 2684less change in DTA -162 -227 -245 -267 -287 -292 -310add change in DTL 112 115 119 122 126 130 134less change in accout receviable -954 -745 -784 -421 -383 -869 -871less change in inventory 301 -259 -260 -272 -264 -596 -182less change Prepaid expenses and other current assets -236 -152 -158 -170 -172 -187 -87add change in account payable 353 169 169 177 172 387 118add change accured expense 1743 547 465 483 483 345 291add non cash expense and lossNet cash provided by operating activities 7182 5902 6330 7102 7413 6874 7168
Investing Activities:decrease(increase) in investment -195 -199 -203 -207 -211 -215 -220Capital expenditure -721 -2606 -3066 -2304 -1370 -1156 -1717Net cash provided by (used in) investing -916 -2805 -3269 -2511 -1581 -1371 -1937
Cash payment on interest, net -937 -1007 -1058 -1110 -1166 -1224 -1286Change in short-term borrowings, net 822 91 95 100 105 110 116Change in LT debt 1512 1588 1667 1751 1838 1930 2027payment of dividend -2373 -2640 -2928 -3119 -3250 -3366 -3433process frm ESOP 241 241 241 217 0 0 0cash payment on repurchase -2,900 -3,016 -2,500 -2,500 -2,525 -2,550 -2,576Net cash (used in) provided by financing -3635 -4743 -4482 -4662 -4998 -5101 -5152
Net change in cash and cash equivalents 2630 -1646 -1422 -71 833 402 79Cash and cash equivalents at beginning 2876 5506 3860 2439 2367 3201 3603Cash and cash equivalents at end of period 5506 3860 2439 2367 3201 3603 3682

MedtronicBalance Sheet
Fiscal year end 4/29/2016 2014 2015 2016 2017E 2018E 2019E 2020E 2021E 2022E 2023E(in millions, except per share data)ASSETSCurrent assets:
Cash and cash equivalents 1403 4843 2876 5506 3860 2439 2367 3201 3603 3682Investments 12838 14637 9758 9953 10152 10355 10562 10774 10989 11209Accounts receivable, net 3811 5112 5562 6516 7261 8045 8466 8849 9718 10589Income tax receivable 0 0 0 0 0 0 0 0 0 0Inventories 1725 3463 3473 3172 3431 3691 3963 4227 4823 5005Tax assets 736 1335 697 721 795 873 956 1040 1109 1174Prepaid expenses and other current assets 697 1454 1234 1470 1623 1780 1950 2121 2308 2396
Total current assets 21210 30844 23600 27339 27122 27183 28265 30212 32551 34054Property, plant, and equipment, net 2392 4699 4841 4757 5327 5931 6591 7276 8143 9176Goodwill 10593 40530 41500 41500 41500 41500 41500 41500 41500 41500Other intangible assets, net 2286 28101 26899 27706 28823 30284 30865 30513 29261 28753Long-term tax assets 300 774 1383 1521 1673 1841 2025 2227 2450 2695Long-term investment - - - 0 0 0 0 0 0 0Other assets 1162 1737 1559 1637 1719 1805 1895 1990 2089 2194
Total assets 37943 106685 99782 104461 106164 108544 111141 113719 115994 118372LIABILITIES AND SHAREHOLDERS EQUITYCurrent liabilities:
Short-term borrowings 1613 2434 993 1815 1906 2001 2101 2206 2316 2432Accounts payable 742 1610 1709 2062 2230 2399 2576 2748 3135 3253Accrued compensation 1015 1611 1712 2841 3088 3289 3496 3692 3822 3927Accrued income taxes 164 935 566 865 936 1007 1081 1153 1206 1251Deferred tax liabilities 19 119 0 0 0 0 0 0 0 0Other accrued expenses 2006 2464 2185 2500 2729 2922 3123 3339 3500 3641
Total current liabilities 5559 9173 7165 10082 10888 11618 12377 13137 13979 14504Long-term debt 10315 33752 30247 31759 33347 35015 36765 38604 40534 42561Long-term accrued compensation and retirement benefits 662 1535 1759 1900 2052 2216 2393 2465 2539 2615Long-term accrued income taxes 1343 2476 2903 3460 3743 4027 4324 4612 4421 4588Long-term deferred tax liabilities 386 4700 3729 3841 3956 4075 4197 4323 4453 4586Other long-term liabilities 235 1819 1916 1973 2033 2094 2156 2221 2288 2356
Total liabilities 18500 53455 47719 53016 56019 59043 62213 65361 68214 71210Shareholders equity:
Retained earnings 19940 54414 53931 52613 51313 50669 50096 49526 48948 48329Accumulated other comprehensive loss -597 -1184 -1168 -1168 -1168 -1168 -1168 -1168 -1168 -1168
Total shareholders equity 19443 53230 52063 51445 50145 49501 48928 48358 47780 47161Total liabilities and shareholders equity 37943 106685 99782 104461 106164 108544 111141 113719 115994 118372

MedtronicIncome Statement
Fiscal year end 4/29/2016 2014 2015 2016 2017E 2018E 2019E 2020E 2021E 2022E 2023ENet sales 17005 20261 28833 31192 33555 36030 38430 40193 41709 42969Costs and expenses:
Cost of products sold, net of depreciation 3832 5736 8253 9255 10024 10731 11592 12262 12865 13372 Depreciation 501 573 889 726 714 799 890 989 1091 1221
Research & development expense 1477 1640 2224 2464 2651 2846 3036 3175 3295 3462Selling, general & administrative expense 5847 6904 9469 10293 10963 11653 12305 12741 13089 13350Special charges (gains), net 40 -38 70 0 0 0 0 0 0 0Restructuring charges, net 78 237 290 218 235 252 269 281 292 301Certain litigation charges, net 770 42 26 312 336 360 384 402 417 430Acquisition-related items 117 550 283 312 369 436 512 588 672 761Amortization of intangible assets 349 733 1931 1345 1385 1441 1514 1543 1526 1463Other expense, net 181 118 107 125 141 159 178 195 213 230
Operating profit 3813 3766 5291 6141 6738 7352 7750 8016 8249 8378Interest expense, net 108 280 955 937 1007 1058 1110 1166 1224 1286
Income from operations before income taxes 3705 3486 4336 5204 5731 6295 6639 6850 7024 7092Provision for income taxes 640 811 798 1249 1375 1511 1593 1644 1686 1702Net income 3065 2675 3538 3955 4356 4784 5046 5206 5338 5390Basic earnings per share 3.06 2.44 2.51 2.87 3.22 3.59 3.85 4.04 4.22 4.33Basic weighted average shares outstanding 1002.1 1095.5 1409.6 1380 1352 1331 1311 1288 1266 1245Cash dividends declared per ordinary share 1.12 1.22 1.52 1.72 1.95 2.20 2.38 2.52 2.66 2.76
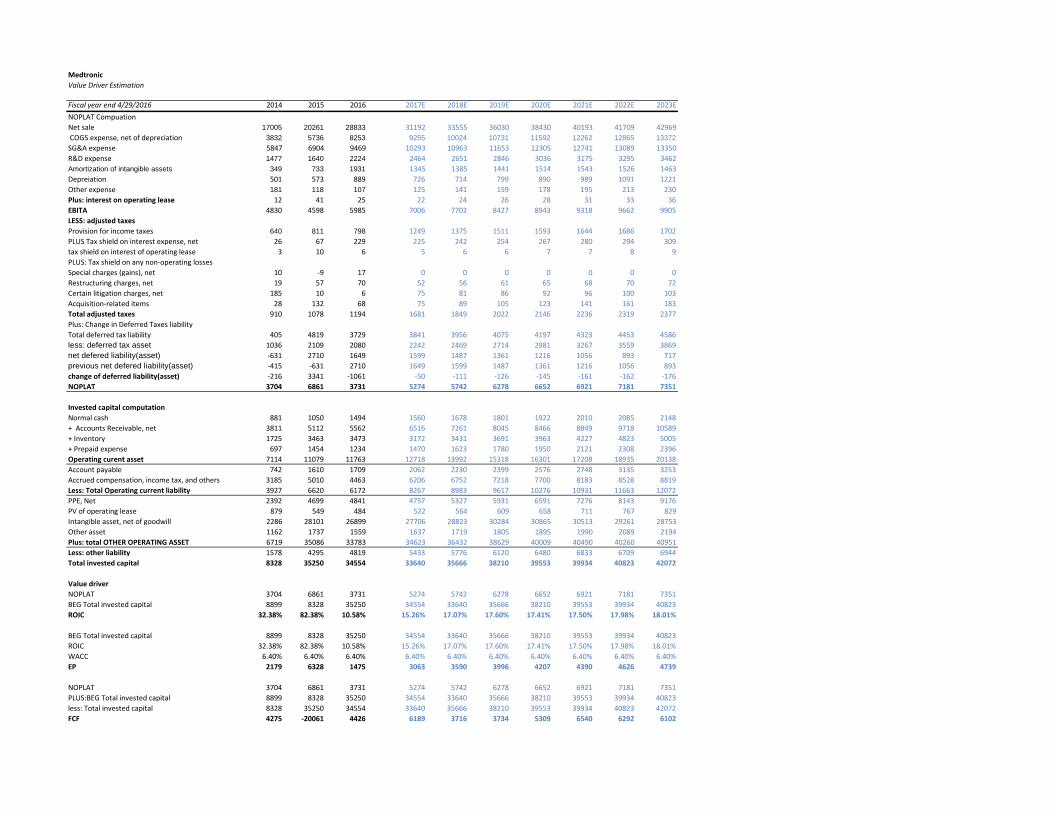
MedtronicValue Driver Estimation
Fiscal year end 4/29/2016 2014 2015 2016 2017E 2018E 2019E 2020E 2021E 2022E 2023ENOPLAT CompuationNet sale 17005 20261 28833 31192 33555 36030 38430 40193 41709 42969 COGS expense, net of depreciation 3832 5736 8253 9255 10024 10731 11592 12262 12865 13372SG&A expense 5847 6904 9469 10293 10963 11653 12305 12741 13089 13350R&D expense 1477 1640 2224 2464 2651 2846 3036 3175 3295 3462Amortization of intangible assets 349 733 1931 1345 1385 1441 1514 1543 1526 1463Depreiation 501 573 889 726 714 799 890 989 1091 1221Other expense 181 118 107 125 141 159 178 195 213 230Plus: interest on operating lease 12 41 25 22 24 26 28 31 33 36EBITA 4830 4598 5985 7006 7702 8427 8943 9318 9662 9905LESS: adjusted taxesProvision for income taxes 640 811 798 1249 1375 1511 1593 1644 1686 1702PLUS Tax shield on interest expense, net 26 67 229 225 242 254 267 280 294 309tax shield on interest of operating lease 3 10 6 5 6 6 7 7 8 9PLUS: Tax shield on any non-operating lossesSpecial charges (gains), net 10 -9 17 0 0 0 0 0 0 0Restructuring charges, net 19 57 70 52 56 61 65 68 70 72Certain litigation charges, net 185 10 6 75 81 86 92 96 100 103Acquisition-related items 28 132 68 75 89 105 123 141 161 183Total adjusted taxes 910 1078 1194 1681 1849 2022 2146 2236 2319 2377Plus: Change in Deferred Taxes liabilityTotal deferred tax liability 405 4819 3729 3841 3956 4075 4197 4323 4453 4586less: deferred tax asset 1036 2109 2080 2242 2469 2714 2981 3267 3559 3869net defered liability(asset) -631 2710 1649 1599 1487 1361 1216 1056 893 717previous net defered liability(asset) -415 -631 2710 1649 1599 1487 1361 1216 1056 893change of deferred liability(asset) -216 3341 -1061 -50 -111 -126 -145 -161 -162 -176NOPLAT 3704 6861 3731 5274 5742 6278 6652 6921 7181 7351
Invested capital computationNormal cash 881 1050 1494 1560 1678 1801 1922 2010 2085 2148+ Accounts Receivable, net 3811 5112 5562 6516 7261 8045 8466 8849 9718 10589+ Inventory 1725 3463 3473 3172 3431 3691 3963 4227 4823 5005+ Prepaid expense 697 1454 1234 1470 1623 1780 1950 2121 2308 2396Operating curent asset 7114 11079 11763 12718 13992 15318 16301 17208 18935 20138Account payable 742 1610 1709 2062 2230 2399 2576 2748 3135 3253Accrued compensation, income tax, and others 3185 5010 4463 6206 6752 7218 7700 8183 8528 8819Less: Total Operating current liability 3927 6620 6172 8267 8983 9617 10276 10931 11663 12072PPE, Net 2392 4699 4841 4757 5327 5931 6591 7276 8143 9176PV of operating lease 879 549 484 522 564 609 658 711 767 829Intangible asset, net of goodwill 2286 28101 26899 27706 28823 30284 30865 30513 29261 28753Other asset 1162 1737 1559 1637 1719 1805 1895 1990 2089 2194Plus: total OTHER OPERATING ASSET 6719 35086 33783 34623 36432 38629 40009 40490 40260 40951Less: other liability 1578 4295 4819 5433 5776 6120 6480 6833 6709 6944Total invested capital 8328 35250 34554 33640 35666 38210 39553 39934 40823 42072
Value driver NOPLAT 3704 6861 3731 5274 5742 6278 6652 6921 7181 7351BEG Total invested capital 8899 8328 35250 34554 33640 35666 38210 39553 39934 40823ROIC 32.38% 82.38% 10.58% 15.26% 17.07% 17.60% 17.41% 17.50% 17.98% 18.01%
BEG Total invested capital 8899 8328 35250 34554 33640 35666 38210 39553 39934 40823ROIC 32.38% 82.38% 10.58% 15.26% 17.07% 17.60% 17.41% 17.50% 17.98% 18.01%WACC 6.40% 6.40% 6.40% 6.40% 6.40% 6.40% 6.40% 6.40% 6.40% 6.40%EP 2179 6328 1475 3063 3590 3996 4207 4390 4626 4739
NOPLAT 3704 6861 3731 5274 5742 6278 6652 6921 7181 7351PLUS:BEG Total invested capital 8899 8328 35250 34554 33640 35666 38210 39553 39934 40823less: Total invested capital 8328 35250 34554 33640 35666 38210 39553 39934 40823 42072FCF 4275 -20061 4426 6189 3716 3734 5309 6540 6292 6102

MedtronicWeighted Average Cost of Capital (WACC) Estimation
Risk-free rate 3% premium/betaMarket risk premium 5.00% $82.49 0.65 0.75 0.85beta 0.85 3.00% 160.75$ 144.22$ 130.51$ cost of equity 7.25% 4.00% 128.45$ 113.81$ 101.85$
5.00% 106.07$ 93.04$ 82.49$ cost of debt 4.64% 6.00% 89.65$ 77.93$ 68.52$
7.00% 77.07$ 66.44$ 57.94$ Million 8.00% 67.12$ 57.40$ 49.65$
MV of common stock (end of FY16) 110,335 Total CS outstanding 1,394Price per share 79.15 Rd/Marginal tax
$82.49 20% 22.00% 24.00%MV of debt 32,233 2.6400% 98.25$ 95.12$ 91.96$ LT debt 31,240 3.64% 92.79$ 89.91$ 87.01$ ST debt 993.0 4.64% 87.80$ 85.16$ 82.49$ PV on operating leasing 484 5.64% 83.25$ 80.81$ 78.34$
6.64% 79.06$ 76.80$ 74.51$ MVof Frim 143,052 7.64% 75.21$ 73.10$ 70.97$
E/V 77.13%D/V 22.53%marginal tax rate 24%WACC 6.40%
MedtronicKey Management Ratios
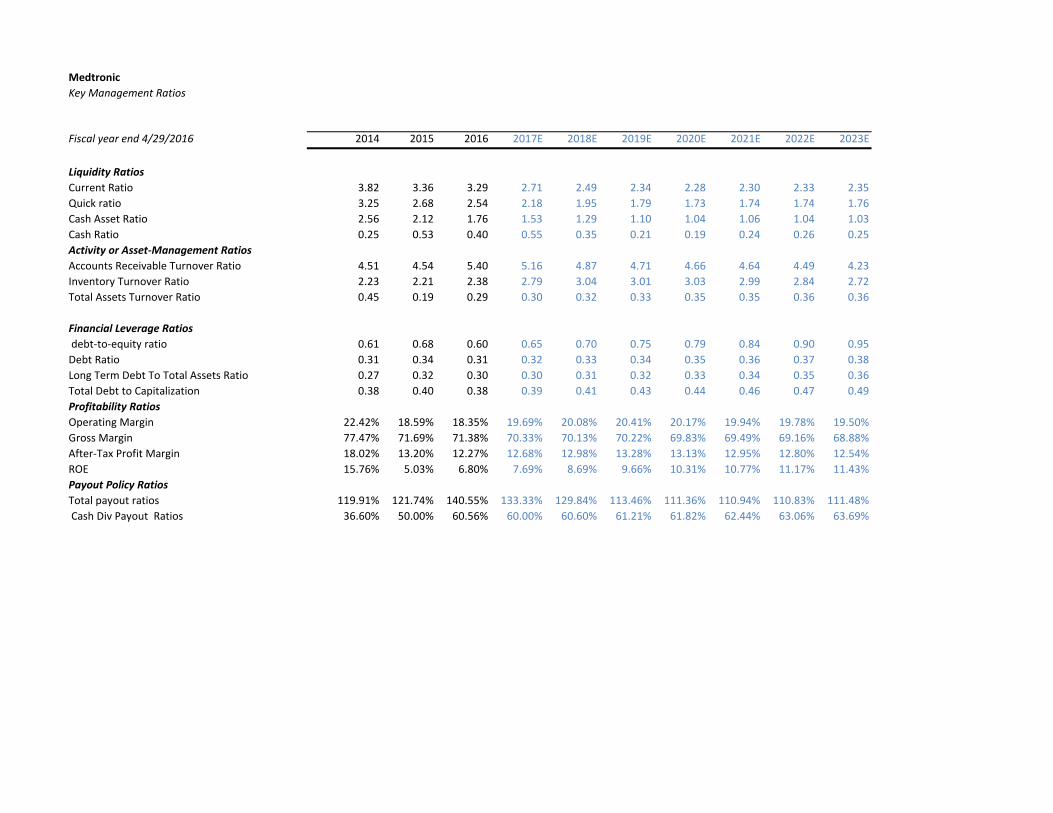
Fiscal year end 4/29/2016 2014 2015 2016 2017E 2018E 2019E 2020E 2021E 2022E 2023E
Liquidity RatiosCurrent Ratio 3.82 3.36 3.29 2.71 2.49 2.34 2.28 2.30 2.33 2.35Quick ratio 3.25 2.68 2.54 2.18 1.95 1.79 1.73 1.74 1.74 1.76Cash Asset Ratio 2.56 2.12 1.76 1.53 1.29 1.10 1.04 1.06 1.04 1.03Cash Ratio 0.25 0.53 0.40 0.55 0.35 0.21 0.19 0.24 0.26 0.25Activity or Asset-Management RatiosAccounts Receivable Turnover Ratio 4.51 4.54 5.40 5.16 4.87 4.71 4.66 4.64 4.49 4.23Inventory Turnover Ratio 2.23 2.21 2.38 2.79 3.04 3.01 3.03 2.99 2.84 2.72Total Assets Turnover Ratio 0.45 0.19 0.29 0.30 0.32 0.33 0.35 0.35 0.36 0.36
Financial Leverage Ratios debt-to-equity ratio 0.61 0.68 0.60 0.65 0.70 0.75 0.79 0.84 0.90 0.95Debt Ratio 0.31 0.34 0.31 0.32 0.33 0.34 0.35 0.36 0.37 0.38Long Term Debt To Total Assets Ratio 0.27 0.32 0.30 0.30 0.31 0.32 0.33 0.34 0.35 0.36Total Debt to Capitalization 0.38 0.40 0.38 0.39 0.41 0.43 0.44 0.46 0.47 0.49Profitability RatiosOperating Margin 22.42% 18.59% 18.35% 19.69% 20.08% 20.41% 20.17% 19.94% 19.78% 19.50%Gross Margin 77.47% 71.69% 71.38% 70.33% 70.13% 70.22% 69.83% 69.49% 69.16% 68.88%After-Tax Profit Margin 18.02% 13.20% 12.27% 12.68% 12.98% 13.28% 13.13% 12.95% 12.80% 12.54%ROE 15.76% 5.03% 6.80% 7.69% 8.69% 9.66% 10.31% 10.77% 11.17% 11.43%Payout Policy RatiosTotal payout ratios 119.91% 121.74% 140.55% 133.33% 129.84% 113.46% 111.36% 110.94% 110.83% 111.48% Cash Div Payout Ratios 36.60% 50.00% 60.56% 60.00% 60.60% 61.21% 61.82% 62.44% 63.06% 63.69%

Medtronic CV gDiscounted Cash Flow (DCF) and Economic Profit (EP) Valuation Models $82.49
14.01%Key Inputs: ROIC 16.01% CV Growth 2.38% 18.01% CV ROIC 18.01% 20.01% WACC 6.40% 22.01% Cost of Equity 7.25% 24.01%
Fiscal year end 4/29/2016 2017E 2018E 2019E 2020E 2021E 2022E 2023E
DCF ModelFree Cash Flow 6,189 3,716 3,734 5,309 6,540 6,292 6,102 Disount factor 1.06 1.13 1.20 1.28 1.36 1.45 1.45 CV at end of 2022 158,632 Discounted FCF 5,816 3,282 3,100 4,142 4,797 4,337 109,340
Value of operating 134,815 Plus Excess Cash 1,382 Plus investment 9,758 Less Total Debts 32,233 Less PV of operating lease 484 Less underfunded pension 1,400 Less ESOP 922 Less other non-operating liability 1,759 Plus Tax credit 202Value of enterprise 109,359 Total outsanding shares at end of FY16 1,394 Intrinsic Value at end of FY16 78.45 Intrinsic Value today 82.49 -
EP ModelInvested capital at end of 2016 34,554 Economic Profit 3,063 3,590 3,996 4,207 4,390 4,626 4,739 Discount factors 1.06 1.13 1.20 1.28 1.36 1.45 1.45 CV at end of 2022 117,809 Discounted EP 2,879 3,171 3,318 3,283 3,220 3,188 81,202
value of operating 134,815 Value of enterprise 109,359 Intrinsic Value at end of FY16 78.45
Intrinsic Value today $82.49

MedtronicRelative Valuation Models
EPS EPSTicker Company Market Capitalization(Billion) Price 2017E 2018E P/E 16 P/E 17JNJ Johnson & Johnson 340 $125.72 $7.05 $7.41 17.8 17.0 ABT Abbott Laboratories 74.84 $43.31 $2.45 $2.75 17.7 15.7 BSX Meridian Bioscience Inc 33.7 $24.62 $1.25 $1.41 19.7 17.5 EW Edwards Lifesciences Corpor 20.21 $95.68 $3.41 $3.84 28.1 24.9 SYK Neogen Corp 48.84 $130.97 $6.41 $7.04 20.4 18.6
Average 20.7 18.7
MDT Medtronic $80.55 $2.87 $3.22 28.1 25.0
Implied Value: Relative P/E (EPS16) $ 59.44 Relative P/E (EPS17) 60.39$
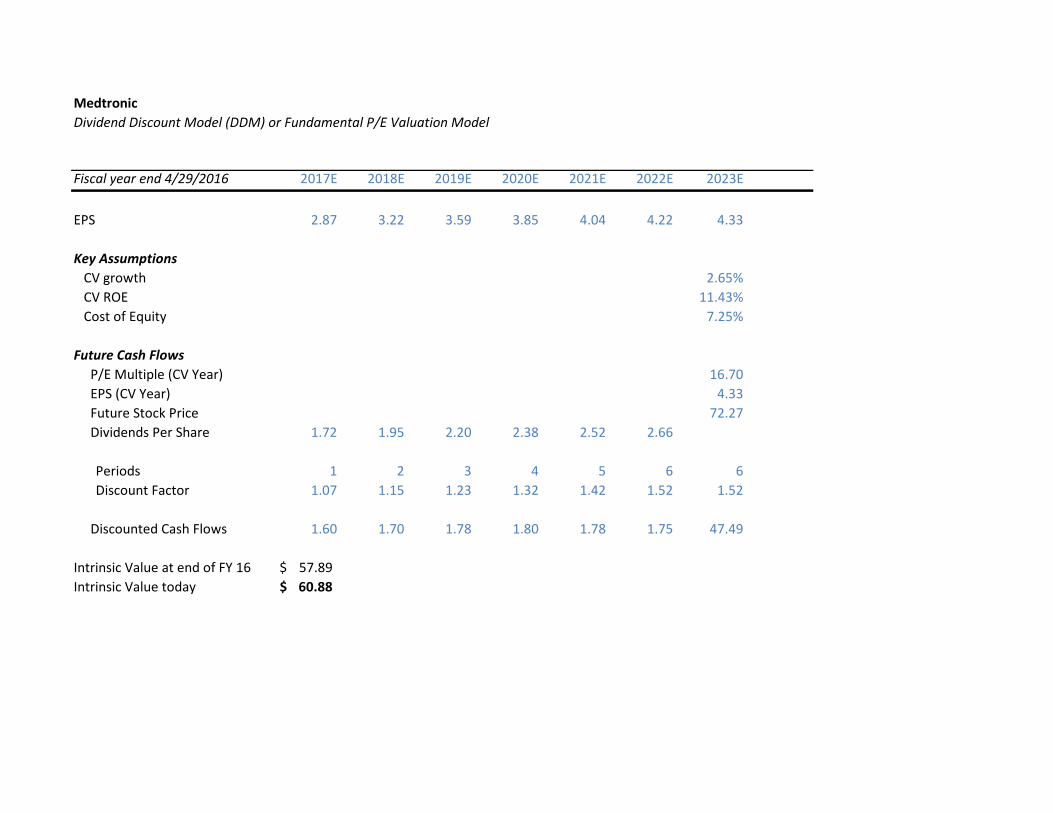
MedtronicDividend Discount Model (DDM) or Fundamental P/E Valuation Model
Fiscal year end 4/29/2016 2017E 2018E 2019E 2020E 2021E 2022E 2023E
EPS 2.87 3.22 3.59 3.85 4.04 4.22 4.33
Key Assumptions CV growth 2.65% CV ROE 11.43% Cost of Equity 7.25%
Future Cash Flows P/E Multiple (CV Year) 16.70 EPS (CV Year) 4.33 Future Stock Price 72.27 Dividends Per Share 1.72 1.95 2.20 2.38 2.52 2.66
Periods 1 2 3 4 5 6 6Discount Factor 1.07 1.15 1.23 1.32 1.42 1.52 1.52
Discounted Cash Flows 1.60 1.70 1.78 1.80 1.78 1.75 47.49
Intrinsic Value at end of FY 16 57.89$ Intrinsic Value today 60.88$

CV Cost of R&D as percentage of sales82.34$ 7.86% 7.96% 8.06% 8.16% 8.26%
31.27% 82.34$ 75.75$ 70.38$ 65.91$ 62.14$ CV SG&A cost as percentage of sales 31.17% 90.61$ 82.34$ 75.75$ 70.38$ 65.91$
31.07% 101.29$ 90.61$ 82.34$ 75.75$ 70.38$ 30.97% 115.63$ 101.29$ 90.61$ 82.34$ 75.75$ 30.87% 135.88$ 115.63$ 101.29$ 90.61$ 82.34$
Risk-free rate82.34$ 1.00% 2.00% 3.00% 4.00% 5.00%
33.56% 486.19$ 216.86$ 135.88$ 96.78$ 73.69$ CV COGS as percentage of sales 33.76% 216.12$ 139.86$ 101.29$ 77.96$ 62.29$
33.96% 144.11$ 105.94$ 82.34$ 66.28$ 54.62$ 34.16% 110.75$ 86.85$ 70.38$ 58.32$ 49.10$ 34.36% 91.50$ 74.61$ 62.14$ 52.55$ 44.94$
CV NOPLAT growth rate82.34$ 1.98% 2.18% 2.38% 2.58% 2.78%14.0% 74.11$ 76.33$ 78.77$ 81.47$ 84.46$
CV ROIC 16.0% 75.63$ 78.08$ 80.78$ 83.76$ 87.07$ 18.0% 76.81$ 79.45$ 82.34$ 85.54$ 89.09$ 20.0% 77.76$ 80.54$ 83.59$ 86.97$ 90.72$ 22.0% 78.53$ 81.43$ 84.62$ 88.14$ 92.04$ 24.0% 79.18$ 82.17$ 85.47$ 89.11$ 93.15$
Beta82.34$ 0.65 0.75 0.85 0.95 1.053.00% 160.59$ 144.07$ 130.35$ 118.79$ 108.90$ 4.00% 128.29$ 113.66$ 101.70$ 91.74$ 83.31$
Equity risk Premium 5.00% 105.92$ 92.89$ 82.34$ 73.63$ 66.30$ 6.00% 89.50$ 77.79$ 68.37$ 60.64$ 54.16$ 7.00% 76.93$ 66.30$ 57.81$ 50.85$ 45.05$ 8.00% 66.98$ 57.26$ 49.52$ 43.20$ 37.94$
Marginal tax rate82.34$ 20.00% 22.00% 24.00% 26.00% 28.00%0.0264 98.08$ 94.95$ 91.79$ 88.62$ 85.43$ 0.0609760.0364 92.62$ 89.75$ 86.86$ 83.94$ 81.00$
Cost of Debt 0.0464 87.65$ 85.01$ 82.34$ 79.65$ 76.93$ 0.0564 83.10$ 80.66$ 78.20$ 75.70$ 73.17$ 0.0664 78.92$ 76.66$ 74.38$ 72.06$ 69.70$ 0.0764 75.07$ 72.97$ 70.85$ 68.68$ 66.49$

MedtronicCommon Size Income Statement
Fiscal year end 4/29/2016 2014 2015 2016 2017E 2018E 2019E 2020E 2021E 2022E 2023ENet sales 100.00% 100.00% 100.00% 100.00% 100.00% 100.00% 100.00% 100.00% 100.00% 100.00%Costs and expenses:
Cost of products sold 25.48% 31.14% 31.71% 32.00% 32.00% 32.00% 32.48% 32.97% 33.46% 33.96%Research & development expense 8.69% 8.09% 7.71% 7.90% 7.90% 7.90% 7.90% 7.90% 7.90% 8.06%Selling, general & administrative expense 34.38% 34.08% 32.84% 33.00% 32.67% 32.34% 32.02% 31.70% 31.38% 31.07%Special charges (gains), net 0.24% -0.19% 0.24% 0.00% 0.00% 0.00% 0.00% 0.00% 0.00% 0.00%Restructuring charges, net 0.46% 1.17% 1.01% 0.70% 0.70% 0.70% 0.70% 0.70% 0.70% 0.70%Certain litigation charges, net 4.53% 0.21% 0.09% 1.00% 1.00% 1.00% 1.00% 1.00% 1.00% 1.00%Acquisition-related items 0.69% 2.71% 0.98% 1.00% 1.10% 1.21% 1.33% 1.46% 1.61% 1.77%Amortization of intangible assets 2.05% 3.62% 6.70% 4.31% 4.13% 4.00% 3.94% 3.84% 3.66% 3.40%Other expense, net 1.06% 0.58% 0.37% 0.40% 0.42% 0.44% 0.46% 0.49% 0.51% 0.54%
Operating profit 22.42% 18.59% 18.35% 19.69% 20.08% 20.41% 20.17% 19.94% 19.78% 19.50%Interest expense, net 0.64% 1.38% 3.31% 3.00% 3.00% 2.94% 2.89% 2.90% 2.94% 2.99%
Income from operations before income taxes 21.79% 17.21% 15.04% 16.68% 17.08% 17.47% 17.28% 17.04% 16.84% 16.51%Provision for income taxes 3.76% 4.00% 2.77% 4.00% 4.10% 4.19% 4.15% 4.09% 4.04% 3.96%Net income 18.02% 13.20% 12.27% 12.68% 12.98% 13.28% 13.13% 12.95% 12.80% 12.54%
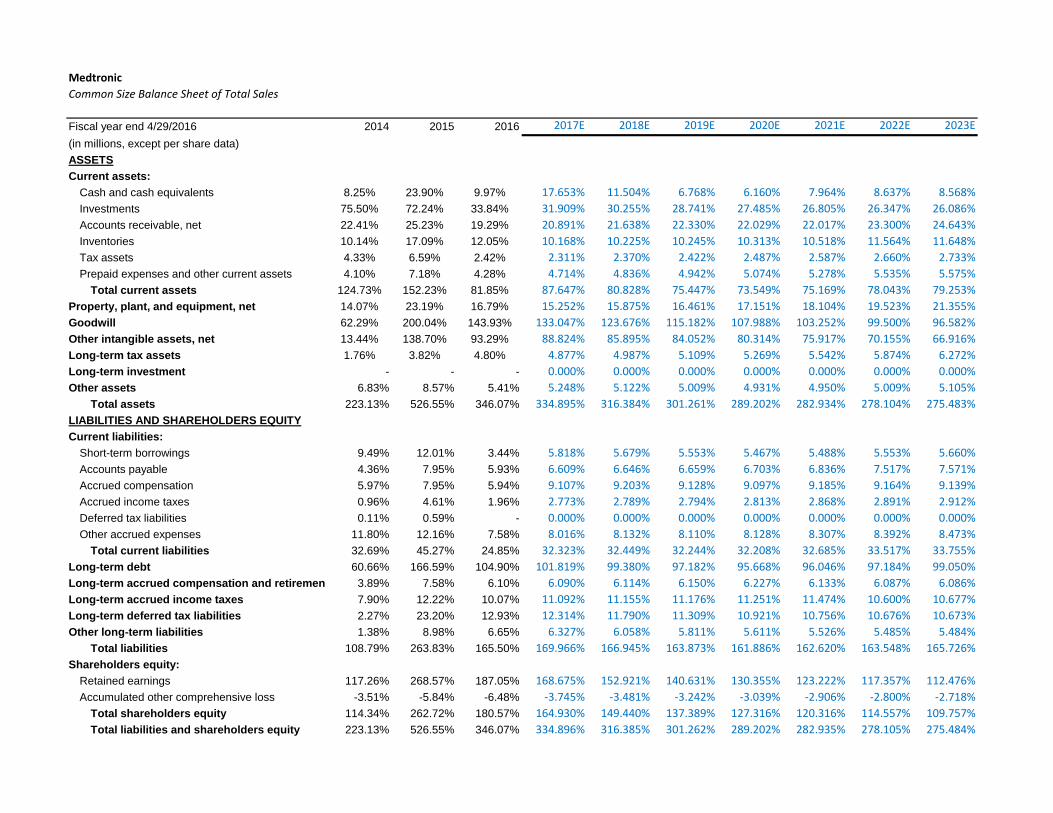
MedtronicCommon Size Balance Sheet of Total Sales
Fiscal year end 4/29/2016 2014 2015 2016 2017E 2018E 2019E 2020E 2021E 2022E 2023E(in millions, except per share data)ASSETSCurrent assets:
Cash and cash equivalents 8.25% 23.90% 9.97% 17.653% 11.504% 6.768% 6.160% 7.964% 8.637% 8.568%Investments 75.50% 72.24% 33.84% 31.909% 30.255% 28.741% 27.485% 26.805% 26.347% 26.086%Accounts receivable, net 22.41% 25.23% 19.29% 20.891% 21.638% 22.330% 22.029% 22.017% 23.300% 24.643%Inventories 10.14% 17.09% 12.05% 10.168% 10.225% 10.245% 10.313% 10.518% 11.564% 11.648%Tax assets 4.33% 6.59% 2.42% 2.311% 2.370% 2.422% 2.487% 2.587% 2.660% 2.733%Prepaid expenses and other current assets 4.10% 7.18% 4.28% 4.714% 4.836% 4.942% 5.074% 5.278% 5.535% 5.575%
Total current assets 124.73% 152.23% 81.85% 87.647% 80.828% 75.447% 73.549% 75.169% 78.043% 79.253%Property, plant, and equipment, net 14.07% 23.19% 16.79% 15.252% 15.875% 16.461% 17.151% 18.104% 19.523% 21.355%Goodwill 62.29% 200.04% 143.93% 133.047% 123.676% 115.182% 107.988% 103.252% 99.500% 96.582%Other intangible assets, net 13.44% 138.70% 93.29% 88.824% 85.895% 84.052% 80.314% 75.917% 70.155% 66.916%Long-term tax assets 1.76% 3.82% 4.80% 4.877% 4.987% 5.109% 5.269% 5.542% 5.874% 6.272%Long-term investment - - - 0.000% 0.000% 0.000% 0.000% 0.000% 0.000% 0.000%Other assets 6.83% 8.57% 5.41% 5.248% 5.122% 5.009% 4.931% 4.950% 5.009% 5.105%
Total assets 223.13% 526.55% 346.07% 334.895% 316.384% 301.261% 289.202% 282.934% 278.104% 275.483%LIABILITIES AND SHAREHOLDERS EQUITYCurrent liabilities:
Short-term borrowings 9.49% 12.01% 3.44% 5.818% 5.679% 5.553% 5.467% 5.488% 5.553% 5.660%Accounts payable 4.36% 7.95% 5.93% 6.609% 6.646% 6.659% 6.703% 6.836% 7.517% 7.571%Accrued compensation 5.97% 7.95% 5.94% 9.107% 9.203% 9.128% 9.097% 9.185% 9.164% 9.139%Accrued income taxes 0.96% 4.61% 1.96% 2.773% 2.789% 2.794% 2.813% 2.868% 2.891% 2.912%Deferred tax liabilities 0.11% 0.59% - 0.000% 0.000% 0.000% 0.000% 0.000% 0.000% 0.000%Other accrued expenses 11.80% 12.16% 7.58% 8.016% 8.132% 8.110% 8.128% 8.307% 8.392% 8.473%
Total current liabilities 32.69% 45.27% 24.85% 32.323% 32.449% 32.244% 32.208% 32.685% 33.517% 33.755%Long-term debt 60.66% 166.59% 104.90% 101.819% 99.380% 97.182% 95.668% 96.046% 97.184% 99.050%Long-term accrued compensation and retirement 3.89% 7.58% 6.10% 6.090% 6.114% 6.150% 6.227% 6.133% 6.087% 6.086%Long-term accrued income taxes 7.90% 12.22% 10.07% 11.092% 11.155% 11.176% 11.251% 11.474% 10.600% 10.677%Long-term deferred tax liabilities 2.27% 23.20% 12.93% 12.314% 11.790% 11.309% 10.921% 10.756% 10.676% 10.673%Other long-term liabilities 1.38% 8.98% 6.65% 6.327% 6.058% 5.811% 5.611% 5.526% 5.485% 5.484%
Total liabilities 108.79% 263.83% 165.50% 169.966% 166.945% 163.873% 161.886% 162.620% 163.548% 165.726%Shareholders equity:
Retained earnings 117.26% 268.57% 187.05% 168.675% 152.921% 140.631% 130.355% 123.222% 117.357% 112.476%Accumulated other comprehensive loss -3.51% -5.84% -6.48% -3.745% -3.481% -3.242% -3.039% -2.906% -2.800% -2.718%
Total shareholders equity 114.34% 262.72% 180.57% 164.930% 149.440% 137.389% 127.316% 120.316% 114.557% 109.757%Total liabilities and shareholders equity 223.13% 526.55% 346.07% 334.896% 316.385% 301.262% 289.202% 282.935% 278.105% 275.484%

MedtronicCommon Size Balance Sheet of total Assets
Fiscal year end 4/29/2016 2014 2015 2016 2017E 2018E 2019E 2020E 2021E 2022E 2023E(in millions, except per share data)ASSETSCurrent assets: 3.70% 4.54% 2.88% 5.27% 3.64% 2.25% 2.13% 2.81% 3.11% 3.11%
Cash and cash equivalents 33.83% 13.72% 9.78% 9.53% 9.56% 9.54% 9.50% 9.47% 9.47% 9.47%Investments 10.04% 4.79% 5.57% 6.24% 6.84% 7.41% 7.62% 7.78% 8.38% 8.95%Accounts receivable, net - - - 0.00% 0.00% 0.00% 0.00% 0.00% 0.00% 0.00%Income tax receivable 4.55% 3.25% 3.48% 3.04% 3.23% 3.40% 3.57% 3.72% 4.16% 4.23%Inventories 1.94% 1.25% 0.70% 0.69% 0.75% 0.80% 0.86% 0.91% 0.96% 0.99%Tax assets 1.84% 1.36% 1.24% 1.41% 1.53% 1.64% 1.75% 1.87% 1.99% 2.02%Prepaid expenses and other current assets 55.90% 28.91% 23.65% 26.17% 25.55% 25.04% 25.43% 26.57% 28.06% 28.77%
Total current assets 6.30% 4.40% 4.85% 4.55% 5.02% 5.46% 5.93% 6.40% 7.02% 7.75%Property, plant, and equipment, net 27.92% 37.99% 41.59% 39.73% 39.09% 38.23% 37.34% 36.49% 35.78% 35.06%Goodwill 6.02% 26.34% 26.96% 26.52% 27.15% 27.90% 27.77% 26.83% 25.23% 24.29%Other intangible assets, net 0.79% 0.73% 1.39% 1.46% 1.58% 1.70% 1.82% 1.96% 2.11% 2.28%Long-term tax assets - - - 0.00% 0.00% 0.00% 0.00% 0.00% 0.00% 0.00%Long-term investment 3.06% 1.63% 1.56% 1.57% 1.62% 1.66% 1.71% 1.75% 1.80% 1.85%Other assets 100.00% 100.00% 100.00% 100.00% 100.00% 100.00% 100.00% 100.00% 100.00% 100.00%
Total assetsLIABILITIES AND SHAREHOLDERS EQUITYCurrent liabilities: 4.25% 2.28% 1.00% 1.74% 1.79% 1.84% 1.89% 1.94% 2.00% 2.05%
Short-term borrowings 1.96% 1.51% 1.71% 1.97% 2.10% 2.21% 2.32% 2.42% 2.70% 2.75%Accounts payable 2.68% 1.51% 1.72% 2.72% 2.91% 3.03% 3.15% 3.25% 3.30% 3.32%Accrued compensation 0.43% 0.88% 0.57% 0.83% 0.88% 0.93% 0.97% 1.01% 1.04% 1.06%Accrued income taxes 0.05% 0.11% - 0.00% 0.00% 0.00% 0.00% 0.00% 0.00% 0.00%Deferred tax liabilities 5.29% 2.31% 2.19% 2.39% 2.57% 2.69% 2.81% 2.94% 3.02% 3.08%Other accrued expenses 14.65% 8.60% 7.18% 9.65% 10.26% 10.70% 11.14% 11.55% 12.05% 12.25%
Total current liabilities 27.19% 31.64% 30.31% 30.40% 31.41% 32.26% 33.08% 33.95% 34.95% 35.96%Long-term debt 1.74% 1.44% 1.76% 1.82% 1.93% 2.04% 2.15% 2.17% 2.19% 2.21%Long-term accrued compensation and retirement 3.54% 2.32% 2.91% 3.31% 3.53% 3.71% 3.89% 4.06% 3.81% 3.88%Long-term accrued income taxes 1.02% 4.41% 3.74% 3.68% 3.73% 3.75% 3.78% 3.80% 3.84% 3.87%Long-term deferred tax liabilities 0.62% 1.71% 1.92% 1.89% 1.91% 1.93% 1.94% 1.95% 1.97% 1.99%Other long-term liabilities 48.76% 50.11% 47.82% 50.75% 52.77% 54.40% 55.98% 57.48% 58.81% 60.16%
Total liabilitiesShareholders equity: 52.55% 51.00% 54.05% 50.37% 48.33% 46.68% 45.07% 43.55% 42.20% 40.83%
Retained earnings -1.57% -1.11% -1.87% -1.12% -1.10% -1.08% -1.05% -1.03% -1.01% -0.99%Accumulated other comprehensive loss 51.24% 49.89% 52.18% 49.25% 47.23% 45.60% 44.02% 42.52% 41.19% 39.84%
Total shareholders equity 100.00% 100.00% 100.00% 100.00% 100.00% 100.00% 100.00% 100.00% 100.00% 100.00%

VALUATION OF OPTIONS GRANTED IN ESOP
Ticker Symbol MDTCurrent Stock Price $81.54Risk Free Rate 3.00%Current Dividend Yield 2.13%Annualized St. Dev. of Stock Returns 17.80%
Average Average B-S ValueRange of Number Exercise Remaining Option of OptionsOutstanding Options of Shares Price Life (yrs) Price GrantedRange 1 23 40.14 3.90 39.44$ 922$ Total 23 40.14$ 3.90$ 39.44$ 922$
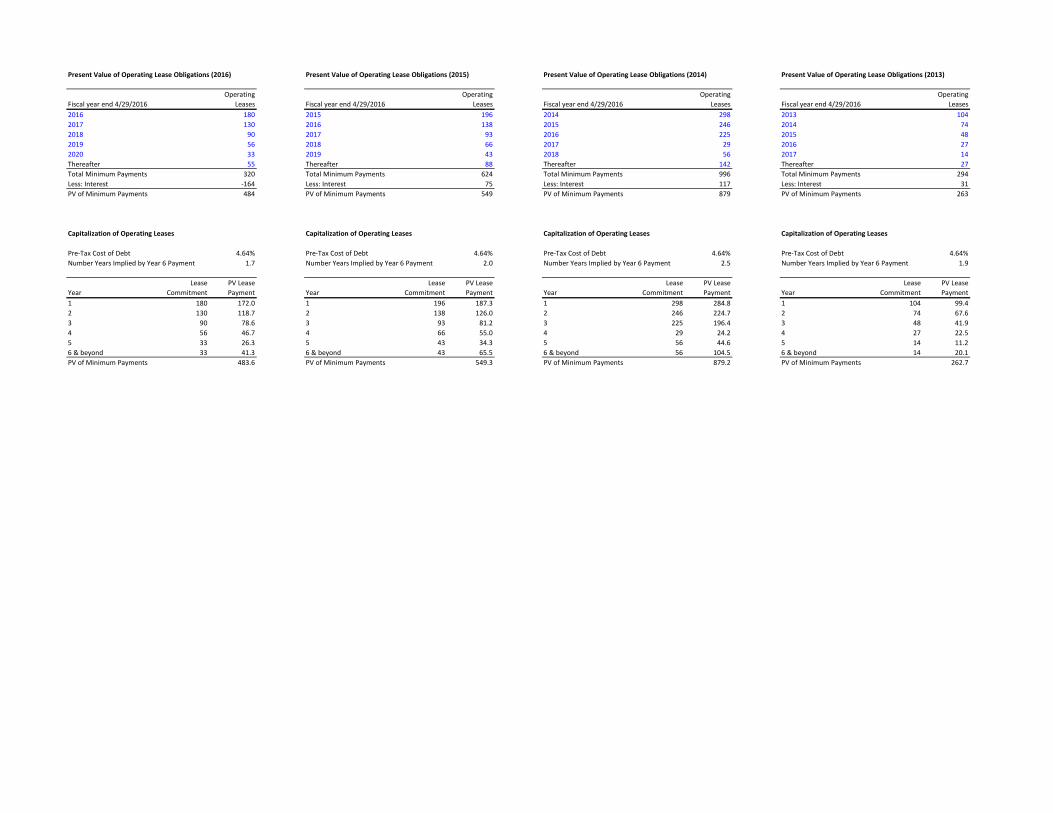
Present Value of Operating Lease Obligations (2016) Present Value of Operating Lease Obligations (2015) Present Value of Operating Lease Obligations (2014) Present Value of Operating Lease Obligations (2013)
Operating Operating Operating OperatingFiscal year end 4/29/2016 Leases Fiscal year end 4/29/2016 Leases Fiscal year end 4/29/2016 Leases Fiscal year end 4/29/2016 Leases2016 180 2015 196 2014 298 2013 1042017 130 2016 138 2015 246 2014 742018 90 2017 93 2016 225 2015 482019 56 2018 66 2017 29 2016 272020 33 2019 43 2018 56 2017 14Thereafter 55 Thereafter 88 Thereafter 142 Thereafter 27Total Minimum Payments 320 Total Minimum Payments 624 Total Minimum Payments 996 Total Minimum Payments 294Less: Interest -164 Less: Interest 75 Less: Interest 117 Less: Interest 31PV of Minimum Payments 484 PV of Minimum Payments 549 PV of Minimum Payments 879 PV of Minimum Payments 263
Capitalization of Operating Leases Capitalization of Operating Leases Capitalization of Operating Leases Capitalization of Operating Leases
Pre-Tax Cost of Debt 4.64% Pre-Tax Cost of Debt 4.64% Pre-Tax Cost of Debt 4.64% Pre-Tax Cost of Debt 4.64%Number Years Implied by Year 6 Payment 1.7 Number Years Implied by Year 6 Payment 2.0 Number Years Implied by Year 6 Payment 2.5 Number Years Implied by Year 6 Payment 1.9
Lease PV Lease Lease PV Lease Lease PV Lease Lease PV LeaseYear Commitment Payment Year Commitment Payment Year Commitment Payment Year Commitment Payment1 180 172.0 1 196 187.3 1 298 284.8 1 104 99.42 130 118.7 2 138 126.0 2 246 224.7 2 74 67.63 90 78.6 3 93 81.2 3 225 196.4 3 48 41.94 56 46.7 4 66 55.0 4 29 24.2 4 27 22.55 33 26.3 5 43 34.3 5 56 44.6 5 14 11.26 & beyond 33 41.3 6 & beyond 43 65.5 6 & beyond 56 104.5 6 & beyond 14 20.1PV of Minimum Payments 483.6 PV of Minimum Payments 549.3 PV of Minimum Payments 879.2 PV of Minimum Payments 262.7

Effects of ESOP Exercise and Share Repurchases on Common Stock Balance Sheet Account and Number of Shares Outstanding
Number of Options Outstanding (shares): 23Average Time to Maturity (years): 3.90Expected Annual Number of Options Exercised: 6
Current Average Strike Price: 40.14$ Cost of Equity: 7.25%Current Stock Price: $81.54
2017E 2018E 2019E 2020E 2021E 2022E 2023E 2024E 2025EIncrease in Shares Outstanding: 6 6 6 5Average Strike Price: 40.14$ 40.14$ 40.14$ 40.14$ Increase in Common Stock Account: 241 241 241 217
Change in Treasury Stock 2,900 3,016 2,500 2,500 2,525 2,550 2,576 2,602 2,628 2,654Expected Price of Repurchased Shares: 81.54$ 87.45$ 93.79$ 100.59$ 107.88$ 115.71$ 124.10$ 133.09$ 142.74$ 153.09$ Number of Shares Repurchased: 36 34 27 25 23 22 21 20 18 17
Shares Outstanding (beginning of the year) 1,410 1,380 1,352 1,331 1,311 1,288 1,266 1,245 1,226 1,207Plus: Shares Issued Through ESOP 6 6 6 5 0 0 0 0 0 0Less: Shares Repurchased in Treasury 36 34 27 25 23 22 21 20 18 17 Shares Outstanding (end of the year) 1,380 1,352 1,331 1,311 1,288 1,266 1,245 1,226 1,207 1,190