Healthcare & Life Sciences Industry Update · 2013-05-03 · Healthcare & Life Sciences Industry...
16
www.harriswilliams.com Member FINRA/SIPC Healthcare & Life Sciences Industry Update March 2013
Transcript of Healthcare & Life Sciences Industry Update · 2013-05-03 · Healthcare & Life Sciences Industry...

www.harriswilliams.com
Member FINRA/SIPC
Healthcare & Life Sciences
Industry Update March 2013

• The Wall Street Journal published an article by a research group led by Clay Christensen,
Harvard Business School professor and co-founder of Innosight Institute, that discusses
why ACOs may not be successful. The article cites the inability of ACOs to change
physician behavior or to enforce patient accountability as fundamental reasons why ACOs
will not be able to align quality of outcomes with interests of multiple healthcare
participants. As a result, the authors assert that ACOs are not likely to deliver the
significant savings or improvements in quality for which they were created. You can find
the article here (a subscription to The Wall Street Journal Online may be required).
• As many readers are already aware, on March 1st, $85 billion in automatic spending cuts,
known as Sequestration, went into effect as part of the Budget Control Act of 2011. As part
of the current plan by the Obama Administration to implement Sequestration, a 2% cut to
Medicare reimbursement is set to take place on April 1st. We have chosen to highlight two
articles that go into greater detail about the impact of this significant development on the
healthcare landscape.
− The Medicare News Group posted an article on their website that concisely
summarizes the projected impacts of Sequestration. The piece provides good detail on
the breakdown of Medicare spending subject to reductions as well as spending which
would be exempt. Additionally, the article cites $11 billion in total cuts to Medicare in
2013 as the result of Sequestration with a potential total reduction of $123 billion
through 2021.
− Becker’s Hospital Review published insights from seven healthcare leaders with
backgrounds in providers, business, academia, and law on the potential effects of
Sequestration. With most providers and hospitals operating on thin margins, there is
broad concern around the ability of hospitals to sustain operations, especially those
reliant on a higher mix of Medicare reimbursement, and the resulting impact on
patient access. The contributors also discuss the potential long term impacts of other
cuts to healthcare-related discretionary spending that are part of Sequestration such as
funding for the FDA and NIH grants.
What We’ve Been
Reading
March 2013
1
HW&Co. HCLS
Group Insights
March 2013
Durable Medical Equipment
Contract Manufacturing
2
Home Health
3
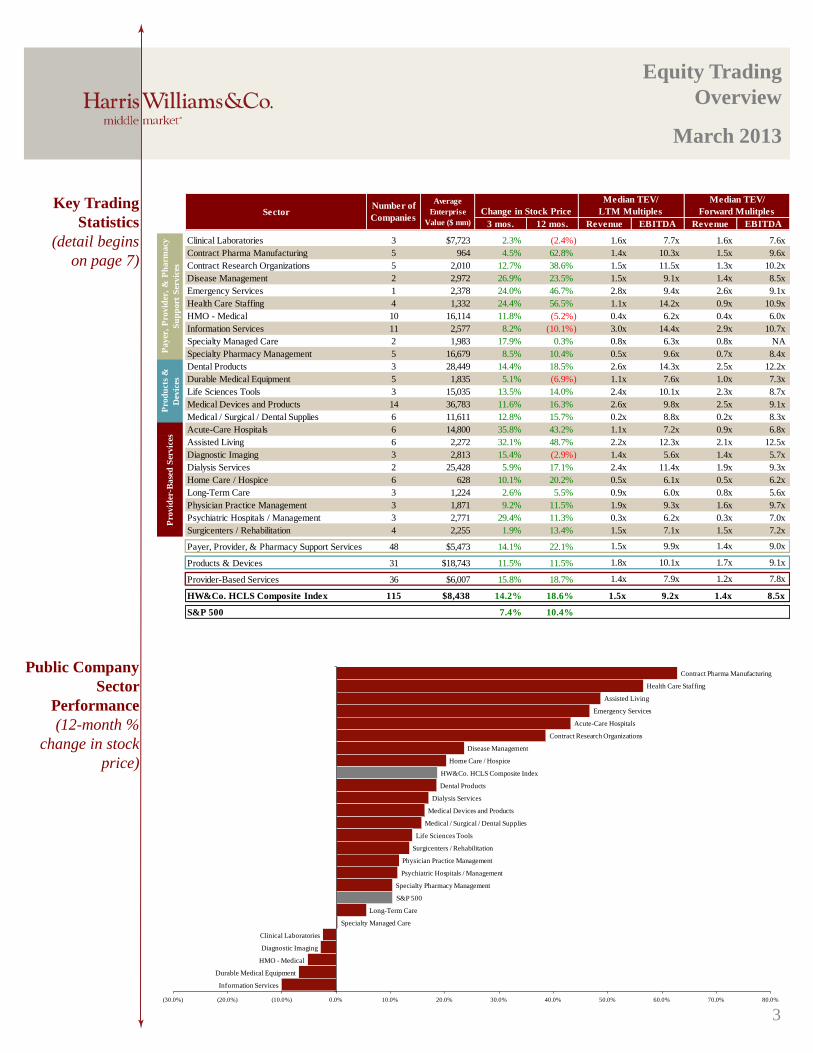
Key Trading
Statistics
(detail begins
on page 7)
Equity Trading
Overview
March 2013
Public Company
Sector
Performance
(12-month %
change in stock
price)
Change in Stock Price
3 mos. 12 mos. Revenue EBITDA Revenue EBITDA
Clinical Laboratories 3 $7,723 2.3% (2.4%) 1.6x 7.7x 1.6x 7.6x
Contract Pharma Manufacturing 5 964 4.5% 62.8% 1.4x 10.3x 1.5x 9.6x
Contract Research Organizations 5 2,010 12.7% 38.6% 1.5x 11.5x 1.3x 10.2x
Disease Management 2 2,972 26.9% 23.5% 1.5x 9.1x 1.4x 8.5x
Emergency Services 1 2,378 24.0% 46.7% 2.8x 9.4x 2.6x 9.1x
Health Care Staffing 4 1,332 24.4% 56.5% 1.1x 14.2x 0.9x 10.9x
HMO - Medical 10 16,114 11.8% (5.2%) 0.4x 6.2x 0.4x 6.0x
Information Services 11 2,577 8.2% (10.1%) 3.0x 14.4x 2.9x 10.7x
Specialty Managed Care 2 1,983 17.9% 0.3% 0.8x 6.3x 0.8x NA
Specialty Pharmacy Management 5 16,679 8.5% 10.4% 0.5x 9.6x 0.7x 8.4x
Dental Products 3 28,449 14.4% 18.5% 2.6x 14.3x 2.5x 12.2x
Durable Medical Equipment 5 1,835 5.1% (6.9%) 1.1x 7.6x 1.0x 7.3x
Life Sciences Tools 3 15,035 13.5% 14.0% 2.4x 10.1x 2.3x 8.7x
Medical Devices and Products 14 36,783 11.6% 16.3% 2.6x 9.8x 2.5x 9.1x
Medical / Surgical / Dental Supplies 6 11,611 12.8% 15.7% 0.2x 8.8x 0.2x 8.3x
Acute-Care Hospitals 6 14,800 35.8% 43.2% 1.1x 7.2x 0.9x 6.8x
Assisted Living 6 2,272 32.1% 48.7% 2.2x 12.3x 2.1x 12.5x
Diagnostic Imaging 3 2,813 15.4% (2.9%) 1.4x 5.6x 1.4x 5.7x
Dialysis Services 2 25,428 5.9% 17.1% 2.4x 11.4x 1.9x 9.3x
Home Care / Hospice 6 628 10.1% 20.2% 0.5x 6.1x 0.5x 6.2x
Long-Term Care 3 1,224 2.6% 5.5% 0.9x 6.0x 0.8x 5.6x
Physician Practice Management 3 1,871 9.2% 11.5% 1.9x 9.3x 1.6x 9.7x
Psychiatric Hospitals / Management 3 2,771 29.4% 11.3% 0.3x 6.2x 0.3x 7.0x
Surgicenters / Rehabilitation 4 2,255 1.9% 13.4% 1.5x 7.1x 1.5x 7.2x
Payer, Provider, & Pharmacy Support Services 48 $5,473 14.1% 22.1% 1.5x 9.9x 1.4x 9.0x
Products & Devices 31 $18,743 11.5% 11.5% 1.8x 10.1x 1.7x 9.1x
Provider-Based Services 36 $6,007 15.8% 18.7% 1.4x 7.9x 1.2x 7.8x
HW&Co. HCLS Composite Index 115 $8,438 14.2% 18.6% 1.5x 9.2x 1.4x 8.5x
S&P 500 7.4% 10.4%
Payer
, P
rovid
er,
& P
harm
acy
Su
pp
ort
Ser
vic
es
Pro
du
cts
&
Dev
ices
Pro
vid
er-B
ase
d S
ervic
es
Median TEV/
Forward MulitplesSectorNumber of
Companies
Average
Enterprise
Value ($ mm)
Median TEV/
LTM Multiples
Contract Pharma Manufacturing
Health Care Staffing
Assisted Living
Emergency Services
Acute-Care Hospitals
Contract Research Organizations
Disease Management
Home Care / Hospice
HW&Co. HCLS Composite Index
Dental Products
Dialysis Services
Medical Devices and Products
Medical / Surgical / Dental Supplies
Life Sciences Tools
Surgicenters / Rehabilitation
Physician Practice Management
Psychiatric Hospitals / Management
Specialty Pharmacy Management
S&P 500
Long-Term Care
Specialty Managed Care
Clinical Laboratories
Diagnostic Imaging
HMO - Medical
Durable Medical Equipment
Information Services
(30.0%) (20.0%) (10.0%) 0.0% 10.0% 20.0% 30.0% 40.0% 50.0% 60.0% 70.0% 80.0%
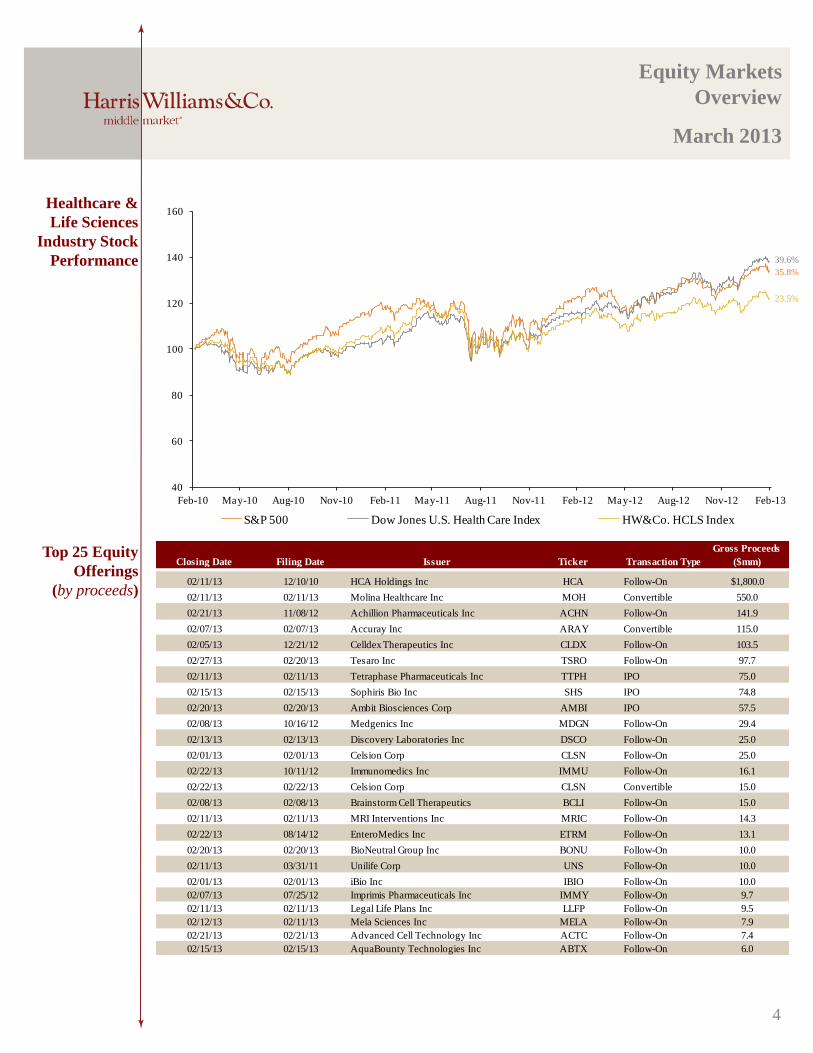
Closing Date Filing Date Issuer Ticker Transaction Type
Gross Proceeds
($mm)
02/11/13 12/10/10 HCA Holdings Inc HCA Follow-On $1,800.0
02/11/13 02/11/13 Molina Healthcare Inc MOH Convertible 550.0
02/21/13 11/08/12 Achillion Pharmaceuticals Inc ACHN Follow-On 141.9
02/07/13 02/07/13 Accuray Inc ARAY Convertible 115.0
02/05/13 12/21/12 Celldex Therapeutics Inc CLDX Follow-On 103.5
02/27/13 02/20/13 Tesaro Inc TSRO Follow-On 97.7
02/11/13 02/11/13 Tetraphase Pharmaceuticals Inc TTPH IPO 75.0
02/15/13 02/15/13 Sophiris Bio Inc SHS IPO 74.8
02/20/13 02/20/13 Ambit Biosciences Corp AMBI IPO 57.5
02/08/13 10/16/12 Medgenics Inc MDGN Follow-On 29.4
02/13/13 02/13/13 Discovery Laboratories Inc DSCO Follow-On 25.0
02/01/13 02/01/13 Celsion Corp CLSN Follow-On 25.0
02/22/13 10/11/12 Immunomedics Inc IMMU Follow-On 16.1
02/22/13 02/22/13 Celsion Corp CLSN Convertible 15.0
02/08/13 02/08/13 Brainstorm Cell Therapeutics BCLI Follow-On 15.0
02/11/13 02/11/13 MRI Interventions Inc MRIC Follow-On 14.3
02/22/13 08/14/12 EnteroMedics Inc ETRM Follow-On 13.1
02/20/13 02/20/13 BioNeutral Group Inc BONU Follow-On 10.0
02/11/13 03/31/11 Unilife Corp UNS Follow-On 10.0
02/01/13 02/01/13 iBio Inc IBIO Follow-On 10.0
02/07/13 07/25/12 Imprimis Pharmaceuticals Inc IMMY Follow-On 9.7
02/11/13 02/11/13 Legal Life Plans Inc LLFP Follow-On 9.5
02/12/13 02/11/13 Mela Sciences Inc MELA Follow-On 7.9
02/21/13 02/21/13 Advanced Cell Technology Inc ACTC Follow-On 7.4
02/15/13 02/15/13 AquaBounty Technologies Inc ABTX Follow-On 6.0
4
Healthcare &
Life Sciences
Industry Stock
Performance
Top 25 Equity
Offerings
(by proceeds)
Equity Markets
Overview
March 2013
35.8%
39.6%
23.5%
40
60
80
100
120
140
160
Feb-10 May-10 Aug-10 Nov-10 Feb-11 May-11 Aug-11 Nov-11 Feb-12 May-12 Aug-12 Nov-12 Feb-13
S&P 500 Dow Jones U.S. Health Care Index HW&Co. HCLS Index

5
Announced
Healthcare &
Life Sciences
M&A
Announced Healthcare & Life Sciences Transactions Median Healthcare & Life Sciences Transaction Multiples
PEG Investments and Exits PEG Investments by Segment (Last 3 Years)
Healthcare &
Life Sciences
M&A Trends
Announced
Private Equity
M&A Activity
Middle Market Healthcare Transaction Highlights Quarterly M&A Activity
LTM Deal Statistics
Note: Transactions based on publicly available information
M&A Overview
March 2013
Announced Target Buyer
2/28/2013 Nine Clinic Physical Therapy Group US Physical Therapy Inc. (NYSE:USPH)
2/25/2013 Assisted Living Concepts Inc. (NYSE:ALC) TPG Capital, L.P.
2/25/2013 PureWellness, Inc. Cerner Corporation (NasdaqGS:CERN)
2/19/2013 Kova International, Inc. StoneCreek Capital, Inc
2/13/2013 AssuraMed Holding, Inc. Cardinal Health, Inc. (NYSE:CAH)
2/7/2013 Addus HealthCare, Inc., Home Health Business LHC Group, Inc. (NasdaqGS:LHCG)
2/6/2013 JAWOOD Business Process Solutions, LLC Genpact Ltd. (NYSE:G)
2/5/2013 TYSABRI Biogen Idec International Holding Ltd
2/5/2013 Biomedical Structures, LLC Modified Polymer Components, Inc.
2/4/2013 Massive Health, Inc. AliphCom, Inc.
Aggregate Number Median Transaction Multiples
Value ($bn) of Deals TEV/Rev TEV/EBITDA
$104.8 1,044 2.13x 10.5x
HC&LS Industry Number of
Segment Companies
Biotechnology 5
Healthcare Technology 18
Healthcare Distributors 8
Healthcare Equipment 26
Healthcare Facilities 33
Healthcare Services 62
Healthcare Supplies 8
Life Sciences Tools & Services 13
Managed Healthcare 6
Pharmaceuticals 17
$194.1 $174.6
$110.6
$141.4
$101.6
$12.4 0
200
400
600
800
1000
1200
$0
$50
$100
$150
$200
$250
$300
$350
$400
$450
$500
2008 2009 2010 2011 2012 2013 YTD
Nu
mb
er o
f Tra
nsa
ctio
ns_
_
Ag
greg
ate
Tra
nsa
cti
on
Va
lue (
$ i
n b
illi
on
s)
Aggregate Deal Value # of deals
279
255
225242
256267
245 236219
229 221
291
152
18
19
17
13
1816
1318
11
20
12
22
10
0
50
100
150
200
250
300
350
1Q10 2Q10 3Q10 4Q10 1Q11 2Q11 3Q11 4Q11 1Q12 2Q12 3Q12 4Q12 1Q13
Nu
mb
er o
f T
ra
nsa
cti
on
s__
PEG Acquirer Strategic Acquirer
15.2x
7.7x
12.8x
11.1x 10.9x
9.3x
0.0x
0.5x
1.0x
1.5x
2.0x
2.5x
3.0x
3.5x
4.0x
0x
3x
6x
9x
12x
15x
18x
21x
2008 2009 2010 2011 2012 2013 YTD
EV
/ LT
M R
ev
en
ue M
ultip
le_
_EV
/ L
TM
EB
ITD
A M
ult
iple
__
TEV / LTM EBITDA TEV / LTM Sales
40
58
69
94
113
79
42
7165 65
10
27
40
60 62
95
49 50
80
120
139
17
0
20
40
60
80
100
120
140
160
2003 2004 2005 2006 2007 2008 2009 2010 2011 2012 2013 YTD
Tra
nsa
cti
on
Vo
lum
e'
Number of Investments Number of Exits

Key Credit
Statistics
Top 20 Recent
Healthcare &
Life Sciences
Debt Offerings
(by deal amount)
Average Secondary Spread
Average Spread on Healthcare Loans
Credit Statistics
Quarterly Healthcare Loan Volume
Debt Markets
Overview
March 2013
6
$0
$3
$6
$9
$12
$15
$18
$21
$24
4Q06 2Q07 4Q07 2Q08 4Q08 2Q09 4Q09 2Q10 4Q10 2Q11 4Q11 2Q12 4Q12
Lo
an
Vo
lum
e b
y Q
ua
rte
r (
$ i
n b
illi
on
s)_
__
Pro Rata Institutional
L + 0
L + 100
L + 200
L + 300
L + 400
L + 500
2006 2007 2008 2009 2010 2011 2012
Aver
age
Sp
read
Over
LIB
OR
__
Revolving Credit / Term Loan A Weighted-Average Institutional
L + 0
L + 200
L + 400
L + 600
L + 800
L + 1000
Aver
age
Sp
read
Over
LIB
OR
__
0.0x
2.0x
4.0x
6.0x
Debt/EBITDA Senior Debt/EBITDA EBITDA/Cash Interest EBITDA - Capex/Cash Interest
EB
ITD
A M
ult
iple
__
2006 2007 2008 2009 2010 2011 2012
Date Effective Borrower Name Description Tranche Amount ($mn) Type Rating Spread
02/20/13 Valeant Pharmaceuticals International Pharmaceutical preparations $2,300 Term Loan B BB- / B1 L+ 275
02/11/13 NBTY Inc Pharmaceutical preparations 1,508 Term Loan B / WR N/A
02/11/13 Catalent Pharma Solutions Pharmaceutical preparations 799 Term Loan B NR / B2 L+ 350
02/11/13 Catalent Pharma Solutions Pharmaceutical preparations 665 Term Loan NR / B2 L+ 325
02/19/13 United Surgical Partners International Inc General medical & surgical hospitals 672 Term Loan B CCC+ / Caa1 L+ 375
02/19/13 United Surgical Partners International Inc General medical & surgical hospitals 310 Term Loan B CCC+ / Caa1 L+ 350
02/19/13 United Surgical Partners International Inc General medical & surgical hospitals 125 Revolver/Line >= 1 Yr. CCC+ / Caa1 L+ 350
02/06/13 Par Pharmaceutical Pharmaceutical preparations 1,066 Term Loan B B- / B1 L+ 325
02/15/13 MultiPlan Inc Medical and hospital equipment 1,030 Term Loan B CCC+ / Caa1 L+ 300
02/21/13 Iasis Healthcare Corp General medical & surgical hospitals 1,007 Term Loan B NR / WR L+ 325
02/19/13 Immucor Inc Diagnostic substances 663 Term Loan B B- / Caa1 L+ 375
02/19/13 Immucor Inc Diagnostic substances 100 Revolver/Line >= 1 Yr. B- / Caa1 L+ 375
02/20/13 American Renal Associates Kidney dialysis centers 50 Revolver/Line >= 1 Yr. NR / Ba3 L+ 325
02/20/13 American Renal Associates Kidney dialysis centers 400 Term Loan B NR / Ba3 L+ 325
02/20/13 American Renal Associates Kidney dialysis centers 240 Term Loan NR / Caa1 L+ 725
02/12/13 Sheridan Healthcare Inc General medical & surgical hospitals 672 Term Loan B NR / WR L+ 350
02/21/13 Prestige Brands Inc Pharmaceutical preparations 455 Term Loan B B- / B3 L+ 275
02/05/13 Healogics Specialty outpatient clinics 30 Revolver/Line >= 1 Yr. B / B1 N/A
02/05/13 Healogics Specialty outpatient clinics 290 Term Loan B B / B1 L+ 400
02/05/13 Healogics Specialty outpatient clinics 125 Term Loan B / B1 L+ 800

Healthcare & Life Sciences Trading Statistics
March 2013
As of February 28, 2013 7
Payer, Provider, & Pharmacy Support Services
Stock Price
% Change 52 Week
2/28/2013 3 mos. 12 mos. High Low Revenue EBITDA EBIT Revenue EBITDA EBIT Revenue EBITDA Revenue EBITDA
Clinical Laboratories
Bio-Reference Laboratories Inc. $26.48 2.3% 25.2% $32.86 $18.29 $734 $24 $26 $732 $673 $96 $79 Jan-13 Oct-12 $706 $105 $88 1.1x 7.7x 1.0x 7.0x
Laboratory Corp. of America Holdings 88.60 6.2% (2.4%) 95.30 81.56 8,249 2,655 467 10,458 5,671 1,303 1,114 Dec-12 Dec-12 5,788 1,303 1,083 1.8x 7.9x 1.8x 8.0x
Quest Diagnostics Inc. 56.17 (2.2%) (4.0%) 64.87 53.25 8,887 3,367 296 11,981 7,383 1,605 1,319 Dec-12 Dec-12 7,388 1,580 1,305 1.6x 7.3x 1.6x 7.6x
Number of Companies 3 Median: 2.3% (2.4%) Total $17,869 $7,723 $13,727 $13,882 1.6x 7.7x 1.6x 7.6x
Mean: 2.1% 6.3% $7,723 1.5x 7.6x 1.5x 7.5x
Contract Pharma Manufacturing
Akorn, Inc. $13.81 4.5% 7.5% $16.87 $10.53 $1,324 $105 $41 $1,387 $256 $89 $78 Dec-12 Dec-12 $333 $116 $108 6.1x 17.6x 4.2x 11.9x
Cambrex Corporation. 11.51 17.9% 62.8% 14.33 5.87 345 64 24 385 277 58 36 Dec-12 Dec-12 309 NA 43 1.4x 6.9x 1.2x NA
Integrated Biopharma Inc. 0.19 (13.6%) 287.8% 0.33 0.02 4 15 0 19 31 (1) (1) Dec-12 Jun-12 NA NA NA 0.6x NM NA NA
Patheon Inc. 3.16 (15.0%) 65.6% 3.89 1.57 442 313 39 708 749 72 31 Oct-12 Oct-12 1,026 127 74 1.0x 10.2x 0.7x 5.6x
West Pharmaceutical Services, Inc. 60.42 12.1% 43.9% 60.99 39.30 2,076 420 162 2,322 1,266 220 143 Dec-12 Dec-12 1,376 241 159 1.8x 10.3x 1.7x 9.6x
Number of Companies 5 Median: 4.5% 62.8% Total $4,190 $964 $2,580 $3,044 1.4x 10.3x 1.5x 9.6x
Mean: 1.2% 93.5% $964 2.2x 11.2x 1.9x 9.1x
Contract Research Organizations
Albany Molecular Research Inc. $8.08 71.9% 192.8% $8.48 $2.25 $250 $8 $23 $235 $227 $31 $14 Dec-12 Dec-12 $244 $37 $21 1.0x 7.5x 1.0x 6.4x
Charles River Laboratories International, Inc. 40.74 5.2% 13.9% 43.30 31.48 1,963 667 110 2,515 1,130 257 176 Dec-12 Dec-12 1,179 277 203 2.2x 9.8x 2.1x 9.1x
Covance Inc. 66.59 18.2% 36.9% 69.80 44.19 3,670 320 493 3,497 2,181 303 189 Dec-12 Dec-12 2,345 344 220 1.6x 11.5x 1.5x 10.2x
ICON Public Limited Company 31.16 12.7% 47.8% 31.72 20.02 1,879 0 0 1,699 1,115 117 74 Dec-12 Dec-12 1,275 158 115 1.5x 14.6x 1.3x 10.8x
PAREXEL International Corporation 34.69 8.6% 38.6% 35.10 23.75 2,017 382 204 2,102 1,565 183 117 Dec-12 Jun-12 1,705 206 136 1.3x 11.5x 1.2x 10.2x
Number of Companies 5 Median: 12.7% 38.6% Total $9,778 $2,010 $6,217 $6,748 1.5x 11.5x 1.3x 10.2x
Mean: 23.3% 66.0% $2,010 1.5x 11.0x 1.4x 9.3x
Disease Management
Alere Inc. $22.76 27.6% (11.2%) $26.50 $17.13 $1,840 $3,709 $328 $5,220 $2,819 $539 $109 Dec-12 Dec-12 $2,934 $619 $521 1.9x 9.5x 1.8x 8.4x
Healthways Inc. 12.85 26.2% 58.3% 13.20 6.21 436 290 2 724 677 82 31 Dec-12 Dec-12 727 85 30 1.1x 8.8x 1.0x 8.5x
Number of Companies 2 Median: 26.9% 23.5% Total $2,276 $2,972 $3,496 $3,661 1.5x 9.1x 1.4x 8.5x
Mean: 26.9% 23.5% $2,972 1.5x 9.1x 1.4x 8.5x
Emergency Services
Air Methods Corp. $44.79 24.0% 46.7% $45.08 $26.97 $1,734 $648 $4 $2,378 $851 $254 $170 Dec-12 Dec-12 $918 $260 $169 2.8x 9.4x 2.6x 9.1x
Number of Companies 1 Median: 24.0% 46.7% Total $1,734 $2,378 $851 $918 2.8x 9.4x 2.6x 9.1x
Mean: 24.0% 46.7% $2,378 2.8x 9.4x 2.6x 9.1x
Health Care Staffing
AMN Healthcare Services Inc. $14.10 28.8% 156.4% $14.43 $4.85 $646 $159 $6 $799 $954 $67 $53 Dec-12 Dec-12 $1,020 $76 $60 0.8x 11.8x 0.8x 10.5x
Cross Country Healthcare, Inc. 5.69 41.5% (1.6%) 5.98 3.80 176 35 5 203 507 10 1 Sep-12 Dec-11 493 10 (2) 0.4x 19.7x 0.4x 20.8x
On Assignment Inc. 21.86 11.1% 55.5% 25.10 13.13 1,148 440 0 1,574 1,240 107 93 Dec-12 Dec-12 1,630 159 123 1.3x 14.7x 1.0x 9.9x
Team Health Holdings, Inc. 33.49 20.1% 57.6% 35.39 19.90 2,277 518 41 2,754 2,069 202 157 Dec-12 Dec-12 2,359 243 194 1.3x 13.7x 1.2x 11.3x
Number of Companies 4 Median: 24.4% 56.5% Total $4,247 $1,332 $4,769 $5,503 1.1x 14.2x 0.9x 10.9x
Mean: 25.4% 67.0% $1,332 1.0x 15.0x 0.8x 13.1x
TEV/ LTM MultiplesEquity
Mkt. ValueTotal Debt
Cash and
Equiv.
Total
Ent.
Value
(TEV)
Lastest Twelve Months
(LTM)TEV/ Fwd MultiplesForward Estimate
Company NameLTM
Period
Lastest
FYE Date

Healthcare & Life Sciences Trading Statistics
March 2013
As of February 28, 2013 8
Payer, Provider, & Pharmacy Support Services
Stock Price
% Change 52 Week
2/28/2013 3 mos. 12 mos. High Low Revenue EBITDA EBIT Revenue EBITDA EBIT Revenue EBITDA Revenue EBITDA
HMO - Medical
Commercial:
Aetna Inc. $47.19 11.5% 1.2% $51.14 $34.58 $15,478 $6,528 $2,579 $19,428 $36,596 $3,522 $3,072 Dec-12 Dec-12 $40,032 $3,334 $2,977 0.5x 5.5x 0.5x 5.8x
Cigna Corp. 58.46 12.5% 31.8% 62.22 39.01 16,717 5,200 2,978 19,053 29,119 3,224 2,875 Dec-12 Dec-12 31,905 3,384 2,828 0.7x 5.9x 0.6x 5.6x
Coventry Health Care Inc. 45.36 5.1% 40.7% 46.92 27.72 6,106 1,585 1,399 6,292 14,154 928 808 Dec-12 Dec-12 14,738 828 702 0.4x 6.8x 0.4x 7.6x
Health Net, Inc. 25.74 12.2% (32.8%) 41.22 16.65 2,092 499 340 2,251 11,278 95 64 Dec-12 Dec-12 11,466 311 304 0.2x 23.8x 0.2x 7.2x
Humana Inc. 68.26 4.8% (22.9%) 93.36 59.92 10,809 2,935 1,306 12,438 39,126 2,354 2,016 Dec-12 Dec-12 41,181 2,489 2,198 0.3x 5.3x 0.3x 5.0x
UnitedHealth Group Incorporated 53.45 1.3% (4.3%) 60.75 50.32 54,782 16,754 8,406 65,251 110,618 10,151 9,254 Dec-12 Dec-12 123,669 10,667 9,573 0.6x 6.4x 0.5x 6.1x
WellPoint Inc. 62.18 13.5% (5.1%) 74.73 52.52 18,905 15,543 2,485 31,963 61,712 5,387 4,646 Dec-12 Dec-12 71,773 4,514 4,010 0.5x 5.9x 0.4x 7.1x
Number of Companies 7 Median: 11.5% (4.3%) Total $124,889 $22,382 $302,602 $334,764 0.5x 5.9x 0.4x 6.1x
Mean: 8.7% 1.2% $22,382 0.5x 8.5x 0.4x 6.4x
Government:
Centene Corp. 45.02 4.9% (8.6%) 50.98 24.26 2,356 539 844 2,052 8,704 92 37 Dec-12 Dec-12 10,353 311 245 0.2x 22.4x 0.2x 6.6x
Molina Healthcare, Inc. 31.91 16.8% (5.3%) 35.37 17.63 1,441 263 796 908 6,029 78 35 Dec-12 Dec-12 7,154 235 150 0.2x 11.6x 0.1x 3.9x
WellCare Health Plans, Inc. 57.19 20.5% (16.0%) 74.41 44.75 2,472 135 1,100 1,506 7,409 317 301 Dec-12 Dec-12 8,938 389 353 0.2x 4.8x 0.2x 3.9x
Number of Companies 3 Median: 16.8% (8.6%) Total $6,268 $1,489 $22,141 $26,445 0.2x 11.6x 0.2x 3.9x
Mean: 14.1% (10.0%) $1,489 0.2x 12.9x 0.2x 4.8x
Information Services
Data/Analytics:
Accelrys Inc. $9.46 8.2% 18.1% $9.97 $7.42 $526 $0 $116 $411 $163 $11 ($11) Dec-12 Dec-12 $187 $37 $27 2.5x 37.7x 2.2x 11.1x
National Research Corp. 56.88 4.4% 49.4% 61.58 37.45 391 13 8 395 86 27 23 Dec-12 Dec-12 100 32 28 4.6x 14.4x 4.0x 12.5x
Number of Companies 2 Median: 6.3% 33.8% Total $917 $403 $249 $287 3.5x 26.0x 3.1x 11.8x
Mean: 6.3% 33.8% $403 3.5x 26.0x 3.1x 11.8x
eHealth:
WebMD Health Corp. 22.10 58.8% (11.5%) 26.08 13.13 1,083 800 992 892 470 28 (0) Dec-12 Dec-12 $448 $74 $44 1.9x 31.6x NA NA
Number of Companies 1 Median: 58.8% (11.5%) Total $1,083 $892 $470 $448 1.9x 31.6x NA NA
Mean: 58.8% (11.5%) $892 1.9x 31.6x NA NA
Hospital/Physician:
Allscripts Healthcare Solutions, Inc. $12.71 2.3% (34.1%) $19.57 $8.84 $2,179 $442 $104 $2,517 $1,446 $175 $24 Dec-12 Dec-12 $1,509 $273 $190 1.7x 14.4x 1.7x 9.2x
athenahealth, Inc. 93.79 48.3% 30.8% 97.37 56.33 3,408 0 155 3,214 422 51 31 Dec-12 Dec-12 545 113 81 7.6x 63.0x 5.9x 28.4x
Cerner Corporation 87.46 12.5% 16.9% 88.92 67.64 15,061 196 317 14,221 2,610 713 572 Dec-12 Dec-12 3,010 972 739 5.4x 20.0x 4.7x 14.6x
Computer Programs & Systems Inc. 52.14 2.5% (15.4%) 62.59 44.95 578 0 9 558 183 44 41 Dec-12 Dec-12 200 54 50 3.0x 12.6x 2.8x 10.3x
HMS Holdings Corp. 29.05 32.2% (10.1%) 37.19 18.50 2,526 333 135 2,723 474 154 100 Dec-12 Dec-12 571 175 114 5.7x 17.6x 4.8x 15.6x
MedAssets, Inc. 18.47 13.5% 28.0% 19.99 10.73 1,098 894 14 1,979 640 195 92 Dec-12 Dec-12 680 221 88 3.1x 10.2x 2.9x 9.0x
Merge Healthcare Incorporated 2.45 (28.6%) (63.8%) 6.72 2.20 228 250 35 444 249 31 11 Dec-12 Dec-12 265 59 31 1.8x 14.2x 1.7x 7.5x
Quality Systems Inc. 18.52 (0.4%) (57.9%) 44.69 15.04 1,103 0 102 996 458 108 95 Dec-12 Mar-12 467 121 97 2.2x 9.2x 2.1x 8.3x
Number of Companies 8 Median: 7.5% (12.7%) Total $1,641 $3,331 $466 $558 3.1x 14.3x 2.9x 9.8x
Mean: 7.5% (12.7%) $2,248 3.1x 14.3x 2.9x 9.8x
Company NameEquity
Mkt. ValueTotal Debt
Cash and
Equiv.
Total
Ent.
Value
(TEV)
Lastest Twelve Months
(LTM)LTM
Period
Lastest
FYE Date
Forward Estimate TEV/ LTM Multiples TEV/ Fwd Multiples

Healthcare & Life Sciences Trading Statistics
March 2013
As of February 28, 2013 9
Payer, Provider, & Pharmacy Support Services
Stock Price
% Change 52 Week
2/28/2013 3 mos. 12 mos. High Low Revenue EBITDA EBIT Revenue EBITDA EBIT Revenue EBITDA Revenue EBITDA
Specialty Managed Care
Assurant Inc. 41.99 23.5% (1.2%) 43.63 32.41 3,309 1,067 909 3,467 8,508 942 818 Dec-12 Dec-12 8,401 NA 755 0.4x 3.7x 0.4x NA
CorVel Corporation 48.04 12.2% 1.7% 51.36 39.46 520 0 21 499 422 56 40 Dec-12 Mar-12 426 NA NA 1.2x 8.9x 1.2x NA
Number of Companies 2 Median: 17.9% 0.3% Total $3,829 $1,983 $8,930 $8,827 0.8x 6.3x 0.8x NA
Mean: 17.9% 0.3% $1,983 0.8x 6.3x 0.8x NA
Specialty Pharmacy Management
BioScrip Inc. $10.95 10.7% 69.8% $11.99 $6.14 $623 $226 $67 $782 $1,904 $60 $45 Sep-12 Dec-11 $655 $40 $20 0.4x 13.1x 1.2x 19.8x
Express Scripts Holding Company 56.93 8.4% 5.9% 66.06 49.79 46,597 15,915 2,794 59,729 93,858 5,275 3,540 Dec-12 Dec-12 100,898 6,774 6,316 0.6x 11.3x 0.6x 8.8x
Catamaran Corporation 54.04 16.8% 52.0% 56.00 33.84 11,086 1,173 371 11,866 9,940 412 261 Dec-12 Dec-12 14,499 673 453 1.2x 29.7x 0.8x 17.6x
Omnicare Inc. 37.26 8.6% 5.3% 40.00 29.24 3,899 2,058 454 5,477 6,160 700 564 Dec-12 Dec-12 6,144 683 573 0.9x 7.8x 0.9x 8.0x
PharMerica Corporation 14.33 2.4% 14.9% 15.42 9.03 423 316 12 727 1,833 104 73 Dec-12 Dec-12 1,663 114 80 0.4x 7.0x 0.4x 6.4x
Number of Companies 5 Median: 8.5% 10.4% Total $62,628 $16,679 $113,695 $123,858 0.5x 9.6x 0.7x 8.4x
Mean: 7.5% 24.0% $16,679 0.6x 9.8x 0.8x 10.8x
TEV/ LTM Multiples TEV/ Fwd MultiplesTotal
Ent.
Value
(TEV)
Lastest Twelve Months
(LTM)LTM
Period
Lastest
FYE Date
Forward EstimateCompany Name
Equity
Mkt. ValueTotal Debt
Cash and
Equiv.

Healthcare & Life Sciences Trading Statistics
March 2013
As of February 28, 2013 10
Products & Devices Stock Price
% Change 52 Week
2/28/2013 3 mos. 12 mos. High Low Revenue EBITDA EBIT Revenue EBITDA EBIT Revenue EBITDA Revenue EBITDA
Dental Products
3M Company $104.00 14.4% 18.5% $104.56 $81.99 $71,759 $6,072 $2,883 $73,765 $29,904 $7,771 $6,483 Dec-12 Dec-12 $31,530 $8,337 $6,977 2.5x 9.5x 2.3x 8.8x
DENTSPLY International Inc. 41.42 5.0% 6.4% 43.51 35.04 5,917 1,718 80 7,593 2,928 534 405 Dec-12 Dec-12 3,050 622 498 2.6x 14.3x 2.5x 12.2x
Sirona Dental Systems Inc. 71.02 14.9% 41.8% 73.98 40.59 4,036 75 124 3,990 994 255 183 Dec-12 Sep-12 1,088 296 260 4.0x 15.7x 3.7x 13.5x
Number of Companies 3 Median: 14.4% 18.5% Total $81,712 $28,449 $33,826 $35,668 2.6x 14.3x 2.5x 12.2x
Mean: 11.4% 22.2% $28,449 3.0x 13.2x 2.8x 11.5x
Durable Medical Equipment
Hill-Rom Holdings, Inc. 32.78 20.0% (6.9%) 36.13 24.69 1,978 350 108 2,220 1,682 291 195 Dec-12 Sep-12 1,759 319 191 1.3x 7.6x 1.3x 7.0x
Invacare Corporation 14.51 5.1% (15.2%) 18.27 12.87 463 235 39 659 1,455 70 31 Dec-12 Dec-12 1,345 NA 37 0.5x 9.5x 0.5x NA
Prism Medical Ltd. 5.45 3.4% (5.7%) 6.47 4.72 46 14 2 58 79 9 6 Aug-12 Nov-11 78 8 NA 0.8x 6.9x 0.7x 7.3x
ResMed Inc. 44.49 8.1% 51.1% 48.47 28.94 6,384 301 958 5,727 1,437 420 340 Dec-12 Jun-12 1,520 454 373 4.0x 13.6x 3.8x 12.6x
Rotech Healthcare Inc. 0.21 (28.3%) (86.6%) 1.80 0.18 5 525 19 511 466 75 9 Sep-12 Dec-11 NA NA NA 1.1x 6.8x NA NA
Number of Companies 5 Median: 5.1% (6.9%) Total $8,876 $1,835 $5,119 $4,702 1.1x 7.6x 1.0x 7.3x
Mean: 1.7% (12.7%) $1,835 1.5x 8.9x 1.6x 9.0x
Life Sciences Tools
Agilent Technologies Inc. $41.48 9.2% (4.9%) $46.28 $35.32 $14,392 $2,361 $2,450 $14,306 $6,903 $1,398 $1,080 Jan-13 Oct-12 $7,030 $1,543 $1,298 2.1x 10.2x 2.0x 9.3x
Becton, Dickinson and Company 88.06 13.5% 14.0% 89.16 71.56 17,080 4,170 1,917 18,737 7,777 2,125 1,618 Dec-12 Sep-12 8,011 2,151 1,605 2.4x 8.8x 2.3x 8.7x
Life Technologies Corporation 58.16 18.5% 21.2% 65.84 39.73 9,910 2,414 256 12,063 3,799 1,199 800 Dec-12 Dec-12 3,927 1,395 1,153 3.2x 10.1x 3.1x 8.6x
Number of Companies 3 Median: 13.5% 14.0% Total $41,382 $15,035 $18,478 $18,969 2.4x 10.1x 2.3x 8.7x
Mean: 13.7% 10.1% $15,035 2.6x 9.7x 2.5x 8.9x
Medical Devices and Products
Abbott Laboratories $33.79 (47.7%) (40.8%) $72.47 $31.64 $53,073 $20,476 $10,802 $58,467 $39,874 $11,595 $8,812 Dec-12 Dec-12 $22,749 $5,478 $3,754 1.5x 5.0x 2.6x 10.7x
ArthroCare Corporation 34.92 6.5% 33.1% 36.99 24.13 979 0 219 841 368 95 74 Dec-12 Dec-12 380 94 71 2.3x 8.9x 2.2x 9.0x
Baxter International Inc. 67.60 2.4% 16.1% 69.34 48.98 36,905 5,930 3,270 39,605 14,190 3,958 3,246 Dec-12 Dec-12 15,534 4,214 3,457 2.8x 10.0x 2.5x 9.4x
Boston Scientific Corporation 7.39 29.9% 16.2% 7.73 4.79 10,031 4,256 207 14,080 7,249 1,638 955 Dec-12 Dec-12 7,203 1,658 904 1.9x 8.6x 2.0x 8.5x
CR Bard Inc. 98.85 1.3% 5.0% 108.31 91.91 8,085 1,410 896 8,599 2,958 943 814 Dec-12 Dec-12 3,065 896 761 2.9x 9.1x 2.8x 9.6x
Danaher Corp. 61.60 16.7% 15.4% 62.14 49.18 42,519 5,343 1,679 46,251 18,260 4,058 3,218 Dec-12 Dec-12 19,103 4,203 3,350 2.5x 11.2x 2.4x 11.0x
Hanger, Inc. 29.66 17.9% 43.2% 31.95 20.04 1,008 509 0 1,461 986 166 131 Dec-12 Dec-12 1,070 185 146 1.5x 8.8x 1.4x 7.9x
Hologic Inc. 21.82 15.0% 1.5% 23.96 16.18 5,841 5,036 718 10,159 2,161 720 323 Dec-12 Sep-12 2,625 1,043 833 4.7x 14.1x 3.9x 9.7x
Hospira Inc. 29.43 (0.7%) (19.2%) 38.49 28.62 4,868 1,736 772 5,831 4,092 383 155 Dec-12 Dec-12 4,116 659 487 1.4x 14.0x 1.4x 8.9x
Johnson & Johnson 76.11 9.8% 16.8% 77.02 61.71 212,752 16,165 14,911 207,828 67,224 21,098 17,432 Dec-12 Dec-12 71,302 22,803 18,899 3.1x 9.9x 2.9x 9.1x
Medtronic, Inc. 44.96 5.6% 16.5% 47.41 35.67 45,471 11,418 1,298 54,425 16,427 5,632 4,822 Jan-13 Apr-12 16,527 6,015 5,191 3.3x 9.7x 3.3x 9.0x
Stryker Corporation 63.88 17.0% 17.1% 64.46 49.43 24,307 1,762 1,395 21,784 8,657 2,161 1,884 Dec-12 Dec-12 8,995 2,663 2,168 2.5x 10.1x 2.4x 8.2x
Thermo Fisher Scientific, Inc. 73.80 17.6% 28.9% 75.79 48.14 26,393 7,124 851 32,662 12,510 2,616 1,633 Dec-12 Dec-12 12,970 2,820 2,519 2.6x 12.5x 2.5x 11.6x
Zimmer Holdings, Inc. 74.96 13.4% 22.0% 76.75 57.46 12,695 1,821 884 12,965 4,472 1,677 1,319 Dec-12 Dec-12 4,615 1,761 1,392 2.9x 7.7x 2.8x 7.4x
Number of Companies 14 Median: 11.6% 16.3% Total $484,927 $36,783 $199,428 $190,254 2.6x 9.8x 2.5x 9.1x
Mean: 7.5% 12.3% $36,783 2.6x 10.0x 2.5x 9.3x
Medical / Surgical / Dental Supplies
AmerisourceBergen Corporation $47.20 14.6% 25.2% $47.51 $35.48 $10,864 $1,396 $417 $11,843 $80,644 $1,429 $1,276 Dec-12 Sep-12 $85,119 $1,449 $1,281 0.1x 8.3x 0.1x 8.2x
Cardinal Health, Inc. 46.21 15.9% 9.8% 46.87 36.91 15,751 2,897 2,255 16,393 104,803 2,290 1,945 Dec-12 Jun-12 100,429 2,297 1,977 0.2x 7.2x 0.2x 7.1x
Henry Schein, Inc. 89.22 11.4% 18.8% 91.11 71.72 7,813 533 122 8,662 8,940 759 634 Dec-12 Dec-12 9,486 796 675 1.0x 11.3x 0.9x 10.9x
McKesson Corporation 106.13 14.2% 28.7% 107.03 81.53 24,717 4,479 2,726 26,470 123,534 2,846 2,275 Dec-12 Mar-12 123,701 3,131 2,656 0.2x 9.3x 0.2x 8.5x
Owens & Minor Inc. 30.45 6.9% 0.0% 32.26 26.97 1,927 215 98 2,046 8,908 247 208 Dec-12 Dec-12 9,195 266 213 0.2x 8.3x 0.2x 7.7x
Patterson Companies, Inc. 36.34 7.9% 12.6% 37.66 30.45 3,948 775 472 4,250 3,609 398 353 Jan-13 Apr-12 3,642 400 356 1.2x 10.7x 1.2x 10.6x
Number of Companies 6 Median: 12.8% 15.7% Total $65,020 $11,611 $330,438 $331,573 0.2x 8.8x 0.2x 8.3x
Mean: 11.8% 15.9% $11,611 0.5x 9.2x 0.5x 8.8x
Forward EstimateCompany Name
Equity
Mkt. ValueTotal Debt
TEV/ LTM Multiples TEV/ Fwd MultiplesCash and
Equiv.
Total
Ent.
Value
(TEV)
Lastest Twelve Months
(LTM)LTM
Period
Lastest
FYE Date

Healthcare & Life Sciences Trading Statistics
March 2013
As of February 28, 2013 11
Provider-Based Services Stock Price
% Change 52 Week
2/28/2013 3 mos. 12 mos. High Low Revenue EBITDA EBIT Revenue EBITDA EBIT Revenue EBITDA Revenue EBITDA
Acute-Care Hospitals
Community Health Systems, Inc. $42.26 46.1% 65.7% $42.98 $20.71 $3,812 $9,723 $388 $13,580 $13,029 $1,845 $1,220 Dec-12 Dec-12 $13,587 $2,013 $1,220 1.0x 7.2x 1.0x 6.7x
Health Management Associates Inc. 10.99 38.8% 48.7% 11.15 5.92 2,827 3,652 59 6,316 5,878 972 614 Dec-12 Dec-12 7,105 980 619 1.1x 6.5x 0.9x 6.4x
HCA Holdings, Inc. 37.09 20.8% 37.7% 39.60 22.95 16,453 29,359 705 46,371 33,013 6,492 4,813 Dec-12 Dec-12 37,608 6,391 4,690 1.4x 7.1x 1.2x 7.3x
Lifepoint Hospitals Inc. 44.09 24.3% 12.4% 46.25 34.32 2,070 1,726 85 3,763 3,392 537 324 Dec-12 Dec-12 4,326 555 328 1.1x 7.0x 0.9x 6.8x
Tenet Healthcare Corp. 39.31 38.5% 72.1% 40.94 17.24 4,099 5,252 364 9,078 9,119 1,200 770 Dec-12 Dec-12 10,548 1,343 887 1.0x 7.6x 0.9x 6.8x
Universal Health Services Inc. 57.89 33.0% 29.3% 58.57 36.90 5,657 3,771 23 9,692 6,961 1,286 977 Dec-12 Dec-12 7,922 1,228 931 1.4x 7.5x 1.2x 7.9x
Number of Companies 6 Median: 35.8% 43.2% Total $34,919 $14,800 $71,392 $81,097 1.1x 7.2x 0.9x 6.8x
Mean: 33.6% 44.3% $14,800 1.2x 7.2x 1.0x 7.0x
Assisted Living
Assisted Living Concepts Inc. $11.84 41.3% (28.4%) $20.33 $6.93 $275 $180 $3 $450 $230 $53 $30 Sep-12 Dec-11 $228 $43 ($32) 2.0x 8.4x 2.0x 10.4x
Brookdale Senior Living Inc. 27.68 11.3% 47.3% 29.25 14.99 3,397 2,681 69 6,009 2,445 375 122 Dec-12 Dec-12 2,795 414 153 2.5x 16.2x 2.2x 14.5x
Capital Senior Living Corp. 23.00 33.0% 159.6% 23.38 7.87 630 333 48 915 294 47 15 Sep-12 Dec-11 308 52 15 3.1x 19.8x 3.0x 17.4x
Emeritus Corp. 28.49 31.4% 50.0% 28.78 14.24 1,286 4,019 60 5,254 1,388 252 105 Dec-12 Dec-12 1,865 307 135 3.8x 20.9x 2.8x 17.1x
Five Star Quality Care Inc. 6.34 32.9% 69.5% 6.49 2.98 306 64 25 336 1,224 46 21 Dec-12 Dec-12 1,453 55 30 0.3x 7.3x 0.2x 6.1x
Skilled Healthcare Group, Inc. 5.82 (13.4%) (12.7%) 8.41 4.97 224 449 2 671 873 99 73 Dec-12 Dec-12 888 102 76 0.8x 6.7x 0.8x 6.6x
Number of Companies 6 Median: 32.1% 48.7% Total $6,118 $2,272 $6,453 $7,537 2.2x 12.3x 2.1x 12.5x
Mean: 22.8% 47.6% $2,272 2.1x 13.2x 1.8x 12.0x
Diagnostic Imaging
Alliance Healthcare Services, Inc. $7.04 15.4% (2.9%) $7.43 $6.62 $72 $631 $79 $673 $478 $153 $48 Sep-12 Dec-11 $474 $143 NA 1.4x 4.3x 1.4x 4.7x
RadNet, Inc. 2.83 23.6% (3.7%) 3.64 2.13 109 552 0 661 681 113 54 Sep-12 Dec-11 654 117 51 1.0x 5.6x 1.0x 5.7x
Varian Medical Systems Inc. 70.63 2.2% 6.4% 75.78 52.90 7,707 206 755 7,106 2,860 674 610 Dec-12 Sep-12 3,044 703 637 2.5x 10.5x 2.3x 10.1x
Number of Companies 3 Median: 15.4% (2.9%) Total $7,888 $2,813 $4,019 $4,172 1.4x 5.6x 1.4x 5.7x
Mean: 13.7% (0.1%) $2,813 1.6x 6.8x 1.6x 6.8x
Dialysis Services
DaVita HealthCare Partners Inc. $119.62 10.4% 37.9% $120.10 $77.81 $12,620 $8,573 $534 $21,379 $8,186 $1,741 $1,397 Dec-12 Dec-12 $11,300 $2,374 $1,854 2.6x 12.2x 1.9x 9.0x
Fresenius Medical Care AG & Co. KGAA 69.13 1.5% (3.8%) 78.82 62.78 21,157 8,305 688 29,477 13,800 2,768 2,165 Dec-12 Dec-12 14,716 3,085 2,431 2.2x 10.7x 2.0x 9.6x
Number of Companies 2 Median: 5.9% 17.1% Total $33,777 $25,428 $21,987 $26,016 2.4x 11.4x 1.9x 9.3x
Mean: 5.9% 17.1% $25,428 2.4x 11.4x 1.9x 9.3x
Home Care / Hospice
Addus HomeCare Corporation $8.81 32.3% 143.4% $10.00 $3.50 $95 $22 $2 $116 $278 $13 $10 Sep-12 Dec-11 $281 $14 $12 0.4x 9.0x 0.4x 8.2x
Almost Family Inc. 20.59 6.7% (12.5%) 26.87 17.87 193 1 26 168 349 31 29 Dec-12 Dec-12 350 29 26 0.5x 5.4x 0.5x 5.7x
Amedisys Inc. 11.30 10.6% (9.2%) 15.95 9.51 350 122 39 450 1,497 105 65 Sep-12 Dec-11 1,498 96 55 0.3x 4.2x 0.3x 4.7x
Gentiva Health Services Inc. 10.52 4.7% 26.6% 12.85 5.13 324 935 207 1,052 1,713 175 148 Dec-12 Dec-12 1,725 175 152 0.6x 6.1x 0.6x 6.0x
LHC Group, Inc. 20.32 9.7% 16.8% 22.42 15.69 358 25 0 397 633 64 57 Sep-12 Dec-11 637 61 54 0.6x 6.2x 0.6x 6.5x
Chemed Corp. 77.19 13.9% 23.7% 80.68 54.06 1,479 175 70 1,584 1,430 181 158 Dec-12 Dec-12 1,486 205 167 1.1x 8.8x 1.1x 7.7x
Number of Companies 6 Median: 10.1% 20.2% Total $337 $628 $1,032 $1,061 0.5x 6.1x 0.5x 6.2x
Mean: 13.0% 31.5% $628 0.6x 6.6x 0.6x 6.5x
Long-Term Care
The Ensign Group, Inc. $31.32 22.9% 9.7% $33.43 $23.40 $681 $211 $41 $847 $825 $122 $93 Dec-12 Dec-12 $916 $145 $114 1.0x 7.0x 0.9x 5.8x
Kindred Healthcare Inc. 11.27 2.5% 5.5% 12.76 7.60 600 1,660 50 2,161 6,181 434 233 Dec-12 Dec-12 5,871 407 215 0.3x 5.2x 0.4x 5.3x
National Healthcare Corp. 46.37 2.6% (1.3%) 50.17 40.75 656 10 67 662 742 96 66 Dec-12 Dec-12 803 NA NA 0.9x 6.0x 0.8x NA
Number of Companies 3 Median: 2.6% 5.5% Total $1,938 $1,224 $7,748 $7,589 0.9x 6.0x 0.8x 5.6x
Mean: 9.3% 4.6% $1,224 0.8x 6.0x 0.7x 5.6x
TEV/ Fwd MultiplesCompany Name
Equity
Mkt. ValueTotal Debt
Cash and
Equiv.
Total
Ent.
Value
(TEV)
Lastest Twelve Months
(LTM)LTM
Period
Lastest
FYE Date
Forward Estimate TEV/ LTM Multiples
Healthcare & Life Sciences Trading Statistics
March 2013
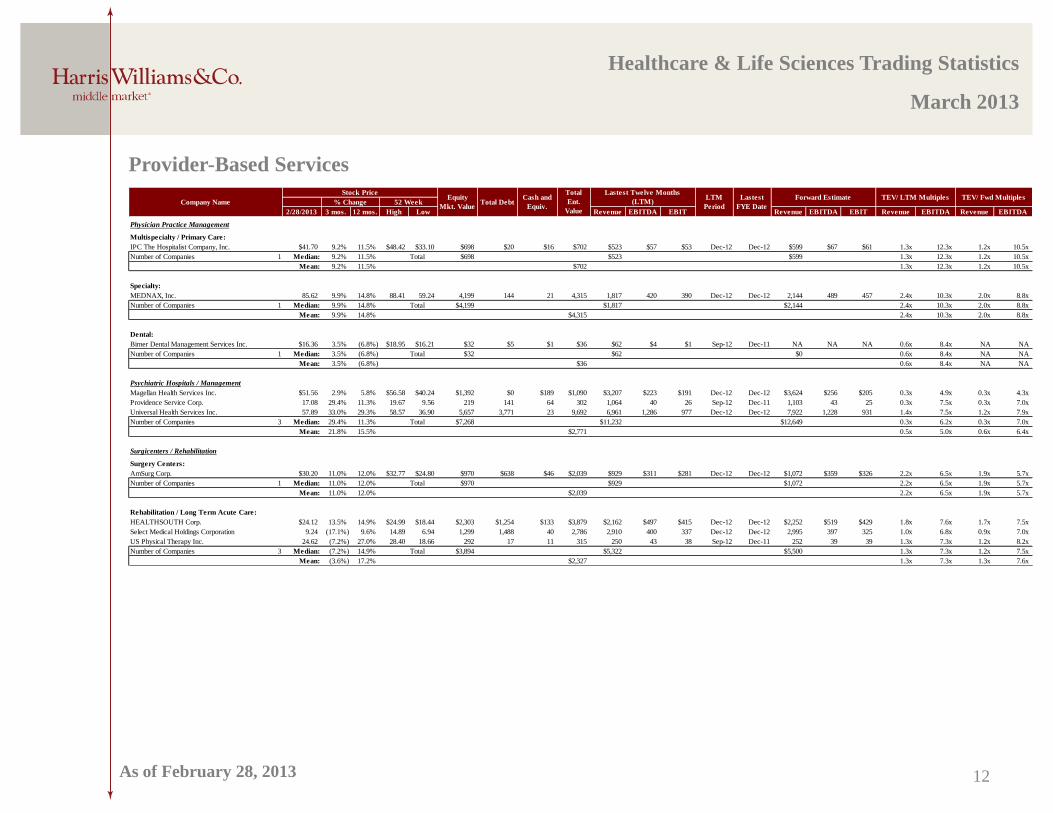
As of February 28, 2013 12
Provider-Based Services Stock Price
% Change 52 Week
2/28/2013 3 mos. 12 mos. High Low Revenue EBITDA EBIT Revenue EBITDA EBIT Revenue EBITDA Revenue EBITDA
Physician Practice Management
Multispecialty / Primary Care:
IPC The Hospitalist Company, Inc. $41.70 9.2% 11.5% $48.42 $33.10 $698 $20 $16 $702 $523 $57 $53 Dec-12 Dec-12 $599 $67 $61 1.3x 12.3x 1.2x 10.5x
Number of Companies 1 Median: 9.2% 11.5% Total $698 $702 $523 $599 1.3x 12.3x 1.2x 10.5x
Mean: 9.2% 11.5% $702 1.3x 12.3x 1.2x 10.5x
Specialty:
MEDNAX, Inc. 85.62 9.9% 14.8% 88.41 59.24 4,199 144 21 4,315 1,817 420 390 Dec-12 Dec-12 2,144 489 457 2.4x 10.3x 2.0x 8.8x
Number of Companies 1 Median: 9.9% 14.8% Total $4,199 $4,315 $1,817 $2,144 2.4x 10.3x 2.0x 8.8x
Mean: 9.9% 14.8% $4,315 2.4x 10.3x 2.0x 8.8x
Dental:
Birner Dental Management Services Inc. $16.36 3.5% (6.8%) $18.95 $16.21 $32 $5 $1 $36 $62 $4 $1 Sep-12 Dec-11 NA NA NA 0.6x 8.4x NA NA
Number of Companies 1 Median: 3.5% (6.8%) Total $32 $36 $62 $0 0.6x 8.4x NA NA
Mean: 3.5% (6.8%) $36 0.6x 8.4x NA NA
Psychiatric Hospitals / Management
Magellan Health Services Inc. $51.56 2.9% 5.8% $56.58 $40.24 $1,392 $0 $189 $1,090 $3,207 $223 $191 Dec-12 Dec-12 $3,624 $256 $205 0.3x 4.9x 0.3x 4.3x
Providence Service Corp. 17.08 29.4% 11.3% 19.67 9.56 219 141 64 302 1,064 40 26 Sep-12 Dec-11 1,103 43 25 0.3x 7.5x 0.3x 7.0x
Universal Health Services Inc. 57.89 33.0% 29.3% 58.57 36.90 5,657 3,771 23 9,692 6,961 1,286 977 Dec-12 Dec-12 7,922 1,228 931 1.4x 7.5x 1.2x 7.9x
Number of Companies 3 Median: 29.4% 11.3% Total $7,268 $2,771 $11,232 $12,649 0.3x 6.2x 0.3x 7.0x
Mean: 21.8% 15.5% $2,771 0.5x 5.0x 0.6x 6.4x
Surgicenters / Rehabilitation
Surgery Centers:
AmSurg Corp. $30.20 11.0% 12.0% $32.77 $24.80 $970 $638 $46 $2,039 $929 $311 $281 Dec-12 Dec-12 $1,072 $359 $326 2.2x 6.5x 1.9x 5.7x
Number of Companies 1 Median: 11.0% 12.0% Total $970 $2,039 $929 $1,072 2.2x 6.5x 1.9x 5.7x
Mean: 11.0% 12.0% $2,039 2.2x 6.5x 1.9x 5.7x
Rehabilitation / Long Term Acute Care:
HEALTHSOUTH Corp. $24.12 13.5% 14.9% $24.99 $18.44 $2,303 $1,254 $133 $3,879 $2,162 $497 $415 Dec-12 Dec-12 $2,252 $519 $429 1.8x 7.6x 1.7x 7.5x
Select Medical Holdings Corporation 9.24 (17.1%) 9.6% 14.89 6.94 1,299 1,488 40 2,786 2,910 400 337 Dec-12 Dec-12 2,995 397 325 1.0x 6.8x 0.9x 7.0x
US Physical Therapy Inc. 24.62 (7.2%) 27.0% 28.40 18.66 292 17 11 315 250 43 38 Sep-12 Dec-11 252 39 39 1.3x 7.3x 1.2x 8.2x
Number of Companies 3 Median: (7.2%) 14.9% Total $3,894 $2,327 $5,322 $5,500 1.3x 7.3x 1.2x 7.5x
Mean: (3.6%) 17.2% $2,327 1.3x 7.3x 1.3x 7.6x
Company NameEquity
Mkt. ValueTotal Debt
Cash and
Equiv.
Total
Ent.
Value
(TEV)
Lastest Twelve Months
(LTM)LTM
Period
Lastest
FYE Date
Forward Estimate TEV/ LTM Multiples TEV/ Fwd Multiples

13
M&A Detail
March 2013
Announced U.S.
Healthcare &
Life Sciences
M&A
Enterprise Enterprise Value / LTM Private Equity
Announced Target Seller Buyer Value ($mm) Sales EBITDA EBIT Involvement
2/28/2013 Nine Clinic Physical Therapy Group - US Physical Therapy Inc.
(NYSE:USPH)
- - - - No
2/28/2013 Audrain Health Care, Inc. - SSM Health Care Corporation - - - - No
2/28/2013 Partners for Medical Education, Inc. - The WeissComm Group Limited - - - - No
2/28/2013 Genmab, Inc., 215,000 Square Foot Antibody
Manufacturing Facility in Brooklyn Park
Genmab, Inc. Baxter Healthcare Corporation $10.0 - - - No
2/27/2013 100Plus Greylock Partners; Band of Angels;
The Founders Fund; Felicis Ventures
Practice Fusion, Inc. - - - - Yes
2/26/2013 Pamlab, L.L.C. - Nestlé Health Science S.A. - - - - No
2/26/2013 CareClarity, Inc. Kramer Healthcare Technologies,
Inc.
Cymetrix Corporation - - - - No
2/25/2013 Assisted Living Concepts Inc. (NYSE:ALC) Bandera Partners LLC; 683 Capital
Management, LLC; Thornridge
Holdings Limited; Newtyn
Management, LLC
TPG Capital, L.P. $453.9 2.0x 8.5x 15.2x Yes
2/25/2013 Provitro Biosciences LLC - Pendrell Corporation
(NasdaqGS:PCO)
- - - - No
2/25/2013 PureWellness, Inc. - Cerner Corporation
(NasdaqGS:CERN)
- - - - No
2/22/2013 Heska Imaging US, LLC - Heska Corporation
(NasdaqCM:HSKA)
$13.9 - - - No
2/22/2013 Freedom Home Healthcare, Inc., Pennsylvania
Operations and Nursing Services in New Jersey
Freedom Home Healthcare, Inc. Epic Health Services, Inc. - - - - No
2/21/2013 Emanuel Medical Center, Inc. The Evangelical Covenant Church,
Investment Arm
Tenet Healthcare Corp. (NYSE:THC) - - - - No
2/20/2013 KRU Medical Ventures, LLC, New Smyrna
Beach Artificial Kidney Center
KRU Medical Ventures, LLC DSI Renal, Inc. - - - - No
2/20/2013 Restorix Health LLLP - The Center For Wound Healing, Inc. - - - - No
2/19/2013 Kova International, Inc. Hycor Biomedical Inc. StoneCreek Capital, Inc.; Laurel
Crown Partners, LLC; One Rock
Capital Partners, LLC
- - - - Yes
2/19/2013 HITS Consulting Group LLC and ClariDIS
Corporation
- iMedicor, Inc. (OTCPK:VMCI) - - - - No
2/19/2013 Family Behavioral Resources, Inc. - South Bay Mental Health Center, Inc. - - - - No
2/19/2013 Liaison Healthcare Informatics - Liaison Technologies, LLC - - - - No
2/19/2013 Hayes Pharmacy Inc., Rights to a
Pharmaceutical/Pharmacy Platform
Hayes Pharmacy Inc. Endexx Corp. (OTCPK:EDXC) - - - - No
2/15/2013 Leonard Street LLC, E. Leonard Medical
Complex
Leonard Street LLC MB Real Estate Healthcare Group $8.4 - - - No
2/14/2013 MediVista Media, LLC, Everwell Waiting Room
Television Network Division
MediVista Media, LLC AccentHealth, LLC - - - - No
2/14/2013 Internal Medicine Consultants, P.A. - IPC The Hospitalist Company, Inc.
(NasdaqGS:IPCM)
- - - - No
2/13/2013 AssuraMed Holding, Inc. Clayton, Dubilier & Rice, Inc.;
Goldman Sachs Group, Merchant
Banking Division; PNC Erieview
Capital
Cardinal Health, Inc. (NYSE:CAH) $2,070.0 - - - Yes
2/13/2013 San Diego Hospice Corporation, Certain Assets - Scripps Health, Inc. $10.7 - - - No
2/12/2013 OA Nurse Travel, LLC On Assignment Inc. (NYSE:ASGN) Medical Solutions L.L.C. $31.0 - - - No
2/8/2013 Ashland Community Hospital City Of Ashland Asante Health Systems, Inc. - - - - No
2/8/2013 Prospector Capital Partners II, LLC, Portfolio
of Nine US Prescription Products
Prospector Capital Partners II, LLC Innovus Pharmaceuticals, Inc.
(OTCPK:INNV)
- - - - Yes
2/7/2013 Two Senior Apartment Communities Calamar Enterprises, Inc. Care Investment Trust Inc.
(OTCPK:CVTR)
- - - - No
2/7/2013 Addus HealthCare, Inc., Home Health Business Addus HealthCare, Inc. LHC Group, Inc. (NasdaqGS:LHCG) - - - - No
2/7/2013 Basin Healthcare Center, LLC - Nueterra Holdings LLC - - - - No
2/7/2013 Advanced Surgery Institute, LLC - Santa Rosa Memorial Hospital Inc - - - - No
2/7/2013 Verdugo Hills Hospital, Inc. - University of Southern California - - - - No
2/6/2013 T&K Inspection Inc. - Desert Industrial X-Ray LP - - - - No
2/6/2013 SureScreen Medical, Inc. Novation Holdings, Inc.
(OTCBB:NOHO)
AVM Licensing Corp. - - - - No
2/6/2013 JAWOOD Business Process Solutions, LLC - Genpact Ltd. (NYSE:G) - - - - No
2/5/2013 TYSABRI Elan Pharma International Ltd. Biogen Idec International Holding Ltd $6,498.0 - - - No
2/5/2013 Hemophilia Compound IB1001 and Related
Assets
Ipsen S.A. (ENXTPA:IPN);
Inspiration Biopharmaceuticals, Inc.
Cangene Corp. (TSX:CNJ) $300.0 - - - No
2/5/2013 Perioperative Nurses Inc. - Alliant, Inc. - - - - No
2/5/2013 Emergency Physicians, PA and Valley
Emergency Physicians Medical Group, Inc.
- Team Health Holdings, Inc.
(NYSE:TMH)
- - - - No
2/5/2013 Biomedical Structures, LLC Ampersand Capital Partners Modified Polymer Components, Inc. - - - - Yes
2/5/2013 Integrative Stem Cell Institute - YaFarm Technologies Inc.
(OTCPK:YFRM)
- - - - No

14
M&A Detail
March 2013
Announced U.S.
Healthcare &
Life Sciences
M&A
(Continued)
Enterprise Enterprise Value / LTM Private Equity
Announced Target Seller Buyer Value ($mm) Sales EBITDA EBIT Involvement
Turner Bredrup Managing Director
+1 (804) 915-0110
Cheairs Porter Managing Director
+1 (804) 915-0130
James Clark Managing Director
+1 (804) 915-0119
Todd Morris Managing Director
+1 (415) 217-3412
Andy Dixon Director
+1 (415) 217-3419
Geoff Smith Director
+1 (804) 915-0195
Whit Knier Vice President
+1 (804) 932-1321
Paul Hepper Vice President
+1 (804) 932-1326
Andy Hewlett Vice President
+1 (415) 217-3427
Contacts
2/4/2013 Horizon Hospice, Inc. - Scripps Health, Inc. - - - - No
2/4/2013 Massive Health, Inc. Charles River Ventures; Greylock
Partners; Mohr Davidow Ventures;
Felicis Ventures; Andreessen
Horowitz; Collaborative Fund
AliphCom, Inc. - - - - No
2/3/2013 Alnylam Pharmaceuticals, Inc., Worldwide
Rights For PCSK-9
Alnylam Pharmaceuticals, Inc.
(NasdaqGS:ALNY)
The Medicines Company
(NasdaqGS:MDCO)
$205.0 - - - No
2/2/2013 ClinForce, LLC and Akos Limited Cross Country Healthcare, Inc.
(NasdaqGS:CCRN)
ICON Public Limited Company
(NasdaqGS:ICLR)
$55.8 - - - No
2/1/2013 Prasco, LLC, Econazole Nitrate Cream 1% Prasco, LLC IGI, Laboratories, Inc. (AMEX:IG) $1.8 - - - No
2/1/2013 Velcera Inc. (OTCPK:VLCR) Essex Woodlands Health Ventures;
Two River Group Holdings, LLC;
HealthCor Partners Management,
L.P.
Perrigo Co. (NasdaqGS:PRGO) $160.0 2.7x - - Yes
2/1/2013 Willamette Valley Treatment Center Inc - CRC Health Group, Inc. - - - - No
2/1/2013 Dmc-Memphis, Inc. - Acadia Healthcare Company, Inc.
(NasdaqGS:ACHC)
- - - - No

15
Sources:
Capital IQ.
Thomson Financial.
S&P.
Reuters.
Bloomberg.
Irving Levin Associates.
Harris Williams & Co. (www.harriswilliams.com) is a preeminent middle market investment bank focused on the
advisory needs of clients worldwide. The firm has deep industry knowledge, global transaction expertise, and an
unwavering commitment to excellence. Harris Williams & Co. provides sell-side and acquisition advisory, restructuring
advisory, board advisory, private placements, and capital markets advisory services.
Investment banking services are provided by Harris Williams LLC, a registered broker-dealer and member of FINRA
and SIPC, and Harris Williams & Co. Ltd, which is authorised and regulated by the Financial Services Authority (FRN
#540892). Harris Williams & Co. is a trade name under which Harris Williams LLC and Harris Williams & Co. Ltd
conduct business.
THIS REPORT MAY CONTAIN REFERENCES TO REGISTERED TRADEMARKS, SERVICE MARKS
AND COPYRIGHTS OWNED BY THIRD-PARTY INFORMATION PROVIDERS. NONE OF THE THIRD-
PARTY INFORMATION PROVIDERS IS ENDORSING THE OFFERING OF, AND SHALL NOT IN ANY
WAY BE DEEMED AN ISSUER OR UNDERWRITER OF, THE SECURITIES, FINANCIAL INSTRUMENTS
OR OTHER INVESTMENTS DISCUSSED IN THIS REPORT, AND SHALL NOT HAVE ANY LIABILITY
OR RESPONSIBILITY FOR ANY STATEMENTS MADE IN THE REPORT OR FOR ANY FINANCIAL
STATEMENTS, FINANCIAL PROJECTIONS OR OTHER FINANCIAL INFORMATION CONTAINED OR
ATTACHED AS AN EXHIBIT TO THE REPORT. FOR MORE INFORMATION ABOUT THE MATERIALS
PROVIDED BY SUCH THIRD PARTIES, PLEASE CONTACT US AT +1 (804) 648-0072.
The information and views contained in this report were prepared by Harris Williams & Co. (“Harris Williams”). It is
not a research report, as such term is defined by applicable law and regulations, and is provided for informational
purposes only. It is not to be construed as an offer to buy or sell or a solicitation of an offer to buy or sell any financial
instruments or to participate in any particular trading strategy. The information contained herein is believed by Harris
Williams to be reliable but Harris Williams makes no representation as to the accuracy or completeness of such
information. Harris Williams and/or its affiliates may be market makers or specialists in, act as advisers or lenders to,
have positions in and effect transactions in securities of companies mentioned herein and also may provide, may have
provided, or may seek to provide investment banking services for those companies. In addition, Harris Williams and/or
its affiliates or their respective officers, directors and employees may hold long or short positions in the securities,
options thereon or other related financial products of companies discussed herein. Opinions, estimates and projections
in this report constitute Harris Williams’ judgment and are subject to change without notice. The financial instruments
discussed in this report may not be suitable for all investors, and investors must make their own investment decisions
using their own independent advisors as they believe necessary and based upon their specific financial situations and
investment objectives. Also, past performance is not necessarily indicative of future results. No part of this material may
be copied or duplicated in any form or by any means, or redistributed, without Harris Williams’ prior written consent.
1001 Haxall Point
9th Floor
Richmond, VA 23219
Phone: +1 (804) 648-0072
Fax: +1 (804) 648-0073
Two International Place
24th Floor
Boston, MA 02110
Phone: +1 (617) 482-7501
Fax: +1 (617) 482-7503
1900 East 9th Street
20th Floor
Cleveland, OH 44114
Phone: +1 (216) 689-2400
Fax: +1 (216) 689-2401
63 Brook Street
London, W1K 4HS
Phone: +44 20 7518 8900
Fax: +44 20 7526 2187
222 South Ninth Street
Suite 3350
Minneapolis, MN 55402
Phone: +1 (612) 359-2700
Fax: +1 (612) 359-2701
1600 Market Street
21st Floor
Philadelphia, PA 19103
Phone: +1 (267) 675-5900
Fax: +1 (267) 675-5901
www.harriswilliams.com
575 Market Street
31st Floor
San Francisco, CA 94105
Phone: +1 (415) 288-4260
Fax: +1 (415) 288-4269
Copyright © 2013 Harris Williams & Co., all rights reserved.