HealthCare Global Enterprises Limited -...
25
HealthCare Global Enterprises Limited November 2017 ©2017, HCGEL – All Rights Reserved
Transcript of HealthCare Global Enterprises Limited -...

HealthCare Global Enterprises Limited
November 2017
©2017, HCGEL – All Rights Reserved

Disclaimer
THIS PRESENTATION AND ITS CONTENTS ARE CONFIDENTIAL AND ARE NOT FOR RELEASE, PUBLICATION OR DISTRIBUTION, IN WHOLE OR IN PART,DIRECTLY OR INDIRECTLY, IN OR INTO OR FROM THE UNITED STATES OF AMERICA, CANADA, AUSTRALIA, JAPAN OR ANY JURISDICTION WHERE SUCHDISTRIBUTION IS UNLAWFUL.
This presentation has been prepared by HealthCare Global Enterprises Limited (the "Company"). These materials are not for publication or distribution,directly or indirectly, in or into the United States (including its territories and possessions, any state of the United States and the District of Columbia). Thesematerials are not an offer of securities for sale into the United States, Canada or Japan. Any securities of the Company have not been and will not be registeredunder the U.S. Securities Act of 1933, as amended, and may not be offered or sold in the United States, except pursuant to an applicable exemption fromregistration. No public offering of any securities of the Company is being made in the United States.
The information contained in this presentation is for information purposes only and does not constitute or form part of an offer or invitation for sale orsubscription of or solicitation or invitation of any offer to buy or subscribe for any securities, nor shall it or any part of it form the basis of or be relied on inconnection with any contract, commitment or investment decision in relation thereto in India, the United States or any other jurisdiction.
No person accepts any liability whatsoever for any loss howsoever arising from the use of this document or of its contents or otherwise arising in connectiontherewith. The information set out herein may be subject to updating, completion, revision, verification and amendment without notice and such informationmay change materially. Financial information contained in this presentation has been derived from the restated consolidated and standalone financialstatements of the Company and have been rounded off to the next integer, except percentages which have been rounded off to one decimal point.
This presentation contains certain "forward looking statements". Forward‐looking statements are based on certain assumptions and expectations of futureevents. Actual future performance, outcomes and results may differ materially from those expressed in forward‐looking statements as a result of a number ofrisks, uncertainties and assumptions. Although the Company believes that such forward‐looking statements are based on reasonable assumptions, it can giveno assurance that such expectations will be met. Neither the Company nor any of its advisors or representatives assumes any responsibility to updateforward-looking statements or to adapt them to future events or developments.
This presentation includes certain industry data and projections that have been obtained from industry publications and surveys. Industry publications andsurveys and forecasts generally state that the information contained therein has been obtained from sources believed to be reliable, but there is no assurancethat the information is accurate or complete. Neither the Company nor any of its advisors or representatives have independently verified any of the data fromthird-party sources or ascertained the underlying economic assumptions relied upon therein. No representation or claim is made that the results orprojections contained in this presentation will actually be achieved. All industry data and projections contained in this presentation are based on data obtainedfrom the sources cited and involve significant elements of subjective judgment and analysis, which may or may not be correct. For the reasons mentionedabove, you should not rely in any way on any of the projections contained in this presentation for any purpose.
This presentation is based on information regarding the Company and the economic, regulatory, market and other conditions as in effect on the date hereof. Itshould be understood that subsequent developments may affect the information contained in this presentation, which neither the Company nor its advisorsor representatives are under an obligation to update, revise or affirm.
© 2017 , ALL RIGHTS RESERVED. WWW.HCGEL .CO M

Table of Contents
© 2017 , ALL RIGHTS RESERVED. WWW.HCGEL .CO M
Overview of HCG
Financial Highlights and
Updates
Appendix

Overview of HCG
Comprehensive cancer diagnosis and
treatment services (through radiation
therapy, medical oncology and surgery)
206 comprehensive cancer centers, 3
freestanding diagnostic centers and one
day care chemotherapy center as of
September 30, 2017
Comprehensive reproductive medicine
services including assisted reproduction,
gynecological endoscopy and fertility
preservation
4 fertility centers in Bengaluru, 1 in Delhi, 1
in Chandigarh and 1 in Mumbai as of
September 30, 2017
Clinical reference laboratory with
specialization in oncology
Undertakes clinical trial management and
R&D services to pharmaceutical and
biotech companies
37 multispecialty hospitals in Ahmedabad,
Bhavnagar and Hubli as at September 30,
2017
Cancer Care
Fertility
Treatment
Clinical
Reference
Laboratory
Multi-specialty
Hospital
Snapshot of the Business
Specialty healthcare provider with a focus
on cancer and fertility
Largest1 provider of cancer care in India
under the “HCG” brand
Leading provider of fertility treatment under
the “Milann”2 brand
Key financials (FY17) : Revenue – INR
7,001mn, EBITDA before exceptional
items3 - INR 1,050mn and Net Profit – INR
222mn4
NABH, ISO 9001, NABL and CAP
accredited5
Future Outlook
6 new comprehensive cancer centers
under development across India
Expansion of Milann fertility centers across
India
Expansion into Africa in partnership with
CDC, UK with acquisition of cancer center
in Kenya
1 In terms of the total number of cancer treatment centers licensed by AERB as of March 31, 2015 (Source: Government of India, Atomic Energy Regulatory Board); 2 Through 50.1% equity interest in BACC Healthcare acquired in 2013 and its wholly owned subsidiary DKR Healthcare; 3 Discontinued operations 4 Post minority Interest 5 NABH accreditation for HCC Bengaluru, HMS Ahmedabad; ISO 9001 certification for pathology laboratory at HMS; NABL and CAP accreditations for Triesta; 6 Includes center in Kenya; 7 Suchiaryu, Hubli hospital managed under Operations and Management contract, not branded as HCG Hospital
4© 2017 , ALL RIGHTS RESERVED. WWW.HCGEL .CO M

Evolution of HCG
¹ In terms of the total number of cancer treatment centers licensed by AERB as of March 31, 2015 (Source: Government of India, Atomic Energy Regulatory Board)
India’s largest provider
of cancer care¹
Milann
ranked #1 nationally
Partnered with
CDC to enter Africa
IPO in March 20161989
2005
2006
2007
2011
2013
Today
1st cancer center in
the HCG network
was set up
Entry into the clinical
laboratory business
through acquisition of
Triesta
Operated 3 cancer
centers; began expansion
of the HCG network
Acquired HCG Medi-Surge
which operated a multi-
speciality hospital in
Ahmedabad
Awarded Oncology Leader
of the Year by Frost &
Sullivan
Entry into fertility business
through the acquisition of 50.1%
in BACC Healthcare Pvt. Ltd.
5© 2017 , ALL RIGHTS RESERVED. WWW.HCGEL .CO M

HCG’s Cancer Care Network
Bengaluru
KochiTiruchi
ChennaiMangalore
Shimoga
Hubli
Gulburga
VishakhapatanamMumbai
Delhi
Kanpur
Ranchi
Jaipur
Ahmedabad
Baroda
Nagpur Cuttak
Kolkata
Bhavnagar
Nashik
Ongole
Vijaywada
Kalinga
Rao Road
Double Road
Koramangala
M S Ramaiah Nagar
Network of Existing and Under
Development Cancer Care centers
Center of Excellence (CoE)1
Comprehensive Cancer center (20)2
Freestanding Diagnostic center (3)2
Day Care Chemotherapy center (1)
Cancer centers Under Development (6)
Regional Penetration
No. of Centers2
Estimated Beds
Karnataka 6 ~522
Gujarat 4 ~304
Maharashtra 4 ~400
North India 3 ~235
HCG Network
1,6591
BEDS
25 LINEAR
ACCELERATORS
14PET-CT
SCANNERS
225+ ONCOLOGISTS
52OPERATION THEATRES
6
1 Includes Multi-specialty beds
2 Existing and planned
1 Includes 2 centers, KR & DR; 2 As on 30th September’ 2017, includes center in Kenya
© 2017 , ALL RIGHTS RESERVED. WWW.HCGEL .CO M

Partnership driven model – select examples
7
Location: Bangalore
Partners
(Business):
M.S. Ramaiah Hospital,
through Gokula Education
Foundation
Educational Institute and
Multi-speciality Hospital
Nature of
Partnership:Revenue Share
Location: Nasik
Partners
(Business):
Dr. Raj Nagarkar
Surgical Oncologist
Nature of
Partnership:Joint Venture
Location: Chennai
Partners
(Business):
Sri Kavery Medical Care Ltd.
Multispeciality Hospital
Nature of
Partnership:Revenue Share
Location: Cuttack
Partners
(Business):
Dr. K.S. Panda, through
Panda Medicals Pvt. Ltd.
Surgical Oncologist
Nature of
Partnership:
Fee for service and rent
paid to our partner
Location: Hubli
Partners
(Business):
NMR Medical Institute Pvt. Ltd.
Freestanding Diagnostics center
Nature of
Partnership:Revenue Share
Location: Ahmedabad
Partners
(Business):
Astha Oncology Private Ltd.
Group of Surgical Oncologists
Nature of
Partnership:Joint Venture
© 2017 , ALL RIGHTS RESERVED. WWW.HCGEL .CO M

Strategy
Planning to establish additional 6 CCCs, which will commence operations in FY2018 / FY2019; 5 new CCCs
already opened as of 30th September’2017
Expanded existing CCCs (Hubli, Cuttack and Ahmedabad) and adding Phase-II in Nashik; Focusing on
Maharashtra and North India regions
Continuously carry out competitive assessment of markets in which we plan to expand
Plan to invest in strengthening the HCG brand, enhancing market presence, brand image and visibility
Intend to strengthen patient support groups comprising cancer survivors to spread awareness and educate
patients
Grow the base of physician partners / collaborators
In the process of establishing 1 new fertility centers in India (as of September 30, 2017)
Planning to set up additional centers; already launched in Delhi, Chandigarh and Mumbai
Invest in building the Milann brand, enhancing market presence and visibility
Intend to strengthen patient support groups and undertake awareness building activities targeting corporates
In the process of significantly upgrading IT infrastructure to enhance quality of care delivered to patients
IT infrastructure is based on a private-cloud computing system and will include a centralised EMR system
seamlessly integrated with RIS/ PACS, biorepository, HIS and ERP
Planning to establish a network of specialty cancer centers in Africa through partnership arrangements and
acquisitions;
Partnered with Commonwealth Development Corporation, UK (CDC) to establish a network of CCCs in Africa
Completed acquisition of Cancer Care Kenya (CCK) in Nairobi
Expand the Reach of
Cancer Care Network in
India
Strengthen HCG Brand
to Reach More Cancer
Patients
Expand Milann Network
of Fertility centers
Across India and Build
Milann Brand
Upgrade and Strengthen
Information Technology
Infrastructure
Expand Cancer Care
Network to Africa
8© 2017 , ALL RIGHTS RESERVED. WWW.HCGEL .CO M
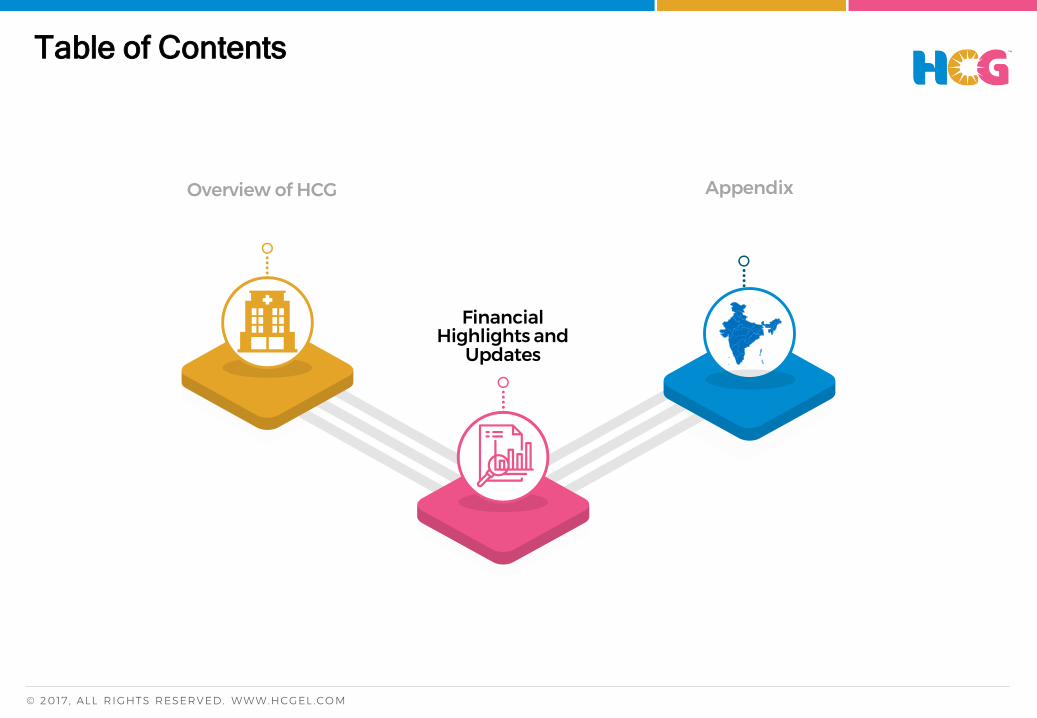
Table of Contents
© 2017 , ALL RIGHTS RESERVED. WWW.HCGEL .CO M
Overview of HCG
Financial Highlights and
Updates
Appendix
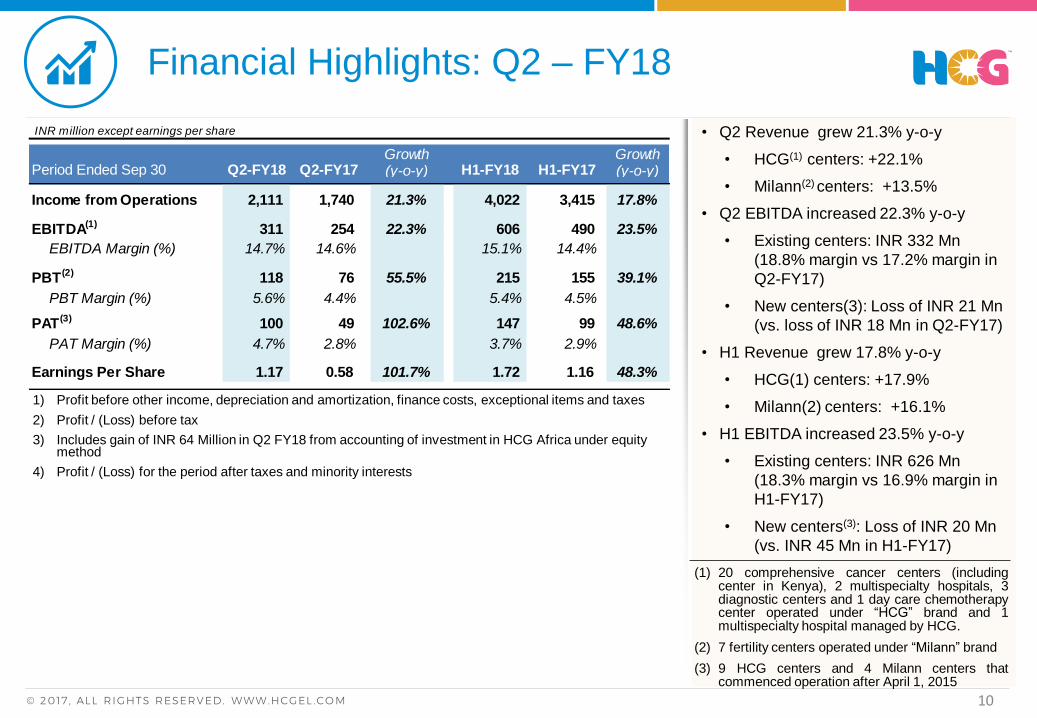
• Q2 Revenue grew 21.3% y-o-y
• HCG(1) centers: +22.1%
• Milann(2) centers: +13.5%
• Q2 EBITDA increased 22.3% y-o-y
• Existing centers: INR 332 Mn
(18.8% margin vs 17.2% margin in
Q2-FY17)
• New centers(3): Loss of INR 21 Mn
(vs. loss of INR 18 Mn in Q2-FY17)
• H1 Revenue grew 17.8% y-o-y
• HCG(1) centers: +17.9%
• Milann(2) centers: +16.1%
• H1 EBITDA increased 23.5% y-o-y
• Existing centers: INR 626 Mn
(18.3% margin vs 16.9% margin in
H1-FY17)
• New centers(3): Loss of INR 20 Mn
(vs. INR 45 Mn in H1-FY17)
Financial Highlights: Q2 – FY18
© 2017 , ALL RIGHTS RESERVED. WWW.HCGEL .CO M
1) Profit before other income, depreciation and amortization, finance costs, exceptional items and taxes
2) Profit / (Loss) before tax
3) Includes gain of INR 64 Million in Q2 FY18 from accounting of investment in HCG Africa under equity method
4) Profit / (Loss) for the period after taxes and minority interests
(1) 20 comprehensive cancer centers (includingcenter in Kenya), 2 multispecialty hospitals, 3diagnostic centers and 1 day care chemotherapycenter operated under “HCG” brand and 1multispecialty hospital managed by HCG.
(2) 7 fertility centers operated under “Milann” brand
(3) 9 HCG centers and 4 Milann centers thatcommenced operation after April 1, 2015
10
INR million except earnings per share
Growth GrowthPeriod Ended Sep 30 Q2-FY18 Q2-FY17 (y-o-y) H1-FY18 H1-FY17 (y-o-y)
Income from Operations 2,111 1,740 21.3% 4,022 3,415 17.8%
EBITDA(1) 311 254 22.3% 606 490 23.5%
EBITDA Margin (%) 14.7% 14.6% 15.1% 14.4%
PBT(2) 118 76 55.5% 215 155 39.1%
PBT Margin (%) 5.6% 4.4% 5.4% 4.5%
PAT(3) 100 49 102.6% 147 99 48.6%
PAT Margin (%) 4.7% 2.8% 3.7% 2.9%
Earnings Per Share 1.17 0.58 101.7% 1.72 1.16 48.3%

Revenue Mix: Q2 – FY18
© 2017 , ALL RIGHTS RESERVED. WWW.HCGEL .CO M
(1) 20 comprehensive cancer centers (including center in Kenya), 2 multispecialtyhospitals, 3 diagnostic centers and 1 day care chemotherapy center operated under“HCG” brand and 1 multispecialty hospital managed by HCG, as at Sept 30 2017
(2) 7 fertility centers operated under “Milann” brand
Karnataka
44%Gujarat
29%
Maharashtra
8%
East India
8%
A.P.
6%
Tamil Nadu
3%
North India
2%
Revenue:
INR 2,111 MnHCG Centers:
INR 1,942 Mn
(1)
(2)Fertility
centers
8%
HCG
centers
92%(91%) 1
(9%) 1
(44%)1(29%) 1
(8%) 1(6%) 1
(3%) 1
(5%) 1
(5%) 1
1(Q2-FY17)
11

• Continuing strong growth at several
existing centers in Q2-FY18
• Hubli: +32% y-o-y
• Cuttack: +21% y-o-y
• KR-DR +20% y-o-y
• Maharashtra scaling up on account of
growth across existing center in Nashik
and new centers in Nagpur and
Mumbai
• Delhi center successfully restructured.
Tiruchi center in process of being
restructured
• New centers contributed Revenues of
INR 314 Mn in Q2-FY18
• Revenue from existing HCG centers,
excluding centers being restructured,
grew 18% in Q2-FY18 on y-o-y basis
HCG Centers: Q2 – FY18 Revenues
© 2017 , ALL RIGHTS RESERVED. WWW.HCGEL .CO M 12
INR million
Growth GrowthPeriod Ended Sep 30 Q2-FY18 Q2-FY17 (y-o-y) H1-FY18 H1-FY17 (y-o-y)
Karnataka 853 701 21.6% 1,587 1,449 9.5%
Gujarat 567 463 22.6% 1,093 868 26.0%
Maharashtra 153 54 183.2% 276 107 158.5%
East India 147 124 18.5% 290 248 17.2%
Andhra Pradesh 115 95 21.9% 238 160 48.9%
Tamil Nadu 68 77 -11.3% 134 146 -8.1%
North India 38 77 -51.2% 69 151 -54.1%
1,942 1,591 22.0% 3,687 3,127 17.9%

• Borivali and Kenya cancer centers and Hubli
multispecialty operationalised in Q2-FY18
• 19.3% increase in occupied bed days on account of
new centers, offset partly by reduction in ALOS
• 5.9% increase in ARPOB, driven by focus on quality
of business across the network, offset by lower
ARPOB at new centers
• Continuing reduction in ALOS to 2.49 on account of
trend towards day care procedures and changing
patient profile
• EBITDA margins maintained inspite of new centers
operationalising and scaling-up. Existing centers
EBITDA margin improved by 160bps to 23.7%
HCG Centers: Q2 - FY18 Operating Metrics
Notes:
(1) No. of Centers includes Cancer and Multispecialty hospitals operated under HCG brand and managed by HCG
(2) Number of beds in operation as at the last day of the period
(3) Occupied Bed Days calculated based on mid-day census
(4) Average Occupancy Rate (“AOR”) calculated as Occupied Bed Days divided by available bed days in the period
(5) Average Revenue per Occupied Bed (“ARPOB”) calculated as Revenue (gross for the hospital) divided by Occupied Bed Days
(6) Average Length of Stay (“ALOS”) calculated as Occupied Bed Days divided by number of admissions (including day care admissions)
(7) EBITDA margin before corporate expenses
No. of Centers Beds Occupied Bed Days
Avg. Occupancy Rate ALOS ARPOB (INR / Day)
Revenue (INR mn) EBITDA Margin
Q2-FY18:
23
Q2-FY17:
19
Q2-FY18:
1,659
Q2-FY17:
1,263
Q2-FY18:
65,690Q2-FY17:
55,072
Q2-FY18:
45.8%Q2-FY17:
47.4%
Q2-FY18:
2.49Q2-FY17:
2.78
Q2-FY18:
30,598Q2-FY17:
28,889
+19.3%
+5.9%
Q2-FY18:
1,942Q2-FY17:
1,591
+22.1%
Q2-FY18:
18.9%Q2-FY17:
19.1%
-20 bps
-160 bps
13© 2017 , ALL RIGHTS RESERVED. WWW.HCGEL .CO M

HCG Centers: Q2 - FY18 Regional Highlights
© 2017 , ALL RIGHTS RESERVED. WWW.HCGEL .CO M
Karnataka
7 632 48.3% 33.8K 853 24.4%
+21.6%5.6%
Centers Beds AOR ARPOB(INR/Day)
Revenue (INR Mn)
EBITDA (%)
Gujarat
4 304 61.5 % 32.9K 567 12.5%
+22.6%
East India
2 165 62.9% 15.4K 147 25.4%
+18.5%+16.9%
New centersExisting centers
+8.4%
+20.5%(1)
+13.1%(1)
+1.4%(1)
Notes:(1) Increase / (Decrease) in Occupied Bed Days(2) Growth numbers are year-on-year basis(3) EBITDA before corporate expenses
COE EBITDA margin at 28% with ARPOB of INR 47k (15% growth y-o-y)
Increasing presence within the region Continuing drive towards improving quality
of business – patient and service mix
Baroda center achieved break-even and Bhavnagar center ramping-up well
EBITDA margin of existing centers at 15.7% for Q2 – FY18
Improved procedure mix and efficiencies in operations leading to optimal occupancy
Strong growth across the region
14
Maharashtra
3 261 42.0% 20.5K 153 9.7% Nagpur center operationalised and
commenced Borivali center Existing Nashik center EBITDA margins at
38% with strong growth+183.2%N.A.N.A.

Milann: Expansion on Track
© 2017 , ALL RIGHTS RESERVED. WWW.HCGEL .CO M
Delhi
Chandigarh
Existing centers(1)
New centers
M S Ramaiah
Bangalore (4 centers)
Indiranagar
JP Nagar
Shivananda
Ahmedabad
(1) Centers in operation prior to April 1, 2015, i.e. Shivananda, JP Nagar, and Indiranagar.
Milann – Ranked #1 nationally for the second consecutive year by the Times of India “All India Fertility & IVF Ranking Survey 2017”
Focus on Southern region with growing presence in North and West
Planned centers
Mumbai
15
H1-FY18 H1-FY17 Growth- - - - - -
New Registrations 2,432 2,231 9.0%
IVF Cycles 1,070 903 18.5%
Revenue (INR Mn) 335 288 16.1%- - -

Capital Expenditure and Net Debt
© 2017 , ALL RIGHTS RESERVED. WWW.HCGEL .CO M
Capital Expenditure Net Debt
1. Net of Bank balance held as margin money of INR 306 mn as at 30-Sep-17 , INR 147 mn as at 30-Jun-17 and INR 145 mn as at 31-Mar-17
2. Includes investment in mutual funds of INR 40 mn as at 30-Sep-17,INR 39 mn as at 30-Jun-17 and INR 113 mn as at 31-Mar-17 andinvestment in fixed deposits of INR 487 mn as at 30-Sep-17, 30-Jun-17
1. Includes amount given as Security Deposit for New Centers of INR 10 mn in Q2-FY18, INR 21 mn in Q1-FY18, and INR 159 mnin FY17
2. Investment of INR 186 mn in HCG Africa is additional
16
INR Million
Q2-FY18 Q1-FY18 FY17
HCG Centres
Existing Centres 72 126 260
Expansions 30 62 381 New Centres 504 520 1,336
606 708 1,976
Milann Centres
Existing Centres 3 5 21
New Centres 20 11 98
23 16 119
Total Capex 629 724 2,095
INR Million
30-Sep-17 30-Jun-17 31-Mar-17
Net Debt
Bank Debt(1)
2,422 1,911 1,320
Vendor Finance 1,993 1,961 1,834
Capital Leases 481 486 491
Other Debt 54 60 73
Less: Cash and Equivalents(2)
(743) (782) (652)
4,207 3,636 3,066
Debt in New Centres
Bank Debt 1,812 1,306 885
Vendor Finance 1,277 1,212 1,123
Other Debt 6 11 13
3,095 2,529 2,021
Net Debt (Excl. New Centres) 1,111 1,107 1,045

Project Update
© 2017 , ALL RIGHTS RESERVED. WWW.HCGEL .CO M
Location Bed
Capacity Project Cost
(INR mn)
Start Date
Kanpur, U.P. 90 839 Q4-FY17
Nagpur, Maharashtra 125 465 Q1-FY18
Borivali, Maharashtra 105 643 Q2-FY18
Nashik, Maharashtra 92 623 Q3-FY18E
Jaipur, Rajasthan 50 410 Q3-FY18E
Kolkata, West Bengal 50 370 Q3-FY18E
South Mumbai, Maharashtra
32 410 Q4-FY18E
1 new HCG center operational during Q2-FY18Additional 4 new HCG centers in FY18
Location Start Date
Delhi Q1-FY17
Chandigarh Q3-FY17
Mumbai Q4-FY17
Ahmedabad Q3-FY18E
3 new Milann centers launched during FY2017 1 new Milann center planned for launch by Q3-FY18
17

Table of Contents
© 2017 , ALL RIGHTS RESERVED. WWW.HCGEL .CO M
Overview of HCG
Financial Highlights and
Updates
Appendix

Appendix A : Investment Thesis
Industry trends
and backdrop
Largest provider of
cancer care in India with
a proven track record
High quality care provided
at a competitive price
Strong management
team with successful
track-record
© 2017 , ALL RIGHTS RESERVED. WWW.HCGEL .CO M

Industry Trends and BackdropCancer Incidences in India to Increase
¹ Call for Action: Expanding cancer care in India dated July 2015, published by Ernst & Young; 2 ASR-W is a weighted mean of the age-specific incidence rates . The weights are taken from the population distribution of the ‘World
Standard Population‘ defined by WHO, and the estimated incidence rate is expressed per 100,000 population for comparisons between different geographies, as age is a key determinant of cancer incidence; 3 Age Group 40-69 years; 4
Breast screening mammograms once in 24 months
Demographic Changes
Cancer incidence increases with age - India’s
population >50+ years to increase from 228m
(2015) to 262mn (2020)
Demographic factors alone are expected to result in
an increase in cancer incidences of 100,000 to
350,000 cases a year
Exposure to Risk Factor
Tobacco use, alcohol consumption, use of
processed food and air pollution
These factors are expected to result in an increase
in cancer incidences of 350,000 to 450,000 cases a
year
Narrowing Diagnosis Gap
Growing awareness and greater public emphasis
on screening and improvements
Expected to result in increased reported cancer
rates
Key Drivers of Cancer Incidence
0.9 1.11.6-2.2
3.4
1.7
Africa India(Reported)
India (Real) China US
Incidence of Cancer Across Countries¹
Estimated
incidence of
cancer in 2015
(mns)
94150-
200174 318123
ASR-W2
(per ’00,000)
Under Diagnosis of Cancer in India¹
62% 71%
31%
81% 70%
30%
72% 91%
19%43%
10% 8%
Breast Cancer Cervical Cancer Head and Neck CancerUSA UK China India
Cancer Diagnosis at Early Stages (Stage I or Stage II)
Cancer prevalence in India estimated to be 3.9mn in 2015
Estimated 1.1mn new cancer cases reported in 2015
Real incidence could be 1.5x to 2.0x times higher than
reported incidence
Difference between reported and real cancer incidence
due to under-diagnosis
Reported incidence of cancer in India based on data from
the cancer registries, which cover < 10% of the population
Late stage disease presentation due to lack of awareness
and participation in screening programs
For example, women³ participation in breast screening
mammograms4: USA (65%), China (30%) and India (<1%)
© 2017 , ALL RIGHTS RESERVED. WWW.HCGEL .CO M 20

Industry Trends and BackdropDemand Supply Gap and Treatment Landscape
Demand for CCCs Demand for LINACs Chemotherapy Cycles (millions)
Outlook for Treatment Landscape¹
200-250
450-550
2014 2020
342750-900
~2,000
2015 2020 2020
1.4-2.0
2.3-3.5
2015 2020(in the absence of
affordability and availability constraints)
¹ Call for Action: Expanding cancer care in India dated July 2015, published by Ernst & Young
77 110 137 200
1,238
Africa India China UK US
0.05 0.10 0.31 0.92 6.20
Per mn Incidence Per mn Population
Existing Demand Supply Gap in Diagnostics…
Lack of adequate infrastructure and absence of mass screening programs are key barriers to timely diagnosis
For example, as of 2014, only 30% of cancer centers in India had advanced imaging technologies like PET-CT
…and Treatment
A key requirement for successful radiation therapy is availability of Linear Accelerators (LINACs)
Region /Country
Number of LINACs(2015)
LINACs per Million
Population
Cancer Prevalence per
LINAC
Cancer Incidence per
LINAC
US 3,818 11.9 1,572 419
UK 323 5.0 3,096 929
China 986 0.7 6,288 3,144
India 342 0.3 7,310 3,216
Availability of LINACs¹
© 2017 , ALL RIGHTS RESERVED. WWW.HCGEL .CO M 21

Largest Provider of Cancer Care in India with a
Proven Track Record¹
HCG’s market leading position, successful track record and strong reputation in
India provides a significant advantage over its competitors
1 As per AERB as of March 31, 2015. (Source: Government of India, Atomic Energy Regulatory Board)
2 Expected to commence operation during FY2018 and FY2019
153
12 15
3
7
2006 Additions 31-Mar-16 2017/18/19
…With a Strong Track Record
Growth in No. of Comprehensive Cancer Care
Centers… Under
Development²
Largest Cancer Care Provider…
Largest provider of cancer care in India in terms of number of cancer
treatment centers listed by AERB as of 31-Mar-20151
HCG network spans 15 cities and towns across eight states in India
Through the extensive network, HCG is able to provide cancer care
beyond just the metropolitan cities
As of 30-Jun-2017, HCG had 599 specialist physicians including 190
oncologists, 37 radiologists and 29 pathologists and 343 other
specialist physicians
HCG believes, it has a strong reputation within the medical
community, driven by
Use of advanced technologies
Successful clinical outcomes
Extensive clinical experience of specialist physicians
© 2017 , ALL RIGHTS RESERVED. WWW.HCGEL .CO M 22

High Quality Care Provided at a Competitive Price
Ability to provide high quality care driven by a multidisciplinary and technology focused approach
…At a Competitive Price
India US¹
Cost of Cancer Treatment in India is lower (INR `000)
India US¹ India US¹
Chemotherapy Surgery Radiation Therapy
Source: Call for Action: Expanding cancer care in India dated July 2015, published by Ernst & Young
1 PPP adjusted 510-720; 2 PPP adjusted 600-720; 3 PPP adjusted 420-540; 4 Vijay Govindarajan and Ravi Ramamurti, Harvard Business Review, "Delivering world-class health Care, Affordably”, November 2013
150-24060-100 60-100
1,100 –
1,4001,500 –
1,800
1,300 –
1,800
Drivers of HCG’s Cost Competitiveness
Economies of scale arising out of expansive network
Optimal utilization of equipment
Centralized drug and consumables formulary
Large network gives competitive advantage in terms of
favourable economic terms of purchase and financing of
medical equipment
Approach to Providing High Quality Care…
Multidisciplinary approach to cancer care - specialist physicians from
various disciplines collaborate to provide the best course of treatment
Focus on identifying and adopting appropriate technology
Among first cancer care providers in India to standardise
molecular diagnostics technologies
First healthcare provider in India to perform computer assisted
tumor navigation surgery
Standardized clinical protocols for diagnosis and treatment
…Results in Successful Clinical
Outcomes…
Ability to manage the large volume of patients
across the network while maintaining quality
of clinical outcomes
For example, the five year survival rate for
breast cancer patients at HCG’s network is
comparable to U.S. benchmarks4
© 2017 , ALL RIGHTS RESERVED. WWW.HCGEL .CO M 23

Govindarajan et. al. .Harvard Business Review, November 2012,
“Delivering World Class Health Care Affordably, Innovative
hospitals in India are pointing the way”G
Survival Rate Cost
Coverage by Harvard
Comparable outcomes at fraction of costUnique and Successful Business Model
© 2017 , ALL RIGHTS RESERVED. WWW.HCGEL .CO M 24

© 2017 HealthCare Global Enterprises Limited., All Rights Reserved.
HCG Logo is trademarks of HealthCare Global Enterprises Limited
In addition to Company data, data from market research agencies, Stock Exchanges and industry publications has been used for this presentation.
This material was used during an oral presentation; it is not a complete record of the discussion. This work may not be used, sold, transferred,
adapted, abridged, copied or reproduced in whole on or in part in any manner or form or in any media without the prior written consent. All product
names and company names and logos mentioned herein are the trademarks or registered trademarks of their respective owners.
For updates and specific queries, please visit www.hcgel.com
or feel free to contact [email protected]
© 2017 , ALL RIGHTS RESERVED. WWW.HCGEL .CO M