Health Status Index Series Volume XV Number II
169
Health Status Index Series Volume XV Number II CIty of Chicago Department of Public Health Office of Epidemiology community area health inventory part one: demographic and health profiles
Transcript of Health Status Index Series Volume XV Number II
Health Status Index Series Volume XV Number II
CIty of ChicagoDepartment of Public Health
Office of Epidemiology
community area health inventorypart one: demographic and health profiles
Community Area Health Inventory Part One: Demographic and Health ProfilesKirsti Bocskay, Ph.D., M.P.H.Sandra Thomas, M.D., M.S.Kevin Gibbs, M.U.P.P.Dana Harper, B.S.Margarita Reina, M.P.H.
Copyright InformationAll material appearing in this report is in the public domain and may be reproduced or copied without permission; citation as to source, however, is appreciated.
Suggested CitationBocskay K., Thomas S., Gibbs K., Harper D., Reina M. Community Area Health Inventory Part One: Demographic and Health Profiles. Health Status Index Series Vol. XV No. II Chicago, Illinois: Chicago Department of Public Health Office of Epidemiology, 2005.
Terry Mason, M.D., F.A.C.S., Commissioner, Department of Public Health, City of Chicago
CONTENTS
Preface...............................................................i
Data Highlights.........................................................ii
Methods.................................................................1
Definitions of Measures...........................................4
Demographic and Health Profiles............................7
PREFACE
Chicago was divided into 75 com-munity areas based upon social, cultural and geographic factors more than 70 years ago by a research committee at the University of Chi-cago. Two additional community areas have been added since 1960. Although the com-munity areas no longer necessarily represent the boundaries of modern Chicago neighbor-hoods, demographic and health information at the community area level is useful to many community-based organizations, planners, hospitals, universities, and other groups. The first edition of the Community Area Health In-ventory was published in 1993 by the Chicago Department of Public Health (CDPH) Office of Planning, Policy and Resource Development. The report was then expanded into two vol-umes by the Office of Epidemiology in 1994. This year’s edition of the Community Area Health Inventory marks a significant change in organization and content, incor-porating revised racial/ethnic groupings, more meaningful socio-economic indica-tors, a more relevant arrangement of health measures and an expanded range of health indicators, such as Alzheimer’s Disease.
Part One includes:
• Population compostions by age, sex and race/ethnicity, socioeconomic (SES) and health measures, and
10-year trend analyses of these indicators.
• Graphic representations of demo- graphic measures are also presented to provide a quick visual reference of gender, age and racial distributions in each community area.
Part Two, as in previous reports, uses the same health measures in Part One to rank community areas both in tabular and map form. This year’s version introduces graphic representations for each health measure giv-ing the user a quicker understanding of each community areas’ rate/percent compared to other areas and Chicago overall. A summary rank index is also given for each community area based on rank in all health indices.
The Community Area Health Inven-tory summarizes data from many sources and represents the cumulative effort of the Offices of Epidemiology and HIV/AIDS Surveillance, and the Sexually Transmitted Diseases (STD) Surveillance, Communicable Disease, Im-munization and Lead Programs. We hope that this report and the additions and revisions within will prove helpful in developing effec-tive interventions for improving the health and well-being of Chicagoans. We welcome any questions, comments, or suggestions for improvements. Please contact:
Office of Epidemiology Chicago Department of Public Health DePaul Center, Room 2137 333 South State Street Chicago, Illinois 60604-3972 (312) 747-9810
Health Status Index Series Vol XV No II, pg. i
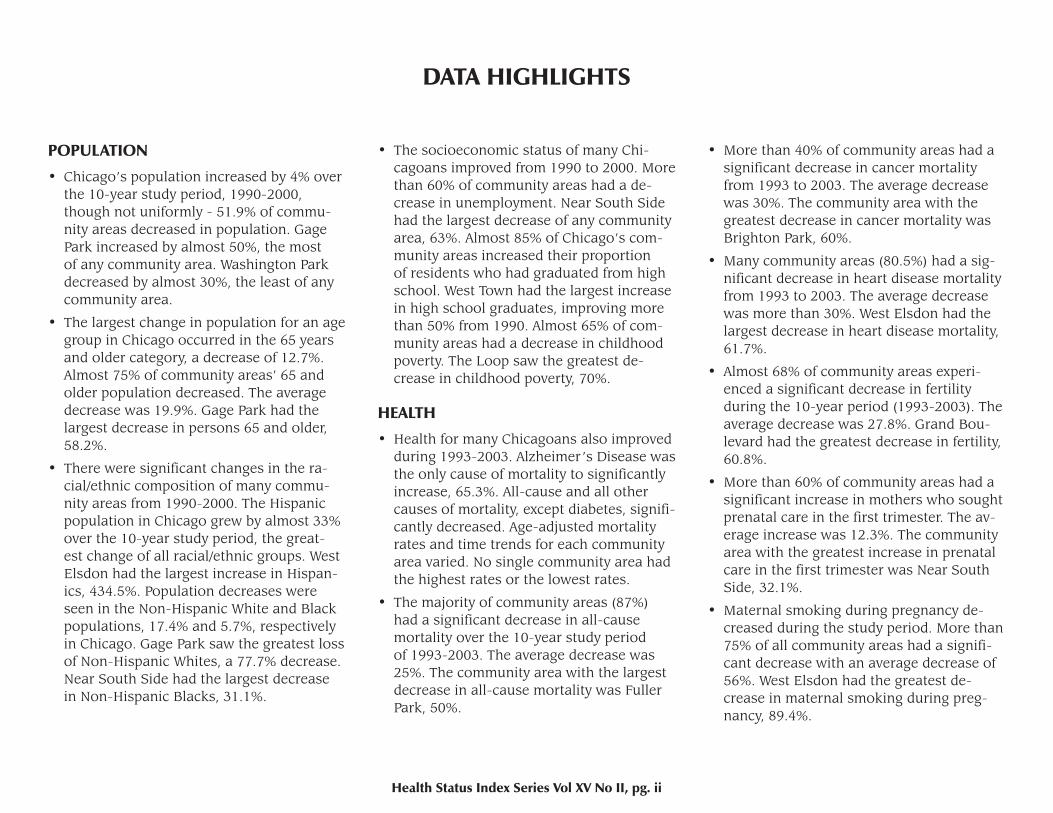
DATA HIGHLIGHTS
• The socioeconomic status of many Chi-cagoans improved from 1990 to 2000. More than 60% of community areas had a de-crease in unemployment. Near South Side had the largest decrease of any community area, 63%. Almost 85% of Chicago’s com-munity areas increased their proportion of residents who had graduated from high school. West Town had the largest increase in high school graduates, improving more than 50% from 1990. Almost 65% of com-munity areas had a decrease in childhood poverty. The Loop saw the greatest de-crease in childhood poverty, 70%.
HEALTH
• Health for many Chicagoans also improvedduring 1993-2003. Alzheimer’s Disease was the only cause of mortality to significantly increase, 65.3%. All-cause and all other causes of mortality, except diabetes, signifi-cantly decreased. Age-adjusted mortality rates and time trends for each community area varied. No single community area had the highest rates or the lowest rates.
• The majority of community areas (87%) had a significant decrease in all-cause mortality over the 10-year study period of 1993-2003. The average decrease was 25%. The community area with the largest decrease in all-cause mortality was Fuller Park, 50%.
• More than 40% of community areas had a significant decrease in cancer mortality from 1993 to 2003. The average decrease was 30%. The community area with the greatest decrease in cancer mortality was Brighton Park, 60%.
• Many community areas (80.5%) had a sig-nificant decrease in heart disease mortality from 1993 to 2003. The average decrease was more than 30%. West Elsdon had the largest decrease in heart disease mortality, 61.7%.
• Almost 68% of community areas experi-enced a significant decrease in fertility during the 10-year period (1993-2003). The average decrease was 27.8%. Grand Bou-levard had the greatest decrease in fertility, 60.8%.
• More than 60% of community areas had a significant increase in mothers who sought prenatal care in the first trimester. The av-erage increase was 12.3%. The community area with the greatest increase in prenatal care in the first trimester was Near South Side, 32.1%.
• Maternal smoking during pregnancy de-creased during the study period. More than 75% of all community areas had a signifi-cant decrease with an average decrease of 56%. West Elsdon had the greatest de-crease in maternal smoking during preg-nancy, 89.4%.
POPULATION
• Chicago’s population increased by 4% overthe 10-year study period, 1990-2000, though not uniformly - 51.9% of commu-nity areas decreased in population. Gage Park increased by almost 50%, the most of any community area. Washington Park decreased by almost 30%, the least of any community area.
• The largest change in population for an agegroup in Chicago occurred in the 65 years and older category, a decrease of 12.7%. Almost 75% of community areas’ 65 and older population decreased. The average decrease was 19.9%. Gage Park had the largest decrease in persons 65 and older, 58.2%.
• There were significant changes in the ra-cial/ethnic composition of many commu-nity areas from 1990-2000. The Hispanic population in Chicago grew by almost 33% over the 10-year study period, the great-est change of all racial/ethnic groups. West Elsdon had the largest increase in Hispan-ics, 434.5%. Population decreases were seen in the Non-Hispanic White and Black populations, 17.4% and 5.7%, respectively in Chicago. Gage Park saw the greatest loss of Non-Hispanic Whites, a 77.7% decrease. Near South Side had the largest decrease in Non-Hispanic Blacks, 31.1%.
Health Status Index Series Vol XV No II, pg. ii
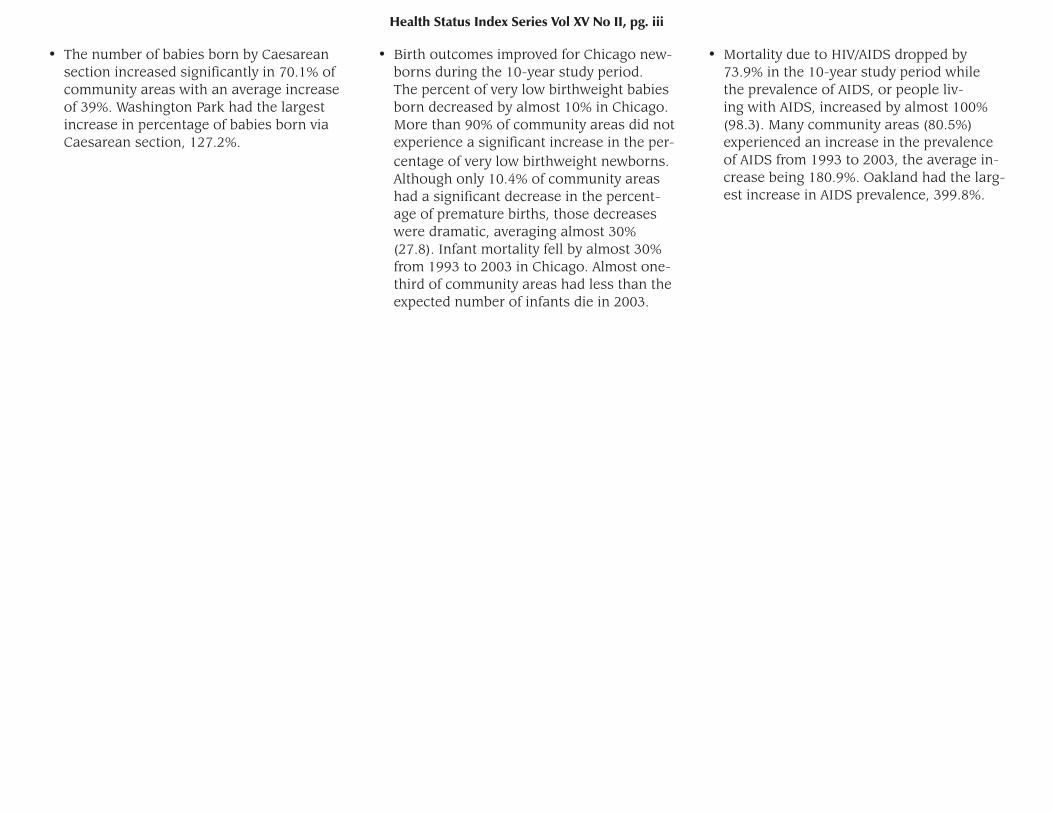
• The number of babies born by Caesarean section increased significantly in 70.1% of community areas with an average increase of 39%. Washington Park had the largest increase in percentage of babies born via Caesarean section, 127.2%.
• Mortality due to HIV/AIDS dropped by 73.9% in the 10-year study period while the prevalence of AIDS, or people liv-ing with AIDS, increased by almost 100% (98.3). Many community areas (80.5%) experienced an increase in the prevalence of AIDS from 1993 to 2003, the average in-crease being 180.9%. Oakland had the larg-est increase in AIDS prevalence, 399.8%.
• Birth outcomes improved for Chicago new-borns during the 10-year study period. The percent of very low birthweight babies born decreased by almost 10% in Chicago. More than 90% of community areas did not experience a significant increase in the per-centage of very low birthweight newborns. Although only 10.4% of community areas had a significant decrease in the percent-age of premature births, those decreases were dramatic, averaging almost 30% (27.8). Infant mortality fell by almost 30% from 1993 to 2003 in Chicago. Almost one-third of community areas had less than the expected number of infants die in 2003.
Health Status Index Series Vol XV No II, pg. iii
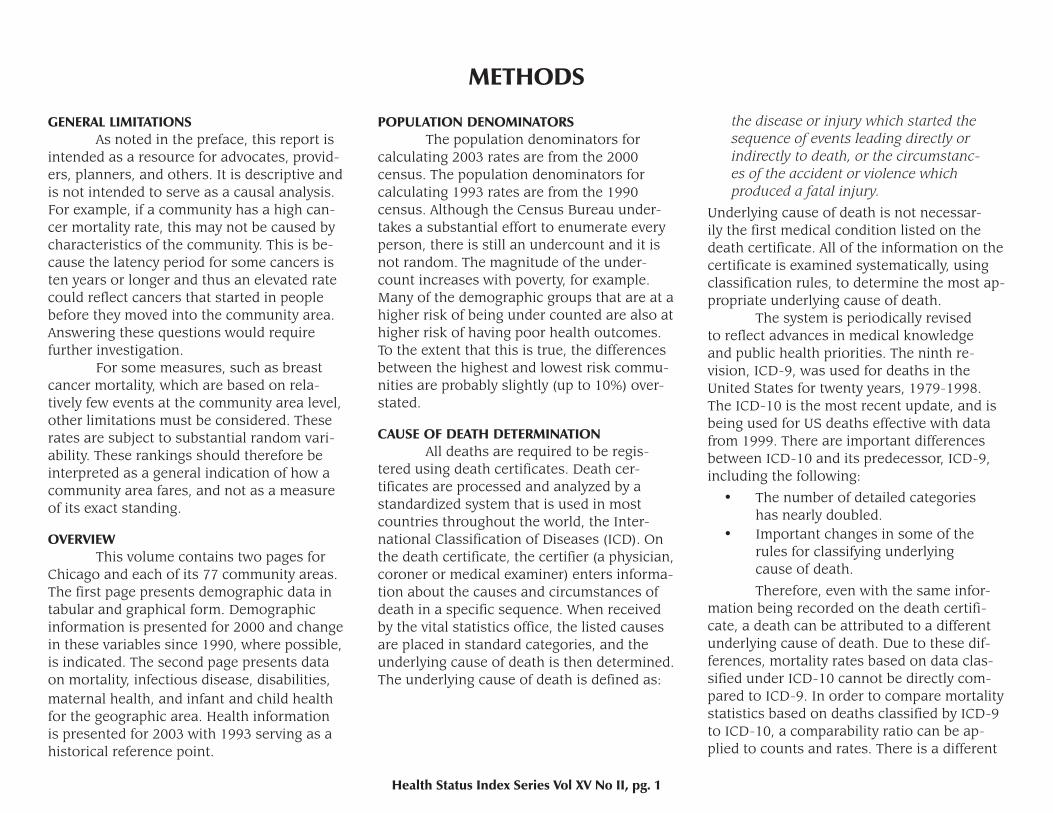
GENERAL LIMITATIONS As noted in the preface, this report is intended as a resource for advocates, provid-ers, planners, and others. It is descriptive and is not intended to serve as a causal analysis. For example, if a community has a high can-cer mortality rate, this may not be caused by characteristics of the community. This is be-cause the latency period for some cancers is ten years or longer and thus an elevated rate could reflect cancers that started in people before they moved into the community area. Answering these questions would require further investigation. For some measures, such as breast cancer mortality, which are based on rela-tively few events at the community area level, other limitations must be considered. These rates are subject to substantial random vari-ability. These rankings should therefore be interpreted as a general indication of how a community area fares, and not as a measure of its exact standing.
OVERVIEW This volume contains two pages for Chicago and each of its 77 community areas. The first page presents demographic data in tabular and graphical form. Demographic information is presented for 2000 and change in these variables since 1990, where possible, is indicated. The second page presents data on mortality, infectious disease, disabilities, maternal health, and infant and child health for the geographic area. Health information is presented for 2003 with 1993 serving as a historical reference point.
POPULATION DENOMINATORS The population denominators for calculating 2003 rates are from the 2000 census. The population denominators for calculating 1993 rates are from the 1990 census. Although the Census Bureau under-takes a substantial effort to enumerate every person, there is still an undercount and it is not random. The magnitude of the under-count increases with poverty, for example. Many of the demographic groups that are at a higher risk of being under counted are also at higher risk of having poor health outcomes. To the extent that this is true, the differences between the highest and lowest risk commu-nities are probably slightly (up to 10%) over-stated.
CAUSE OF DEATH DETERMINATION All deaths are required to be regis-tered using death certificates. Death cer-tificates are processed and analyzed by a standardized system that is used in most countries throughout the world, the Inter-national Classification of Diseases (ICD). On the death certificate, the certifier (a physician, coroner or medical examiner) enters informa-tion about the causes and circumstances of death in a specific sequence. When received by the vital statistics office, the listed causes are placed in standard categories, and the underlying cause of death is then determined. The underlying cause of death is defined as:
the disease or injury which started the sequence of events leading directly or indirectly to death, or the circumstanc-es of the accident or violence which produced a fatal injury.
Underlying cause of death is not necessar-ily the first medical condition listed on the death certificate. All of the information on the certificate is examined systematically, using classification rules, to determine the most ap-propriate underlying cause of death. The system is periodically revised to reflect advances in medical knowledge and public health priorities. The ninth re-vision, ICD-9, was used for deaths in the United States for twenty years, 1979-1998. The ICD-10 is the most recent update, and is being used for US deaths effective with data from 1999. There are important differences between ICD-10 and its predecessor, ICD-9, including the following:
• The number of detailed categories has nearly doubled.• Important changes in some of the rules for classifying underlying cause of death.
Therefore, even with the same infor-mation being recorded on the death certifi-cate, a death can be attributed to a different underlying cause of death. Due to these dif-ferences, mortality rates based on data clas-sified under ICD-10 cannot be directly com-pared to ICD-9. In order to compare mortality statistics based on deaths classified by ICD-9 to ICD-10, a comparability ratio can be ap-plied to counts and rates. There is a different
METHODS
Health Status Index Series Vol XV No II, pg. 1
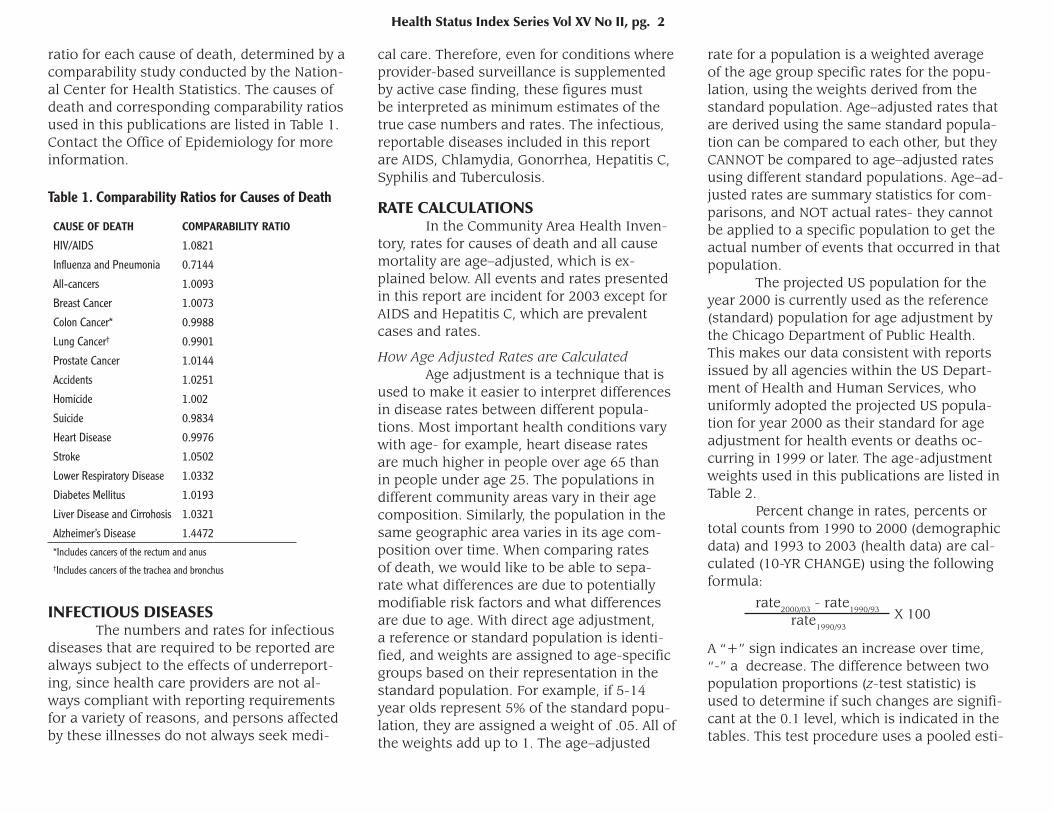
rate for a population is a weighted average of the age group specific rates for the popu-lation, using the weights derived from the standard population. Age–adjusted rates that are derived using the same standard popula-tion can be compared to each other, but they CANNOT be compared to age–adjusted rates using different standard populations. Age–ad-justed rates are summary statistics for com-parisons, and NOT actual rates- they cannot be applied to a specific population to get the actual number of events that occurred in that population. The projected US population for the year 2000 is currently used as the reference (standard) population for age adjustment by the Chicago Department of Public Health. This makes our data consistent with reports issued by all agencies within the US Depart-ment of Health and Human Services, who uniformly adopted the projected US popula-tion for year 2000 as their standard for age adjustment for health events or deaths oc-curring in 1999 or later. The age-adjustment weights used in this publications are listed in Table 2. Percent change in rates, percents or total counts from 1990 to 2000 (demographic data) and 1993 to 2003 (health data) are cal-culated (10-YR CHANGE) using the following formula:
rate2000/03 - rate1990/93
rate1990/93
A “+” sign indicates an increase over time, “-” a decrease. The difference between two population proportions (z-test statistic) is used to determine if such changes are signifi-cant at the 0.1 level, which is indicated in the tables. This test procedure uses a pooled esti-
Health Status Index Series Vol XV No II, pg. 2
X 100
Table 1. Comparability Ratios for Causes of Death
CAUSE OF DEATH COMPARABILITY RATIO
HIV/AIDS 1.0821
Infl uenza and Pneumonia 0.7144
All-cancers 1.0093
Breast Cancer 1.0073
Colon Cancer* 0.9988
Lung Cancer† 0.9901
Prostate Cancer 1.0144
Accidents 1.0251
Homicide 1.002
Suicide 0.9834
Heart Disease 0.9976
Stroke 1.0502
Lower Respiratory Disease 1.0332
Diabetes Mellitus 1.0193
Liver Disease and Cirrohosis 1.0321
Alzheimer’s Disease 1.4472
*Includes cancers of the rectum and anus†Includes cancers of the trachea and bronchus
cal care. Therefore, even for conditions where provider-based surveillance is supplemented by active case finding, these figures must be interpreted as minimum estimates of the true case numbers and rates. The infectious, reportable diseases included in this report are AIDS, Chlamydia, Gonorrhea, Hepatitis C, Syphilis and Tuberculosis.
RATE CALCULATIONS In the Community Area Health Inven-tory, rates for causes of death and all cause mortality are age–adjusted, which is ex-plained below. All events and rates presented in this report are incident for 2003 except for AIDS and Hepatitis C, which are prevalent cases and rates.
How Age Adjusted Rates are Calculated Age adjustment is a technique that is used to make it easier to interpret differences in disease rates between different popula-tions. Most important health conditions vary with age- for example, heart disease rates are much higher in people over age 65 than in people under age 25. The populations in different community areas vary in their age composition. Similarly, the population in the same geographic area varies in its age com-position over time. When comparing rates of death, we would like to be able to sepa-rate what differences are due to potentially modifiable risk factors and what differences are due to age. With direct age adjustment, a reference or standard population is identi-fied, and weights are assigned to age-specific groups based on their representation in the standard population. For example, if 5-14 year olds represent 5% of the standard popu-lation, they are assigned a weight of .05. All of the weights add up to 1. The age–adjusted
ratio for each cause of death, determined by a comparability study conducted by the Nation-al Center for Health Statistics. The causes of death and corresponding comparability ratios used in this publications are listed in Table 1. Contact the Office of Epidemiology for more information.
INFECTIOUS DISEASES The numbers and rates for infectious diseases that are required to be reported are always subject to the effects of underreport-ing, since health care providers are not al-ways compliant with reporting requirements for a variety of reasons, and persons affected by these illnesses do not always seek medi-
mate of the two population rates/percents and the estimated standard error of this pooled estimate in order to assess if the two rates/percents are equal or not. Any difference between the 1990 and 2000 total population count is considered significant according to the U.S. Census Bureau. Therefore, no z-test was performed for total population counts (“All”). For more details, contact the Office of Epidemiology.
Data Reporting Criteria The guidelines for data release and cell suppression used by CDPH try to balance data accessibility with privacy concerns and confidence in the stability of the estimates that we publish. Rates, percentages, and ratios based on twenty or fewer events can vary widely just by random chance even when there is no meaningful statistical difference between measurements. Rare events occurring in large populations do not usually allow for the iden-
tification of individuals, but reporting small cell sizes for population subgroups (for ex-ample, Native American Chicago residents be-tween 20-29 that give birth in a calendar year) increases the risk of breaching confidentiality. The guidelines for cell suppression used in this report (adapted from the Mas-sachusetts Department of Public Health) are based on both the numerator (event) and de-nominator (population or group size) values, except for Chlamydia, Gonnorrhea, Syphilis (primary and secondary), and AIDS cases and rates. To prevent back calculation of sup-pressed numbers, secondary suppression of at least three other cells may be performed in conjunction with the primary suppression.
Data will be reported when they meet one of the following conditions:
1. For population/group size > 29, number of events is less than the population/group size.2. For population/group size between 10 and 29, the number of events is either 0 or the difference between the population/group size and the number of events is greater than 5.3. For population/group size less than 10, there are no events.
If these conditions are met but calculations produce statistically unreliable rates, ratios or percentages, then:
• counts will be reported without secondary calculations, or
• secondary calculations will be identfied with a warning to use caution when interpreting or comparing those values.
Data will NOT be reported when either of the following conditions exist:
1. For population/group size between 10 and 29, the difference between the population/group size and the number of events is between 0 and 5.2. For population/group size less than 10, the number of events is between 1 and 9.
The Office of HIV/AIDS Surveillance and the STD Surveillance Program have a separate confidentiality standard whereby counts and rates for less than 5 cases are suppressed. As such, for fewer than 5 Chla-mydia, Gonnorrhea, Syphilis and AIDS cases, counts will be reported as < 5 and rates sup-pressed. An age-adjusted mortality rate will be suppressed when the total number of events is 20 or less. (Other methods of analysis are available to evaluate age-adjusted rates based on 20 or fewer events e.g. Poisson. Please contact the Office of Epidemiology for more information.) Percentages and rates (not age-adjusted) based on 20 events or less will be reported along with a warning to use caution when making interpretations based on these rates. Percentages and rates (not age-ad-justed) based on fewer than 5 events will be supressed. If 1993 and/or 2003 rates/percents are suppressed, 10-YR CHANGE will not be calculated and indicated by “--”.
Health Status Index Series Vol XV No II, pg. 3
AGE (YEARS) WEIGHT
Under 1 0.013818
1-4 0.055317
5-14 0.145565
15-24 0.138646
25-34 0.135573
35-44 0.162613
45-54 0.134834
55-64 0.087247
65-74 0.066037
75-84 0.044842
85+ 0.015508
Table 2. Age-Adjustment Weights for Year 2000 Standard Population
DEFINITIONS OF MEASURES
DEMOGRAPHIC MEASURES
Below Poverty LevelPersons whose household income falls below the federally defined poverty level in 1989 (1990 data) and 1999 (2000 data).
Source: United States Census
Childhood PovertyPersons under age 18 whose total family in-come falls below the federally defined pov-erty level in 1989 (1990 data) and 1999 (2000 data).
Source: United States Census
High School GraduatesPersons age 25 years and older who have received a high school diploma or its equiva-lent.
Source: United States Census
Housing VacanciesNumber of unoccupied housing units either for rent, sale, or seasonal use only.
Source: United States Census
Median Household IncomeThe annual income at which half of the households fell above and half below.
Source: United States Census
Population DistributionsThe proportions of age, sex, and racial/ethnic distributions sum to 100% (to within round-ing error). Females 15-44 reports the popula-tion of women of child-bearing age.
Source: United States Census
Same Place of Residence for 5 YearsPersons who lived in the same place (house, apartment, etc.) in 1995 (1985 for the 1990 Census).
Source: United States Census
UnemployedCivilian persons over age 16 who are without work and actively seeking work.
Source: United States Census
HEALTH MEASURES
Infectious Diseases (Reportable) Reportable diseases are those that are man-dated by state law to be tabulated and report-ed to the appropriate health authority, in this case CDPH. The infectious, reportable condi-tions selected for this report are:
AIDSChlamydiaGonorrheaHepatitis CSyphilis (primary and secondary)Tuberculosis
The annual number of cases and incidence rates per 100,000 population are given for all conditions except AIDS and Hepatitis C. The AIDS prevalence rate estimates the number of persons diagnosed with AIDS living in Chicago and a specific community area. The total number of cases diagnosed for individu-als living in a community area/Chicago since surveillance began are included in this report, assuming the persons living with AIDS re-mained in the community area where they re-sided when diagnosed. As advances in treat-ment have lengthened the lifespan of AIDS
patients, it is possible that persons living with AIDS have moved since diagnosis. Hepa-titis C counts reflect persons who have tested positive by an antibody, PCR or RIBA test. The data included in this report are the number of positive reports received by CDPH in 2003 per 100,000, and not the disease prevalence rate for Hepatitis C in 2003. No rates are age-ad-justed. Data for sexually transmitted diseases and AIDS are not reported if fewer than five events occurred in the community area. Com-munity area STD and Hepatitis C data for 1993 are not available.
Sources: CDPH Programs of Communicable Disease and Sexually Transmitted Disease,
and Office of HIV/AIDS Surveillance
DisabilitiesNon-institutionalized, civilian persons aged 5 and older with a long-lasting condition such as: blindness, deafness, or a severe vision or hearing impairment (Blind/Deaf); a con-dition that substantially limits one or more basic physical activities like walking, climbing stairs, reaching, lifting or carrying (Physical); a condition that makes it difficult to learn, remember, or concentrate (Mental); a condi-tion that makes it difficult to dress, bathe, get around inside the home (Requires Care); a condition that makes it difficult to go outside the home alone to shop or visit a doctor’s of-fice (Home-Bound); or a condition that makes it difficult to work at a job or business, refers only to persons between the ages of 16 and 64 (Unable to Work). These categories are NOT mutally exclusive.
Source: United States Census
Health Status Index Series Vol XV No II, pg. 4
Fertility RateThe annual number of births and fertility rate, defined as the number of births per 1000 women of child-bearing age (15-44) in the geographic area.
Source: IDPH Vital Records Tapes
First Trimester Prenatal CareThe annual number and percent of births to resident mothers receiving prenatal care in the first trimester.
Source: IDPH Vital Records Tapes
SmokingThe annual number and percent of births to resident mothers who reported smoking dur-ing pregnancy.
Source: IDPH Vital Records Tapes
Caesarean SectionThe annual number and percent of births to resident mothers who were delivered by Cae-sarean section.
Source: IDPH Vital Records Tapes
Very Low BirthweightThe annual number and percent of resident births weighing less than 1500 grams (3.25 pounds).
Source: IDPH Vital Records Tapes
Premature BirthThe annual number and percent of resident births with less than 37 completed weeks in the womb.
Source: IDPH Vital Records Tapes
Fetal MortalityThe annual number and rate of deaths of fe-tuses who have reached at least 20 weeks of gestation and whose mothers reside in Chi-cago. A fetal death is when the expelled fetus does not breathe or show any other evidence of life, such as beating of the heart, pulsation of the umblical cord, or definite movement of vountary muscles regardless of gestational length or fetal development. The rate is the number of fetal deaths per 1,000 live births and fetal deaths to mothers residing in the geographic area.
Source: IDPH Vital Records Tapes
Infant MortalityThe annual number and rate of deaths of resi-dent infants (younger than one year of age). The rate is the number of infant deaths per 1,000 live births to mothers residing in the geographic area.
Source: IDPH Vital Records Tapes
Lead ScreeningScreened is the number and percent of resi-dent children age six and younger with at least one lead screening.
Elevated is the number and percent of resi-dent children screened with a blood lead level higher than nine micrograms per deciliter. If a child was screened more than once, only one elevated screening is reported here. Commu-nity area data are not available prior to 1997.
Source: CDPH Lead Program
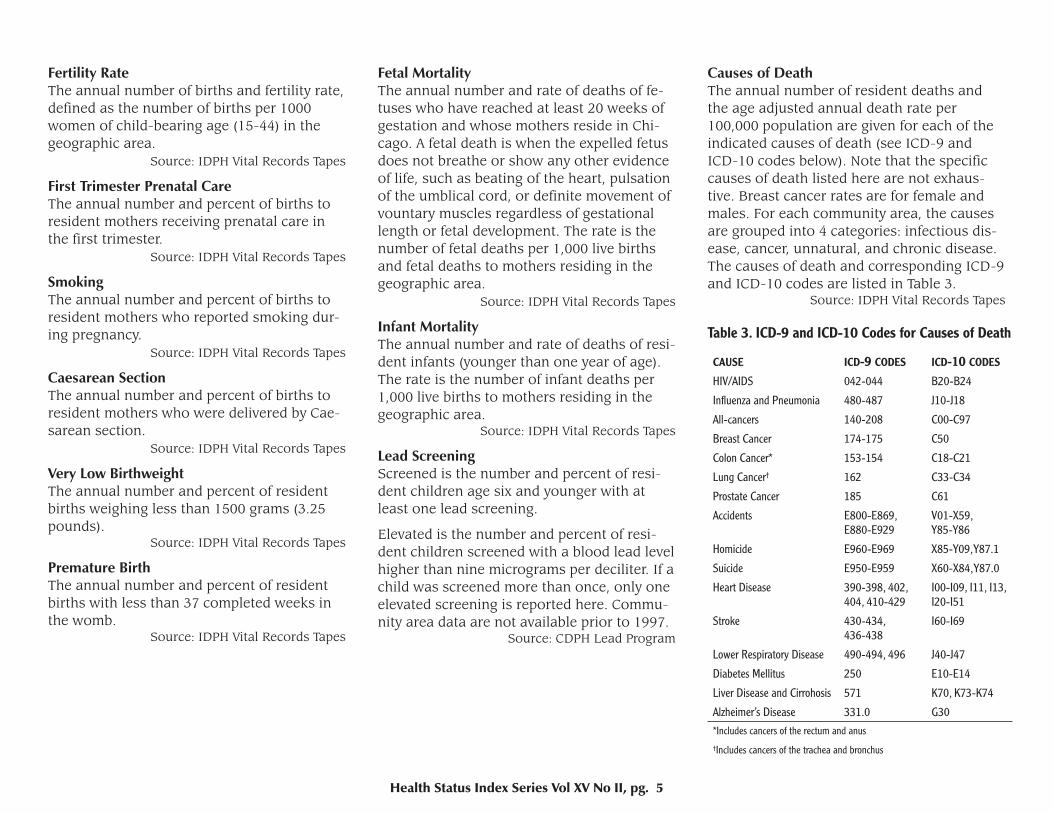
Causes of DeathThe annual number of resident deaths and the age adjusted annual death rate per 100,000 population are given for each of the indicated causes of death (see ICD-9 and ICD-10 codes below). Note that the specific causes of death listed here are not exhaus-tive. Breast cancer rates are for female and males. For each community area, the causes are grouped into 4 categories: infectious dis-ease, cancer, unnatural, and chronic disease. The causes of death and corresponding ICD-9 and ICD-10 codes are listed in Table 3.
Source: IDPH Vital Records Tapes
Health Status Index Series Vol XV No II, pg. 5
CAUSE ICD-9 CODES ICD-10 CODES
HIV/AIDS 042-044 B20-B24
Infl uenza and Pneumonia 480-487 J10-J18
All-cancers 140-208 C00-C97
Breast Cancer 174-175 C50
Colon Cancer* 153-154 C18-C21
Lung Cancer† 162 C33-C34
Prostate Cancer 185 C61
Accidents E800-E869,E880-E929
V01-X59, Y85-Y86
Homicide E960-E969 X85-Y09, Y87.1
Suicide E950-E959 X60-X84, Y87.0
Heart Disease 390-398, 402, 404, 410-429
I00-I09, I11, I13, I20-I51
Stroke 430-434, 436-438
I60-I69
Lower Respiratory Disease 490-494, 496 J40-J47
Diabetes Mellitus 250 E10-E14
Liver Disease and Cirrohosis 571 K70, K73-K74
Alzheimer’s Disease 331.0 G30
*Includes cancers of the rectum and anus†Includes cancers of the trachea and bronchus
Table 3. ICD-9 and ICD-10 Codes for Causes of Death


DEMOGRAPHIC AND HEALTH PROFILES
AGE
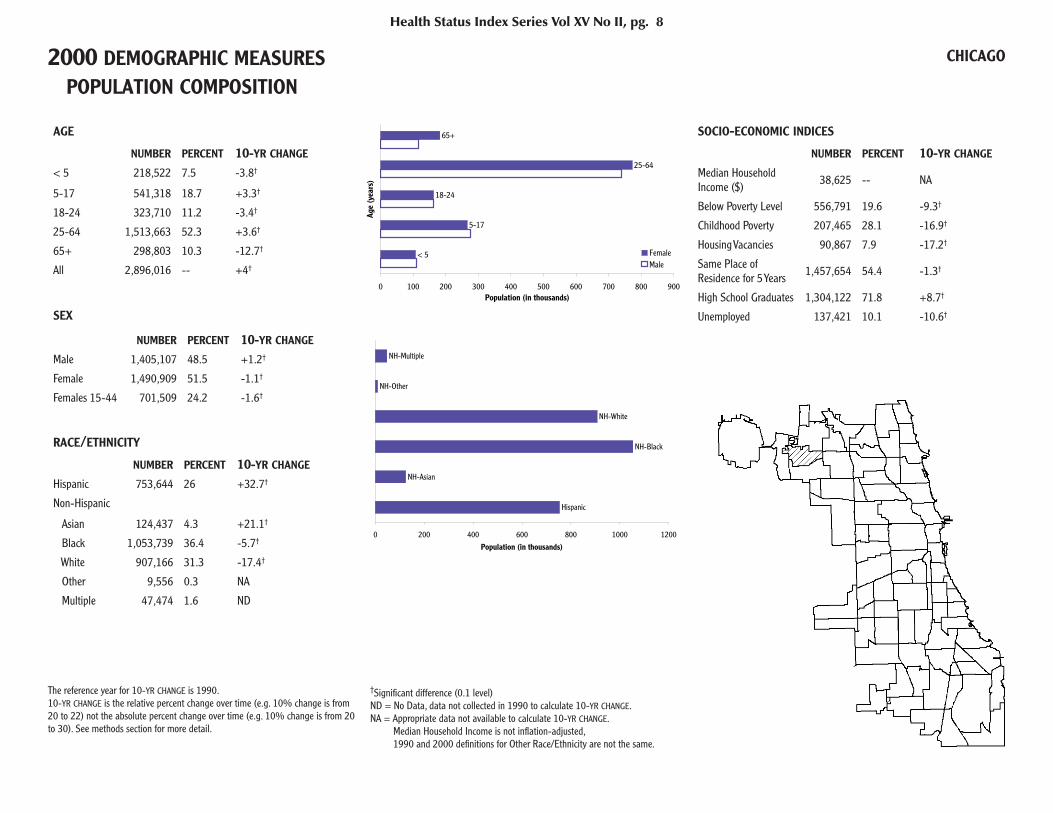
NUMBER PERCENT 10-YR CHANGE < 5 218,522 7.5 -3.8†
5-17 541,318 18.7 +3.3†
18-24 323,710 11.2 -3.4†
25-64 1,513,663 52.3 +3.6†
65+ 298,803 10.3 -12.7†
All 2,896,016 -- +4†
RACE/ETHNICITY
NUMBER PERCENT 10-YR CHANGE Hispanic 753,644 26 +32.7†
Non-Hispanic
Asian 124,437 4.3 +21.1†
Black 1,053,739 36.4 -5.7†
White 907,166 31.3 -17.4†
Other 9,556 0.3 NA
Multiple 47,474 1.6 ND
SEX
NUMBER PERCENT 10-YR CHANGE Male 1,405,107 48.5 +1.2†
Female 1,490,909 51.5 -1.1†
Females 15-44 701,509 24.2 -1.6†
SOCIO-ECONOMIC INDICES
NUMBER PERCENT 10-YR CHANGE
Median Household Income ($) 38,625 -- NA
Below Poverty Level 556,791 19.6 -9.3†
Childhood Poverty 207,465 28.1 -16.9†
Housing Vacancies 90,867 7.9 -17.2†
Same Place of Residence for 5 Years 1,457,654 54.4 -1.3†
High School Graduates 1,304,122 71.8 +8.7†
Unemployed 137,421 10.1 -10.6†
The reference year for 10-YR CHANGE is 1990.10-YR CHANGE is the relative percent change over time (e.g. 10% change is from 20 to 22) not the absolute percent change over time (e.g. 10% change is from 20 to 30). See methods section for more detail.
†Signifi cant difference (0.1 level)ND = No Data, data not collected in 1990 to calculate 10-YR CHANGE.NA = Appropriate data not available to calculate 10-YR CHANGE. Median Household Income is not infl ation-adjusted, 1990 and 2000 defi nitions for Other Race/Ethnicity are not the same.
Health Status Index Series Vol XV No II, pg. 8
CHICAGO2000 DEMOGRAPHIC MEASURES POPULATION COMPOSITION
< 5
5-17
18-24
25-64
65+
0 100 200 300 400 500 600 700 800 900
Age
(yea
rs)
Population (in thousands)
FemaleMale
Hispanic
NH-Asian
NH-Black
NH-White
NH-Other
NH-Multiple
0 200 400 600 800 1000 1200
Population (in thousands)
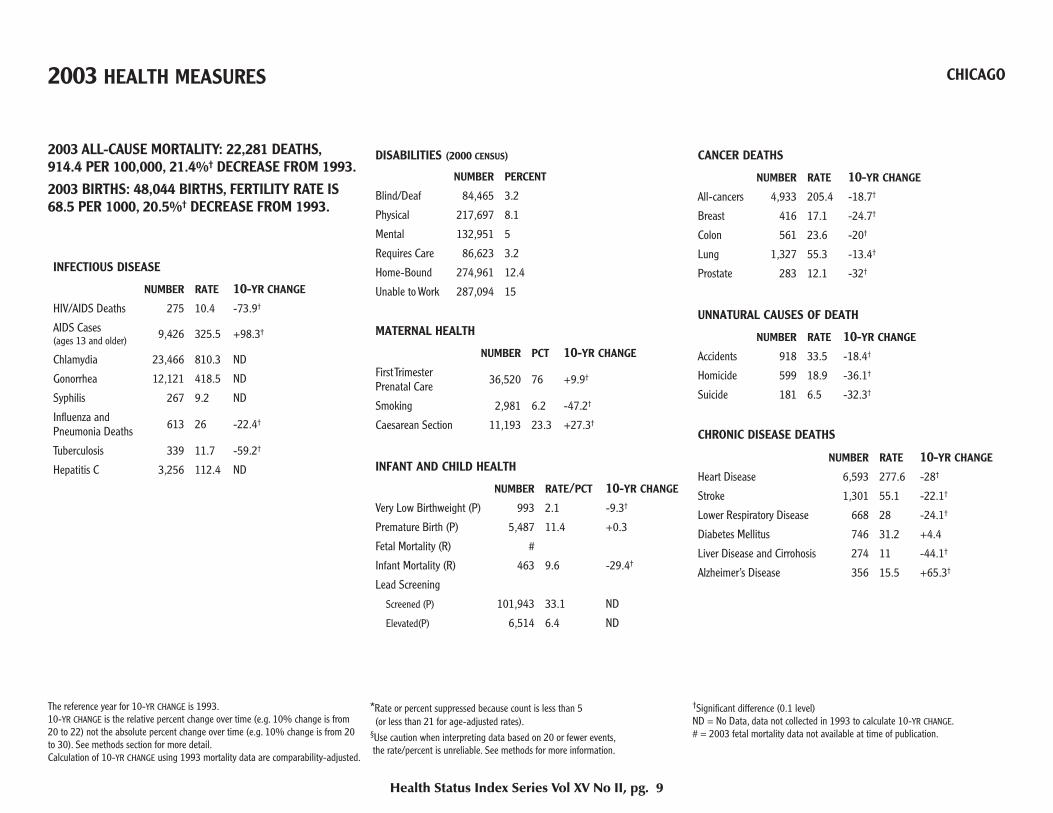
2003 ALL-CAUSE MORTALITY: 22,281 DEATHS,914.4 PER 100,000, 21.4%† DECREASE FROM 1993.2003 BIRTHS: 48,044 BIRTHS, FERTILITY RATE IS 68.5 PER 1000, 20.5%† DECREASE FROM 1993.
INFECTIOUS DISEASE
NUMBER RATE 10-YR CHANGE HIV/AIDS Deaths 275 10.4 -73.9†
AIDS Cases (ages 13 and older) 9,426 325.5 +98.3†
Chlamydia 23,466 810.3 ND
Gonorrhea 12,121 418.5 ND
Syphilis 267 9.2 ND
Infl uenza and Pneumonia Deaths 613 26 -22.4†
Tuberculosis 339 11.7 -59.2†
Hepatitis C 3,256 112.4 ND
DISABILITIES (2000 CENSUS)
NUMBER PERCENT
Blind/Deaf 84,465 3.2
Physical 217,697 8.1
Mental 132,951 5
Requires Care 86,623 3.2
Home-Bound 274,961 12.4
Unable to Work 287,094 15
MATERNAL HEALTH
NUMBER PCT 10-YR CHANGE First Trimester Prenatal Care 36,520 76 +9.9†
Smoking 2,981 6.2 -47.2†
Caesarean Section 11,193 23.3 +27.3†
INFANT AND CHILD HEALTH
NUMBER RATE/PCT 10-YR CHANGE Very Low Birthweight (P) 993 2.1 -9.3†
Premature Birth (P) 5,487 11.4 +0.3
Fetal Mortality (R) #
Infant Mortality (R) 463 9.6 -29.4†
Lead Screening
Screened (P) 101,943 33.1 ND
Elevated(P) 6,514 6.4 ND
CANCER DEATHS
NUMBER RATE 10-YR CHANGE All-cancers 4,933 205.4 -18.7†
Breast 416 17.1 -24.7†
Colon 561 23.6 -20†
Lung 1,327 55.3 -13.4†
Prostate 283 12.1 -32†
UNNATURAL CAUSES OF DEATH
NUMBER RATE 10-YR CHANGE Accidents 918 33.5 -18.4†
Homicide 599 18.9 -36.1†
Suicide 181 6.5 -32.3†
CHRONIC DISEASE DEATHS
NUMBER RATE 10-YR CHANGE Heart Disease 6,593 277.6 -28†
Stroke 1,301 55.1 -22.1†
Lower Respiratory Disease 668 28 -24.1†
Diabetes Mellitus 746 31.2 +4.4
Liver Disease and Cirrohosis 274 11 -44.1†
Alzheimer’s Disease 356 15.5 +65.3†
The reference year for 10-YR CHANGE is 1993. 10-YR CHANGE is the relative percent change over time (e.g. 10% change is from 20 to 22) not the absolute percent change over time (e.g. 10% change is from 20 to 30). See methods section for more detail. Calculation of 10-YR CHANGE using 1993 mortality data are comparability-adjusted.
*Rate or percent suppressed because count is less than 5 (or less than 21 for age-adjusted rates).§Use caution when interpreting data based on 20 or fewer events, the rate/percent is unreliable. See methods for more information.
†Signifi cant difference (0.1 level)ND = No Data, data not collected in 1993 to calculate 10-YR CHANGE.# = 2003 fetal mortality data not available at time of publication.
Health Status Index Series Vol XV No II, pg. 9
2003 HEALTH MEASURES CHICAGO
2000 DEMOGRAPHIC MEASURES POPULATION COMPOSITION
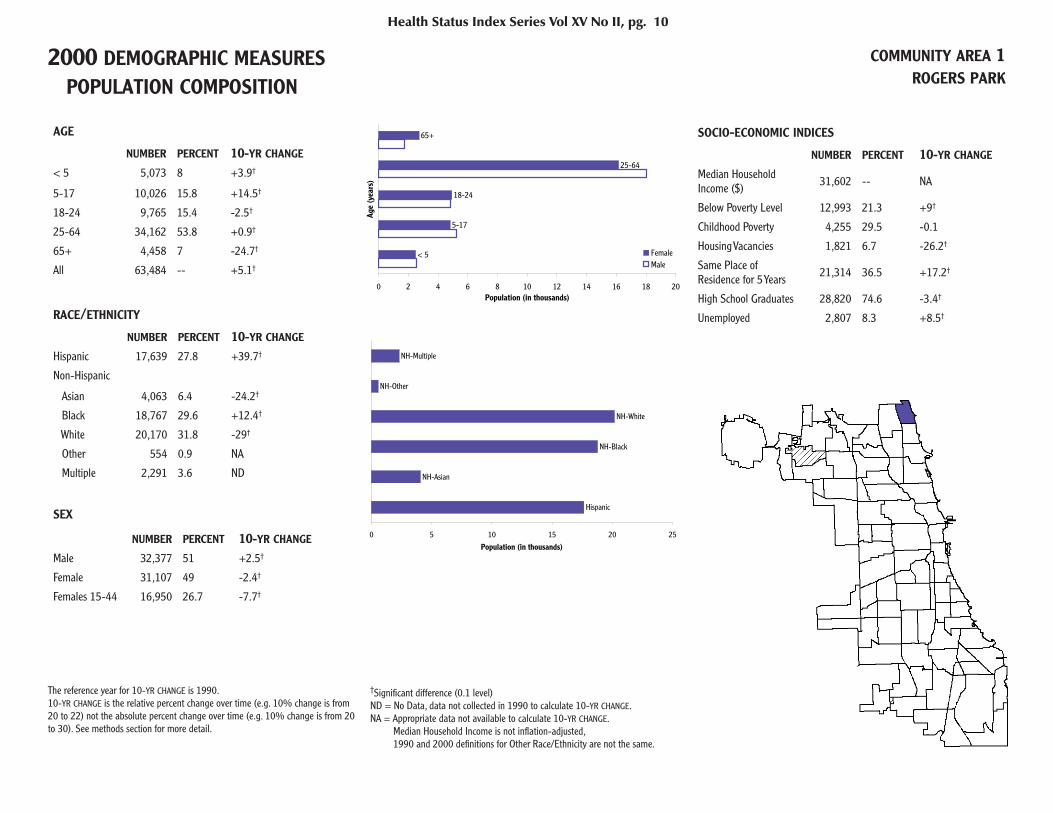
COMMUNITY AREA 1ROGERS PARK
AGE
NUMBER PERCENT 10-YR CHANGE < 5 5,073 8 +3.9†
5-17 10,026 15.8 +14.5†
18-24 9,765 15.4 -2.5†
25-64 34,162 53.8 +0.9†
65+ 4,458 7 -24.7†
All 63,484 -- +5.1†
RACE/ETHNICITY
NUMBER PERCENT 10-YR CHANGE Hispanic 17,639 27.8 +39.7†
Non-Hispanic
Asian 4,063 6.4 -24.2†
Black 18,767 29.6 +12.4†
White 20,170 31.8 -29†
Other 554 0.9 NA
Multiple 2,291 3.6 ND
SEX
NUMBER PERCENT 10-YR CHANGE Male 32,377 51 +2.5†
Female 31,107 49 -2.4†
Females 15-44 16,950 26.7 -7.7†
SOCIO-ECONOMIC INDICES
NUMBER PERCENT 10-YR CHANGE
Median Household Income ($) 31,602 -- NA
Below Poverty Level 12,993 21.3 +9†
Childhood Poverty 4,255 29.5 -0.1
Housing Vacancies 1,821 6.7 -26.2†
Same Place of Residence for 5 Years 21,314 36.5 +17.2†
High School Graduates 28,820 74.6 -3.4†
Unemployed 2,807 8.3 +8.5†
Health Status Index Series Vol XV No II, pg. 10
< 5
5-17
18-24
25-64
65+
0 2 4 6 8 10 12 14 16 18 20
Age
(yea
rs)
Population (in thousands)
FemaleMale
Hispanic
NH-Asian
NH-Black
NH-White
NH-Other
NH-Multiple
0 5 10 15 20 25
Population (in thousands)
The reference year for 10-YR CHANGE is 1990.10-YR CHANGE is the relative percent change over time (e.g. 10% change is from 20 to 22) not the absolute percent change over time (e.g. 10% change is from 20 to 30). See methods section for more detail.
†Signifi cant difference (0.1 level)ND = No Data, data not collected in 1990 to calculate 10-YR CHANGE.NA = Appropriate data not available to calculate 10-YR CHANGE. Median Household Income is not infl ation-adjusted, 1990 and 2000 defi nitions for Other Race/Ethnicity are not the same.

2003 HEALTH MEASURES COMMUNITY AREA 1ROGERS PARK
2003 ALL-CAUSE MORTALITY: 441 DEATHS,1,074.8 PER 100,000, 16.7%† DECREASE FROM 1993.2003 BIRTHS: 1,024 BIRTHS, FERTILITY RATE IS60.4 PER 1000, 16.6%† DECREASE FROM 1993.
INFECTIOUS DISEASE
NUMBER RATE 10-YR CHANGE HIV/AIDS Deaths 6 * --
AIDS Cases (ages 13 and older) 405 779.5 +187.8†
Chlamydia 320 504.1 ND
Gonorrhea 162 255.2 ND
Syphilis 10 15.8§ ND
Infl uenza and Pneumonia Deaths 24 59.1 --
Tuberculosis 6 9.5§ -47.8†
Hepatitis C 36 56.7 ND
DISABILITIES (2000 CENSUS)
NUMBER PERCENT
Blind/Deaf 1,565 2.7
Physical 3,775 6.5
Mental 3,431 5.9
Requires Care 1,990 3.4
Home-Bound 6,441 12.9
Unable to Work 7,595 16.7
MATERNAL HEALTH
NUMBER PCT 10-YR CHANGE First Trimester Prenatal Care 613 59.9 +6.7†
Smoking 49 4.8 -36.3†
Caesarean Section 218 21.3 +33.3†
INFANT AND CHILD HEALTH
NUMBER RATE/PCT 10-YR CHANGE Very Low Birthweight (P) 25 2.4 -3.5
Premature Birth (P) 109 10.6 -2.4
Fetal Mortality (R) #
Infant Mortality (R) 8 7.8§ -55.1†
Lead Screening
Screened (P) 2,182 31.8 ND
Elevated(P) 95 4.4 ND
CANCER DEATHS
NUMBER RATE 10-YR CHANGE All-cancers 86 221.5 -10.7
Breast 5 * --
Colon 12 * --
Lung 20 * --
Prostate 6 * --
UNNATURAL CAUSES OF DEATH
NUMBER RATE 10-YR CHANGE Accidents 12 * --
Homicide 6 * --
Suicide 3 * --
CHRONIC DISEASE DEATHS
NUMBER RATE 10-YR CHANGE Heart Disease 138 354.3 -19.7†
Stroke 15 * --
Lower Respiratory Disease 19 * --
Diabetes Mellitus 14 * --
Liver Disease and Cirrohosis 8 * --
Alzheimer’s Disease 5 * --
Health Status Index Series Vol XV No II, pg. 11
The reference year for 10-YR CHANGE is 1993. 10-YR CHANGE is the relative percent change over time (e.g. 10% change is from 20 to 22) not the absolute percent change over time (e.g. 10% change is from 20 to 30). See methods section for more detail. Calculation of 10-YR CHANGE using 1993 mortality data are comparability-adjusted.
*Rate or percent suppressed because count is less than 5 (or less than 21 for age-adjusted rates).§Use caution when interpreting data based on 20 or fewer events, the rate/percent is unreliable. See methods for more information.
†Signifi cant difference (0.1 level)ND = No Data, data not collected in 1993 to calculate 10-YR CHANGE.# = 2003 fetal mortality data not available at time of publication.
2000 DEMOGRAPHIC MEASURES POPULATION COMPOSITION
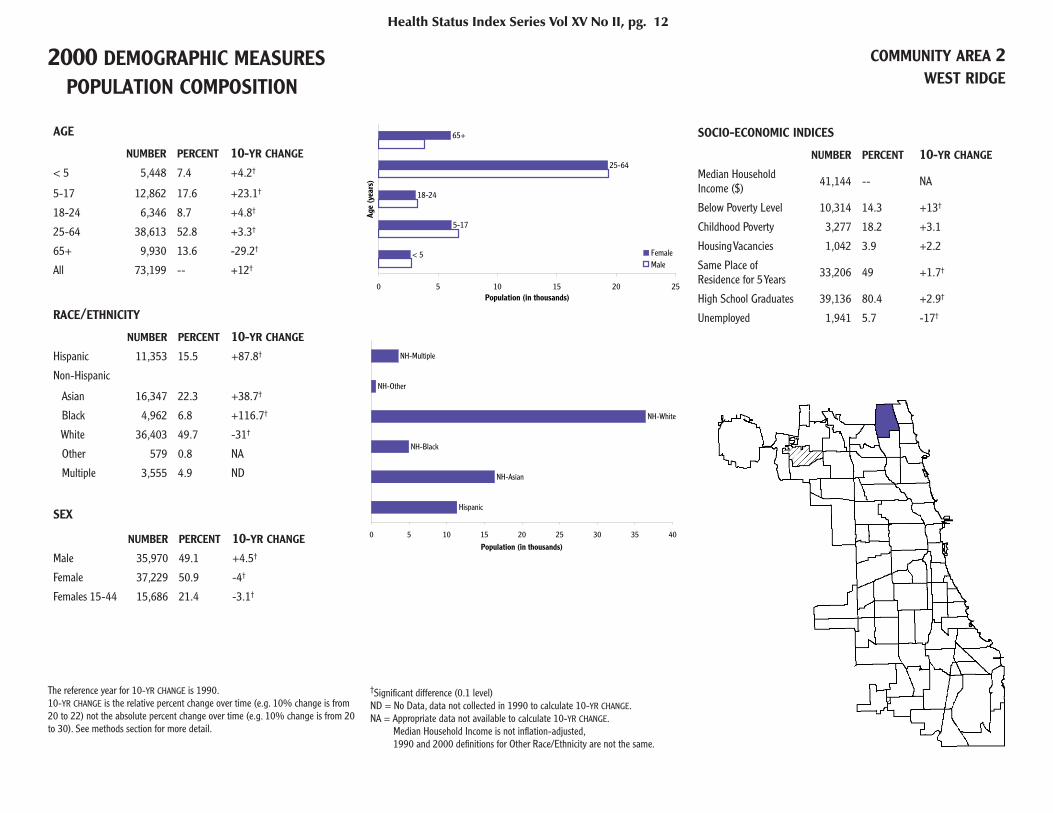
COMMUNITY AREA 2WEST RIDGE
AGE
NUMBER PERCENT 10-YR CHANGE < 5 5,448 7.4 +4.2†
5-17 12,862 17.6 +23.1†
18-24 6,346 8.7 +4.8†
25-64 38,613 52.8 +3.3†
65+ 9,930 13.6 -29.2†
All 73,199 -- +12†
RACE/ETHNICITY
NUMBER PERCENT 10-YR CHANGE Hispanic 11,353 15.5 +87.8†
Non-Hispanic
Asian 16,347 22.3 +38.7†
Black 4,962 6.8 +116.7†
White 36,403 49.7 -31†
Other 579 0.8 NA
Multiple 3,555 4.9 ND
SEX
NUMBER PERCENT 10-YR CHANGE Male 35,970 49.1 +4.5†
Female 37,229 50.9 -4†
Females 15-44 15,686 21.4 -3.1†
SOCIO-ECONOMIC INDICES
NUMBER PERCENT 10-YR CHANGE
Median Household Income ($) 41,144 -- NA
Below Poverty Level 10,314 14.3 +13†
Childhood Poverty 3,277 18.2 +3.1
Housing Vacancies 1,042 3.9 +2.2
Same Place of Residence for 5 Years 33,206 49 +1.7†
High School Graduates 39,136 80.4 +2.9†
Unemployed 1,941 5.7 -17†
Health Status Index Series Vol XV No II, pg. 12
< 5
5-17
18-24
25-64
65+
0 5 10 15 20 25
Age
(yea
rs)
Population (in thousands)
FemaleMale
Hispanic
NH-Asian
NH-Black
NH-White
NH-Other
NH-Multiple
0 5 10 15 20 25 30 35 40
Population (in thousands)
The reference year for 10-YR CHANGE is 1990.10-YR CHANGE is the relative percent change over time (e.g. 10% change is from 20 to 22) not the absolute percent change over time (e.g. 10% change is from 20 to 30). See methods section for more detail.
†Signifi cant difference (0.1 level)ND = No Data, data not collected in 1990 to calculate 10-YR CHANGE.NA = Appropriate data not available to calculate 10-YR CHANGE. Median Household Income is not infl ation-adjusted, 1990 and 2000 defi nitions for Other Race/Ethnicity are not the same.

2003 HEALTH MEASURES COMMUNITY AREA 2WEST RIDGE
2003 ALL-CAUSE MORTALITY: 593 DEATHS,690.2 PER 100,000, 21.7%† DECREASE FROM 1993.2003 BIRTHS: 1,249 BIRTHS, FERTILITY RATE IS79.6 PER 1000, 4.9% INCREASE FROM 1993.
INFECTIOUS DISEASE
NUMBER RATE 10-YR CHANGE HIV/AIDS Deaths 7 * --
AIDS Cases (ages 13 and older) 89 149.4 +163.7†
Chlamydia 106 144.8 ND
Gonorrhea 44 60.1 ND
Syphilis < 5 * ND
Infl uenza and Pneumonia Deaths 25 25.6 -25.5
Tuberculosis 13 17.8§ +6
Hepatitis C 26 35.5 ND
DISABILITIES (2000 CENSUS)
NUMBER PERCENT
Blind/Deaf 2,173 3.2
Physical 5,148 7.6
Mental 3,404 5
Requires Care 2,315 3.4
Home-Bound 7,867 13.9
Unable to Work 7,351 15.7
MATERNAL HEALTH
NUMBER PCT 10-YR CHANGE First Trimester Prenatal Care 807 64.6 -12.4†
Smoking 24 1.9 -66†
Caesarean Section 291 23.3 +20.6†
INFANT AND CHILD HEALTH
NUMBER RATE/PCT 10-YR CHANGE Very Low Birthweight (P) 23 1.8 +44.3
Premature Birth (P) 136 10.9 +34.2†
Fetal Mortality (R) #
Infant Mortality (R) 8 6.4§ +0.4
Lead Screening
Screened (P) 2,273 30.4 ND
Elevated(P) 62 2.7 ND
CANCER DEATHS
NUMBER RATE 10-YR CHANGE All-cancers 139 172.1 -20.6†
Breast 11 * --
Colon 13 * --
Lung 34 43.7 +19.2
Prostate 4 * --
UNNATURAL CAUSES OF DEATH
NUMBER RATE 10-YR CHANGE Accidents 18 * --
Homicide 3 * --
Suicide 2 * --
CHRONIC DISEASE DEATHS
NUMBER RATE 10-YR CHANGE Heart Disease 190 213.5 -31.1†
Stroke 32 35.6 -42.3†
Lower Respiratory Disease 11 * --
Diabetes Mellitus 16 * --
Liver Disease and Cirrohosis 10 * --
Alzheimer’s Disease 18 * --
Health Status Index Series Vol XV No II, pg. 13
The reference year for 10-YR CHANGE is 1993. 10-YR CHANGE is the relative percent change over time (e.g. 10% change is from 20 to 22) not the absolute percent change over time (e.g. 10% change is from 20 to 30). See methods section for more detail. Calculation of 10-YR CHANGE using 1993 mortality data are comparability-adjusted.
*Rate or percent suppressed because count is less than 5 (or less than 21 for age-adjusted rates).§Use caution when interpreting data based on 20 or fewer events, the rate/percent is unreliable. See methods for more information.
†Signifi cant difference (0.1 level)ND = No Data, data not collected in 1993 to calculate 10-YR CHANGE.# = 2003 fetal mortality data not available at time of publication.
2000 DEMOGRAPHIC MEASURES POPULATION COMPOSITION
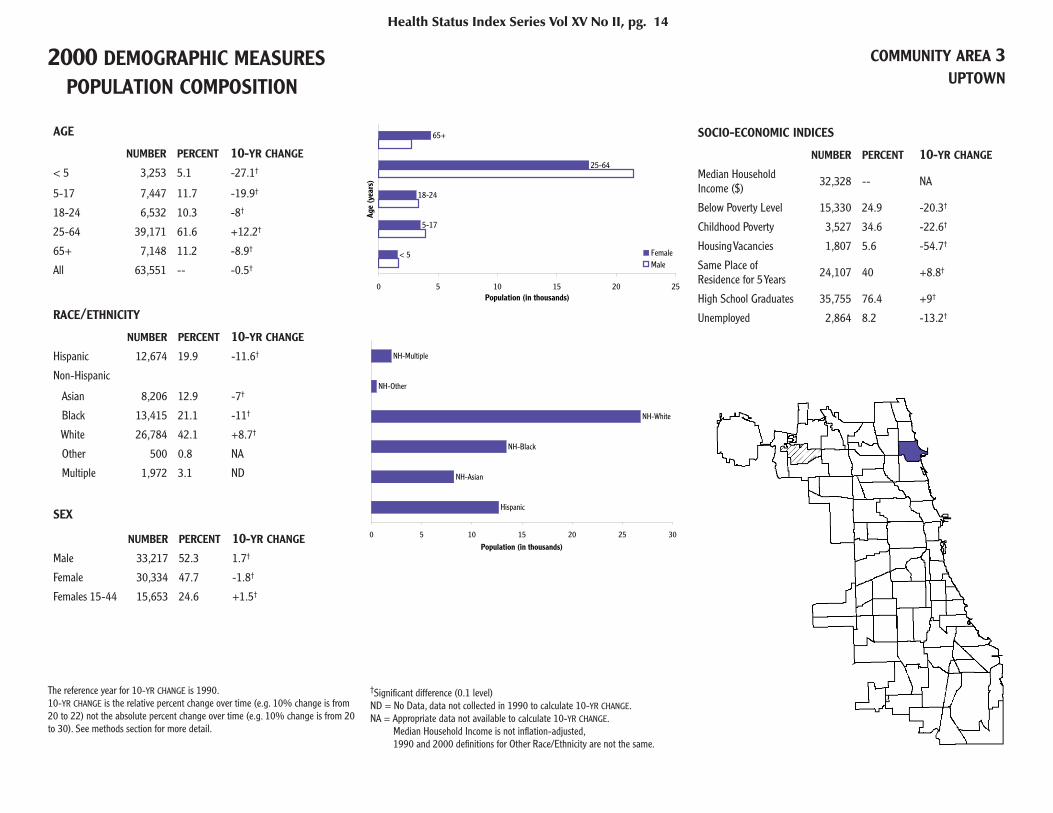
COMMUNITY AREA 3UPTOWN
AGE
NUMBER PERCENT 10-YR CHANGE < 5 3,253 5.1 -27.1†
5-17 7,447 11.7 -19.9†
18-24 6,532 10.3 -8†
25-64 39,171 61.6 +12.2†
65+ 7,148 11.2 -8.9†
All 63,551 -- -0.5†
RACE/ETHNICITY
NUMBER PERCENT 10-YR CHANGE Hispanic 12,674 19.9 -11.6†
Non-Hispanic
Asian 8,206 12.9 -7†
Black 13,415 21.1 -11†
White 26,784 42.1 +8.7†
Other 500 0.8 NA
Multiple 1,972 3.1 ND
SEX
NUMBER PERCENT 10-YR CHANGE Male 33,217 52.3 1.7†
Female 30,334 47.7 -1.8†
Females 15-44 15,653 24.6 +1.5†
SOCIO-ECONOMIC INDICES
NUMBER PERCENT 10-YR CHANGE
Median Household Income ($) 32,328 -- NA
Below Poverty Level 15,330 24.9 -20.3†
Childhood Poverty 3,527 34.6 -22.6†
Housing Vacancies 1,807 5.6 -54.7†
Same Place of Residence for 5 Years 24,107 40 +8.8†
High School Graduates 35,755 76.4 +9†
Unemployed 2,864 8.2 -13.2†
Health Status Index Series Vol XV No II, pg. 14
< 5
5-17
18-24
25-64
65+
0 5 10 15 20 25
Age
(yea
rs)
Population (in thousands)
FemaleMale
Hispanic
NH-Asian
NH-Black
NH-White
NH-Other
NH-Multiple
0 5 10 15 20 25 30
Population (in thousands)
The reference year for 10-YR CHANGE is 1990.10-YR CHANGE is the relative percent change over time (e.g. 10% change is from 20 to 22) not the absolute percent change over time (e.g. 10% change is from 20 to 30). See methods section for more detail.
†Signifi cant difference (0.1 level)ND = No Data, data not collected in 1990 to calculate 10-YR CHANGE.NA = Appropriate data not available to calculate 10-YR CHANGE. Median Household Income is not infl ation-adjusted, 1990 and 2000 defi nitions for Other Race/Ethnicity are not the same.

2003 HEALTH MEASURES COMMUNITY AREA 3UPTOWN
2003 ALL-CAUSE MORTALITY: 602 DEATHS,1,010.7 PER 100,000, 26.9%† DECREASE FROM 1993.2003 BIRTHS: 774 BIRTHS, FERTILITY RATE IS49.4 PER 1000, 36.8%† DECREASE FROM 1993.
INFECTIOUS DISEASE
NUMBER RATE 10-YR CHANGE HIV/AIDS Deaths 22 35.4 -82†
AIDS Cases (ages 13 and older) 787 1417 +92.9†
Chlamydia 227 357.2 ND
Gonorrhea 138 217.1 ND
Syphilis 40 62.9 ND
Infl uenza and Pneumonia Deaths 29 46.8 +22.2
Tuberculosis 15 23.6§ -59.3†
Hepatitis C 47 74 ND
DISABILITIES (2000 CENSUS)
NUMBER PERCENT
Blind/Deaf 1,996 3.3
Physical 5,306 8.8
Mental 4,650 7.7
Requires Care 2,446 4.1
Home-Bound 6,555 12.2
Unable to Work 7,509 16.1
MATERNAL HEALTH
NUMBER PCT 10-YR CHANGE First Trimester Prenatal Care 582 75.2 +28.1†
Smoking 26 3.4 -57.6†
Caesarean Section 167 21.6 +24.4†
INFANT AND CHILD HEALTH
NUMBER RATE/PCT 10-YR CHANGE Very Low Birthweight (P) 8 1§ -53.6†
Premature Birth (P) 62 8 -18.5†
Fetal Mortality (R) #
Infant Mortality (R) 5 6.5§ -13.1
Lead Screening
Screened (P) 1,760 38.9 ND
Elevated(P) 81 4.6 ND
CANCER DEATHS
NUMBER RATE 10-YR CHANGE All-cancers 103 181.4 -22.2†
Breast 6 * --
Colon 12 * --
Lung 27 48.1 -37†
Prostate 2 * --
UNNATURAL CAUSES OF DEATH
NUMBER RATE 10-YR CHANGE Accidents 14 * --
Homicide 10 * --
Suicide 5 * --
CHRONIC DISEASE DEATHS
NUMBER RATE 10-YR CHANGE Heart Disease 196 329.5 -29†
Stroke 33 54.1 -23.2
Lower Respiratory Disease 18 * --
Diabetes Mellitus 26 45.3 --
Liver Disease and Cirrohosis 13 * --
Alzheimer’s Disease 17 * --
Health Status Index Series Vol XV No II, pg. 15
The reference year for 10-YR CHANGE is 1993. 10-YR CHANGE is the relative percent change over time (e.g. 10% change is from 20 to 22) not the absolute percent change over time (e.g. 10% change is from 20 to 30). See methods section for more detail. Calculation of 10-YR CHANGE using 1993 mortality data are comparability-adjusted.
*Rate or percent suppressed because count is less than 5 (or less than 21 for age-adjusted rates).§Use caution when interpreting data based on 20 or fewer events, the rate/percent is unreliable. See methods for more information.
†Signifi cant difference (0.1 level)ND = No Data, data not collected in 1993 to calculate 10-YR CHANGE.# = 2003 fetal mortality data not available at time of publication.
2000 DEMOGRAPHIC MEASURES POPULATION COMPOSITION
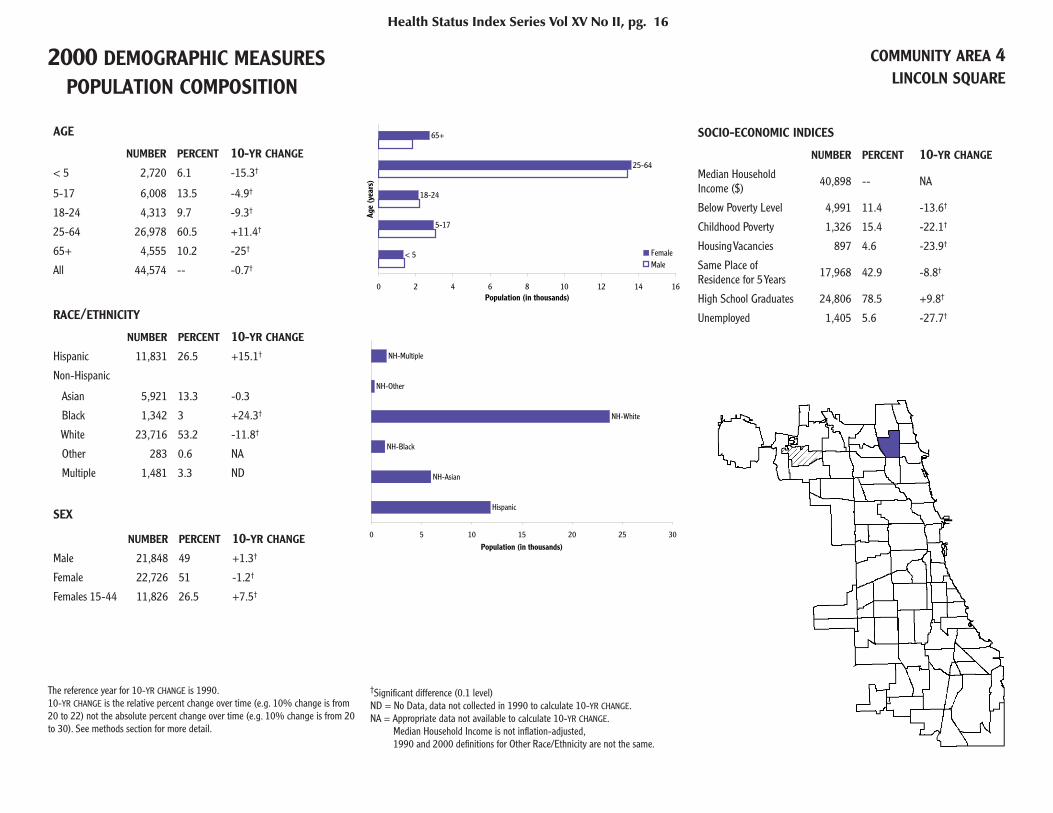
COMMUNITY AREA 4LINCOLN SQUARE
AGE
NUMBER PERCENT 10-YR CHANGE < 5 2,720 6.1 -15.3†
5-17 6,008 13.5 -4.9†
18-24 4,313 9.7 -9.3†
25-64 26,978 60.5 +11.4†
65+ 4,555 10.2 -25†
All 44,574 -- -0.7†
RACE/ETHNICITY
NUMBER PERCENT 10-YR CHANGE Hispanic 11,831 26.5 +15.1†
Non-Hispanic
Asian 5,921 13.3 -0.3
Black 1,342 3 +24.3†
White 23,716 53.2 -11.8†
Other 283 0.6 NA
Multiple 1,481 3.3 ND
SEX
NUMBER PERCENT 10-YR CHANGE Male 21,848 49 +1.3†
Female 22,726 51 -1.2†
Females 15-44 11,826 26.5 +7.5†
SOCIO-ECONOMIC INDICES
NUMBER PERCENT 10-YR CHANGE
Median Household Income ($) 40,898 -- NA
Below Poverty Level 4,991 11.4 -13.6†
Childhood Poverty 1,326 15.4 -22.1†
Housing Vacancies 897 4.6 -23.9†
Same Place of Residence for 5 Years 17,968 42.9 -8.8†
High School Graduates 24,806 78.5 +9.8†
Unemployed 1,405 5.6 -27.7†
Health Status Index Series Vol XV No II, pg. 16
< 5
5-17
18-24
25-64
65+
0 2 4 6 8 10 12 14 16
Age
(yea
rs)
Population (in thousands)
FemaleMale
Hispanic
NH-Asian
NH-Black
NH-White
NH-Other
NH-Multiple
0 5 10 15 20 25 30
Population (in thousands)
The reference year for 10-YR CHANGE is 1990.10-YR CHANGE is the relative percent change over time (e.g. 10% change is from 20 to 22) not the absolute percent change over time (e.g. 10% change is from 20 to 30). See methods section for more detail.
†Signifi cant difference (0.1 level)ND = No Data, data not collected in 1990 to calculate 10-YR CHANGE.NA = Appropriate data not available to calculate 10-YR CHANGE. Median Household Income is not infl ation-adjusted, 1990 and 2000 defi nitions for Other Race/Ethnicity are not the same.
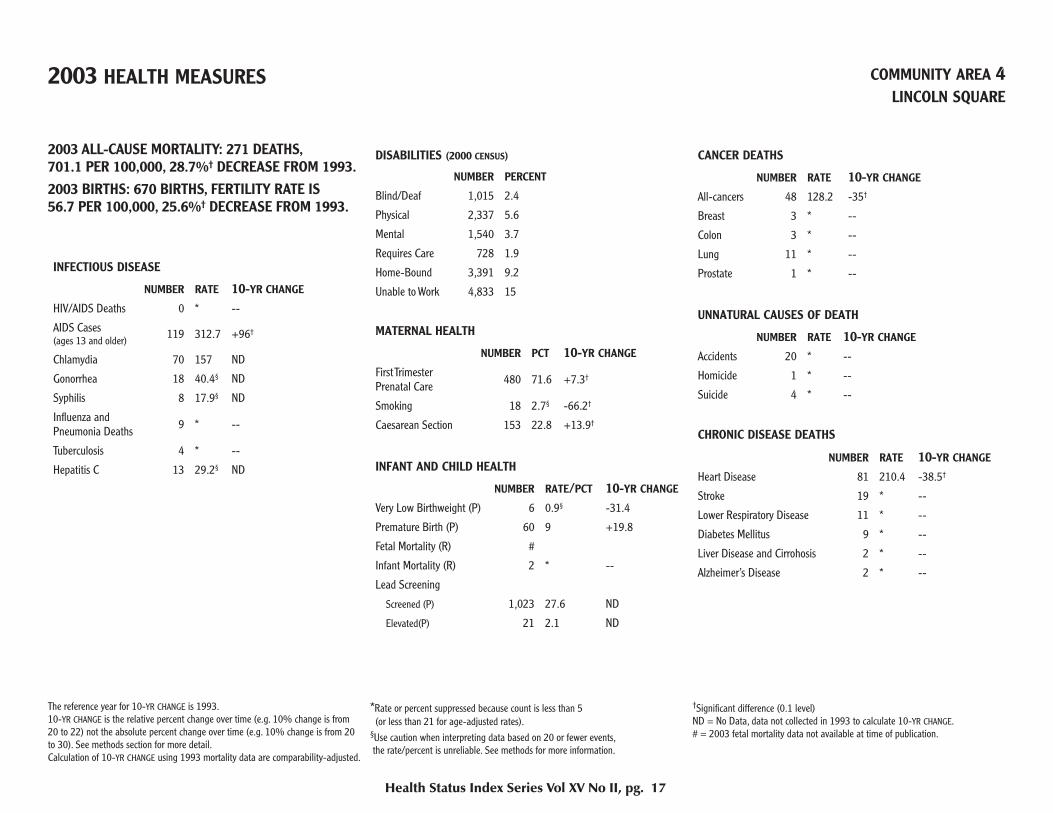
2003 HEALTH MEASURES COMMUNITY AREA 4LINCOLN SQUARE
2003 ALL-CAUSE MORTALITY: 271 DEATHS,701.1 PER 100,000, 28.7%† DECREASE FROM 1993.2003 BIRTHS: 670 BIRTHS, FERTILITY RATE IS56.7 PER 100,000, 25.6%† DECREASE FROM 1993.
INFECTIOUS DISEASE
NUMBER RATE 10-YR CHANGE HIV/AIDS Deaths 0 * --
AIDS Cases (ages 13 and older) 119 312.7 +96†
Chlamydia 70 157 ND
Gonorrhea 18 40.4§ ND
Syphilis 8 17.9§ ND
Infl uenza and Pneumonia Deaths 9 * --
Tuberculosis 4 * --
Hepatitis C 13 29.2§ ND
DISABILITIES (2000 CENSUS)
NUMBER PERCENT
Blind/Deaf 1,015 2.4
Physical 2,337 5.6
Mental 1,540 3.7
Requires Care 728 1.9
Home-Bound 3,391 9.2
Unable to Work 4,833 15
MATERNAL HEALTH
NUMBER PCT 10-YR CHANGE First Trimester Prenatal Care 480 71.6 +7.3†
Smoking 18 2.7§ -66.2†
Caesarean Section 153 22.8 +13.9†
INFANT AND CHILD HEALTH
NUMBER RATE/PCT 10-YR CHANGE Very Low Birthweight (P) 6 0.9§ -31.4
Premature Birth (P) 60 9 +19.8
Fetal Mortality (R) #
Infant Mortality (R) 2 * --
Lead Screening
Screened (P) 1,023 27.6 ND
Elevated(P) 21 2.1 ND
CANCER DEATHS
NUMBER RATE 10-YR CHANGE All-cancers 48 128.2 -35†
Breast 3 * --
Colon 3 * --
Lung 11 * --
Prostate 1 * --
UNNATURAL CAUSES OF DEATH
NUMBER RATE 10-YR CHANGE Accidents 20 * --
Homicide 1 * --
Suicide 4 * --
CHRONIC DISEASE DEATHS
NUMBER RATE 10-YR CHANGE Heart Disease 81 210.4 -38.5†
Stroke 19 * --
Lower Respiratory Disease 11 * --
Diabetes Mellitus 9 * --
Liver Disease and Cirrohosis 2 * --
Alzheimer’s Disease 2 * --
Health Status Index Series Vol XV No II, pg. 17
The reference year for 10-YR CHANGE is 1993. 10-YR CHANGE is the relative percent change over time (e.g. 10% change is from 20 to 22) not the absolute percent change over time (e.g. 10% change is from 20 to 30). See methods section for more detail. Calculation of 10-YR CHANGE using 1993 mortality data are comparability-adjusted.
*Rate or percent suppressed because count is less than 5 (or less than 21 for age-adjusted rates).§Use caution when interpreting data based on 20 or fewer events, the rate/percent is unreliable. See methods for more information.
†Signifi cant difference (0.1 level)ND = No Data, data not collected in 1993 to calculate 10-YR CHANGE.# = 2003 fetal mortality data not available at time of publication.
2000 DEMOGRAPHIC MEASURES POPULATION COMPOSITION
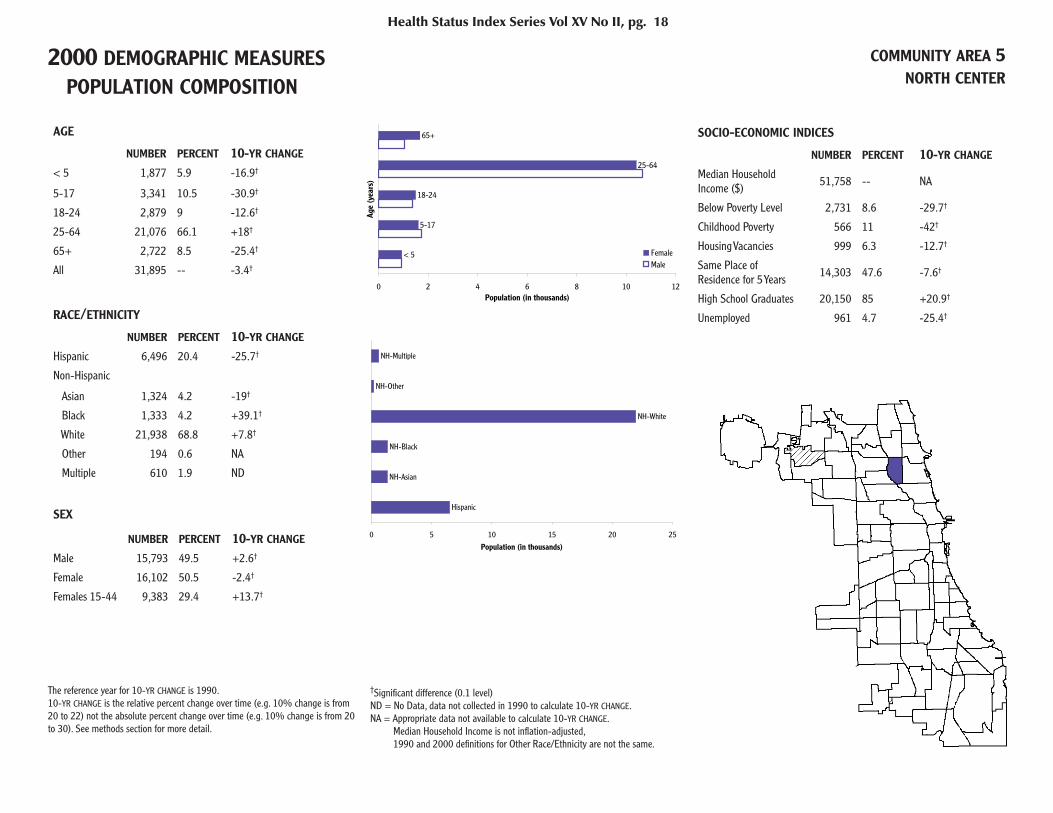
COMMUNITY AREA 5NORTH CENTER
AGE
NUMBER PERCENT 10-YR CHANGE < 5 1,877 5.9 -16.9†
5-17 3,341 10.5 -30.9†
18-24 2,879 9 -12.6†
25-64 21,076 66.1 +18†
65+ 2,722 8.5 -25.4†
All 31,895 -- -3.4†
RACE/ETHNICITY
NUMBER PERCENT 10-YR CHANGE Hispanic 6,496 20.4 -25.7†
Non-Hispanic
Asian 1,324 4.2 -19†
Black 1,333 4.2 +39.1†
White 21,938 68.8 +7.8†
Other 194 0.6 NA
Multiple 610 1.9 ND
SEX
NUMBER PERCENT 10-YR CHANGE Male 15,793 49.5 +2.6†
Female 16,102 50.5 -2.4†
Females 15-44 9,383 29.4 +13.7†
SOCIO-ECONOMIC INDICES
NUMBER PERCENT 10-YR CHANGE
Median Household Income ($) 51,758 -- NA
Below Poverty Level 2,731 8.6 -29.7†
Childhood Poverty 566 11 -42†
Housing Vacancies 999 6.3 -12.7†
Same Place of Residence for 5 Years 14,303 47.6 -7.6†
High School Graduates 20,150 85 +20.9†
Unemployed 961 4.7 -25.4†
Health Status Index Series Vol XV No II, pg. 18
< 5
5-17
18-24
25-64
65+
0 2 4 6 8 10 12
Age
(yea
rs)
Population (in thousands)
FemaleMale
Hispanic
NH-Asian
NH-Black
NH-White
NH-Other
NH-Multiple
0 5 10 15 20 25
Population (in thousands)
The reference year for 10-YR CHANGE is 1990.10-YR CHANGE is the relative percent change over time (e.g. 10% change is from 20 to 22) not the absolute percent change over time (e.g. 10% change is from 20 to 30). See methods section for more detail.
†Signifi cant difference (0.1 level)ND = No Data, data not collected in 1990 to calculate 10-YR CHANGE.NA = Appropriate data not available to calculate 10-YR CHANGE. Median Household Income is not infl ation-adjusted, 1990 and 2000 defi nitions for Other Race/Ethnicity are not the same.

2003 HEALTH MEASURES COMMUNITY AREA 5NORTH CENTER
2003 ALL-CAUSE MORTALITY: 165 DEATHS,734.1 PER 100,000, 26.8%† DECREASE FROM 1993.2003 BIRTHS: 585 BIRTHS, FERTILITY RATE IS62.3 PER 1000, 3.2% DECREASE FROM 1993.
INFECTIOUS DISEASE
NUMBER RATE 10-YR CHANGE HIV/AIDS Deaths 0 * --
AIDS Cases (ages 13 and older) 77 275.9 +80.4†
Chlamydia 46 144.2 ND
Gonorrhea 29 90.9 ND
Syphilis 7 21.9§ ND
Infl uenza and Pneumonia Deaths 3 * --
Tuberculosis 0 * --
Hepatitis C 13 40.8§ ND
DISABILITIES (2000 CENSUS)
NUMBER PERCENT
Blind/Deaf 817 2.7
Physical 1,923 6.4
Mental 1,079 3.6
Requires Care 706 2.4
Home-Bound 2,216 8.1
Unable to Work 2,437 10
MATERNAL HEALTH
NUMBER PCT 10-YR CHANGE First Trimester Prenatal Care 508 86.8 +23.1†
Smoking 13 2.2§ -78.9†
Caesarean Section 139 23.8 +21†
INFANT AND CHILD HEALTH
NUMBER RATE/PCT 10-YR CHANGE Very Low Birthweight (P) 7 1.2§ -56.1†
Premature Birth (P) 67 11.5 -1.6
Fetal Mortality (R) #
Infant Mortality (R) 3 * --
Lead Screening
Screened (P) 634 26.2 ND
Elevated(P) 5 0.8§ ND
CANCER DEATHS
NUMBER RATE 10-YR CHANGE All-cancers 37 164.4 -32.3†
Breast 4 * --
Colon 5 * --
Lung 9 * --
Prostate 2 * --
UNNATURAL CAUSES OF DEATH
NUMBER RATE 10-YR CHANGE Accidents 6 * --
Homicide 1 * --
Suicide 1 * --
CHRONIC DISEASE DEATHS
NUMBER RATE 10-YR CHANGE Heart Disease 53 242.3 -33.1†
Stroke 12 * --
Lower Respiratory Disease 5 * --
Diabetes Mellitus 6 * --
Liver Disease and Cirrohosis 2 * --
Alzheimer’s Disease 2 * --
Health Status Index Series Vol XV No II, pg. 19
The reference year for 10-YR CHANGE is 1993. 10-YR CHANGE is the relative percent change over time (e.g. 10% change is from 20 to 22) not the absolute percent change over time (e.g. 10% change is from 20 to 30). See methods section for more detail. Calculation of 10-YR CHANGE using 1993 mortality data are comparability-adjusted.
*Rate or percent suppressed because count is less than 5 (or less than 21 for age-adjusted rates).§Use caution when interpreting data based on 20 or fewer events, the rate/percent is unreliable. See methods for more information.
†Signifi cant difference (0.1 level)ND = No Data, data not collected in 1993 to calculate 10-YR CHANGE.# = 2003 fetal mortality data not available at time of publication.
2000 DEMOGRAPHIC MEASURES POPULATION COMPOSITION
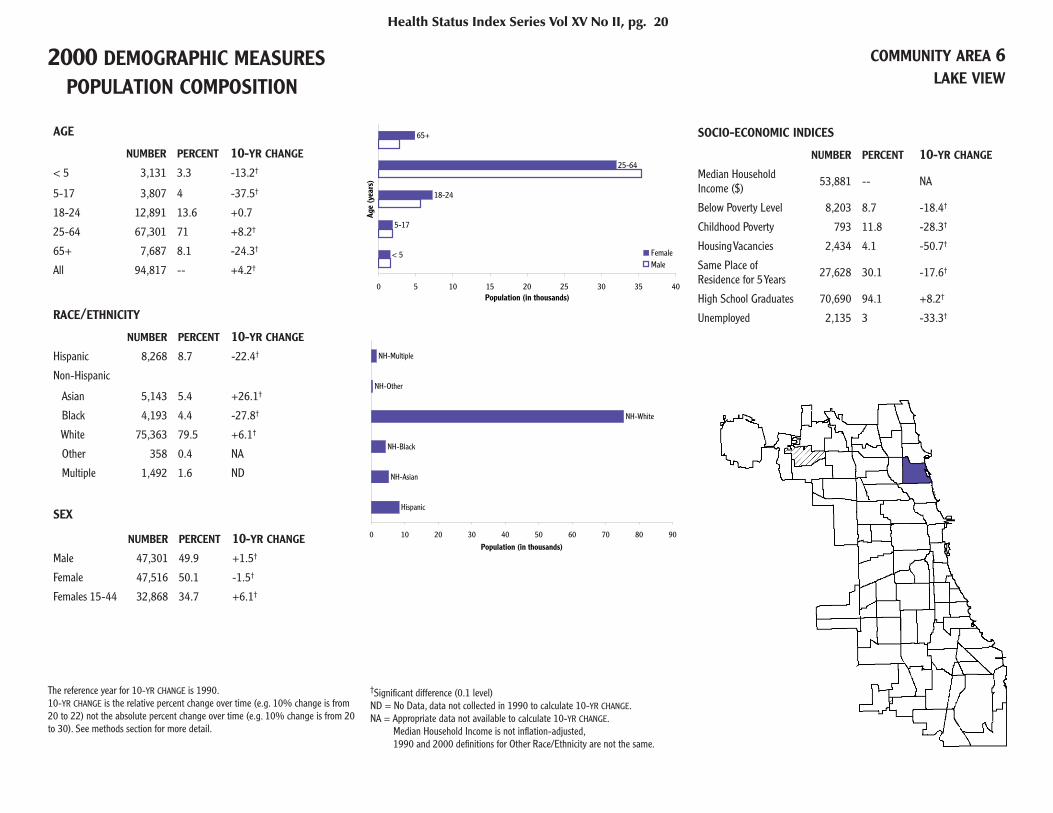
COMMUNITY AREA 6LAKE VIEW
AGE
NUMBER PERCENT 10-YR CHANGE < 5 3,131 3.3 -13.2†
5-17 3,807 4 -37.5†
18-24 12,891 13.6 +0.7
25-64 67,301 71 +8.2†
65+ 7,687 8.1 -24.3†
All 94,817 -- +4.2†
RACE/ETHNICITY
NUMBER PERCENT 10-YR CHANGE Hispanic 8,268 8.7 -22.4†
Non-Hispanic
Asian 5,143 5.4 +26.1†
Black 4,193 4.4 -27.8†
White 75,363 79.5 +6.1†
Other 358 0.4 NA
Multiple 1,492 1.6 ND
SEX
NUMBER PERCENT 10-YR CHANGE Male 47,301 49.9 +1.5†
Female 47,516 50.1 -1.5†
Females 15-44 32,868 34.7 +6.1†
SOCIO-ECONOMIC INDICES
NUMBER PERCENT 10-YR CHANGE
Median Household Income ($) 53,881 -- NA
Below Poverty Level 8,203 8.7 -18.4†
Childhood Poverty 793 11.8 -28.3†
Housing Vacancies 2,434 4.1 -50.7†
Same Place of Residence for 5 Years 27,628 30.1 -17.6†
High School Graduates 70,690 94.1 +8.2†
Unemployed 2,135 3 -33.3†
Health Status Index Series Vol XV No II, pg. 20
< 5
5-17
18-24
25-64
65+
0 5 10 15 20 25 30 35 40
Age
(yea
rs)
Population (in thousands)
FemaleMale
Hispanic
NH-Asian
NH-Black
NH-White
NH-Other
NH-Multiple
0 10 20 30 40 50 60 70 80 90
Population (in thousands)
The reference year for 10-YR CHANGE is 1990.10-YR CHANGE is the relative percent change over time (e.g. 10% change is from 20 to 22) not the absolute percent change over time (e.g. 10% change is from 20 to 30). See methods section for more detail.
†Signifi cant difference (0.1 level)ND = No Data, data not collected in 1990 to calculate 10-YR CHANGE.NA = Appropriate data not available to calculate 10-YR CHANGE. Median Household Income is not infl ation-adjusted, 1990 and 2000 defi nitions for Other Race/Ethnicity are not the same.

2003 HEALTH MEASURES COMMUNITY AREA 6LAKE VIEW
2003 ALL-CAUSE MORTALITY: 443 DEATHS,613.7 PER 100,000, 31.4%† DECREASE FROM 1993.2003 BIRTHS: 1,123 BIRTHS, FERTILITY RATE IS34.2 PER 1000, 11.3%† INCREASE FROM 1993.
INFECTIOUS DISEASE
NUMBER RATE 10-YR CHANGE HIV/AIDS Deaths 13 * --
AIDS Cases(ages 13 and older) 713 799.4 +66.3†
Chlamydia 162 170.9 ND
Gonorrhea 148 156.1 ND
Syphilis 35 36.9 ND
Infl uenza and Pneumonia Deaths 13 * --
Tuberculosis 5 5.3§ -78.1†
Hepatitis C 26 27.4 ND
DISABILITIES (2000 CENSUS)
NUMBER PERCENT
Blind/Deaf 2,020 2.2
Physical 4,148 4.5
Mental 2,426 2.6
Requires Care 1,649 1.8
Home-Bound 3,798 4.3
Unable to Work 5,743 7.1
MATERNAL HEALTH
NUMBER PCT 10-YR CHANGE First Trimester Prenatal Care 964 85.8 +2.2
Smoking 10 0.9§ -85.7†
Caesarean Section 268 23.9 +16.5†
INFANT AND CHILD HEALTH
NUMBER RATE/PCT 10-YR CHANGE Very Low Birthweight (P) 13 1.2§ -3.9
Premature Birth (P) 120 10.7 +50.1†
Fetal Mortality (R) #
Infant Mortality (R) 4 * --
Lead Screening
Screened (P) 913 23.8 ND
Elevated(P) 7 0.8§ ND
CANCER DEATHS
NUMBER RATE 10-YR CHANGE All-cancers 98 151 -18.5†
Breast 8 * --
Colon 10 * --
Lung 22 36.5 -29.3†
Prostate 3 * --
UNNATURAL CAUSES OF DEATH
NUMBER RATE 10-YR CHANGE Accidents 16 * --
Homicide 5 * --
Suicide 3 * --
CHRONIC DISEASE DEATHS
NUMBER RATE 10-YR CHANGE Heart Disease 144 200.8 -26.1†
Stroke 25 35.3 -32.5†
Lower Respiratory Disease 21 32.7 -34.8†
Diabetes Mellitus 11 * --
Liver Disease and Cirrohosis 3 * --
Alzheimer’s Disease 9 * --
Health Status Index Series Vol XV No II, pg. 21
The reference year for 10-YR CHANGE is 1993. 10-YR CHANGE is the relative percent change over time (e.g. 10% change is from 20 to 22) not the absolute percent change over time (e.g. 10% change is from 20 to 30). See methods section for more detail. Calculation of 10-YR CHANGE using 1993 mortality data are comparability-adjusted.
*Rate or percent suppressed because count is less than 5 (or less than 21 for age-adjusted rates).§Use caution when interpreting data based on 20 or fewer events, the rate/percent is unreliable. See methods for more information.
†Signifi cant difference (0.1 level)ND = No Data, data not collected in 1993 to calculate 10-YR CHANGE.# = 2003 fetal mortality data not available at time of publication.
2000 DEMOGRAPHIC MEASURES POPULATION COMPOSITION
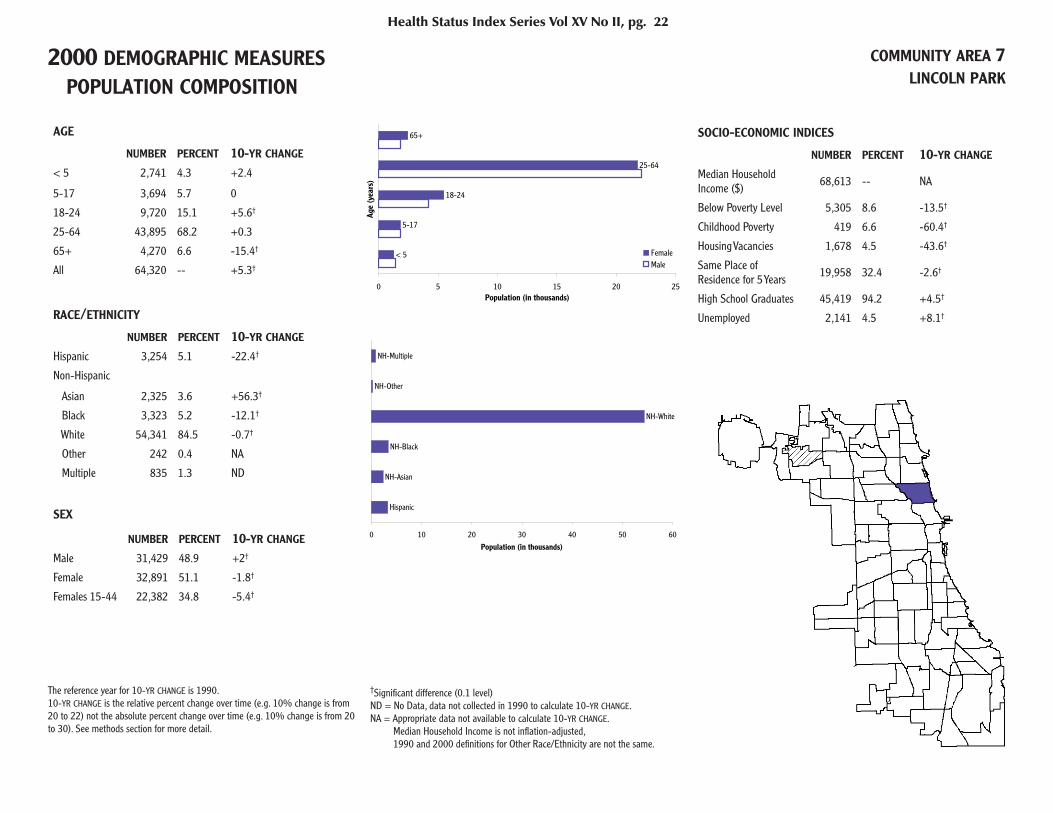
COMMUNITY AREA 7LINCOLN PARK
AGE
NUMBER PERCENT 10-YR CHANGE < 5 2,741 4.3 +2.4
5-17 3,694 5.7 0
18-24 9,720 15.1 +5.6†
25-64 43,895 68.2 +0.3
65+ 4,270 6.6 -15.4†
All 64,320 -- +5.3†
RACE/ETHNICITY
NUMBER PERCENT 10-YR CHANGE Hispanic 3,254 5.1 -22.4†
Non-Hispanic
Asian 2,325 3.6 +56.3†
Black 3,323 5.2 -12.1†
White 54,341 84.5 -0.7†
Other 242 0.4 NA
Multiple 835 1.3 ND
SEX
NUMBER PERCENT 10-YR CHANGE Male 31,429 48.9 +2†
Female 32,891 51.1 -1.8†
Females 15-44 22,382 34.8 -5.4†
SOCIO-ECONOMIC INDICES
NUMBER PERCENT 10-YR CHANGE
Median Household Income ($) 68,613 -- NA
Below Poverty Level 5,305 8.6 -13.5†
Childhood Poverty 419 6.6 -60.4†
Housing Vacancies 1,678 4.5 -43.6†
Same Place of Residence for 5 Years 19,958 32.4 -2.6†
High School Graduates 45,419 94.2 +4.5†
Unemployed 2,141 4.5 +8.1†
Health Status Index Series Vol XV No II, pg. 22
< 5
5-17
18-24
25-64
65+
0 5 10 15 20 25
Age
(yea
rs)
Population (in thousands)
FemaleMale
Hispanic
NH-Asian
NH-Black
NH-White
NH-Other
NH-Multiple
0 10 20 30 40 50 60
Population (in thousands)
The reference year for 10-YR CHANGE is 1990.10-YR CHANGE is the relative percent change over time (e.g. 10% change is from 20 to 22) not the absolute percent change over time (e.g. 10% change is from 20 to 30). See methods section for more detail.
†Signifi cant difference (0.1 level)ND = No Data, data not collected in 1990 to calculate 10-YR CHANGE.NA = Appropriate data not available to calculate 10-YR CHANGE. Median Household Income is not infl ation-adjusted, 1990 and 2000 defi nitions for Other Race/Ethnicity are not the same.

2003 HEALTH MEASURES COMMUNITY AREA 7LINCOLN PARK
2003 ALL-CAUSE MORTALITY: 330 DEATHS,833.2 PER 100,000, 26.2%† DECREASE FROM 1993.2003 BIRTHS: 897 BIRTHS, FERTILITY RATE IS40.1 PER 1000, 30.2%† INCREASE FROM 1993.
INFECTIOUS DISEASE
NUMBER RATE 10-YR CHANGE HIV/AIDS Deaths 6 * --
AIDS Cases (ages 13 and older) 147 248.4 +70.6†
Chlamydia 88 136.8 ND
Gonorrhea 41 63.7 ND
Syphilis < 5 * ND
Infl uenza and Pneumonia Deaths 12 * --
Tuberculosis 1 * --
Hepatitis C 13 20.2§ ND
DISABILITIES (2000 CENSUS)
NUMBER PERCENT
Blind/Deaf 889 1.4
Physical 2,087 3.4
Mental 1,535 2.5
Requires Care 816 1.3
Home-Bound 2,001 3.4
Unable to Work 2,834 5.2
MATERNAL HEALTH
NUMBER PCT 10-YR CHANGE First Trimester Prenatal Care 762 84.9 -7.3†
Smoking 12 1.3§ -71.1†
Caesarean Section 214 23.9 +10.1
INFANT AND CHILD HEALTH
NUMBER RATE/PCT 10-YR CHANGE Very Low Birthweight (P) 7 0.8§ -46
Premature Birth (P) 94 10.5 +9.9
Fetal Mortality (R) #
Infant Mortality (R) 4 * --
Lead Screening
Screened (P) 809 23.7 ND
Elevated(P) 8 1§ ND
CANCER DEATHS
NUMBER RATE 10-YR CHANGE All-cancers 73 190.5 -27.7†
Breast 7 * --
Colon 3 * --
Lung 19 * --
Prostate 4 * --
UNNATURAL CAUSES OF DEATH
NUMBER RATE 10-YR CHANGE Accidents 9 * --
Homicide 3 * --
Suicide 3 * --
CHRONIC DISEASE DEATHS
NUMBER RATE 10-YR CHANGE Heart Disease 81 205.6 -39.3†
Stroke 14 * --
Lower Respiratory Disease 7 * --
Diabetes Mellitus 11 * --
Liver Disease and Cirrohosis 4 * --
Alzheimer’s Disease 9 * --
Health Status Index Series Vol XV No II, pg. 23
The reference year for 10-YR CHANGE is 1993. 10-YR CHANGE is the relative percent change over time (e.g. 10% change is from 20 to 22) not the absolute percent change over time (e.g. 10% change is from 20 to 30). See methods section for more detail. Calculation of 10-YR CHANGE using 1993 mortality data are comparability-adjusted.
*Rate or percent suppressed because count is less than 5 (or less than 21 for age-adjusted rates).§Use caution when interpreting data based on 20 or fewer events, the rate/percent is unreliable. See methods for more information.
†Signifi cant difference (0.1 level)ND = No Data, data not collected in 1993 to calculate 10-YR CHANGE.# = 2003 fetal mortality data not available at time of publication.
2000 DEMOGRAPHIC MEASURES POPULATION COMPOSITION
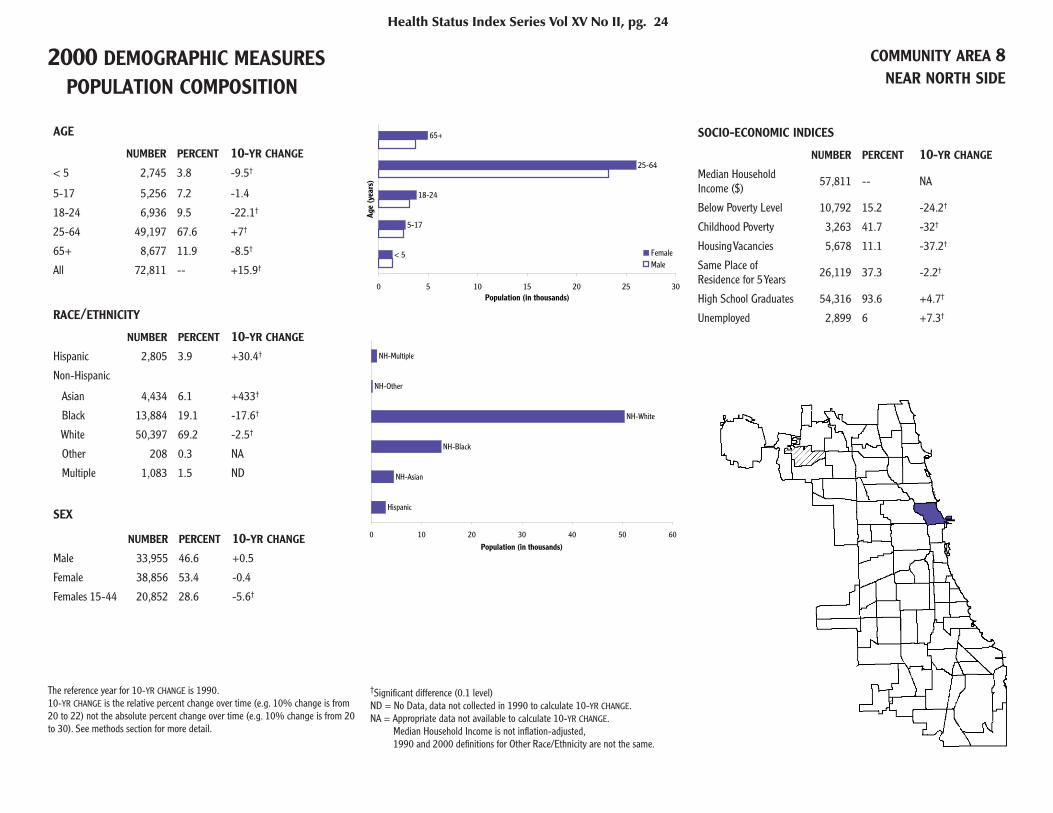
COMMUNITY AREA 8NEAR NORTH SIDE
AGE
NUMBER PERCENT 10-YR CHANGE < 5 2,745 3.8 -9.5†
5-17 5,256 7.2 -1.4
18-24 6,936 9.5 -22.1†
25-64 49,197 67.6 +7†
65+ 8,677 11.9 -8.5†
All 72,811 -- +15.9†
RACE/ETHNICITY
NUMBER PERCENT 10-YR CHANGE Hispanic 2,805 3.9 +30.4†
Non-Hispanic
Asian 4,434 6.1 +433†
Black 13,884 19.1 -17.6†
White 50,397 69.2 -2.5†
Other 208 0.3 NA
Multiple 1,083 1.5 ND
SEX
NUMBER PERCENT 10-YR CHANGE Male 33,955 46.6 +0.5
Female 38,856 53.4 -0.4
Females 15-44 20,852 28.6 -5.6†
SOCIO-ECONOMIC INDICES
NUMBER PERCENT 10-YR CHANGE
Median Household Income ($) 57,811 -- NA
Below Poverty Level 10,792 15.2 -24.2†
Childhood Poverty 3,263 41.7 -32†
Housing Vacancies 5,678 11.1 -37.2†
Same Place of Residence for 5 Years 26,119 37.3 -2.2†
High School Graduates 54,316 93.6 +4.7†
Unemployed 2,899 6 +7.3†
Health Status Index Series Vol XV No II, pg. 24
< 5
5-17
18-24
25-64
65+
0 5 10 15 20 25 30
Age
(yea
rs)
Population (in thousands)
FemaleMale
Hispanic
NH-Asian
NH-Black
NH-White
NH-Other
NH-Multiple
0 10 20 30 40 50 60
Population (in thousands)
The reference year for 10-YR CHANGE is 1990.10-YR CHANGE is the relative percent change over time (e.g. 10% change is from 20 to 22) not the absolute percent change over time (e.g. 10% change is from 20 to 30). See methods section for more detail.
†Signifi cant difference (0.1 level)ND = No Data, data not collected in 1990 to calculate 10-YR CHANGE.NA = Appropriate data not available to calculate 10-YR CHANGE. Median Household Income is not infl ation-adjusted, 1990 and 2000 defi nitions for Other Race/Ethnicity are not the same.

2003 HEALTH MEASURES COMMUNITY AREA 8NEAR NORTH SIDE
2003 ALL-CAUSE MORTALITY: 466 DEATHS,677.2 PER 100,000, 26.3%† DECREASE FROM 1993.2003 BIRTHS: 807 BIRTHS, FERTILITY RATE IS38.7 PER 1000, 3.5% DECREASE FROM 1993.
INFECTIOUS DISEASE
NUMBER RATE 10-YR CHANGE HIV/AIDS Deaths 2 * --
AIDS Cases(ages 13 and older) 222 334.2 +73.9†
Chlamydia 307 421.6 ND
Gonorrhea 201 276.1 ND
Syphilis < 5 * ND
Infl uenza and Pneumonia Deaths 21 31 --
Tuberculosis 7 9.6§ -56.9†
Hepatitis C 24 33 ND
DISABILITIES (2000 CENSUS)
NUMBER PERCENT
Blind/Deaf 1,589 2.3
Physical 3,964 5.7
Mental 2,316 3.3
Requires Care 1,250 1.8
Home-Bound 3,465 5.3
Unable to Work 4,043 7.1
MATERNAL HEALTH
NUMBER PCT 10-YR CHANGE First Trimester Prenatal Care 593 73.5 -7.4†
Smoking 39 4.8 -66.7†
Caesarean Section 177 21.9 +49.8†
INFANT AND CHILD HEALTH
NUMBER RATE/PCT 10-YR CHANGE Very Low Birthweight (P) 21 2.6 +24.4
Premature Birth (P) 97 12 -17.2†
Fetal Mortality (R) #
Infant Mortality (R) 14 17.3§ +20.6
Lead Screening
Screened (P) 1,404 37.6 ND
Elevated(P) 22 1.6 ND
CANCER DEATHS
NUMBER RATE 10-YR CHANGE All-cancers 117 165.4 -21.6†
Breast 11 * --
Colon 14 * --
Lung 23 32.8 -31.1†
Prostate 7 * --
UNNATURAL CAUSES OF DEATH
NUMBER RATE 10-YR CHANGE Accidents 20 * --
Homicide 6 * --
Suicide 9 * --
CHRONIC DISEASE DEATHS
NUMBER RATE 10-YR CHANGE Heart Disease 133 193.6 -27.8†
Stroke 24 34.3 -29.3
Lower Respiratory Disease 7 * --
Diabetes Mellitus 11 * --
Liver Disease and Cirrohosis 3 * --
Alzheimer’s Disease 8 * --
Health Status Index Series Vol XV No II, pg. 25
The reference year for 10-YR CHANGE is 1993. 10-YR CHANGE is the relative percent change over time (e.g. 10% change is from 20 to 22) not the absolute percent change over time (e.g. 10% change is from 20 to 30). See methods section for more detail. Calculation of 10-YR CHANGE using 1993 mortality data are comparability-adjusted.
*Rate or percent suppressed because count is less than 5 (or less than 21 for age-adjusted rates).§Use caution when interpreting data based on 20 or fewer events, the rate/percent is unreliable. See methods for more information.
†Signifi cant difference (0.1 level)ND = No Data, data not collected in 1993 to calculate 10-YR CHANGE.# = 2003 fetal mortality data not available at time of publication.

2000 DEMOGRAPHIC MEASURES POPULATION COMPOSITION
COMMUNITY AREA 9EDISON PARK
AGE
NUMBER PERCENT 10-YR CHANGE < 5 689 6.1 +15.1†
5-17 1,622 14.4 +18†
18-24 615 5.5 -34.5†
25-64 6,066 53.9 +4.3†
65+ 2,267 20.1 -10.7†
All 11,259 -- -1.5†
RACE/ETHNICITY
NUMBER PERCENT 10-YR CHANGE Hispanic 463 4.1 +116.5†
Non-Hispanic
Asian 200 1.8 +37.1†
Black 19 0.2 +542.7†
White 10,503 93.3 -3.6†
Other 11 0.1 NA
Multiple 63 0.6 ND
SEX
NUMBER PERCENT 10-YR CHANGE Male 5,269 46.8 +1.9†
Female 5,990 53.2 -1.6†
Females 15-44 2,244 19.9 -0.9
SOCIO-ECONOMIC INDICES
NUMBER PERCENT 10-YR CHANGE
Median Household Income ($) 57,083 -- NA
Below Poverty Level 270 2.4 +14.5†
Childhood Poverty 33 1.5 +20.3
Housing Vacancies 95 1.9 -20.9†
Same Place of Residence for 5 Years 7,127 67.4 -7.4†
High School Graduates 7,158 86.4 +7.4†
Unemployed 199 3.4 +1.8
Health Status Index Series Vol XV No II, pg. 26
< 5
5-17
18-24
25-64
65+
0 0.5 1 1.5 2 2.5 3 3.5
Age
(yea
rs)
Population (in thousands)
FemaleMale
Hispanic
NH-Asian
NH-Black
NH-White
NH-Other
NH-Multiple
0 2 4 6 8 10 12
Population (in thousands)
The reference year for 10-YR CHANGE is 1990.10-YR CHANGE is the relative percent change over time (e.g. 10% change is from 20 to 22) not the absolute percent change over time (e.g. 10% change is from 20 to 30). See methods section for more detail.
†Signifi cant difference (0.1 level)ND = No Data, data not collected in 1990 to calculate 10-YR CHANGE.NA = Appropriate data not available to calculate 10-YR CHANGE. Median Household Income is not infl ation-adjusted, 1990 and 2000 defi nitions for Other Race/Ethnicity are not the same.
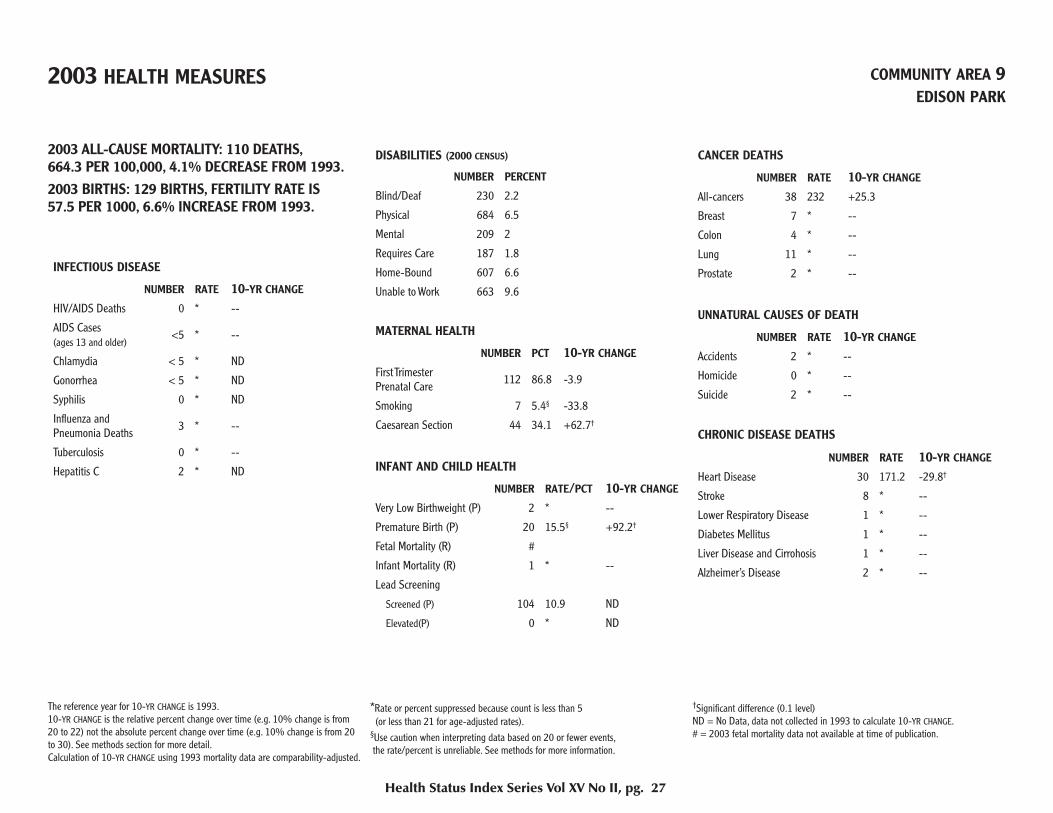
2003 HEALTH MEASURES COMMUNITY AREA 9EDISON PARK
2003 ALL-CAUSE MORTALITY: 110 DEATHS,664.3 PER 100,000, 4.1% DECREASE FROM 1993.2003 BIRTHS: 129 BIRTHS, FERTILITY RATE IS57.5 PER 1000, 6.6% INCREASE FROM 1993.
INFECTIOUS DISEASE
NUMBER RATE 10-YR CHANGE HIV/AIDS Deaths 0 * --
AIDS Cases(ages 13 and older) <5 * --
Chlamydia < 5 * ND
Gonorrhea < 5 * ND
Syphilis 0 * ND
Infl uenza and Pneumonia Deaths 3 * --
Tuberculosis 0 * --
Hepatitis C 2 * ND
DISABILITIES (2000 CENSUS)
NUMBER PERCENT
Blind/Deaf 230 2.2
Physical 684 6.5
Mental 209 2
Requires Care 187 1.8
Home-Bound 607 6.6
Unable to Work 663 9.6
MATERNAL HEALTH
NUMBER PCT 10-YR CHANGE First Trimester Prenatal Care 112 86.8 -3.9
Smoking 7 5.4§ -33.8
Caesarean Section 44 34.1 +62.7†
INFANT AND CHILD HEALTH
NUMBER RATE/PCT 10-YR CHANGE Very Low Birthweight (P) 2 * --
Premature Birth (P) 20 15.5§ +92.2†
Fetal Mortality (R) #
Infant Mortality (R) 1 * --
Lead Screening
Screened (P) 104 10.9 ND
Elevated(P) 0 * ND
CANCER DEATHS
NUMBER RATE 10-YR CHANGE All-cancers 38 232 +25.3
Breast 7 * --
Colon 4 * --
Lung 11 * --
Prostate 2 * --
UNNATURAL CAUSES OF DEATH
NUMBER RATE 10-YR CHANGE Accidents 2 * --
Homicide 0 * --
Suicide 2 * --
CHRONIC DISEASE DEATHS
NUMBER RATE 10-YR CHANGE Heart Disease 30 171.2 -29.8†
Stroke 8 * --
Lower Respiratory Disease 1 * --
Diabetes Mellitus 1 * --
Liver Disease and Cirrohosis 1 * --
Alzheimer’s Disease 2 * --
Health Status Index Series Vol XV No II, pg. 27
The reference year for 10-YR CHANGE is 1993. 10-YR CHANGE is the relative percent change over time (e.g. 10% change is from 20 to 22) not the absolute percent change over time (e.g. 10% change is from 20 to 30). See methods section for more detail. Calculation of 10-YR CHANGE using 1993 mortality data are comparability-adjusted.
*Rate or percent suppressed because count is less than 5 (or less than 21 for age-adjusted rates).§Use caution when interpreting data based on 20 or fewer events, the rate/percent is unreliable. See methods for more information.
†Signifi cant difference (0.1 level)ND = No Data, data not collected in 1993 to calculate 10-YR CHANGE.# = 2003 fetal mortality data not available at time of publication.

2000 DEMOGRAPHIC MEASURES POPULATION COMPOSITION
COMMUNITY AREA 10NORWOOD PARK
AGE
NUMBER PERCENT 10-YR CHANGE < 5 2,152 5.7 +11.8†
5-17 4,834 12.8 +13.3†
18-24 2,178 5.8 -25.6†
25-64 19,835 52.7 +3.1†
65+ 8,670 23 -6.9†
All 37,669 -- -0.1†
RACE/ETHNICITY
NUMBER PERCENT 10-YR CHANGE Hispanic 2,409 6.4 +140†
Non-Hispanic
Asian 1,212 3.2 +73†
Black 332 0.9 +1659.8†
White 33,288 88.4 -7.3†
Other 62 0.2 NA
Multiple 362 1 ND
SEX
NUMBER PERCENT 10-YR CHANGE Male 17,601 46.7 +0.8
Female 20,068 53.3 -0.7
Females 15-44 6,944 18.4 -3.9†
SOCIO-ECONOMIC INDICES
NUMBER PERCENT 10-YR CHANGE
Median Household Income ($) 53,402 -- NA
Below Poverty Level 1,611 4.3 +88.4†
Childhood Poverty 206 3 +164.6†
Housing Vacancies 326 2.1 -9.9†
Same Place of Residence for 5 Years 24,543 69.1 +0.9†
High School Graduates 23,550 82.7 +12.7†
Unemployed 561 3 -24†
Health Status Index Series Vol XV No II, pg. 28
< 5
5-17
18-24
25-64
65+
0 2 4 6 8 10 12
Age
(yea
rs)
Population (in thousands)
FemaleMale
Hispanic
NH-Asian
NH-Black
NH-White
NH-Other
NH-Multiple
0 5 10 15 20 25 30 35 40
Population (in thousands)
The reference year for 10-YR CHANGE is 1990.10-YR CHANGE is the relative percent change over time (e.g. 10% change is from 20 to 22) not the absolute percent change over time (e.g. 10% change is from 20 to 30). See methods section for more detail.
†Signifi cant difference (0.1 level)ND = No Data, data not collected in 1990 to calculate 10-YR CHANGE.NA = Appropriate data not available to calculate 10-YR CHANGE. Median Household Income is not infl ation-adjusted, 1990 and 2000 defi nitions for Other Race/Ethnicity are not the same.

2003 HEALTH MEASURES COMMUNITY AREA 10NORWOOD PARK
2003 ALL-CAUSE MORTALITY: 516 DEATHS,763.1 PER 100,000, 9.3%† DECREASE FROM 1993.2003 BIRTHS: 447 BIRTHS, FERTILITY RATE IS64.4 PER 1000, 11.7%† INCREASE FROM 1993.
INFECTIOUS DISEASE
NUMBER RATE 10-YR CHANGE HIV/AIDS Deaths 1 * --
AIDS Cases(ages 13 and older) 21 64.8 +205.5†
Chlamydia 16 42.7§ ND
Gonorrhea < 5 * ND
Syphilis 0 * ND
Infl uenza and Pneumonia Deaths 22 27.1 --
Tuberculosis 1 * --
Hepatitis C 9 23.9§ ND
DISABILITIES (2000 CENSUS)
NUMBER PERCENT
Blind/Deaf 1,549 4.4
Physical 2,911 8.2
Mental 1,344 3.8
Requires Care 883 2.5
Home-Bound 2,994 9.5
Unable to Work 2,401 10.6
MATERNAL HEALTH
NUMBER PCT 10-YR CHANGE First Trimester Prenatal Care 385 86.1 -5.7†
Smoking 17 3.8§ -61.3†
Caesarean Section 137 30.6 +19.4†
INFANT AND CHILD HEALTH
NUMBER RATE/PCT 10-YR CHANGE Very Low Birthweight (P) 9 2§ +67.9
Premature Birth (P) 50 11.2 +13.8
Fetal Mortality (R) #
Infant Mortality (R) 2 * --
Lead Screening
Screened (P) 366 12.5 ND
Elevated(P) 3 * ND
CANCER DEATHS
NUMBER RATE 10-YR CHANGE All-cancers 113 186.2 -5.7
Breast 12 * --
Colon 14 * --
Lung 27 45.5 -11.1
Prostate 6 * --
UNNATURAL CAUSES OF DEATH
NUMBER RATE 10-YR CHANGE Accidents 11 * --
Homicide 0 * --
Suicide 7 * --
CHRONIC DISEASE DEATHS
NUMBER RATE 10-YR CHANGE Heart Disease 179 250.2 -25.2†
Stroke 36 51.2 -10.2
Lower Respiratory Disease 18 * --
Diabetes Mellitus 7 * --
Liver Disease and Cirrohosis 5 * --
Alzheimer’s Disease 11 * --
Health Status Index Series Vol XV No II, pg. 29
The reference year for 10-YR CHANGE is 1993. 10-YR CHANGE is the relative percent change over time (e.g. 10% change is from 20 to 22) not the absolute percent change over time (e.g. 10% change is from 20 to 30). See methods section for more detail. Calculation of 10-YR CHANGE using 1993 mortality data are comparability-adjusted.
*Rate or percent suppressed because count is less than 5 (or less than 21 for age-adjusted rates).§Use caution when interpreting data based on 20 or fewer events, the rate/percent is unreliable. See methods for more information.
†Signifi cant difference (0.1 level)ND = No Data, data not collected in 1993 to calculate 10-YR CHANGE.# = 2003 fetal mortality data not available at time of publication.

2000 DEMOGRAPHIC MEASURES POPULATION COMPOSITION
COMMUNITY AREA 11JEFFERSON PARK
AGE
NUMBER PERCENT 10-YR CHANGE < 5 1,521 5.9 +9.3†
5-17 3,664 14.2 +22.4†
18-24 1,923 7.4 -6.3†
25-64 14,167 54.8 +4†
65+ 4,584 17.7 -21.3†
All 25,859 -- +9.3†
RACE/ETHNICITY
NUMBER PERCENT 10-YR CHANGE Hispanic 2,881 11.1 +153.1†
Non-Hispanic
Asian 1,237 4.8 -0.2
Black 81 0.3 +363†
White 21,101 81.6 -11.3†
Other 79 0.3 NA
Multiple 480 1.9 ND
SEX
NUMBER PERCENT 10-YR CHANGE Male 12,273 47.5 +1.9†
Female 13,586 52.5 -1.6†
Females 15-44 5,421 21 +0.9
SOCIO-ECONOMIC INDICES
NUMBER PERCENT 10-YR CHANGE
Median Household Income ($) 49,640 -- NA
Below Poverty Level 1,270 4.9 +31†
Childhood Poverty 216 4.3 +2
Housing Vacancies 354 3.3 -1.7
Same Place of Residence for 5 Years 15,680 64.4 +0.7
High School Graduates 15,082 80 +9.8†
Unemployed 427 3.2 -21.8†
Health Status Index Series Vol XV No II, pg. 30
< 5
5-17
18-24
25-64
65+
0 1 2 3 4 5 6 7 8
Age
(yea
rs)
Population (in thousands)
FemaleMale
Hispanic
NH-Asian
NH-Black
NH-White
NH-Other
NH-Multiple
0 5 10 15 20 25
Population (in thousands)
The reference year for 10-YR CHANGE is 1990.10-YR CHANGE is the relative percent change over time (e.g. 10% change is from 20 to 22) not the absolute percent change over time (e.g. 10% change is from 20 to 30). See methods section for more detail.
†Signifi cant difference (0.1 level)ND = No Data, data not collected in 1990 to calculate 10-YR CHANGE.NA = Appropriate data not available to calculate 10-YR CHANGE. Median Household Income is not infl ation-adjusted, 1990 and 2000 defi nitions for Other Race/Ethnicity are not the same.
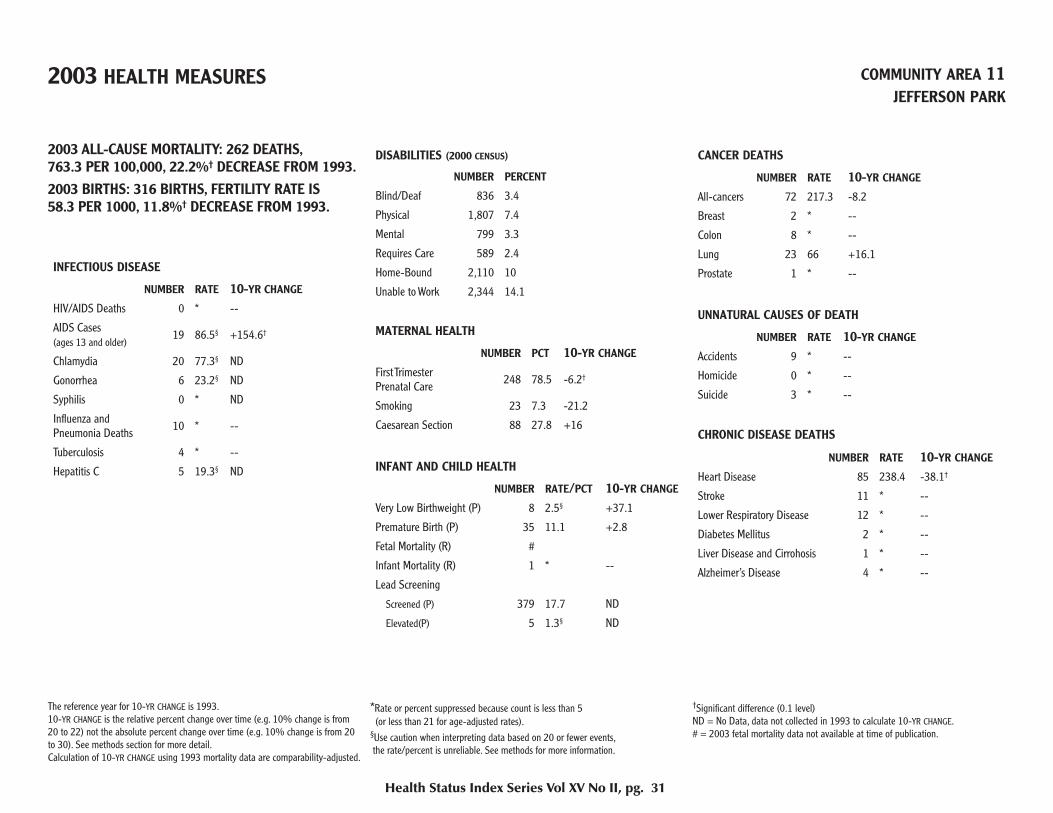
2003 HEALTH MEASURES COMMUNITY AREA 11JEFFERSON PARK
2003 ALL-CAUSE MORTALITY: 262 DEATHS,763.3 PER 100,000, 22.2%† DECREASE FROM 1993.2003 BIRTHS: 316 BIRTHS, FERTILITY RATE IS58.3 PER 1000, 11.8%† DECREASE FROM 1993.
INFECTIOUS DISEASE
NUMBER RATE 10-YR CHANGE HIV/AIDS Deaths 0 * --
AIDS Cases(ages 13 and older) 19 86.5§ +154.6†
Chlamydia 20 77.3§ ND
Gonorrhea 6 23.2§ ND
Syphilis 0 * ND
Infl uenza and Pneumonia Deaths 10 * --
Tuberculosis 4 * --
Hepatitis C 5 19.3§ ND
DISABILITIES (2000 CENSUS)
NUMBER PERCENT
Blind/Deaf 836 3.4
Physical 1,807 7.4
Mental 799 3.3
Requires Care 589 2.4
Home-Bound 2,110 10
Unable to Work 2,344 14.1
MATERNAL HEALTH
NUMBER PCT 10-YR CHANGE First Trimester Prenatal Care 248 78.5 -6.2†
Smoking 23 7.3 -21.2
Caesarean Section 88 27.8 +16
INFANT AND CHILD HEALTH
NUMBER RATE/PCT 10-YR CHANGE Very Low Birthweight (P) 8 2.5§ +37.1
Premature Birth (P) 35 11.1 +2.8
Fetal Mortality (R) #
Infant Mortality (R) 1 * --
Lead Screening
Screened (P) 379 17.7 ND
Elevated(P) 5 1.3§ ND
CANCER DEATHS
NUMBER RATE 10-YR CHANGE All-cancers 72 217.3 -8.2
Breast 2 * --
Colon 8 * --
Lung 23 66 +16.1
Prostate 1 * --
UNNATURAL CAUSES OF DEATH
NUMBER RATE 10-YR CHANGE Accidents 9 * --
Homicide 0 * --
Suicide 3 * --
CHRONIC DISEASE DEATHS
NUMBER RATE 10-YR CHANGE Heart Disease 85 238.4 -38.1†
Stroke 11 * --
Lower Respiratory Disease 12 * --
Diabetes Mellitus 2 * --
Liver Disease and Cirrohosis 1 * --
Alzheimer’s Disease 4 * --
Health Status Index Series Vol XV No II, pg. 31
The reference year for 10-YR CHANGE is 1993. 10-YR CHANGE is the relative percent change over time (e.g. 10% change is from 20 to 22) not the absolute percent change over time (e.g. 10% change is from 20 to 30). See methods section for more detail. Calculation of 10-YR CHANGE using 1993 mortality data are comparability-adjusted.
*Rate or percent suppressed because count is less than 5 (or less than 21 for age-adjusted rates).§Use caution when interpreting data based on 20 or fewer events, the rate/percent is unreliable. See methods for more information.
†Signifi cant difference (0.1 level)ND = No Data, data not collected in 1993 to calculate 10-YR CHANGE.# = 2003 fetal mortality data not available at time of publication.
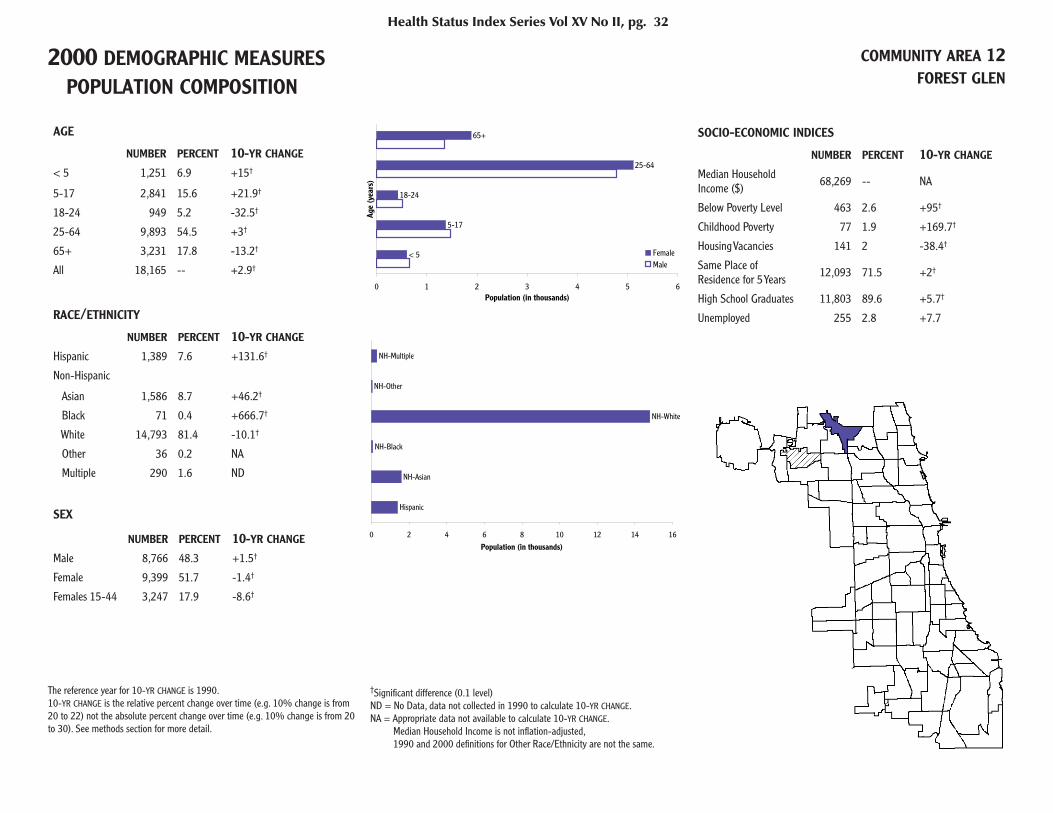
2000 DEMOGRAPHIC MEASURES POPULATION COMPOSITION
COMMUNITY AREA 12FOREST GLEN
AGE
NUMBER PERCENT 10-YR CHANGE < 5 1,251 6.9 +15†
5-17 2,841 15.6 +21.9†
18-24 949 5.2 -32.5†
25-64 9,893 54.5 +3†
65+ 3,231 17.8 -13.2†
All 18,165 -- +2.9†
RACE/ETHNICITY
NUMBER PERCENT 10-YR CHANGE Hispanic 1,389 7.6 +131.6†
Non-Hispanic
Asian 1,586 8.7 +46.2†
Black 71 0.4 +666.7†
White 14,793 81.4 -10.1†
Other 36 0.2 NA
Multiple 290 1.6 ND
SEX
NUMBER PERCENT 10-YR CHANGE Male 8,766 48.3 +1.5†
Female 9,399 51.7 -1.4†
Females 15-44 3,247 17.9 -8.6†
SOCIO-ECONOMIC INDICES
NUMBER PERCENT 10-YR CHANGE
Median Household Income ($) 68,269 -- NA
Below Poverty Level 463 2.6 +95†
Childhood Poverty 77 1.9 +169.7†
Housing Vacancies 141 2 -38.4†
Same Place of Residence for 5 Years 12,093 71.5 +2†
High School Graduates 11,803 89.6 +5.7†
Unemployed 255 2.8 +7.7
Health Status Index Series Vol XV No II, pg. 32
< 5
5-17
18-24
25-64
65+
0 1 2 3 4 5 6
Age
(yea
rs)
Population (in thousands)
FemaleMale
Hispanic
NH-Asian
NH-Black
NH-White
NH-Other
NH-Multiple
0 2 4 6 8 10 12 14 16
Population (in thousands)
The reference year for 10-YR CHANGE is 1990.10-YR CHANGE is the relative percent change over time (e.g. 10% change is from 20 to 22) not the absolute percent change over time (e.g. 10% change is from 20 to 30). See methods section for more detail.
†Signifi cant difference (0.1 level)ND = No Data, data not collected in 1990 to calculate 10-YR CHANGE.NA = Appropriate data not available to calculate 10-YR CHANGE. Median Household Income is not infl ation-adjusted, 1990 and 2000 defi nitions for Other Race/Ethnicity are not the same.

2003 HEALTH MEASURES COMMUNITY AREA 12FOREST GLEN
2003 ALL-CAUSE MORTALITY: 144 DEATHS,535 PER 100,000, 22.9%† DECREASE FROM 1993.2003 BIRTHS: 271 BIRTHS, FERTILITY RATE IS83.5 PER 1000, 23.1%† INCREASE FROM 1993.
INFECTIOUS DISEASE
NUMBER RATE 10-YR CHANGE HIV/AIDS Deaths 0 * --
AIDS Cases(ages 13 and older) 9 59.7§ --
Chlamydia 10 55.1§ ND
Gonorrhea < 5 * ND
Syphilis 0 * ND
Infl uenza and Pneumonia Deaths 4 * --
Tuberculosis 1 * --
Hepatitis C 2 * ND
DISABILITIES (2000 CENSUS)
NUMBER PERCENT
Blind/Deaf 438 2.6
Physical 1,080 6.4
Mental 474 2.8
Requires Care 327 1.9
Home-Bound 1,032 7.1
Unable to Work 1,174 10.5
MATERNAL HEALTH
NUMBER PCT 10-YR CHANGE First Trimester Prenatal Care 230 84.9 -1.7
Smoking 2 * --
Caesarean Section 75 27.7 +19.9
INFANT AND CHILD HEALTH
NUMBER RATE/PCT 10-YR CHANGE Very Low Birthweight (P) 2 * --
Premature Birth (P) 29 10.7 +127.6†
Fetal Mortality (R) #
Infant Mortality (R) 0 * --
Lead Screening
Screened (P) 287 16.7 ND
Elevated(P) 2 * ND
CANCER DEATHS
NUMBER RATE 10-YR CHANGE All-cancers 34 135.6 -27.9†
Breast 5 * --
Colon 1 * --
Lung 10 * --
Prostate 1 * --
UNNATURAL CAUSES OF DEATH
NUMBER RATE 10-YR CHANGE Accidents 1 * --
Homicide 0 * --
Suicide 0 * --
CHRONIC DISEASE DEATHS
NUMBER RATE 10-YR CHANGE Heart Disease 52 190.3 -26†
Stroke 13 * --
Lower Respiratory Disease 4 * --
Diabetes Mellitus 1 * --
Liver Disease and Cirrohosis 1 * --
Alzheimer’s Disease 2 * --
Health Status Index Series Vol XV No II, pg. 33
The reference year for 10-YR CHANGE is 1993. 10-YR CHANGE is the relative percent change over time (e.g. 10% change is from 20 to 22) not the absolute percent change over time (e.g. 10% change is from 20 to 30). See methods section for more detail. Calculation of 10-YR CHANGE using 1993 mortality data are comparability-adjusted.
*Rate or percent suppressed because count is less than 5 (or less than 21 for age-adjusted rates).§Use caution when interpreting data based on 20 or fewer events, the rate/percent is unreliable. See methods for more information.
†Signifi cant difference (0.1 level)ND = No Data, data not collected in 1993 to calculate 10-YR CHANGE.# = 2003 fetal mortality data not available at time of publication.
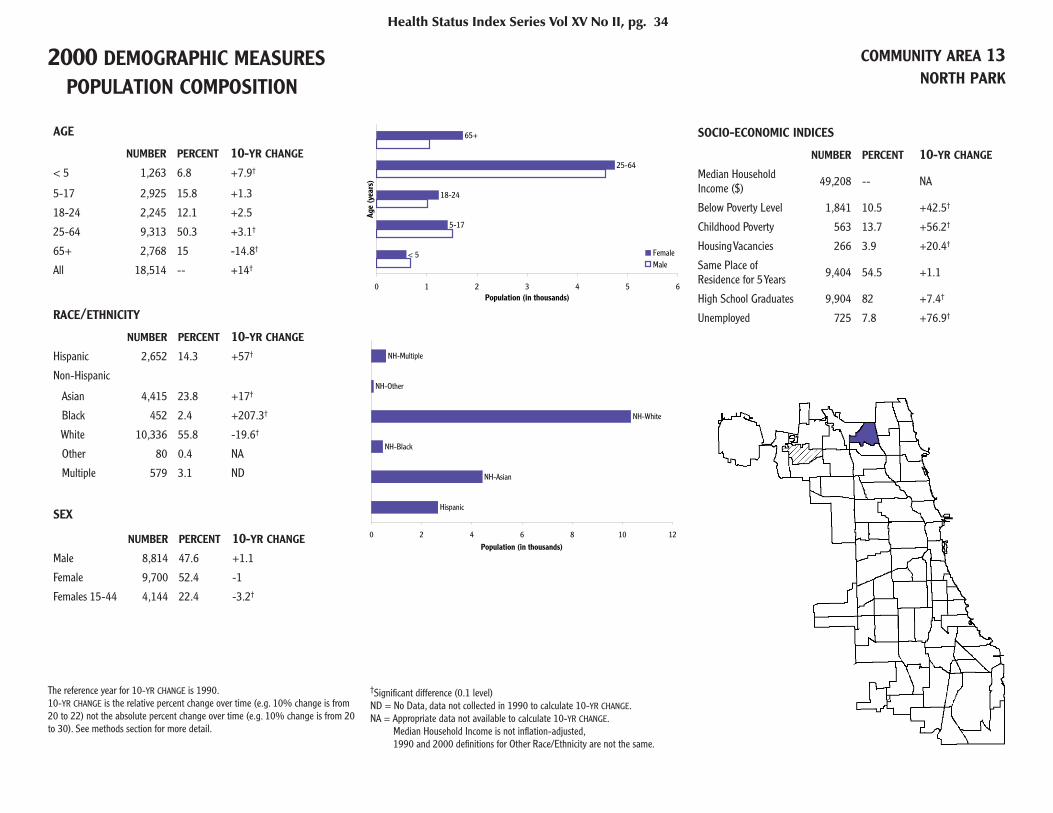
2000 DEMOGRAPHIC MEASURES POPULATION COMPOSITION
COMMUNITY AREA 13NORTH PARK
AGE
NUMBER PERCENT 10-YR CHANGE < 5 1,263 6.8 +7.9†
5-17 2,925 15.8 +1.3
18-24 2,245 12.1 +2.5
25-64 9,313 50.3 +3.1†
65+ 2,768 15 -14.8†
All 18,514 -- +14†
RACE/ETHNICITY
NUMBER PERCENT 10-YR CHANGE Hispanic 2,652 14.3 +57†
Non-Hispanic
Asian 4,415 23.8 +17†
Black 452 2.4 +207.3†
White 10,336 55.8 -19.6†
Other 80 0.4 NA
Multiple 579 3.1 ND
SEX
NUMBER PERCENT 10-YR CHANGE Male 8,814 47.6 +1.1
Female 9,700 52.4 -1
Females 15-44 4,144 22.4 -3.2†
SOCIO-ECONOMIC INDICES
NUMBER PERCENT 10-YR CHANGE
Median Household Income ($) 49,208 -- NA
Below Poverty Level 1,841 10.5 +42.5†
Childhood Poverty 563 13.7 +56.2†
Housing Vacancies 266 3.9 +20.4†
Same Place of Residence for 5 Years 9,404 54.5 +1.1
High School Graduates 9,904 82 +7.4†
Unemployed 725 7.8 +76.9†
Health Status Index Series Vol XV No II, pg. 34
< 5
5-17
18-24
25-64
65+
0 1 2 3 4 5 6
Age
(yea
rs)
Population (in thousands)
FemaleMale
Hispanic
NH-Asian
NH-Black
NH-White
NH-Other
NH-Multiple
0 2 4 6 8 10 12
Population (in thousands)
The reference year for 10-YR CHANGE is 1990.10-YR CHANGE is the relative percent change over time (e.g. 10% change is from 20 to 22) not the absolute percent change over time (e.g. 10% change is from 20 to 30). See methods section for more detail.
†Signifi cant difference (0.1 level)ND = No Data, data not collected in 1990 to calculate 10-YR CHANGE.NA = Appropriate data not available to calculate 10-YR CHANGE. Median Household Income is not infl ation-adjusted, 1990 and 2000 defi nitions for Other Race/Ethnicity are not the same.

2003 HEALTH MEASURES COMMUNITY AREA 13NORTH PARK
2003 ALL-CAUSE MORTALITY: 148 DEATHS,669.9 PER 100,000, 28.9%† DECREASE FROM 1993.2003 BIRTHS: 240 BIRTHS, FERTILITY RATE IS57.9 PER 1000, 18.9%† DECREASE FROM 1993.
INFECTIOUS DISEASE
NUMBER RATE 10-YR CHANGE HIV/AIDS Deaths 0 * --
AIDS Cases(ages 13 and older) 22 142.5 +77.2†
Chlamydia 21 113.4 ND
Gonorrhea 9 48.6§ ND
Syphilis 0 * ND
Infl uenza and Pneumonia Deaths 7 * --
Tuberculosis 6 32.4§ --
Hepatitis C 5 27§ ND
DISABILITIES (2000 CENSUS)
NUMBER PERCENT
Blind/Deaf 477 2.8
Physical 1,141 6.6
Mental 604 3.5
Requires Care 481 2.8
Home-Bound 1,859 12.6
Unable to Work 1,720 14.3
MATERNAL HEALTH
NUMBER PCT 10-YR CHANGE First Trimester Prenatal Care 152 63.3 -16.8†
Smoking 5 2.1§ -70.6†
Caesarean Section 55 22.9 -2.5
INFANT AND CHILD HEALTH
NUMBER RATE/PCT 10-YR CHANGE Very Low Birthweight (P) 3 * --
Premature Birth (P) 21 8.8 +37.9
Fetal Mortality (R) #
Infant Mortality (R) 2 * --
Lead Screening
Screened (P) 447 25.9 ND
Elevated(P) 11 2.5§ ND
CANCER DEATHS
NUMBER RATE 10-YR CHANGE All-cancers 42 197.7 +7.4
Breast 3 * --
Colon 6 * --
Lung 11 * --
Prostate 0 * --
UNNATURAL CAUSES OF DEATH
NUMBER RATE 10-YR CHANGE Accidents 2 * --
Homicide 0 * --
Suicide 1 * --
CHRONIC DISEASE DEATHS
NUMBER RATE 10-YR CHANGE Heart Disease 45 200.1 -46.2†
Stroke 10 * --
Lower Respiratory Disease 3 * --
Diabetes Mellitus 7 * --
Liver Disease and Cirrohosis 1 * --
Alzheimer’s Disease 1 * --
Health Status Index Series Vol XV No II, pg. 35
The reference year for 10-YR CHANGE is 1993. 10-YR CHANGE is the relative percent change over time (e.g. 10% change is from 20 to 22) not the absolute percent change over time (e.g. 10% change is from 20 to 30). See methods section for more detail. Calculation of 10-YR CHANGE using 1993 mortality data are comparability-adjusted.
*Rate or percent suppressed because count is less than 5 (or less than 21 for age-adjusted rates).§Use caution when interpreting data based on 20 or fewer events, the rate/percent is unreliable. See methods for more information.
†Signifi cant difference (0.1 level)ND = No Data, data not collected in 1993 to calculate 10-YR CHANGE.# = 2003 fetal mortality data not available at time of publication.
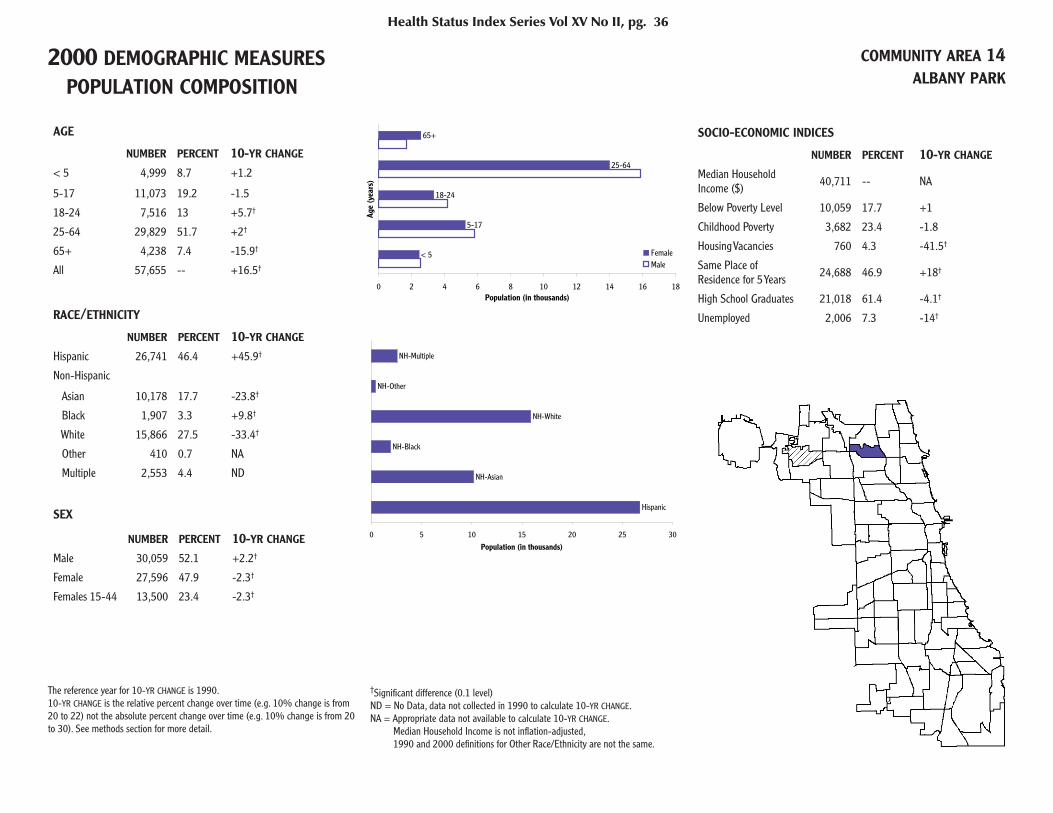
2000 DEMOGRAPHIC MEASURES POPULATION COMPOSITION
COMMUNITY AREA 14ALBANY PARK
AGE
NUMBER PERCENT 10-YR CHANGE < 5 4,999 8.7 +1.2
5-17 11,073 19.2 -1.5
18-24 7,516 13 +5.7†
25-64 29,829 51.7 +2†
65+ 4,238 7.4 -15.9†
All 57,655 -- +16.5†
RACE/ETHNICITY
NUMBER PERCENT 10-YR CHANGE Hispanic 26,741 46.4 +45.9†
Non-Hispanic
Asian 10,178 17.7 -23.8†
Black 1,907 3.3 +9.8†
White 15,866 27.5 -33.4†
Other 410 0.7 NA
Multiple 2,553 4.4 ND
SEX
NUMBER PERCENT 10-YR CHANGE Male 30,059 52.1 +2.2†
Female 27,596 47.9 -2.3†
Females 15-44 13,500 23.4 -2.3†
SOCIO-ECONOMIC INDICES
NUMBER PERCENT 10-YR CHANGE
Median Household Income ($) 40,711 -- NA
Below Poverty Level 10,059 17.7 +1
Childhood Poverty 3,682 23.4 -1.8
Housing Vacancies 760 4.3 -41.5†
Same Place of Residence for 5 Years 24,688 46.9 +18†
High School Graduates 21,018 61.4 -4.1†
Unemployed 2,006 7.3 -14†
Health Status Index Series Vol XV No II, pg. 36
< 5
5-17
18-24
25-64
65+
0 2 4 6 8 10 12 14 16 18
Age
(yea
rs)
Population (in thousands)
FemaleMale
Hispanic
NH-Asian
NH-Black
NH-White
NH-Other
NH-Multiple
0 5 10 15 20 25 30
Population (in thousands)
The reference year for 10-YR CHANGE is 1990.10-YR CHANGE is the relative percent change over time (e.g. 10% change is from 20 to 22) not the absolute percent change over time (e.g. 10% change is from 20 to 30). See methods section for more detail.
†Signifi cant difference (0.1 level)ND = No Data, data not collected in 1990 to calculate 10-YR CHANGE.NA = Appropriate data not available to calculate 10-YR CHANGE. Median Household Income is not infl ation-adjusted, 1990 and 2000 defi nitions for Other Race/Ethnicity are not the same.

2003 HEALTH MEASURES COMMUNITY AREA 14ALBANY PARK
2003 ALL-CAUSE MORTALITY: 278 DEATHS,735.6 PER 100,000, 19.6%† DECREASE FROM 1993.2003 BIRTHS: 1,114 BIRTHS, FERTILITY RATE IS82.5 PER 1000, 6.7%† DECREASE FROM 1993.
INFECTIOUS DISEASE
NUMBER RATE 10-YR CHANGE HIV/AIDS Deaths 4 * --
AIDS Cases(ages 13 and older) 101 221.5 +128†
Chlamydia 141 244.6 ND
Gonorrhea 27 46.8 ND
Syphilis 5 8.7§ ND
Infl uenza and Pneumonia Deaths 15 * --
Tuberculosis 15 26§ -44†
Hepatitis C 21 36.4 ND
DISABILITIES (2000 CENSUS)
NUMBER PERCENT
Blind/Deaf 1,356 2.6
Physical 2,962 5.6
Mental 2,110 4
Requires Care 1,368 2.6
Home-Bound 6,155 14.2
Unable to Work 7,743 19.8
MATERNAL HEALTH
NUMBER PCT 10-YR CHANGE First Trimester Prenatal Care 715 64.2 +4.7†
Smoking 23 2.1 -69.5†
Caesarean Section 219 19.7 +3.1
INFANT AND CHILD HEALTH
NUMBER RATE/PCT 10-YR CHANGE Very Low Birthweight (P) 6 0.5§ -68.6†
Premature Birth (P) 87 7.8 -0.1
Fetal Mortality (R) #
Infant Mortality (R) 1 * --
Lead Screening
Screened (P) 2,394 34.9 ND
Elevated(P) 118 4.9 ND
CANCER DEATHS
NUMBER RATE 10-YR CHANGE All-cancers 72 198.8 -1.9
Breast 6 * --
Colon 6 * --
Lung 15 * --
Prostate 3 * --
UNNATURAL CAUSES OF DEATH
NUMBER RATE 10-YR CHANGE Accidents 11 * --
Homicide 5 * --
Suicide 6 * --
CHRONIC DISEASE DEATHS
NUMBER RATE 10-YR CHANGE Heart Disease 63 174.1 -48.6†
Stroke 24 68.4 --
Lower Respiratory Disease 11 * --
Diabetes Mellitus 11 * --
Liver Disease and Cirrohosis 4 * --
Alzheimer’s Disease 3 * --
Health Status Index Series Vol XV No II, pg. 37
The reference year for 10-YR CHANGE is 1993. 10-YR CHANGE is the relative percent change over time (e.g. 10% change is from 20 to 22) not the absolute percent change over time (e.g. 10% change is from 20 to 30). See methods section for more detail. Calculation of 10-YR CHANGE using 1993 mortality data are comparability-adjusted.
*Rate or percent suppressed because count is less than 5 (or less than 21 for age-adjusted rates).§Use caution when interpreting data based on 20 or fewer events, the rate/percent is unreliable. See methods for more information.
†Signifi cant difference (0.1 level)ND = No Data, data not collected in 1993 to calculate 10-YR CHANGE.# = 2003 fetal mortality data not available at time of publication.
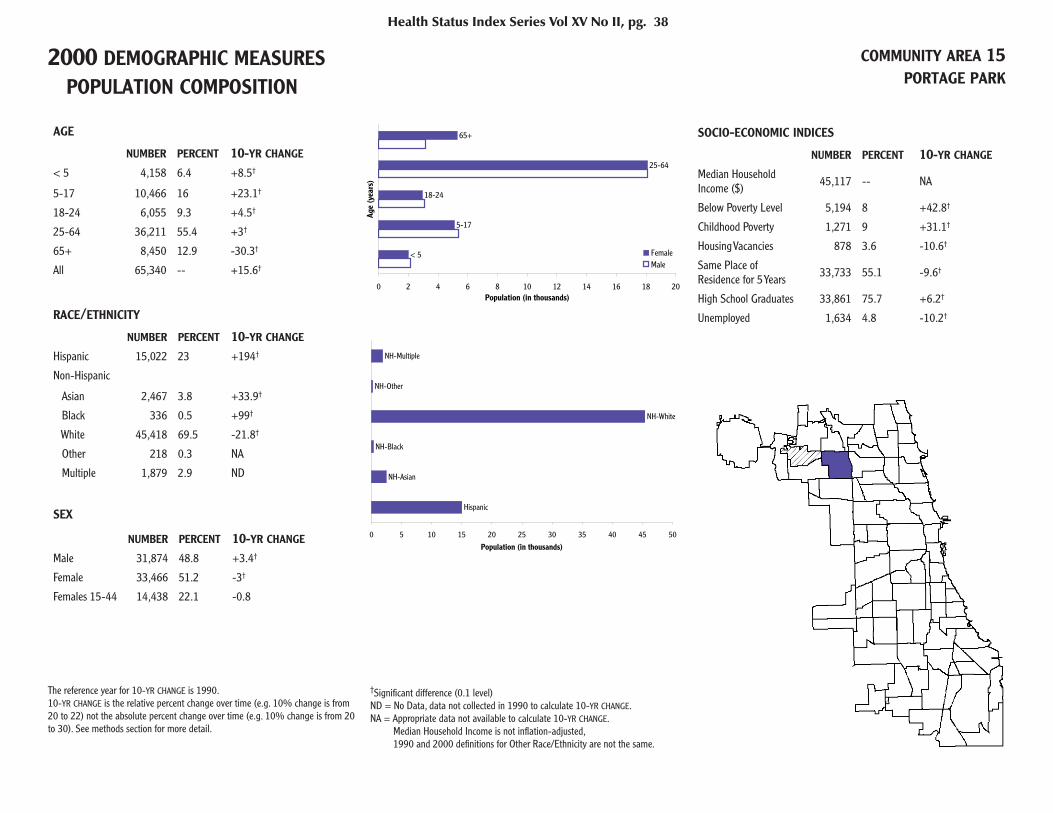
2000 DEMOGRAPHIC MEASURES POPULATION COMPOSITION
COMMUNITY AREA 15PORTAGE PARK
AGE
NUMBER PERCENT 10-YR CHANGE < 5 4,158 6.4 +8.5†
5-17 10,466 16 +23.1†
18-24 6,055 9.3 +4.5†
25-64 36,211 55.4 +3†
65+ 8,450 12.9 -30.3†
All 65,340 -- +15.6†
RACE/ETHNICITY
NUMBER PERCENT 10-YR CHANGE Hispanic 15,022 23 +194†
Non-Hispanic
Asian 2,467 3.8 +33.9†
Black 336 0.5 +99†
White 45,418 69.5 -21.8†
Other 218 0.3 NA
Multiple 1,879 2.9 ND
SEX
NUMBER PERCENT 10-YR CHANGE Male 31,874 48.8 +3.4†
Female 33,466 51.2 -3†
Females 15-44 14,438 22.1 -0.8
SOCIO-ECONOMIC INDICES
NUMBER PERCENT 10-YR CHANGE
Median Household Income ($) 45,117 -- NA
Below Poverty Level 5,194 8 +42.8†
Childhood Poverty 1,271 9 +31.1†
Housing Vacancies 878 3.6 -10.6†
Same Place of Residence for 5 Years 33,733 55.1 -9.6†
High School Graduates 33,861 75.7 +6.2†
Unemployed 1,634 4.8 -10.2†
Health Status Index Series Vol XV No II, pg. 38
< 5
5-17
18-24
25-64
65+
0 2 4 6 8 10 12 14 16 18 20
Age
(yea
rs)
Population (in thousands)
FemaleMale
Hispanic
NH-Asian
NH-Black
NH-White
NH-Other
NH-Multiple
0 5 10 15 20 25 30 35 40 45 50
Population (in thousands)
The reference year for 10-YR CHANGE is 1990.10-YR CHANGE is the relative percent change over time (e.g. 10% change is from 20 to 22) not the absolute percent change over time (e.g. 10% change is from 20 to 30). See methods section for more detail.
†Signifi cant difference (0.1 level)ND = No Data, data not collected in 1990 to calculate 10-YR CHANGE.NA = Appropriate data not available to calculate 10-YR CHANGE. Median Household Income is not infl ation-adjusted, 1990 and 2000 defi nitions for Other Race/Ethnicity are not the same.

2003 HEALTH MEASURES COMMUNITY AREA 15PORTAGE PARK
2003 ALL-CAUSE MORTALITY: 505 DEATHS,750 PER 100,000, 8.5%† DECREASE FROM 1993.2003 BIRTHS: 902 BIRTHS, FERTILITY RATE IS 62.5 PER 1000, 6%† DECREASE FROM 1993.
INFECTIOUS DISEASE
NUMBER RATE 10-YR CHANGE HIV/AIDS Deaths 1 * --
AIDS Cases(ages 13 and older) 43 78.7 +82.3†
Chlamydia 88 134.7 ND
Gonorrhea 25 38.3 ND
Syphilis 0 * ND
Infl uenza and Pneumonia Deaths 10 * --
Tuberculosis 4 * --
Hepatitis C 21 32.1 ND
DISABILITIES (2000 CENSUS)
NUMBER PERCENT
Blind/Deaf 1,714 2.8
Physical 4,711 7.7
Mental 2,571 4.2
Requires Care 1,938 3.2
Home-Bound 6,239 11.9
Unable to Work 6,848 15.6
MATERNAL HEALTH
NUMBER PCT 10-YR CHANGE First Trimester Prenatal Care 686 76.1 -0.8
Smoking 43 4.8 -52.5†
Caesarean Section 196 21.7 +13†
INFANT AND CHILD HEALTH
NUMBER RATE/PCT 10-YR CHANGE Very Low Birthweight (P) 7 0.8§ -18.8
Premature Birth (P) 70 7.8 +18.1
Fetal Mortality (R) #
Infant Mortality (R) 3 * --
Lead Screening
Screened (P) 1,414 24.3 ND
Elevated(P) 26 1.8 ND
CANCER DEATHS
NUMBER RATE 10-YR CHANGE All-cancers 119 177.1 +4.8
Breast 5 * --
Colon 10 * --
Lung 39 58.3 +57.1†
Prostate 11 * --
UNNATURAL CAUSES OF DEATH
NUMBER RATE 10-YR CHANGE Accidents 22 32.6 --
Homicide 3 * --
Suicide 10 * --
CHRONIC DISEASE DEATHS
NUMBER RATE 10-YR CHANGE Heart Disease 168 249 -25.3†
Stroke 31 47 -10.2
Lower Respiratory Disease 17 * --
Diabetes Mellitus 15 * --
Liver Disease and Cirrohosis 5 * --
Alzheimer’s Disease 6 * --
Health Status Index Series Vol XV No II, pg. 39
The reference year for 10-YR CHANGE is 1993. 10-YR CHANGE is the relative percent change over time (e.g. 10% change is from 20 to 22) not the absolute percent change over time (e.g. 10% change is from 20 to 30). See methods section for more detail. Calculation of 10-YR CHANGE using 1993 mortality data are comparability-adjusted.
*Rate or percent suppressed because count is less than 5 (or less than 21 for age-adjusted rates).§Use caution when interpreting data based on 20 or fewer events, the rate/percent is unreliable. See methods for more information.
†Signifi cant difference (0.1 level)ND = No Data, data not collected in 1993 to calculate 10-YR CHANGE.# = 2003 fetal mortality data not available at time of publication.
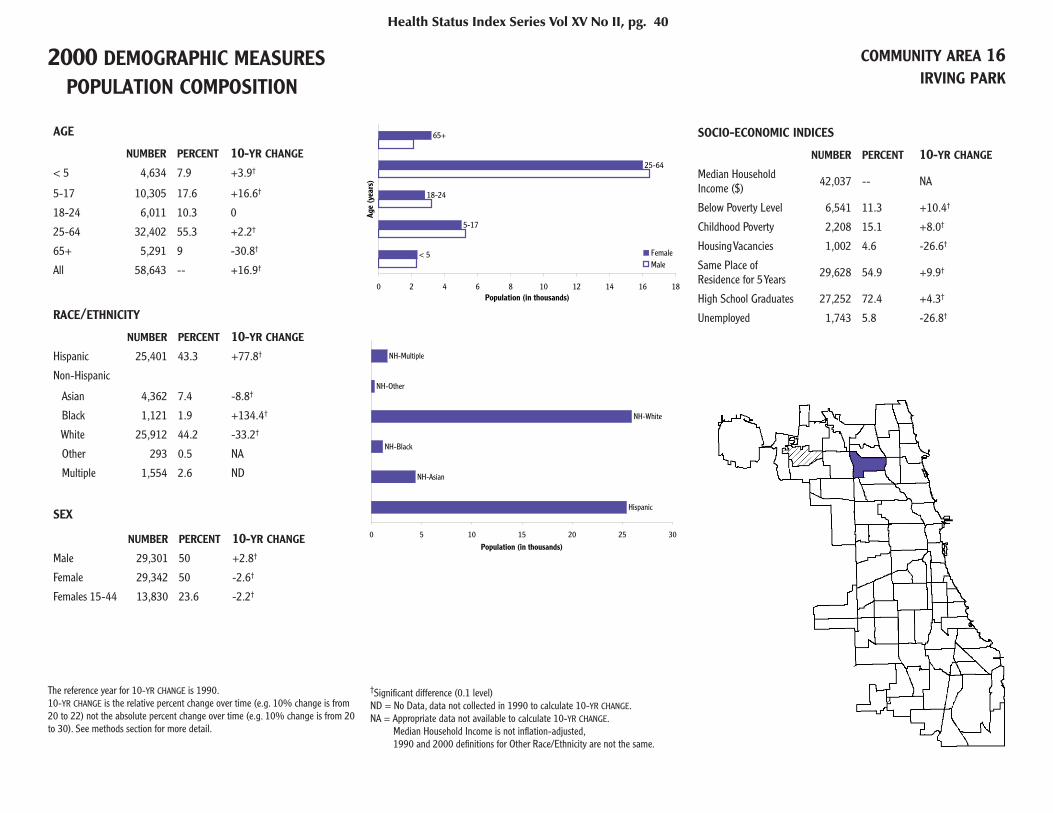
2000 DEMOGRAPHIC MEASURES POPULATION COMPOSITION
COMMUNITY AREA 16IRVING PARK
AGE
NUMBER PERCENT 10-YR CHANGE < 5 4,634 7.9 +3.9†
5-17 10,305 17.6 +16.6†
18-24 6,011 10.3 0
25-64 32,402 55.3 +2.2†
65+ 5,291 9 -30.8†
All 58,643 -- +16.9†
RACE/ETHNICITY
NUMBER PERCENT 10-YR CHANGE Hispanic 25,401 43.3 +77.8†
Non-Hispanic
Asian 4,362 7.4 -8.8†
Black 1,121 1.9 +134.4†
White 25,912 44.2 -33.2†
Other 293 0.5 NA
Multiple 1,554 2.6 ND
SEX
NUMBER PERCENT 10-YR CHANGE Male 29,301 50 +2.8†
Female 29,342 50 -2.6†
Females 15-44 13,830 23.6 -2.2†
SOCIO-ECONOMIC INDICES
NUMBER PERCENT 10-YR CHANGE
Median Household Income ($) 42,037 -- NA
Below Poverty Level 6,541 11.3 +10.4†
Childhood Poverty 2,208 15.1 +8.0†
Housing Vacancies 1,002 4.6 -26.6†
Same Place of Residence for 5 Years 29,628 54.9 +9.9†
High School Graduates 27,252 72.4 +4.3†
Unemployed 1,743 5.8 -26.8†
Health Status Index Series Vol XV No II, pg. 40
< 5
5-17
18-24
25-64
65+
0 2 4 6 8 10 12 14 16 18
Age
(yea
rs)
Population (in thousands)
FemaleMale
Hispanic
NH-Asian
NH-Black
NH-White
NH-Other
NH-Multiple
0 5 10 15 20 25 30
Population (in thousands)
The reference year for 10-YR CHANGE is 1990.10-YR CHANGE is the relative percent change over time (e.g. 10% change is from 20 to 22) not the absolute percent change over time (e.g. 10% change is from 20 to 30). See methods section for more detail.
†Signifi cant difference (0.1 level)ND = No Data, data not collected in 1990 to calculate 10-YR CHANGE.NA = Appropriate data not available to calculate 10-YR CHANGE. Median Household Income is not infl ation-adjusted, 1990 and 2000 defi nitions for Other Race/Ethnicity are not the same.

2003 HEALTH MEASURES COMMUNITY AREA 16IRVING PARK
2003 ALL-CAUSE MORTALITY: 383 DEATHS,852.5 PER 100,000, 12.9%† DECREASE FROM 1993.2003 BIRTHS: 964 BIRTHS, FERTILITY RATE IS69.7 PER 1000, 13.2%† DECREASE FROM 1993.
INFECTIOUS DISEASE
NUMBER RATE 10-YR CHANGE HIV/AIDS Deaths 3 * --
AIDS Cases (ages 13 and older) 95 200.4 +102.5†
Chlamydia 131 223.4 ND
Gonorrhea 20 34.1§ ND
Syphilis < 5 * ND
Infl uenza and Pneumonia Deaths 11 * --
Tuberculosis 8 13.6§ -31.8
Hepatitis C 18 30.7§ ND
DISABILITIES (2000 CENSUS)
NUMBER PERCENT
Blind/Deaf 1,436 2.7
Physical 3,413 6.3
Mental 1,641 3
Requires Care 1,049 1.9
Home-Bound 5,694 12.6
Unable to Work 6,862 17.2
MATERNAL HEALTH
NUMBER PCT 10-YR CHANGE First Trimester Prenatal Care 740 76.8 +7.9†
Smoking 29 3 -73.2†
Caesarean Section 245 25.4 +12.2†
INFANT AND CHILD HEALTH
NUMBER RATE/PCT 10-YR CHANGE Very Low Birthweight (P) 10 1§ -32.8
Premature Birth (P) 84 8.7 +9.9
Fetal Mortality (R) #
Infant Mortality (R) 5 5.2§ -66.4†
Lead Screening
Screened (P) 1,785 28.2 ND
Elevated(P) 57 3.2 ND
CANCER DEATHS
NUMBER RATE 10-YR CHANGE All-cancers 78 174.6 -17.9†
Breast 5 * --
Colon 13 * --
Lung 19 * --
Prostate 4 * --
UNNATURAL CAUSES OF DEATH
NUMBER RATE 10-YR CHANGE Accidents 19 * --
Homicide 9 * --
Suicide 4 * --
CHRONIC DISEASE DEATHS
NUMBER RATE 10-YR CHANGE Heart Disease 125 288.1 -21.9†
Stroke 27 65.3 +26
Lower Respiratory Disease 13 * --
Diabetes Mellitus 13 * --
Liver Disease and Cirrohosis 6 * --
Alzheimer’s Disease 6 * --
Health Status Index Series Vol XV No II, pg. 41
The reference year for 10-YR CHANGE is 1993. 10-YR CHANGE is the relative percent change over time (e.g. 10% change is from 20 to 22) not the absolute percent change over time (e.g. 10% change is from 20 to 30). See methods section for more detail. Calculation of 10-YR CHANGE using 1993 mortality data are comparability-adjusted.
*Rate or percent suppressed because count is less than 5 (or less than 21 for age-adjusted rates).§Use caution when interpreting data based on 20 or fewer events, the rate/percent is unreliable. See methods for more information.
†Signifi cant difference (0.1 level)ND = No Data, data not collected in 1993 to calculate 10-YR CHANGE.# = 2003 fetal mortality data not available at time of publication.
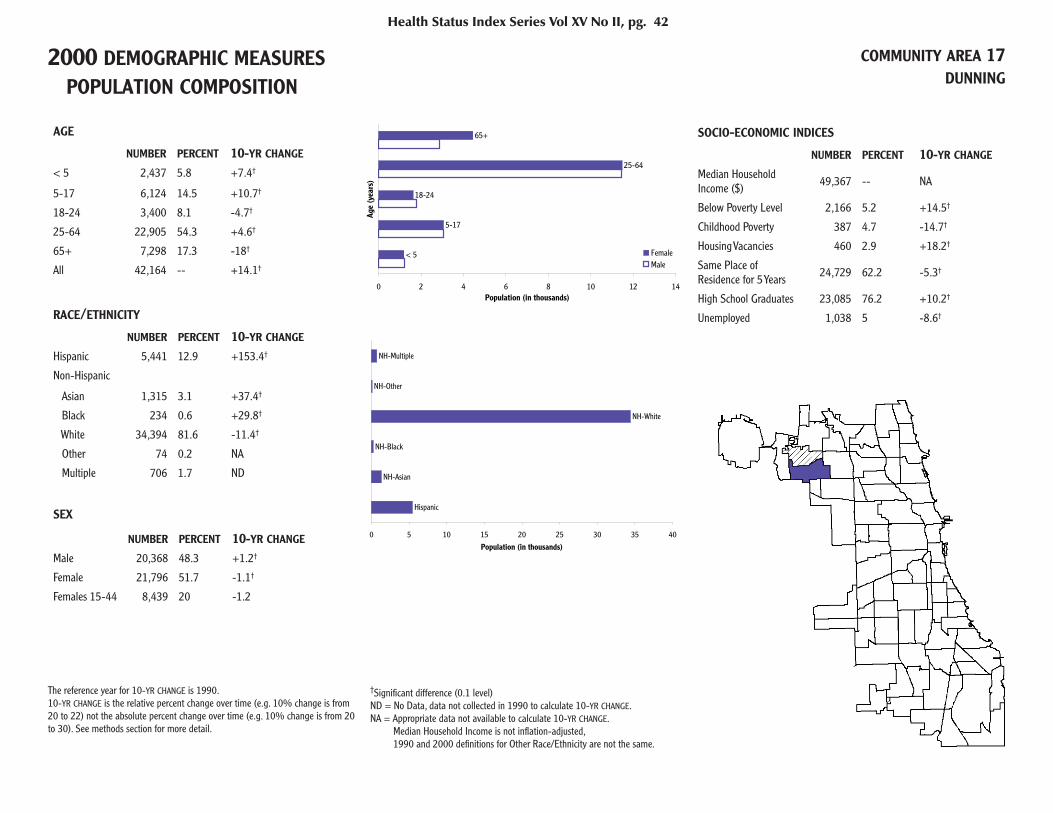
2000 DEMOGRAPHIC MEASURES POPULATION COMPOSITION
COMMUNITY AREA 17DUNNING
AGE
NUMBER PERCENT 10-YR CHANGE < 5 2,437 5.8 +7.4†
5-17 6,124 14.5 +10.7†
18-24 3,400 8.1 -4.7†
25-64 22,905 54.3 +4.6†
65+ 7,298 17.3 -18†
All 42,164 -- +14.1†
RACE/ETHNICITY
NUMBER PERCENT 10-YR CHANGE Hispanic 5,441 12.9 +153.4†
Non-Hispanic
Asian 1,315 3.1 +37.4†
Black 234 0.6 +29.8†
White 34,394 81.6 -11.4†
Other 74 0.2 NA
Multiple 706 1.7 ND
SEX
NUMBER PERCENT 10-YR CHANGE Male 20,368 48.3 +1.2†
Female 21,796 51.7 -1.1†
Females 15-44 8,439 20 -1.2
SOCIO-ECONOMIC INDICES
NUMBER PERCENT 10-YR CHANGE
Median Household Income ($) 49,367 -- NA
Below Poverty Level 2,166 5.2 +14.5†
Childhood Poverty 387 4.7 -14.7†
Housing Vacancies 460 2.9 +18.2†
Same Place of Residence for 5 Years 24,729 62.2 -5.3†
High School Graduates 23,085 76.2 +10.2†
Unemployed 1,038 5 -8.6†
Health Status Index Series Vol XV No II, pg. 42
< 5
5-17
18-24
25-64
65+
0 2 4 6 8 10 12 14
Age
(yea
rs)
Population (in thousands)
FemaleMale
Hispanic
NH-Asian
NH-Black
NH-White
NH-Other
NH-Multiple
0 5 10 15 20 25 30 35 40
Population (in thousands)
The reference year for 10-YR CHANGE is 1990.10-YR CHANGE is the relative percent change over time (e.g. 10% change is from 20 to 22) not the absolute percent change over time (e.g. 10% change is from 20 to 30). See methods section for more detail.
†Signifi cant difference (0.1 level)ND = No Data, data not collected in 1990 to calculate 10-YR CHANGE.NA = Appropriate data not available to calculate 10-YR CHANGE. Median Household Income is not infl ation-adjusted, 1990 and 2000 defi nitions for Other Race/Ethnicity are not the same.

2003 HEALTH MEASURES COMMUNITY AREA 17DUNNING
2003 ALL-CAUSE MORTALITY: 380 DEATHS,695.7 PER 100,000, 21.5%† DECREASE FROM 1993.2003 BIRTHS: 520 BIRTHS, FERTILITY RATE IS61.6 PER 1000, 10.3%† INCREASE FROM 1993.
INFECTIOUS DISEASE
NUMBER RATE 10-YR CHANGE HIV/AIDS Deaths 2 * --
AIDS Cases (ages 13 and older) 25 69.6 +123†
Chlamydia 32 75.9 ND
Gonorrhea < 5 * ND
Syphilis 0 * ND
Infl uenza and Pneumonia Deaths 14 * --
Tuberculosis 2 * --
Hepatitis C 9 21.3§ ND
DISABILITIES (2000 CENSUS)
NUMBER PERCENT
Blind/Deaf 1,446 3.6
Physical 3,037 7.6
Mental 1,399 3.5
Requires Care 982 2.5
Home-Bound 3,655 10.6
Unable to Work 3,720 13.7
MATERNAL HEALTH
NUMBER PCT 10-YR CHANGE First Trimester Prenatal Care 417 80.2 -5.6†
Smoking 28 5.4 -56.7†
Caesarean Section 142 27.3 +2.8
INFANT AND CHILD HEALTH
NUMBER RATE/PCT 10-YR CHANGE Very Low Birthweight (P) 11 2.1§ -1.8
Premature Birth (P) 52 10 +44.1†
Fetal Mortality (R) #
Infant Mortality (R) 2 * --
Lead Screening
Screened (P) 551 16.3 ND
Elevated(P) 3 * ND
CANCER DEATHS
NUMBER RATE 10-YR CHANGE All-cancers 86 155.2 -34.3†
Breast 8 * --
Colon 13 * --
Lung 23 43.2 -36.2†
Prostate 3 * --
UNNATURAL CAUSES OF DEATH
NUMBER RATE 10-YR CHANGE Accidents 15 * --
Homicide 0 * --
Suicide 6 * --
CHRONIC DISEASE DEATHS
NUMBER RATE 10-YR CHANGE Heart Disease 127 230.4 -29.6†
Stroke 29 51.4 +4.2
Lower Respiratory Disease 12 * --
Diabetes Mellitus 11 * --
Liver Disease and Cirrohosis 5 * --
Alzheimer’s Disease 8 * --
Health Status Index Series Vol XV No II, pg. 43
The reference year for 10-YR CHANGE is 1993. 10-YR CHANGE is the relative percent change over time (e.g. 10% change is from 20 to 22) not the absolute percent change over time (e.g. 10% change is from 20 to 30). See methods section for more detail. Calculation of 10-YR CHANGE using 1993 mortality data are comparability-adjusted.
*Rate or percent suppressed because count is less than 5 (or less than 21 for age-adjusted rates).§Use caution when interpreting data based on 20 or fewer events, the rate/percent is unreliable. See methods for more information.
†Signifi cant difference (0.1 level)ND = No Data, data not collected in 1993 to calculate 10-YR CHANGE.# = 2003 fetal mortality data not available at time of publication.
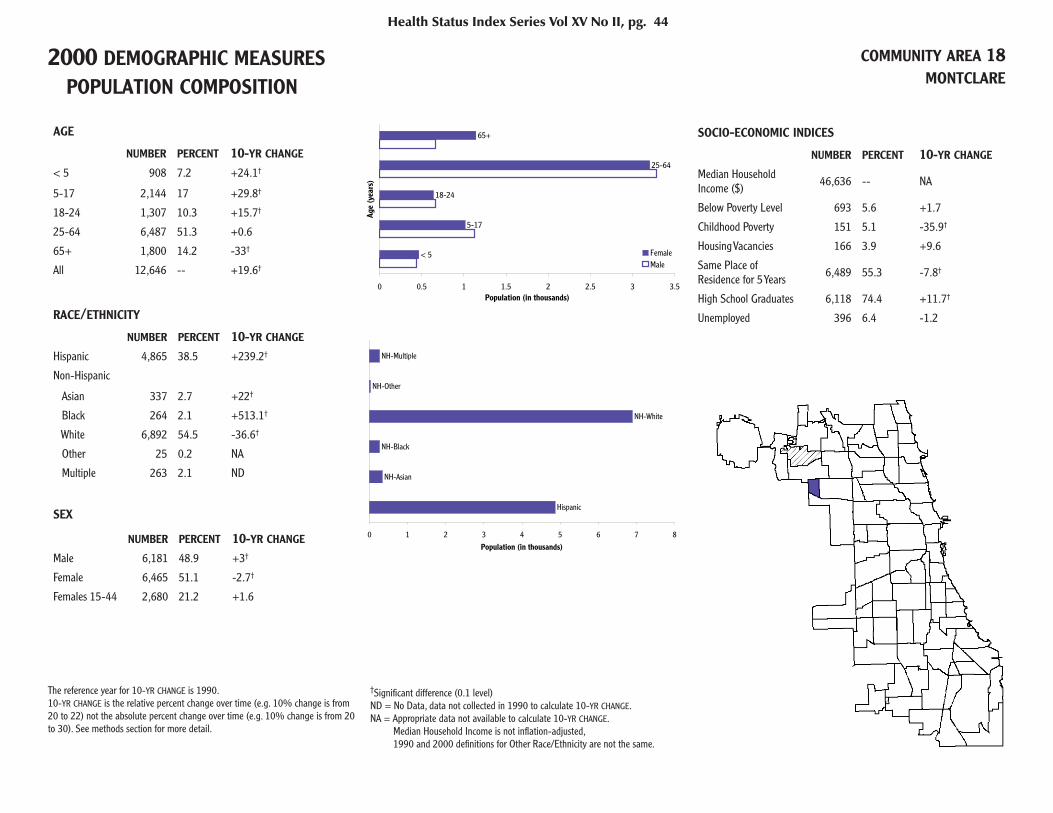
2000 DEMOGRAPHIC MEASURES POPULATION COMPOSITION
COMMUNITY AREA 18MONTCLARE
AGE
NUMBER PERCENT 10-YR CHANGE < 5 908 7.2 +24.1†
5-17 2,144 17 +29.8†
18-24 1,307 10.3 +15.7†
25-64 6,487 51.3 +0.6
65+ 1,800 14.2 -33†
All 12,646 -- +19.6†
RACE/ETHNICITY
NUMBER PERCENT 10-YR CHANGE Hispanic 4,865 38.5 +239.2†
Non-Hispanic
Asian 337 2.7 +22†
Black 264 2.1 +513.1†
White 6,892 54.5 -36.6†
Other 25 0.2 NA
Multiple 263 2.1 ND
SEX
NUMBER PERCENT 10-YR CHANGE Male 6,181 48.9 +3†
Female 6,465 51.1 -2.7†
Females 15-44 2,680 21.2 +1.6
SOCIO-ECONOMIC INDICES
NUMBER PERCENT 10-YR CHANGE
Median Household Income ($) 46,636 -- NA
Below Poverty Level 693 5.6 +1.7
Childhood Poverty 151 5.1 -35.9†
Housing Vacancies 166 3.9 +9.6
Same Place of Residence for 5 Years 6,489 55.3 -7.8†
High School Graduates 6,118 74.4 +11.7†
Unemployed 396 6.4 -1.2
Health Status Index Series Vol XV No II, pg. 44
< 5
5-17
18-24
25-64
65+
0 0.5 1 1.5 2 2.5 3 3.5
Age
(yea
rs)
Population (in thousands)
FemaleMale
Hispanic
NH-Asian
NH-Black
NH-White
NH-Other
NH-Multiple
0 1 2 3 4 5 6 7 8
Population (in thousands)
The reference year for 10-YR CHANGE is 1990.10-YR CHANGE is the relative percent change over time (e.g. 10% change is from 20 to 22) not the absolute percent change over time (e.g. 10% change is from 20 to 30). See methods section for more detail.
†Signifi cant difference (0.1 level)ND = No Data, data not collected in 1990 to calculate 10-YR CHANGE.NA = Appropriate data not available to calculate 10-YR CHANGE. Median Household Income is not infl ation-adjusted, 1990 and 2000 defi nitions for Other Race/Ethnicity are not the same.

2003 HEALTH MEASURES COMMUNITY AREA 18MONTCLARE
2003 ALL-CAUSE MORTALITY: 120 DEATHS,763.5 PER 100,000, 23.9%† DECREASE FROM 1993.2003 BIRTHS: 192 BIRTHS, FERTILITY RATE IS71.6 PER 1000, 12.9% INCREASE FROM 1993.
INFECTIOUS DISEASE
NUMBER RATE 10-YR CHANGE HIV/AIDS Deaths 0 * --
AIDS Cases (ages 13 and older) 10 95.9§ --
Chlamydia 23 181.9 ND
Gonorrhea 8 63.3§ ND
Syphilis < 5 * ND
Infl uenza and Pneumonia Deaths 3 * --
Tuberculosis 2 * --
Hepatitis C 5 39.5§ ND
DISABILITIES (2000 CENSUS)
NUMBER PERCENT
Blind/Deaf 485 4.1
Physical 1,014 8.6
Mental 483 4.1
Requires Care 486 4.1
Home-Bound 1,323 13.3
Unable to Work 1,253 15.4
MATERNAL HEALTH
NUMBER PCT 10-YR CHANGE First Trimester Prenatal Care 157 81.8 -2.2
Smoking 6 3.1§ -72.7†
Caesarean Section 56 29.2 +45.8†
INFANT AND CHILD HEALTH
NUMBER RATE/PCT 10-YR CHANGE Very Low Birthweight (P) 2 * --
Premature Birth (P) 17 8.9§ +24
Fetal Mortality (R) #
Infant Mortality (R) 2 * --
Lead Screening
Screened (P) 318 25.1 ND
Elevated(P) 3 * ND
CANCER DEATHS
NUMBER RATE 10-YR CHANGE All-cancers 26 175.6 -16.9
Breast 2 * --
Colon 4 * --
Lung 10 * --
Prostate 1 * --
UNNATURAL CAUSES OF DEATH
NUMBER RATE 10-YR CHANGE Accidents 2 * --
Homicide 2 * --
Suicide 1 * --
CHRONIC DISEASE DEATHS
NUMBER RATE 10-YR CHANGE Heart Disease 46 273.2 -23.1†
Stroke 3 * --
Lower Respiratory Disease 2 * --
Diabetes Mellitus 5 * --
Liver Disease and Cirrohosis 2 * --
Alzheimer’s Disease 5 * --
Health Status Index Series Vol XV No II, pg. 45
The reference year for 10-YR CHANGE is 1993. 10-YR CHANGE is the relative percent change over time (e.g. 10% change is from 20 to 22) not the absolute percent change over time (e.g. 10% change is from 20 to 30). See methods section for more detail. Calculation of 10-YR CHANGE using 1993 mortality data are comparability-adjusted.
*Rate or percent suppressed because count is less than 5 (or less than 21 for age-adjusted rates).§Use caution when interpreting data based on 20 or fewer events, the rate/percent is unreliable. See methods for more information.
†Signifi cant difference (0.1 level)ND = No Data, data not collected in 1993 to calculate 10-YR CHANGE.# = 2003 fetal mortality data not available at time of publication.
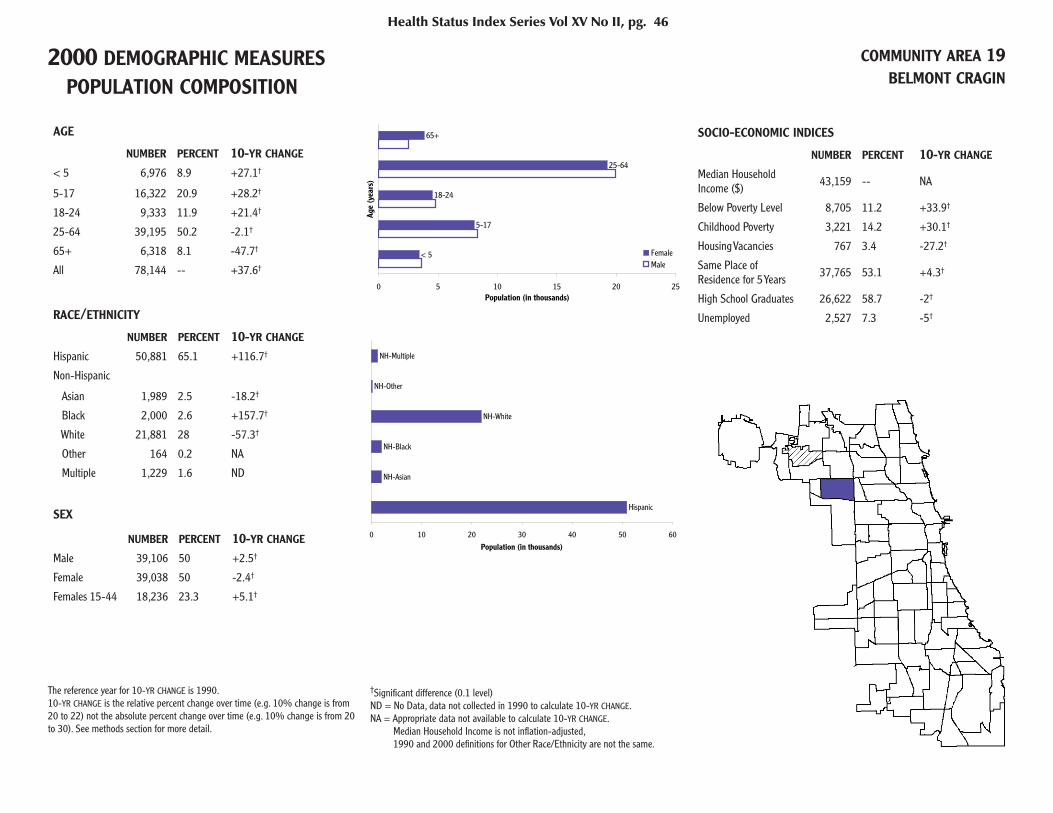
2000 DEMOGRAPHIC MEASURES POPULATION COMPOSITION
COMMUNITY AREA 19BELMONT CRAGIN
AGE
NUMBER PERCENT 10-YR CHANGE < 5 6,976 8.9 +27.1†
5-17 16,322 20.9 +28.2†
18-24 9,333 11.9 +21.4†
25-64 39,195 50.2 -2.1†
65+ 6,318 8.1 -47.7†
All 78,144 -- +37.6†
RACE/ETHNICITY
NUMBER PERCENT 10-YR CHANGE Hispanic 50,881 65.1 +116.7†
Non-Hispanic
Asian 1,989 2.5 -18.2†
Black 2,000 2.6 +157.7†
White 21,881 28 -57.3†
Other 164 0.2 NA
Multiple 1,229 1.6 ND
SEX
NUMBER PERCENT 10-YR CHANGE Male 39,106 50 +2.5†
Female 39,038 50 -2.4†
Females 15-44 18,236 23.3 +5.1†
SOCIO-ECONOMIC INDICES
NUMBER PERCENT 10-YR CHANGE
Median Household Income ($) 43,159 -- NA
Below Poverty Level 8,705 11.2 +33.9†
Childhood Poverty 3,221 14.2 +30.1†
Housing Vacancies 767 3.4 -27.2†
Same Place of Residence for 5 Years 37,765 53.1 +4.3†
High School Graduates 26,622 58.7 -2†
Unemployed 2,527 7.3 -5†
Health Status Index Series Vol XV No II, pg. 46
< 5
5-17
18-24
25-64
65+
0 5 10 15 20 25
Age
(yea
rs)
Population (in thousands)
FemaleMale
Hispanic
NH-Asian
NH-Black
NH-White
NH-Other
NH-Multiple
0 10 20 30 40 50 60
Population (in thousands)
The reference year for 10-YR CHANGE is 1990.10-YR CHANGE is the relative percent change over time (e.g. 10% change is from 20 to 22) not the absolute percent change over time (e.g. 10% change is from 20 to 30). See methods section for more detail.
†Signifi cant difference (0.1 level)ND = No Data, data not collected in 1990 to calculate 10-YR CHANGE.NA = Appropriate data not available to calculate 10-YR CHANGE. Median Household Income is not infl ation-adjusted, 1990 and 2000 defi nitions for Other Race/Ethnicity are not the same.

2003 HEALTH MEASURES COMMUNITY AREA 19BELMONT CRAGIN
2003 ALL-CAUSE MORTALITY: 383 DEATHS,689.5 PER 100,000, 31.6%† DECREASE FROM 1993.2003 BIRTHS: 1,591 BIRTHS, FERTILITY RATE IS87.2 PER 1000, 9.5%† DECREASE FROM 1993.
INFECTIOUS DISEASE
NUMBER RATE 10-YR CHANGE HIV/AIDS Deaths 1 * --
AIDS Cases (ages 13 and older) 77 126.8 +128.9†
Chlamydia 250 319.9 ND
Gonorrhea 46 58.9 ND
Syphilis < 5 * ND
Infl uenza and Pneumonia Deaths 9 * --
Tuberculosis 3 * --
Hepatitis C 23 29.4 ND
DISABILITIES (2000 CENSUS)
NUMBER PERCENT
Blind/Deaf 1,584 2.2
Physical 4,673 6.6
Mental 2,672 3.8
Requires Care 2,028 2.8
Home-Bound 8,740 15.3
Unable to Work 9,293 18.3
MATERNAL HEALTH
NUMBER PCT 10-YR CHANGE First Trimester Prenatal Care 1,209 76 +3†
Smoking 32 2 -72.2†
Caesarean Section 330 20.7 +5.5
INFANT AND CHILD HEALTH
NUMBER RATE/PCT 10-YR CHANGE Very Low Birthweight (P) 9 0.6§ -23.6
Premature Birth (P) 126 7.9 +9.4
Fetal Mortality (R) #
Infant Mortality (R) 8 5§ -32.1
Lead Screening
Screened (P) 3,316 34 ND
Elevated(P) 133 4 ND
CANCER DEATHS
NUMBER RATE 10-YR CHANGE All-cancers 86 156.7 -19.8†
Breast 6 * --
Colon 11 * --
Lung 19 * --
Prostate 7 * --
UNNATURAL CAUSES OF DEATH
NUMBER RATE 10-YR CHANGE Accidents 15 * --
Homicide 11 * --
Suicide 5 * --
CHRONIC DISEASE DEATHS
NUMBER RATE 10-YR CHANGE Heart Disease 136 259.6 -31.9†
Stroke 18 * --
Lower Respiratory Disease 11 * --
Diabetes Mellitus 12 * --
Liver Disease and Cirrohosis 3 * --
Alzheimer’s Disease 2 * --
Health Status Index Series Vol XV No II, pg. 47
The reference year for 10-YR CHANGE is 1993. 10-YR CHANGE is the relative percent change over time (e.g. 10% change is from 20 to 22) not the absolute percent change over time (e.g. 10% change is from 20 to 30). See methods section for more detail. Calculation of 10-YR CHANGE using 1993 mortality data are comparability-adjusted.
*Rate or percent suppressed because count is less than 5 (or less than 21 for age-adjusted rates).§Use caution when interpreting data based on 20 or fewer events, the rate/percent is unreliable. See methods for more information.
†Signifi cant difference (0.1 level)ND = No Data, data not collected in 1993 to calculate 10-YR CHANGE.# = 2003 fetal mortality data not available at time of publication.
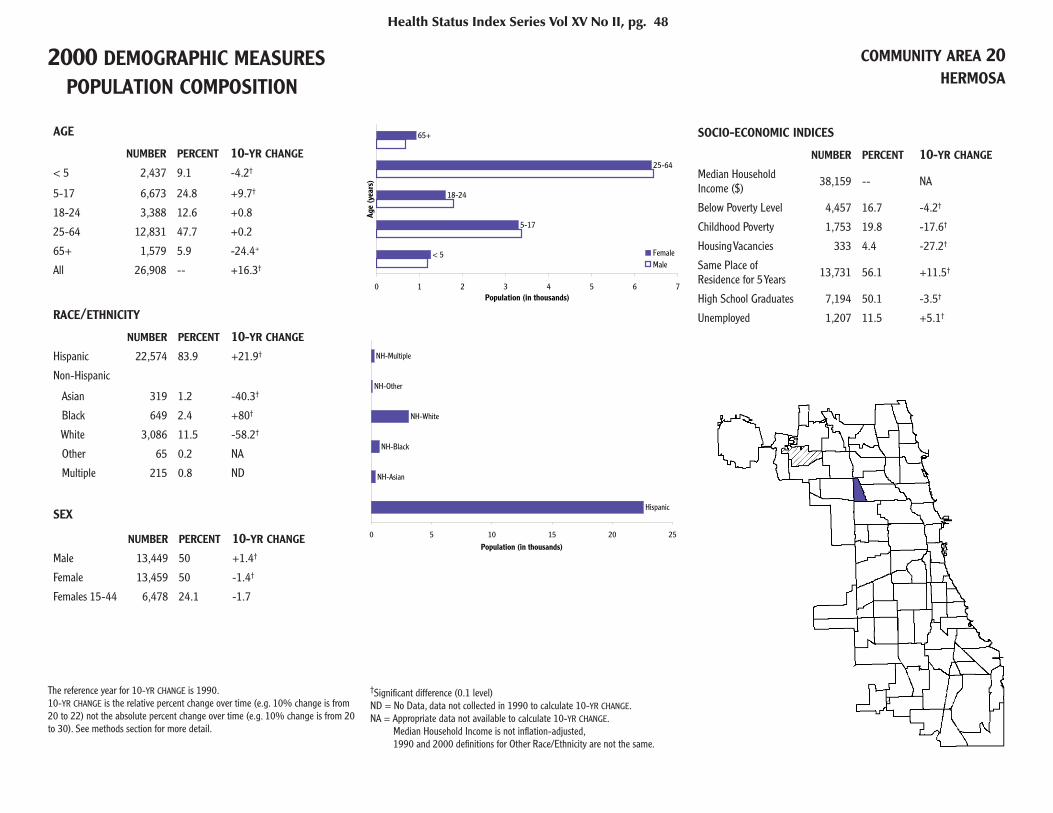
2000 DEMOGRAPHIC MEASURES POPULATION COMPOSITION
COMMUNITY AREA 20HERMOSA
AGE
NUMBER PERCENT 10-YR CHANGE < 5 2,437 9.1 -4.2†
5-17 6,673 24.8 +9.7†
18-24 3,388 12.6 +0.8
25-64 12,831 47.7 +0.2
65+ 1,579 5.9 -24.4+
All 26,908 -- +16.3†
RACE/ETHNICITY
NUMBER PERCENT 10-YR CHANGE Hispanic 22,574 83.9 +21.9†
Non-Hispanic
Asian 319 1.2 -40.3†
Black 649 2.4 +80†
White 3,086 11.5 -58.2†
Other 65 0.2 NA
Multiple 215 0.8 ND
SEX
NUMBER PERCENT 10-YR CHANGE Male 13,449 50 +1.4†
Female 13,459 50 -1.4†
Females 15-44 6,478 24.1 -1.7
SOCIO-ECONOMIC INDICES
NUMBER PERCENT 10-YR CHANGE
Median Household Income ($) 38,159 -- NA
Below Poverty Level 4,457 16.7 -4.2†
Childhood Poverty 1,753 19.8 -17.6†
Housing Vacancies 333 4.4 -27.2†
Same Place of Residence for 5 Years 13,731 56.1 +11.5†
High School Graduates 7,194 50.1 -3.5†
Unemployed 1,207 11.5 +5.1†
Health Status Index Series Vol XV No II, pg. 48
< 5
5-17
18-24
25-64
65+
0 1 2 3 4 5 6 7
Age
(yea
rs)
Population (in thousands)
FemaleMale
Hispanic
NH-Asian
NH-Black
NH-White
NH-Other
NH-Multiple
0 5 10 15 20 25
Population (in thousands)
The reference year for 10-YR CHANGE is 1990.10-YR CHANGE is the relative percent change over time (e.g. 10% change is from 20 to 22) not the absolute percent change over time (e.g. 10% change is from 20 to 30). See methods section for more detail.
†Signifi cant difference (0.1 level)ND = No Data, data not collected in 1990 to calculate 10-YR CHANGE.NA = Appropriate data not available to calculate 10-YR CHANGE. Median Household Income is not infl ation-adjusted, 1990 and 2000 defi nitions for Other Race/Ethnicity are not the same.

2003 HEALTH MEASURES COMMUNITY AREA 20HERMOSA
2003 ALL-CAUSE MORTALITY: 109 DEATHS,700.1 PER 100,000, 16.2%† DECREASE FROM 1993.2003 BIRTHS: 640 BIRTHS, FERTILITY RATE IS98.8 PER 1000, 5.7% DECREASE FROM 1993.
INFECTIOUS DISEASE
NUMBER RATE 10-YR CHANGE HIV/AIDS Deaths 1 * --
AIDS Cases(ages 13 and older) 58 287 +140.8†
Chlamydia 103 382.8 ND
Gonorrhea 20 74.3§ ND
Syphilis 0 * ND
Infl uenza and Pneumonia Deaths 3 * --
Tuberculosis 4 * --
Hepatitis C 11 40.9§ ND
DISABILITIES (2000 CENSUS)
NUMBER PERCENT
Blind/Deaf 789 3.2
Physical 1,584 6.5
Mental 1,263 5.2
Requires Care 858 3.5
Home-Bound 2,799 14.9
Unable to Work 3,624 21.1
MATERNAL HEALTH
NUMBER PCT 10-YR CHANGE First Trimester Prenatal Care 472 73.8 +5.1†
Smoking 10 1.6§ -83.4†
Caesarean Section 129 20.2 +0.6
INFANT AND CHILD HEALTH
NUMBER RATE/PCT 10-YR CHANGE Very Low Birthweight (P) 13 2§ -13.8
Premature Birth (P) 62 9.7 +10.7
Fetal Mortality (R) #
Infant Mortality (R) 2 * --
Lead Screening
Screened (P) 1,414 40 ND
Elevated(P) 68 4.8 ND
CANCER DEATHS
NUMBER RATE 10-YR CHANGE All-cancers 29 203.2 +14.4
Breast 2 * --
Colon 4 * --
Lung 4 * --
Prostate 0 * --
UNNATURAL CAUSES OF DEATH
NUMBER RATE 10-YR CHANGE Accidents 11 * --
Homicide 1 * --
Suicide 1 * --
CHRONIC DISEASE DEATHS
NUMBER RATE 10-YR CHANGE Heart Disease 26 196.3 -33.8†
Stroke 4 * --
Lower Respiratory Disease 2 * --
Diabetes Mellitus 3 * --
Liver Disease and Cirrohosis 0 * --
Alzheimer’s Disease 1 * --
Health Status Index Series Vol XV No II, pg. 49
The reference year for 10-YR CHANGE is 1993. 10-YR CHANGE is the relative percent change over time (e.g. 10% change is from 20 to 22) not the absolute percent change over time (e.g. 10% change is from 20 to 30). See methods section for more detail. Calculation of 10-YR CHANGE using 1993 mortality data are comparability-adjusted.
*Rate or percent suppressed because count is less than 5 (or less than 21 for age-adjusted rates).§Use caution when interpreting data based on 20 or fewer events, the rate/percent is unreliable. See methods for more information.
†Signifi cant difference (0.1 level)ND = No Data, data not collected in 1993 to calculate 10-YR CHANGE.# = 2003 fetal mortality data not available at time of publication.
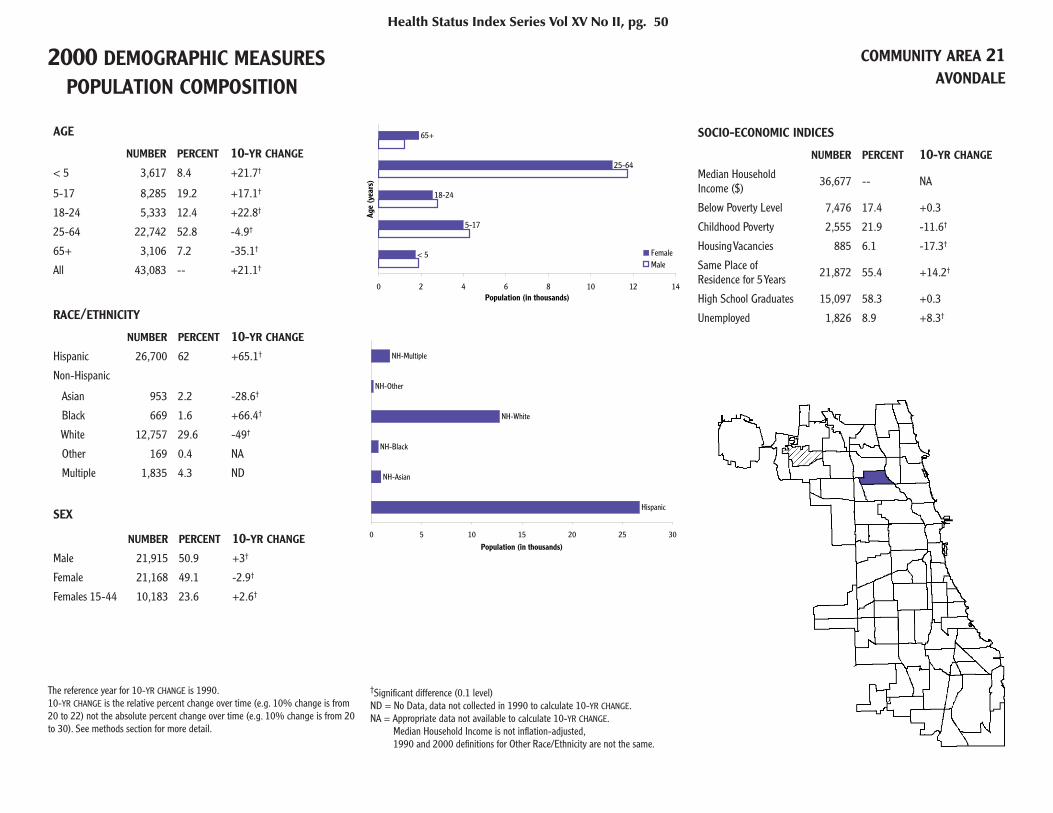
2000 DEMOGRAPHIC MEASURES POPULATION COMPOSITION
COMMUNITY AREA 21AVONDALE
AGE
NUMBER PERCENT 10-YR CHANGE < 5 3,617 8.4 +21.7†
5-17 8,285 19.2 +17.1†
18-24 5,333 12.4 +22.8†
25-64 22,742 52.8 -4.9†
65+ 3,106 7.2 -35.1†
All 43,083 -- +21.1†
RACE/ETHNICITY
NUMBER PERCENT 10-YR CHANGE Hispanic 26,700 62 +65.1†
Non-Hispanic
Asian 953 2.2 -28.6†
Black 669 1.6 +66.4†
White 12,757 29.6 -49†
Other 169 0.4 NA
Multiple 1,835 4.3 ND
SEX
NUMBER PERCENT 10-YR CHANGE Male 21,915 50.9 +3†
Female 21,168 49.1 -2.9†
Females 15-44 10,183 23.6 +2.6†
SOCIO-ECONOMIC INDICES
NUMBER PERCENT 10-YR CHANGE
Median Household Income ($) 36,677 -- NA
Below Poverty Level 7,476 17.4 +0.3
Childhood Poverty 2,555 21.9 -11.6†
Housing Vacancies 885 6.1 -17.3†
Same Place of Residence for 5 Years 21,872 55.4 +14.2†
High School Graduates 15,097 58.3 +0.3
Unemployed 1,826 8.9 +8.3†
Health Status Index Series Vol XV No II, pg. 50
< 5
5-17
18-24
25-64
65+
0 2 4 6 8 10 12 14
Age
(yea
rs)
Population (in thousands)
FemaleMale
Hispanic
NH-Asian
NH-Black
NH-White
NH-Other
NH-Multiple
0 5 10 15 20 25 30
Population (in thousands)
The reference year for 10-YR CHANGE is 1990.10-YR CHANGE is the relative percent change over time (e.g. 10% change is from 20 to 22) not the absolute percent change over time (e.g. 10% change is from 20 to 30). See methods section for more detail.
†Signifi cant difference (0.1 level)ND = No Data, data not collected in 1990 to calculate 10-YR CHANGE.NA = Appropriate data not available to calculate 10-YR CHANGE. Median Household Income is not infl ation-adjusted, 1990 and 2000 defi nitions for Other Race/Ethnicity are not the same.

2003 HEALTH MEASURES COMMUNITY AREA 21AVONDALE
2003 ALL-CAUSE MORTALITY: 186 DEATHS,675.3 PER 100,000, 23.4%† DECREASE FROM 1993.2003 BIRTHS: 825 BIRTHS, FERTILITY RATE IS81 PER 1000, 6.8%† DECREASE FROM 1993.
INFECTIOUS DISEASE
NUMBER RATE 10-YR CHANGE HIV/AIDS Deaths 1 * --
AIDS Cases (ages 13 and older) 94 274.3 +168.6†
Chlamydia 139 322.6 ND
Gonorrhea 21 48.7 ND
Syphilis < 5 * ND
Infl uenza and Pneumonia Deaths 6 * --
Tuberculosis 8 18.6§ -26.5
Hepatitis C 11 25.5§ ND
DISABILITIES (2000 CENSUS)
NUMBER PERCENT
Blind/Deaf 1,165 3
Physical 2,453 6.2
Mental 1,583 4
Requires Care 946 2.4
Home-Bound 5,269 16.2
Unable to Work 5,795 19.7
MATERNAL HEALTH
NUMBER PCT 10-YR CHANGE First Trimester Prenatal Care 616 74.7 +5.2†
Smoking 23 2.8 -61†
Caesarean Section 198 24 +31.6†
INFANT AND CHILD HEALTH
NUMBER RATE/PCT 10-YR CHANGE Very Low Birthweight (P) 15 1.8§ +85.2†
Premature Birth (P) 91 11 +15.7
Fetal Mortality (R) #
Infant Mortality (R) 6 7.3§ -25.9
Lead Screening
Screened (P) 1,609 32.1 ND
Elevated(P) 74 4.6 ND
CANCER DEATHS
NUMBER RATE 10-YR CHANGE All-cancers 36 135.8 -9.6
Breast 2 * --
Colon 2 * --
Lung 14 * --
Prostate 4 * --
UNNATURAL CAUSES OF DEATH
NUMBER RATE 10-YR CHANGE Accidents 11 * --
Homicide 6 * --
Suicide 4 * --
CHRONIC DISEASE DEATHS
NUMBER RATE 10-YR CHANGE Heart Disease 52 209.8 -41†
Stroke 9 * --
Lower Respiratory Disease 6 * --
Diabetes Mellitus 6 * --
Liver Disease and Cirrohosis 5 * --
Alzheimer’s Disease 3 * --
Health Status Index Series Vol XV No II, pg. 51
The reference year for 10-YR CHANGE is 1993. 10-YR CHANGE is the relative percent change over time (e.g. 10% change is from 20 to 22) not the absolute percent change over time (e.g. 10% change is from 20 to 30). See methods section for more detail. Calculation of 10-YR CHANGE using 1993 mortality data are comparability-adjusted.
*Rate or percent suppressed because count is less than 5 (or less than 21 for age-adjusted rates).§Use caution when interpreting data based on 20 or fewer events, the rate/percent is unreliable. See methods for more information.
†Signifi cant difference (0.1 level)ND = No Data, data not collected in 1993 to calculate 10-YR CHANGE.# = 2003 fetal mortality data not available at time of publication.
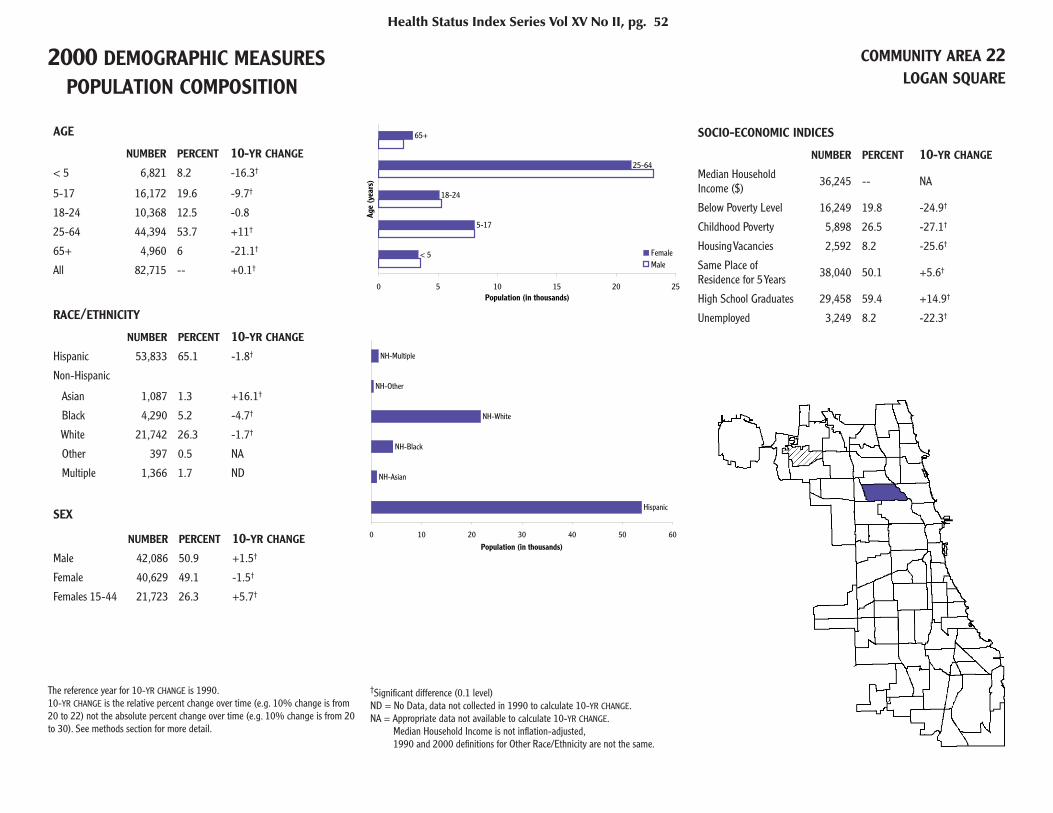
2000 DEMOGRAPHIC MEASURES POPULATION COMPOSITION
COMMUNITY AREA 22LOGAN SQUARE
AGE
NUMBER PERCENT 10-YR CHANGE < 5 6,821 8.2 -16.3†
5-17 16,172 19.6 -9.7†
18-24 10,368 12.5 -0.8
25-64 44,394 53.7 +11†
65+ 4,960 6 -21.1†
All 82,715 -- +0.1†
RACE/ETHNICITY
NUMBER PERCENT 10-YR CHANGE Hispanic 53,833 65.1 -1.8†
Non-Hispanic
Asian 1,087 1.3 +16.1†
Black 4,290 5.2 -4.7†
White 21,742 26.3 -1.7†
Other 397 0.5 NA
Multiple 1,366 1.7 ND
SEX
NUMBER PERCENT 10-YR CHANGE Male 42,086 50.9 +1.5†
Female 40,629 49.1 -1.5†
Females 15-44 21,723 26.3 +5.7†
SOCIO-ECONOMIC INDICES
NUMBER PERCENT 10-YR CHANGE
Median Household Income ($) 36,245 -- NA
Below Poverty Level 16,249 19.8 -24.9†
Childhood Poverty 5,898 26.5 -27.1†
Housing Vacancies 2,592 8.2 -25.6†
Same Place of Residence for 5 Years 38,040 50.1 +5.6†
High School Graduates 29,458 59.4 +14.9†
Unemployed 3,249 8.2 -22.3†
Health Status Index Series Vol XV No II, pg. 52
< 5
5-17
18-24
25-64
65+
0 5 10 15 20 25
Age
(yea
rs)
Population (in thousands)
FemaleMale
Hispanic
NH-Asian
NH-Black
NH-White
NH-Other
NH-Multiple
0 10 20 30 40 50 60
Population (in thousands)
The reference year for 10-YR CHANGE is 1990.10-YR CHANGE is the relative percent change over time (e.g. 10% change is from 20 to 22) not the absolute percent change over time (e.g. 10% change is from 20 to 30). See methods section for more detail.
†Signifi cant difference (0.1 level)ND = No Data, data not collected in 1990 to calculate 10-YR CHANGE.NA = Appropriate data not available to calculate 10-YR CHANGE. Median Household Income is not infl ation-adjusted, 1990 and 2000 defi nitions for Other Race/Ethnicity are not the same.

2003 HEALTH MEASURES COMMUNITY AREA 22LOGAN SQUARE
2003 ALL-CAUSE MORTALITY: 388 DEATHS,846.4 PER 100,000, 24.5%† DECREASE FROM 1993.2003 BIRTHS: 1,553 BIRTHS, FERTILITY RATE IS71.5 PER 1000, 28.1%† DECREASE FROM 1993.
INFECTIOUS DISEASE
NUMBER RATE 10-YR CHANGE HIV/AIDS Deaths 7 * --
AIDS Cases (ages 13 and older) 276 421.5 +112.8†
Chlamydia 328 396.5 ND
Gonorrhea 94 113.6 ND
Syphilis < 5 * ND
Infl uenza and Pneumonia Deaths 12 * --
Tuberculosis 2 * --
Hepatitis C 48 58 ND
DISABILITIES (2000 CENSUS)
NUMBER PERCENT
Blind/Deaf 2,764 3.6
Physical 5,110 6.7
Mental 3,956 5.2
Requires Care 2,453 3.2
Home-Bound 8,689 14
Unable to Work 10,135 17.8
MATERNAL HEALTH
NUMBER PCT 10-YR CHANGE First Trimester Prenatal Care 1,219 78.5 +13.2†
Smoking 46 3 -54.9†
Caesarean Section 349 22.5 +11.7†
INFANT AND CHILD HEALTH
NUMBER RATE/PCT 10-YR CHANGE Very Low Birthweight (P) 23 1.5 -8.4
Premature Birth (P) 129 8.3 -3.1
Fetal Mortality (R) #
Infant Mortality (R) 9 5.8§ -30.4
Lead Screening
Screened (P) 2,746 28.8 ND
Elevated(P) 117 4.3 ND
CANCER DEATHS
NUMBER RATE 10-YR CHANGE All-cancers 78 174.8 -26.3†
Breast 6 * --
Colon 10 * --
Lung 19 * --
Prostate 5 * --
UNNATURAL CAUSES OF DEATH
NUMBER RATE 10-YR CHANGE Accidents 15 * --
Homicide 15 * --
Suicide 6 * --
CHRONIC DISEASE DEATHS
NUMBER RATE 10-YR CHANGE Heart Disease 105 253.9 -35.4†
Stroke 21 52.8 --
Lower Respiratory Disease 9 * --
Diabetes Mellitus 17 * --
Liver Disease and Cirrohosis 9 * --
Alzheimer’s Disease 8 * --
Health Status Index Series Vol XV No II, pg. 53
The reference year for 10-YR CHANGE is 1993. 10-YR CHANGE is the relative percent change over time (e.g. 10% change is from 20 to 22) not the absolute percent change over time (e.g. 10% change is from 20 to 30). See methods section for more detail. Calculation of 10-YR CHANGE using 1993 mortality data are comparability-adjusted.
*Rate or percent suppressed because count is less than 5 (or less than 21 for age-adjusted rates).§Use caution when interpreting data based on 20 or fewer events, the rate/percent is unreliable. See methods for more information.
†Signifi cant difference (0.1 level)ND = No Data, data not collected in 1993 to calculate 10-YR CHANGE.# = 2003 fetal mortality data not available at time of publication.
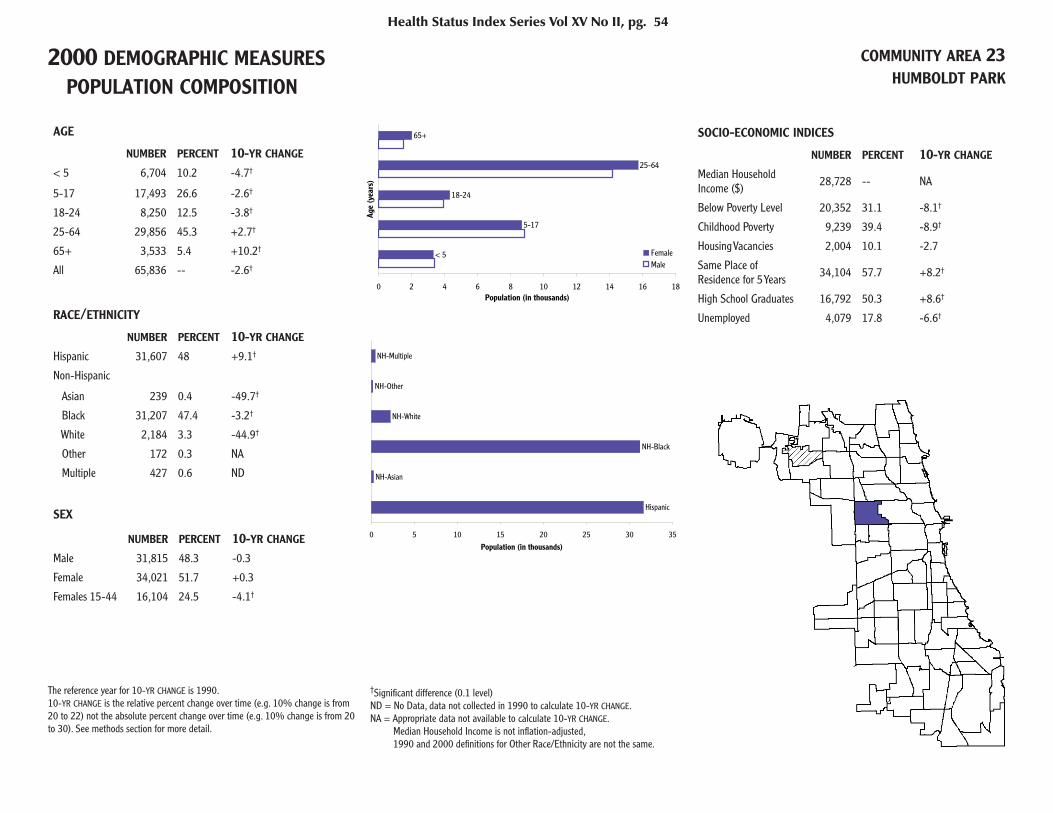
2000 DEMOGRAPHIC MEASURES POPULATION COMPOSITION
COMMUNITY AREA 23HUMBOLDT PARK
AGE
NUMBER PERCENT 10-YR CHANGE < 5 6,704 10.2 -4.7†
5-17 17,493 26.6 -2.6†
18-24 8,250 12.5 -3.8†
25-64 29,856 45.3 +2.7†
65+ 3,533 5.4 +10.2†
All 65,836 -- -2.6†
RACE/ETHNICITY
NUMBER PERCENT 10-YR CHANGE Hispanic 31,607 48 +9.1†
Non-Hispanic
Asian 239 0.4 -49.7†
Black 31,207 47.4 -3.2†
White 2,184 3.3 -44.9†
Other 172 0.3 NA
Multiple 427 0.6 ND
SEX
NUMBER PERCENT 10-YR CHANGE Male 31,815 48.3 -0.3
Female 34,021 51.7 +0.3
Females 15-44 16,104 24.5 -4.1†
SOCIO-ECONOMIC INDICES
NUMBER PERCENT 10-YR CHANGE
Median Household Income ($) 28,728 -- NA
Below Poverty Level 20,352 31.1 -8.1†
Childhood Poverty 9,239 39.4 -8.9†
Housing Vacancies 2,004 10.1 -2.7
Same Place of Residence for 5 Years 34,104 57.7 +8.2†
High School Graduates 16,792 50.3 +8.6†
Unemployed 4,079 17.8 -6.6†
Health Status Index Series Vol XV No II, pg. 54
< 5
5-17
18-24
25-64
65+
0 2 4 6 8 10 12 14 16 18
Age
(yea
rs)
Population (in thousands)
FemaleMale
Hispanic
NH-Asian
NH-Black
NH-White
NH-Other
NH-Multiple
0 5 10 15 20 25 30 35
Population (in thousands)
The reference year for 10-YR CHANGE is 1990.10-YR CHANGE is the relative percent change over time (e.g. 10% change is from 20 to 22) not the absolute percent change over time (e.g. 10% change is from 20 to 30). See methods section for more detail.
†Signifi cant difference (0.1 level)ND = No Data, data not collected in 1990 to calculate 10-YR CHANGE.NA = Appropriate data not available to calculate 10-YR CHANGE. Median Household Income is not infl ation-adjusted, 1990 and 2000 defi nitions for Other Race/Ethnicity are not the same.
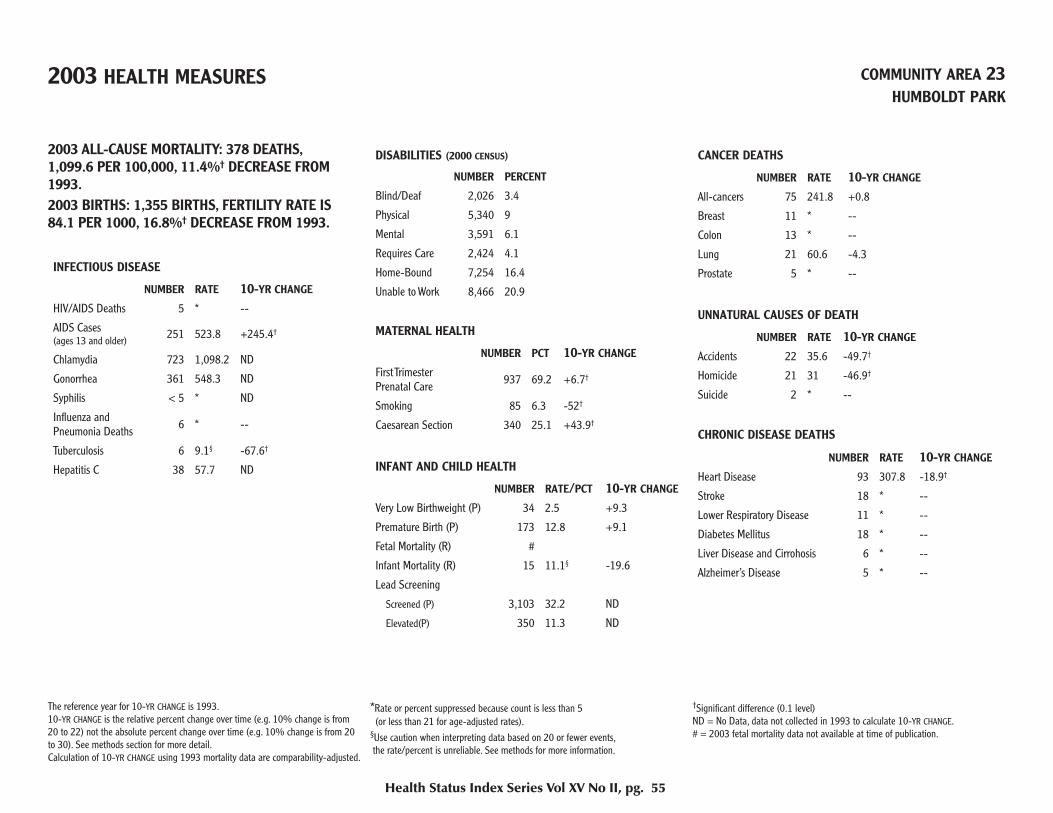
2003 HEALTH MEASURES COMMUNITY AREA 23HUMBOLDT PARK
2003 ALL-CAUSE MORTALITY: 378 DEATHS,1,099.6 PER 100,000, 11.4%† DECREASE FROM 1993.2003 BIRTHS: 1,355 BIRTHS, FERTILITY RATE IS84.1 PER 1000, 16.8%† DECREASE FROM 1993.
INFECTIOUS DISEASE
NUMBER RATE 10-YR CHANGE HIV/AIDS Deaths 5 * --
AIDS Cases (ages 13 and older) 251 523.8 +245.4†
Chlamydia 723 1,098.2 ND
Gonorrhea 361 548.3 ND
Syphilis < 5 * ND
Infl uenza and Pneumonia Deaths 6 * --
Tuberculosis 6 9.1§ -67.6†
Hepatitis C 38 57.7 ND
DISABILITIES (2000 CENSUS)
NUMBER PERCENT
Blind/Deaf 2,026 3.4
Physical 5,340 9
Mental 3,591 6.1
Requires Care 2,424 4.1
Home-Bound 7,254 16.4
Unable to Work 8,466 20.9
MATERNAL HEALTH
NUMBER PCT 10-YR CHANGE First Trimester Prenatal Care 937 69.2 +6.7†
Smoking 85 6.3 -52†
Caesarean Section 340 25.1 +43.9†
INFANT AND CHILD HEALTH
NUMBER RATE/PCT 10-YR CHANGE Very Low Birthweight (P) 34 2.5 +9.3
Premature Birth (P) 173 12.8 +9.1
Fetal Mortality (R) #
Infant Mortality (R) 15 11.1§ -19.6
Lead Screening
Screened (P) 3,103 32.2 ND
Elevated(P) 350 11.3 ND
CANCER DEATHS
NUMBER RATE 10-YR CHANGE All-cancers 75 241.8 +0.8
Breast 11 * --
Colon 13 * --
Lung 21 60.6 -4.3
Prostate 5 * --
UNNATURAL CAUSES OF DEATH
NUMBER RATE 10-YR CHANGE Accidents 22 35.6 -49.7†
Homicide 21 31 -46.9†
Suicide 2 * --
CHRONIC DISEASE DEATHS
NUMBER RATE 10-YR CHANGE Heart Disease 93 307.8 -18.9†
Stroke 18 * --
Lower Respiratory Disease 11 * --
Diabetes Mellitus 18 * --
Liver Disease and Cirrohosis 6 * --
Alzheimer’s Disease 5 * --
Health Status Index Series Vol XV No II, pg. 55
The reference year for 10-YR CHANGE is 1993. 10-YR CHANGE is the relative percent change over time (e.g. 10% change is from 20 to 22) not the absolute percent change over time (e.g. 10% change is from 20 to 30). See methods section for more detail. Calculation of 10-YR CHANGE using 1993 mortality data are comparability-adjusted.
*Rate or percent suppressed because count is less than 5 (or less than 21 for age-adjusted rates).§Use caution when interpreting data based on 20 or fewer events, the rate/percent is unreliable. See methods for more information.
†Signifi cant difference (0.1 level)ND = No Data, data not collected in 1993 to calculate 10-YR CHANGE.# = 2003 fetal mortality data not available at time of publication.
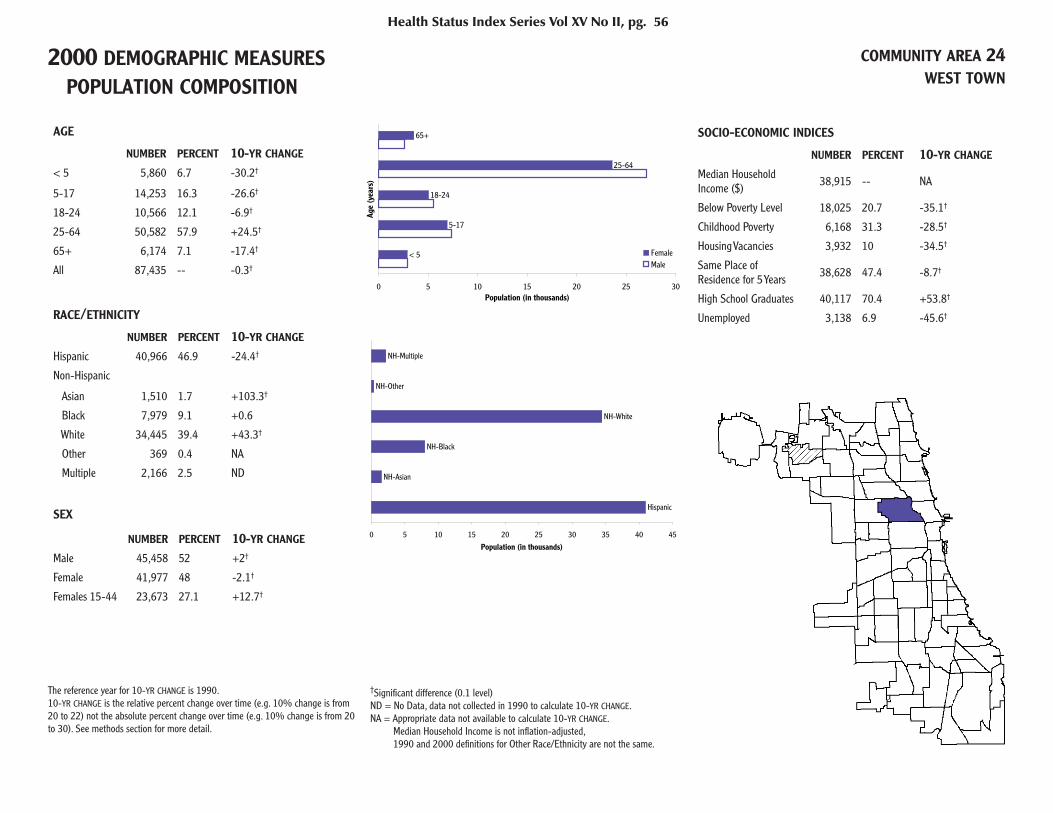
2000 DEMOGRAPHIC MEASURES POPULATION COMPOSITION
COMMUNITY AREA 24WEST TOWN
AGE
NUMBER PERCENT 10-YR CHANGE < 5 5,860 6.7 -30.2†
5-17 14,253 16.3 -26.6†
18-24 10,566 12.1 -6.9†
25-64 50,582 57.9 +24.5†
65+ 6,174 7.1 -17.4†
All 87,435 -- -0.3†
RACE/ETHNICITY
NUMBER PERCENT 10-YR CHANGE Hispanic 40,966 46.9 -24.4†
Non-Hispanic
Asian 1,510 1.7 +103.3†
Black 7,979 9.1 +0.6
White 34,445 39.4 +43.3†
Other 369 0.4 NA
Multiple 2,166 2.5 ND
SEX
NUMBER PERCENT 10-YR CHANGE Male 45,458 52 +2†
Female 41,977 48 -2.1†
Females 15-44 23,673 27.1 +12.7†
SOCIO-ECONOMIC INDICES
NUMBER PERCENT 10-YR CHANGE
Median Household Income ($) 38,915 -- NA
Below Poverty Level 18,025 20.7 -35.1†
Childhood Poverty 6,168 31.3 -28.5†
Housing Vacancies 3,932 10 -34.5†
Same Place of Residence for 5 Years 38,628 47.4 -8.7†
High School Graduates 40,117 70.4 +53.8†
Unemployed 3,138 6.9 -45.6†
Health Status Index Series Vol XV No II, pg. 56
< 5
5-17
18-24
25-64
65+
0 5 10 15 20 25 30
Age
(yea
rs)
Population (in thousands)
FemaleMale
Hispanic
NH-Asian
NH-Black
NH-White
NH-Other
NH-Multiple
0 5 10 15 20 25 30 35 40 45
Population (in thousands)
The reference year for 10-YR CHANGE is 1990.10-YR CHANGE is the relative percent change over time (e.g. 10% change is from 20 to 22) not the absolute percent change over time (e.g. 10% change is from 20 to 30). See methods section for more detail.
†Signifi cant difference (0.1 level)ND = No Data, data not collected in 1990 to calculate 10-YR CHANGE.NA = Appropriate data not available to calculate 10-YR CHANGE. Median Household Income is not infl ation-adjusted, 1990 and 2000 defi nitions for Other Race/Ethnicity are not the same.
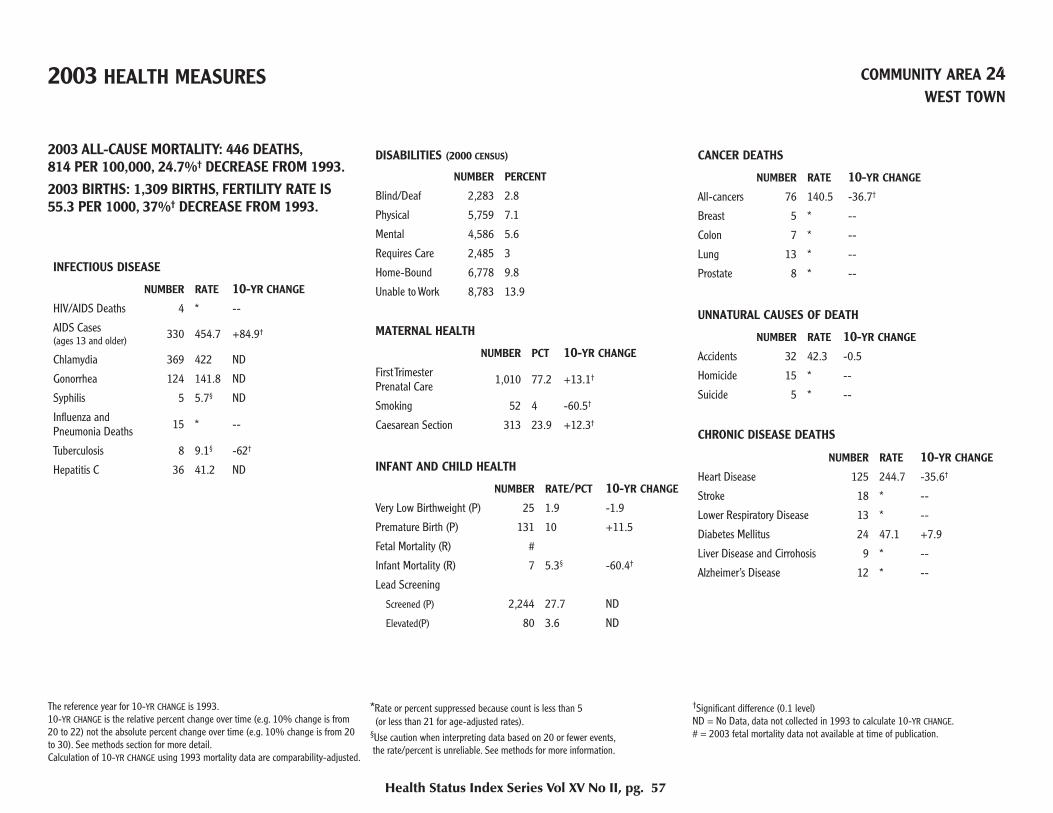
2003 HEALTH MEASURES COMMUNITY AREA 24WEST TOWN
2003 ALL-CAUSE MORTALITY: 446 DEATHS,814 PER 100,000, 24.7%† DECREASE FROM 1993.2003 BIRTHS: 1,309 BIRTHS, FERTILITY RATE IS55.3 PER 1000, 37%† DECREASE FROM 1993.
INFECTIOUS DISEASE
NUMBER RATE 10-YR CHANGE HIV/AIDS Deaths 4 * --
AIDS Cases (ages 13 and older) 330 454.7 +84.9†
Chlamydia 369 422 ND
Gonorrhea 124 141.8 ND
Syphilis 5 5.7§ ND
Infl uenza and Pneumonia Deaths 15 * --
Tuberculosis 8 9.1§ -62†
Hepatitis C 36 41.2 ND
DISABILITIES (2000 CENSUS)
NUMBER PERCENT
Blind/Deaf 2,283 2.8
Physical 5,759 7.1
Mental 4,586 5.6
Requires Care 2,485 3
Home-Bound 6,778 9.8
Unable to Work 8,783 13.9
MATERNAL HEALTH
NUMBER PCT 10-YR CHANGE First Trimester Prenatal Care 1,010 77.2 +13.1†
Smoking 52 4 -60.5†
Caesarean Section 313 23.9 +12.3†
INFANT AND CHILD HEALTH
NUMBER RATE/PCT 10-YR CHANGE Very Low Birthweight (P) 25 1.9 -1.9
Premature Birth (P) 131 10 +11.5
Fetal Mortality (R) #
Infant Mortality (R) 7 5.3§ -60.4†
Lead Screening
Screened (P) 2,244 27.7 ND
Elevated(P) 80 3.6 ND
CANCER DEATHS
NUMBER RATE 10-YR CHANGE All-cancers 76 140.5 -36.7†
Breast 5 * --
Colon 7 * --
Lung 13 * --
Prostate 8 * --
UNNATURAL CAUSES OF DEATH
NUMBER RATE 10-YR CHANGE Accidents 32 42.3 -0.5
Homicide 15 * --
Suicide 5 * --
CHRONIC DISEASE DEATHS
NUMBER RATE 10-YR CHANGE Heart Disease 125 244.7 -35.6†
Stroke 18 * --
Lower Respiratory Disease 13 * --
Diabetes Mellitus 24 47.1 +7.9
Liver Disease and Cirrohosis 9 * --
Alzheimer’s Disease 12 * --
Health Status Index Series Vol XV No II, pg. 57
The reference year for 10-YR CHANGE is 1993. 10-YR CHANGE is the relative percent change over time (e.g. 10% change is from 20 to 22) not the absolute percent change over time (e.g. 10% change is from 20 to 30). See methods section for more detail. Calculation of 10-YR CHANGE using 1993 mortality data are comparability-adjusted.
*Rate or percent suppressed because count is less than 5 (or less than 21 for age-adjusted rates).§Use caution when interpreting data based on 20 or fewer events, the rate/percent is unreliable. See methods for more information.
†Signifi cant difference (0.1 level)ND = No Data, data not collected in 1993 to calculate 10-YR CHANGE.# = 2003 fetal mortality data not available at time of publication.
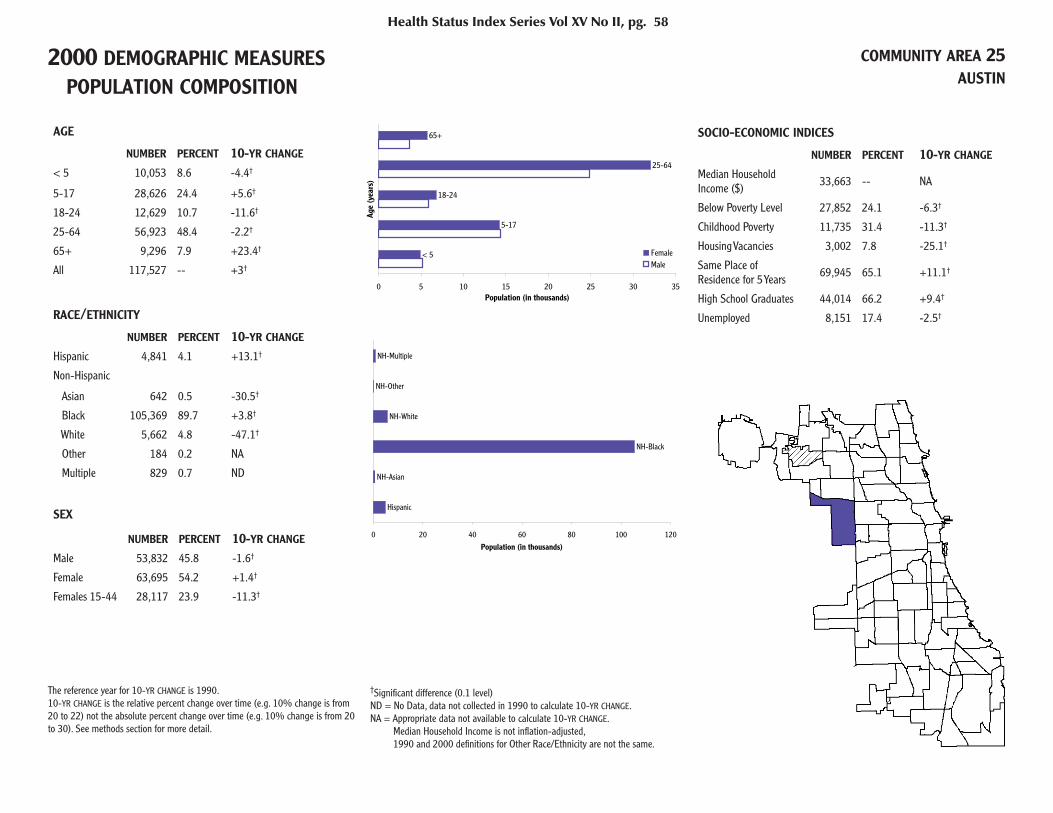
2000 DEMOGRAPHIC MEASURES POPULATION COMPOSITION
COMMUNITY AREA 25AUSTIN
AGE
NUMBER PERCENT 10-YR CHANGE < 5 10,053 8.6 -4.4†
5-17 28,626 24.4 +5.6†
18-24 12,629 10.7 -11.6†
25-64 56,923 48.4 -2.2†
65+ 9,296 7.9 +23.4†
All 117,527 -- +3†
RACE/ETHNICITY
NUMBER PERCENT 10-YR CHANGE Hispanic 4,841 4.1 +13.1†
Non-Hispanic
Asian 642 0.5 -30.5†
Black 105,369 89.7 +3.8†
White 5,662 4.8 -47.1†
Other 184 0.2 NA
Multiple 829 0.7 ND
SEX
NUMBER PERCENT 10-YR CHANGE Male 53,832 45.8 -1.6†
Female 63,695 54.2 +1.4†
Females 15-44 28,117 23.9 -11.3†
SOCIO-ECONOMIC INDICES
NUMBER PERCENT 10-YR CHANGE
Median Household Income ($) 33,663 -- NA
Below Poverty Level 27,852 24.1 -6.3†
Childhood Poverty 11,735 31.4 -11.3†
Housing Vacancies 3,002 7.8 -25.1†
Same Place of Residence for 5 Years 69,945 65.1 +11.1†
High School Graduates 44,014 66.2 +9.4†
Unemployed 8,151 17.4 -2.5†
Health Status Index Series Vol XV No II, pg. 58
< 5
5-17
18-24
25-64
65+
0 5 10 15 20 25 30 35
Age
(yea
rs)
Population (in thousands)
FemaleMale
Hispanic
NH-Asian
NH-Black
NH-White
NH-Other
NH-Multiple
0 20 40 60 80 100 120
Population (in thousands)
The reference year for 10-YR CHANGE is 1990.10-YR CHANGE is the relative percent change over time (e.g. 10% change is from 20 to 22) not the absolute percent change over time (e.g. 10% change is from 20 to 30). See methods section for more detail.
†Signifi cant difference (0.1 level)ND = No Data, data not collected in 1990 to calculate 10-YR CHANGE.NA = Appropriate data not available to calculate 10-YR CHANGE. Median Household Income is not infl ation-adjusted, 1990 and 2000 defi nitions for Other Race/Ethnicity are not the same.
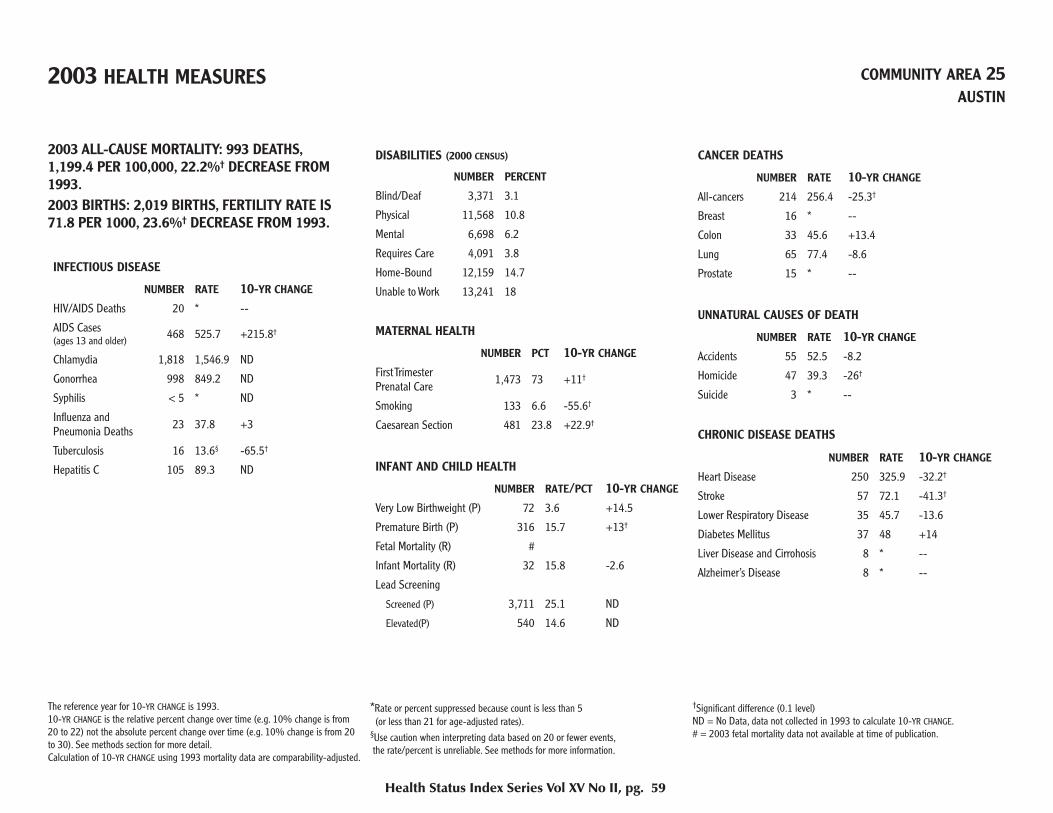
2003 HEALTH MEASURES COMMUNITY AREA 25AUSTIN
2003 ALL-CAUSE MORTALITY: 993 DEATHS,1,199.4 PER 100,000, 22.2%† DECREASE FROM 1993.2003 BIRTHS: 2,019 BIRTHS, FERTILITY RATE IS71.8 PER 1000, 23.6%† DECREASE FROM 1993.
INFECTIOUS DISEASE
NUMBER RATE 10-YR CHANGE HIV/AIDS Deaths 20 * --
AIDS Cases (ages 13 and older) 468 525.7 +215.8†
Chlamydia 1,818 1,546.9 ND
Gonorrhea 998 849.2 ND
Syphilis < 5 * ND
Infl uenza and Pneumonia Deaths 23 37.8 +3
Tuberculosis 16 13.6§ -65.5†
Hepatitis C 105 89.3 ND
DISABILITIES (2000 CENSUS)
NUMBER PERCENT
Blind/Deaf 3,371 3.1
Physical 11,568 10.8
Mental 6,698 6.2
Requires Care 4,091 3.8
Home-Bound 12,159 14.7
Unable to Work 13,241 18
MATERNAL HEALTH
NUMBER PCT 10-YR CHANGE First Trimester Prenatal Care 1,473 73 +11†
Smoking 133 6.6 -55.6†
Caesarean Section 481 23.8 +22.9†
INFANT AND CHILD HEALTH
NUMBER RATE/PCT 10-YR CHANGE Very Low Birthweight (P) 72 3.6 +14.5
Premature Birth (P) 316 15.7 +13†
Fetal Mortality (R) #
Infant Mortality (R) 32 15.8 -2.6
Lead Screening
Screened (P) 3,711 25.1 ND
Elevated(P) 540 14.6 ND
CANCER DEATHS
NUMBER RATE 10-YR CHANGE All-cancers 214 256.4 -25.3†
Breast 16 * --
Colon 33 45.6 +13.4
Lung 65 77.4 -8.6
Prostate 15 * --
UNNATURAL CAUSES OF DEATH
NUMBER RATE 10-YR CHANGE Accidents 55 52.5 -8.2
Homicide 47 39.3 -26†
Suicide 3 * --
CHRONIC DISEASE DEATHS
NUMBER RATE 10-YR CHANGE Heart Disease 250 325.9 -32.2†
Stroke 57 72.1 -41.3†
Lower Respiratory Disease 35 45.7 -13.6
Diabetes Mellitus 37 48 +14
Liver Disease and Cirrohosis 8 * --
Alzheimer’s Disease 8 * --
Health Status Index Series Vol XV No II, pg. 59
The reference year for 10-YR CHANGE is 1993. 10-YR CHANGE is the relative percent change over time (e.g. 10% change is from 20 to 22) not the absolute percent change over time (e.g. 10% change is from 20 to 30). See methods section for more detail. Calculation of 10-YR CHANGE using 1993 mortality data are comparability-adjusted.
*Rate or percent suppressed because count is less than 5 (or less than 21 for age-adjusted rates).§Use caution when interpreting data based on 20 or fewer events, the rate/percent is unreliable. See methods for more information.
†Signifi cant difference (0.1 level)ND = No Data, data not collected in 1993 to calculate 10-YR CHANGE.# = 2003 fetal mortality data not available at time of publication.

2000 DEMOGRAPHIC MEASURES POPULATION COMPOSITION
COMMUNITY AREA 26WEST GARFIELD PARK
AGE
NUMBER PERCENT 10-YR CHANGE < 5 2,128 9.2 -6.1†
5-17 6,165 26.8 +11.7†
18-24 2,346 10.2 -12.1†
25-64 10,076 43.8 -6.0†
65+ 2,304 10 +25†
All 23,019 -- -4.5†
RACE/ETHNICITY
NUMBER PERCENT 10-YR CHANGE Hispanic 201 0.9 +58.2†
Non-Hispanic
Asian 18 0.1 +10.8
Black 22,564 98 -0.9†
White 133 0.6 +60†
Other 43 0.2 NA
Multiple 60 0.3 ND
SEX
NUMBER PERCENT 10-YR CHANGE Male 10,588 46 -0.5
Female 12,431 54 +0.4
Females 15-44 5,340 23.2 -8.2†
SOCIO-ECONOMIC INDICES
NUMBER PERCENT 10-YR CHANGE
Median Household Income ($) 23,121 -- NA
Below Poverty Level 8,161 35.9 -12†
Childhood Poverty 3,454 43.9 -24.6†
Housing Vacancies 1,018 12.9 +31.8†
Same Place of Residence for 5 Years 12,955 62 -2.7†
High School Graduates 7,188 58 +16.3†
Unemployed 1,788 22.1 -17.5†
Health Status Index Series Vol XV No II, pg. 60
< 5
5-17
18-24
25-64
65+
0 1 2 3 4 5 6
Age
(yea
rs)
Population (in thousands)
FemaleMale
Hispanic
NH-Asian
NH-Black
NH-White
NH-Other
NH-Multiple
0 5 10 15 20 25
Population (in thousands)
The reference year for 10-YR CHANGE is 1990.10-YR CHANGE is the relative percent change over time (e.g. 10% change is from 20 to 22) not the absolute percent change over time (e.g. 10% change is from 20 to 30). See methods section for more detail.
†Signifi cant difference (0.1 level)ND = No Data, data not collected in 1990 to calculate 10-YR CHANGE.NA = Appropriate data not available to calculate 10-YR CHANGE. Median Household Income is not infl ation-adjusted, 1990 and 2000 defi nitions for Other Race/Ethnicity are not the same.

2003 HEALTH MEASURES COMMUNITY AREA 26WEST GARFIELD PARK
2003 ALL-CAUSE MORTALITY: 209 DEATHS,1,147.5 PER 100,000, 36.4%† DECREASE FROM 1993.2003 BIRTHS: 410 BIRTHS, FERTILITY RATE IS76.8 PER 1000, 37.6%† DECREASE FROM 1993.
INFECTIOUS DISEASE
NUMBER RATE 10-YR CHANGE HIV/AIDS Deaths 8 * --
AIDS Cases (ages 13 and older) 123 725.3 +354.4†
Chlamydia 409 1,776.8 ND
Gonorrhea 217 942.7 ND
Syphilis < 5 * ND
Infl uenza and Pneumonia Deaths 4 * --
Tuberculosis 3 * --
Hepatitis C 29 126 ND
DISABILITIES (2000 CENSUS)
NUMBER PERCENT
Blind/Deaf 731 3.5
Physical 2,551 12.2
Mental 1,734 8.3
Requires Care 1,035 5
Home-Bound 2,878 18.4
Unable to Work 2,716 20.4
MATERNAL HEALTH
NUMBER PCT 10-YR CHANGE First Trimester Prenatal Care 272 66.3 +12.1†
Smoking 62 15.1 +3.1
Caesarean Section 81 19.8 +42.5†
INFANT AND CHILD HEALTH
NUMBER RATE/PCT 10-YR CHANGE Very Low Birthweight (P) 13 3.2§ -4.9
Premature Birth (P) 70 17.1 +24.3†
Fetal Mortality (R) #
Infant Mortality (R) 8 19.5§ +4.5
Lead Screening
Screened (P) 1,135 36.5 ND
Elevated(P) 187 16.5 ND
CANCER DEATHS
NUMBER RATE 10-YR CHANGE All-cancers 58 326.3 -18.3
Breast 6 * --
Colon 7 * --
Lung 14 * --
Prostate 4 * --
UNNATURAL CAUSES OF DEATH
NUMBER RATE 10-YR CHANGE Accidents 16 * --
Homicide 12 * --
Suicide 1 * --
CHRONIC DISEASE DEATHS
NUMBER RATE 10-YR CHANGE Heart Disease 48 285.2 -43.7†
Stroke 4 * --
Lower Respiratory Disease 6 * --
Diabetes Mellitus 5 * --
Liver Disease and Cirrohosis 3 * --
Alzheimer’s Disease 0 * --
Health Status Index Series Vol XV No II, pg. 61
The reference year for 10-YR CHANGE is 1993. 10-YR CHANGE is the relative percent change over time (e.g. 10% change is from 20 to 22) not the absolute percent change over time (e.g. 10% change is from 20 to 30). See methods section for more detail. Calculation of 10-YR CHANGE using 1993 mortality data are comparability-adjusted.
*Rate or percent suppressed because count is less than 5 (or less than 21 for age-adjusted rates).§Use caution when interpreting data based on 20 or fewer events, the rate/percent is unreliable. See methods for more information.
†Signifi cant difference (0.1 level)ND = No Data, data not collected in 1993 to calculate 10-YR CHANGE.# = 2003 fetal mortality data not available at time of publication.
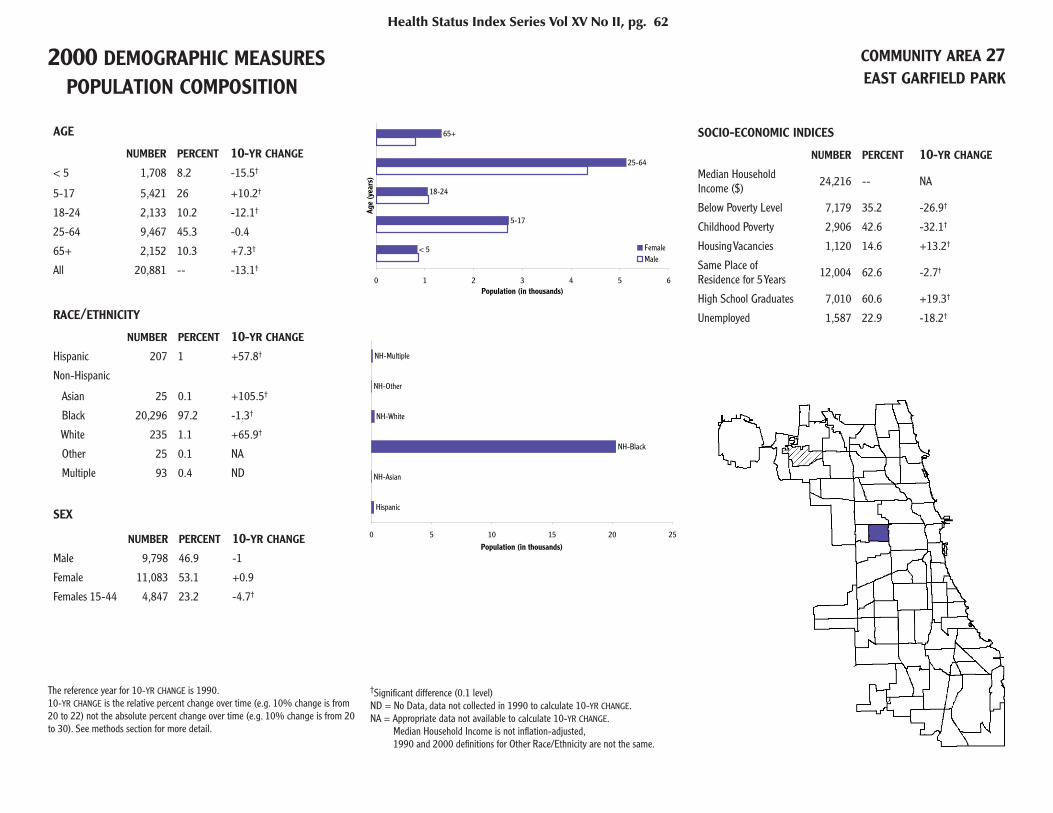
2000 DEMOGRAPHIC MEASURES POPULATION COMPOSITION
COMMUNITY AREA 27EAST GARFIELD PARK
AGE
NUMBER PERCENT 10-YR CHANGE < 5 1,708 8.2 -15.5†
5-17 5,421 26 +10.2†
18-24 2,133 10.2 -12.1†
25-64 9,467 45.3 -0.4
65+ 2,152 10.3 +7.3†
All 20,881 -- -13.1†
RACE/ETHNICITY
NUMBER PERCENT 10-YR CHANGE Hispanic 207 1 +57.8†
Non-Hispanic
Asian 25 0.1 +105.5†
Black 20,296 97.2 -1.3†
White 235 1.1 +65.9†
Other 25 0.1 NA
Multiple 93 0.4 ND
SEX
NUMBER PERCENT 10-YR CHANGE Male 9,798 46.9 -1
Female 11,083 53.1 +0.9
Females 15-44 4,847 23.2 -4.7†
SOCIO-ECONOMIC INDICES
NUMBER PERCENT 10-YR CHANGE
Median Household Income ($) 24,216 -- NA
Below Poverty Level 7,179 35.2 -26.9†
Childhood Poverty 2,906 42.6 -32.1†
Housing Vacancies 1,120 14.6 +13.2†
Same Place of Residence for 5 Years 12,004 62.6 -2.7†
High School Graduates 7,010 60.6 +19.3†
Unemployed 1,587 22.9 -18.2†
Health Status Index Series Vol XV No II, pg. 62
< 5
5-17
18-24
25-64
65+
0 1 2 3 4 5 6
Age
(yea
rs)
Population (in thousands)
FemaleMale
Hispanic
NH-Asian
NH-Black
NH-White
NH-Other
NH-Multiple
0 5 10 15 20 25
Population (in thousands)
The reference year for 10-YR CHANGE is 1990.10-YR CHANGE is the relative percent change over time (e.g. 10% change is from 20 to 22) not the absolute percent change over time (e.g. 10% change is from 20 to 30). See methods section for more detail.
†Signifi cant difference (0.1 level)ND = No Data, data not collected in 1990 to calculate 10-YR CHANGE.NA = Appropriate data not available to calculate 10-YR CHANGE. Median Household Income is not infl ation-adjusted, 1990 and 2000 defi nitions for Other Race/Ethnicity are not the same.
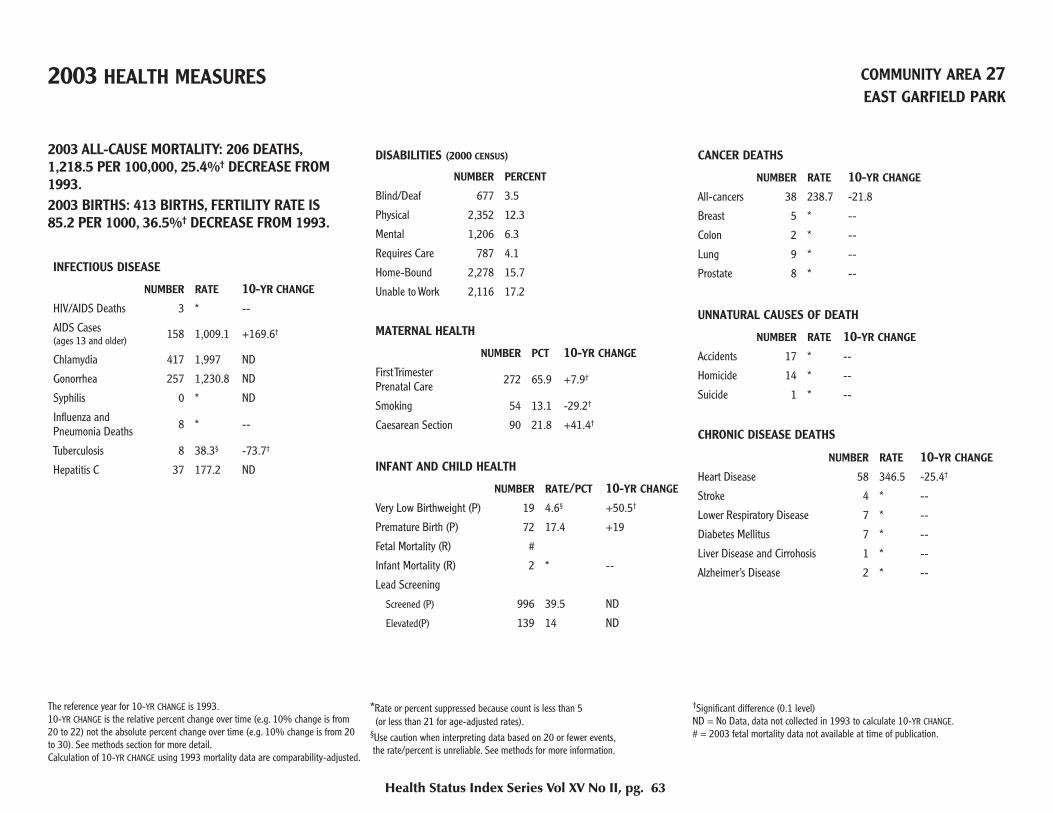
2003 HEALTH MEASURES COMMUNITY AREA 27EAST GARFIELD PARK
2003 ALL-CAUSE MORTALITY: 206 DEATHS,1,218.5 PER 100,000, 25.4%† DECREASE FROM 1993.2003 BIRTHS: 413 BIRTHS, FERTILITY RATE IS85.2 PER 1000, 36.5%† DECREASE FROM 1993.
INFECTIOUS DISEASE
NUMBER RATE 10-YR CHANGE HIV/AIDS Deaths 3 * --
AIDS Cases (ages 13 and older) 158 1,009.1 +169.6†
Chlamydia 417 1,997 ND
Gonorrhea 257 1,230.8 ND
Syphilis 0 * ND
Infl uenza and Pneumonia Deaths 8 * --
Tuberculosis 8 38.3§ -73.7†
Hepatitis C 37 177.2 ND
DISABILITIES (2000 CENSUS)
NUMBER PERCENT
Blind/Deaf 677 3.5
Physical 2,352 12.3
Mental 1,206 6.3
Requires Care 787 4.1
Home-Bound 2,278 15.7
Unable to Work 2,116 17.2
MATERNAL HEALTH
NUMBER PCT 10-YR CHANGE First Trimester Prenatal Care 272 65.9 +7.9†
Smoking 54 13.1 -29.2†
Caesarean Section 90 21.8 +41.4†
INFANT AND CHILD HEALTH
NUMBER RATE/PCT 10-YR CHANGE Very Low Birthweight (P) 19 4.6§ +50.5†
Premature Birth (P) 72 17.4 +19
Fetal Mortality (R) #
Infant Mortality (R) 2 * --
Lead Screening
Screened (P) 996 39.5 ND
Elevated(P) 139 14 ND
CANCER DEATHS
NUMBER RATE 10-YR CHANGE All-cancers 38 238.7 -21.8
Breast 5 * --
Colon 2 * --
Lung 9 * --
Prostate 8 * --
UNNATURAL CAUSES OF DEATH
NUMBER RATE 10-YR CHANGE Accidents 17 * --
Homicide 14 * --
Suicide 1 * --
CHRONIC DISEASE DEATHS
NUMBER RATE 10-YR CHANGE Heart Disease 58 346.5 -25.4†
Stroke 4 * --
Lower Respiratory Disease 7 * --
Diabetes Mellitus 7 * --
Liver Disease and Cirrohosis 1 * --
Alzheimer’s Disease 2 * --
Health Status Index Series Vol XV No II, pg. 63
The reference year for 10-YR CHANGE is 1993. 10-YR CHANGE is the relative percent change over time (e.g. 10% change is from 20 to 22) not the absolute percent change over time (e.g. 10% change is from 20 to 30). See methods section for more detail. Calculation of 10-YR CHANGE using 1993 mortality data are comparability-adjusted.
*Rate or percent suppressed because count is less than 5 (or less than 21 for age-adjusted rates).§Use caution when interpreting data based on 20 or fewer events, the rate/percent is unreliable. See methods for more information.
†Signifi cant difference (0.1 level)ND = No Data, data not collected in 1993 to calculate 10-YR CHANGE.# = 2003 fetal mortality data not available at time of publication.
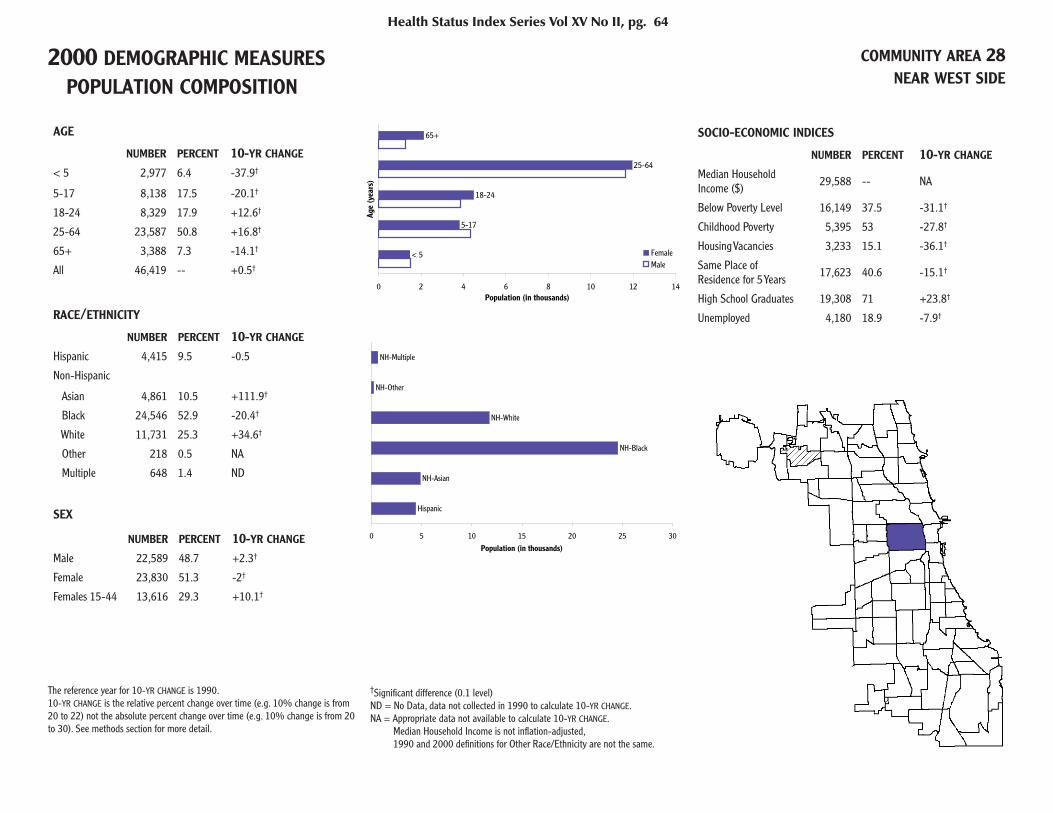
2000 DEMOGRAPHIC MEASURES POPULATION COMPOSITION
COMMUNITY AREA 28NEAR WEST SIDE
AGE
NUMBER PERCENT 10-YR CHANGE < 5 2,977 6.4 -37.9†
5-17 8,138 17.5 -20.1†
18-24 8,329 17.9 +12.6†
25-64 23,587 50.8 +16.8†
65+ 3,388 7.3 -14.1†
All 46,419 -- +0.5†
RACE/ETHNICITY
NUMBER PERCENT 10-YR CHANGE Hispanic 4,415 9.5 -0.5
Non-Hispanic
Asian 4,861 10.5 +111.9†
Black 24,546 52.9 -20.4†
White 11,731 25.3 +34.6†
Other 218 0.5 NA
Multiple 648 1.4 ND
SEX
NUMBER PERCENT 10-YR CHANGE Male 22,589 48.7 +2.3†
Female 23,830 51.3 -2†
Females 15-44 13,616 29.3 +10.1†
SOCIO-ECONOMIC INDICES
NUMBER PERCENT 10-YR CHANGE
Median Household Income ($) 29,588 -- NA
Below Poverty Level 16,149 37.5 -31.1†
Childhood Poverty 5,395 53 -27.8†
Housing Vacancies 3,233 15.1 -36.1†
Same Place of Residence for 5 Years 17,623 40.6 -15.1†
High School Graduates 19,308 71 +23.8†
Unemployed 4,180 18.9 -7.9†
Health Status Index Series Vol XV No II, pg. 64
< 5
5-17
18-24
25-64
65+
0 2 4 6 8 10 12 14
Age
(yea
rs)
Population (in thousands)
FemaleMale
Hispanic
NH-Asian
NH-Black
NH-White
NH-Other
NH-Multiple
0 5 10 15 20 25 30
Population (in thousands)
The reference year for 10-YR CHANGE is 1990.10-YR CHANGE is the relative percent change over time (e.g. 10% change is from 20 to 22) not the absolute percent change over time (e.g. 10% change is from 20 to 30). See methods section for more detail.
†Signifi cant difference (0.1 level)ND = No Data, data not collected in 1990 to calculate 10-YR CHANGE.NA = Appropriate data not available to calculate 10-YR CHANGE. Median Household Income is not infl ation-adjusted, 1990 and 2000 defi nitions for Other Race/Ethnicity are not the same.

2003 HEALTH MEASURES COMMUNITY AREA 28NEAR WEST SIDE
2003 ALL-CAUSE MORTALITY: 282 DEATHS,938.7 PER 100,000, 36.6%† DECREASE FROM 1993.2003 BIRTHS: 798 BIRTHS, FERTILITY RATE IS58.6 PER 1000, 56.6%† DECREASE FROM 1993.
INFECTIOUS DISEASE
NUMBER RATE 10-YR CHANGE HIV/AIDS Deaths 7 * --
AIDS Cases (ages 13 and older) 257 668.1 +150.8†
Chlamydia 455 980.2 ND
Gonorrhea 257 553.7 ND
Syphilis < 5 * ND
Infl uenza and Pneumonia Deaths 4 * --
Tuberculosis 7 15.1§ -80.1†
Hepatitis C 47 101.3 ND
DISABILITIES (2000 CENSUS)
NUMBER PERCENT
Blind/Deaf 1,403 3.2
Physical 4,175 9.6
Mental 2,675 6.2
Requires Care 1,675 3.9
Home-Bound 4,611 12.6
Unable to Work 3,451 10.4
MATERNAL HEALTH
NUMBER PCT 10-YR CHANGE First Trimester Prenatal Care 624 78.2 +26.3†
Smoking 86 10.8 -35.1†
Caesarean Section 176 22.1 +53.9†
INFANT AND CHILD HEALTH
NUMBER RATE/PCT 10-YR CHANGE Very Low Birthweight (P) 19 2.4§ -22.5
Premature Birth (P) 106 13.3 -9.6
Fetal Mortality (R) #
Infant Mortality (R) 8 10§ -52.4†
Lead Screening
Screened (P) 1,246 29.1 ND
Elevated(P) 89 7.1 ND
CANCER DEATHS
NUMBER RATE 10-YR CHANGE All-cancers 52 182.4 -46.7†
Breast 6 * --
Colon 5 * --
Lung 13 * --
Prostate 2 * --
UNNATURAL CAUSES OF DEATH
NUMBER RATE 10-YR CHANGE Accidents 18 * --
Homicide 14 * --
Suicide 3 * --
CHRONIC DISEASE DEATHS
NUMBER RATE 10-YR CHANGE Heart Disease 90 319.6 -23.2†
Stroke 11 * --
Lower Respiratory Disease 10 * --
Diabetes Mellitus 6 * --
Liver Disease and Cirrohosis 1 * --
Alzheimer’s Disease 2 * --
Health Status Index Series Vol XV No II, pg. 65
The reference year for 10-YR CHANGE is 1993. 10-YR CHANGE is the relative percent change over time (e.g. 10% change is from 20 to 22) not the absolute percent change over time (e.g. 10% change is from 20 to 30). See methods section for more detail. Calculation of 10-YR CHANGE using 1993 mortality data are comparability-adjusted.
*Rate or percent suppressed because count is less than 5 (or less than 21 for age-adjusted rates).§Use caution when interpreting data based on 20 or fewer events, the rate/percent is unreliable. See methods for more information.
†Signifi cant difference (0.1 level)ND = No Data, data not collected in 1993 to calculate 10-YR CHANGE.# = 2003 fetal mortality data not available at time of publication.

2000 DEMOGRAPHIC MEASURES POPULATION COMPOSITION
COMMUNITY AREA 29NORTH LAWNDALE
AGE
NUMBER PERCENT 10-YR CHANGE < 5 4,020 9.6 -7.7†
5-17 11,929 28.6 +10†
18-24 4,356 10.4 -11.1†
25-64 17,576 42.1 -3†
65+ 3,887 9.3 +9.4†
All 41,768 -- -11.7†
RACE/ETHNICITY
NUMBER PERCENT 10-YR CHANGE Hispanic 1,896 4.5 +46†
Non-Hispanic
Asian 54 0.1 +85.3†
Black 39,164 93.8 -2.3†
White 383 0.9 +21.1†
Other 60 0.1 NA
Multiple 211 0.5 ND
SEX
NUMBER PERCENT 10-YR CHANGE Male 18,581 44.5 -4.2†
Female 23,187 55.5 +3.6†
Females 15-44 10,183 24.4 -1.1
SOCIO-ECONOMIC INDICES
NUMBER PERCENT 10-YR CHANGE
Median Household Income ($) 18,342 -- NA
Below Poverty Level 18,485 45.2 -6.6†
Childhood Poverty 8,989 59.1 -7.3†
Housing Vacancies 2,218 15.2 +40†
Same Place of Residence for 5 Years 25,584 67.8 +8.3†
High School Graduates 12,978 60.5 +25.8†
Unemployed 3,304 25.8 -5.4†
Health Status Index Series Vol XV No II, pg. 66
< 5
5-17
18-24
25-64
65+
0 2 4 6 8 10 12
Age
(yea
rs)
Population (in thousands)
FemaleMale
Hispanic
NH-Asian
NH-Black
NH-White
NH-Other
NH-Multiple
0 5 10 15 20 25 30 35 40 45
Population (in thousands)
The reference year for 10-YR CHANGE is 1990.10-YR CHANGE is the relative percent change over time (e.g. 10% change is from 20 to 22) not the absolute percent change over time (e.g. 10% change is from 20 to 30). See methods section for more detail.
†Signifi cant difference (0.1 level)ND = No Data, data not collected in 1990 to calculate 10-YR CHANGE.NA = Appropriate data not available to calculate 10-YR CHANGE. Median Household Income is not infl ation-adjusted, 1990 and 2000 defi nitions for Other Race/Ethnicity are not the same.

2003 HEALTH MEASURES COMMUNITY AREA 29NORTH LAWNDALE
2003 ALL-CAUSE MORTALITY: 344 DEATHS,1,096.4 PER 100,000, 25%† DECREASE FROM 1993.2003 BIRTHS: 808 BIRTHS, FERTILITY RATE IS79.3 PER 1000, 46.5%† DECREASE FROM 1993.
INFECTIOUS DISEASE
NUMBER RATE 10-YR CHANGE HIV/AIDS Deaths 2 * --
AIDS Cases (ages 13 and older) 162 542 +164.3†
Chlamydia 904 2164 ND
Gonorrhea 472 1,130.1 ND
Syphilis < 5 * ND
Infl uenza and Pneumonia Deaths 8 * --
Tuberculosis 12 28.7§ -60.1†
Hepatitis C 63 150.8 ND
DISABILITIES (2000 CENSUS)
NUMBER PERCENT
Blind/Deaf 1,406 3.7
Physical 4,083 10.8
Mental 2,412 6.4
Requires Care 1,510 4
Home-Bound 4,685 17.1
Unable to Work 3,453 14.7
MATERNAL HEALTH
NUMBER PCT 10-YR CHANGE First Trimester Prenatal Care 595 73.6 +20†
Smoking 124 15.3 +14.9†
Caesarean Section 193 23.9 +35.9†
INFANT AND CHILD HEALTH
NUMBER RATE/PCT 10-YR CHANGE Very Low Birthweight (P) 28 3.5 +3.4
Premature Birth (P) 124 15.3 +4.5
Fetal Mortality (R) #
Infant Mortality (R) 11 13.6§ -5.8
Lead Screening
Screened (P) 2,537 43.2 ND
Elevated(P) 328 12.9 ND
CANCER DEATHS
NUMBER RATE 10-YR CHANGE All-cancers 78 259.2 -19.4†
Breast 7 * --
Colon 6 * --
Lung 23 80.2 -9.8
Prostate 4 * --
UNNATURAL CAUSES OF DEATH
NUMBER RATE 10-YR CHANGE Accidents 15 * --
Homicide 18 * --
Suicide 3 * --
CHRONIC DISEASE DEATHS
NUMBER RATE 10-YR CHANGE Heart Disease 90 296.6 -27.5†
Stroke 23 75.3 -5.6
Lower Respiratory Disease 12 * --
Diabetes Mellitus 10 * --
Liver Disease and Cirrohosis 4 * --
Alzheimer’s Disease 0 * --
Health Status Index Series Vol XV No II, pg. 67
The reference year for 10-YR CHANGE is 1993. 10-YR CHANGE is the relative percent change over time (e.g. 10% change is from 20 to 22) not the absolute percent change over time (e.g. 10% change is from 20 to 30). See methods section for more detail. Calculation of 10-YR CHANGE using 1993 mortality data are comparability-adjusted.
*Rate or percent suppressed because count is less than 5 (or less than 21 for age-adjusted rates).§Use caution when interpreting data based on 20 or fewer events, the rate/percent is unreliable. See methods for more information.
†Signifi cant difference (0.1 level)ND = No Data, data not collected in 1993 to calculate 10-YR CHANGE.# = 2003 fetal mortality data not available at time of publication.
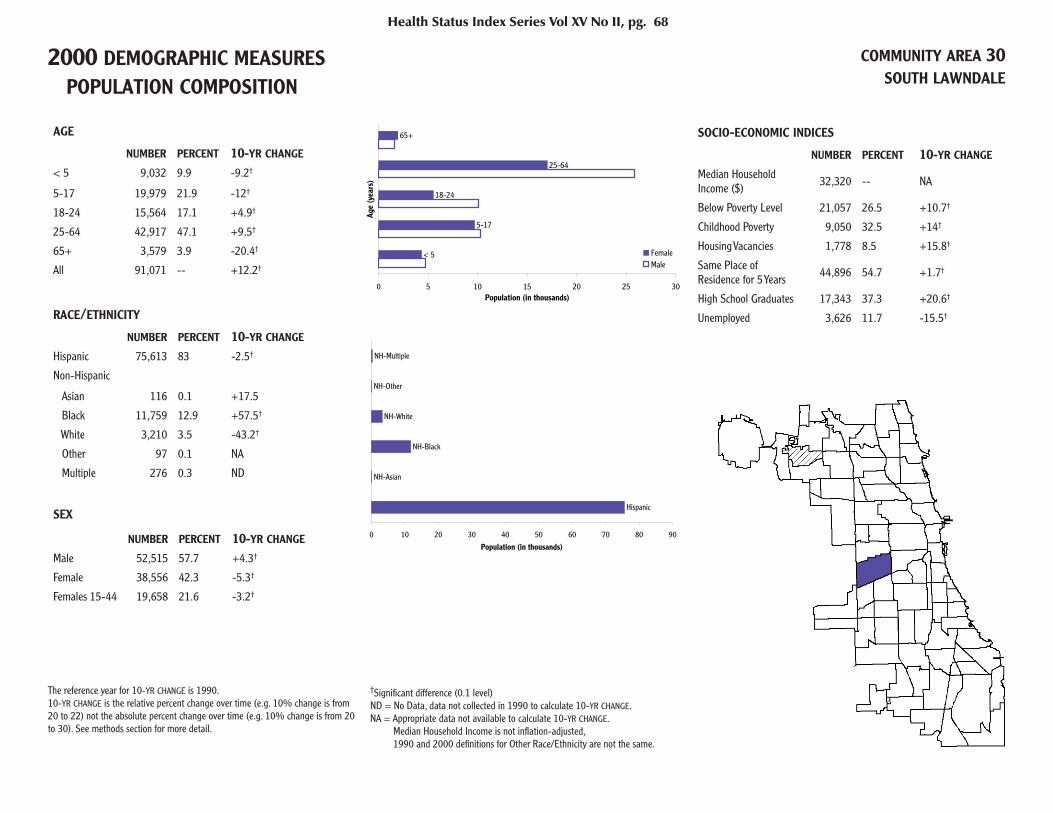
2000 DEMOGRAPHIC MEASURES POPULATION COMPOSITION
COMMUNITY AREA 30SOUTH LAWNDALE
AGE
NUMBER PERCENT 10-YR CHANGE < 5 9,032 9.9 -9.2†
5-17 19,979 21.9 -12†
18-24 15,564 17.1 +4.9†
25-64 42,917 47.1 +9.5†
65+ 3,579 3.9 -20.4†
All 91,071 -- +12.2†
RACE/ETHNICITY
NUMBER PERCENT 10-YR CHANGE Hispanic 75,613 83 -2.5†
Non-Hispanic
Asian 116 0.1 +17.5
Black 11,759 12.9 +57.5†
White 3,210 3.5 -43.2†
Other 97 0.1 NA
Multiple 276 0.3 ND
SEX
NUMBER PERCENT 10-YR CHANGE Male 52,515 57.7 +4.3†
Female 38,556 42.3 -5.3†
Females 15-44 19,658 21.6 -3.2†
SOCIO-ECONOMIC INDICES
NUMBER PERCENT 10-YR CHANGE
Median Household Income ($) 32,320 -- NA
Below Poverty Level 21,057 26.5 +10.7†
Childhood Poverty 9,050 32.5 +14†
Housing Vacancies 1,778 8.5 +15.8†
Same Place of Residence for 5 Years 44,896 54.7 +1.7†
High School Graduates 17,343 37.3 +20.6†
Unemployed 3,626 11.7 -15.5†
Health Status Index Series Vol XV No II, pg. 68
< 5
5-17
18-24
25-64
65+
0 5 10 15 20 25 30
Age
(yea
rs)
Population (in thousands)
FemaleMale
Hispanic
NH-Asian
NH-Black
NH-White
NH-Other
NH-Multiple
0 10 20 30 40 50 60 70 80 90
Population (in thousands)
The reference year for 10-YR CHANGE is 1990.10-YR CHANGE is the relative percent change over time (e.g. 10% change is from 20 to 22) not the absolute percent change over time (e.g. 10% change is from 20 to 30). See methods section for more detail.
†Signifi cant difference (0.1 level)ND = No Data, data not collected in 1990 to calculate 10-YR CHANGE.NA = Appropriate data not available to calculate 10-YR CHANGE. Median Household Income is not infl ation-adjusted, 1990 and 2000 defi nitions for Other Race/Ethnicity are not the same.
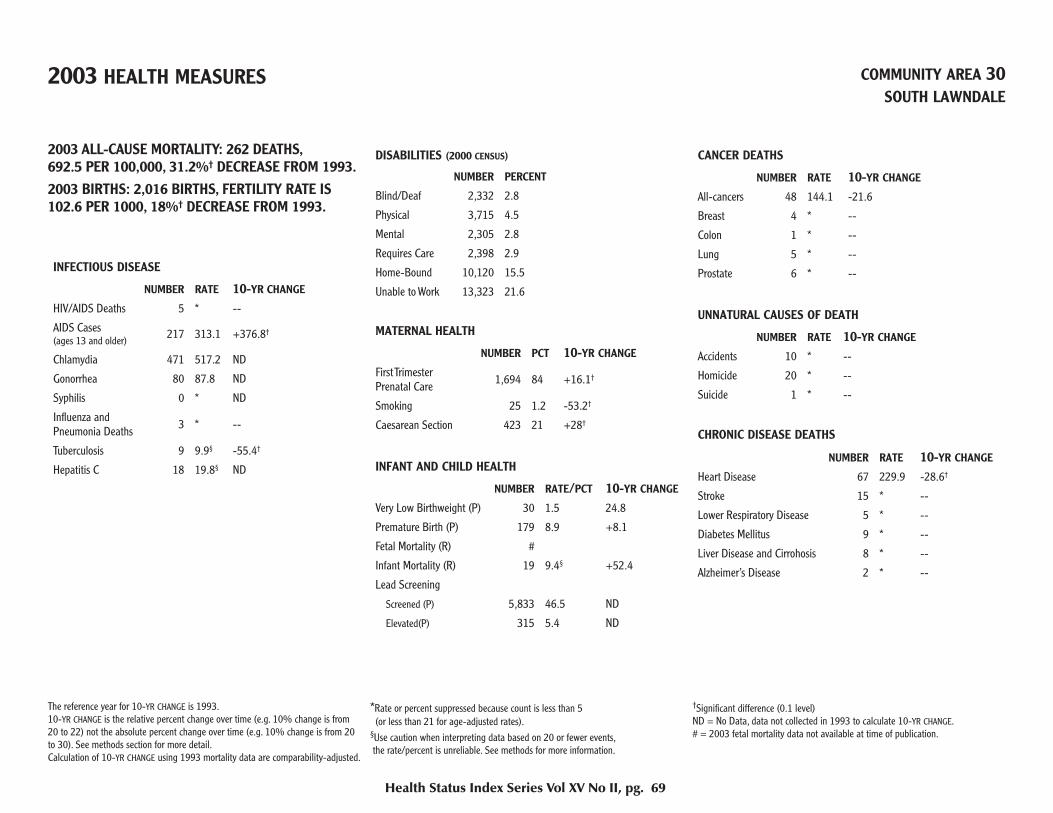
2003 HEALTH MEASURES COMMUNITY AREA 30SOUTH LAWNDALE
2003 ALL-CAUSE MORTALITY: 262 DEATHS,692.5 PER 100,000, 31.2%† DECREASE FROM 1993.2003 BIRTHS: 2,016 BIRTHS, FERTILITY RATE IS102.6 PER 1000, 18%† DECREASE FROM 1993.
INFECTIOUS DISEASE
NUMBER RATE 10-YR CHANGE HIV/AIDS Deaths 5 * --
AIDS Cases (ages 13 and older) 217 313.1 +376.8†
Chlamydia 471 517.2 ND
Gonorrhea 80 87.8 ND
Syphilis 0 * ND
Infl uenza and Pneumonia Deaths 3 * --
Tuberculosis 9 9.9§ -55.4†
Hepatitis C 18 19.8§ ND
DISABILITIES (2000 CENSUS)
NUMBER PERCENT
Blind/Deaf 2,332 2.8
Physical 3,715 4.5
Mental 2,305 2.8
Requires Care 2,398 2.9
Home-Bound 10,120 15.5
Unable to Work 13,323 21.6
MATERNAL HEALTH
NUMBER PCT 10-YR CHANGE First Trimester Prenatal Care 1,694 84 +16.1†
Smoking 25 1.2 -53.2†
Caesarean Section 423 21 +28†
INFANT AND CHILD HEALTH
NUMBER RATE/PCT 10-YR CHANGE Very Low Birthweight (P) 30 1.5 24.8
Premature Birth (P) 179 8.9 +8.1
Fetal Mortality (R) #
Infant Mortality (R) 19 9.4§ +52.4
Lead Screening
Screened (P) 5,833 46.5 ND
Elevated(P) 315 5.4 ND
CANCER DEATHS
NUMBER RATE 10-YR CHANGE All-cancers 48 144.1 -21.6
Breast 4 * --
Colon 1 * --
Lung 5 * --
Prostate 6 * --
UNNATURAL CAUSES OF DEATH
NUMBER RATE 10-YR CHANGE Accidents 10 * --
Homicide 20 * --
Suicide 1 * --
CHRONIC DISEASE DEATHS
NUMBER RATE 10-YR CHANGE Heart Disease 67 229.9 -28.6†
Stroke 15 * --
Lower Respiratory Disease 5 * --
Diabetes Mellitus 9 * --
Liver Disease and Cirrohosis 8 * --
Alzheimer’s Disease 2 * --
Health Status Index Series Vol XV No II, pg. 69
The reference year for 10-YR CHANGE is 1993. 10-YR CHANGE is the relative percent change over time (e.g. 10% change is from 20 to 22) not the absolute percent change over time (e.g. 10% change is from 20 to 30). See methods section for more detail. Calculation of 10-YR CHANGE using 1993 mortality data are comparability-adjusted.
*Rate or percent suppressed because count is less than 5 (or less than 21 for age-adjusted rates).§Use caution when interpreting data based on 20 or fewer events, the rate/percent is unreliable. See methods for more information.
†Signifi cant difference (0.1 level)ND = No Data, data not collected in 1993 to calculate 10-YR CHANGE.# = 2003 fetal mortality data not available at time of publication.

2000 DEMOGRAPHIC MEASURES POPULATION COMPOSITION
COMMUNITY AREA 31LOWER WEST SIDE
AGE
NUMBER PERCENT 10-YR CHANGE < 5 4,677 10.6 -7.8†
5-17 9,905 22.5 -10.4†
18-24 6,406 14.5 -5.2†
25-64 20,547 46.7 +10.1†
65+ 2,496 5.7 0
All 44,031 -- -3.6†
RACE/ETHNICITY
NUMBER PERCENT 10-YR CHANGE Hispanic 39,144 88.9 +0.9†
Non-Hispanic
Asian 121 0.3 +84.5†
Black 774 1.8 +98.6†
White 3,587 8.1 -22.6†
Other 104 0.2 NA
Multiple 301 0.7 ND
SEX
NUMBER PERCENT 10-YR CHANGE Male 23,379 53.1 0
Female 20,652 46.9 0
Females 15-44 10,328 23.5 +2.9†
SOCIO-ECONOMIC INDICES
NUMBER PERCENT 10-YR CHANGE
Median Household Income ($) 27,763 -- NA
Below Poverty Level 11,841 27 -3.0†
Childhood Poverty 5,042 35.3 -2.4†
Housing Vacancies 1,613 11.2 +1.5
Same Place of Residence for 5 Years 22,163 56.3 +2.4†
High School Graduates 10,013 43.5 +34.7†
Unemployed 1,691 9.1 -27.7†
Health Status Index Series Vol XV No II, pg. 70
< 5
5-17
18-24
25-64
65+
0 2 4 6 8 10 12
Age
(yea
rs)
Population (in thousands)
FemaleMale
Hispanic
NH-Asian
NH-Black
NH-White
NH-Other
NH-Multiple
0 5 10 15 20 25 30 35 40 45
Population (in thousands)
The reference year for 10-YR CHANGE is 1990.10-YR CHANGE is the relative percent change over time (e.g. 10% change is from 20 to 22) not the absolute percent change over time (e.g. 10% change is from 20 to 30). See methods section for more detail.
†Signifi cant difference (0.1 level)ND = No Data, data not collected in 1990 to calculate 10-YR CHANGE.NA = Appropriate data not available to calculate 10-YR CHANGE. Median Household Income is not infl ation-adjusted, 1990 and 2000 defi nitions for Other Race/Ethnicity are not the same.

2003 HEALTH MEASURES COMMUNITY AREA 31LOWER WEST SIDE
2003 ALL-CAUSE MORTALITY: 154 DEATHS,677.1 PER 100,000, 34.3%† DECREASE FROM 1993.2003 BIRTHS: 921 BIRTHS, FERTILITY RATE IS89.2 PER 1000, 34.8%† DECREASE FROM 1993.
INFECTIOUS DISEASE
NUMBER RATE 10-YR CHANGE HIV/AIDS Deaths 2 * --
AIDS Cases (ages 13 and older) 74 224.5 +254.1†
Chlamydia 186 422.4 ND
Gonorrhea 48 109 ND
Syphilis < 5 * ND
Infl uenza and Pneumonia Deaths 4 * --
Tuberculosis 4 * --
Hepatitis C 14 31.8§ ND
DISABILITIES (2000 CENSUS)
NUMBER PERCENT
Blind/Deaf 1,337 3.4
Physical 2,318 5.9
Mental 1,416 3.6
Requires Care 827 2.1
Home-Bound 4,401 14.2
Unable to Work 5,325 18.7
MATERNAL HEALTH
NUMBER PCT 10-YR CHANGE First Trimester Prenatal Care 709 77 +11.9†
Smoking 20 2.2§ -29.8†
Caesarean Section 189 20.5 +32.1†
INFANT AND CHILD HEALTH
NUMBER RATE/PCT 10-YR CHANGE Very Low Birthweight (P) 15 1.6§ 54.5
Premature Birth (P) 84 9.1 +31.1†
Fetal Mortality (R) #
Infant Mortality (R) 9 9.8§ +54.5
Lead Screening
Screened (P) 2,776 42.6 ND
Elevated(P) 134 4.8 ND
CANCER DEATHS
NUMBER RATE 10-YR CHANGE All-cancers 32 148.3 -20.9
Breast 1 * --
Colon 3 * --
Lung 8 * --
Prostate 1 * --
UNNATURAL CAUSES OF DEATH
NUMBER RATE 10-YR CHANGE Accidents 12 * --
Homicide 6 * --
Suicide 0 * --
CHRONIC DISEASE DEATHS
NUMBER RATE 10-YR CHANGE Heart Disease 34 177 -53†
Stroke 9 * --
Lower Respiratory Disease 4 * --
Diabetes Mellitus 11 * --
Liver Disease and Cirrohosis 5 * --
Alzheimer’s Disease 3 * --
Health Status Index Series Vol XV No II, pg. 71
The reference year for 10-YR CHANGE is 1993. 10-YR CHANGE is the relative percent change over time (e.g. 10% change is from 20 to 22) not the absolute percent change over time (e.g. 10% change is from 20 to 30). See methods section for more detail. Calculation of 10-YR CHANGE using 1993 mortality data are comparability-adjusted.
*Rate or percent suppressed because count is less than 5 (or less than 21 for age-adjusted rates).§Use caution when interpreting data based on 20 or fewer events, the rate/percent is unreliable. See methods for more information.
†Signifi cant difference (0.1 level)ND = No Data, data not collected in 1993 to calculate 10-YR CHANGE.# = 2003 fetal mortality data not available at time of publication.
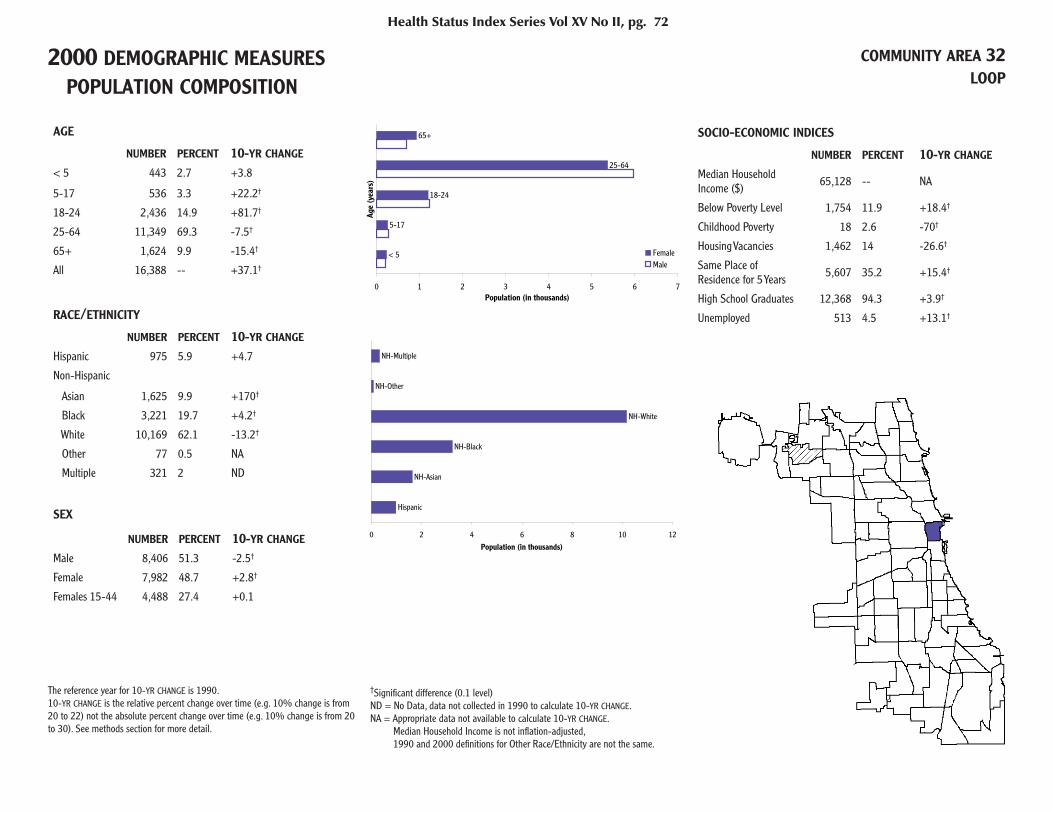
2000 DEMOGRAPHIC MEASURES POPULATION COMPOSITION
COMMUNITY AREA 32LOOP
AGE
NUMBER PERCENT 10-YR CHANGE < 5 443 2.7 +3.8
5-17 536 3.3 +22.2†
18-24 2,436 14.9 +81.7†
25-64 11,349 69.3 -7.5†
65+ 1,624 9.9 -15.4†
All 16,388 -- +37.1†
RACE/ETHNICITY
NUMBER PERCENT 10-YR CHANGE Hispanic 975 5.9 +4.7
Non-Hispanic
Asian 1,625 9.9 +170†
Black 3,221 19.7 +4.2†
White 10,169 62.1 -13.2†
Other 77 0.5 NA
Multiple 321 2 ND
SEX
NUMBER PERCENT 10-YR CHANGE Male 8,406 51.3 -2.5†
Female 7,982 48.7 +2.8†
Females 15-44 4,488 27.4 +0.1
SOCIO-ECONOMIC INDICES
NUMBER PERCENT 10-YR CHANGE
Median Household Income ($) 65,128 -- NA
Below Poverty Level 1,754 11.9 +18.4†
Childhood Poverty 18 2.6 -70†
Housing Vacancies 1,462 14 -26.6†
Same Place of Residence for 5 Years 5,607 35.2 +15.4†
High School Graduates 12,368 94.3 +3.9†
Unemployed 513 4.5 +13.1†
Health Status Index Series Vol XV No II, pg. 72
< 5
5-17
18-24
25-64
65+
0 1 2 3 4 5 6 7
Age
(yea
rs)
Population (in thousands)
FemaleMale
Hispanic
NH-Asian
NH-Black
NH-White
NH-Other
NH-Multiple
0 2 4 6 8 10 12
Population (in thousands)
The reference year for 10-YR CHANGE is 1990.10-YR CHANGE is the relative percent change over time (e.g. 10% change is from 20 to 22) not the absolute percent change over time (e.g. 10% change is from 20 to 30). See methods section for more detail.
†Signifi cant difference (0.1 level)ND = No Data, data not collected in 1990 to calculate 10-YR CHANGE.NA = Appropriate data not available to calculate 10-YR CHANGE. Median Household Income is not infl ation-adjusted, 1990 and 2000 defi nitions for Other Race/Ethnicity are not the same.

2003 HEALTH MEASURES COMMUNITY AREA 32LOOP
2003 ALL-CAUSE MORTALITY: 92 DEATHS,686.5 PER 100,000, 30.6%† DECREASE FROM 1993.2003 BIRTHS: 148 BIRTHS, FERTILITY RATE IS33 PER 1000, 38.4%† DECREASE FROM 1993.
INFECTIOUS DISEASE
NUMBER RATE 10-YR CHANGE HIV/AIDS Deaths 2 * --
AIDS Cases(ages 13 and older) 75 480.5 +71.6†
Chlamydia 40 244.1 ND
Gonorrhea 19 115.9§ ND
Syphilis < 5 * ND
Infl uenza and Pneumonia Deaths 3 * --
Tuberculosis 4 * --
Hepatitis C 7 42.7§ ND
DISABILITIES (2000 CENSUS)
NUMBER PERCENT
Blind/Deaf 398 2.5
Physical 641 4
Mental 405 2.5
Requires Care 165 1
Home-Bound 477 3.1
Unable to Work 532 3.8
MATERNAL HEALTH
NUMBER PCT 10-YR CHANGE First Trimester Prenatal Care 127 85.8 -3.1
Smoking 2 * --
Caesarean Section 36 24.3 +29
INFANT AND CHILD HEALTH
NUMBER RATE/PCT 10-YR CHANGE Very Low Birthweight (P) 2 * --
Premature Birth (P) 12 8.1§ -25.3
Fetal Mortality (R) #
Infant Mortality (R) 1 * --
Lead Screening
Screened (P) 153 28.8 ND
Elevated(P) 4 * ND
CANCER DEATHS
NUMBER RATE 10-YR CHANGE All-cancers 30 204.3 --
Breast 2 * --
Colon 4 * --
Lung 9 * --
Prostate 1 * --
UNNATURAL CAUSES OF DEATH
NUMBER RATE 10-YR CHANGE Accidents 4 * --
Homicide 0 * --
Suicide 1 * --
CHRONIC DISEASE DEATHS
NUMBER RATE 10-YR CHANGE Heart Disease 23 176.9 -21.8
Stroke 3 * --
Lower Respiratory Disease 4 * --
Diabetes Mellitus 2 * --
Liver Disease and Cirrohosis 0 * --
Alzheimer’s Disease 0 * --
Health Status Index Series Vol XV No II, pg. 73
The reference year for 10-YR CHANGE is 1993. 10-YR CHANGE is the relative percent change over time (e.g. 10% change is from 20 to 22) not the absolute percent change over time (e.g. 10% change is from 20 to 30). See methods section for more detail. Calculation of 10-YR CHANGE using 1993 mortality data are comparability-adjusted.
*Rate or percent suppressed because count is less than 5 (or less than 21 for age-adjusted rates).§Use caution when interpreting data based on 20 or fewer events, the rate/percent is unreliable. See methods for more information.
†Signifi cant difference (0.1 level)ND = No Data, data not collected in 1993 to calculate 10-YR CHANGE.# = 2003 fetal mortality data not available at time of publication.
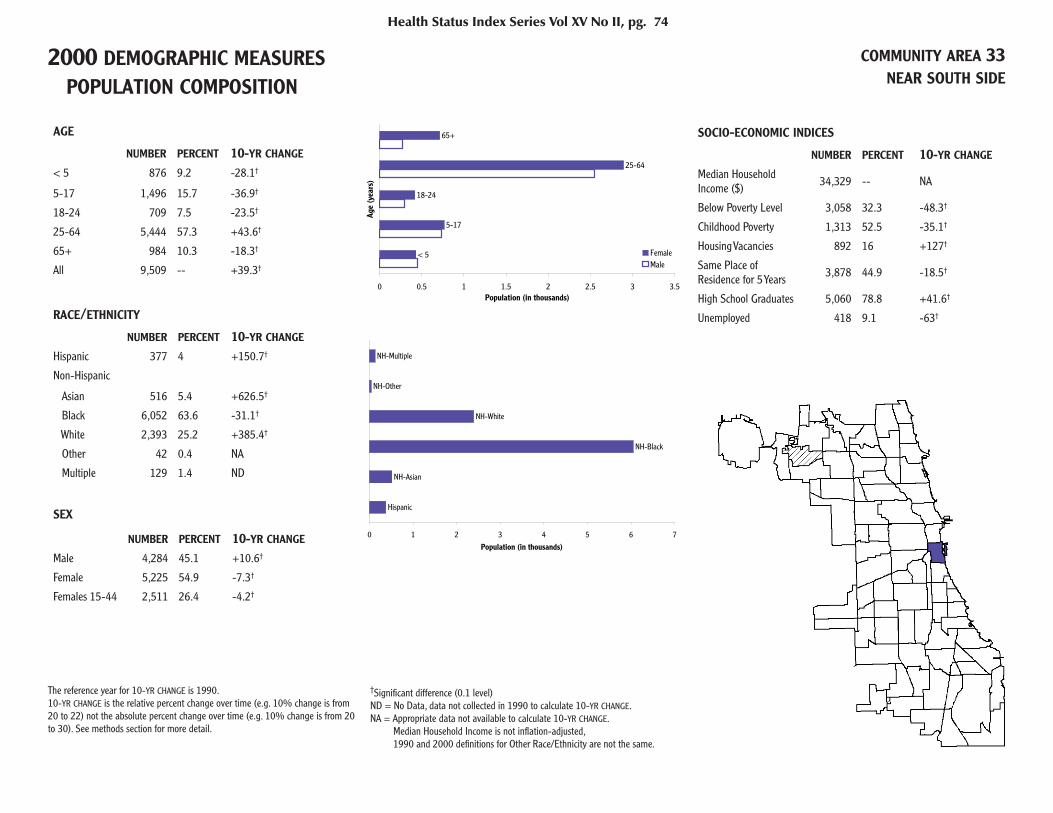
2000 DEMOGRAPHIC MEASURES POPULATION COMPOSITION
COMMUNITY AREA 33NEAR SOUTH SIDE
AGE
NUMBER PERCENT 10-YR CHANGE < 5 876 9.2 -28.1†
5-17 1,496 15.7 -36.9†
18-24 709 7.5 -23.5†
25-64 5,444 57.3 +43.6†
65+ 984 10.3 -18.3†
All 9,509 -- +39.3†
RACE/ETHNICITY
NUMBER PERCENT 10-YR CHANGE Hispanic 377 4 +150.7†
Non-Hispanic
Asian 516 5.4 +626.5†
Black 6,052 63.6 -31.1†
White 2,393 25.2 +385.4†
Other 42 0.4 NA
Multiple 129 1.4 ND
SEX
NUMBER PERCENT 10-YR CHANGE Male 4,284 45.1 +10.6†
Female 5,225 54.9 -7.3†
Females 15-44 2,511 26.4 -4.2†
SOCIO-ECONOMIC INDICES
NUMBER PERCENT 10-YR CHANGE
Median Household Income ($) 34,329 -- NA
Below Poverty Level 3,058 32.3 -48.3†
Childhood Poverty 1,313 52.5 -35.1†
Housing Vacancies 892 16 +127†
Same Place of Residence for 5 Years 3,878 44.9 -18.5†
High School Graduates 5,060 78.8 +41.6†
Unemployed 418 9.1 -63†
Health Status Index Series Vol XV No II, pg. 74
< 5
5-17
18-24
25-64
65+
0 0.5 1 1.5 2 2.5 3 3.5
Age
(yea
rs)
Population (in thousands)
FemaleMale
Hispanic
NH-Asian
NH-Black
NH-White
NH-Other
NH-Multiple
0 1 2 3 4 5 6 7
Population (in thousands)
The reference year for 10-YR CHANGE is 1990.10-YR CHANGE is the relative percent change over time (e.g. 10% change is from 20 to 22) not the absolute percent change over time (e.g. 10% change is from 20 to 30). See methods section for more detail.
†Signifi cant difference (0.1 level)ND = No Data, data not collected in 1990 to calculate 10-YR CHANGE.NA = Appropriate data not available to calculate 10-YR CHANGE. Median Household Income is not infl ation-adjusted, 1990 and 2000 defi nitions for Other Race/Ethnicity are not the same.
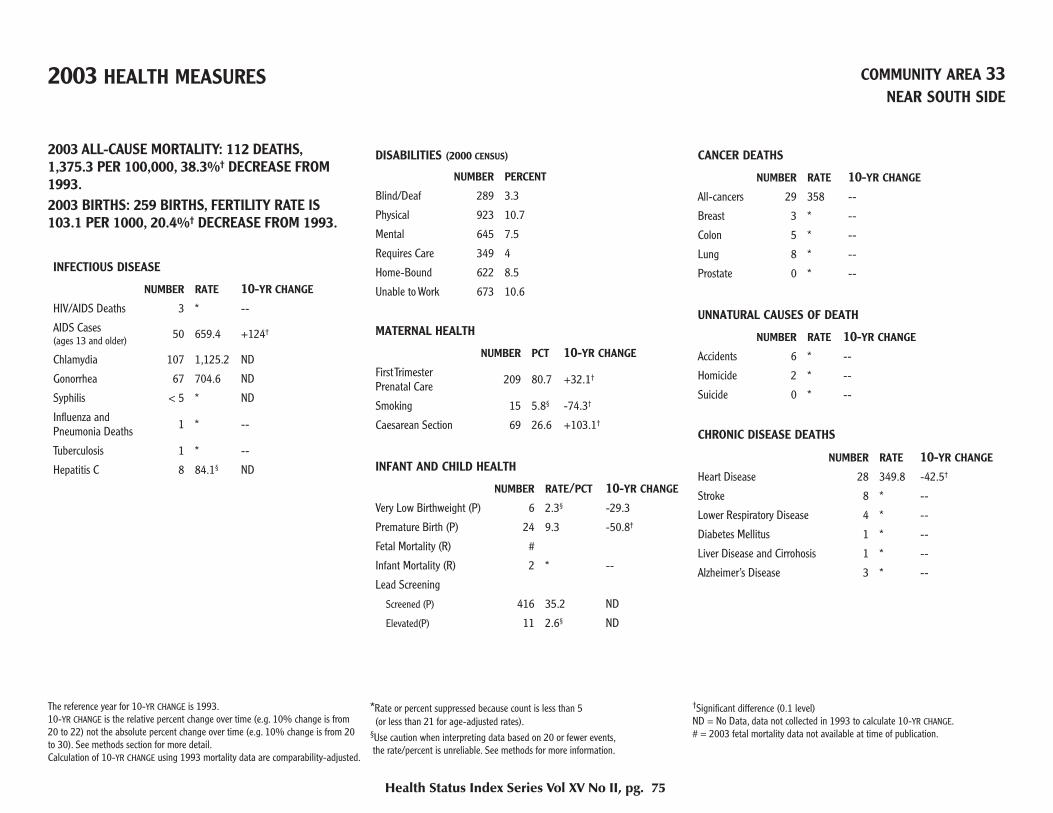
2003 HEALTH MEASURES COMMUNITY AREA 33NEAR SOUTH SIDE
2003 ALL-CAUSE MORTALITY: 112 DEATHS,1,375.3 PER 100,000, 38.3%† DECREASE FROM 1993.2003 BIRTHS: 259 BIRTHS, FERTILITY RATE IS103.1 PER 1000, 20.4%† DECREASE FROM 1993.
INFECTIOUS DISEASE
NUMBER RATE 10-YR CHANGE HIV/AIDS Deaths 3 * --
AIDS Cases (ages 13 and older) 50 659.4 +124†
Chlamydia 107 1,125.2 ND
Gonorrhea 67 704.6 ND
Syphilis < 5 * ND
Infl uenza and Pneumonia Deaths 1 * --
Tuberculosis 1 * --
Hepatitis C 8 84.1§ ND
DISABILITIES (2000 CENSUS)
NUMBER PERCENT
Blind/Deaf 289 3.3
Physical 923 10.7
Mental 645 7.5
Requires Care 349 4
Home-Bound 622 8.5
Unable to Work 673 10.6
MATERNAL HEALTH
NUMBER PCT 10-YR CHANGE First Trimester Prenatal Care 209 80.7 +32.1†
Smoking 15 5.8§ -74.3†
Caesarean Section 69 26.6 +103.1†
INFANT AND CHILD HEALTH
NUMBER RATE/PCT 10-YR CHANGE Very Low Birthweight (P) 6 2.3§ -29.3
Premature Birth (P) 24 9.3 -50.8†
Fetal Mortality (R) #
Infant Mortality (R) 2 * --
Lead Screening
Screened (P) 416 35.2 ND
Elevated(P) 11 2.6§ ND
CANCER DEATHS
NUMBER RATE 10-YR CHANGE All-cancers 29 358 --
Breast 3 * --
Colon 5 * --
Lung 8 * --
Prostate 0 * --
UNNATURAL CAUSES OF DEATH
NUMBER RATE 10-YR CHANGE Accidents 6 * --
Homicide 2 * --
Suicide 0 * --
CHRONIC DISEASE DEATHS
NUMBER RATE 10-YR CHANGE Heart Disease 28 349.8 -42.5†
Stroke 8 * --
Lower Respiratory Disease 4 * --
Diabetes Mellitus 1 * --
Liver Disease and Cirrohosis 1 * --
Alzheimer’s Disease 3 * --
Health Status Index Series Vol XV No II, pg. 75
The reference year for 10-YR CHANGE is 1993. 10-YR CHANGE is the relative percent change over time (e.g. 10% change is from 20 to 22) not the absolute percent change over time (e.g. 10% change is from 20 to 30). See methods section for more detail. Calculation of 10-YR CHANGE using 1993 mortality data are comparability-adjusted.
*Rate or percent suppressed because count is less than 5 (or less than 21 for age-adjusted rates).§Use caution when interpreting data based on 20 or fewer events, the rate/percent is unreliable. See methods for more information.
†Signifi cant difference (0.1 level)ND = No Data, data not collected in 1993 to calculate 10-YR CHANGE.# = 2003 fetal mortality data not available at time of publication.
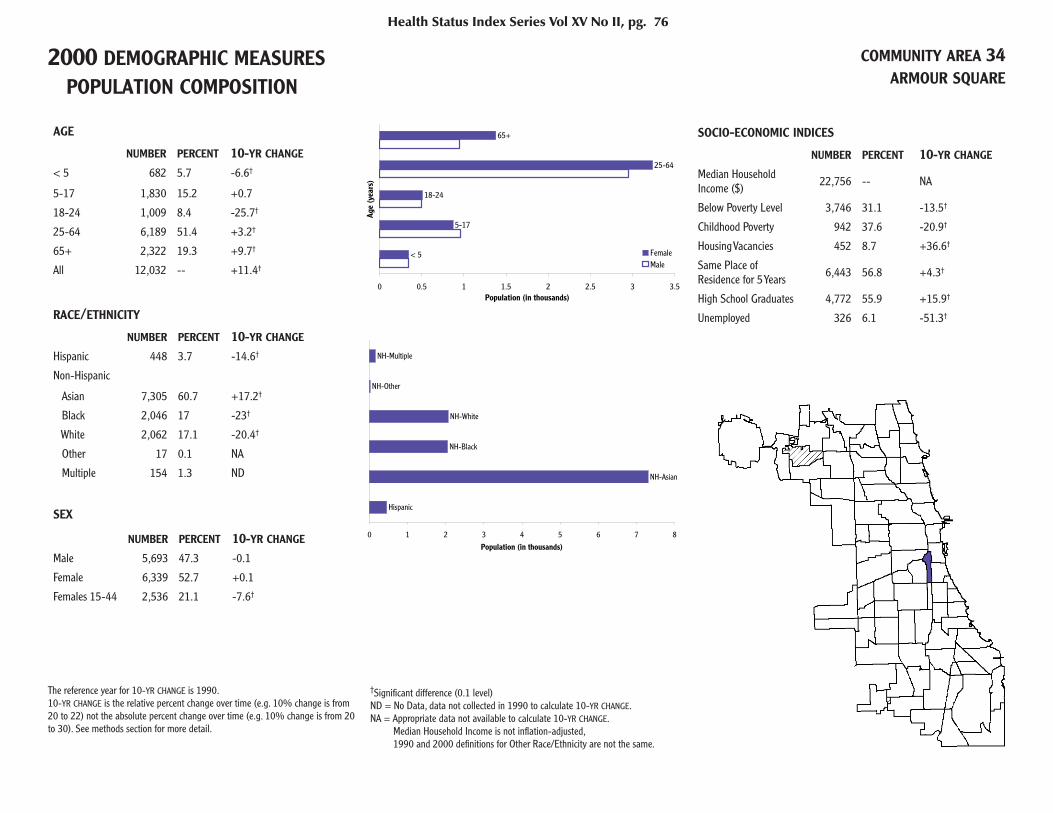
2000 DEMOGRAPHIC MEASURES POPULATION COMPOSITION
COMMUNITY AREA 34ARMOUR SQUARE
AGE
NUMBER PERCENT 10-YR CHANGE < 5 682 5.7 -6.6†
5-17 1,830 15.2 +0.7
18-24 1,009 8.4 -25.7†
25-64 6,189 51.4 +3.2†
65+ 2,322 19.3 +9.7†
All 12,032 -- +11.4†
RACE/ETHNICITY
NUMBER PERCENT 10-YR CHANGE Hispanic 448 3.7 -14.6†
Non-Hispanic
Asian 7,305 60.7 +17.2†
Black 2,046 17 -23†
White 2,062 17.1 -20.4†
Other 17 0.1 NA
Multiple 154 1.3 ND
SEX
NUMBER PERCENT 10-YR CHANGE Male 5,693 47.3 -0.1
Female 6,339 52.7 +0.1
Females 15-44 2,536 21.1 -7.6†
SOCIO-ECONOMIC INDICES
NUMBER PERCENT 10-YR CHANGE
Median Household Income ($) 22,756 -- NA
Below Poverty Level 3,746 31.1 -13.5†
Childhood Poverty 942 37.6 -20.9†
Housing Vacancies 452 8.7 +36.6†
Same Place of Residence for 5 Years 6,443 56.8 +4.3†
High School Graduates 4,772 55.9 +15.9†
Unemployed 326 6.1 -51.3†
Health Status Index Series Vol XV No II, pg. 76
< 5
5-17
18-24
25-64
65+
0 0.5 1 1.5 2 2.5 3 3.5
Age
(yea
rs)
Population (in thousands)
FemaleMale
Hispanic
NH-Asian
NH-Black
NH-White
NH-Other
NH-Multiple
0 1 2 3 4 5 6 7 8
Population (in thousands)
The reference year for 10-YR CHANGE is 1990.10-YR CHANGE is the relative percent change over time (e.g. 10% change is from 20 to 22) not the absolute percent change over time (e.g. 10% change is from 20 to 30). See methods section for more detail.
†Signifi cant difference (0.1 level)ND = No Data, data not collected in 1990 to calculate 10-YR CHANGE.NA = Appropriate data not available to calculate 10-YR CHANGE. Median Household Income is not infl ation-adjusted, 1990 and 2000 defi nitions for Other Race/Ethnicity are not the same.

2003 HEALTH MEASURES COMMUNITY AREA 34ARMOUR SQUARE
2003 ALL-CAUSE MORTALITY: 113 DEATHS,773.4 PER 100,000, 17.9%† DECREASE FROM 1993.2003 BIRTHS: 130 BIRTHS, FERTILITY RATE IS51.3 PER 1000, 29.4%† DECREASE FROM 1993.
INFECTIOUS DISEASE
NUMBER RATE 10-YR CHANGE HIV/AIDS Deaths 1 * --
AIDS Cases (ages 13 and older) 13 127.8§ +67.9
Chlamydia 47 390.6 ND
Gonorrhea 23 191.2 ND
Syphilis 0 * ND
Infl uenza and Pneumonia Deaths 3 * --
Tuberculosis 2 * --
Hepatitis C 5 41.6§ ND
DISABILITIES (2000 CENSUS)
NUMBER PERCENT
Blind/Deaf 434 3.8
Physical 1,059 9.3
Mental 554 4.9
Requires Care 428 3.8
Home-Bound 1,533 15.7
Unable to Work 1,447 19.5
MATERNAL HEALTH
NUMBER PCT 10-YR CHANGE First Trimester Prenatal Care 108 83.1 +9.3†
Smoking 3 * --
Caesarean Section 33 25.4 +56.7†
INFANT AND CHILD HEALTH
NUMBER RATE/PCT 10-YR CHANGE Very Low Birthweight (P) 5 3.8§ +72.1
Premature Birth (P) 19 14.6§ +45.3
Fetal Mortality (R) #
Infant Mortality (R) 2 * --
Lead Screening
Screened (P) 229 23.3 ND
Elevated(P) 1 * ND
CANCER DEATHS
NUMBER RATE 10-YR CHANGE All-cancers 36 226.8 -9.9
Breast 3 * --
Colon 2 * --
Lung 12 * --
Prostate 2 * --
UNNATURAL CAUSES OF DEATH
NUMBER RATE 10-YR CHANGE Accidents 6 * --
Homicide 0 * --
Suicide 1 * --
CHRONIC DISEASE DEATHS
NUMBER RATE 10-YR CHANGE Heart Disease 25 170.6 -46.3†
Stroke 8 * --
Lower Respiratory Disease 3 * --
Diabetes Mellitus 2 * --
Liver Disease and Cirrohosis 1 * --
Alzheimer’s Disease 2 * --
Health Status Index Series Vol XV No II, pg. 77
The reference year for 10-YR CHANGE is 1993. 10-YR CHANGE is the relative percent change over time (e.g. 10% change is from 20 to 22) not the absolute percent change over time (e.g. 10% change is from 20 to 30). See methods section for more detail. Calculation of 10-YR CHANGE using 1993 mortality data are comparability-adjusted.
*Rate or percent suppressed because count is less than 5 (or less than 21 for age-adjusted rates).§Use caution when interpreting data based on 20 or fewer events, the rate/percent is unreliable. See methods for more information.
†Signifi cant difference (0.1 level)ND = No Data, data not collected in 1993 to calculate 10-YR CHANGE.# = 2003 fetal mortality data not available at time of publication.

2000 DEMOGRAPHIC MEASURES POPULATION COMPOSITION
COMMUNITY AREA 35DOUGLAS
AGE
NUMBER PERCENT 10-YR CHANGE < 5 2,094 7.9 -26.9†
5-17 4,981 18.8 -10.5†
18-24 3,999 15.1 +15.3†
25-64 12,051 45.5 +7.8†
65+ 3,345 12.6 -2.3
All 26,470 -- -13.6†
RACE/ETHNICITY
NUMBER PERCENT 10-YR CHANGE Hispanic 295 1.1 +35†
Non-Hispanic
Asian 1,390 5.3 +104.3†
Black 22,635 85.5 -6.2†
White 1,745 6.6 +26.5†
Other 102 0.4 NA
Multiple 303 1.1 ND
SEX
NUMBER PERCENT 10-YR CHANGE Male 11,877 44.9 +4.5†
Female 14,593 55.1 -3.4†
Females 15-44 6,694 25.3 -2†
SOCIO-ECONOMIC INDICES
NUMBER PERCENT 10-YR CHANGE
Median Household Income ($) 24,835 -- NA
Below Poverty Level 9,699 41.2 -16.5†
Childhood Poverty 4,312 62.5 -14.1†
Housing Vacancies 2,793 20.5 +29.1†
Same Place of Residence for 5 Years 12,411 50.9 -14†
High School Graduates 11,384 73.1 +13.3†
Unemployed 3,666 31.6 +76.1†
Health Status Index Series Vol XV No II, pg. 78
< 5
5-17
18-24
25-64
65+
0 1 2 3 4 5 6 7 8
Age
(yea
rs)
Population (in thousands)
FemaleMale
Hispanic
NH-Asian
NH-Black
NH-White
NH-Other
NH-Multiple
0 5 10 15 20 25
Population (in thousands)
The reference year for 10-YR CHANGE is 1990.10-YR CHANGE is the relative percent change over time (e.g. 10% change is from 20 to 22) not the absolute percent change over time (e.g. 10% change is from 20 to 30). See methods section for more detail.
†Signifi cant difference (0.1 level)ND = No Data, data not collected in 1990 to calculate 10-YR CHANGE.NA = Appropriate data not available to calculate 10-YR CHANGE. Median Household Income is not infl ation-adjusted, 1990 and 2000 defi nitions for Other Race/Ethnicity are not the same.
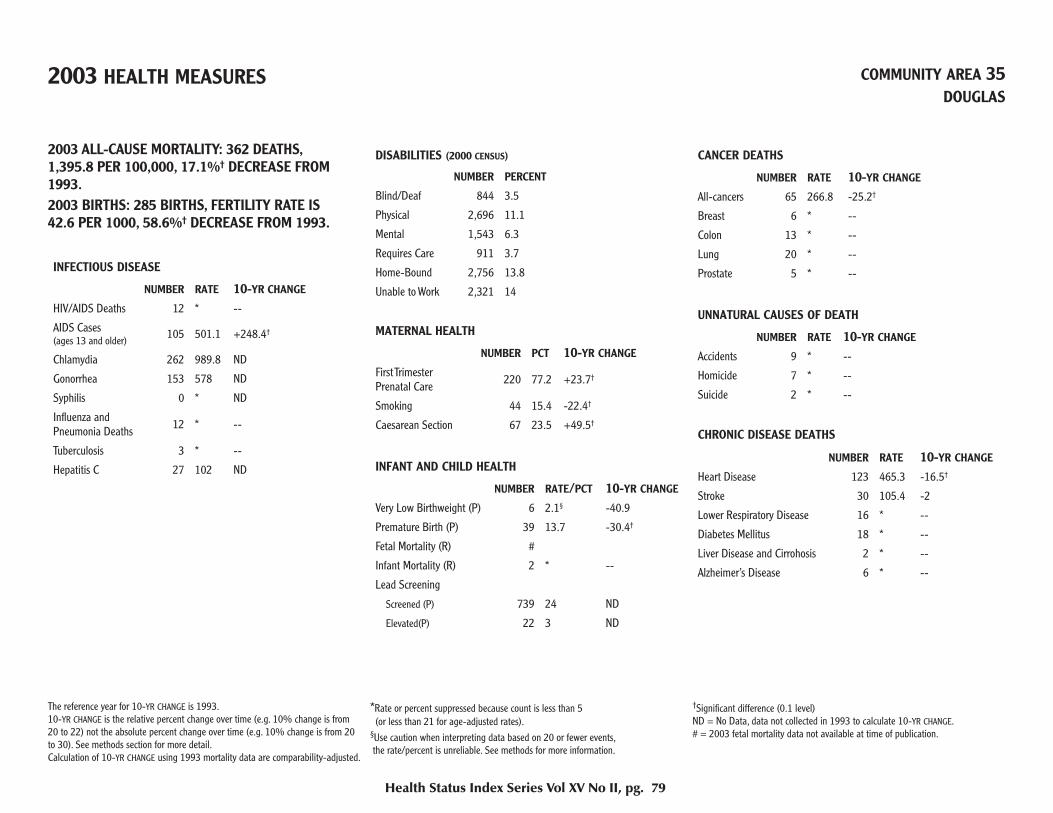
2003 HEALTH MEASURES COMMUNITY AREA 35DOUGLAS
2003 ALL-CAUSE MORTALITY: 362 DEATHS,1,395.8 PER 100,000, 17.1%† DECREASE FROM 1993.2003 BIRTHS: 285 BIRTHS, FERTILITY RATE IS42.6 PER 1000, 58.6%† DECREASE FROM 1993.
INFECTIOUS DISEASE
NUMBER RATE 10-YR CHANGE HIV/AIDS Deaths 12 * --
AIDS Cases (ages 13 and older) 105 501.1 +248.4†
Chlamydia 262 989.8 ND
Gonorrhea 153 578 ND
Syphilis 0 * ND
Infl uenza and Pneumonia Deaths 12 * --
Tuberculosis 3 * --
Hepatitis C 27 102 ND
DISABILITIES (2000 CENSUS)
NUMBER PERCENT
Blind/Deaf 844 3.5
Physical 2,696 11.1
Mental 1,543 6.3
Requires Care 911 3.7
Home-Bound 2,756 13.8
Unable to Work 2,321 14
MATERNAL HEALTH
NUMBER PCT 10-YR CHANGE First Trimester Prenatal Care 220 77.2 +23.7†
Smoking 44 15.4 -22.4†
Caesarean Section 67 23.5 +49.5†
INFANT AND CHILD HEALTH
NUMBER RATE/PCT 10-YR CHANGE Very Low Birthweight (P) 6 2.1§ -40.9
Premature Birth (P) 39 13.7 -30.4†
Fetal Mortality (R) #
Infant Mortality (R) 2 * --
Lead Screening
Screened (P) 739 24 ND
Elevated(P) 22 3 ND
CANCER DEATHS
NUMBER RATE 10-YR CHANGE All-cancers 65 266.8 -25.2†
Breast 6 * --
Colon 13 * --
Lung 20 * --
Prostate 5 * --
UNNATURAL CAUSES OF DEATH
NUMBER RATE 10-YR CHANGE Accidents 9 * --
Homicide 7 * --
Suicide 2 * --
CHRONIC DISEASE DEATHS
NUMBER RATE 10-YR CHANGE Heart Disease 123 465.3 -16.5†
Stroke 30 105.4 -2
Lower Respiratory Disease 16 * --
Diabetes Mellitus 18 * --
Liver Disease and Cirrohosis 2 * --
Alzheimer’s Disease 6 * --
Health Status Index Series Vol XV No II, pg. 79
The reference year for 10-YR CHANGE is 1993. 10-YR CHANGE is the relative percent change over time (e.g. 10% change is from 20 to 22) not the absolute percent change over time (e.g. 10% change is from 20 to 30). See methods section for more detail. Calculation of 10-YR CHANGE using 1993 mortality data are comparability-adjusted.
*Rate or percent suppressed because count is less than 5 (or less than 21 for age-adjusted rates).§Use caution when interpreting data based on 20 or fewer events, the rate/percent is unreliable. See methods for more information.
†Signifi cant difference (0.1 level)ND = No Data, data not collected in 1993 to calculate 10-YR CHANGE.# = 2003 fetal mortality data not available at time of publication.

2000 DEMOGRAPHIC MEASURES POPULATION COMPOSITION
COMMUNITY AREA 36OAKLAND
AGE
NUMBER PERCENT 10-YR CHANGE < 5 641 10.5 -18.6†
5-17 1,764 28.9 -5.2†
18-24 644 10.5 -2.8
25-64 2,537 41.5 +13.4†
65+ 524 8.6 -6.5†
All 6,110 -- -25.5†
RACE/ETHNICITY
NUMBER PERCENT 10-YR CHANGE Hispanic 58 0.9 +128.9†
Non-Hispanic
Asian 8 0.1 +53.3
Black 5,957 97.5 -1.5†
White 40 0.7 +45†
Other 5 0.1 NA
Multiple 42 0.7 ND
SEX
NUMBER PERCENT 10-YR CHANGE Male 2,674 43.8 +3.8†
Female 3,436 56.2 -2.8†
Females 15-44 1,595 26.1 +0.4
SOCIO-ECONOMIC INDICES
NUMBER PERCENT 10-YR CHANGE
Median Household Income ($) 10,739 -- NA
Below Poverty Level 3,178 52.5 -27.5†
Childhood Poverty 1,418 60.6 -28.9†
Housing Vacancies 589 20.7 -43.1†
Same Place of Residence for 5 Years 3,083 56.4 -2.3†
High School Graduates 1,858 60.4 +25.9†
Unemployed 500 26.4 -41.3†
Health Status Index Series Vol XV No II, pg. 80
< 5
5-17
18-24
25-64
65+
0 0.2 0.4 0.6 0.8 1 1.2 1.4 1.6 1.8
Age
(yea
rs)
Population (in thousands)
FemaleMale
Hispanic
NH-Asian
NH-Black
NH-White
NH-Other
NH-Multiple
0 1 2 3 4 5 6 7
Population (in thousands)
The reference year for 10-YR CHANGE is 1990.10-YR CHANGE is the relative percent change over time (e.g. 10% change is from 20 to 22) not the absolute percent change over time (e.g. 10% change is from 20 to 30). See methods section for more detail.
†Signifi cant difference (0.1 level)ND = No Data, data not collected in 1990 to calculate 10-YR CHANGE.NA = Appropriate data not available to calculate 10-YR CHANGE. Median Household Income is not infl ation-adjusted, 1990 and 2000 defi nitions for Other Race/Ethnicity are not the same.
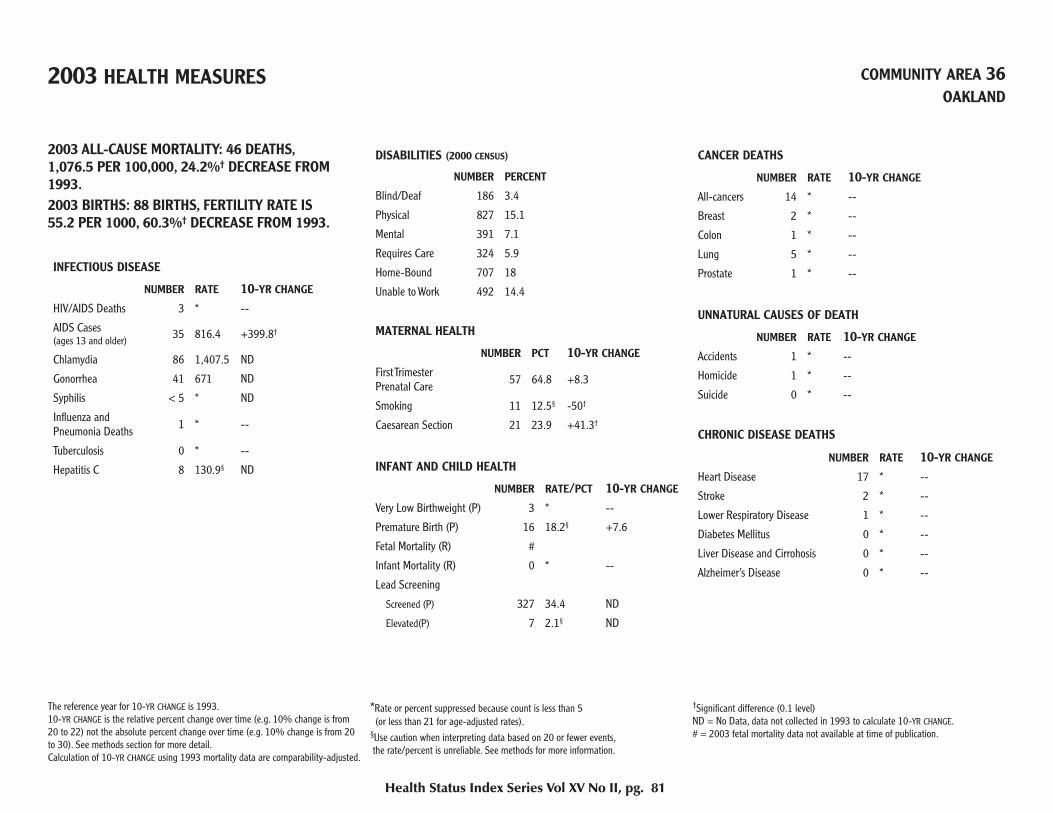
2003 HEALTH MEASURES COMMUNITY AREA 36OAKLAND
2003 ALL-CAUSE MORTALITY: 46 DEATHS,1,076.5 PER 100,000, 24.2%† DECREASE FROM 1993.2003 BIRTHS: 88 BIRTHS, FERTILITY RATE IS55.2 PER 1000, 60.3%† DECREASE FROM 1993.
INFECTIOUS DISEASE
NUMBER RATE 10-YR CHANGE HIV/AIDS Deaths 3 * --
AIDS Cases (ages 13 and older) 35 816.4 +399.8†
Chlamydia 86 1,407.5 ND
Gonorrhea 41 671 ND
Syphilis < 5 * ND
Infl uenza and Pneumonia Deaths 1 * --
Tuberculosis 0 * --
Hepatitis C 8 130.9§ ND
DISABILITIES (2000 CENSUS)
NUMBER PERCENT
Blind/Deaf 186 3.4
Physical 827 15.1
Mental 391 7.1
Requires Care 324 5.9
Home-Bound 707 18
Unable to Work 492 14.4
MATERNAL HEALTH
NUMBER PCT 10-YR CHANGE First Trimester Prenatal Care 57 64.8 +8.3
Smoking 11 12.5§ -50†
Caesarean Section 21 23.9 +41.3†
INFANT AND CHILD HEALTH
NUMBER RATE/PCT 10-YR CHANGE Very Low Birthweight (P) 3 * --
Premature Birth (P) 16 18.2§ +7.6
Fetal Mortality (R) #
Infant Mortality (R) 0 * --
Lead Screening
Screened (P) 327 34.4 ND
Elevated(P) 7 2.1§ ND
CANCER DEATHS
NUMBER RATE 10-YR CHANGE All-cancers 14 * --
Breast 2 * --
Colon 1 * --
Lung 5 * --
Prostate 1 * --
UNNATURAL CAUSES OF DEATH
NUMBER RATE 10-YR CHANGE Accidents 1 * --
Homicide 1 * --
Suicide 0 * --
CHRONIC DISEASE DEATHS
NUMBER RATE 10-YR CHANGE Heart Disease 17 * --
Stroke 2 * --
Lower Respiratory Disease 1 * --
Diabetes Mellitus 0 * --
Liver Disease and Cirrohosis 0 * --
Alzheimer’s Disease 0 * --
Health Status Index Series Vol XV No II, pg. 81
The reference year for 10-YR CHANGE is 1993. 10-YR CHANGE is the relative percent change over time (e.g. 10% change is from 20 to 22) not the absolute percent change over time (e.g. 10% change is from 20 to 30). See methods section for more detail. Calculation of 10-YR CHANGE using 1993 mortality data are comparability-adjusted.
*Rate or percent suppressed because count is less than 5 (or less than 21 for age-adjusted rates).§Use caution when interpreting data based on 20 or fewer events, the rate/percent is unreliable. See methods for more information.
†Signifi cant difference (0.1 level)ND = No Data, data not collected in 1993 to calculate 10-YR CHANGE.# = 2003 fetal mortality data not available at time of publication.
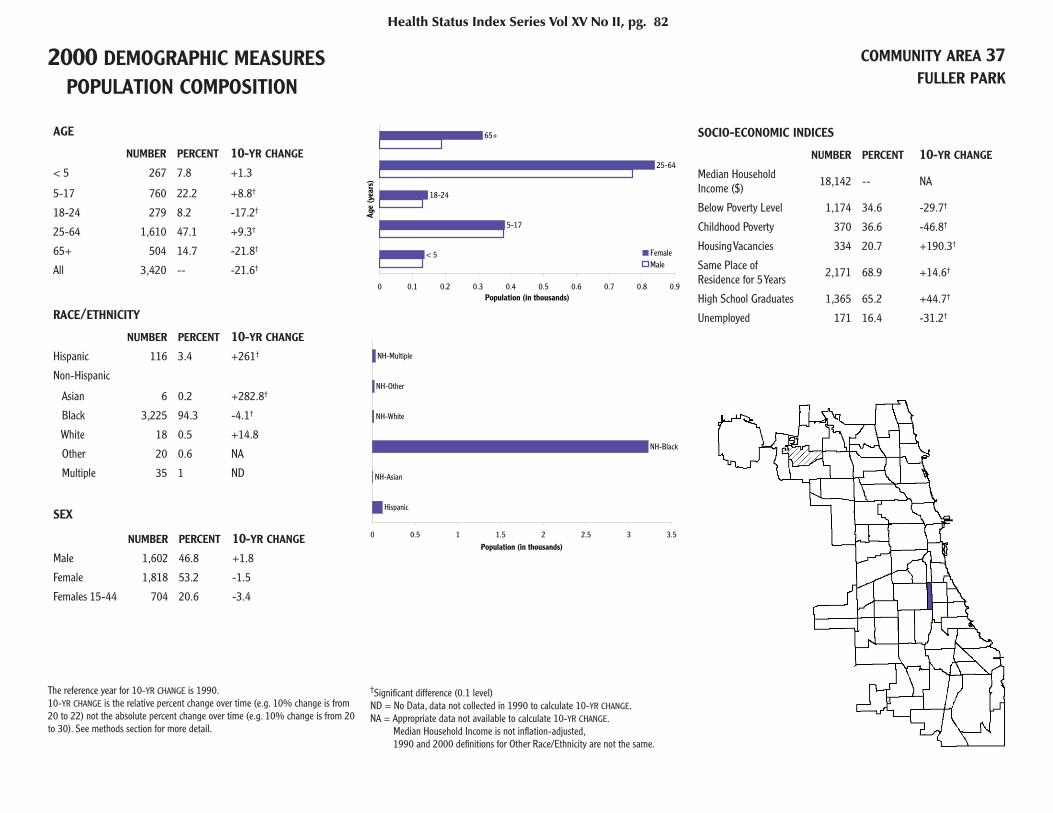
2000 DEMOGRAPHIC MEASURES POPULATION COMPOSITION
COMMUNITY AREA 37FULLER PARK
AGE
NUMBER PERCENT 10-YR CHANGE < 5 267 7.8 +1.3
5-17 760 22.2 +8.8†
18-24 279 8.2 -17.2†
25-64 1,610 47.1 +9.3†
65+ 504 14.7 -21.8†
All 3,420 -- -21.6†
RACE/ETHNICITY
NUMBER PERCENT 10-YR CHANGE Hispanic 116 3.4 +261†
Non-Hispanic
Asian 6 0.2 +282.8†
Black 3,225 94.3 -4.1†
White 18 0.5 +14.8
Other 20 0.6 NA
Multiple 35 1 ND
SEX
NUMBER PERCENT 10-YR CHANGE Male 1,602 46.8 +1.8
Female 1,818 53.2 -1.5
Females 15-44 704 20.6 -3.4
SOCIO-ECONOMIC INDICES
NUMBER PERCENT 10-YR CHANGE
Median Household Income ($) 18,142 -- NA
Below Poverty Level 1,174 34.6 -29.7†
Childhood Poverty 370 36.6 -46.8†
Housing Vacancies 334 20.7 +190.3†
Same Place of Residence for 5 Years 2,171 68.9 +14.6†
High School Graduates 1,365 65.2 +44.7†
Unemployed 171 16.4 -31.2†
Health Status Index Series Vol XV No II, pg. 82
< 5
5-17
18-24
25-64
65+
0 0.1 0.2 0.3 0.4 0.5 0.6 0.7 0.8 0.9
Age
(yea
rs)
Population (in thousands)
FemaleMale
Hispanic
NH-Asian
NH-Black
NH-White
NH-Other
NH-Multiple
0 0.5 1 1.5 2 2.5 3 3.5
Population (in thousands)
The reference year for 10-YR CHANGE is 1990.10-YR CHANGE is the relative percent change over time (e.g. 10% change is from 20 to 22) not the absolute percent change over time (e.g. 10% change is from 20 to 30). See methods section for more detail.
†Signifi cant difference (0.1 level)ND = No Data, data not collected in 1990 to calculate 10-YR CHANGE.NA = Appropriate data not available to calculate 10-YR CHANGE. Median Household Income is not infl ation-adjusted, 1990 and 2000 defi nitions for Other Race/Ethnicity are not the same.

2003 HEALTH MEASURES COMMUNITY AREA 37FULLER PARK
2003 ALL-CAUSE MORTALITY: 39 DEATHS,1,058.5 PER 100,000, 50%† DECREASE FROM 1993.2003 BIRTHS: 52 BIRTHS, FERTILITY RATE IS73.9 PER 1000, 38.1%† DECREASE FROM 1993.
INFECTIOUS DISEASE
NUMBER RATE 10-YR CHANGE HIV/AIDS Deaths 0 * --
AIDS Cases (ages 13 and older) 14 526.7§ --
Chlamydia 62 1,812.9 ND
Gonorrhea 40 1,169 ND
Syphilis 0 * ND
Infl uenza and Pneumonia Deaths 1 * --
Tuberculosis 0 * --
Hepatitis C 2 * ND
DISABILITIES (2000 CENSUS)
NUMBER PERCENT
Blind/Deaf 177 5.6
Physical 456 14.5
Mental 233 7.4
Requires Care 162 5.1
Home-Bound 326 13
Unable to Work 333 16.5
MATERNAL HEALTH
NUMBER PCT 10-YR CHANGE First Trimester Prenatal Care 27 51.9 -15.2
Smoking 13 25§ +15.6
Caesarean Section 7 13.5§ -6.6
INFANT AND CHILD HEALTH
NUMBER RATE/PCT 10-YR CHANGE Very Low Birthweight (P) 4 * --
Premature Birth (P) 11 21.2§ +30.4
Fetal Mortality (R) #
Infant Mortality (R) 0 * --
Lead Screening
Screened (P) 172 44.2 ND
Elevated(P) 22 12.8 ND
CANCER DEATHS
NUMBER RATE 10-YR CHANGE All-cancers 7 * --
Breast 0 * --
Colon 1 * --
Lung 1 * --
Prostate 0 * --
UNNATURAL CAUSES OF DEATH
NUMBER RATE 10-YR CHANGE Accidents 3 * --
Homicide 0 * --
Suicide 0 * --
CHRONIC DISEASE DEATHS
NUMBER RATE 10-YR CHANGE Heart Disease 13 * --
Stroke 0 * --
Lower Respiratory Disease 1 * --
Diabetes Mellitus 0 * --
Liver Disease and Cirrohosis 0 * --
Alzheimer’s Disease 0 * --
Health Status Index Series Vol XV No II, pg. 83
The reference year for 10-YR CHANGE is 1993. 10-YR CHANGE is the relative percent change over time (e.g. 10% change is from 20 to 22) not the absolute percent change over time (e.g. 10% change is from 20 to 30). See methods section for more detail. Calculation of 10-YR CHANGE using 1993 mortality data are comparability-adjusted.
*Rate or percent suppressed because count is less than 5 (or less than 21 for age-adjusted rates).§Use caution when interpreting data based on 20 or fewer events, the rate/percent is unreliable. See methods for more information.
†Signifi cant difference (0.1 level)ND = No Data, data not collected in 1993 to calculate 10-YR CHANGE.# = 2003 fetal mortality data not available at time of publication.
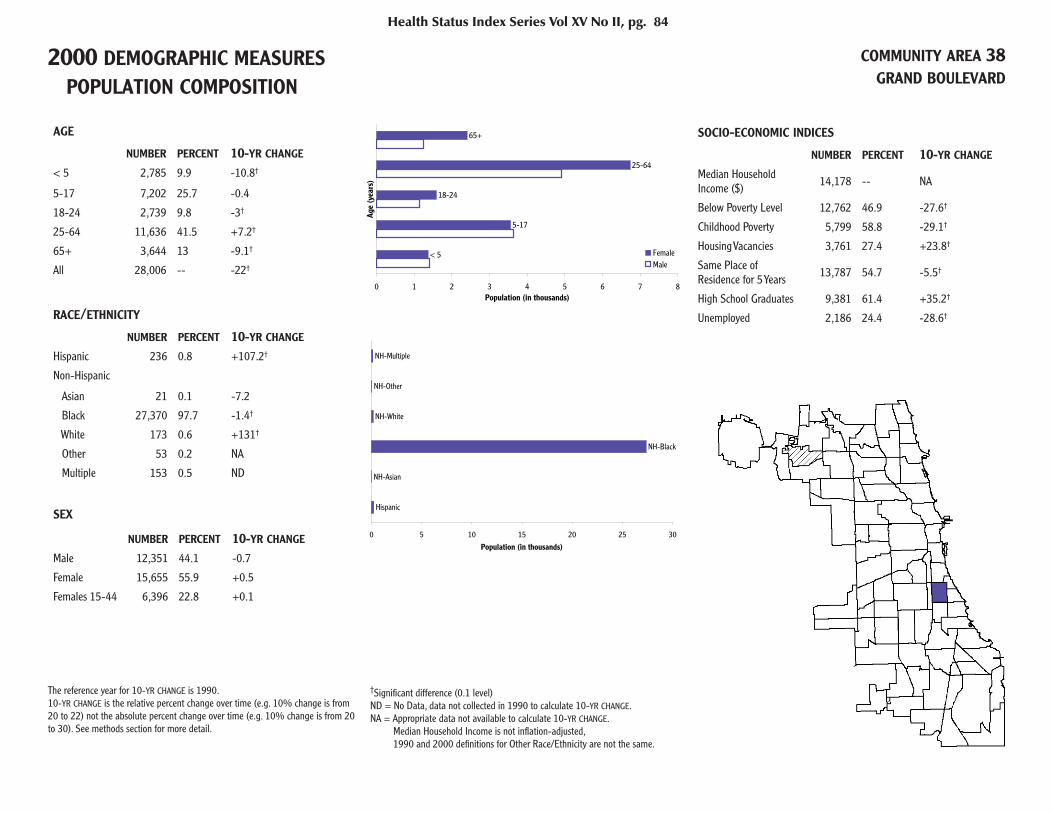
2000 DEMOGRAPHIC MEASURES POPULATION COMPOSITION
COMMUNITY AREA 38GRAND BOULEVARD
AGE
NUMBER PERCENT 10-YR CHANGE < 5 2,785 9.9 -10.8†
5-17 7,202 25.7 -0.4
18-24 2,739 9.8 -3†
25-64 11,636 41.5 +7.2†
65+ 3,644 13 -9.1†
All 28,006 -- -22†
RACE/ETHNICITY
NUMBER PERCENT 10-YR CHANGE Hispanic 236 0.8 +107.2†
Non-Hispanic
Asian 21 0.1 -7.2
Black 27,370 97.7 -1.4†
White 173 0.6 +131†
Other 53 0.2 NA
Multiple 153 0.5 ND
SEX
NUMBER PERCENT 10-YR CHANGE Male 12,351 44.1 -0.7
Female 15,655 55.9 +0.5
Females 15-44 6,396 22.8 +0.1
SOCIO-ECONOMIC INDICES
NUMBER PERCENT 10-YR CHANGE
Median Household Income ($) 14,178 -- NA
Below Poverty Level 12,762 46.9 -27.6†
Childhood Poverty 5,799 58.8 -29.1†
Housing Vacancies 3,761 27.4 +23.8†
Same Place of Residence for 5 Years 13,787 54.7 -5.5†
High School Graduates 9,381 61.4 +35.2†
Unemployed 2,186 24.4 -28.6†
Health Status Index Series Vol XV No II, pg. 84
< 5
5-17
18-24
25-64
65+
0 1 2 3 4 5 6 7 8
Age
(yea
rs)
Population (in thousands)
FemaleMale
Hispanic
NH-Asian
NH-Black
NH-White
NH-Other
NH-Multiple
0 5 10 15 20 25 30
Population (in thousands)
The reference year for 10-YR CHANGE is 1990.10-YR CHANGE is the relative percent change over time (e.g. 10% change is from 20 to 22) not the absolute percent change over time (e.g. 10% change is from 20 to 30). See methods section for more detail.
†Signifi cant difference (0.1 level)ND = No Data, data not collected in 1990 to calculate 10-YR CHANGE.NA = Appropriate data not available to calculate 10-YR CHANGE. Median Household Income is not infl ation-adjusted, 1990 and 2000 defi nitions for Other Race/Ethnicity are not the same.

2003 HEALTH MEASURES COMMUNITY AREA 38GRAND BOULEVARD
2003 ALL-CAUSE MORTALITY: 326 DEATHS,1,201.2 PER 100,000, 32.6%† DECREASE FROM 1993.2003 BIRTHS: 381 BIRTHS, FERTILITY RATE IS59.6 PER 1000, 60.8%† DECREASE FROM 1993.
INFECTIOUS DISEASE
NUMBER RATE 10-YR CHANGE HIV/AIDS Deaths 11 * --
AIDS Cases (ages 13 and older) 166 818.2 +285.2†
Chlamydia 457 1,631.8 ND
Gonorrhea 270 964.1 ND
Syphilis < 5 * ND
Infl uenza and Pneumonia Deaths 6 * --
Tuberculosis 8 28.6§ -57.2†
Hepatitis C 39 139.3 ND
DISABILITIES (2000 CENSUS)
NUMBER PERCENT
Blind/Deaf 1,334 5.3
Physical 3,583 14.2
Mental 2,531 10
Requires Care 1,386 5.5
Home-Bound 3,710 19.6
Unable to Work 2,784 18.2
MATERNAL HEALTH
NUMBER PCT 10-YR CHANGE First Trimester Prenatal Care 284 74.5 +22.4†
Smoking 67 17.6 -27.6†
Caesarean Section 81 21.3 +69.4†
INFANT AND CHILD HEALTH
NUMBER RATE/PCT 10-YR CHANGE Very Low Birthweight (P) 9 2.4§ -28.4
Premature Birth (P) 58 15.2 -11.6
Fetal Mortality (R) #
Infant Mortality (R) 7 18.4§ -4.8
Lead Screening
Screened (P) 1,194 29.1 ND
Elevated(P) 54 4.5 ND
CANCER DEATHS
NUMBER RATE 10-YR CHANGE All-cancers 67 254.9 -29.5†
Breast 6 * --
Colon 8 * --
Lung 20 * --
Prostate 3 * --
UNNATURAL CAUSES OF DEATH
NUMBER RATE 10-YR CHANGE Accidents 20 * --
Homicide 7 * --
Suicide 0 * --
CHRONIC DISEASE DEATHS
NUMBER RATE 10-YR CHANGE Heart Disease 90 327.8 -36.8†
Stroke 15 * --
Lower Respiratory Disease 12 * --
Diabetes Mellitus 13 * --
Liver Disease and Cirrohosis 3 * --
Alzheimer’s Disease 3 * --
Health Status Index Series Vol XV No II, pg. 85
The reference year for 10-YR CHANGE is 1993. 10-YR CHANGE is the relative percent change over time (e.g. 10% change is from 20 to 22) not the absolute percent change over time (e.g. 10% change is from 20 to 30). See methods section for more detail. Calculation of 10-YR CHANGE using 1993 mortality data are comparability-adjusted.
*Rate or percent suppressed because count is less than 5 (or less than 21 for age-adjusted rates).§Use caution when interpreting data based on 20 or fewer events, the rate/percent is unreliable. See methods for more information.
†Signifi cant difference (0.1 level)ND = No Data, data not collected in 1993 to calculate 10-YR CHANGE.# = 2003 fetal mortality data not available at time of publication.
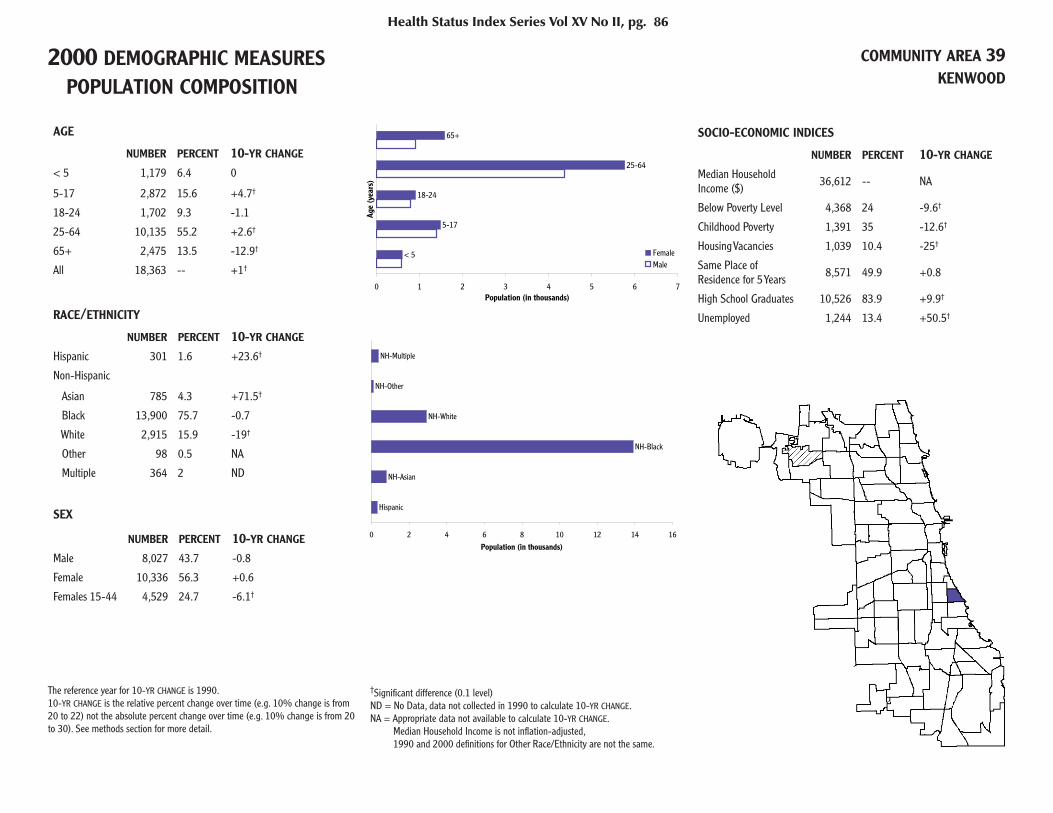
2000 DEMOGRAPHIC MEASURES POPULATION COMPOSITION
COMMUNITY AREA 39KENWOOD
AGE
NUMBER PERCENT 10-YR CHANGE < 5 1,179 6.4 0
5-17 2,872 15.6 +4.7†
18-24 1,702 9.3 -1.1
25-64 10,135 55.2 +2.6†
65+ 2,475 13.5 -12.9†
All 18,363 -- +1†
RACE/ETHNICITY
NUMBER PERCENT 10-YR CHANGE Hispanic 301 1.6 +23.6†
Non-Hispanic
Asian 785 4.3 +71.5†
Black 13,900 75.7 -0.7
White 2,915 15.9 -19†
Other 98 0.5 NA
Multiple 364 2 ND
SEX
NUMBER PERCENT 10-YR CHANGE Male 8,027 43.7 -0.8
Female 10,336 56.3 +0.6
Females 15-44 4,529 24.7 -6.1†
SOCIO-ECONOMIC INDICES
NUMBER PERCENT 10-YR CHANGE
Median Household Income ($) 36,612 -- NA
Below Poverty Level 4,368 24 -9.6†
Childhood Poverty 1,391 35 -12.6†
Housing Vacancies 1,039 10.4 -25†
Same Place of Residence for 5 Years 8,571 49.9 +0.8
High School Graduates 10,526 83.9 +9.9†
Unemployed 1,244 13.4 +50.5†
Health Status Index Series Vol XV No II, pg. 86
< 5
5-17
18-24
25-64
65+
0 1 2 3 4 5 6 7
Age
(yea
rs)
Population (in thousands)
FemaleMale
Hispanic
NH-Asian
NH-Black
NH-White
NH-Other
NH-Multiple
0 2 4 6 8 10 12 14 16
Population (in thousands)
The reference year for 10-YR CHANGE is 1990.10-YR CHANGE is the relative percent change over time (e.g. 10% change is from 20 to 22) not the absolute percent change over time (e.g. 10% change is from 20 to 30). See methods section for more detail.
†Signifi cant difference (0.1 level)ND = No Data, data not collected in 1990 to calculate 10-YR CHANGE.NA = Appropriate data not available to calculate 10-YR CHANGE. Median Household Income is not infl ation-adjusted, 1990 and 2000 defi nitions for Other Race/Ethnicity are not the same.

2003 HEALTH MEASURES COMMUNITY AREA 39KENWOOD
2003 ALL-CAUSE MORTALITY: 164 DEATHS,833.3 PER 100,000, 26.5%† DECREASE FROM 1993.2003 BIRTHS: 250 BIRTHS, FERTILITY RATE IS55.2 PER 1000, 18.1%† DECREASE FROM 1993.
INFECTIOUS DISEASE
NUMBER RATE 10-YR CHANGE HIV/AIDS Deaths 0 * --
AIDS Cases (ages 13 and older) 59 385.6 +247†
Chlamydia 187 1,018.4 ND
Gonorrhea 104 566.4 ND
Syphilis < 5 * ND
Infl uenza and Pneumonia Deaths 8 * --
Tuberculosis 1 * --
Hepatitis C 21 114.4 ND
DISABILITIES (2000 CENSUS)
NUMBER PERCENT
Blind/Deaf 729 4.2
Physical 1,766 10.3
Mental 991 5.8
Requires Care 587 3.4
Home-Bound 1,618 11
Unable to Work 1,686 13.8
MATERNAL HEALTH
NUMBER PCT 10-YR CHANGE First Trimester Prenatal Care 196 78.4 +12.7†
Smoking 16 6.4§ -62.5†
Caesarean Section 58 23.2 +18.6
INFANT AND CHILD HEALTH
NUMBER RATE/PCT 10-YR CHANGE Very Low Birthweight (P) 10 4§ +28.8
Premature Birth (P) 31 12.4 -7.1
Fetal Mortality (R) #
Infant Mortality (R) 4 * --
Lead Screening
Screened (P) 599 36.5 ND
Elevated(P) 12 2§ ND
CANCER DEATHS
NUMBER RATE 10-YR CHANGE All-cancers 44 225.1 -12.1
Breast 2 * --
Colon 1 * --
Lung 14 * --
Prostate 3 * --
UNNATURAL CAUSES OF DEATH
NUMBER RATE 10-YR CHANGE Accidents 9 * --
Homicide 3 * --
Suicide 0 * --
CHRONIC DISEASE DEATHS
NUMBER RATE 10-YR CHANGE Heart Disease 36 180.4 -45.2†
Stroke 11 * --
Lower Respiratory Disease 9 * --
Diabetes Mellitus 2 * --
Liver Disease and Cirrohosis 1 * --
Alzheimer’s Disease 3 * --
Health Status Index Series Vol XV No II, pg. 87
The reference year for 10-YR CHANGE is 1993. 10-YR CHANGE is the relative percent change over time (e.g. 10% change is from 20 to 22) not the absolute percent change over time (e.g. 10% change is from 20 to 30). See methods section for more detail. Calculation of 10-YR CHANGE using 1993 mortality data are comparability-adjusted.
*Rate or percent suppressed because count is less than 5 (or less than 21 for age-adjusted rates).§Use caution when interpreting data based on 20 or fewer events, the rate/percent is unreliable. See methods for more information.
†Signifi cant difference (0.1 level)ND = No Data, data not collected in 1993 to calculate 10-YR CHANGE.# = 2003 fetal mortality data not available at time of publication.
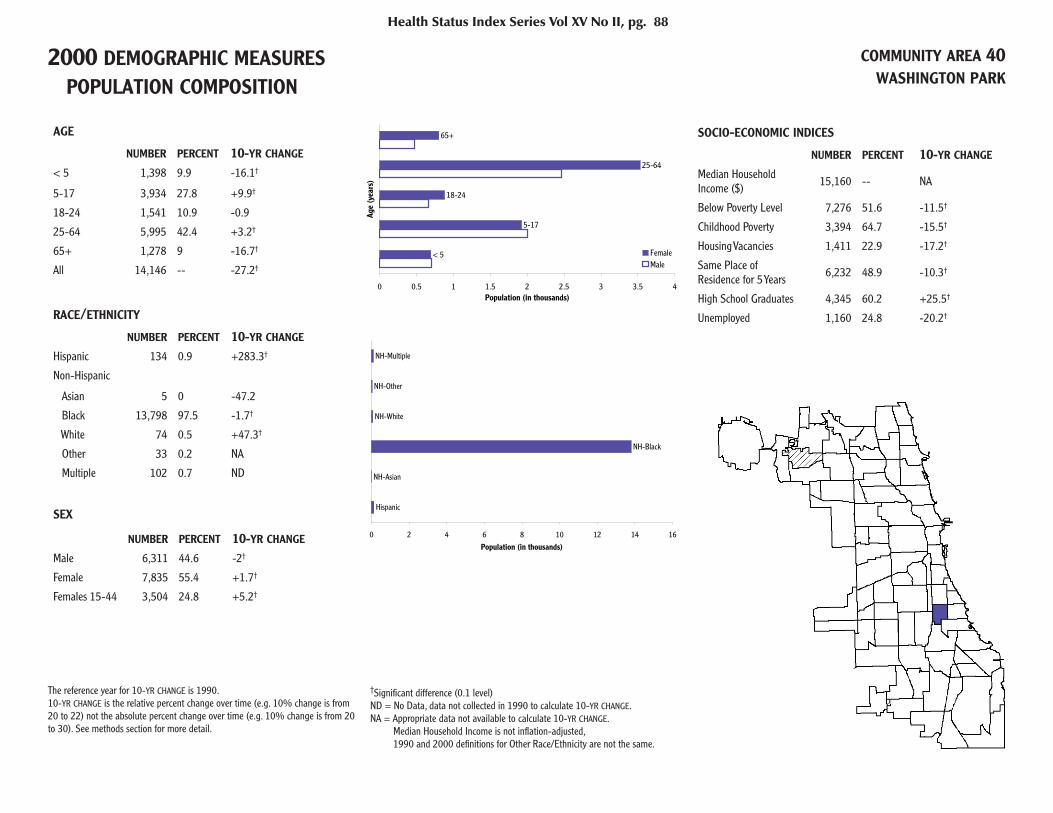
2000 DEMOGRAPHIC MEASURES POPULATION COMPOSITION
COMMUNITY AREA 40WASHINGTON PARK
AGE
NUMBER PERCENT 10-YR CHANGE < 5 1,398 9.9 -16.1†
5-17 3,934 27.8 +9.9†
18-24 1,541 10.9 -0.9
25-64 5,995 42.4 +3.2†
65+ 1,278 9 -16.7†
All 14,146 -- -27.2†
RACE/ETHNICITY
NUMBER PERCENT 10-YR CHANGE Hispanic 134 0.9 +283.3†
Non-Hispanic
Asian 5 0 -47.2
Black 13,798 97.5 -1.7†
White 74 0.5 +47.3†
Other 33 0.2 NA
Multiple 102 0.7 ND
SEX
NUMBER PERCENT 10-YR CHANGE Male 6,311 44.6 -2†
Female 7,835 55.4 +1.7†
Females 15-44 3,504 24.8 +5.2†
SOCIO-ECONOMIC INDICES
NUMBER PERCENT 10-YR CHANGE
Median Household Income ($) 15,160 -- NA
Below Poverty Level 7,276 51.6 -11.5†
Childhood Poverty 3,394 64.7 -15.5†
Housing Vacancies 1,411 22.9 -17.2†
Same Place of Residence for 5 Years 6,232 48.9 -10.3†
High School Graduates 4,345 60.2 +25.5†
Unemployed 1,160 24.8 -20.2†
Health Status Index Series Vol XV No II, pg. 88
< 5
5-17
18-24
25-64
65+
0 0.5 1 1.5 2 2.5 3 3.5 4
Age
(yea
rs)
Population (in thousands)
FemaleMale
Hispanic
NH-Asian
NH-Black
NH-White
NH-Other
NH-Multiple
0 2 4 6 8 10 12 14 16
Population (in thousands)
The reference year for 10-YR CHANGE is 1990.10-YR CHANGE is the relative percent change over time (e.g. 10% change is from 20 to 22) not the absolute percent change over time (e.g. 10% change is from 20 to 30). See methods section for more detail.
†Signifi cant difference (0.1 level)ND = No Data, data not collected in 1990 to calculate 10-YR CHANGE.NA = Appropriate data not available to calculate 10-YR CHANGE. Median Household Income is not infl ation-adjusted, 1990 and 2000 defi nitions for Other Race/Ethnicity are not the same.

2003 HEALTH MEASURES COMMUNITY AREA 40WASHINGTON PARK
2003 ALL-CAUSE MORTALITY: 119 DEATHS,1,126.3 PER 100,000, 28.5%† DECREASE FROM 1993.2003 BIRTHS: 284 BIRTHS, FERTILITY RATE IS81.1 PER 1000, 44.1%† DECREASE FROM 1993.
INFECTIOUS DISEASE
NUMBER RATE 10-YR CHANGE HIV/AIDS Deaths 3 * --
AIDS Cases (ages 13 and older) 108 1,063.8 +237.4†
Chlamydia 310 2,191.4 ND
Gonorrhea 191 1,350.2 ND
Syphilis < 5 * ND
Infl uenza and Pneumonia Deaths 1 * --
Tuberculosis 4 * --
Hepatitis C 34 240.4 ND
DISABILITIES (2000 CENSUS)
NUMBER PERCENT
Blind/Deaf 438 3.4
Physical 1,592 12.5
Mental 1,091 8.4
Requires Care 593 4.7
Home-Bound 1,429 15.3
Unable to Work 1,300 16.1
MATERNAL HEALTH
NUMBER PCT 10-YR CHANGE First Trimester Prenatal Care 201 70.8 +18.8†
Smoking 66 23.2 +2.7
Caesarean Section 73 25.7 +127.2†
INFANT AND CHILD HEALTH
NUMBER RATE/PCT 10-YR CHANGE Very Low Birthweight (P) 10 3.5§ +66.8
Premature Birth (P) 50 17.6 +35.7†
Fetal Mortality (R) #
Infant Mortality (R) 6 21.1§ -6.6
Lead Screening
Screened (P) 882 42.8 ND
Elevated(P) 70 7.9 ND
CANCER DEATHS
NUMBER RATE 10-YR CHANGE All-cancers 23 230.6 -33.3†
Breast 6 * --
Colon 4 * --
Lung 3 * --
Prostate 2 * --
UNNATURAL CAUSES OF DEATH
NUMBER RATE 10-YR CHANGE Accidents 6 * --
Homicide 11 * --
Suicide 0 * --
CHRONIC DISEASE DEATHS
NUMBER RATE 10-YR CHANGE Heart Disease 33 334.9 -12.5
Stroke 7 * --
Lower Respiratory Disease 2 * --
Diabetes Mellitus 0 * --
Liver Disease and Cirrohosis 1 * --
Alzheimer’s Disease 1 * --
Health Status Index Series Vol XV No II, pg. 89
The reference year for 10-YR CHANGE is 1993. 10-YR CHANGE is the relative percent change over time (e.g. 10% change is from 20 to 22) not the absolute percent change over time (e.g. 10% change is from 20 to 30). See methods section for more detail. Calculation of 10-YR CHANGE using 1993 mortality data are comparability-adjusted.
*Rate or percent suppressed because count is less than 5 (or less than 21 for age-adjusted rates).§Use caution when interpreting data based on 20 or fewer events, the rate/percent is unreliable. See methods for more information.
†Signifi cant difference (0.1 level)ND = No Data, data not collected in 1993 to calculate 10-YR CHANGE.# = 2003 fetal mortality data not available at time of publication.
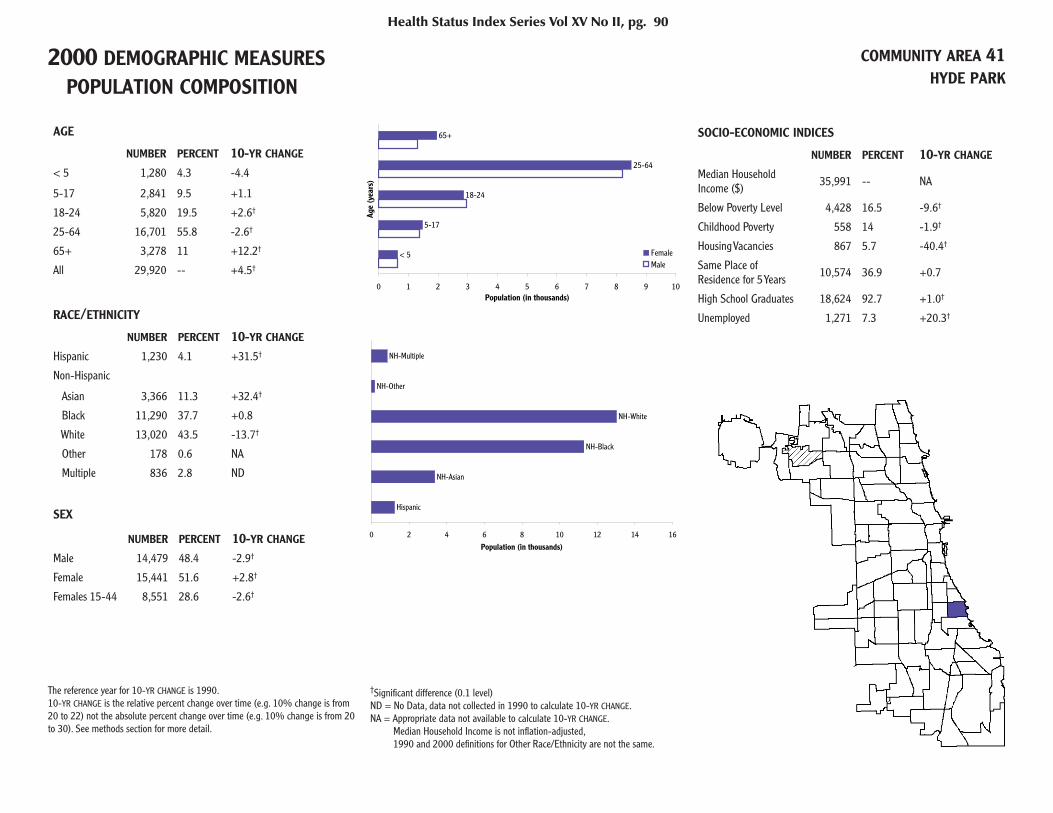
2000 DEMOGRAPHIC MEASURES POPULATION COMPOSITION
COMMUNITY AREA 41HYDE PARK
AGE
NUMBER PERCENT 10-YR CHANGE < 5 1,280 4.3 -4.4
5-17 2,841 9.5 +1.1
18-24 5,820 19.5 +2.6†
25-64 16,701 55.8 -2.6†
65+ 3,278 11 +12.2†
All 29,920 -- +4.5†
RACE/ETHNICITY
NUMBER PERCENT 10-YR CHANGE Hispanic 1,230 4.1 +31.5†
Non-Hispanic
Asian 3,366 11.3 +32.4†
Black 11,290 37.7 +0.8
White 13,020 43.5 -13.7†
Other 178 0.6 NA
Multiple 836 2.8 ND
SEX
NUMBER PERCENT 10-YR CHANGE Male 14,479 48.4 -2.9†
Female 15,441 51.6 +2.8†
Females 15-44 8,551 28.6 -2.6†
SOCIO-ECONOMIC INDICES
NUMBER PERCENT 10-YR CHANGE
Median Household Income ($) 35,991 -- NA
Below Poverty Level 4,428 16.5 -9.6†
Childhood Poverty 558 14 -1.9†
Housing Vacancies 867 5.7 -40.4†
Same Place of Residence for 5 Years 10,574 36.9 +0.7
High School Graduates 18,624 92.7 +1.0†
Unemployed 1,271 7.3 +20.3†
Health Status Index Series Vol XV No II, pg. 90
< 5
5-17
18-24
65+
25-64
0 1 2 3 4 5 6 7 8 9 10
Age
(yea
rs)
Population (in thousands)
FemaleMale
Hispanic
NH-Asian
NH-Black
NH-White
NH-Other
NH-Multiple
0 2 4 6 8 10 12 14 16
Population (in thousands)
The reference year for 10-YR CHANGE is 1990.10-YR CHANGE is the relative percent change over time (e.g. 10% change is from 20 to 22) not the absolute percent change over time (e.g. 10% change is from 20 to 30). See methods section for more detail.
†Signifi cant difference (0.1 level)ND = No Data, data not collected in 1990 to calculate 10-YR CHANGE.NA = Appropriate data not available to calculate 10-YR CHANGE. Median Household Income is not infl ation-adjusted, 1990 and 2000 defi nitions for Other Race/Ethnicity are not the same.

2003 HEALTH MEASURES COMMUNITY AREA 41HYDE PARK
2003 ALL-CAUSE MORTALITY: 166 DEATHS,624.6 PER 100,000, 22%† DECREASE FROM 1993.2003 BIRTHS: 339 BIRTHS, FERTILITY RATE IS39.6 PER 1000, 2.9% DECREASE FROM 1993.
INFECTIOUS DISEASE
NUMBER RATE 10-YR CHANGE HIV/AIDS Deaths 0 * --
AIDS Cases (ages 13 and older) 90 335.1 +231†
Chlamydia 105 350.9 ND
Gonorrhea 71 237.3 ND
Syphilis < 5 * ND
Infl uenza and Pneumonia Deaths 7 * --
Tuberculosis 1 * --
Hepatitis C 14 46.8§ ND
DISABILITIES (2000 CENSUS)
NUMBER PERCENT
Blind/Deaf 603 2.1
Physical 1,465 5.1
Mental 1,211 4.2
Requires Care 636 2.2
Home-Bound 1,576 6
Unable to Work 1,545 6.7
MATERNAL HEALTH
NUMBER PCT 10-YR CHANGE First Trimester Prenatal Care 294 86.7 +6.6†
Smoking 10 2.9§ -51.8†
Caesarean Section 85 25.1 +19.4
INFANT AND CHILD HEALTH
NUMBER RATE/PCT 10-YR CHANGE Very Low Birthweight (P) 4 * --
Premature Birth (P) 30 8.8 -32.5†
Fetal Mortality (R) #
Infant Mortality (R) 5 14.7§ --
Lead Screening
Screened (P) 614 35.7 ND
Elevated(P) 14 2.3§ ND
CANCER DEATHS
NUMBER RATE 10-YR CHANGE All-cancers 44 167 +11.8
Breast 3 * --
Colon 7 * --
Lung 14 * --
Prostate 4 * --
UNNATURAL CAUSES OF DEATH
NUMBER RATE 10-YR CHANGE Accidents 3 * --
Homicide 1 * --
Suicide 2 * --
CHRONIC DISEASE DEATHS
NUMBER RATE 10-YR CHANGE Heart Disease 48 180 -26.3†
Stroke 10 * --
Lower Respiratory Disease 6 * --
Diabetes Mellitus 5 * --
Liver Disease and Cirrohosis 1 * --
Alzheimer’s Disease 2 * --
Health Status Index Series Vol XV No II, pg. 91
The reference year for 10-YR CHANGE is 1993. 10-YR CHANGE is the relative percent change over time (e.g. 10% change is from 20 to 22) not the absolute percent change over time (e.g. 10% change is from 20 to 30). See methods section for more detail. Calculation of 10-YR CHANGE using 1993 mortality data are comparability-adjusted.
*Rate or percent suppressed because count is less than 5 (or less than 21 for age-adjusted rates).§Use caution when interpreting data based on 20 or fewer events, the rate/percent is unreliable. See methods for more information.
†Signifi cant difference (0.1 level)ND = No Data, data not collected in 1993 to calculate 10-YR CHANGE.# = 2003 fetal mortality data not available at time of publication.

2000 DEMOGRAPHIC MEASURES POPULATION COMPOSITION
COMMUNITY AREA 42WOODLAWN
AGE
NUMBER PERCENT 10-YR CHANGE < 5 2,251 8.3 -2.4
5-17 6,458 23.8 +21.4†
18-24 2,887 10.7 -8.5†
25-64 11,956 44.1 -0.9
65+ 3,534 13 -17.2†
All 27,086 -- -1.4†
RACE/ETHNICITY
NUMBER PERCENT 10-YR CHANGE Hispanic 288 1.1 +64.1†
Non-Hispanic
Asian 207 0.8 +28†
Black 25,518 94.2 -1.3†
White 761 2.8 -8.9†
Other 61 0.2 NA
Multiple 251 0.9 ND
SEX
NUMBER PERCENT 10-YR CHANGE Male 12,084 44.6 -1.4†
Female 15,002 55.4 +1.2†
Females 15-44 6,313 23.3 -1.4
SOCIO-ECONOMIC INDICES
NUMBER PERCENT 10-YR CHANGE
Median Household Income ($) 18,266 -- NA
Below Poverty Level 10,323 39.4 +6.6†
Childhood Poverty 4,117 48.7 -4.6†
Housing Vacancies 1,778 14.9 -26.4†
Same Place of Residence for 5 Years 12,927 52.1 +0.2
High School Graduates 10,548 67.7 +20.8†
Unemployed 1,851 19.8 -18.3†
Health Status Index Series Vol XV No II, pg. 92
< 5
5-17
18-24
25-64
65+
0 1 2 3 4 5 6 7 8
Age
(yea
rs)
Population (in thousands)
FemaleMale
Hispanic
NH-Asian
NH-Black
NH-White
NH-Other
NH-Multiple
0 5 10 15 20 25 30
Population (in thousands)
The reference year for 10-YR CHANGE is 1990.10-YR CHANGE is the relative percent change over time (e.g. 10% change is from 20 to 22) not the absolute percent change over time (e.g. 10% change is from 20 to 30). See methods section for more detail.
†Signifi cant difference (0.1 level)ND = No Data, data not collected in 1990 to calculate 10-YR CHANGE.NA = Appropriate data not available to calculate 10-YR CHANGE. Median Household Income is not infl ation-adjusted, 1990 and 2000 defi nitions for Other Race/Ethnicity are not the same.

2003 HEALTH MEASURES COMMUNITY AREA 42WOODLAWN
2003 ALL-CAUSE MORTALITY: 284 DEATHS,1,089.2 PER 100,000, 29.6%† DECREASE FROM 1993.2003 BIRTHS: 451 BIRTHS, FERTILITY RATE IS71.4 PER 1000, 30.9%† DECREASE FROM 1993.
INFECTIOUS DISEASE
NUMBER RATE 10-YR CHANGE HIV/AIDS Deaths 2 * --
AIDS Cases(ages 13 and older) 131 637.5 +156.7†
Chlamydia 475 1,753.7 ND
Gonorrhea 318 1,174 ND
Syphilis < 5 * ND
Infl uenza and Pneumonia Deaths 4 * --
Tuberculosis 2 * --
Hepatitis C 53 195.7 ND
DISABILITIES (2000 CENSUS)
NUMBER PERCENT
Blind/Deaf 1,159 4.7
Physical 3,563 14.3
Mental 2,136 8.6
Requires Care 1,126 4.5
Home-Bound 3,087 16
Unable to Work 2,934 18.7
MATERNAL HEALTH
NUMBER PCT 10-YR CHANGE First Trimester Prenatal Care 312 69.2 +19.9†
Smoking 71 15.7 -5.7
Caesarean Section 89 19.7 +31.1†
INFANT AND CHILD HEALTH
NUMBER RATE/PCT 10-YR CHANGE Very Low Birthweight (P) 14 3.1§ -25.6
Premature Birth (P) 76 16.9 -21.5†
Fetal Mortality (R) #
Infant Mortality (R) 8 17.7§ -20.7
Lead Screening
Screened (P) 1,346 40.7 ND
Elevated(P) 130 9.7 ND
CANCER DEATHS
NUMBER RATE 10-YR CHANGE All-cancers 58 229.3 -37.9†
Breast 9 * --
Colon 5 * --
Lung 16 * --
Prostate 0 * --
UNNATURAL CAUSES OF DEATH
NUMBER RATE 10-YR CHANGE Accidents 12 * --
Homicide 8 * --
Suicide 1 * --
CHRONIC DISEASE DEATHS
NUMBER RATE 10-YR CHANGE Heart Disease 73 279.2 -43.2†
Stroke 29 106.9 +47.8†
Lower Respiratory Disease 11 * --
Diabetes Mellitus 8 * --
Liver Disease and Cirrohosis 3 * --
Alzheimer’s Disease 4 * --
Health Status Index Series Vol XV No II, pg. 93
The reference year for 10-YR CHANGE is 1993. 10-YR CHANGE is the relative percent change over time (e.g. 10% change is from 20 to 22) not the absolute percent change over time (e.g. 10% change is from 20 to 30). See methods section for more detail. Calculation of 10-YR CHANGE using 1993 mortality data are comparability-adjusted.
*Rate or percent suppressed because count is less than 5 (or less than 21 for age-adjusted rates).§Use caution when interpreting data based on 20 or fewer events, the rate/percent is unreliable. See methods for more information.
†Signifi cant difference (0.1 level)ND = No Data, data not collected in 1993 to calculate 10-YR CHANGE.# = 2003 fetal mortality data not available at time of publication.
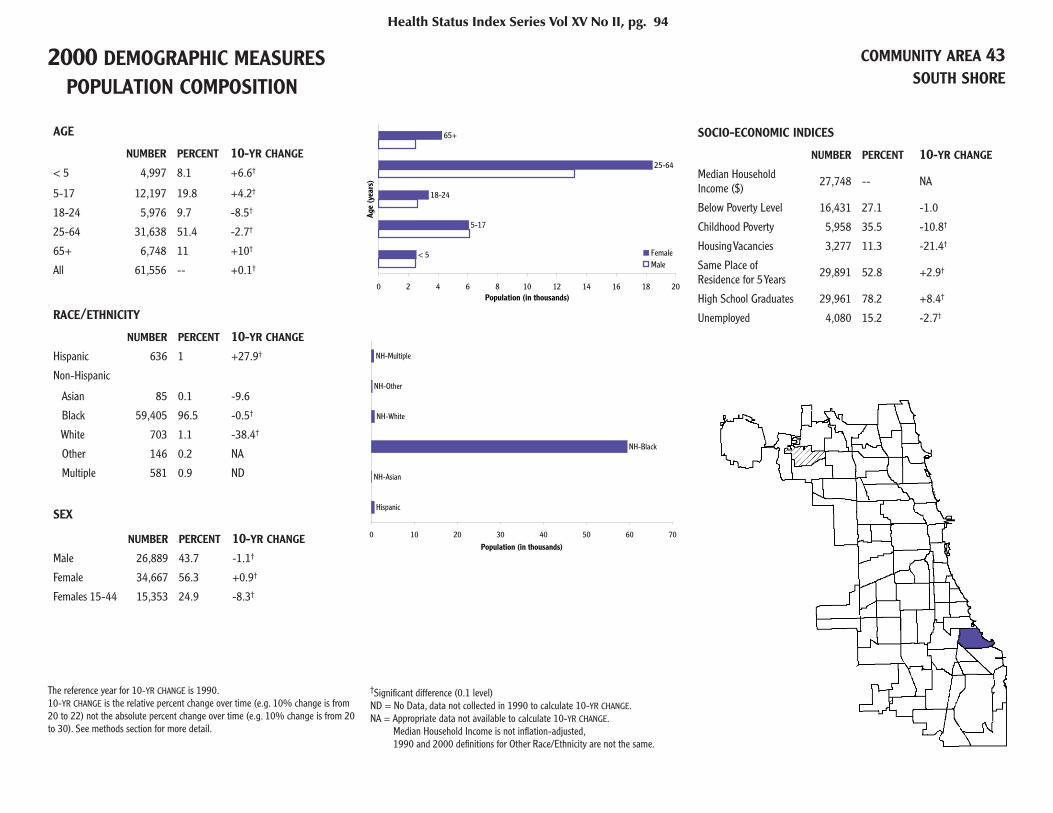
2000 DEMOGRAPHIC MEASURES POPULATION COMPOSITION
COMMUNITY AREA 43SOUTH SHORE
AGE
NUMBER PERCENT 10-YR CHANGE < 5 4,997 8.1 +6.6†
5-17 12,197 19.8 +4.2†
18-24 5,976 9.7 -8.5†
25-64 31,638 51.4 -2.7†
65+ 6,748 11 +10†
All 61,556 -- +0.1†
RACE/ETHNICITY
NUMBER PERCENT 10-YR CHANGE Hispanic 636 1 +27.9†
Non-Hispanic
Asian 85 0.1 -9.6
Black 59,405 96.5 -0.5†
White 703 1.1 -38.4†
Other 146 0.2 NA
Multiple 581 0.9 ND
SEX
NUMBER PERCENT 10-YR CHANGE Male 26,889 43.7 -1.1†
Female 34,667 56.3 +0.9†
Females 15-44 15,353 24.9 -8.3†
SOCIO-ECONOMIC INDICES
NUMBER PERCENT 10-YR CHANGE
Median Household Income ($) 27,748 -- NA
Below Poverty Level 16,431 27.1 -1.0
Childhood Poverty 5,958 35.5 -10.8†
Housing Vacancies 3,277 11.3 -21.4†
Same Place of Residence for 5 Years 29,891 52.8 +2.9†
High School Graduates 29,961 78.2 +8.4†
Unemployed 4,080 15.2 -2.7†
Health Status Index Series Vol XV No II, pg. 94
< 5
5-17
18-24
25-64
65+
0 2 4 6 8 10 12 14 16 18 20
Age
(yea
rs)
Population (in thousands)
FemaleMale
Hispanic
NH-Asian
NH-Black
NH-White
NH-Other
NH-Multiple
0 10 20 30 40 50 60 70
Population (in thousands)
The reference year for 10-YR CHANGE is 1990.10-YR CHANGE is the relative percent change over time (e.g. 10% change is from 20 to 22) not the absolute percent change over time (e.g. 10% change is from 20 to 30). See methods section for more detail.
†Signifi cant difference (0.1 level)ND = No Data, data not collected in 1990 to calculate 10-YR CHANGE.NA = Appropriate data not available to calculate 10-YR CHANGE. Median Household Income is not infl ation-adjusted, 1990 and 2000 defi nitions for Other Race/Ethnicity are not the same.

2003 HEALTH MEASURES COMMUNITY AREA 43SOUTH SHORE
2003 ALL-CAUSE MORTALITY: 641 DEATHS,1,194.8 PER 100,000, 6.7% DECREASE FROM 1993.2003 BIRTHS: 886 BIRTHS, FERTILITY RATE IS57.7 PER 1000, 26.8%† DECREASE FROM 1993.
INFECTIOUS DISEASE
NUMBER RATE 10-YR CHANGE HIV/AIDS Deaths 9 * --
AIDS Cases (ages 13 and older) 283 585 +217.6†
Chlamydia 847 1,376 ND
Gonorrhea 539 875.6 ND
Syphilis 11 17.9§ ND
Infl uenza and Pneumonia Deaths 9 * --
Tuberculosis 10 16.2§ -28.8
Hepatitis C 68 110.5 ND
DISABILITIES (2000 CENSUS)
NUMBER PERCENT
Blind/Deaf 1,976 3.5
Physical 6,123 10.8
Mental 4,209 7.4
Requires Care 2,243 4
Home-Bound 6,910 15
Unable to Work 5,873 15
MATERNAL HEALTH
NUMBER PCT 10-YR CHANGE First Trimester Prenatal Care 636 71.8 +7.8†
Smoking 119 13.4 -14.8†
Caesarean Section 219 24.7 +27.4†
INFANT AND CHILD HEALTH
NUMBER RATE/PCT 10-YR CHANGE Very Low Birthweight (P) 33 3.7 +6.8
Premature Birth (P) 129 14.6 -4.5
Fetal Mortality (R) #
Infant Mortality (R) 17 19.2§ -6.3
Lead Screening
Screened (P) 2,700 37.9 ND
Elevated(P) 234 8.7 ND
CANCER DEATHS
NUMBER RATE 10-YR CHANGE All-cancers 134 248.7 -12.5
Breast 8 * --
Colon 23 42.3 --
Lung 32 57.6 -27.1†
Prostate 8 * --
UNNATURAL CAUSES OF DEATH
NUMBER RATE 10-YR CHANGE Accidents 22 37.6 -0.8
Homicide 26 42.4 -21.6
Suicide 4 * --
CHRONIC DISEASE DEATHS
NUMBER RATE 10-YR CHANGE Heart Disease 198 378.2 -0.6
Stroke 38 72 -16.6
Lower Respiratory Disease 26 47.5 --
Diabetes Mellitus 22 41.5 --
Liver Disease and Cirrohosis 9 * --
Alzheimer’s Disease 12 * --
Health Status Index Series Vol XV No II, pg. 95
The reference year for 10-YR CHANGE is 1993. 10-YR CHANGE is the relative percent change over time (e.g. 10% change is from 20 to 22) not the absolute percent change over time (e.g. 10% change is from 20 to 30). See methods section for more detail. Calculation of 10-YR CHANGE using 1993 mortality data are comparability-adjusted.
*Rate or percent suppressed because count is less than 5 (or less than 21 for age-adjusted rates).§Use caution when interpreting data based on 20 or fewer events, the rate/percent is unreliable. See methods for more information.
†Signifi cant difference (0.1 level)ND = No Data, data not collected in 1993 to calculate 10-YR CHANGE.# = 2003 fetal mortality data not available at time of publication.
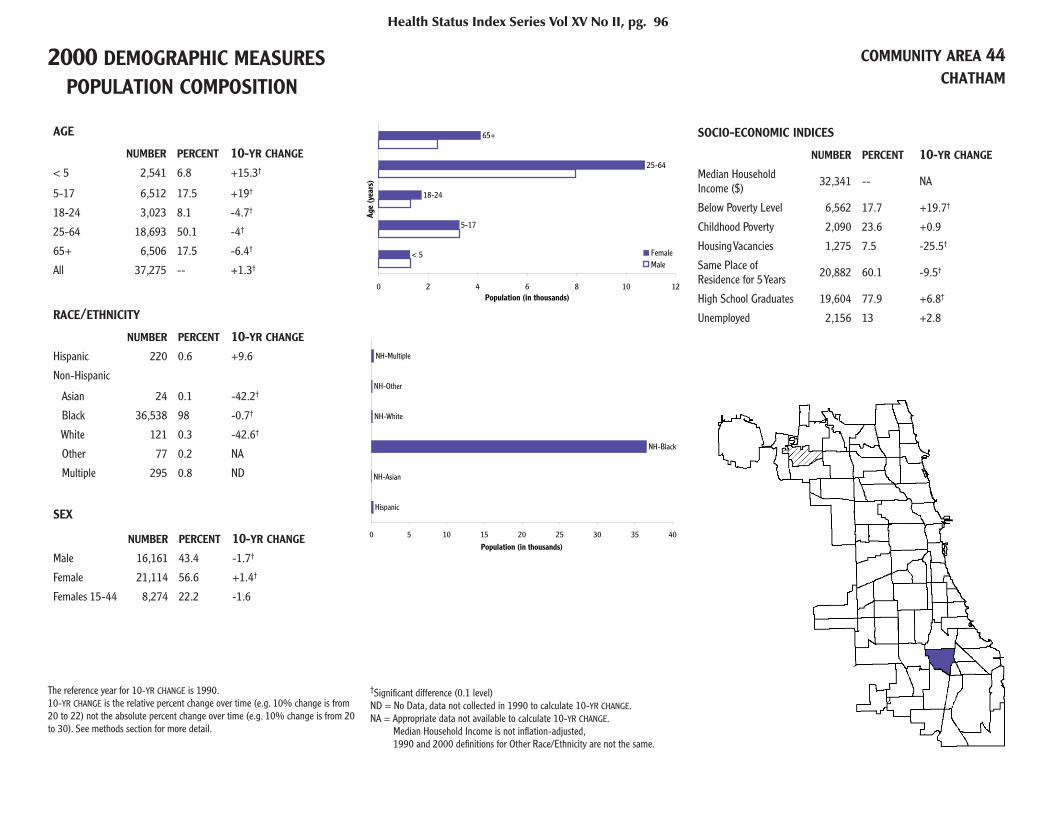
2000 DEMOGRAPHIC MEASURES POPULATION COMPOSITION
COMMUNITY AREA 44CHATHAM
AGE
NUMBER PERCENT 10-YR CHANGE < 5 2,541 6.8 +15.3†
5-17 6,512 17.5 +19†
18-24 3,023 8.1 -4.7†
25-64 18,693 50.1 -4†
65+ 6,506 17.5 -6.4†
All 37,275 -- +1.3†
RACE/ETHNICITY
NUMBER PERCENT 10-YR CHANGE Hispanic 220 0.6 +9.6
Non-Hispanic
Asian 24 0.1 -42.2†
Black 36,538 98 -0.7†
White 121 0.3 -42.6†
Other 77 0.2 NA
Multiple 295 0.8 ND
SEX
NUMBER PERCENT 10-YR CHANGE Male 16,161 43.4 -1.7†
Female 21,114 56.6 +1.4†
Females 15-44 8,274 22.2 -1.6
SOCIO-ECONOMIC INDICES
NUMBER PERCENT 10-YR CHANGE
Median Household Income ($) 32,341 -- NA
Below Poverty Level 6,562 17.7 +19.7†
Childhood Poverty 2,090 23.6 +0.9
Housing Vacancies 1,275 7.5 -25.5†
Same Place of Residence for 5 Years 20,882 60.1 -9.5†
High School Graduates 19,604 77.9 +6.8†
Unemployed 2,156 13 +2.8
Health Status Index Series Vol XV No II, pg. 96
< 5
5-17
18-24
25-64
65+
0 2 4 6 8 10 12
Age
(yea
rs)
Population (in thousands)
FemaleMale
Hispanic
NH-Asian
NH-Black
NH-White
NH-Other
NH-Multiple
0 5 10 15 20 25 30 35 40
Population (in thousands)
The reference year for 10-YR CHANGE is 1990.10-YR CHANGE is the relative percent change over time (e.g. 10% change is from 20 to 22) not the absolute percent change over time (e.g. 10% change is from 20 to 30). See methods section for more detail.
†Signifi cant difference (0.1 level)ND = No Data, data not collected in 1990 to calculate 10-YR CHANGE.NA = Appropriate data not available to calculate 10-YR CHANGE. Median Household Income is not infl ation-adjusted, 1990 and 2000 defi nitions for Other Race/Ethnicity are not the same.
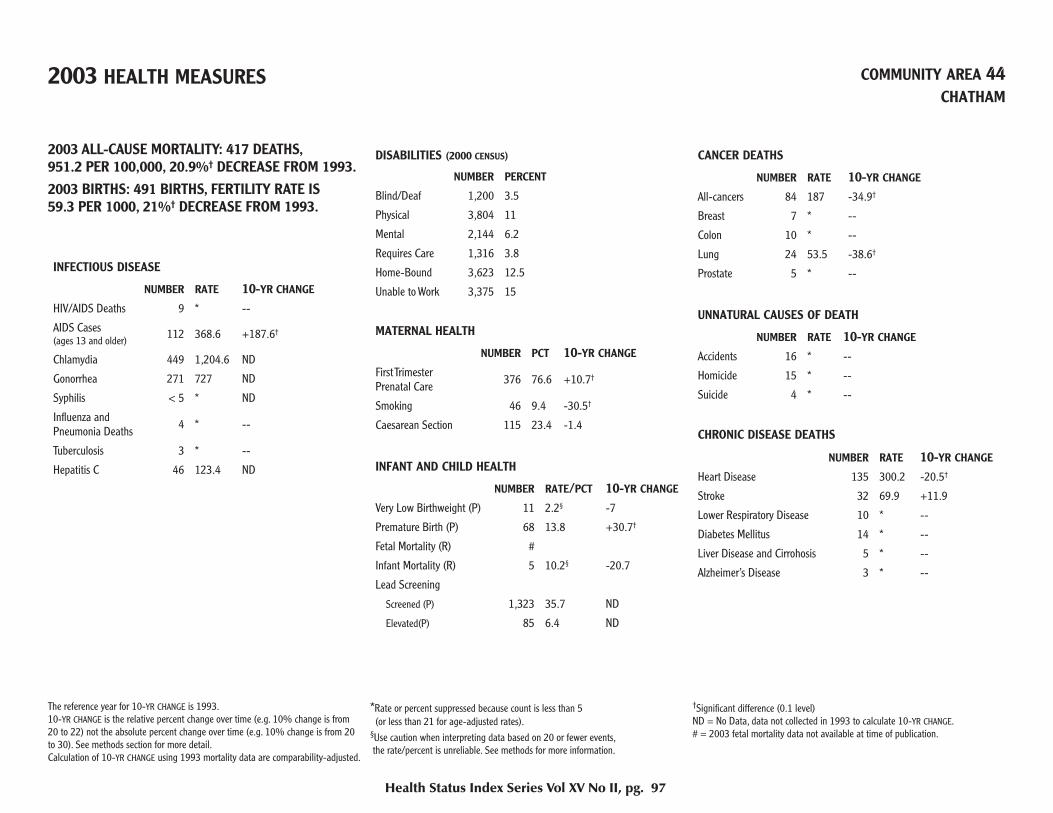
2003 HEALTH MEASURES COMMUNITY AREA 44CHATHAM
2003 ALL-CAUSE MORTALITY: 417 DEATHS,951.2 PER 100,000, 20.9%† DECREASE FROM 1993.2003 BIRTHS: 491 BIRTHS, FERTILITY RATE IS59.3 PER 1000, 21%† DECREASE FROM 1993.
INFECTIOUS DISEASE
NUMBER RATE 10-YR CHANGE HIV/AIDS Deaths 9 * --
AIDS Cases(ages 13 and older) 112 368.6 +187.6†
Chlamydia 449 1,204.6 ND
Gonorrhea 271 727 ND
Syphilis < 5 * ND
Infl uenza and Pneumonia Deaths 4 * --
Tuberculosis 3 * --
Hepatitis C 46 123.4 ND
DISABILITIES (2000 CENSUS)
NUMBER PERCENT
Blind/Deaf 1,200 3.5
Physical 3,804 11
Mental 2,144 6.2
Requires Care 1,316 3.8
Home-Bound 3,623 12.5
Unable to Work 3,375 15
MATERNAL HEALTH
NUMBER PCT 10-YR CHANGE First Trimester Prenatal Care 376 76.6 +10.7†
Smoking 46 9.4 -30.5†
Caesarean Section 115 23.4 -1.4
INFANT AND CHILD HEALTH
NUMBER RATE/PCT 10-YR CHANGE Very Low Birthweight (P) 11 2.2§ -7
Premature Birth (P) 68 13.8 +30.7†
Fetal Mortality (R) #
Infant Mortality (R) 5 10.2§ -20.7
Lead Screening
Screened (P) 1,323 35.7 ND
Elevated(P) 85 6.4 ND
CANCER DEATHS
NUMBER RATE 10-YR CHANGE All-cancers 84 187 -34.9†
Breast 7 * --
Colon 10 * --
Lung 24 53.5 -38.6†
Prostate 5 * --
UNNATURAL CAUSES OF DEATH
NUMBER RATE 10-YR CHANGE Accidents 16 * --
Homicide 15 * --
Suicide 4 * --
CHRONIC DISEASE DEATHS
NUMBER RATE 10-YR CHANGE Heart Disease 135 300.2 -20.5†
Stroke 32 69.9 +11.9
Lower Respiratory Disease 10 * --
Diabetes Mellitus 14 * --
Liver Disease and Cirrohosis 5 * --
Alzheimer’s Disease 3 * --
Health Status Index Series Vol XV No II, pg. 97
The reference year for 10-YR CHANGE is 1993. 10-YR CHANGE is the relative percent change over time (e.g. 10% change is from 20 to 22) not the absolute percent change over time (e.g. 10% change is from 20 to 30). See methods section for more detail. Calculation of 10-YR CHANGE using 1993 mortality data are comparability-adjusted.
*Rate or percent suppressed because count is less than 5 (or less than 21 for age-adjusted rates).§Use caution when interpreting data based on 20 or fewer events, the rate/percent is unreliable. See methods for more information.
†Signifi cant difference (0.1 level)ND = No Data, data not collected in 1993 to calculate 10-YR CHANGE.# = 2003 fetal mortality data not available at time of publication.
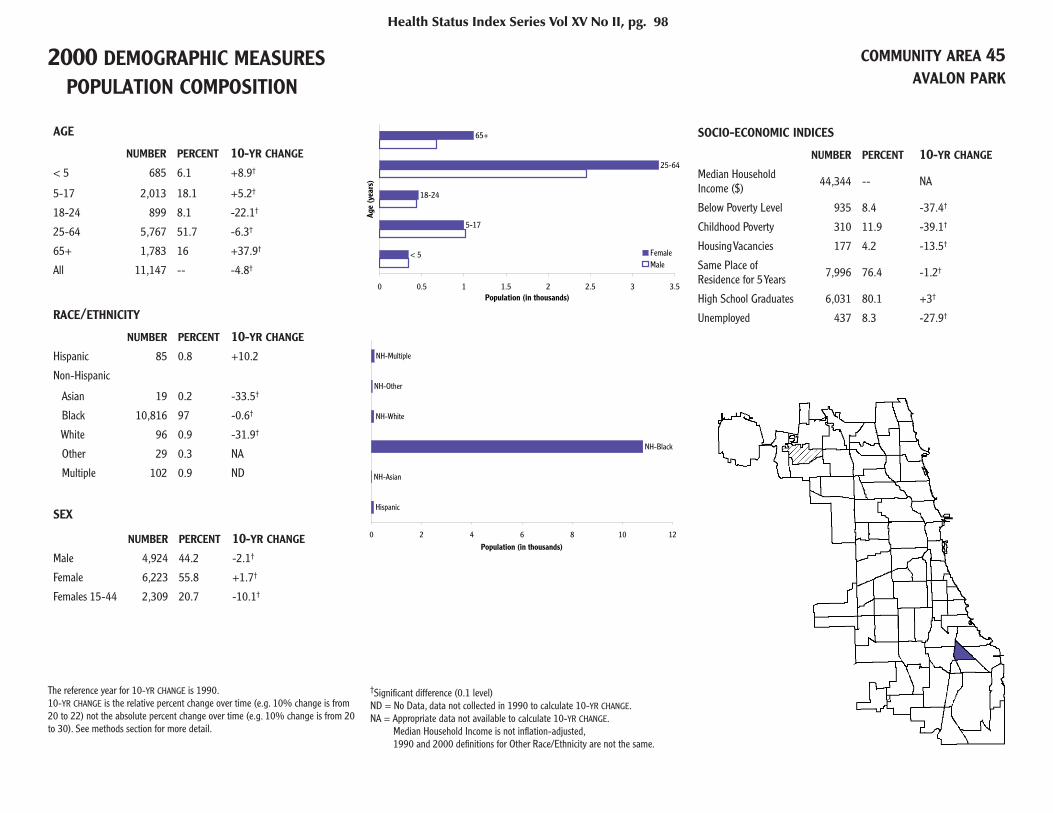
2000 DEMOGRAPHIC MEASURES POPULATION COMPOSITION
COMMUNITY AREA 45AVALON PARK
AGE
NUMBER PERCENT 10-YR CHANGE < 5 685 6.1 +8.9†
5-17 2,013 18.1 +5.2†
18-24 899 8.1 -22.1†
25-64 5,767 51.7 -6.3†
65+ 1,783 16 +37.9†
All 11,147 -- -4.8†
RACE/ETHNICITY
NUMBER PERCENT 10-YR CHANGE Hispanic 85 0.8 +10.2
Non-Hispanic
Asian 19 0.2 -33.5†
Black 10,816 97 -0.6†
White 96 0.9 -31.9†
Other 29 0.3 NA
Multiple 102 0.9 ND
SEX
NUMBER PERCENT 10-YR CHANGE Male 4,924 44.2 -2.1†
Female 6,223 55.8 +1.7†
Females 15-44 2,309 20.7 -10.1†
SOCIO-ECONOMIC INDICES
NUMBER PERCENT 10-YR CHANGE
Median Household Income ($) 44,344 -- NA
Below Poverty Level 935 8.4 -37.4†
Childhood Poverty 310 11.9 -39.1†
Housing Vacancies 177 4.2 -13.5†
Same Place of Residence for 5 Years 7,996 76.4 -1.2†
High School Graduates 6,031 80.1 +3†
Unemployed 437 8.3 -27.9†
Health Status Index Series Vol XV No II, pg. 98
< 5
5-17
18-24
25-64
65+
0 0.5 1 1.5 2 2.5 3 3.5
Age
(yea
rs)
Population (in thousands)
FemaleMale
Hispanic
NH-Asian
NH-Black
NH-White
NH-Other
NH-Multiple
0 2 4 6 8 10 12
Population (in thousands)
The reference year for 10-YR CHANGE is 1990.10-YR CHANGE is the relative percent change over time (e.g. 10% change is from 20 to 22) not the absolute percent change over time (e.g. 10% change is from 20 to 30). See methods section for more detail.
†Signifi cant difference (0.1 level)ND = No Data, data not collected in 1990 to calculate 10-YR CHANGE.NA = Appropriate data not available to calculate 10-YR CHANGE. Median Household Income is not infl ation-adjusted, 1990 and 2000 defi nitions for Other Race/Ethnicity are not the same.

2003 HEALTH MEASURES COMMUNITY AREA 45AVALON PARK
2003 ALL-CAUSE MORTALITY: 129 DEATHS,1,062.7 PER 100,000, 21.7%† DECREASE FROM 1993.2003 BIRTHS: 129 BIRTHS, FERTILITY RATE IS55.9 PER 1000, 23.1%† DECREASE FROM 1993.
INFECTIOUS DISEASE
NUMBER RATE 10-YR CHANGE HIV/AIDS Deaths 1 * --
AIDS Cases (ages 13 and older) 30 325.8 +168.1†
Chlamydia 107 959.9 ND
Gonorrhea 60 538.3 ND
Syphilis 0 * ND
Infl uenza and Pneumonia Deaths 2 * --
Tuberculosis 0 * --
Hepatitis C 11 98.7§ ND
DISABILITIES (2000 CENSUS)
NUMBER PERCENT
Blind/Deaf 426 4.1
Physical 1,218 11.6
Mental 472 4.5
Requires Care 395 3.8
Home-Bound 938 10.7
Unable to Work 1,091 15.7
MATERNAL HEALTH
NUMBER PCT 10-YR CHANGE First Trimester Prenatal Care 98 76 +6.4
Smoking 14 10.9§ +25.1
Caesarean Section 37 28.7 +51.9†
INFANT AND CHILD HEALTH
NUMBER RATE/PCT 10-YR CHANGE Very Low Birthweight (P) 2 * --
Premature Birth (P) 21 16.3 +10
Fetal Mortality (R) #
Infant Mortality (R) 2 * --
Lead Screening
Screened (P) 355 35.4 ND
Elevated(P) 16 4.5§ ND
CANCER DEATHS
NUMBER RATE 10-YR CHANGE All-cancers 28 213.1 -35.9†
Breast 1 * --
Colon 4 * --
Lung 8 * --
Prostate 1 * --
UNNATURAL CAUSES OF DEATH
NUMBER RATE 10-YR CHANGE Accidents 5 * --
Homicide 0 * --
Suicide 3 * --
CHRONIC DISEASE DEATHS
NUMBER RATE 10-YR CHANGE Heart Disease 40 322.7 -34.4†
Stroke 13 * --
Lower Respiratory Disease 2 * --
Diabetes Mellitus 4 * --
Liver Disease and Cirrohosis 0 * --
Alzheimer’s Disease 4 * --
Health Status Index Series Vol XV No II, pg. 99
The reference year for 10-YR CHANGE is 1993. 10-YR CHANGE is the relative percent change over time (e.g. 10% change is from 20 to 22) not the absolute percent change over time (e.g. 10% change is from 20 to 30). See methods section for more detail. Calculation of 10-YR CHANGE using 1993 mortality data are comparability-adjusted.
*Rate or percent suppressed because count is less than 5 (or less than 21 for age-adjusted rates).§Use caution when interpreting data based on 20 or fewer events, the rate/percent is unreliable. See methods for more information.
†Signifi cant difference (0.1 level)ND = No Data, data not collected in 1993 to calculate 10-YR CHANGE.# = 2003 fetal mortality data not available at time of publication.
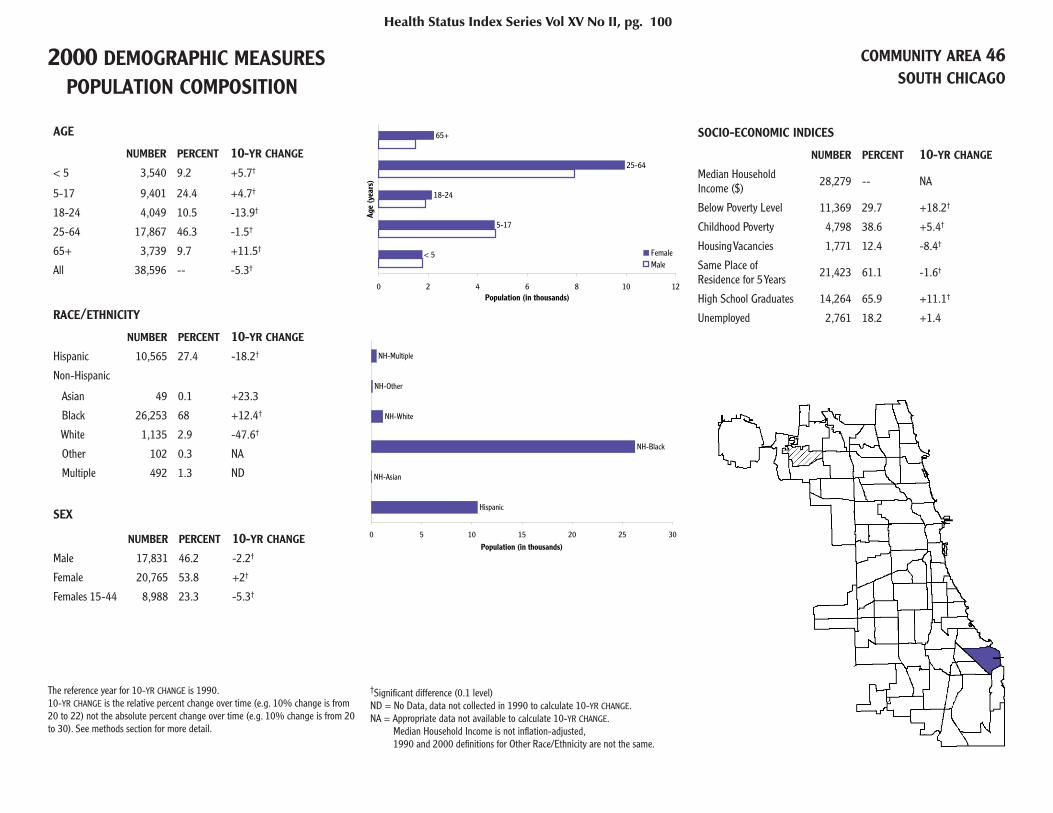
2000 DEMOGRAPHIC MEASURES POPULATION COMPOSITION
COMMUNITY AREA 46SOUTH CHICAGO
AGE
NUMBER PERCENT 10-YR CHANGE < 5 3,540 9.2 +5.7†
5-17 9,401 24.4 +4.7†
18-24 4,049 10.5 -13.9†
25-64 17,867 46.3 -1.5†
65+ 3,739 9.7 +11.5†
All 38,596 -- -5.3†
RACE/ETHNICITY
NUMBER PERCENT 10-YR CHANGE Hispanic 10,565 27.4 -18.2†
Non-Hispanic
Asian 49 0.1 +23.3
Black 26,253 68 +12.4†
White 1,135 2.9 -47.6†
Other 102 0.3 NA
Multiple 492 1.3 ND
SEX
NUMBER PERCENT 10-YR CHANGE Male 17,831 46.2 -2.2†
Female 20,765 53.8 +2†
Females 15-44 8,988 23.3 -5.3†
SOCIO-ECONOMIC INDICES
NUMBER PERCENT 10-YR CHANGE
Median Household Income ($) 28,279 -- NA
Below Poverty Level 11,369 29.7 +18.2†
Childhood Poverty 4,798 38.6 +5.4†
Housing Vacancies 1,771 12.4 -8.4†
Same Place of Residence for 5 Years 21,423 61.1 -1.6†
High School Graduates 14,264 65.9 +11.1†
Unemployed 2,761 18.2 +1.4
Health Status Index Series Vol XV No II, pg. 100
< 5
5-17
18-24
25-64
65+
0 2 4 6 8 10 12
Age
(yea
rs)
Population (in thousands)
FemaleMale
Hispanic
NH-Asian
NH-Black
NH-White
NH-Other
NH-Multiple
0 5 10 15 20 25 30
Population (in thousands)
The reference year for 10-YR CHANGE is 1990.10-YR CHANGE is the relative percent change over time (e.g. 10% change is from 20 to 22) not the absolute percent change over time (e.g. 10% change is from 20 to 30). See methods section for more detail.
†Signifi cant difference (0.1 level)ND = No Data, data not collected in 1990 to calculate 10-YR CHANGE.NA = Appropriate data not available to calculate 10-YR CHANGE. Median Household Income is not infl ation-adjusted, 1990 and 2000 defi nitions for Other Race/Ethnicity are not the same.

2003 HEALTH MEASURES COMMUNITY AREA 46SOUTH CHICAGO
2003 ALL-CAUSE MORTALITY: 301 DEATHS,1,037.9 PER 100,000, 6.7% DECREASE FROM 1993.2003 BIRTHS: 630 BIRTHS, FERTILITY RATE IS70.1 PER 1000, 27.2%† DECREASE FROM 1993.
INFECTIOUS DISEASE
NUMBER RATE 10-YR CHANGE HIV/AIDS Deaths 2 * --
AIDS Cases(ages 13 and older) 102 352.9 +326.1†
Chlamydia 444 1,150.4 ND
Gonorrhea 230 595.9 ND
Syphilis 0 * ND
Infl uenza and Pneumonia Deaths 6 * --
Tuberculosis 11 28.5§ -17
Hepatitis C 28 72.5 ND
DISABILITIES (2000 CENSUS)
NUMBER PERCENT
Blind/Deaf 1,272 3.6
Physical 3,329 9.5
Mental 1,851 5.3
Requires Care 1,176 3.4
Home-Bound 3,581 13.3
Unable to Work 3,918 16.9
MATERNAL HEALTH
NUMBER PCT 10-YR CHANGE First Trimester Prenatal Care 469 74.4 +11†
Smoking 58 9.2 -25.3†
Caesarean Section 144 22.9 +36.3†
INFANT AND CHILD HEALTH
NUMBER RATE/PCT 10-YR CHANGE Very Low Birthweight (P) 17 2.7§ +13.3
Premature Birth (P) 80 12.7 +6.7
Fetal Mortality (R) #
Infant Mortality (R) 6 9.5§ -38.7
Lead Screening
Screened (P) 2,138 42.1 ND
Elevated(P) 161 7.5 ND
CANCER DEATHS
NUMBER RATE 10-YR CHANGE All-cancers 78 257.6 -10.3
Breast 6 * --
Colon 4 * --
Lung 25 82.5 +19
Prostate 4 * --
UNNATURAL CAUSES OF DEATH
NUMBER RATE 10-YR CHANGE Accidents 15 * --
Homicide 11 * --
Suicide 3 * --
CHRONIC DISEASE DEATHS
NUMBER RATE 10-YR CHANGE Heart Disease 85 307.2 +3.4
Stroke 13 * --
Lower Respiratory Disease 5 * --
Diabetes Mellitus 10 * --
Liver Disease and Cirrohosis 3 * --
Alzheimer’s Disease 2 * --
Health Status Index Series Vol XV No II, pg. 101
The reference year for 10-YR CHANGE is 1993. 10-YR CHANGE is the relative percent change over time (e.g. 10% change is from 20 to 22) not the absolute percent change over time (e.g. 10% change is from 20 to 30). See methods section for more detail. Calculation of 10-YR CHANGE using 1993 mortality data are comparability-adjusted.
*Rate or percent suppressed because count is less than 5 (or less than 21 for age-adjusted rates).§Use caution when interpreting data based on 20 or fewer events, the rate/percent is unreliable. See methods for more information.
†Signifi cant difference (0.1 level)ND = No Data, data not collected in 1993 to calculate 10-YR CHANGE.# = 2003 fetal mortality data not available at time of publication.
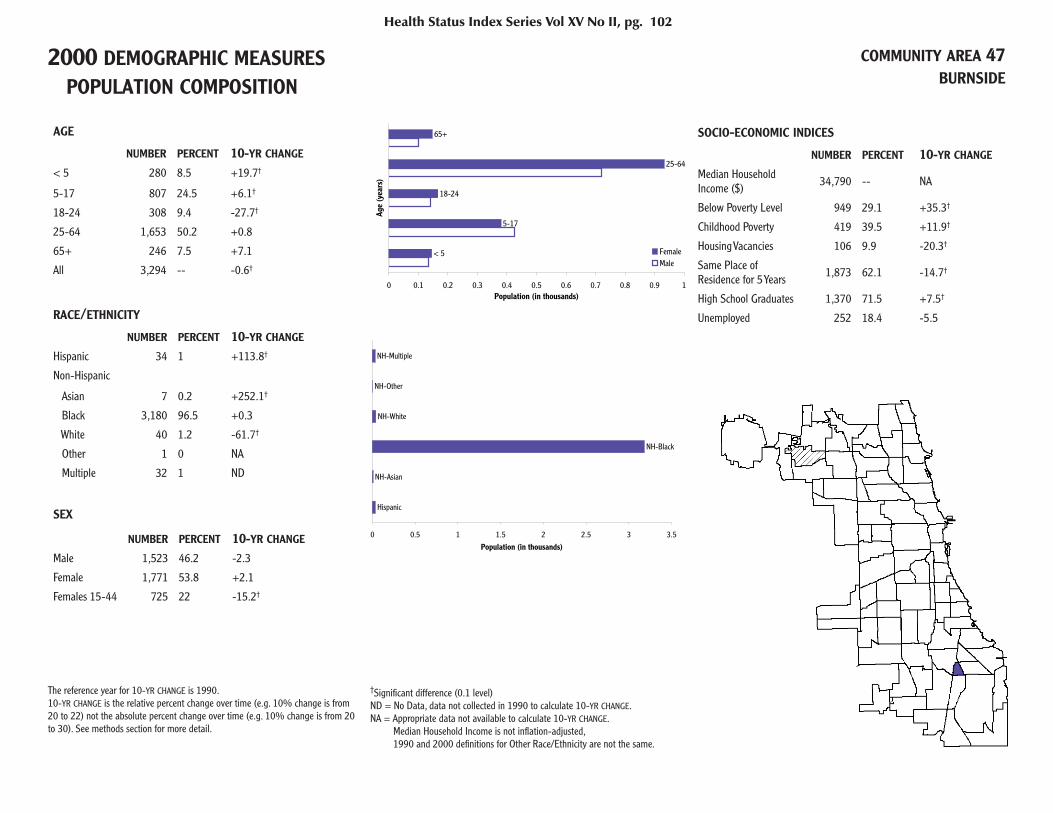
2000 DEMOGRAPHIC MEASURES POPULATION COMPOSITION
COMMUNITY AREA 47BURNSIDE
AGE
NUMBER PERCENT 10-YR CHANGE < 5 280 8.5 +19.7†
5-17 807 24.5 +6.1†
18-24 308 9.4 -27.7†
25-64 1,653 50.2 +0.8
65+ 246 7.5 +7.1
All 3,294 -- -0.6†
RACE/ETHNICITY
NUMBER PERCENT 10-YR CHANGE Hispanic 34 1 +113.8†
Non-Hispanic
Asian 7 0.2 +252.1†
Black 3,180 96.5 +0.3
White 40 1.2 -61.7†
Other 1 0 NA
Multiple 32 1 ND
SEX
NUMBER PERCENT 10-YR CHANGE Male 1,523 46.2 -2.3
Female 1,771 53.8 +2.1
Females 15-44 725 22 -15.2†
SOCIO-ECONOMIC INDICES
NUMBER PERCENT 10-YR CHANGE
Median Household Income ($) 34,790 -- NA
Below Poverty Level 949 29.1 +35.3†
Childhood Poverty 419 39.5 +11.9†
Housing Vacancies 106 9.9 -20.3†
Same Place of Residence for 5 Years 1,873 62.1 -14.7†
High School Graduates 1,370 71.5 +7.5†
Unemployed 252 18.4 -5.5
Health Status Index Series Vol XV No II, pg. 102
< 5
5-17
18-24
25-64
65+
0 0.1 0.2 0.3 0.4 0.5 0.6 0.7 0.8 0.9 1
Age
(yea
rs)
Population (in thousands)
FemaleMale
Hispanic
NH-Asian
NH-Black
NH-White
NH-Other
NH-Multiple
0 0.5 1 1.5 2 2.5 3 3.5
Population (in thousands)
The reference year for 10-YR CHANGE is 1990.10-YR CHANGE is the relative percent change over time (e.g. 10% change is from 20 to 22) not the absolute percent change over time (e.g. 10% change is from 20 to 30). See methods section for more detail.
†Signifi cant difference (0.1 level)ND = No Data, data not collected in 1990 to calculate 10-YR CHANGE.NA = Appropriate data not available to calculate 10-YR CHANGE. Median Household Income is not infl ation-adjusted, 1990 and 2000 defi nitions for Other Race/Ethnicity are not the same.
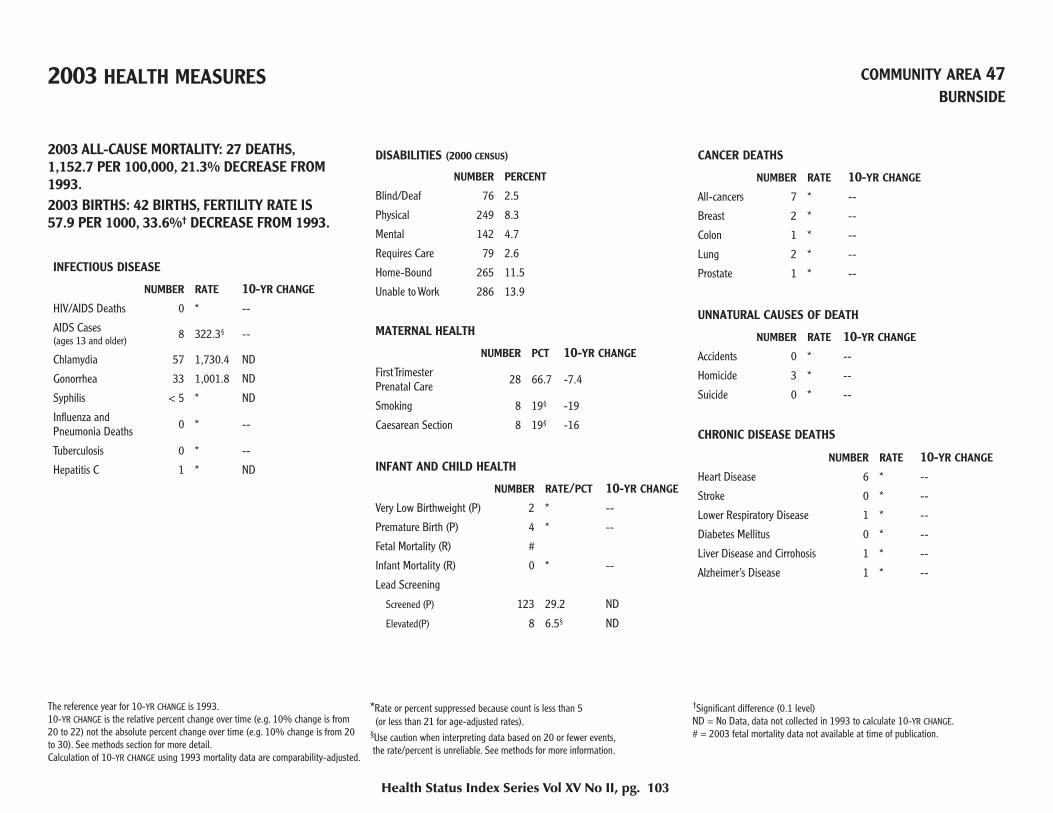
2003 HEALTH MEASURES COMMUNITY AREA 47BURNSIDE
2003 ALL-CAUSE MORTALITY: 27 DEATHS,1,152.7 PER 100,000, 21.3% DECREASE FROM 1993.2003 BIRTHS: 42 BIRTHS, FERTILITY RATE IS57.9 PER 1000, 33.6%† DECREASE FROM 1993.
INFECTIOUS DISEASE
NUMBER RATE 10-YR CHANGE HIV/AIDS Deaths 0 * --
AIDS Cases (ages 13 and older) 8 322.3§ --
Chlamydia 57 1,730.4 ND
Gonorrhea 33 1,001.8 ND
Syphilis < 5 * ND
Infl uenza and Pneumonia Deaths 0 * --
Tuberculosis 0 * --
Hepatitis C 1 * ND
DISABILITIES (2000 CENSUS)
NUMBER PERCENT
Blind/Deaf 76 2.5
Physical 249 8.3
Mental 142 4.7
Requires Care 79 2.6
Home-Bound 265 11.5
Unable to Work 286 13.9
MATERNAL HEALTH
NUMBER PCT 10-YR CHANGE First Trimester Prenatal Care 28 66.7 -7.4
Smoking 8 19§ -19
Caesarean Section 8 19§ -16
INFANT AND CHILD HEALTH
NUMBER RATE/PCT 10-YR CHANGE Very Low Birthweight (P) 2 * --
Premature Birth (P) 4 * --
Fetal Mortality (R) #
Infant Mortality (R) 0 * --
Lead Screening
Screened (P) 123 29.2 ND
Elevated(P) 8 6.5§ ND
CANCER DEATHS
NUMBER RATE 10-YR CHANGE All-cancers 7 * --
Breast 2 * --
Colon 1 * --
Lung 2 * --
Prostate 1 * --
UNNATURAL CAUSES OF DEATH
NUMBER RATE 10-YR CHANGE Accidents 0 * --
Homicide 3 * --
Suicide 0 * --
CHRONIC DISEASE DEATHS
NUMBER RATE 10-YR CHANGE Heart Disease 6 * --
Stroke 0 * --
Lower Respiratory Disease 1 * --
Diabetes Mellitus 0 * --
Liver Disease and Cirrohosis 1 * --
Alzheimer’s Disease 1 * --
Health Status Index Series Vol XV No II, pg. 103
The reference year for 10-YR CHANGE is 1993. 10-YR CHANGE is the relative percent change over time (e.g. 10% change is from 20 to 22) not the absolute percent change over time (e.g. 10% change is from 20 to 30). See methods section for more detail. Calculation of 10-YR CHANGE using 1993 mortality data are comparability-adjusted.
*Rate or percent suppressed because count is less than 5 (or less than 21 for age-adjusted rates).§Use caution when interpreting data based on 20 or fewer events, the rate/percent is unreliable. See methods for more information.
†Signifi cant difference (0.1 level)ND = No Data, data not collected in 1993 to calculate 10-YR CHANGE.# = 2003 fetal mortality data not available at time of publication.

2000 DEMOGRAPHIC MEASURES POPULATION COMPOSITION
COMMUNITY AREA 48CALUMET HEIGHTS
AGE
NUMBER PERCENT 10-YR CHANGE < 5 900 5.6 +7.7†
5-17 2,635 16.5 -2.9
18-24 1,208 7.6 -34.5†
25-64 8,651 54.2 -3.2†
65+ 2,580 16.2 +58.8†
All 15,974 -- -8.5†
RACE/ETHNICITY
NUMBER PERCENT 10-YR CHANGE Hispanic 747 4.7 -11.3†
Non-Hispanic
Asian 33 0.2 -59.5†
Black 14,817 92.8 +1.3†
White 206 1.3 -47.7†
Other 24 0.2 NA
Multiple 147 0.9 ND
SEX
NUMBER PERCENT 10-YR CHANGE Male 7,102 44.5 -3.7†
Female 8,872 55.5 +3.2†
Females 15-44 3,165 19.8 -13†
SOCIO-ECONOMIC INDICES
NUMBER PERCENT 10-YR CHANGE
Median Household Income ($) 46,326 -- NA
Below Poverty Level 1,902 11.9 +53.6†
Childhood Poverty 678 19.4 +46†
Housing Vacancies 245 4 -18.8†
Same Place of Residence for 5 Years 11,679 77.5 +7.5†
High School Graduates 9,336 83 +2.4†
Unemployed 716 9.2 -16.6†
Health Status Index Series Vol XV No II, pg. 104
< 5
5-17
18-24
25-64
65+
0 1 2 3 4 5 6
Age
(yea
rs)
Population (in thousands)
FemaleMale
Hispanic
NH-Asian
NH-Black
NH-White
NH-Other
NH-Multiple
0 2 4 6 8 10 12 14 16
Population (in thousands)
The reference year for 10-YR CHANGE is 1990.10-YR CHANGE is the relative percent change over time (e.g. 10% change is from 20 to 22) not the absolute percent change over time (e.g. 10% change is from 20 to 30). See methods section for more detail.
†Signifi cant difference (0.1 level)ND = No Data, data not collected in 1990 to calculate 10-YR CHANGE.NA = Appropriate data not available to calculate 10-YR CHANGE. Median Household Income is not infl ation-adjusted, 1990 and 2000 defi nitions for Other Race/Ethnicity are not the same.

2003 HEALTH MEASURES COMMUNITY AREA 48CALUMET HEIGHTS
2003 ALL-CAUSE MORTALITY: 218 DEATHS,1,383.6 PER 100,000, 14.5%† INCREASE FROM 1993.2003 BIRTHS: 166 BIRTHS, FERTILITY RATE IS52.4 PER 1000, 16.3%† DECREASE FROM 1993.
INFECTIOUS DISEASE
NUMBER RATE 10-YR CHANGE HIV/AIDS Deaths 1 * --
AIDS Cases (ages 13 and older) 41 304.8 +278.3†
Chlamydia 155 970.3 ND
Gonorrhea 72 450.7 ND
Syphilis 0 * ND
Infl uenza and Pneumonia Deaths 7 * --
Tuberculosis 4 * --
Hepatitis C 9 56.3§ ND
DISABILITIES (2000 CENSUS)
NUMBER PERCENT
Blind/Deaf 508 3.4
Physical 1,429 9.5
Mental 800 5.3
Requires Care 569 3.8
Home-Bound 1,648 12.8
Unable to Work 1,506 14.7
MATERNAL HEALTH
NUMBER PCT 10-YR CHANGE First Trimester Prenatal Care 131 78.9 +18.4†
Smoking 15 9§ -25
Caesarean Section 53 31.9 +50†
INFANT AND CHILD HEALTH
NUMBER RATE/PCT 10-YR CHANGE Very Low Birthweight (P) 10 6§ +87.5†
Premature Birth (P) 28 16.9 +50†
Fetal Mortality (R) #
Infant Mortality (R) 2 * --
Lead Screening
Screened (P) 461 36.6 ND
Elevated(P) 14 3.0§ ND
CANCER DEATHS
NUMBER RATE 10-YR CHANGE All-cancers 49 274.7 -13.3
Breast 4 * --
Colon 6 * --
Lung 14 * --
Prostate 7 * --
UNNATURAL CAUSES OF DEATH
NUMBER RATE 10-YR CHANGE Accidents 2 * --
Homicide 6 * --
Suicide 2 * --
CHRONIC DISEASE DEATHS
NUMBER RATE 10-YR CHANGE Heart Disease 62 412.6 +5.8
Stroke 20 * --
Lower Respiratory Disease 0 * --
Diabetes Mellitus 7 * --
Liver Disease and Cirrohosis 1 * --
Alzheimer’s Disease 6 * --
Health Status Index Series Vol XV No II, pg. 105
The reference year for 10-YR CHANGE is 1993. 10-YR CHANGE is the relative percent change over time (e.g. 10% change is from 20 to 22) not the absolute percent change over time (e.g. 10% change is from 20 to 30). See methods section for more detail. Calculation of 10-YR CHANGE using 1993 mortality data are comparability-adjusted.
*Rate or percent suppressed because count is less than 5 (or less than 21 for age-adjusted rates).§Use caution when interpreting data based on 20 or fewer events, the rate/percent is unreliable. See methods for more information.
†Signifi cant difference (0.1 level)ND = No Data, data not collected in 1993 to calculate 10-YR CHANGE.# = 2003 fetal mortality data not available at time of publication.
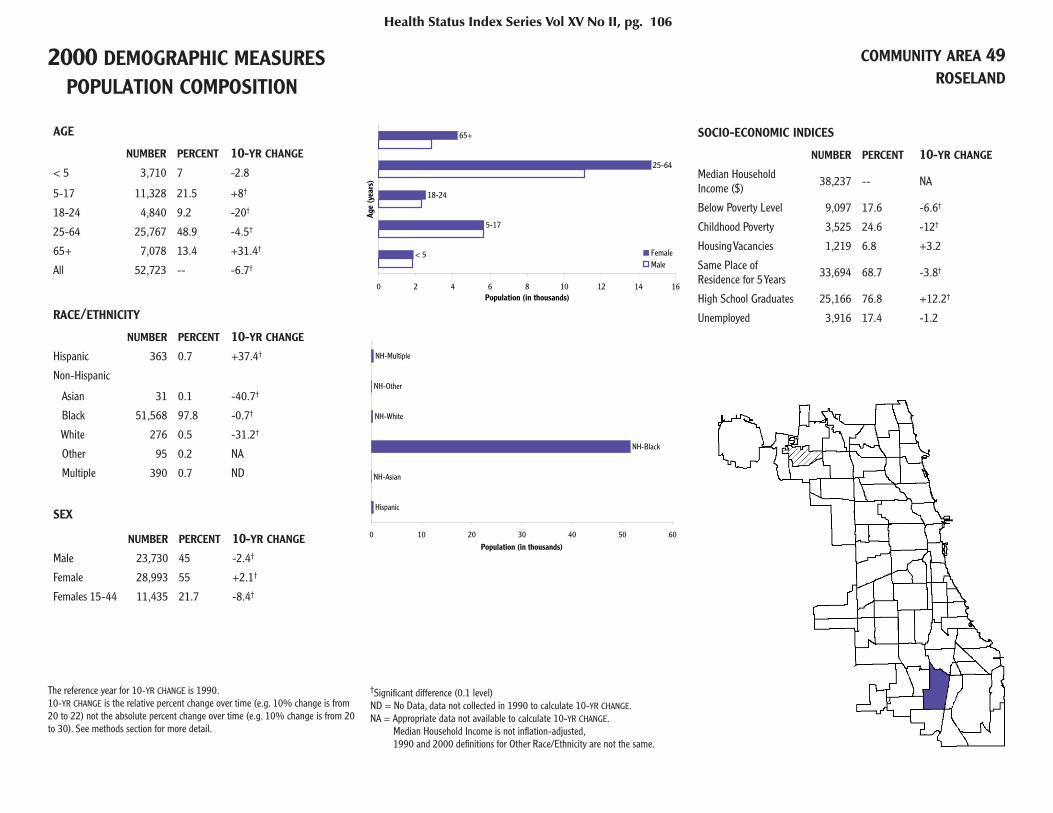
2000 DEMOGRAPHIC MEASURES POPULATION COMPOSITION
COMMUNITY AREA 49ROSELAND
AGE
NUMBER PERCENT 10-YR CHANGE < 5 3,710 7 -2.8
5-17 11,328 21.5 +8†
18-24 4,840 9.2 -20†
25-64 25,767 48.9 -4.5†
65+ 7,078 13.4 +31.4†
All 52,723 -- -6.7†
RACE/ETHNICITY
NUMBER PERCENT 10-YR CHANGE Hispanic 363 0.7 +37.4†
Non-Hispanic
Asian 31 0.1 -40.7†
Black 51,568 97.8 -0.7†
White 276 0.5 -31.2†
Other 95 0.2 NA
Multiple 390 0.7 ND
SEX
NUMBER PERCENT 10-YR CHANGE Male 23,730 45 -2.4†
Female 28,993 55 +2.1†
Females 15-44 11,435 21.7 -8.4†
SOCIO-ECONOMIC INDICES
NUMBER PERCENT 10-YR CHANGE
Median Household Income ($) 38,237 -- NA
Below Poverty Level 9,097 17.6 -6.6†
Childhood Poverty 3,525 24.6 -12†
Housing Vacancies 1,219 6.8 +3.2
Same Place of Residence for 5 Years 33,694 68.7 -3.8†
High School Graduates 25,166 76.8 +12.2†
Unemployed 3,916 17.4 -1.2
Health Status Index Series Vol XV No II, pg. 106
< 5
5-17
18-24
25-64
65+
0 2 4 6 8 10 12 14 16
Age
(yea
rs)
Population (in thousands)
FemaleMale
Hispanic
NH-Asian
NH-Black
NH-White
NH-Other
NH-Multiple
0 10 20 30 40 50 60
Population (in thousands)
The reference year for 10-YR CHANGE is 1990.10-YR CHANGE is the relative percent change over time (e.g. 10% change is from 20 to 22) not the absolute percent change over time (e.g. 10% change is from 20 to 30). See methods section for more detail.
†Signifi cant difference (0.1 level)ND = No Data, data not collected in 1990 to calculate 10-YR CHANGE.NA = Appropriate data not available to calculate 10-YR CHANGE. Median Household Income is not infl ation-adjusted, 1990 and 2000 defi nitions for Other Race/Ethnicity are not the same.
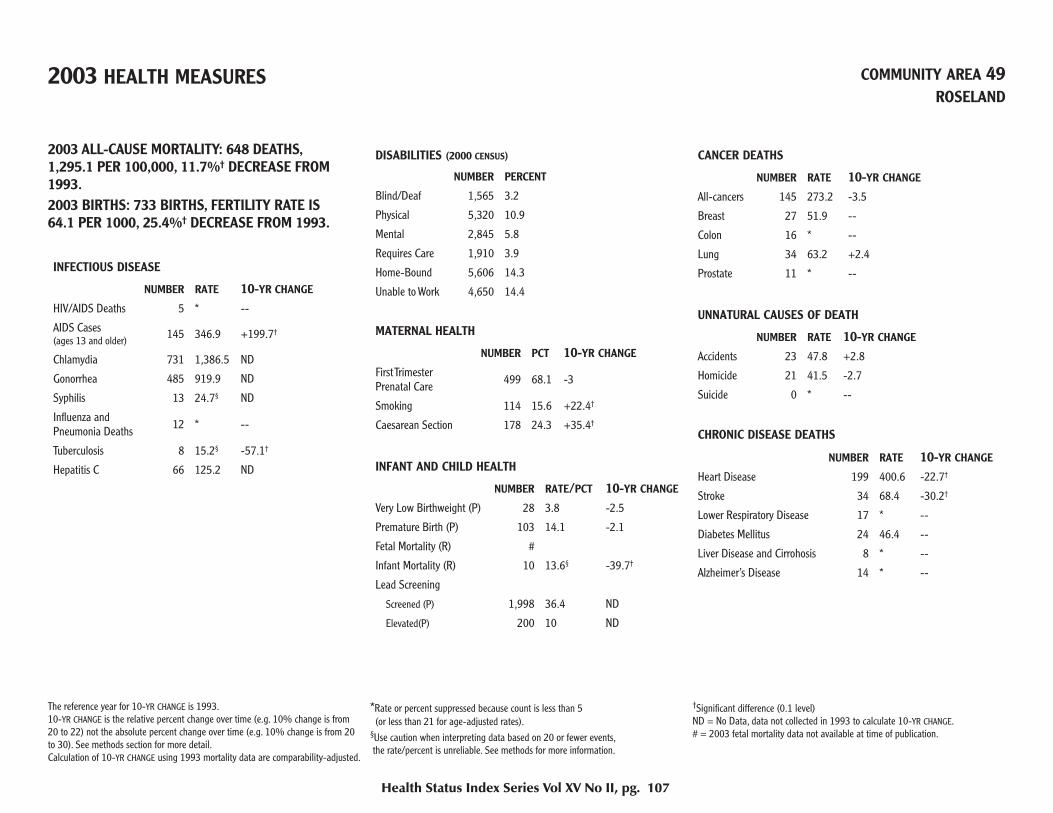
2003 HEALTH MEASURES COMMUNITY AREA 49ROSELAND
2003 ALL-CAUSE MORTALITY: 648 DEATHS,1,295.1 PER 100,000, 11.7%† DECREASE FROM 1993.2003 BIRTHS: 733 BIRTHS, FERTILITY RATE IS64.1 PER 1000, 25.4%† DECREASE FROM 1993.
INFECTIOUS DISEASE
NUMBER RATE 10-YR CHANGE HIV/AIDS Deaths 5 * --
AIDS Cases (ages 13 and older) 145 346.9 +199.7†
Chlamydia 731 1,386.5 ND
Gonorrhea 485 919.9 ND
Syphilis 13 24.7§ ND
Infl uenza and Pneumonia Deaths 12 * --
Tuberculosis 8 15.2§ -57.1†
Hepatitis C 66 125.2 ND
DISABILITIES (2000 CENSUS)
NUMBER PERCENT
Blind/Deaf 1,565 3.2
Physical 5,320 10.9
Mental 2,845 5.8
Requires Care 1,910 3.9
Home-Bound 5,606 14.3
Unable to Work 4,650 14.4
MATERNAL HEALTH
NUMBER PCT 10-YR CHANGE First Trimester Prenatal Care 499 68.1 -3
Smoking 114 15.6 +22.4†
Caesarean Section 178 24.3 +35.4†
INFANT AND CHILD HEALTH
NUMBER RATE/PCT 10-YR CHANGE Very Low Birthweight (P) 28 3.8 -2.5
Premature Birth (P) 103 14.1 -2.1
Fetal Mortality (R) #
Infant Mortality (R) 10 13.6§ -39.7†
Lead Screening
Screened (P) 1,998 36.4 ND
Elevated(P) 200 10 ND
CANCER DEATHS
NUMBER RATE 10-YR CHANGE All-cancers 145 273.2 -3.5
Breast 27 51.9 --
Colon 16 * --
Lung 34 63.2 +2.4
Prostate 11 * --
UNNATURAL CAUSES OF DEATH
NUMBER RATE 10-YR CHANGE Accidents 23 47.8 +2.8
Homicide 21 41.5 -2.7
Suicide 0 * --
CHRONIC DISEASE DEATHS
NUMBER RATE 10-YR CHANGE Heart Disease 199 400.6 -22.7†
Stroke 34 68.4 -30.2†
Lower Respiratory Disease 17 * --
Diabetes Mellitus 24 46.4 --
Liver Disease and Cirrohosis 8 * --
Alzheimer’s Disease 14 * --
Health Status Index Series Vol XV No II, pg. 107
The reference year for 10-YR CHANGE is 1993. 10-YR CHANGE is the relative percent change over time (e.g. 10% change is from 20 to 22) not the absolute percent change over time (e.g. 10% change is from 20 to 30). See methods section for more detail. Calculation of 10-YR CHANGE using 1993 mortality data are comparability-adjusted.
*Rate or percent suppressed because count is less than 5 (or less than 21 for age-adjusted rates).§Use caution when interpreting data based on 20 or fewer events, the rate/percent is unreliable. See methods for more information.
†Signifi cant difference (0.1 level)ND = No Data, data not collected in 1993 to calculate 10-YR CHANGE.# = 2003 fetal mortality data not available at time of publication.
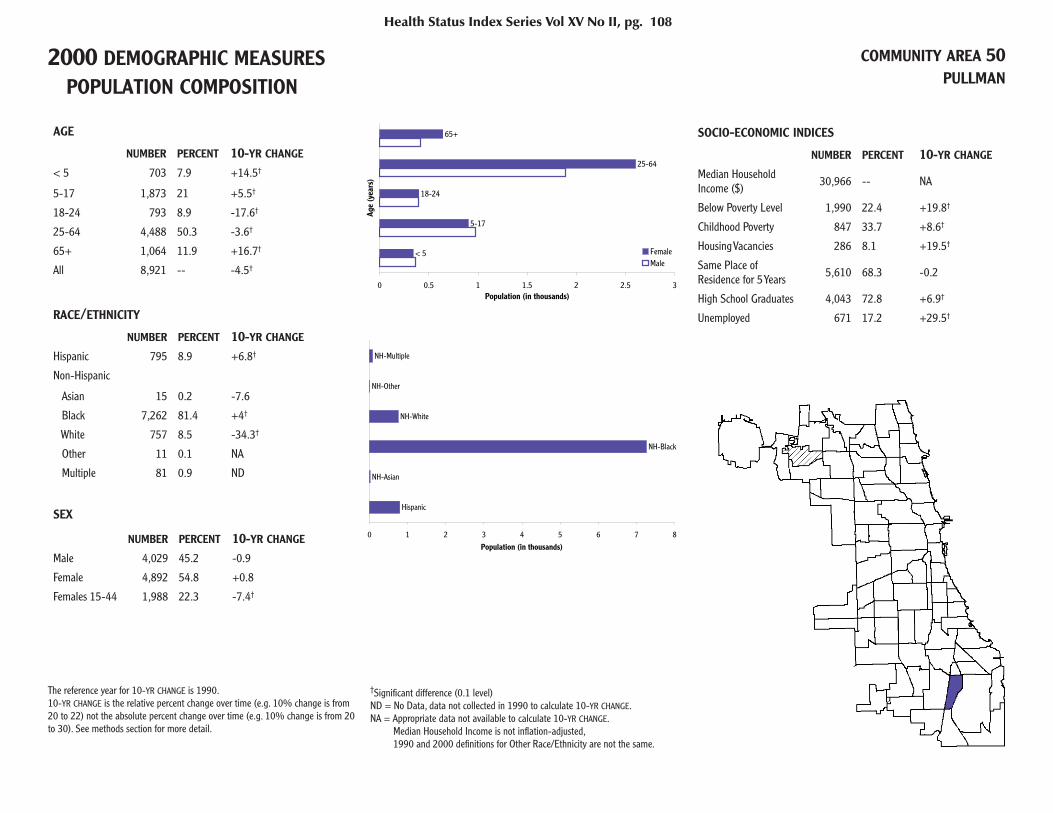
2000 DEMOGRAPHIC MEASURES POPULATION COMPOSITION
COMMUNITY AREA 50PULLMAN
AGE
NUMBER PERCENT 10-YR CHANGE < 5 703 7.9 +14.5†
5-17 1,873 21 +5.5†
18-24 793 8.9 -17.6†
25-64 4,488 50.3 -3.6†
65+ 1,064 11.9 +16.7†
All 8,921 -- -4.5†
RACE/ETHNICITY
NUMBER PERCENT 10-YR CHANGE Hispanic 795 8.9 +6.8†
Non-Hispanic
Asian 15 0.2 -7.6
Black 7,262 81.4 +4†
White 757 8.5 -34.3†
Other 11 0.1 NA
Multiple 81 0.9 ND
SEX
NUMBER PERCENT 10-YR CHANGE Male 4,029 45.2 -0.9
Female 4,892 54.8 +0.8
Females 15-44 1,988 22.3 -7.4†
SOCIO-ECONOMIC INDICES
NUMBER PERCENT 10-YR CHANGE
Median Household Income ($) 30,966 -- NA
Below Poverty Level 1,990 22.4 +19.8†
Childhood Poverty 847 33.7 +8.6†
Housing Vacancies 286 8.1 +19.5†
Same Place of Residence for 5 Years 5,610 68.3 -0.2
High School Graduates 4,043 72.8 +6.9†
Unemployed 671 17.2 +29.5†
Health Status Index Series Vol XV No II, pg. 108
< 5
5-17
18-24
25-64
65+
0 0.5 1 1.5 2 2.5 3
Age
(yea
rs)
Population (in thousands)
FemaleMale
Hispanic
NH-Asian
NH-Black
NH-White
NH-Other
NH-Multiple
0 1 2 3 4 5 6 7 8
Population (in thousands)
The reference year for 10-YR CHANGE is 1990.10-YR CHANGE is the relative percent change over time (e.g. 10% change is from 20 to 22) not the absolute percent change over time (e.g. 10% change is from 20 to 30). See methods section for more detail.
†Signifi cant difference (0.1 level)ND = No Data, data not collected in 1990 to calculate 10-YR CHANGE.NA = Appropriate data not available to calculate 10-YR CHANGE. Median Household Income is not infl ation-adjusted, 1990 and 2000 defi nitions for Other Race/Ethnicity are not the same.

2003 HEALTH MEASURES COMMUNITY AREA 50PULLMAN
2003 ALL-CAUSE MORTALITY: 64 DEATHS,836.2 PER 100,000, 24.6%† DECREASE FROM 1993.2003 BIRTHS: 127 BIRTHS, FERTILITY RATE IS63.9 PER 1000, 19.8%† DECREASE FROM 1993.
INFECTIOUS DISEASE
NUMBER RATE 10-YR CHANGE HIV/AIDS Deaths 3 * --
AIDS Cases (ages 13 and older) 26 372.8 +116.6†
Chlamydia 90 1,008.9 ND
Gonorrhea 54 605.3 ND
Syphilis < 5 * ND
Infl uenza and Pneumonia Deaths 0 * --
Tuberculosis 1 * --
Hepatitis C 9 100.9§ ND
DISABILITIES (2000 CENSUS)
NUMBER PERCENT
Blind/Deaf 287 3.5
Physical 919 11.2
Mental 502 6.1
Requires Care 306 3.7
Home-Bound 967 14.6
Unable to Work 846 15.2
MATERNAL HEALTH
NUMBER PCT 10-YR CHANGE First Trimester Prenatal Care 92 72.4 -2.5
Smoking 10 7.9§ -32.9
Caesarean Section 28 22 +6.7
INFANT AND CHILD HEALTH
NUMBER RATE/PCT 10-YR CHANGE Very Low Birthweight (P) 2 * --
Premature Birth (P) 17 13.4§ +71.1†
Fetal Mortality (R) #
Infant Mortality (R) 2 * --
Lead Screening
Screened (P) 313 31.1 ND
Elevated(P) 20 6.4§ ND
CANCER DEATHS
NUMBER RATE 10-YR CHANGE All-cancers 14 * --
Breast 1 * --
Colon 3 * --
Lung 2 * --
Prostate 0 * --
UNNATURAL CAUSES OF DEATH
NUMBER RATE 10-YR CHANGE Accidents 1 * --
Homicide 1 * --
Suicide 0 * --
CHRONIC DISEASE DEATHS
NUMBER RATE 10-YR CHANGE Heart Disease 20 * --
Stroke 4 * --
Lower Respiratory Disease 2 * --
Diabetes Mellitus 2 * --
Liver Disease and Cirrohosis 0 * --
Alzheimer’s Disease 2 * --
Health Status Index Series Vol XV No II, pg. 109
The reference year for 10-YR CHANGE is 1993. 10-YR CHANGE is the relative percent change over time (e.g. 10% change is from 20 to 22) not the absolute percent change over time (e.g. 10% change is from 20 to 30). See methods section for more detail. Calculation of 10-YR CHANGE using 1993 mortality data are comparability-adjusted.
*Rate or percent suppressed because count is less than 5 (or less than 21 for age-adjusted rates).§Use caution when interpreting data based on 20 or fewer events, the rate/percent is unreliable. See methods for more information.
†Signifi cant difference (0.1 level)ND = No Data, data not collected in 1993 to calculate 10-YR CHANGE.# = 2003 fetal mortality data not available at time of publication.
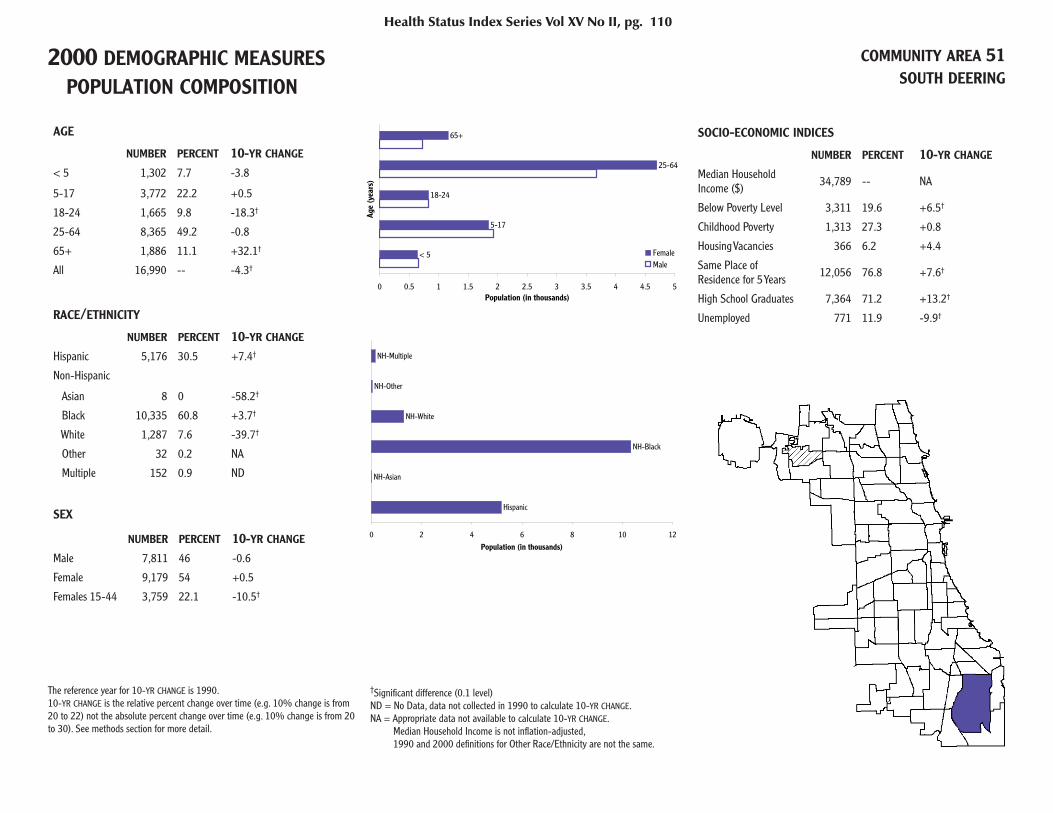
2000 DEMOGRAPHIC MEASURES POPULATION COMPOSITION
COMMUNITY AREA 51SOUTH DEERING
AGE
NUMBER PERCENT 10-YR CHANGE < 5 1,302 7.7 -3.8
5-17 3,772 22.2 +0.5
18-24 1,665 9.8 -18.3†
25-64 8,365 49.2 -0.8
65+ 1,886 11.1 +32.1†
All 16,990 -- -4.3†
RACE/ETHNICITY
NUMBER PERCENT 10-YR CHANGE Hispanic 5,176 30.5 +7.4†
Non-Hispanic
Asian 8 0 -58.2†
Black 10,335 60.8 +3.7†
White 1,287 7.6 -39.7†
Other 32 0.2 NA
Multiple 152 0.9 ND
SEX
NUMBER PERCENT 10-YR CHANGE Male 7,811 46 -0.6
Female 9,179 54 +0.5
Females 15-44 3,759 22.1 -10.5†
SOCIO-ECONOMIC INDICES
NUMBER PERCENT 10-YR CHANGE
Median Household Income ($) 34,789 -- NA
Below Poverty Level 3,311 19.6 +6.5†
Childhood Poverty 1,313 27.3 +0.8
Housing Vacancies 366 6.2 +4.4
Same Place of Residence for 5 Years 12,056 76.8 +7.6†
High School Graduates 7,364 71.2 +13.2†
Unemployed 771 11.9 -9.9†
Health Status Index Series Vol XV No II, pg. 110
< 5
5-17
18-24
25-64
65+
0 0.5 1 1.5 2 2.5 3 3.5 4 4.5 5
Age
(yea
rs)
Population (in thousands)
FemaleMale
Hispanic
NH-Asian
NH-Black
NH-White
NH-Other
NH-Multiple
0 2 4 6 8 10 12
Population (in thousands)
The reference year for 10-YR CHANGE is 1990.10-YR CHANGE is the relative percent change over time (e.g. 10% change is from 20 to 22) not the absolute percent change over time (e.g. 10% change is from 20 to 30). See methods section for more detail.
†Signifi cant difference (0.1 level)ND = No Data, data not collected in 1990 to calculate 10-YR CHANGE.NA = Appropriate data not available to calculate 10-YR CHANGE. Median Household Income is not infl ation-adjusted, 1990 and 2000 defi nitions for Other Race/Ethnicity are not the same.

2003 HEALTH MEASURES COMMUNITY AREA 51SOUTH DEERING
2003 ALL-CAUSE MORTALITY: 140 DEATHS,925 PER 100,000, 34%† DECREASE FROM 1993.2003 BIRTHS: 260 BIRTHS, FERTILITY RATE IS69.2 PER 1000, 4.3% DECREASE FROM 1993.
INFECTIOUS DISEASE
NUMBER RATE 10-YR CHANGE HIV/AIDS Deaths 1 * --
AIDS Cases (ages 13 and older) 28 210 +125.5†
Chlamydia 189 1,112.4 ND
Gonorrhea 90 529.7 ND
Syphilis < 5 * ND
Infl uenza and Pneumonia Deaths 2 * --
Tuberculosis 2 * --
Hepatitis C 13 76.5§ ND
DISABILITIES (2000 CENSUS)
NUMBER PERCENT
Blind/Deaf 587 3.7
Physical 1,504 9.6
Mental 822 5.2
Requires Care 573 3.7
Home-Bound 1,868 15
Unable to Work 1,510 14.2
MATERNAL HEALTH
NUMBER PCT 10-YR CHANGE First Trimester Prenatal Care 205 78.8 +6.4†
Smoking 20 7.7§ -44.6†
Caesarean Section 65 25 +7.1
INFANT AND CHILD HEALTH
NUMBER RATE/PCT 10-YR CHANGE Very Low Birthweight (P) 3 * --
Premature Birth (P) 23 8.8 -28.1†
Fetal Mortality (R) #
Infant Mortality (R) 2 * --
Lead Screening
Screened (P) 724 38.7 ND
Elevated(P) 27 3.7 ND
CANCER DEATHS
NUMBER RATE 10-YR CHANGE All-cancers 34 210.6 -19.3
Breast 8 * --
Colon 3 * --
Lung 13 * --
Prostate 0 * --
UNNATURAL CAUSES OF DEATH
NUMBER RATE 10-YR CHANGE Accidents 10 * --
Homicide 3 * --
Suicide 1 * --
CHRONIC DISEASE DEATHS
NUMBER RATE 10-YR CHANGE Heart Disease 38 248.5 -50.3†
Stroke 7 * --
Lower Respiratory Disease 3 * --
Diabetes Mellitus 5 * --
Liver Disease and Cirrohosis 1 * --
Alzheimer’s Disease 2 * --
Health Status Index Series Vol XV No II, pg. 111
The reference year for 10-YR CHANGE is 1993. 10-YR CHANGE is the relative percent change over time (e.g. 10% change is from 20 to 22) not the absolute percent change over time (e.g. 10% change is from 20 to 30). See methods section for more detail. Calculation of 10-YR CHANGE using 1993 mortality data are comparability-adjusted.
*Rate or percent suppressed because count is less than 5 (or less than 21 for age-adjusted rates).§Use caution when interpreting data based on 20 or fewer events, the rate/percent is unreliable. See methods for more information.
†Signifi cant difference (0.1 level)ND = No Data, data not collected in 1993 to calculate 10-YR CHANGE.# = 2003 fetal mortality data not available at time of publication.
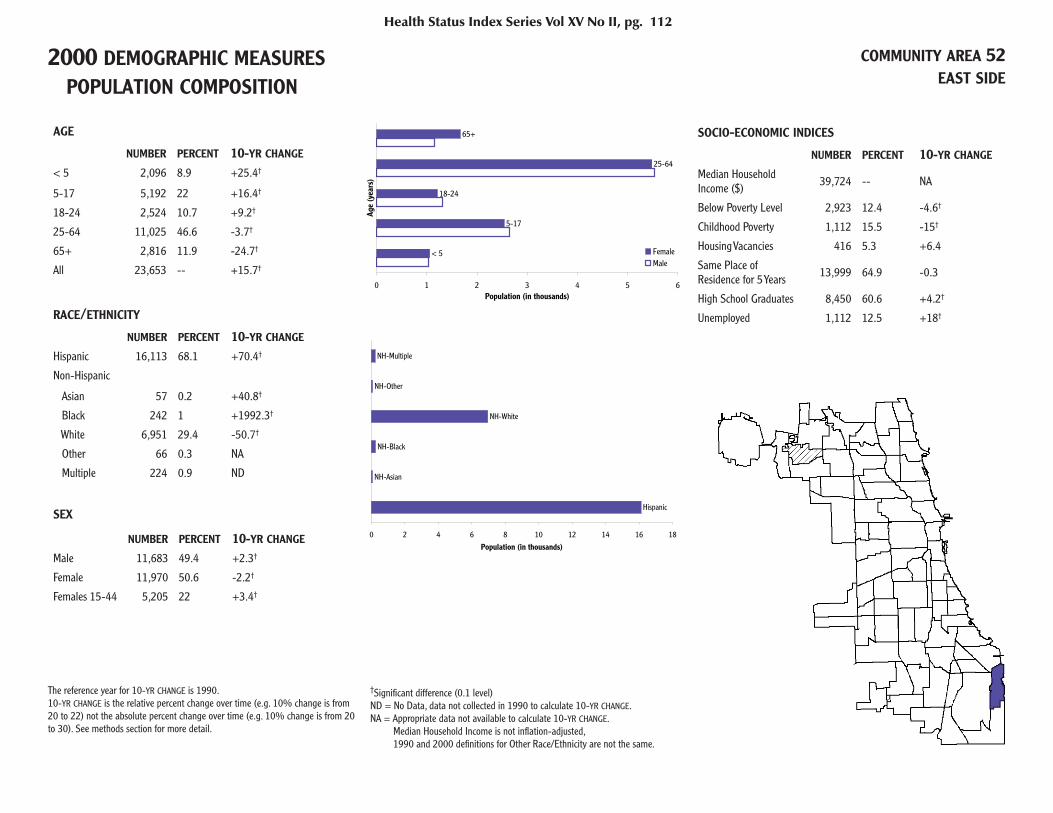
2000 DEMOGRAPHIC MEASURES POPULATION COMPOSITION
COMMUNITY AREA 52EAST SIDE
AGE
NUMBER PERCENT 10-YR CHANGE < 5 2,096 8.9 +25.4†
5-17 5,192 22 +16.4†
18-24 2,524 10.7 +9.2†
25-64 11,025 46.6 -3.7†
65+ 2,816 11.9 -24.7†
All 23,653 -- +15.7†
RACE/ETHNICITY
NUMBER PERCENT 10-YR CHANGE Hispanic 16,113 68.1 +70.4†
Non-Hispanic
Asian 57 0.2 +40.8†
Black 242 1 +1992.3†
White 6,951 29.4 -50.7†
Other 66 0.3 NA
Multiple 224 0.9 ND
SEX
NUMBER PERCENT 10-YR CHANGE Male 11,683 49.4 +2.3†
Female 11,970 50.6 -2.2†
Females 15-44 5,205 22 +3.4†
SOCIO-ECONOMIC INDICES
NUMBER PERCENT 10-YR CHANGE
Median Household Income ($) 39,724 -- NA
Below Poverty Level 2,923 12.4 -4.6†
Childhood Poverty 1,112 15.5 -15†
Housing Vacancies 416 5.3 +6.4
Same Place of Residence for 5 Years 13,999 64.9 -0.3
High School Graduates 8,450 60.6 +4.2†
Unemployed 1,112 12.5 +18†
Health Status Index Series Vol XV No II, pg. 112
< 5
5-17
18-24
25-64
65+
0 1 2 3 4 5 6
Age
(yea
rs)
Population (in thousands)
FemaleMale
Hispanic
NH-Asian
NH-Black
NH-White
NH-Other
NH-Multiple
0 2 4 6 8 10 12 14 16 18
Population (in thousands)
The reference year for 10-YR CHANGE is 1990.10-YR CHANGE is the relative percent change over time (e.g. 10% change is from 20 to 22) not the absolute percent change over time (e.g. 10% change is from 20 to 30). See methods section for more detail.
†Signifi cant difference (0.1 level)ND = No Data, data not collected in 1990 to calculate 10-YR CHANGE.NA = Appropriate data not available to calculate 10-YR CHANGE. Median Household Income is not infl ation-adjusted, 1990 and 2000 defi nitions for Other Race/Ethnicity are not the same.

2003 HEALTH MEASURES COMMUNITY AREA 52EAST SIDE
2003 ALL-CAUSE MORTALITY: 158 DEATHS,761.2 PER 100,000, 23.4%† DECREASE FROM 1993.2003 BIRTHS: 457 BIRTHS, FERTILITY RATE IS87.8 PER 1000, 4.7% INCREASE FROM 1993.
INFECTIOUS DISEASE
NUMBER RATE 10-YR CHANGE HIV/AIDS Deaths 0 * --
AIDS Cases (ages 13 and older) 11 60.2§ --
Chlamydia 69 291.7 ND
Gonorrhea 7 29.6§ ND
Syphilis 0 * ND
Infl uenza and Pneumonia Deaths 3 * --
Tuberculosis 1 * --
Hepatitis C 2 * ND
DISABILITIES (2000 CENSUS)
NUMBER PERCENT
Blind/Deaf 858 4
Physical 1,616 7.5
Mental 917 4.3
Requires Care 703 3.3
Home-Bound 1,931 11.3
Unable to Work 1,845 12.9
MATERNAL HEALTH
NUMBER PCT 10-YR CHANGE First Trimester Prenatal Care 384 84 +2.2
Smoking 15 3.3§ -65.8†
Caesarean Section 103 22.5 +24.6†
INFANT AND CHILD HEALTH
NUMBER RATE/PCT 10-YR CHANGE Very Low Birthweight (P) 5 1.1§ -43
Premature Birth (P) 35 7.7 +21.5
Fetal Mortality (R) #
Infant Mortality (R) 3 * --
Lead Screening
Screened (P) 1,016 34 ND
Elevated(P) 24 2.4 ND
CANCER DEATHS
NUMBER RATE 10-YR CHANGE All-cancers 41 199.6 -9
Breast 1 * --
Colon 8 * --
Lung 8 * --
Prostate 0 * --
UNNATURAL CAUSES OF DEATH
NUMBER RATE 10-YR CHANGE Accidents 7 * --
Homicide 5 * --
Suicide 3 * --
CHRONIC DISEASE DEATHS
NUMBER RATE 10-YR CHANGE Heart Disease 52 256.5 -24.3†
Stroke 6 * --
Lower Respiratory Disease 5 * --
Diabetes Mellitus 10 * --
Liver Disease and Cirrohosis 0 * --
Alzheimer’s Disease 3 * --
Health Status Index Series Vol XV No II, pg. 113
The reference year for 10-YR CHANGE is 1993. 10-YR CHANGE is the relative percent change over time (e.g. 10% change is from 20 to 22) not the absolute percent change over time (e.g. 10% change is from 20 to 30). See methods section for more detail. Calculation of 10-YR CHANGE using 1993 mortality data are comparability-adjusted.
*Rate or percent suppressed because count is less than 5 (or less than 21 for age-adjusted rates).§Use caution when interpreting data based on 20 or fewer events, the rate/percent is unreliable. See methods for more information.
†Signifi cant difference (0.1 level)ND = No Data, data not collected in 1993 to calculate 10-YR CHANGE.# = 2003 fetal mortality data not available at time of publication.

2000 DEMOGRAPHIC MEASURES POPULATION COMPOSITION
COMMUNITY AREA 53WEST PULLMAN
AGE
NUMBER PERCENT 10-YR CHANGE < 5 2,890 7.9 -1.3
5-17 8,872 24.2 -2.4†
18-24 3,757 10.3 -18.9†
25-64 17,887 48.8 -0.4
65+ 3,243 8.8 +57.1†
All 36,649 -- -8†
RACE/ETHNICITY
NUMBER PERCENT 10-YR CHANGE Hispanic 1,699 4.6 +4.3
Non-Hispanic
Asian 16 0 -54.2†
Black 34,277 93.5 0
White 328 0.9 -49.3†
Other 79 0.2 NA
Multiple 250 0.7 ND
SEX
NUMBER PERCENT 10-YR CHANGE Male 16,950 46.2 -1.5†
Female 19,699 53.8 +1.3†
Females 15-44 8,094 22.1 -15.3†
SOCIO-ECONOMIC INDICES
NUMBER PERCENT 10-YR CHANGE
Median Household Income ($) 40,478 -- NA
Below Poverty Level 7,949 22 +13.7†
Childhood Poverty 3,587 32.1 +21.2†
Housing Vacancies 987 8.5 -9.1†
Same Place of Residence for 5 Years 23,997 71.1 +8†
High School Graduates 14,894 70.4 +0.3
Unemployed 2,079 14 -20.9†
Health Status Index Series Vol XV No II, pg. 114
< 5
5-17
18-24
25-64
65+
0 2 4 6 8 10 12
Age
(yea
rs)
Population (in thousands)
FemaleMale
Hispanic
NH-Asian
NH-Black
NH-White
NH-Other
NH-Multiple
0 5 10 15 20 25 30 35 40
Population (in thousands)
The reference year for 10-YR CHANGE is 1990.10-YR CHANGE is the relative percent change over time (e.g. 10% change is from 20 to 22) not the absolute percent change over time (e.g. 10% change is from 20 to 30). See methods section for more detail.
†Signifi cant difference (0.1 level)ND = No Data, data not collected in 1990 to calculate 10-YR CHANGE.NA = Appropriate data not available to calculate 10-YR CHANGE. Median Household Income is not infl ation-adjusted, 1990 and 2000 defi nitions for Other Race/Ethnicity are not the same.

2003 HEALTH MEASURES COMMUNITY AREA 53WEST PULLMAN
2003 ALL-CAUSE MORTALITY: 337 DEATHS,1,239.5 PER 100,000, 21.3%† DECREASE FROM 1993.2003 BIRTHS: 597 BIRTHS, FERTILITY RATE IS73.8 PER 1000, 15.3%† DECREASE FROM 1993.
INFECTIOUS DISEASE
NUMBER RATE 10-YR CHANGE HIV/AIDS Deaths 7 * --
AIDS Cases (ages 13 and older) 104 369.9 +257.5†
Chlamydia 542 1,478.9 ND
Gonorrhea 349 952.3 ND
Syphilis 12 32.7§ ND
Infl uenza and Pneumonia Deaths 7 * --
Tuberculosis 9 24.6§ -42.3†
Hepatitis C 32 87.3 ND
DISABILITIES (2000 CENSUS)
NUMBER PERCENT
Blind/Deaf 1,026 3
Physical 3,574 10.6
Mental 1,876 5.6
Requires Care 1,389 4.1
Home-Bound 3,810 14.6
Unable to Work 4,238 18.5
MATERNAL HEALTH
NUMBER PCT 10-YR CHANGE First Trimester Prenatal Care 451 75.5 +10.9†
Smoking 77 12.9 +8
Caesarean Section 144 24.1 +55.8†
INFANT AND CHILD HEALTH
NUMBER RATE/PCT 10-YR CHANGE Very Low Birthweight (P) 19 3.2§ +10.7
Premature Birth (P) 72 12.1 -23.2†
Fetal Mortality (R) #
Infant Mortality (R) 5 8.4§ -55.5†
Lead Screening
Screened (P) 1,422 33.7 ND
Elevated(P) 108 7.6 ND
CANCER DEATHS
NUMBER RATE 10-YR CHANGE All-cancers 98 361.1 -4.4
Breast 4 * --
Colon 12 * --
Lung 33 116.8 -4.6
Prostate 8 * --
UNNATURAL CAUSES OF DEATH
NUMBER RATE 10-YR CHANGE Accidents 9 * --
Homicide 20 * --
Suicide 0 * --
CHRONIC DISEASE DEATHS
NUMBER RATE 10-YR CHANGE Heart Disease 91 347.8 -30.1†
Stroke 19 * --
Lower Respiratory Disease 9 * --
Diabetes Mellitus 9 * --
Liver Disease and Cirrohosis 3 * --
Alzheimer’s Disease 3 * --
Health Status Index Series Vol XV No II, pg. 115
The reference year for 10-YR CHANGE is 1993. 10-YR CHANGE is the relative percent change over time (e.g. 10% change is from 20 to 22) not the absolute percent change over time (e.g. 10% change is from 20 to 30). See methods section for more detail. Calculation of 10-YR CHANGE using 1993 mortality data are comparability-adjusted.
*Rate or percent suppressed because count is less than 5 (or less than 21 for age-adjusted rates).§Use caution when interpreting data based on 20 or fewer events, the rate/percent is unreliable. See methods for more information.
†Signifi cant difference (0.1 level)ND = No Data, data not collected in 1993 to calculate 10-YR CHANGE.# = 2003 fetal mortality data not available at time of publication.
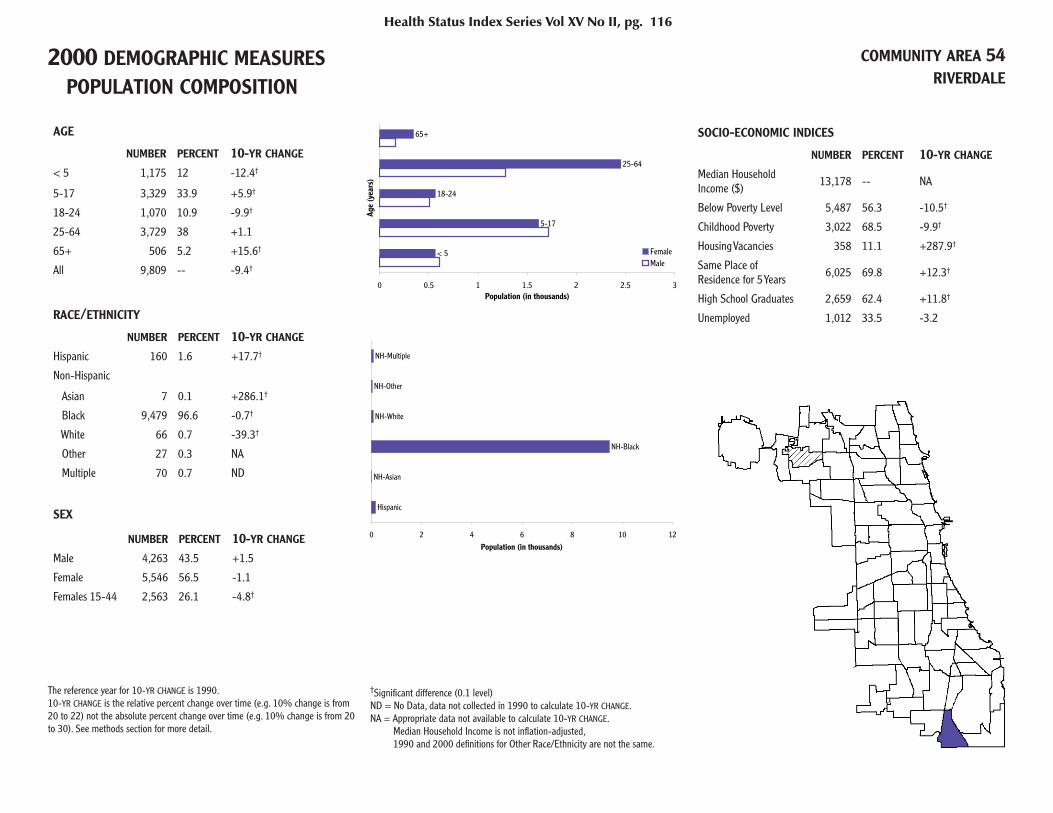
2000 DEMOGRAPHIC MEASURES POPULATION COMPOSITION
COMMUNITY AREA 54RIVERDALE
AGE
NUMBER PERCENT 10-YR CHANGE < 5 1,175 12 -12.4†
5-17 3,329 33.9 +5.9†
18-24 1,070 10.9 -9.9†
25-64 3,729 38 +1.1
65+ 506 5.2 +15.6†
All 9,809 -- -9.4†
RACE/ETHNICITY
NUMBER PERCENT 10-YR CHANGE Hispanic 160 1.6 +17.7†
Non-Hispanic
Asian 7 0.1 +286.1†
Black 9,479 96.6 -0.7†
White 66 0.7 -39.3†
Other 27 0.3 NA
Multiple 70 0.7 ND
SEX
NUMBER PERCENT 10-YR CHANGE Male 4,263 43.5 +1.5
Female 5,546 56.5 -1.1
Females 15-44 2,563 26.1 -4.8†
SOCIO-ECONOMIC INDICES
NUMBER PERCENT 10-YR CHANGE
Median Household Income ($) 13,178 -- NA
Below Poverty Level 5,487 56.3 -10.5†
Childhood Poverty 3,022 68.5 -9.9†
Housing Vacancies 358 11.1 +287.9†
Same Place of Residence for 5 Years 6,025 69.8 +12.3†
High School Graduates 2,659 62.4 +11.8†
Unemployed 1,012 33.5 -3.2
Health Status Index Series Vol XV No II, pg. 116
< 5
5-17
18-24
25-64
65+
0 0.5 1 1.5 2 2.5 3
Age
(yea
rs)
Population (in thousands)
FemaleMale
Hispanic
NH-Asian
NH-Black
NH-White
NH-Other
NH-Multiple
0 2 4 6 8 10 12
Population (in thousands)
The reference year for 10-YR CHANGE is 1990.10-YR CHANGE is the relative percent change over time (e.g. 10% change is from 20 to 22) not the absolute percent change over time (e.g. 10% change is from 20 to 30). See methods section for more detail.
†Signifi cant difference (0.1 level)ND = No Data, data not collected in 1990 to calculate 10-YR CHANGE.NA = Appropriate data not available to calculate 10-YR CHANGE. Median Household Income is not infl ation-adjusted, 1990 and 2000 defi nitions for Other Race/Ethnicity are not the same.

2003 HEALTH MEASURES COMMUNITY AREA 54RIVERDALE
2003 ALL-CAUSE MORTALITY: 49 DEATHS,1,134 PER 100,000, 15.4% DECREASE FROM 1993.2003 BIRTHS: 123 BIRTHS, FERTILITY RATE IS48 PER 1000, 56.2%† DECREASE FROM 1993.
INFECTIOUS DISEASE
NUMBER RATE 10-YR CHANGE HIV/AIDS Deaths 1 * --
AIDS Cases (ages 13 and older) 17 267.0§ +110.1†
Chlamydia 163 1,661.7 ND
Gonorrhea 104 1,060.3 ND
Syphilis < 5 * ND
Infl uenza and Pneumonia Deaths 1 * --
Tuberculosis 1 * --
Hepatitis C 9 91.8§ ND
DISABILITIES (2000 CENSUS)
NUMBER PERCENT
Blind/Deaf 292 3.4
Physical 731 8.5
Mental 511 5.9
Requires Care 333 3.9
Home-Bound 978 17.1
Unable to Work 830 15.9
MATERNAL HEALTH
NUMBER PCT 10-YR CHANGE First Trimester Prenatal Care 81 65.9 +10.3
Smoking 29 23.6 +118.9†
Caesarean Section 21 17.1 +26.1
INFANT AND CHILD HEALTH
NUMBER RATE/PCT 10-YR CHANGE Very Low Birthweight (P) 1 * --
Premature Birth (P) 12 9.8§ -27.9
Fetal Mortality (R) #
Infant Mortality (R) 3 * --
Lead Screening
Screened (P) 63 3.6 ND
Elevated(P) 1 * ND
CANCER DEATHS
NUMBER RATE 10-YR CHANGE All-cancers 6 * --
Breast 0 * --
Colon 1 * --
Lung 1 * --
Prostate 2 * --
UNNATURAL CAUSES OF DEATH
NUMBER RATE 10-YR CHANGE Accidents 5 * --
Homicide 4 * --
Suicide 0 * --
CHRONIC DISEASE DEATHS
NUMBER RATE 10-YR CHANGE Heart Disease 17 * --
Stroke 3 * --
Lower Respiratory Disease 0 * --
Diabetes Mellitus 2 * --
Liver Disease and Cirrohosis 0 * --
Alzheimer’s Disease 0 * --
Health Status Index Series Vol XV No II, pg. 117
The reference year for 10-YR CHANGE is 1993. 10-YR CHANGE is the relative percent change over time (e.g. 10% change is from 20 to 22) not the absolute percent change over time (e.g. 10% change is from 20 to 30). See methods section for more detail. Calculation of 10-YR CHANGE using 1993 mortality data are comparability-adjusted.
*Rate or percent suppressed because count is less than 5 (or less than 21 for age-adjusted rates).§Use caution when interpreting data based on 20 or fewer events, the rate/percent is unreliable. See methods for more information.
†Signifi cant difference (0.1 level)ND = No Data, data not collected in 1993 to calculate 10-YR CHANGE.# = 2003 fetal mortality data not available at time of publication.
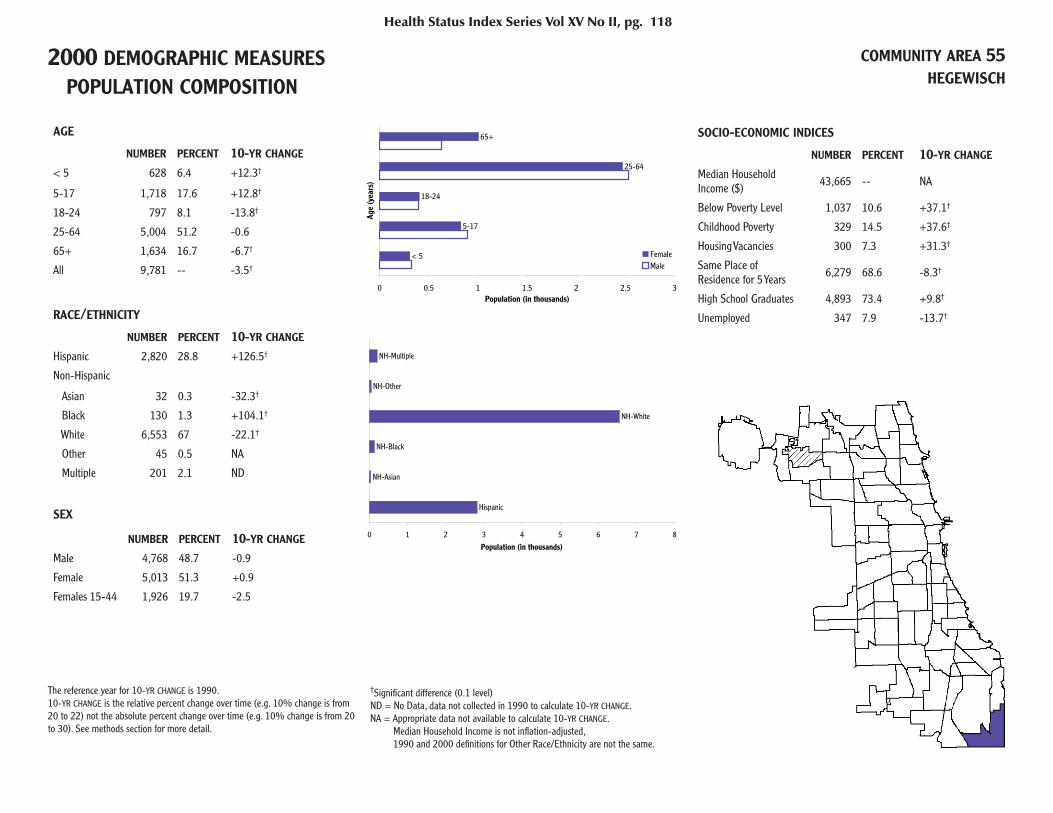
2000 DEMOGRAPHIC MEASURES POPULATION COMPOSITION
COMMUNITY AREA 55HEGEWISCH
AGE
NUMBER PERCENT 10-YR CHANGE < 5 628 6.4 +12.3†
5-17 1,718 17.6 +12.8†
18-24 797 8.1 -13.8†
25-64 5,004 51.2 -0.6
65+ 1,634 16.7 -6.7†
All 9,781 -- -3.5†
RACE/ETHNICITY
NUMBER PERCENT 10-YR CHANGE Hispanic 2,820 28.8 +126.5†
Non-Hispanic
Asian 32 0.3 -32.3†
Black 130 1.3 +104.1†
White 6,553 67 -22.1†
Other 45 0.5 NA
Multiple 201 2.1 ND
SEX
NUMBER PERCENT 10-YR CHANGE Male 4,768 48.7 -0.9
Female 5,013 51.3 +0.9
Females 15-44 1,926 19.7 -2.5
SOCIO-ECONOMIC INDICES
NUMBER PERCENT 10-YR CHANGE
Median Household Income ($) 43,665 -- NA
Below Poverty Level 1,037 10.6 +37.1†
Childhood Poverty 329 14.5 +37.6†
Housing Vacancies 300 7.3 +31.3†
Same Place of Residence for 5 Years 6,279 68.6 -8.3†
High School Graduates 4,893 73.4 +9.8†
Unemployed 347 7.9 -13.7†
Health Status Index Series Vol XV No II, pg. 118
< 5
5-17
18-24
25-64
65+
0 0.5 1 1.5 2 2.5 3
Age
(yea
rs)
Population (in thousands)
FemaleMale
Hispanic
NH-Asian
NH-Black
NH-White
NH-Other
NH-Multiple
0 1 2 3 4 5 6 7 8
Population (in thousands)
The reference year for 10-YR CHANGE is 1990.10-YR CHANGE is the relative percent change over time (e.g. 10% change is from 20 to 22) not the absolute percent change over time (e.g. 10% change is from 20 to 30). See methods section for more detail.
†Signifi cant difference (0.1 level)ND = No Data, data not collected in 1990 to calculate 10-YR CHANGE.NA = Appropriate data not available to calculate 10-YR CHANGE. Median Household Income is not infl ation-adjusted, 1990 and 2000 defi nitions for Other Race/Ethnicity are not the same.

2003 HEALTH MEASURES COMMUNITY AREA 55HEGEWISCH
2003 ALL-CAUSE MORTALITY: 115 DEATHS,983 PER 100,000, 34.2%† DECREASE FROM 1993.2003 BIRTHS: 131 BIRTHS, FERTILITY RATE IS68 PER 1000, 14.2% INCREASE FROM 1993.
INFECTIOUS DISEASE
NUMBER RATE 10-YR CHANGE HIV/AIDS Deaths 0 * --
AIDS Cases (ages 13 and older) <5 * --
Chlamydia 18 184§ ND
Gonorrhea 6 61.3§ ND
Syphilis 0 * ND
Infl uenza and Pneumonia Deaths 0 * --
Tuberculosis 0 * --
Hepatitis C 8 81.8§ ND
DISABILITIES (2000 CENSUS)
NUMBER PERCENT
Blind/Deaf 408 4.5
Physical 873 9.5
Mental 358 3.9
Requires Care 237 2.6
Home-Bound 675 8.8
Unable to Work 760 12.6
MATERNAL HEALTH
NUMBER PCT 10-YR CHANGE First Trimester Prenatal Care 117 89.3 +10.1†
Smoking 15 11.5 -48.3†
Caesarean Section 31 23.7 -3.8
INFANT AND CHILD HEALTH
NUMBER RATE/PCT 10-YR CHANGE Very Low Birthweight (P) 2 * --
Premature Birth (P) 15 11.5§ +249.2†
Fetal Mortality (R) #
Infant Mortality (R) 2 * --
Lead Screening
Screened (P) 196 21.4 ND
Elevated(P) 0 * ND
CANCER DEATHS
NUMBER RATE 10-YR CHANGE All-cancers 35 286.6 -22.5
Breast 2 * --
Colon 3 * --
Lung 10 * --
Prostate 0 * --
UNNATURAL CAUSES OF DEATH
NUMBER RATE 10-YR CHANGE Accidents 3 * --
Homicide 1 * --
Suicide 1 * --
CHRONIC DISEASE DEATHS
NUMBER RATE 10-YR CHANGE Heart Disease 32 267.7 -45.9†
Stroke 4 * --
Lower Respiratory Disease 3 * --
Diabetes Mellitus 1 * --
Liver Disease and Cirrohosis 1 * --
Alzheimer’s Disease 1 * --
Health Status Index Series Vol XV No II, pg. 119
The reference year for 10-YR CHANGE is 1993. 10-YR CHANGE is the relative percent change over time (e.g. 10% change is from 20 to 22) not the absolute percent change over time (e.g. 10% change is from 20 to 30). See methods section for more detail. Calculation of 10-YR CHANGE using 1993 mortality data are comparability-adjusted.
*Rate or percent suppressed because count is less than 5 (or less than 21 for age-adjusted rates).§Use caution when interpreting data based on 20 or fewer events, the rate/percent is unreliable. See methods for more information.
†Signifi cant difference (0.1 level)ND = No Data, data not collected in 1993 to calculate 10-YR CHANGE.# = 2003 fetal mortality data not available at time of publication.
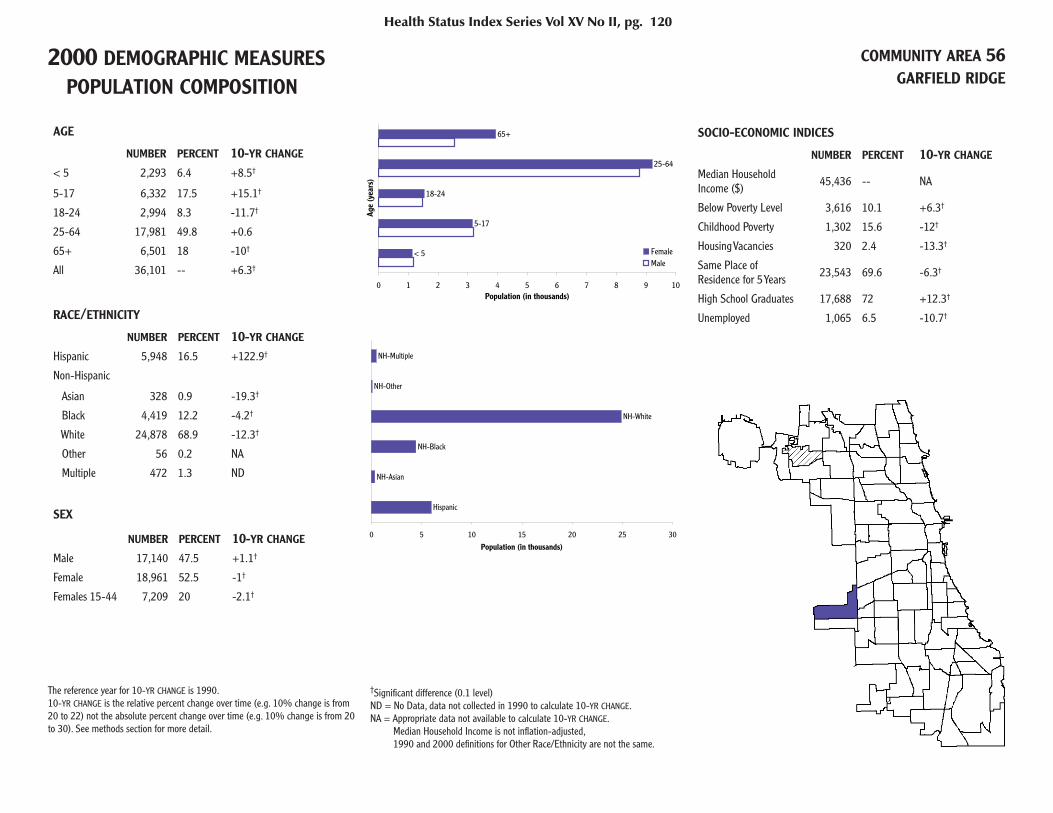
2000 DEMOGRAPHIC MEASURES POPULATION COMPOSITION
COMMUNITY AREA 56GARFIELD RIDGE
AGE
NUMBER PERCENT 10-YR CHANGE < 5 2,293 6.4 +8.5†
5-17 6,332 17.5 +15.1†
18-24 2,994 8.3 -11.7†
25-64 17,981 49.8 +0.6
65+ 6,501 18 -10†
All 36,101 -- +6.3†
RACE/ETHNICITY
NUMBER PERCENT 10-YR CHANGE Hispanic 5,948 16.5 +122.9†
Non-Hispanic
Asian 328 0.9 -19.3†
Black 4,419 12.2 -4.2†
White 24,878 68.9 -12.3†
Other 56 0.2 NA
Multiple 472 1.3 ND
SEX
NUMBER PERCENT 10-YR CHANGE Male 17,140 47.5 +1.1†
Female 18,961 52.5 -1†
Females 15-44 7,209 20 -2.1†
SOCIO-ECONOMIC INDICES
NUMBER PERCENT 10-YR CHANGE
Median Household Income ($) 45,436 -- NA
Below Poverty Level 3,616 10.1 +6.3†
Childhood Poverty 1,302 15.6 -12†
Housing Vacancies 320 2.4 -13.3†
Same Place of Residence for 5 Years 23,543 69.6 -6.3†
High School Graduates 17,688 72 +12.3†
Unemployed 1,065 6.5 -10.7†
Health Status Index Series Vol XV No II, pg. 120
< 5
5-17
18-24
25-64
65+
0 1 2 3 4 5 6 7 8 9 10
Age
(yea
rs)
Population (in thousands)
FemaleMale
Hispanic
NH-Asian
NH-Black
NH-White
NH-Other
NH-Multiple
0 5 10 15 20 25 30
Population (in thousands)
The reference year for 10-YR CHANGE is 1990.10-YR CHANGE is the relative percent change over time (e.g. 10% change is from 20 to 22) not the absolute percent change over time (e.g. 10% change is from 20 to 30). See methods section for more detail.
†Signifi cant difference (0.1 level)ND = No Data, data not collected in 1990 to calculate 10-YR CHANGE.NA = Appropriate data not available to calculate 10-YR CHANGE. Median Household Income is not infl ation-adjusted, 1990 and 2000 defi nitions for Other Race/Ethnicity are not the same.

2003 HEALTH MEASURES COMMUNITY AREA 56GARFIELD RIDGE
2003 ALL-CAUSE MORTALITY: 390 DEATHS,867 PER 100,000, 21.5%† DECREASE FROM 1993.2003 BIRTHS: 504 BIRTHS, FERTILITY RATE IS69.9 PER 1000, 8.2% INCREASE FROM 1993.
INFECTIOUS DISEASE
NUMBER RATE 10-YR CHANGE HIV/AIDS Deaths 2 * --
AIDS Cases (ages 13 and older) 21 70.4 +153.1†
Chlamydia 104 288.1 ND
Gonorrhea 43 119.1 ND
Syphilis 6 16.6§ ND
Infl uenza and Pneumonia Deaths 13 * --
Tuberculosis 1 * --
Hepatitis C 14 38.8§ ND
DISABILITIES (2000 CENSUS)
NUMBER PERCENT
Blind/Deaf 1,468 4.3
Physical 3,079 9.1
Mental 1,515 4.5
Requires Care 1,153 3.4
Home-Bound 3,114 10.9
Unable to Work 2,606 11.9
MATERNAL HEALTH
NUMBER PCT 10-YR CHANGE First Trimester Prenatal Care 413 81.9 +2.6
Smoking 36 7.1 -40.9†
Caesarean Section 138 27.4 +47.5†
INFANT AND CHILD HEALTH
NUMBER RATE/PCT 10-YR CHANGE Very Low Birthweight (P) 11 2.2§ +39.4
Premature Birth (P) 58 11.5 +25.5
Fetal Mortality (R) #
Infant Mortality (R) 8 15.9§ +18.3
Lead Screening
Screened (P) 607 18.5 ND
Elevated(P) 6 1§ ND
CANCER DEATHS
NUMBER RATE 10-YR CHANGE All-cancers 86 190.8 -31.2†
Breast 2 * --
Colon 8 * --
Lung 22 48 -1.2
Prostate 5 * --
UNNATURAL CAUSES OF DEATH
NUMBER RATE 10-YR CHANGE Accidents 9 * --
Homicide 4 * --
Suicide 4 * --
CHRONIC DISEASE DEATHS
NUMBER RATE 10-YR CHANGE Heart Disease 133 284.6 -23.9†
Stroke 13 * --
Lower Respiratory Disease 17 * --
Diabetes Mellitus 18 * --
Liver Disease and Cirrohosis 6 * --
Alzheimer’s Disease 8 * --
Health Status Index Series Vol XV No II, pg. 121
The reference year for 10-YR CHANGE is 1993. 10-YR CHANGE is the relative percent change over time (e.g. 10% change is from 20 to 22) not the absolute percent change over time (e.g. 10% change is from 20 to 30). See methods section for more detail. Calculation of 10-YR CHANGE using 1993 mortality data are comparability-adjusted.
*Rate or percent suppressed because count is less than 5 (or less than 21 for age-adjusted rates).§Use caution when interpreting data based on 20 or fewer events, the rate/percent is unreliable. See methods for more information.
†Signifi cant difference (0.1 level)ND = No Data, data not collected in 1993 to calculate 10-YR CHANGE.# = 2003 fetal mortality data not available at time of publication.
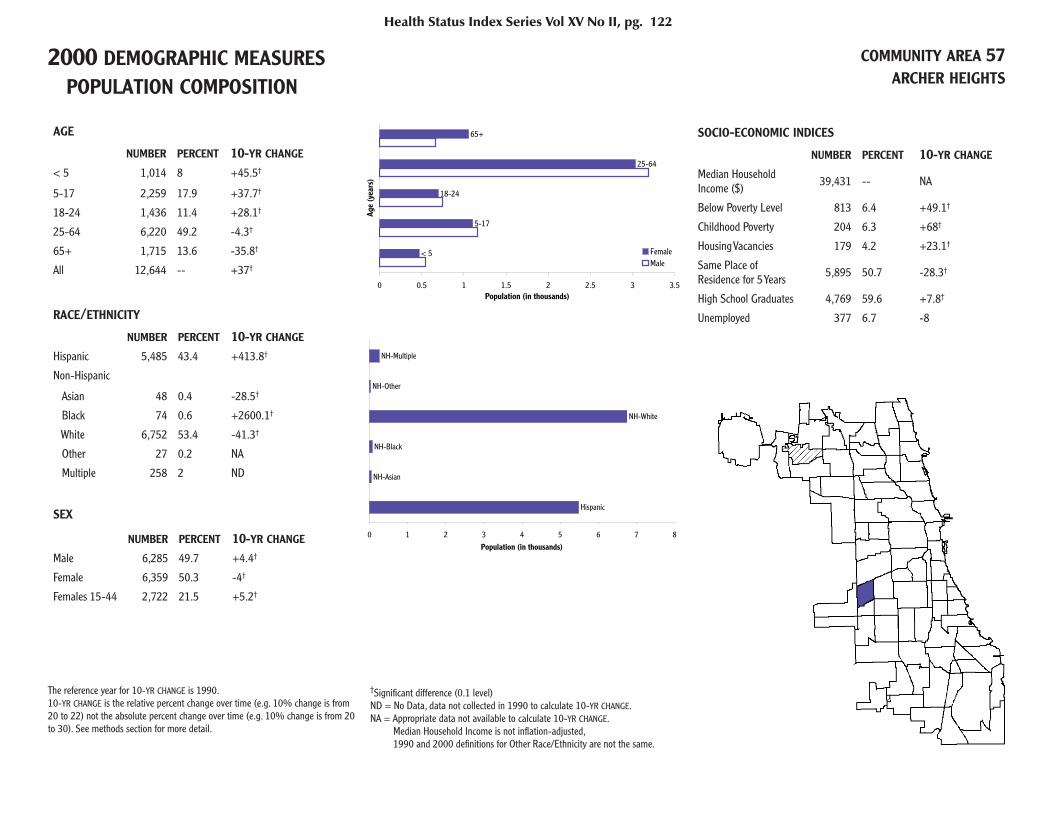
2000 DEMOGRAPHIC MEASURES POPULATION COMPOSITION
COMMUNITY AREA 57ARCHER HEIGHTS
AGE
NUMBER PERCENT 10-YR CHANGE < 5 1,014 8 +45.5†
5-17 2,259 17.9 +37.7†
18-24 1,436 11.4 +28.1†
25-64 6,220 49.2 -4.3†
65+ 1,715 13.6 -35.8†
All 12,644 -- +37†
RACE/ETHNICITY
NUMBER PERCENT 10-YR CHANGE Hispanic 5,485 43.4 +413.8†
Non-Hispanic
Asian 48 0.4 -28.5†
Black 74 0.6 +2600.1†
White 6,752 53.4 -41.3†
Other 27 0.2 NA
Multiple 258 2 ND
SEX
NUMBER PERCENT 10-YR CHANGE Male 6,285 49.7 +4.4†
Female 6,359 50.3 -4†
Females 15-44 2,722 21.5 +5.2†
SOCIO-ECONOMIC INDICES
NUMBER PERCENT 10-YR CHANGE
Median Household Income ($) 39,431 -- NA
Below Poverty Level 813 6.4 +49.1†
Childhood Poverty 204 6.3 +68†
Housing Vacancies 179 4.2 +23.1†
Same Place of Residence for 5 Years 5,895 50.7 -28.3†
High School Graduates 4,769 59.6 +7.8†
Unemployed 377 6.7 -8
Health Status Index Series Vol XV No II, pg. 122
< 5
5-17
18-24
25-64
65+
0 0.5 1 1.5 2 2.5 3 3.5
Age
(yea
rs)
Population (in thousands)
FemaleMale
Hispanic
NH-Asian
NH-Black
NH-White
NH-Other
NH-Multiple
0 1 2 3 4 5 6 7 8
Population (in thousands)
The reference year for 10-YR CHANGE is 1990.10-YR CHANGE is the relative percent change over time (e.g. 10% change is from 20 to 22) not the absolute percent change over time (e.g. 10% change is from 20 to 30). See methods section for more detail.
†Signifi cant difference (0.1 level)ND = No Data, data not collected in 1990 to calculate 10-YR CHANGE.NA = Appropriate data not available to calculate 10-YR CHANGE. Median Household Income is not infl ation-adjusted, 1990 and 2000 defi nitions for Other Race/Ethnicity are not the same.

2003 HEALTH MEASURES COMMUNITY AREA 57ARCHER HEIGHTS
2003 ALL-CAUSE MORTALITY: 95 DEATHS,754.8 PER 100,000, 28.8%† DECREASE FROM 1993.2003 BIRTHS: 262 BIRTHS, FERTILITY RATE IS96.3 PER 1000, 15.4%† DECREASE FROM 1993.
INFECTIOUS DISEASE
NUMBER RATE 10-YR CHANGE HIV/AIDS Deaths 0 * --
AIDS Cases (ages 13 and older) <5 * --
Chlamydia 27 213.5 ND
Gonorrhea < 5 * ND
Syphilis 0 * ND
Infl uenza and Pneumonia Deaths 4 * --
Tuberculosis 0 * --
Hepatitis C 1 * ND
DISABILITIES (2000 CENSUS)
NUMBER PERCENT
Blind/Deaf 351 3
Physical 935 8
Mental 417 3.6
Requires Care 307 2.6
Home-Bound 1,376 14.1
Unable to Work 1,249 15.6
MATERNAL HEALTH
NUMBER PCT 10-YR CHANGE First Trimester Prenatal Care 227 86.6 +16.4†
Smoking 7 2.7§ -77.9†
Caesarean Section 58 22.1 -10.2
INFANT AND CHILD HEALTH
NUMBER RATE/PCT 10-YR CHANGE Very Low Birthweight (P) 3 * --
Premature Birth (P) 17 6.5§ +39.5
Fetal Mortality (R) #
Infant Mortality (R) 2 * --
Lead Screening
Screened (P) 485 34.6 ND
Elevated(P) 8 1.6§ ND
CANCER DEATHS
NUMBER RATE 10-YR CHANGE All-cancers 16 * --
Breast 2 * --
Colon 2 * --
Lung 3 * --
Prostate 0 * --
UNNATURAL CAUSES OF DEATH
NUMBER RATE 10-YR CHANGE Accidents 1 * --
Homicide 4 * --
Suicide 2 * --
CHRONIC DISEASE DEATHS
NUMBER RATE 10-YR CHANGE Heart Disease 33 264.4 -42.1†
Stroke 7 * --
Lower Respiratory Disease 4 * --
Diabetes Mellitus 2 * --
Liver Disease and Cirrohosis 3 * --
Alzheimer’s Disease 0 * --
Health Status Index Series Vol XV No II, pg. 123
The reference year for 10-YR CHANGE is 1993. 10-YR CHANGE is the relative percent change over time (e.g. 10% change is from 20 to 22) not the absolute percent change over time (e.g. 10% change is from 20 to 30). See methods section for more detail. Calculation of 10-YR CHANGE using 1993 mortality data are comparability-adjusted.
*Rate or percent suppressed because count is less than 5 (or less than 21 for age-adjusted rates).§Use caution when interpreting data based on 20 or fewer events, the rate/percent is unreliable. See methods for more information.
†Signifi cant difference (0.1 level)ND = No Data, data not collected in 1993 to calculate 10-YR CHANGE.# = 2003 fetal mortality data not available at time of publication.

2000 DEMOGRAPHIC MEASURES POPULATION COMPOSITION
COMMUNITY AREA 58BRIGHTON PARK
AGE
NUMBER PERCENT 10-YR CHANGE < 5 4,898 10.9 +34.6†
5-17 10,286 22.9 +25.1†
18-24 5,761 12.8 +19.6†
25-64 20,602 45.9 -4.4†
65+ 3,365 7.5 -50†
All 44,912 -- +39.4†
RACE/ETHNICITY
NUMBER PERCENT 10-YR CHANGE Hispanic 34,409 76.6 +104.9†
Non-Hispanic
Asian 1,288 2.9 +51.2†
Black 221 0.5 +832.2†
White 8,300 18.5 -69.4†
Other 98 0.2 NA
Multiple 596 1.3 ND
SEX
NUMBER PERCENT 10-YR CHANGE Male 23,125 51.5 +4.8†
Female 21,787 48.5 -4.7†
Females 15-44 10,259 22.8 +5.1†
SOCIO-ECONOMIC INDICES
NUMBER PERCENT 10-YR CHANGE
Median Household Income ($) 36,245 -- NA
Below Poverty Level 7,721 17.3 +36.9†
Childhood Poverty 3,171 21.3 +14.1†
Housing Vacancies 921 6.9 +21.9†
Same Place of Residence for 5 Years 20,784 51.9 -8†
High School Graduates 11,325 47.4 -11.1†
Unemployed 2,024 11.5 +32†
Health Status Index Series Vol XV No II, pg. 124
< 5
5-17
18-24
25-64
65+
0 2 4 6 8 10 12
Age
(yea
rs)
Population (in thousands)
FemaleMale
Hispanic
NH-Asian
NH-Black
NH-White
NH-Other
NH-Multiple
0 5 10 15 20 25 30 35 40
Population (in thousands)
The reference year for 10-YR CHANGE is 1990.10-YR CHANGE is the relative percent change over time (e.g. 10% change is from 20 to 22) not the absolute percent change over time (e.g. 10% change is from 20 to 30). See methods section for more detail.
†Signifi cant difference (0.1 level)ND = No Data, data not collected in 1990 to calculate 10-YR CHANGE.NA = Appropriate data not available to calculate 10-YR CHANGE. Median Household Income is not infl ation-adjusted, 1990 and 2000 defi nitions for Other Race/Ethnicity are not the same.

2003 HEALTH MEASURES COMMUNITY AREA 58BRIGHTON PARK
2003 ALL-CAUSE MORTALITY: 209 DEATHS,719 PER 100,000, 39.1%† DECREASE FROM 1993.2003 BIRTHS: 1,152 BIRTHS, FERTILITY RATE IS112.3 PER 1000, 1.2% DECREASE FROM 1993.
INFECTIOUS DISEASE
NUMBER RATE 10-YR CHANGE HIV/AIDS Deaths 1 * --
AIDS Cases (ages 13 and older) 43 129.2 +232.5†
Chlamydia 199 443.1 ND
Gonorrhea 17 37.9§ ND
Syphilis 0 * ND
Infl uenza and Pneumonia Deaths 10 * --
Tuberculosis 5 11.1§ -48.9
Hepatitis C 11 24.5§ ND
DISABILITIES (2000 CENSUS)
NUMBER PERCENT
Blind/Deaf 1,348 3.4
Physical 2,366 5.9
Mental 1,520 3.8
Requires Care 1,132 2.8
Home-Bound 4,829 15.5
Unable to Work 4,817 17.3
MATERNAL HEALTH
NUMBER PCT 10-YR CHANGE First Trimester Prenatal Care 941 81.7 +5.7†
Smoking 21 1.8 -77.7†
Caesarean Section 230 20 +17.7†
INFANT AND CHILD HEALTH
NUMBER RATE/PCT 10-YR CHANGE Very Low Birthweight (P) 14 1.2§ +38.2
Premature Birth (P) 102 8.9 +25.9†
Fetal Mortality (R) #
Infant Mortality (R) 5 4.3§ -50.6
Lead Screening
Screened (P) 2,952 43.6 ND
Elevated(P) 107 3.6 ND
CANCER DEATHS
NUMBER RATE 10-YR CHANGE All-cancers 34 119.7 -60†
Breast 3 * --
Colon 1 * --
Lung 7 * --
Prostate 1 * --
UNNATURAL CAUSES OF DEATH
NUMBER RATE 10-YR CHANGE Accidents 11 * --
Homicide 6 * --
Suicide 2 * --
CHRONIC DISEASE DEATHS
NUMBER RATE 10-YR CHANGE Heart Disease 74 274.5 -35.6†
Stroke 5 * --
Lower Respiratory Disease 4 * --
Diabetes Mellitus 9 * --
Liver Disease and Cirrohosis 4 * --
Alzheimer’s Disease 8 * --
Health Status Index Series Vol XV No II, pg. 125
The reference year for 10-YR CHANGE is 1993. 10-YR CHANGE is the relative percent change over time (e.g. 10% change is from 20 to 22) not the absolute percent change over time (e.g. 10% change is from 20 to 30). See methods section for more detail. Calculation of 10-YR CHANGE using 1993 mortality data are comparability-adjusted.
*Rate or percent suppressed because count is less than 5 (or less than 21 for age-adjusted rates).§Use caution when interpreting data based on 20 or fewer events, the rate/percent is unreliable. See methods for more information.
†Signifi cant difference (0.1 level)ND = No Data, data not collected in 1993 to calculate 10-YR CHANGE.# = 2003 fetal mortality data not available at time of publication.
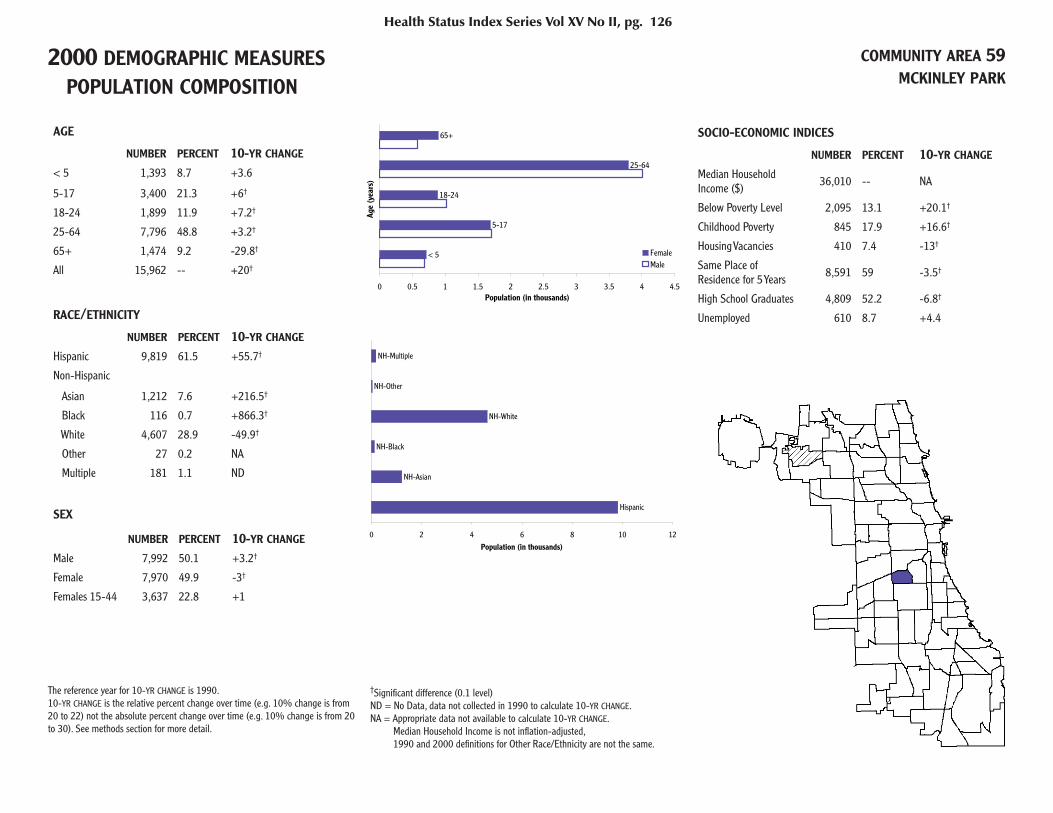
2000 DEMOGRAPHIC MEASURES POPULATION COMPOSITION
COMMUNITY AREA 59MCKINLEY PARK
AGE
NUMBER PERCENT 10-YR CHANGE < 5 1,393 8.7 +3.6
5-17 3,400 21.3 +6†
18-24 1,899 11.9 +7.2†
25-64 7,796 48.8 +3.2†
65+ 1,474 9.2 -29.8†
All 15,962 -- +20†
RACE/ETHNICITY
NUMBER PERCENT 10-YR CHANGE Hispanic 9,819 61.5 +55.7†
Non-Hispanic
Asian 1,212 7.6 +216.5†
Black 116 0.7 +866.3†
White 4,607 28.9 -49.9†
Other 27 0.2 NA
Multiple 181 1.1 ND
SEX
NUMBER PERCENT 10-YR CHANGE Male 7,992 50.1 +3.2†
Female 7,970 49.9 -3†
Females 15-44 3,637 22.8 +1
SOCIO-ECONOMIC INDICES
NUMBER PERCENT 10-YR CHANGE
Median Household Income ($) 36,010 -- NA
Below Poverty Level 2,095 13.1 +20.1†
Childhood Poverty 845 17.9 +16.6†
Housing Vacancies 410 7.4 -13†
Same Place of Residence for 5 Years 8,591 59 -3.5†
High School Graduates 4,809 52.2 -6.8†
Unemployed 610 8.7 +4.4
Health Status Index Series Vol XV No II, pg. 126
< 5
5-17
18-24
25-64
65+
0 0.5 1 1.5 2 2.5 3 3.5 4 4.5
Age
(yea
rs)
Population (in thousands)
FemaleMale
Hispanic
NH-Asian
NH-Black
NH-White
NH-Other
NH-Multiple
0 2 4 6 8 10 12
Population (in thousands)
The reference year for 10-YR CHANGE is 1990.10-YR CHANGE is the relative percent change over time (e.g. 10% change is from 20 to 22) not the absolute percent change over time (e.g. 10% change is from 20 to 30). See methods section for more detail.
†Signifi cant difference (0.1 level)ND = No Data, data not collected in 1990 to calculate 10-YR CHANGE.NA = Appropriate data not available to calculate 10-YR CHANGE. Median Household Income is not infl ation-adjusted, 1990 and 2000 defi nitions for Other Race/Ethnicity are not the same.

2003 HEALTH MEASURES COMMUNITY AREA 59MCKINLEY PARK
2003 ALL-CAUSE MORTALITY: 92 DEATHS,807.8 PER 100,000, 23.8%† DECREASE FROM 1993.2003 BIRTHS: 288 BIRTHS, FERTILITY RATE IS79.2 PER 1000, 8.3% DECREASE FROM 1993.
INFECTIOUS DISEASE
NUMBER RATE 10-YR CHANGE HIV/AIDS Deaths 1 * --
AIDS Cases (ages 13 and older) 12 97§ --
Chlamydia 44 275.7 ND
Gonorrhea 7 43.9§ ND
Syphilis < 5 * ND
Infl uenza and Pneumonia Deaths 3 * --
Tuberculosis 1 * --
Hepatitis C 1 * ND
DISABILITIES (2000 CENSUS)
NUMBER PERCENT
Blind/Deaf 470 3.2
Physical 1,089 7.5
Mental 550 3.8
Requires Care 797 5.5
Home-Bound 2,020 17.3
Unable to Work 2,126 20.9
MATERNAL HEALTH
NUMBER PCT 10-YR CHANGE First Trimester Prenatal Care 219 76 -1
Smoking 9 3.1§ -63.2†
Caesarean Section 58 20.1 +33.7†
INFANT AND CHILD HEALTH
NUMBER RATE/PCT 10-YR CHANGE Very Low Birthweight (P) 0 * --
Premature Birth (P) 24 8.3 -13.7
Fetal Mortality (R)
Infant Mortality (R) 0 * --
Lead Screening
Screened (P) 689 34.8 ND
Elevated(P) 11 1.6§ ND
CANCER DEATHS
NUMBER RATE 10-YR CHANGE All-cancers 21 172.1 +2.3
Breast 1 * --
Colon 3 * --
Lung 8 * --
Prostate 1 * --
UNNATURAL CAUSES OF DEATH
NUMBER RATE 10-YR CHANGE Accidents 2 * --
Homicide 0 * --
Suicide 0 * --
CHRONIC DISEASE DEATHS
NUMBER RATE 10-YR CHANGE Heart Disease 33 304.8 -19.2
Stroke 6 * --
Lower Respiratory Disease 1 * --
Diabetes Mellitus 7 * --
Liver Disease and Cirrohosis 3 * --
Alzheimer’s Disease 0 * --
Health Status Index Series Vol XV No II, pg. 127
The reference year for 10-YR CHANGE is 1993. 10-YR CHANGE is the relative percent change over time (e.g. 10% change is from 20 to 22) not the absolute percent change over time (e.g. 10% change is from 20 to 30). See methods section for more detail. Calculation of 10-YR CHANGE using 1993 mortality data are comparability-adjusted.
*Rate or percent suppressed because count is less than 5 (or less than 21 for age-adjusted rates).§Use caution when interpreting data based on 20 or fewer events, the rate/percent is unreliable. See methods for more information.
†Signifi cant difference (0.1 level)ND = No Data, data not collected in 1993 to calculate 10-YR CHANGE.# = 2003 fetal mortality data not available at time of publication.
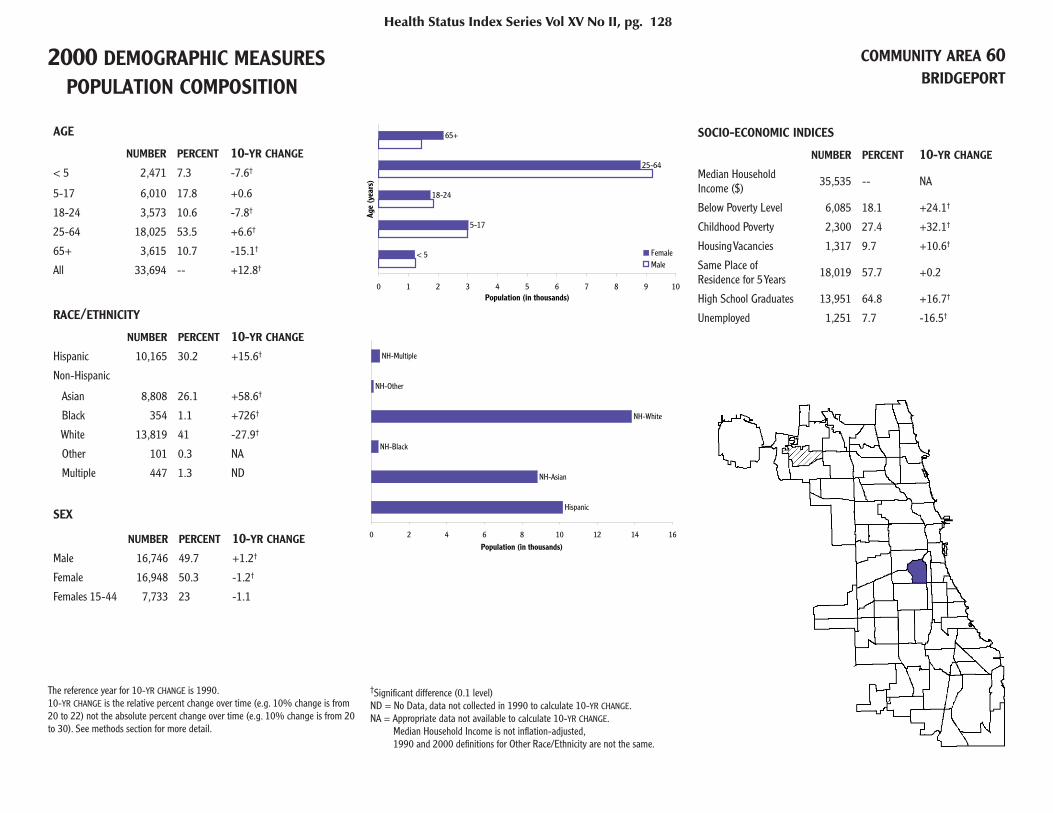
2000 DEMOGRAPHIC MEASURES POPULATION COMPOSITION
COMMUNITY AREA 60BRIDGEPORT
AGE
NUMBER PERCENT 10-YR CHANGE < 5 2,471 7.3 -7.6†
5-17 6,010 17.8 +0.6
18-24 3,573 10.6 -7.8†
25-64 18,025 53.5 +6.6†
65+ 3,615 10.7 -15.1†
All 33,694 -- +12.8†
RACE/ETHNICITY
NUMBER PERCENT 10-YR CHANGE Hispanic 10,165 30.2 +15.6†
Non-Hispanic
Asian 8,808 26.1 +58.6†
Black 354 1.1 +726†
White 13,819 41 -27.9†
Other 101 0.3 NA
Multiple 447 1.3 ND
SEX
NUMBER PERCENT 10-YR CHANGE Male 16,746 49.7 +1.2†
Female 16,948 50.3 -1.2†
Females 15-44 7,733 23 -1.1
SOCIO-ECONOMIC INDICES
NUMBER PERCENT 10-YR CHANGE
Median Household Income ($) 35,535 -- NA
Below Poverty Level 6,085 18.1 +24.1†
Childhood Poverty 2,300 27.4 +32.1†
Housing Vacancies 1,317 9.7 +10.6†
Same Place of Residence for 5 Years 18,019 57.7 +0.2
High School Graduates 13,951 64.8 +16.7†
Unemployed 1,251 7.7 -16.5†
Health Status Index Series Vol XV No II, pg. 128
< 5
5-17
18-24
25-64
65+
0 1 2 3 4 5 6 7 8 9 10
Age
(yea
rs)
Population (in thousands)
FemaleMale
Hispanic
NH-Asian
NH-Black
NH-White
NH-Other
NH-Multiple
0 2 4 6 8 10 12 14 16
Population (in thousands)
The reference year for 10-YR CHANGE is 1990.10-YR CHANGE is the relative percent change over time (e.g. 10% change is from 20 to 22) not the absolute percent change over time (e.g. 10% change is from 20 to 30). See methods section for more detail.
†Signifi cant difference (0.1 level)ND = No Data, data not collected in 1990 to calculate 10-YR CHANGE.NA = Appropriate data not available to calculate 10-YR CHANGE. Median Household Income is not infl ation-adjusted, 1990 and 2000 defi nitions for Other Race/Ethnicity are not the same.

2003 HEALTH MEASURES COMMUNITY AREA 60BRIDGEPORT
2003 ALL-CAUSE MORTALITY: 211 DEATHS,769 PER 100,000, 23%† DECREASE FROM 1993.2003 BIRTHS: 428 BIRTHS, FERTILITY RATE IS55.3 PER 1000, 35.2%† DECREASE FROM 1993.
INFECTIOUS DISEASE
NUMBER RATE 10-YR CHANGE HIV/AIDS Deaths 1 * --
AIDS Cases (ages 13 and older) 35 128.7 +183.4†
Chlamydia 61 181 ND
Gonorrhea 19 56.4§ ND
Syphilis < 5 * ND
Infl uenza and Pneumonia Deaths 6 * --
Tuberculosis 4 * --
Hepatitis C 12 35.6§ ND
DISABILITIES (2000 CENSUS)
NUMBER PERCENT
Blind/Deaf 967 3.1
Physical 2,354 7.5
Mental 1,223 3.9
Requires Care 914 2.9
Home-Bound 3,162 12.2
Unable to Work 3,293 14.7
MATERNAL HEALTH
NUMBER PCT 10-YR CHANGE First Trimester Prenatal Care 358 83.6 +4†
Smoking 18 4.2§ -75.4†
Caesarean Section 101 23.6 +20.4†
INFANT AND CHILD HEALTH
NUMBER RATE/PCT 10-YR CHANGE Very Low Birthweight (P) 2 * --
Premature Birth (P) 47 11 +4.9
Fetal Mortality (R) #
Infant Mortality (R) 1 * --
Lead Screening
Screened (P) 660 18.8 ND
Elevated(P) 10 1.5§ ND
CANCER DEATHS
NUMBER RATE 10-YR CHANGE All-cancers 59 208 -12.4
Breast 5 * --
Colon 5 * --
Lung 18 * --
Prostate 0 * --
UNNATURAL CAUSES OF DEATH
NUMBER RATE 10-YR CHANGE Accidents 11 * --
Homicide 2 * --
Suicide 2 * --
CHRONIC DISEASE DEATHS
NUMBER RATE 10-YR CHANGE Heart Disease 64 234.6 -37†
Stroke 14 * --
Lower Respiratory Disease 7 * --
Diabetes Mellitus 6 * --
Liver Disease and Cirrohosis 3 * --
Alzheimer’s Disease 3 * --
Health Status Index Series Vol XV No II, pg. 129
The reference year for 10-YR CHANGE is 1993. 10-YR CHANGE is the relative percent change over time (e.g. 10% change is from 20 to 22) not the absolute percent change over time (e.g. 10% change is from 20 to 30). See methods section for more detail. Calculation of 10-YR CHANGE using 1993 mortality data are comparability-adjusted.
*Rate or percent suppressed because count is less than 5 (or less than 21 for age-adjusted rates).§Use caution when interpreting data based on 20 or fewer events, the rate/percent is unreliable. See methods for more information.
†Signifi cant difference (0.1 level)ND = No Data, data not collected in 1993 to calculate 10-YR CHANGE.# = 2003 fetal mortality data not available at time of publication.
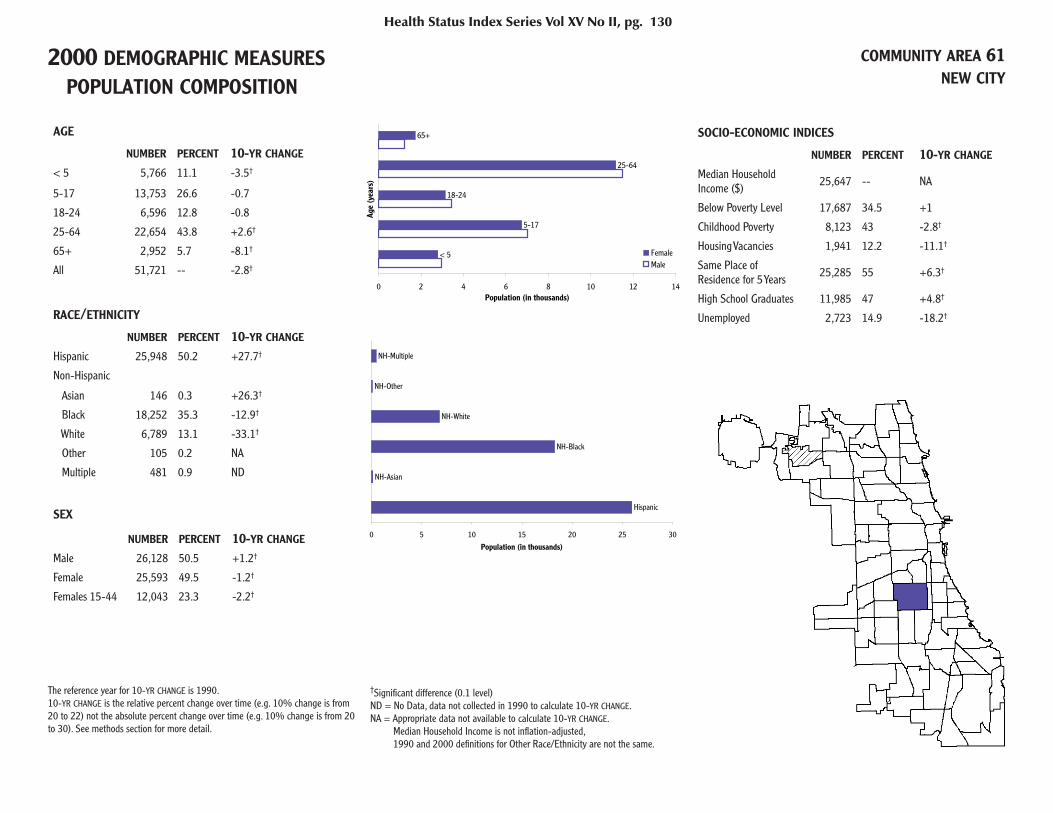
2000 DEMOGRAPHIC MEASURES POPULATION COMPOSITION
COMMUNITY AREA 61NEW CITY
AGE
NUMBER PERCENT 10-YR CHANGE < 5 5,766 11.1 -3.5†
5-17 13,753 26.6 -0.7
18-24 6,596 12.8 -0.8
25-64 22,654 43.8 +2.6†
65+ 2,952 5.7 -8.1†
All 51,721 -- -2.8†
RACE/ETHNICITY
NUMBER PERCENT 10-YR CHANGE Hispanic 25,948 50.2 +27.7†
Non-Hispanic
Asian 146 0.3 +26.3†
Black 18,252 35.3 -12.9†
White 6,789 13.1 -33.1†
Other 105 0.2 NA
Multiple 481 0.9 ND
SEX
NUMBER PERCENT 10-YR CHANGE Male 26,128 50.5 +1.2†
Female 25,593 49.5 -1.2†
Females 15-44 12,043 23.3 -2.2†
SOCIO-ECONOMIC INDICES
NUMBER PERCENT 10-YR CHANGE
Median Household Income ($) 25,647 -- NA
Below Poverty Level 17,687 34.5 +1
Childhood Poverty 8,123 43 -2.8†
Housing Vacancies 1,941 12.2 -11.1†
Same Place of Residence for 5 Years 25,285 55 +6.3†
High School Graduates 11,985 47 +4.8†
Unemployed 2,723 14.9 -18.2†
Health Status Index Series Vol XV No II, pg. 130
< 5
5-17
18-24
25-64
65+
0 2 4 6 8 10 12 14
Age
(yea
rs)
Population (in thousands)
FemaleMale
Hispanic
NH-Asian
NH-Black
NH-White
NH-Other
NH-Multiple
0 5 10 15 20 25 30
Population (in thousands)
The reference year for 10-YR CHANGE is 1990.10-YR CHANGE is the relative percent change over time (e.g. 10% change is from 20 to 22) not the absolute percent change over time (e.g. 10% change is from 20 to 30). See methods section for more detail.
†Signifi cant difference (0.1 level)ND = No Data, data not collected in 1990 to calculate 10-YR CHANGE.NA = Appropriate data not available to calculate 10-YR CHANGE. Median Household Income is not infl ation-adjusted, 1990 and 2000 defi nitions for Other Race/Ethnicity are not the same.

2003 HEALTH MEASURES COMMUNITY AREA 61NEW CITY
2003 ALL-CAUSE MORTALITY: 292 DEATHS,1,047.5 PER 100,000, 31%† DECREASE FROM 1993.2003 BIRTHS: 1,167 BIRTHS, FERTILITY RATE IS96.9 PER 1000, 25.5%† DECREASE FROM 1993.
INFECTIOUS DISEASE
NUMBER RATE 10-YR CHANGE HIV/AIDS Deaths 3 * --
AIDS Cases (ages 13 and older) 115 311.4 +152.6†
Chlamydia 528 1,020.9 ND
Gonorrhea 273 527.8 ND
Syphilis < 5 * ND
Infl uenza and Pneumonia Deaths 6 * --
Tuberculosis 7 13.5§ -73.4†
Hepatitis C 27 52.2 ND
DISABILITIES (2000 CENSUS)
NUMBER PERCENT
Blind/Deaf 1,746 3.8
Physical 3,475 7.6
Mental 2,584 5.6
Requires Care 1,551 3.4
Home-Bound 6,066 17.8
Unable to Work 6,571 21.1
MATERNAL HEALTH
NUMBER PCT 10-YR CHANGE First Trimester Prenatal Care 894 76.6 +17.6†
Smoking 91 7.8 -44.2†
Caesarean Section 240 20.6 +17.2†
INFANT AND CHILD HEALTH
NUMBER RATE/PCT 10-YR CHANGE Very Low Birthweight (P) 23 2 -4.5
Premature Birth (P) 128 11 -11.4
Fetal Mortality (R) #
Infant Mortality (R) 13 11.1§ -53†
Lead Screening
Screened (P) 3,142 38.4 ND
Elevated(P) 278 8.8 ND
CANCER DEATHS
NUMBER RATE 10-YR CHANGE All-cancers 48 182 -33†
Breast 5 * --
Colon 5 * --
Lung 13 * --
Prostate 0 * --
UNNATURAL CAUSES OF DEATH
NUMBER RATE 10-YR CHANGE Accidents 18 * --
Homicide 22 39.8 --
Suicide 3 * --
CHRONIC DISEASE DEATHS
NUMBER RATE 10-YR CHANGE Heart Disease 75 317.1 -39.6†
Stroke 20 * --
Lower Respiratory Disease 6 * --
Diabetes Mellitus 13 * --
Liver Disease and Cirrohosis 3 * --
Alzheimer’s Disease 2 * --
Health Status Index Series Vol XV No II, pg. 131
The reference year for 10-YR CHANGE is 1993. 10-YR CHANGE is the relative percent change over time (e.g. 10% change is from 20 to 22) not the absolute percent change over time (e.g. 10% change is from 20 to 30). See methods section for more detail. Calculation of 10-YR CHANGE using 1993 mortality data are comparability-adjusted.
*Rate or percent suppressed because count is less than 5 (or less than 21 for age-adjusted rates).§Use caution when interpreting data based on 20 or fewer events, the rate/percent is unreliable. See methods for more information.
†Signifi cant difference (0.1 level)ND = No Data, data not collected in 1993 to calculate 10-YR CHANGE.# = 2003 fetal mortality data not available at time of publication.
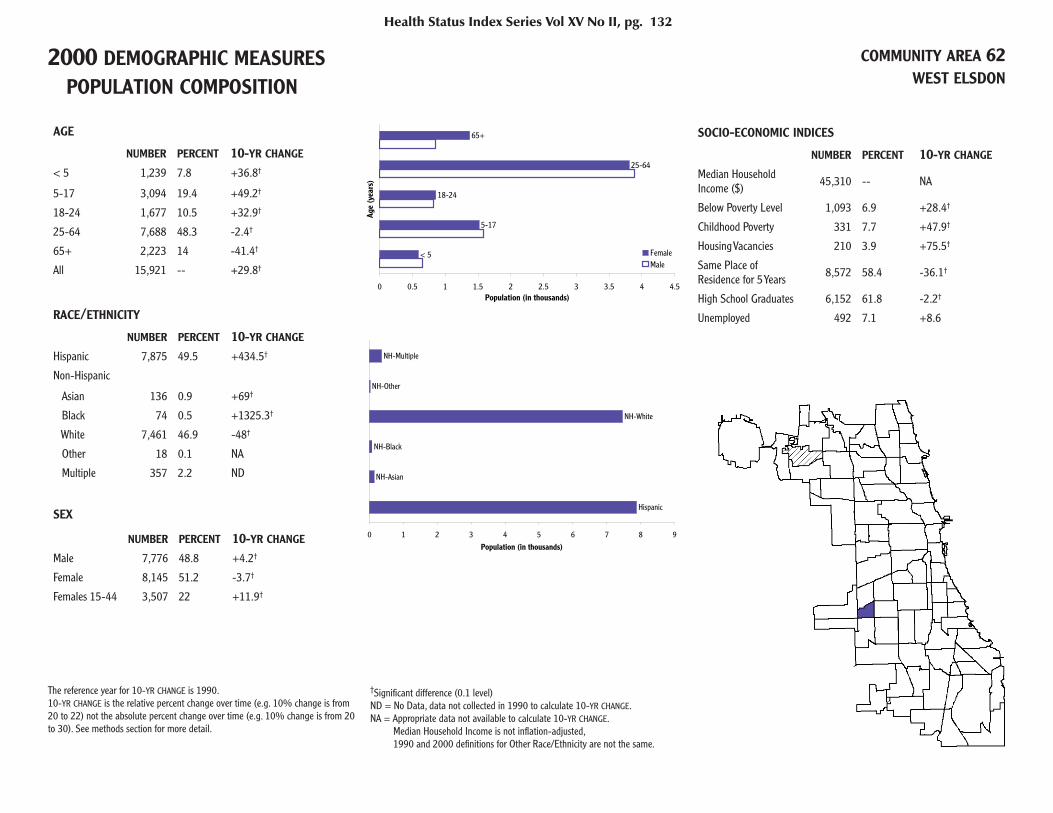
2000 DEMOGRAPHIC MEASURES POPULATION COMPOSITION
COMMUNITY AREA 62WEST ELSDON
AGE
NUMBER PERCENT 10-YR CHANGE < 5 1,239 7.8 +36.8†
5-17 3,094 19.4 +49.2†
18-24 1,677 10.5 +32.9†
25-64 7,688 48.3 -2.4†
65+ 2,223 14 -41.4†
All 15,921 -- +29.8†
RACE/ETHNICITY
NUMBER PERCENT 10-YR CHANGE Hispanic 7,875 49.5 +434.5†
Non-Hispanic
Asian 136 0.9 +69†
Black 74 0.5 +1325.3†
White 7,461 46.9 -48†
Other 18 0.1 NA
Multiple 357 2.2 ND
SEX
NUMBER PERCENT 10-YR CHANGE Male 7,776 48.8 +4.2†
Female 8,145 51.2 -3.7†
Females 15-44 3,507 22 +11.9†
SOCIO-ECONOMIC INDICES
NUMBER PERCENT 10-YR CHANGE
Median Household Income ($) 45,310 -- NA
Below Poverty Level 1,093 6.9 +28.4†
Childhood Poverty 331 7.7 +47.9†
Housing Vacancies 210 3.9 +75.5†
Same Place of Residence for 5 Years 8,572 58.4 -36.1†
High School Graduates 6,152 61.8 -2.2†
Unemployed 492 7.1 +8.6
Health Status Index Series Vol XV No II, pg. 132
< 5
5-17
18-24
25-64
65+
0 0.5 1 1.5 2 2.5 3 3.5 4 4.5
Age
(yea
rs)
Population (in thousands)
FemaleMale
Hispanic
NH-Asian
NH-Black
NH-White
NH-Other
NH-Multiple
0 1 2 3 4 5 6 7 8 9
Population (in thousands)
The reference year for 10-YR CHANGE is 1990.10-YR CHANGE is the relative percent change over time (e.g. 10% change is from 20 to 22) not the absolute percent change over time (e.g. 10% change is from 20 to 30). See methods section for more detail.
†Signifi cant difference (0.1 level)ND = No Data, data not collected in 1990 to calculate 10-YR CHANGE.NA = Appropriate data not available to calculate 10-YR CHANGE. Median Household Income is not infl ation-adjusted, 1990 and 2000 defi nitions for Other Race/Ethnicity are not the same.
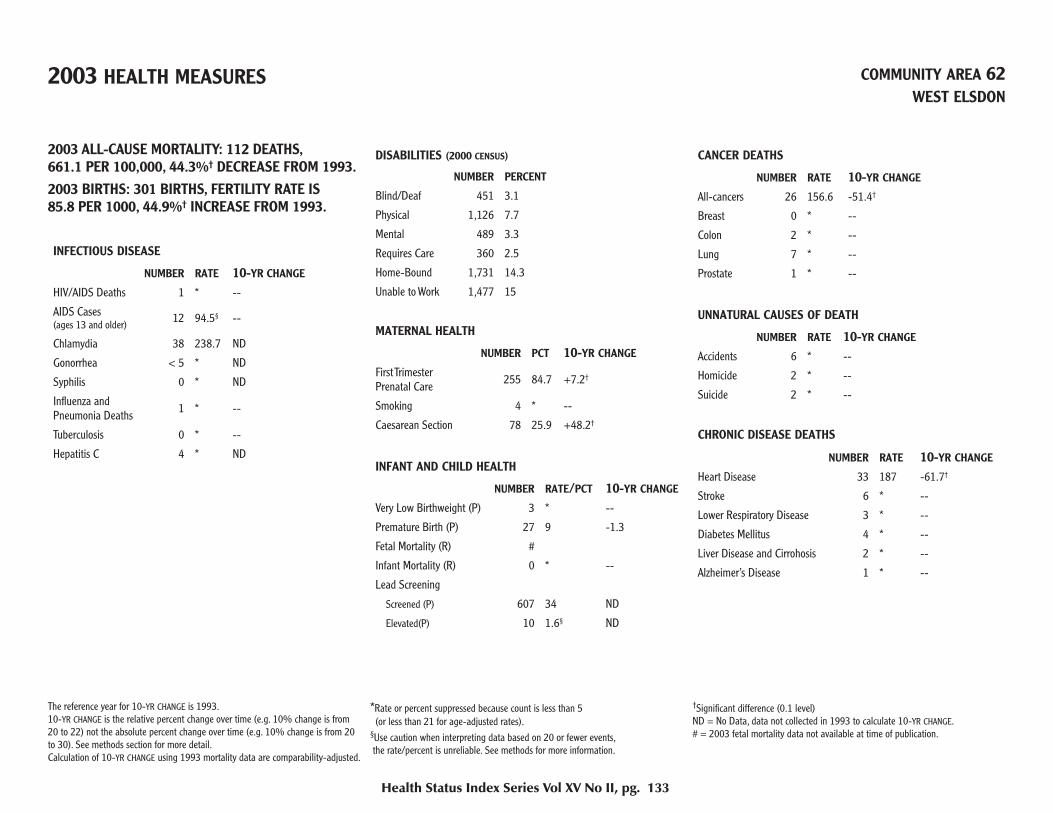
2003 HEALTH MEASURES COMMUNITY AREA 62WEST ELSDON
2003 ALL-CAUSE MORTALITY: 112 DEATHS,661.1 PER 100,000, 44.3%† DECREASE FROM 1993.2003 BIRTHS: 301 BIRTHS, FERTILITY RATE IS85.8 PER 1000, 44.9%† INCREASE FROM 1993.
INFECTIOUS DISEASE
NUMBER RATE 10-YR CHANGE HIV/AIDS Deaths 1 * --
AIDS Cases(ages 13 and older) 12 94.5§ --
Chlamydia 38 238.7 ND
Gonorrhea < 5 * ND
Syphilis 0 * ND
Infl uenza and Pneumonia Deaths 1 * --
Tuberculosis 0 * --
Hepatitis C 4 * ND
DISABILITIES (2000 CENSUS)
NUMBER PERCENT
Blind/Deaf 451 3.1
Physical 1,126 7.7
Mental 489 3.3
Requires Care 360 2.5
Home-Bound 1,731 14.3
Unable to Work 1,477 15
MATERNAL HEALTH
NUMBER PCT 10-YR CHANGE First Trimester Prenatal Care 255 84.7 +7.2†
Smoking 4 * --
Caesarean Section 78 25.9 +48.2†
INFANT AND CHILD HEALTH
NUMBER RATE/PCT 10-YR CHANGE Very Low Birthweight (P) 3 * --
Premature Birth (P) 27 9 -1.3
Fetal Mortality (R) #
Infant Mortality (R) 0 * --
Lead Screening
Screened (P) 607 34 ND
Elevated(P) 10 1.6§ ND
CANCER DEATHS
NUMBER RATE 10-YR CHANGE All-cancers 26 156.6 -51.4†
Breast 0 * --
Colon 2 * --
Lung 7 * --
Prostate 1 * --
UNNATURAL CAUSES OF DEATH
NUMBER RATE 10-YR CHANGE Accidents 6 * --
Homicide 2 * --
Suicide 2 * --
CHRONIC DISEASE DEATHS
NUMBER RATE 10-YR CHANGE Heart Disease 33 187 -61.7†
Stroke 6 * --
Lower Respiratory Disease 3 * --
Diabetes Mellitus 4 * --
Liver Disease and Cirrohosis 2 * --
Alzheimer’s Disease 1 * --
Health Status Index Series Vol XV No II, pg. 133
The reference year for 10-YR CHANGE is 1993. 10-YR CHANGE is the relative percent change over time (e.g. 10% change is from 20 to 22) not the absolute percent change over time (e.g. 10% change is from 20 to 30). See methods section for more detail. Calculation of 10-YR CHANGE using 1993 mortality data are comparability-adjusted.
*Rate or percent suppressed because count is less than 5 (or less than 21 for age-adjusted rates).§Use caution when interpreting data based on 20 or fewer events, the rate/percent is unreliable. See methods for more information.
†Signifi cant difference (0.1 level)ND = No Data, data not collected in 1993 to calculate 10-YR CHANGE.# = 2003 fetal mortality data not available at time of publication.
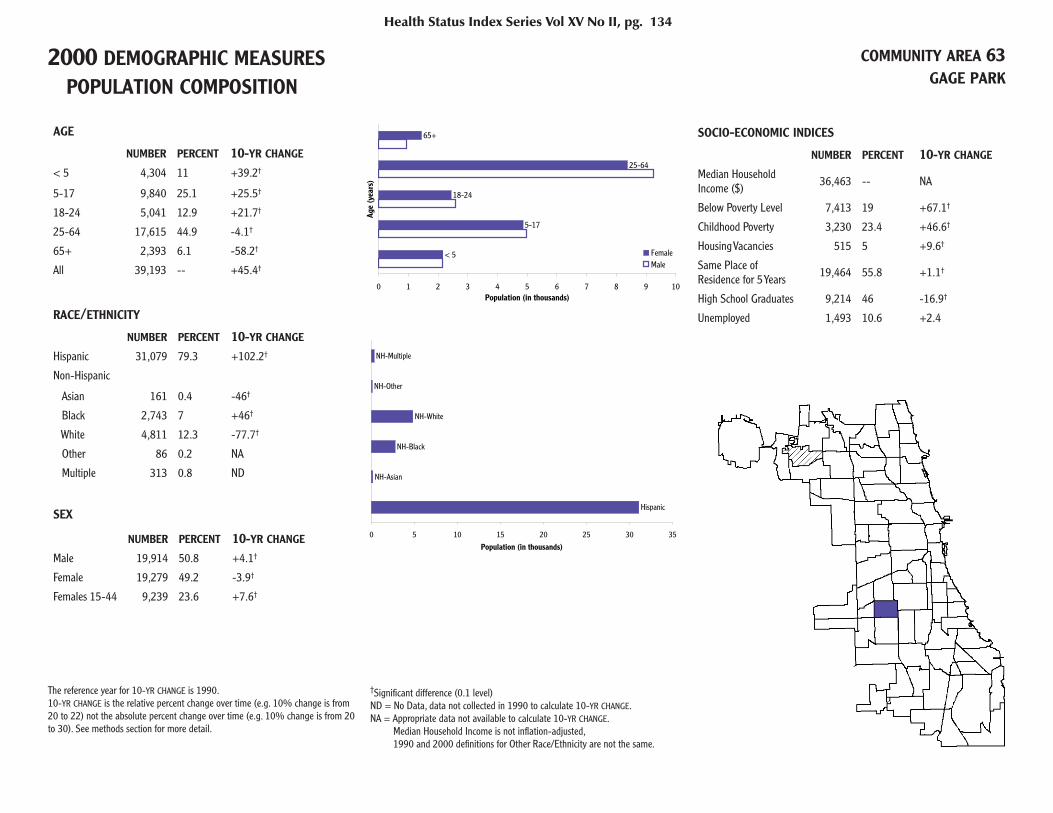
2000 DEMOGRAPHIC MEASURES POPULATION COMPOSITION
COMMUNITY AREA 63GAGE PARK
AGE
NUMBER PERCENT 10-YR CHANGE < 5 4,304 11 +39.2†
5-17 9,840 25.1 +25.5†
18-24 5,041 12.9 +21.7†
25-64 17,615 44.9 -4.1†
65+ 2,393 6.1 -58.2†
All 39,193 -- +45.4†
RACE/ETHNICITY
NUMBER PERCENT 10-YR CHANGE Hispanic 31,079 79.3 +102.2†
Non-Hispanic
Asian 161 0.4 -46†
Black 2,743 7 +46†
White 4,811 12.3 -77.7†
Other 86 0.2 NA
Multiple 313 0.8 ND
SEX
NUMBER PERCENT 10-YR CHANGE Male 19,914 50.8 +4.1†
Female 19,279 49.2 -3.9†
Females 15-44 9,239 23.6 +7.6†
SOCIO-ECONOMIC INDICES
NUMBER PERCENT 10-YR CHANGE
Median Household Income ($) 36,463 -- NA
Below Poverty Level 7,413 19 +67.1†
Childhood Poverty 3,230 23.4 +46.6†
Housing Vacancies 515 5 +9.6†
Same Place of Residence for 5 Years 19,464 55.8 +1.1†
High School Graduates 9,214 46 -16.9†
Unemployed 1,493 10.6 +2.4
Health Status Index Series Vol XV No II, pg. 134
< 5
5-17
18-24
25-64
65+
0 1 2 3 4 5 6 7 8 9 10
Age
(yea
rs)
Population (in thousands)
FemaleMale
Hispanic
NH-Asian
NH-Black
NH-White
NH-Other
NH-Multiple
0 5 10 15 20 25 30 35
Population (in thousands)
The reference year for 10-YR CHANGE is 1990.10-YR CHANGE is the relative percent change over time (e.g. 10% change is from 20 to 22) not the absolute percent change over time (e.g. 10% change is from 20 to 30). See methods section for more detail.
†Signifi cant difference (0.1 level)ND = No Data, data not collected in 1990 to calculate 10-YR CHANGE.NA = Appropriate data not available to calculate 10-YR CHANGE. Median Household Income is not infl ation-adjusted, 1990 and 2000 defi nitions for Other Race/Ethnicity are not the same.
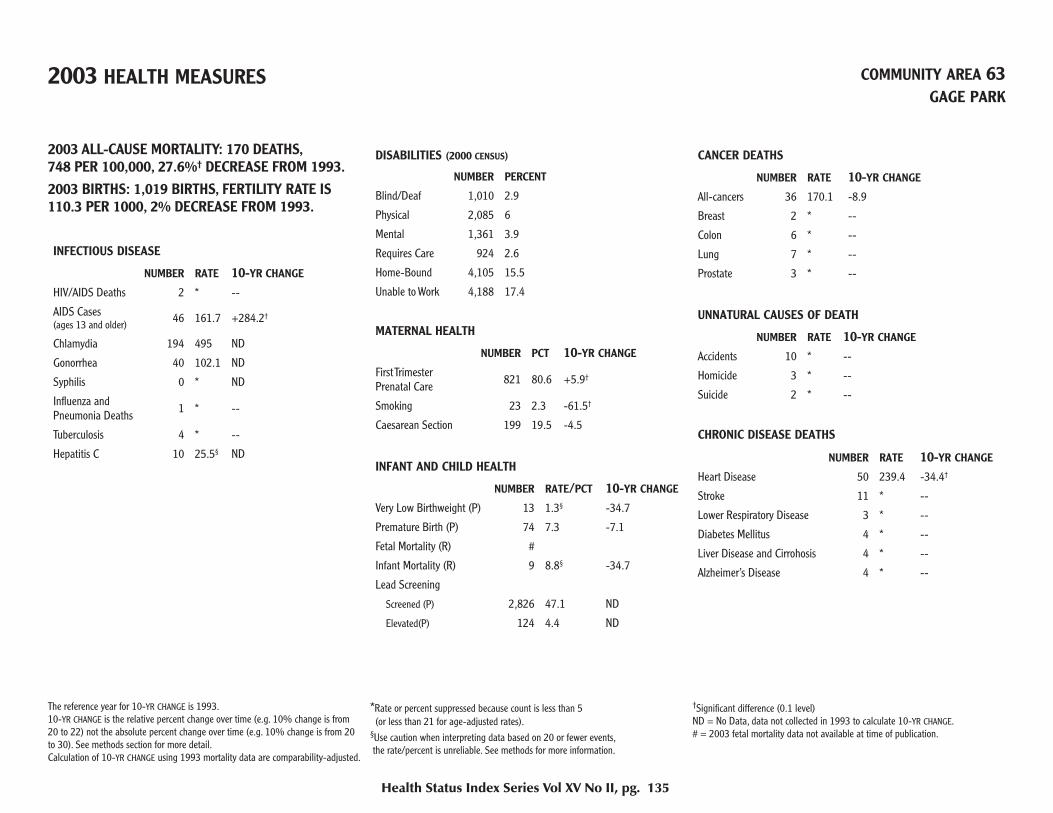
2003 HEALTH MEASURES COMMUNITY AREA 63GAGE PARK
2003 ALL-CAUSE MORTALITY: 170 DEATHS,748 PER 100,000, 27.6%† DECREASE FROM 1993.2003 BIRTHS: 1,019 BIRTHS, FERTILITY RATE IS110.3 PER 1000, 2% DECREASE FROM 1993.
INFECTIOUS DISEASE
NUMBER RATE 10-YR CHANGE HIV/AIDS Deaths 2 * --
AIDS Cases (ages 13 and older) 46 161.7 +284.2†
Chlamydia 194 495 ND
Gonorrhea 40 102.1 ND
Syphilis 0 * ND
Infl uenza and Pneumonia Deaths 1 * --
Tuberculosis 4 * --
Hepatitis C 10 25.5§ ND
DISABILITIES (2000 CENSUS)
NUMBER PERCENT
Blind/Deaf 1,010 2.9
Physical 2,085 6
Mental 1,361 3.9
Requires Care 924 2.6
Home-Bound 4,105 15.5
Unable to Work 4,188 17.4
MATERNAL HEALTH
NUMBER PCT 10-YR CHANGE First Trimester Prenatal Care 821 80.6 +5.9†
Smoking 23 2.3 -61.5†
Caesarean Section 199 19.5 -4.5
INFANT AND CHILD HEALTH
NUMBER RATE/PCT 10-YR CHANGE Very Low Birthweight (P) 13 1.3§ -34.7
Premature Birth (P) 74 7.3 -7.1
Fetal Mortality (R) #
Infant Mortality (R) 9 8.8§ -34.7
Lead Screening
Screened (P) 2,826 47.1 ND
Elevated(P) 124 4.4 ND
CANCER DEATHS
NUMBER RATE 10-YR CHANGE All-cancers 36 170.1 -8.9
Breast 2 * --
Colon 6 * --
Lung 7 * --
Prostate 3 * --
UNNATURAL CAUSES OF DEATH
NUMBER RATE 10-YR CHANGE Accidents 10 * --
Homicide 3 * --
Suicide 2 * --
CHRONIC DISEASE DEATHS
NUMBER RATE 10-YR CHANGE Heart Disease 50 239.4 -34.4†
Stroke 11 * --
Lower Respiratory Disease 3 * --
Diabetes Mellitus 4 * --
Liver Disease and Cirrohosis 4 * --
Alzheimer’s Disease 4 * --
Health Status Index Series Vol XV No II, pg. 135
The reference year for 10-YR CHANGE is 1993. 10-YR CHANGE is the relative percent change over time (e.g. 10% change is from 20 to 22) not the absolute percent change over time (e.g. 10% change is from 20 to 30). See methods section for more detail. Calculation of 10-YR CHANGE using 1993 mortality data are comparability-adjusted.
*Rate or percent suppressed because count is less than 5 (or less than 21 for age-adjusted rates).§Use caution when interpreting data based on 20 or fewer events, the rate/percent is unreliable. See methods for more information.
†Signifi cant difference (0.1 level)ND = No Data, data not collected in 1993 to calculate 10-YR CHANGE.# = 2003 fetal mortality data not available at time of publication.

2000 DEMOGRAPHIC MEASURES POPULATION COMPOSITION
COMMUNITY AREA 64CLEARING
AGE
NUMBER PERCENT 10-YR CHANGE < 5 1,446 6.5 +14†
5-17 3,653 16.4 +12.3†
18-24 1,914 8.6 -13.1†
25-64 11,874 53.2 0
65+ 3,444 15.4 -6.7†
All 22,331 -- +3.9†
RACE/ETHNICITY
NUMBER PERCENT 10-YR CHANGE Hispanic 4,688 21 +179.3†
Non-Hispanic
Asian 152 0.7 +22.9†
Black 137 0.6 +1364.9†
White 17,047 76.3 -16.8†
Other 40 0.2 NA
Multiple 267 1.2 ND
SEX
NUMBER PERCENT 10-YR CHANGE Male 10,955 49.1 +1.1
Female 11,376 50.9 -1
Females 15-44 4,662 20.9 -3.5†
SOCIO-ECONOMIC INDICES
NUMBER PERCENT 10-YR CHANGE
Median Household Income ($) 45,533 -- NA
Below Poverty Level 1,535 6.9 +56.1†
Childhood Poverty 429 8.6 +78.9†
Housing Vacancies 264 3 +17†
Same Place of Residence for 5 Years 12,913 61.8 -9.4†
High School Graduates 11,805 77 +10.7†
Unemployed 534 4.9 -12.1†
Health Status Index Series Vol XV No II, pg. 136
< 5
5-17
18-24
25-64
65+
0 1 2 3 4 5 6 7
Age
(yea
rs)
Population (in thousands)
FemaleMale
Hispanic
NH-Asian
NH-Black
NH-White
NH-Other
NH-Multiple
0 2 4 6 8 10 12 14 16 18 20
Population (in thousands)
The reference year for 10-YR CHANGE is 1990.10-YR CHANGE is the relative percent change over time (e.g. 10% change is from 20 to 22) not the absolute percent change over time (e.g. 10% change is from 20 to 30). See methods section for more detail.
†Signifi cant difference (0.1 level)ND = No Data, data not collected in 1990 to calculate 10-YR CHANGE.NA = Appropriate data not available to calculate 10-YR CHANGE. Median Household Income is not infl ation-adjusted, 1990 and 2000 defi nitions for Other Race/Ethnicity are not the same.

2003 HEALTH MEASURES COMMUNITY AREA 64CLEARING
2003 ALL-CAUSE MORTALITY: 224 DEATHS,924.4 PER 100,000, 15.4%† DECREASE FROM 1993.2003 BIRTHS: 303 BIRTHS, FERTILITY RATE IS65 PER 1000, 11%† INCREASE FROM 1993.
INFECTIOUS DISEASE
NUMBER RATE 10-YR CHANGE HIV/AIDS Deaths 0 * --
AIDS Cases (ages 13 and older) 11 59.3§ +80.7
Chlamydia 25 112 ND
Gonorrhea 10 44.8§ ND
Syphilis 0 * ND
Infl uenza and Pneumonia Deaths 6 * --
Tuberculosis 1 * --
Hepatitis C 10 44.8§ ND
DISABILITIES (2000 CENSUS)
NUMBER PERCENT
Blind/Deaf 691 3.3
Physical 1,815 8.7
Mental 867 4.2
Requires Care 554 2.7
Home-Bound 1,815 10.2
Unable to Work 1,953 13.6
MATERNAL HEALTH
NUMBER PCT 10-YR CHANGE First Trimester Prenatal Care 270 89.1 -0.7
Smoking 27 8.9 -30.8†
Caesarean Section 93 30.7 +63.7†
INFANT AND CHILD HEALTH
NUMBER RATE/PCT 10-YR CHANGE Very Low Birthweight (P) 5 1.7§ +348.8†
Premature Birth (P) 31 10.2 +54.6†
Fetal Mortality (R) #
Infant Mortality (R) 2 * --
Lead Screening
Screened (P) 351 17.2 ND
Elevated(P) 6 1.7§ ND
CANCER DEATHS
NUMBER RATE 10-YR CHANGE All-cancers 62 255.6 -12.9
Breast 3 * --
Colon 10 * --
Lung 21 91.1 --
Prostate 2 * --
UNNATURAL CAUSES OF DEATH
NUMBER RATE 10-YR CHANGE Accidents 2 * --
Homicide 0 * --
Suicide 0 * --
CHRONIC DISEASE DEATHS
NUMBER RATE 10-YR CHANGE Heart Disease 75 309.7 -13.9
Stroke 16 * --
Lower Respiratory Disease 5 * --
Diabetes Mellitus 6 * --
Liver Disease and Cirrohosis 6 * --
Alzheimer’s Disease 4 * --
Health Status Index Series Vol XV No II, pg. 137
The reference year for 10-YR CHANGE is 1993. 10-YR CHANGE is the relative percent change over time (e.g. 10% change is from 20 to 22) not the absolute percent change over time (e.g. 10% change is from 20 to 30). See methods section for more detail. Calculation of 10-YR CHANGE using 1993 mortality data are comparability-adjusted.
*Rate or percent suppressed because count is less than 5 (or less than 21 for age-adjusted rates).§Use caution when interpreting data based on 20 or fewer events, the rate/percent is unreliable. See methods for more information.
†Signifi cant difference (0.1 level)ND = No Data, data not collected in 1993 to calculate 10-YR CHANGE.# = 2003 fetal mortality data not available at time of publication.
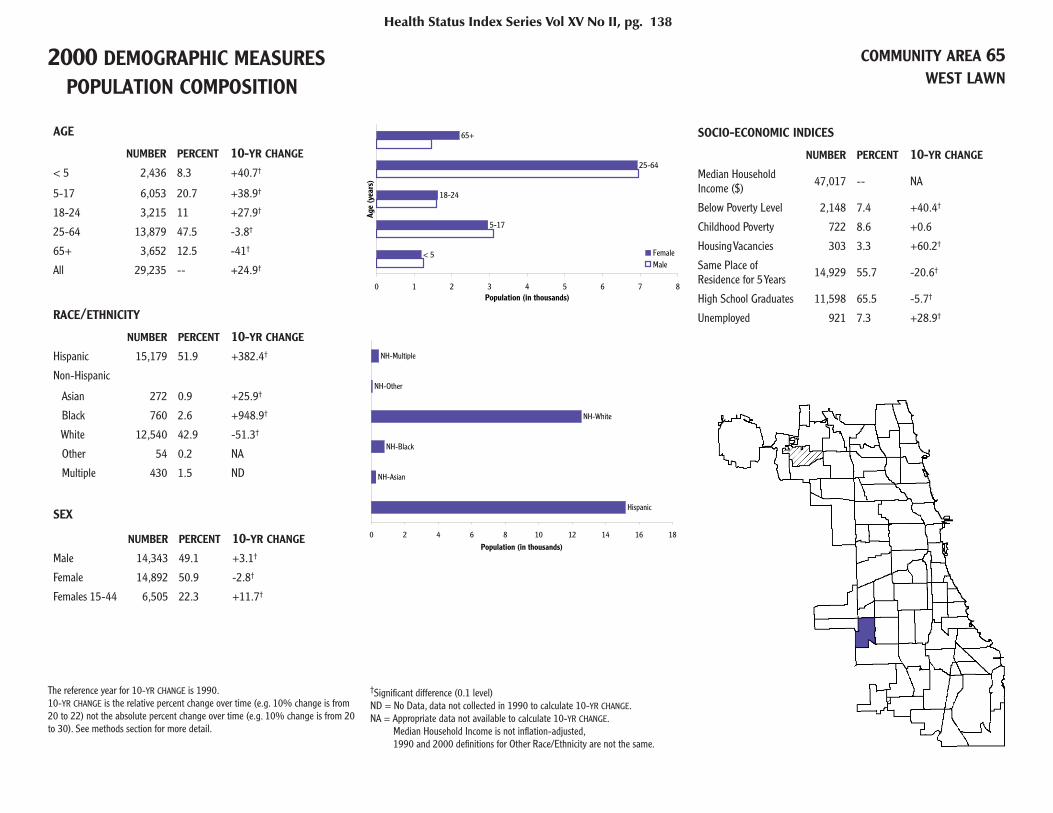
2000 DEMOGRAPHIC MEASURES POPULATION COMPOSITION
COMMUNITY AREA 65WEST LAWN
AGE
NUMBER PERCENT 10-YR CHANGE < 5 2,436 8.3 +40.7†
5-17 6,053 20.7 +38.9†
18-24 3,215 11 +27.9†
25-64 13,879 47.5 -3.8†
65+ 3,652 12.5 -41†
All 29,235 -- +24.9†
RACE/ETHNICITY
NUMBER PERCENT 10-YR CHANGE Hispanic 15,179 51.9 +382.4†
Non-Hispanic
Asian 272 0.9 +25.9†
Black 760 2.6 +948.9†
White 12,540 42.9 -51.3†
Other 54 0.2 NA
Multiple 430 1.5 ND
SEX
NUMBER PERCENT 10-YR CHANGE Male 14,343 49.1 +3.1†
Female 14,892 50.9 -2.8†
Females 15-44 6,505 22.3 +11.7†
SOCIO-ECONOMIC INDICES
NUMBER PERCENT 10-YR CHANGE
Median Household Income ($) 47,017 -- NA
Below Poverty Level 2,148 7.4 +40.4†
Childhood Poverty 722 8.6 +0.6
Housing Vacancies 303 3.3 +60.2†
Same Place of Residence for 5 Years 14,929 55.7 -20.6†
High School Graduates 11,598 65.5 -5.7†
Unemployed 921 7.3 +28.9†
Health Status Index Series Vol XV No II, pg. 138
< 5
5-17
18-24
25-64
65+
0 1 2 3 4 5 6 7 8
Age
(yea
rs)
Population (in thousands)
FemaleMale
Hispanic
NH-Asian
NH-Black
NH-White
NH-Other
NH-Multiple
0 2 4 6 8 10 12 14 16 18
Population (in thousands)
The reference year for 10-YR CHANGE is 1990.10-YR CHANGE is the relative percent change over time (e.g. 10% change is from 20 to 22) not the absolute percent change over time (e.g. 10% change is from 20 to 30). See methods section for more detail.
†Signifi cant difference (0.1 level)ND = No Data, data not collected in 1990 to calculate 10-YR CHANGE.NA = Appropriate data not available to calculate 10-YR CHANGE. Median Household Income is not infl ation-adjusted, 1990 and 2000 defi nitions for Other Race/Ethnicity are not the same.

2003 HEALTH MEASURES COMMUNITY AREA 65WEST LAWN
2003 ALL-CAUSE MORTALITY: 253 DEATHS,877.4 PER 100,000, 5.1% DECREASE FROM 1993.2003 BIRTHS: 646 BIRTHS, FERTILITY RATE IS99.3 PER 1000, 36.6%† INCREASE FROM 1993.
INFECTIOUS DISEASE
NUMBER RATE 10-YR CHANGE HIV/AIDS Deaths 0 * --
AIDS Cases (ages 13 and older) 15 65.5§ --
Chlamydia 63 215.5 ND
Gonorrhea 13 44.5§ ND
Syphilis 0 * ND
Infl uenza and Pneumonia Deaths 11 * --
Tuberculosis 1 * --
Hepatitis C 5 17.1§ ND
DISABILITIES (2000 CENSUS)
NUMBER PERCENT
Blind/Deaf 851 3.2
Physical 2,064 7.7
Mental 901 3.4
Requires Care 670 2.5
Home-Bound 2,538 11.7
Unable to Work 2,288 12.7
MATERNAL HEALTH
NUMBER PCT 10-YR CHANGE First Trimester Prenatal Care 535 82.8 -5.2†
Smoking 6 0.9§ -89.1†
Caesarean Section 146 22.6 -6.6
INFANT AND CHILD HEALTH
NUMBER RATE/PCT 10-YR CHANGE Very Low Birthweight (P) 11 1.7§ -3.8
Premature Birth (P) 64 9.9 +24.4
Fetal Mortality (R) #
Infant Mortality (R) 5 7.7§ --
Lead Screening
Screened (P) 1,209 34.9 ND
Elevated(P) 13 1.1§ ND
CANCER DEATHS
NUMBER RATE 10-YR CHANGE All-cancers 54 182.6 -19.8
Breast 4 * --
Colon 6 * --
Lung 20 * --
Prostate 1 * --
UNNATURAL CAUSES OF DEATH
NUMBER RATE 10-YR CHANGE Accidents 8 * --
Homicide 0 * --
Suicide 1 * --
CHRONIC DISEASE DEATHS
NUMBER RATE 10-YR CHANGE Heart Disease 67 233.2 -30.7†
Stroke 26 91.9 -0.9
Lower Respiratory Disease 9 * --
Diabetes Mellitus 10 * --
Liver Disease and Cirrohosis 1 * --
Alzheimer’s Disease 5 * --
Health Status Index Series Vol XV No II, pg. 139
The reference year for 10-YR CHANGE is 1993. 10-YR CHANGE is the relative percent change over time (e.g. 10% change is from 20 to 22) not the absolute percent change over time (e.g. 10% change is from 20 to 30). See methods section for more detail. Calculation of 10-YR CHANGE using 1993 mortality data are comparability-adjusted.
*Rate or percent suppressed because count is less than 5 (or less than 21 for age-adjusted rates).§Use caution when interpreting data based on 20 or fewer events, the rate/percent is unreliable. See methods for more information.
†Signifi cant difference (0.1 level)ND = No Data, data not collected in 1993 to calculate 10-YR CHANGE.# = 2003 fetal mortality data not available at time of publication.
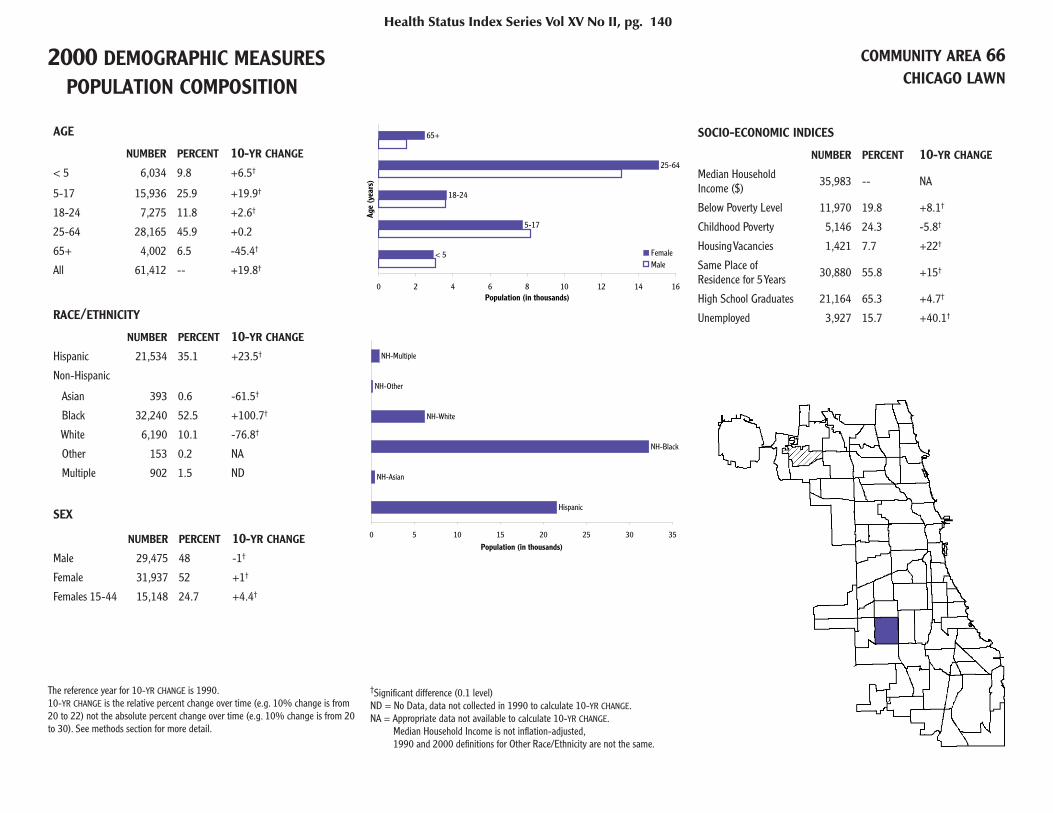
2000 DEMOGRAPHIC MEASURES POPULATION COMPOSITION
COMMUNITY AREA 66CHICAGO LAWN
AGE
NUMBER PERCENT 10-YR CHANGE < 5 6,034 9.8 +6.5†
5-17 15,936 25.9 +19.9†
18-24 7,275 11.8 +2.6†
25-64 28,165 45.9 +0.2
65+ 4,002 6.5 -45.4†
All 61,412 -- +19.8†
RACE/ETHNICITY
NUMBER PERCENT 10-YR CHANGE Hispanic 21,534 35.1 +23.5†
Non-Hispanic
Asian 393 0.6 -61.5†
Black 32,240 52.5 +100.7†
White 6,190 10.1 -76.8†
Other 153 0.2 NA
Multiple 902 1.5 ND
SEX
NUMBER PERCENT 10-YR CHANGE Male 29,475 48 -1†
Female 31,937 52 +1†
Females 15-44 15,148 24.7 +4.4†
SOCIO-ECONOMIC INDICES
NUMBER PERCENT 10-YR CHANGE
Median Household Income ($) 35,983 -- NA
Below Poverty Level 11,970 19.8 +8.1†
Childhood Poverty 5,146 24.3 -5.8†
Housing Vacancies 1,421 7.7 +22†
Same Place of Residence for 5 Years 30,880 55.8 +15†
High School Graduates 21,164 65.3 +4.7†
Unemployed 3,927 15.7 +40.1†
Health Status Index Series Vol XV No II, pg. 140
< 5
5-17
18-24
25-64
65+
0 2 4 6 8 10 12 14 16
Age
(yea
rs)
Population (in thousands)
FemaleMale
Hispanic
NH-Asian
NH-Black
NH-White
NH-Other
NH-Multiple
0 5 10 15 20 25 30 35
Population (in thousands)
The reference year for 10-YR CHANGE is 1990.10-YR CHANGE is the relative percent change over time (e.g. 10% change is from 20 to 22) not the absolute percent change over time (e.g. 10% change is from 20 to 30). See methods section for more detail.
†Signifi cant difference (0.1 level)ND = No Data, data not collected in 1990 to calculate 10-YR CHANGE.NA = Appropriate data not available to calculate 10-YR CHANGE. Median Household Income is not infl ation-adjusted, 1990 and 2000 defi nitions for Other Race/Ethnicity are not the same.

2003 HEALTH MEASURES COMMUNITY AREA 66CHICAGO LAWN
2003 ALL-CAUSE MORTALITY: 383 DEATHS,971.2 PER 100,000, 8.7% INCREASE FROM 1993.2003 BIRTHS: 1,287 BIRTHS, FERTILITY RATE IS85 PER 1000, 23.8%† DECREASE FROM 1993.
INFECTIOUS DISEASE
NUMBER RATE 10-YR CHANGE HIV/AIDS Deaths 3 * --
AIDS Cases (ages 13 and older) 117 258.9 +345.5†
Chlamydia 644 1,048.7 ND
Gonorrhea 358 582.9 ND
Syphilis < 5 * ND
Infl uenza and Pneumonia Deaths 5 * --
Tuberculosis 6 9.8§ -66.5†
Hepatitis C 35 57 ND
DISABILITIES (2000 CENSUS)
NUMBER PERCENT
Blind/Deaf 1,800 3.3
Physical 4,337 7.8
Mental 2,925 5.3
Requires Care 1,847 3.3
Home-Bound 5,911 14.2
Unable to Work 5,960 15.8
MATERNAL HEALTH
NUMBER PCT 10-YR CHANGE First Trimester Prenatal Care 1,013 78.7 +10.2†
Smoking 82 6.4 -30.1†
Caesarean Section 287 22.3 +14.5†
INFANT AND CHILD HEALTH
NUMBER RATE/PCT 10-YR CHANGE Very Low Birthweight (P) 19 1.5§ -20.3
Premature Birth (P) 144 11.2 +33.7†
Fetal Mortality (R) #
Infant Mortality (R) 17 13.2§ +62.1
Lead Screening
Screened (P) 3,560 41.3 ND
Elevated(P) 224 6.3 ND
CANCER DEATHS
NUMBER RATE 10-YR CHANGE All-cancers 78 221.7 +11.1
Breast 9 * --
Colon 9 * --
Lung 25 75 +38
Prostate 1 * --
UNNATURAL CAUSES OF DEATH
NUMBER RATE 10-YR CHANGE Accidents 24 44.7 --
Homicide 17 * --
Suicide 2 * --
CHRONIC DISEASE DEATHS
NUMBER RATE 10-YR CHANGE Heart Disease 104 287.3 -4
Stroke 17 * --
Lower Respiratory Disease 9 * --
Diabetes Mellitus 18 * --
Liver Disease and Cirrohosis 6 * --
Alzheimer’s Disease 7 * --
Health Status Index Series Vol XV No II, pg. 141
The reference year for 10-YR CHANGE is 1993. 10-YR CHANGE is the relative percent change over time (e.g. 10% change is from 20 to 22) not the absolute percent change over time (e.g. 10% change is from 20 to 30). See methods section for more detail. Calculation of 10-YR CHANGE using 1993 mortality data are comparability-adjusted.
*Rate or percent suppressed because count is less than 5 (or less than 21 for age-adjusted rates).§Use caution when interpreting data based on 20 or fewer events, the rate/percent is unreliable. See methods for more information.
†Signifi cant difference (0.1 level)ND = No Data, data not collected in 1993 to calculate 10-YR CHANGE.# = 2003 fetal mortality data not available at time of publication.

2000 DEMOGRAPHIC MEASURES POPULATION COMPOSITION
COMMUNITY AREA 67WEST ENGLEWOOD
AGE
NUMBER PERCENT 10-YR CHANGE < 5 3,855 8.5 -7.6†
5-17 11,860 26.2 +5.6†
18-24 4,874 10.8 -16.3†
25-64 20,295 44.8 -2.4†
65+ 4,398 9.7 +34.7†
All 45,282 -- -14.2†
RACE/ETHNICITY
NUMBER PERCENT 10-YR CHANGE Hispanic 459 1 +61.6†
Non-Hispanic
Asian 29 0.1 -29.6†
Black 44,271 97.8 -0.3†
White 164 0.4 -66.9†
Other 71 0.2 NA
Multiple 288 0.6 ND
SEX
NUMBER PERCENT 10-YR CHANGE Male 20,991 46.4 -1.2†
Female 24,291 53.6 +1.1†
Females 15-44 10,276 22.7 -9†
SOCIO-ECONOMIC INDICES
NUMBER PERCENT 10-YR CHANGE
Median Household Income ($) 26,693 -- NA
Below Poverty Level 14,450 32.1 +5†
Childhood Poverty 6,383 41.7 +1.3
Housing Vacancies 1,693 12 +55.9†
Same Place of Residence for 5 Years 27,884 67.3 -0.5
High School Graduates 15,453 62.8 +13.2†
Unemployed 3,995 24.5 +1.9
Health Status Index Series Vol XV No II, pg. 142
< 5
5-17
18-24
25-64
65+
0 2 4 6 8 10 12 14
Age
(yea
rs)
Population (in thousands)
FemaleMale
Hispanic
NH-Asian
NH-Black
NH-White
NH-Other
NH-Multiple
0 4 8 12 16 20 24 28 32 36 40 44 48
Population (in thousands)
The reference year for 10-YR CHANGE is 1990.10-YR CHANGE is the relative percent change over time (e.g. 10% change is from 20 to 22) not the absolute percent change over time (e.g. 10% change is from 20 to 30). See methods section for more detail.
†Signifi cant difference (0.1 level)ND = No Data, data not collected in 1990 to calculate 10-YR CHANGE.NA = Appropriate data not available to calculate 10-YR CHANGE. Median Household Income is not infl ation-adjusted, 1990 and 2000 defi nitions for Other Race/Ethnicity are not the same.

2003 HEALTH MEASURES COMMUNITY AREA 67WEST ENGLEWOOD
2003 ALL-CAUSE MORTALITY: 467 DEATHS,1,325.2 PER 100,000, 21.4%† DECREASE FROM 1993.2003 BIRTHS: 835 BIRTHS, FERTILITY RATE IS81.3 PER 1000, 33%† DECREASE FROM 1993.
INFECTIOUS DISEASE
NUMBER RATE 10-YR CHANGE HIV/AIDS Deaths 5 * --
AIDS Cases (ages 13 and older) 197 582.3 +217.6†
Chlamydia 931 2056 ND
Gonorrhea 650 1,435.4 ND
Syphilis 5 11§ ND
Infl uenza and Pneumonia Deaths 9 * --
Tuberculosis 7 15.5§ -48.9†
Hepatitis C 44 97.2 ND
DISABILITIES (2000 CENSUS)
NUMBER PERCENT
Blind/Deaf 1,500 3.6
Physical 4,582 11.1
Mental 3,239 7.8
Requires Care 2,033 4.9
Home-Bound 5,273 16.9
Unable to Work 4,886 18.2
MATERNAL HEALTH
NUMBER PCT 10-YR CHANGE First Trimester Prenatal Care 546 65.4 +7.6†
Smoking 160 19.2 +12.4†
Caesarean Section 181 21.7 +28.5†
INFANT AND CHILD HEALTH
NUMBER RATE/PCT 10-YR CHANGE Very Low Birthweight (P) 27 3.2 -2.7
Premature Birth (P) 130 15.6 +6.1
Fetal Mortality (R) #
Infant Mortality (R) 21 25.1 +8.4
Lead Screening
Screened (P) 2,475 43.4 ND
Elevated(P) 386 15.6 ND
CANCER DEATHS
NUMBER RATE 10-YR CHANGE All-cancers 108 305.5 -21.2†
Breast 7 * --
Colon 15 * --
Lung 31 81.9 -22.2
Prostate 6 * --
UNNATURAL CAUSES OF DEATH
NUMBER RATE 10-YR CHANGE Accidents 33 76.5 +31.7
Homicide 20 * --
Suicide 2 * --
CHRONIC DISEASE DEATHS
NUMBER RATE 10-YR CHANGE Heart Disease 133 398.4 -25.5†
Stroke 21 64.8 -34†
Lower Respiratory Disease 10 * --
Diabetes Mellitus 22 67.4 --
Liver Disease and Cirrohosis 5 * --
Alzheimer’s Disease 3 * --
Health Status Index Series Vol XV No II, pg. 143
The reference year for 10-YR CHANGE is 1993. 10-YR CHANGE is the relative percent change over time (e.g. 10% change is from 20 to 22) not the absolute percent change over time (e.g. 10% change is from 20 to 30). See methods section for more detail. Calculation of 10-YR CHANGE using 1993 mortality data are comparability-adjusted.
*Rate or percent suppressed because count is less than 5 (or less than 21 for age-adjusted rates).§Use caution when interpreting data based on 20 or fewer events, the rate/percent is unreliable. See methods for more information.
†Signifi cant difference (0.1 level)ND = No Data, data not collected in 1993 to calculate 10-YR CHANGE.# = 2003 fetal mortality data not available at time of publication.
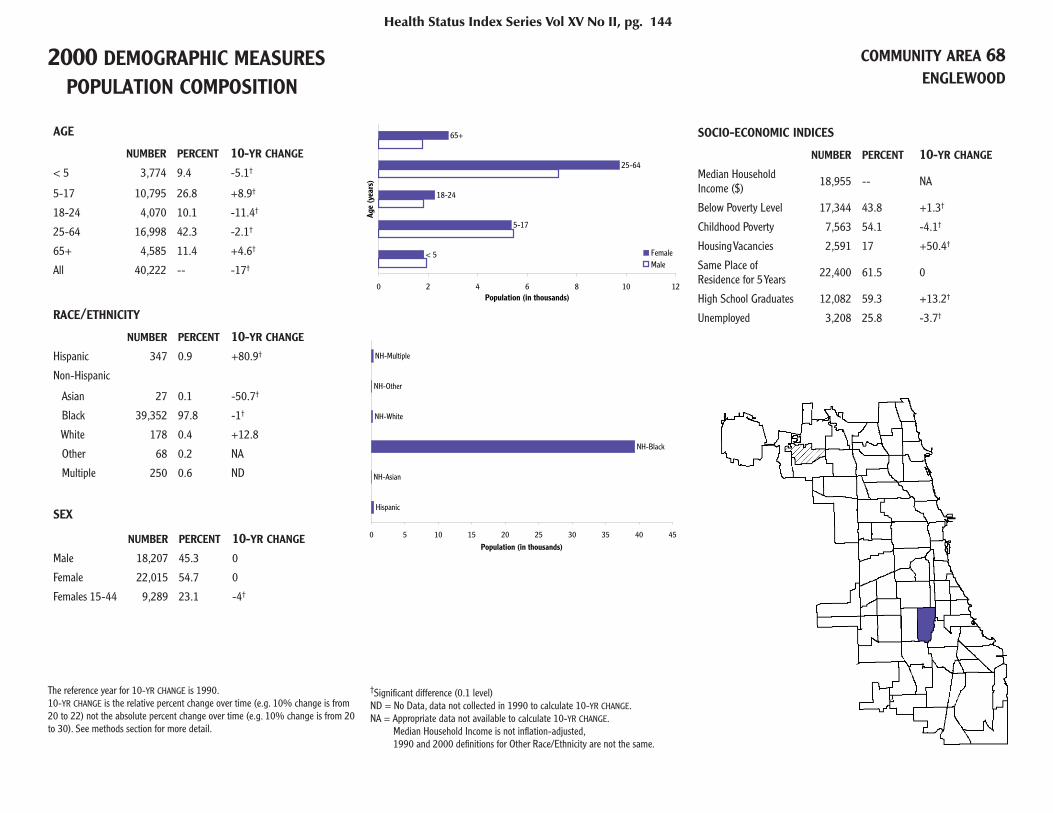
2000 DEMOGRAPHIC MEASURES POPULATION COMPOSITION
COMMUNITY AREA 68ENGLEWOOD
AGE
NUMBER PERCENT 10-YR CHANGE < 5 3,774 9.4 -5.1†
5-17 10,795 26.8 +8.9†
18-24 4,070 10.1 -11.4†
25-64 16,998 42.3 -2.1†
65+ 4,585 11.4 +4.6†
All 40,222 -- -17†
RACE/ETHNICITY
NUMBER PERCENT 10-YR CHANGE Hispanic 347 0.9 +80.9†
Non-Hispanic
Asian 27 0.1 -50.7†
Black 39,352 97.8 -1†
White 178 0.4 +12.8
Other 68 0.2 NA
Multiple 250 0.6 ND
SEX
NUMBER PERCENT 10-YR CHANGE Male 18,207 45.3 0
Female 22,015 54.7 0
Females 15-44 9,289 23.1 -4†
SOCIO-ECONOMIC INDICES
NUMBER PERCENT 10-YR CHANGE
Median Household Income ($) 18,955 -- NA
Below Poverty Level 17,344 43.8 +1.3†
Childhood Poverty 7,563 54.1 -4.1†
Housing Vacancies 2,591 17 +50.4†
Same Place of Residence for 5 Years 22,400 61.5 0
High School Graduates 12,082 59.3 +13.2†
Unemployed 3,208 25.8 -3.7†
Health Status Index Series Vol XV No II, pg. 144
< 5
5-17
18-24
25-64
65+
0 2 4 6 8 10 12
Age
(yea
rs)
Population (in thousands)
FemaleMale
Hispanic
NH-Asian
NH-Black
NH-White
NH-Other
NH-Multiple
0 5 10 15 20 25 30 35 40 45
Population (in thousands)
The reference year for 10-YR CHANGE is 1990.10-YR CHANGE is the relative percent change over time (e.g. 10% change is from 20 to 22) not the absolute percent change over time (e.g. 10% change is from 20 to 30). See methods section for more detail.
†Signifi cant difference (0.1 level)ND = No Data, data not collected in 1990 to calculate 10-YR CHANGE.NA = Appropriate data not available to calculate 10-YR CHANGE. Median Household Income is not infl ation-adjusted, 1990 and 2000 defi nitions for Other Race/Ethnicity are not the same.

2003 HEALTH MEASURES COMMUNITY AREA 68ENGLEWOOD
2003 ALL-CAUSE MORTALITY: 405 DEATHS,1,213.9 PER 100,000, 17.9%† DECREASE FROM 1993.2003 BIRTHS: 738 BIRTHS, FERTILITY RATE IS79.4 PER 1000, 26%† DECREASE FROM 1993.
INFECTIOUS DISEASE
NUMBER RATE 10-YR CHANGE HIV/AIDS Deaths 5 * --
AIDS Cases (ages 13 and older) 158 537.4 +203.1†
Chlamydia 896 2,227.6 ND
Gonorrhea 605 1,504.2 ND
Syphilis < 5 * ND
Infl uenza and Pneumonia Deaths 8 * --
Tuberculosis 9 22.4§ -59.8†
Hepatitis C 39 97 ND
DISABILITIES (2000 CENSUS)
NUMBER PERCENT
Blind/Deaf 1,790 4.9
Physical 5,396 14.8
Mental 2,762 7.6
Requires Care 2,146 5.9
Home-Bound 5,007 18.5
Unable to Work 3,959 17.6
MATERNAL HEALTH
NUMBER PCT 10-YR CHANGE First Trimester Prenatal Care 479 64.9 +1.2
Smoking 142 19.2 +6
Caesarean Section 157 21.3 +43.7†
INFANT AND CHILD HEALTH
NUMBER RATE/PCT 10-YR CHANGE Very Low Birthweight (P) 26 3.5 +0.1
Premature Birth (P) 143 19.4 +31.6†
Fetal Mortality (R) #
Infant Mortality (R) 6 8.1§ -57.7†
Lead Screening
Screened (P) 2,469 44.3 ND
Elevated(P) 428 17.3 ND
CANCER DEATHS
NUMBER RATE 10-YR CHANGE All-cancers 97 291.2 -10.3
Breast 4 * --
Colon 10 * --
Lung 30 89.6 -5.4
Prostate 7 * --
UNNATURAL CAUSES OF DEATH
NUMBER RATE 10-YR CHANGE Accidents 13 * --
Homicide 18 * --
Suicide 1 * --
CHRONIC DISEASE DEATHS
NUMBER RATE 10-YR CHANGE Heart Disease 119 362.2 -23.1†
Stroke 20 * --
Lower Respiratory Disease 10 * --
Diabetes Mellitus 13 * --
Liver Disease and Cirrohosis 4 * --
Alzheimer’s Disease 7 * --
Health Status Index Series Vol XV No II, pg. 145
The reference year for 10-YR CHANGE is 1993. 10-YR CHANGE is the relative percent change over time (e.g. 10% change is from 20 to 22) not the absolute percent change over time (e.g. 10% change is from 20 to 30). See methods section for more detail. Calculation of 10-YR CHANGE using 1993 mortality data are comparability-adjusted.
*Rate or percent suppressed because count is less than 5 (or less than 21 for age-adjusted rates).§Use caution when interpreting data based on 20 or fewer events, the rate/percent is unreliable. See methods for more information.
†Signifi cant difference (0.1 level)ND = No Data, data not collected in 1993 to calculate 10-YR CHANGE.# = 2003 fetal mortality data not available at time of publication.
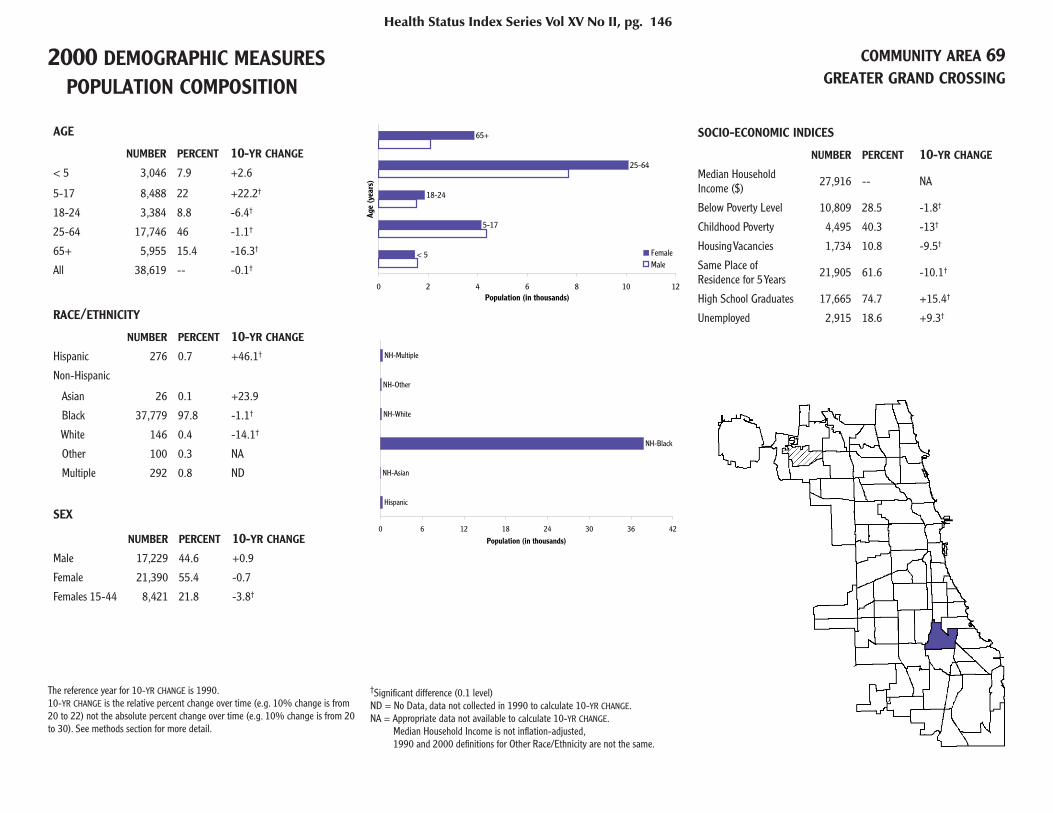
2000 DEMOGRAPHIC MEASURES POPULATION COMPOSITION
AGE
NUMBER PERCENT 10-YR CHANGE < 5 3,046 7.9 +2.6
5-17 8,488 22 +22.2†
18-24 3,384 8.8 -6.4†
25-64 17,746 46 -1.1†
65+ 5,955 15.4 -16.3†
All 38,619 -- -0.1†
RACE/ETHNICITY
NUMBER PERCENT 10-YR CHANGE Hispanic 276 0.7 +46.1†
Non-Hispanic
Asian 26 0.1 +23.9
Black 37,779 97.8 -1.1†
White 146 0.4 -14.1†
Other 100 0.3 NA
Multiple 292 0.8 ND
SEX
NUMBER PERCENT 10-YR CHANGE Male 17,229 44.6 +0.9
Female 21,390 55.4 -0.7
Females 15-44 8,421 21.8 -3.8†
SOCIO-ECONOMIC INDICES
NUMBER PERCENT 10-YR CHANGE
Median Household Income ($) 27,916 -- NA
Below Poverty Level 10,809 28.5 -1.8†
Childhood Poverty 4,495 40.3 -13†
Housing Vacancies 1,734 10.8 -9.5†
Same Place of Residence for 5 Years 21,905 61.6 -10.1†
High School Graduates 17,665 74.7 +15.4†
Unemployed 2,915 18.6 +9.3†
Health Status Index Series Vol XV No II, pg. 146
COMMUNITY AREA 69GREATER GRAND CROSSING
< 5
5-17
18-24
25-64
65+
0 2 4 6 8 10 12
Age
(yea
rs)
Population (in thousands)
FemaleMale
Hispanic
NH-Asian
NH-Black
NH-White
NH-Other
NH-Multiple
0 6 12 18 24 30 36 42
Population (in thousands)
The reference year for 10-YR CHANGE is 1990.10-YR CHANGE is the relative percent change over time (e.g. 10% change is from 20 to 22) not the absolute percent change over time (e.g. 10% change is from 20 to 30). See methods section for more detail.
†Signifi cant difference (0.1 level)ND = No Data, data not collected in 1990 to calculate 10-YR CHANGE.NA = Appropriate data not available to calculate 10-YR CHANGE. Median Household Income is not infl ation-adjusted, 1990 and 2000 defi nitions for Other Race/Ethnicity are not the same.
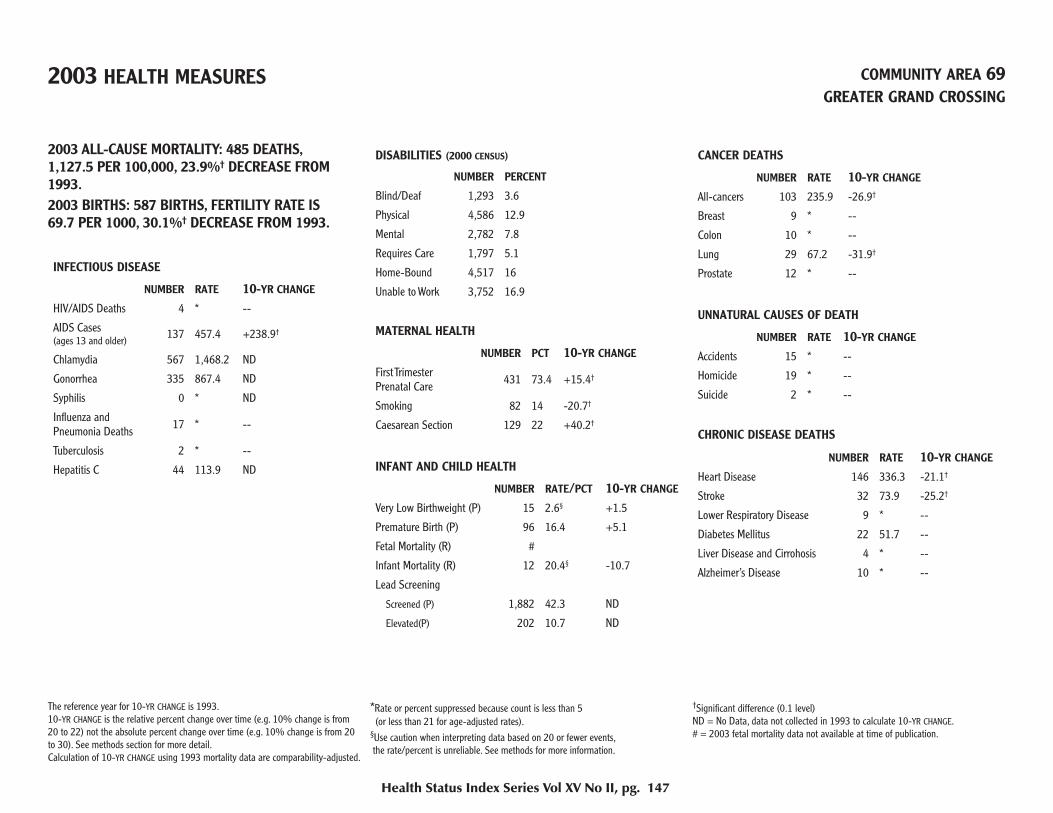
2003 HEALTH MEASURES COMMUNITY AREA 69GREATER GRAND CROSSING
2003 ALL-CAUSE MORTALITY: 485 DEATHS,1,127.5 PER 100,000, 23.9%† DECREASE FROM 1993.2003 BIRTHS: 587 BIRTHS, FERTILITY RATE IS69.7 PER 1000, 30.1%† DECREASE FROM 1993.
INFECTIOUS DISEASE
NUMBER RATE 10-YR CHANGE HIV/AIDS Deaths 4 * --
AIDS Cases (ages 13 and older) 137 457.4 +238.9†
Chlamydia 567 1,468.2 ND
Gonorrhea 335 867.4 ND
Syphilis 0 * ND
Infl uenza and Pneumonia Deaths 17 * --
Tuberculosis 2 * --
Hepatitis C 44 113.9 ND
DISABILITIES (2000 CENSUS)
NUMBER PERCENT
Blind/Deaf 1,293 3.6
Physical 4,586 12.9
Mental 2,782 7.8
Requires Care 1,797 5.1
Home-Bound 4,517 16
Unable to Work 3,752 16.9
MATERNAL HEALTH
NUMBER PCT 10-YR CHANGE First Trimester Prenatal Care 431 73.4 +15.4†
Smoking 82 14 -20.7†
Caesarean Section 129 22 +40.2†
INFANT AND CHILD HEALTH
NUMBER RATE/PCT 10-YR CHANGE Very Low Birthweight (P) 15 2.6§ +1.5
Premature Birth (P) 96 16.4 +5.1
Fetal Mortality (R) #
Infant Mortality (R) 12 20.4§ -10.7
Lead Screening
Screened (P) 1,882 42.3 ND
Elevated(P) 202 10.7 ND
CANCER DEATHS
NUMBER RATE 10-YR CHANGE All-cancers 103 235.9 -26.9†
Breast 9 * --
Colon 10 * --
Lung 29 67.2 -31.9†
Prostate 12 * --
UNNATURAL CAUSES OF DEATH
NUMBER RATE 10-YR CHANGE Accidents 15 * --
Homicide 19 * --
Suicide 2 * --
CHRONIC DISEASE DEATHS
NUMBER RATE 10-YR CHANGE Heart Disease 146 336.3 -21.1†
Stroke 32 73.9 -25.2†
Lower Respiratory Disease 9 * --
Diabetes Mellitus 22 51.7 --
Liver Disease and Cirrohosis 4 * --
Alzheimer’s Disease 10 * --
Health Status Index Series Vol XV No II, pg. 147
The reference year for 10-YR CHANGE is 1993. 10-YR CHANGE is the relative percent change over time (e.g. 10% change is from 20 to 22) not the absolute percent change over time (e.g. 10% change is from 20 to 30). See methods section for more detail. Calculation of 10-YR CHANGE using 1993 mortality data are comparability-adjusted.
*Rate or percent suppressed because count is less than 5 (or less than 21 for age-adjusted rates).§Use caution when interpreting data based on 20 or fewer events, the rate/percent is unreliable. See methods for more information.
†Signifi cant difference (0.1 level)ND = No Data, data not collected in 1993 to calculate 10-YR CHANGE.# = 2003 fetal mortality data not available at time of publication.
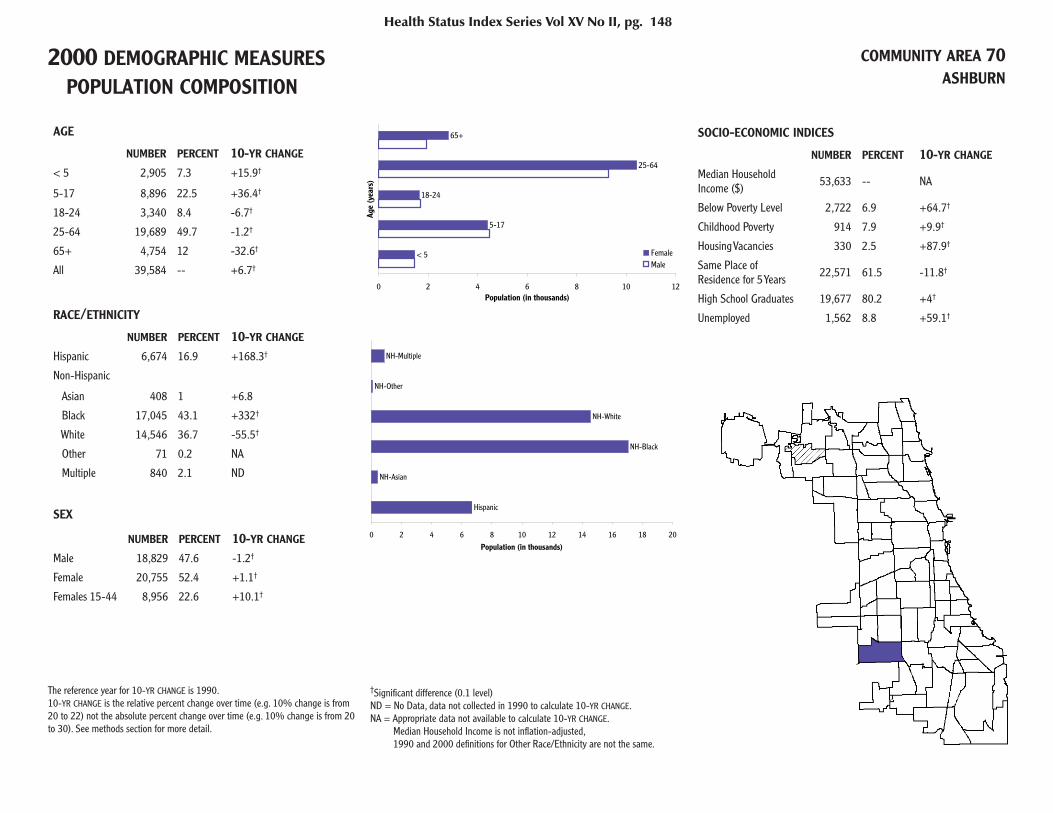
2000 DEMOGRAPHIC MEASURES POPULATION COMPOSITION
COMMUNITY AREA 70ASHBURN
AGE
NUMBER PERCENT 10-YR CHANGE < 5 2,905 7.3 +15.9†
5-17 8,896 22.5 +36.4†
18-24 3,340 8.4 -6.7†
25-64 19,689 49.7 -1.2†
65+ 4,754 12 -32.6†
All 39,584 -- +6.7†
RACE/ETHNICITY
NUMBER PERCENT 10-YR CHANGE Hispanic 6,674 16.9 +168.3†
Non-Hispanic
Asian 408 1 +6.8
Black 17,045 43.1 +332†
White 14,546 36.7 -55.5†
Other 71 0.2 NA
Multiple 840 2.1 ND
SEX
NUMBER PERCENT 10-YR CHANGE Male 18,829 47.6 -1.2†
Female 20,755 52.4 +1.1†
Females 15-44 8,956 22.6 +10.1†
SOCIO-ECONOMIC INDICES
NUMBER PERCENT 10-YR CHANGE
Median Household Income ($) 53,633 -- NA
Below Poverty Level 2,722 6.9 +64.7†
Childhood Poverty 914 7.9 +9.9†
Housing Vacancies 330 2.5 +87.9†
Same Place of Residence for 5 Years 22,571 61.5 -11.8†
High School Graduates 19,677 80.2 +4†
Unemployed 1,562 8.8 +59.1†
Health Status Index Series Vol XV No II, pg. 148
< 5
5-17
18-24
25-64
65+
0 2 4 6 8 10 12
Age
(yea
rs)
Population (in thousands)
FemaleMale
Hispanic
NH-Asian
NH-Black
NH-White
NH-Other
NH-Multiple
0 2 4 6 8 10 12 14 16 18 20
Population (in thousands)
The reference year for 10-YR CHANGE is 1990.10-YR CHANGE is the relative percent change over time (e.g. 10% change is from 20 to 22) not the absolute percent change over time (e.g. 10% change is from 20 to 30). See methods section for more detail.
†Signifi cant difference (0.1 level)ND = No Data, data not collected in 1990 to calculate 10-YR CHANGE.NA = Appropriate data not available to calculate 10-YR CHANGE. Median Household Income is not infl ation-adjusted, 1990 and 2000 defi nitions for Other Race/Ethnicity are not the same.

2003 HEALTH MEASURES COMMUNITY AREA 70ASHBURN
2003 ALL-CAUSE MORTALITY: 381 DEATHS,1,058.9 PER 100,000, 13.6%† DECREASE FROM 1993.2003 BIRTHS: 639 BIRTHS, FERTILITY RATE IS71.3 PER 1000, 8.1%† INCREASE FROM 1993.
INFECTIOUS DISEASE
NUMBER RATE 10-YR CHANGE HIV/AIDS Deaths 5 * --
AIDS Cases (ages 13 and older) 27 87 +199.4†
Chlamydia 224 565.9 ND
Gonorrhea 119 300.6 ND
Syphilis < 5 * ND
Infl uenza and Pneumonia Deaths 8 * --
Tuberculosis 3 * --
Hepatitis C 24 60.6 ND
DISABILITIES (2000 CENSUS)
NUMBER PERCENT
Blind/Deaf 1,089 3
Physical 2,579 7
Mental 1,267 3.5
Requires Care 920 2.5
Home-Bound 3,345 11.5
Unable to Work 3,441 14.2
MATERNAL HEALTH
NUMBER PCT 10-YR CHANGE First Trimester Prenatal Care 539 84.4 -5.1†
Smoking 26 4.1 -67†
Caesarean Section 183 28.6 +20†
INFANT AND CHILD HEALTH
NUMBER RATE/PCT 10-YR CHANGE Very Low Birthweight (P) 11 1.7§ +332.9†
Premature Birth (P) 76 11.9 +99.4†
Fetal Mortality (R) #
Infant Mortality (R) 6 9.4§ --
Lead Screening
Screened (P) 1,114 26.4 ND
Elevated(P) 19 1.7§ ND
CANCER DEATHS
NUMBER RATE 10-YR CHANGE All-cancers 84 229.2 -19.8†
Breast 5 * --
Colon 6 * --
Lung 27 74.7 +7.1
Prostate 7 * --
UNNATURAL CAUSES OF DEATH
NUMBER RATE 10-YR CHANGE Accidents 7 * --
Homicide 12 * --
Suicide 4 * --
CHRONIC DISEASE DEATHS
NUMBER RATE 10-YR CHANGE Heart Disease 110 316.2 -34.3†
Stroke 23 64.6 -23.5
Lower Respiratory Disease 16 * --
Diabetes Mellitus 8 * --
Liver Disease and Cirrohosis 6 * --
Alzheimer’s Disease 8 * --
Health Status Index Series Vol XV No II, pg. 149
The reference year for 10-YR CHANGE is 1993. 10-YR CHANGE is the relative percent change over time (e.g. 10% change is from 20 to 22) not the absolute percent change over time (e.g. 10% change is from 20 to 30). See methods section for more detail. Calculation of 10-YR CHANGE using 1993 mortality data are comparability-adjusted.
*Rate or percent suppressed because count is less than 5 (or less than 21 for age-adjusted rates).§Use caution when interpreting data based on 20 or fewer events, the rate/percent is unreliable. See methods for more information.
†Signifi cant difference (0.1 level)ND = No Data, data not collected in 1993 to calculate 10-YR CHANGE.# = 2003 fetal mortality data not available at time of publication.

2000 DEMOGRAPHIC MEASURES POPULATION COMPOSITION
COMMUNITY AREA 71AUBURN GRESHAM
AGE
NUMBER PERCENT 10-YR CHANGE < 5 4,193 7.5 0
5-17 12,164 21.7 +9†
18-24 5,124 9.2 -19.3†
25-64 27,554 49.3 -5.9†
65+ 6,893 12.3 +39.8†
All 55,928 -- -6.5†
RACE/ETHNICITY
NUMBER PERCENT 10-YR CHANGE Hispanic 347 0.6 +81.9†
Non-Hispanic
Asian 45 0.1 +71.9†
Black 54,862 98.1 -0.9†
White 237 0.4 -27.6†
Other 95 0.2 NA
Multiple 342 0.6 ND
SEX
NUMBER PERCENT 10-YR CHANGE Male 25,092 44.9 -1.8†
Female 30,836 55.1 +1.5†
Females 15-44 12,583 22.5 -10.6†
SOCIO-ECONOMIC INDICES
NUMBER PERCENT 10-YR CHANGE
Median Household Income ($) 34,238 -- NA
Below Poverty Level 11,439 20.6 +13.5†
Childhood Poverty 4,478 28.3 +2.4†
Housing Vacancies 1,685 8.4 +25.2†
Same Place of Residence for 5 Years 35,463 68.5 -2.1†
High School Graduates 25,049 72.9 +10.9†
Unemployed 3,782 16.7 +4.3†
Health Status Index Series Vol XV No II, pg. 150
< 5
5-17
18-24
25-64
65+
0 2 4 6 8 10 12 14 16 18
Age
(yea
rs)
Population (in thousands)
FemaleMale
Hispanic
NH-Asian
NH-Black
NH-White
NH-Other
NH-Multiple
0 5 10 15 20 25 30 35 40 45 50 55 60
Population (in thousands)
The reference year for 10-YR CHANGE is 1990.10-YR CHANGE is the relative percent change over time (e.g. 10% change is from 20 to 22) not the absolute percent change over time (e.g. 10% change is from 20 to 30). See methods section for more detail.
†Signifi cant difference (0.1 level)ND = No Data, data not collected in 1990 to calculate 10-YR CHANGE.NA = Appropriate data not available to calculate 10-YR CHANGE. Median Household Income is not infl ation-adjusted, 1990 and 2000 defi nitions for Other Race/Ethnicity are not the same.

2003 HEALTH MEASURES COMMUNITY AREA 71AUBURN GRESHAM
2003 ALL-CAUSE MORTALITY: 559 DEATHS,1,123 PER 100,000, 22.2%† DECREASE FROM 1993.2003 BIRTHS: 800 BIRTHS, FERTILITY RATE IS63.6 PER 1000, 20.8%† DECREASE FROM 1993.
INFECTIOUS DISEASE
NUMBER RATE 10-YR CHANGE HIV/AIDS Deaths 6 * --
AIDS Cases (ages 13 and older) 163 371.5 +207.8†
Chlamydia 794 1,419.7 ND
Gonorrhea 462 826.1 ND
Syphilis 11 19.7§ ND
Infl uenza and Pneumonia Deaths 6 * --
Tuberculosis 9 16.1§ -51.9†
Hepatitis C 60 107.3 ND
DISABILITIES (2000 CENSUS)
NUMBER PERCENT
Blind/Deaf 1,707 3.3
Physical 6,142 11.9
Mental 3,517 6.8
Requires Care 2,649 5.1
Home-Bound 6,913 16.7
Unable to Work 6,555 19.1
MATERNAL HEALTH
NUMBER PCT 10-YR CHANGE First Trimester Prenatal Care 564 70.5 +7.3†
Smoking 95 11.9 -22†
Caesarean Section 224 28 +58.1†
INFANT AND CHILD HEALTH
NUMBER RATE/PCT 10-YR CHANGE Very Low Birthweight (P) 34 4.3 11.6
Premature Birth (P) 135 16.9 +3
Fetal Mortality (R) #
Infant Mortality (R) 15 18.8§ -1.5
Lead Screening
Screened (P) 2,205 36 ND
Elevated(P) 231 10.5 ND
CANCER DEATHS
NUMBER RATE 10-YR CHANGE All-cancers 136 256.9 -25.1†
Breast 16 * --
Colon 12 * --
Lung 39 70.6 -24.3
Prostate 9 * --
UNNATURAL CAUSES OF DEATH
NUMBER RATE 10-YR CHANGE Accidents 22 40.3 -18.6
Homicide 26 49.1 +24.9
Suicide 2 * --
CHRONIC DISEASE DEATHS
NUMBER RATE 10-YR CHANGE Heart Disease 159 320.8 -33.7†
Stroke 37 83.1 +21.8
Lower Respiratory Disease 16 * --
Diabetes Mellitus 18 * --
Liver Disease and Cirrohosis 7 * --
Alzheimer’s Disease 6 * --
Health Status Index Series Vol XV No II, pg. 151
The reference year for 10-YR CHANGE is 1993. 10-YR CHANGE is the relative percent change over time (e.g. 10% change is from 20 to 22) not the absolute percent change over time (e.g. 10% change is from 20 to 30). See methods section for more detail. Calculation of 10-YR CHANGE using 1993 mortality data are comparability-adjusted.
*Rate or percent suppressed because count is less than 5 (or less than 21 for age-adjusted rates).§Use caution when interpreting data based on 20 or fewer events, the rate/percent is unreliable. See methods for more information.
†Signifi cant difference (0.1 level)ND = No Data, data not collected in 1993 to calculate 10-YR CHANGE.# = 2003 fetal mortality data not available at time of publication.
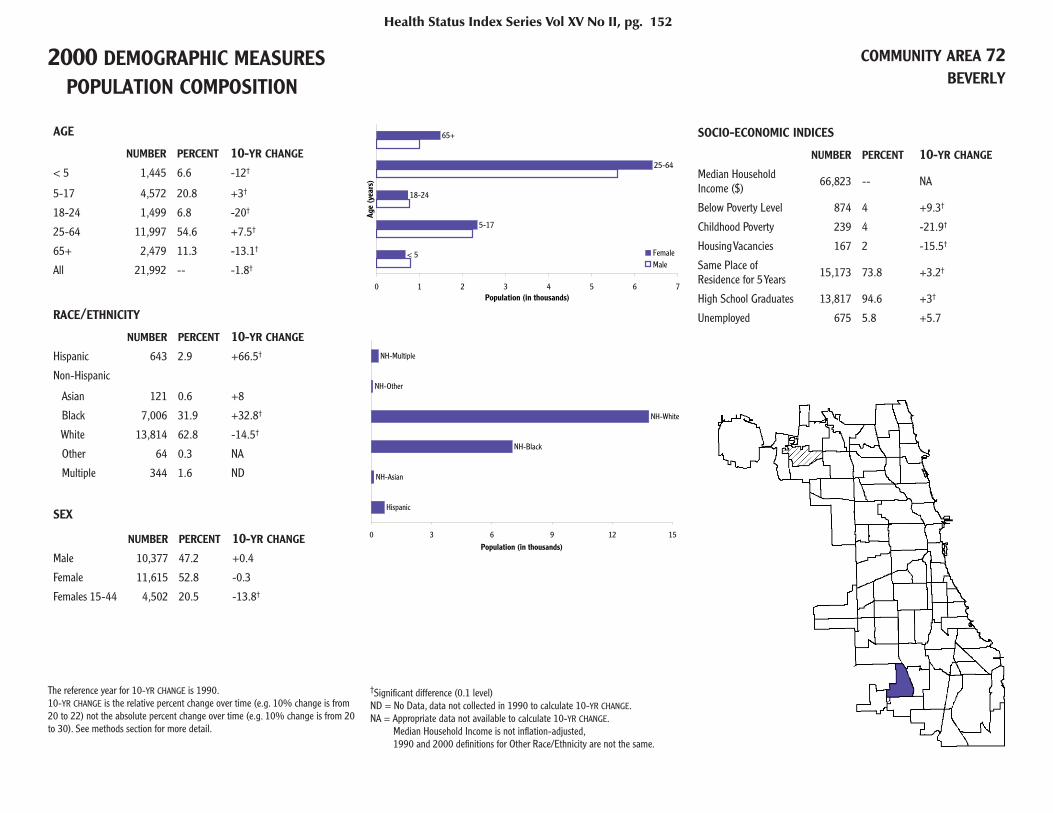
2000 DEMOGRAPHIC MEASURES POPULATION COMPOSITION
COMMUNITY AREA 72BEVERLY
AGE
NUMBER PERCENT 10-YR CHANGE < 5 1,445 6.6 -12†
5-17 4,572 20.8 +3†
18-24 1,499 6.8 -20†
25-64 11,997 54.6 +7.5†
65+ 2,479 11.3 -13.1†
All 21,992 -- -1.8†
RACE/ETHNICITY
NUMBER PERCENT 10-YR CHANGE Hispanic 643 2.9 +66.5†
Non-Hispanic
Asian 121 0.6 +8
Black 7,006 31.9 +32.8†
White 13,814 62.8 -14.5†
Other 64 0.3 NA
Multiple 344 1.6 ND
SEX
NUMBER PERCENT 10-YR CHANGE Male 10,377 47.2 +0.4
Female 11,615 52.8 -0.3
Females 15-44 4,502 20.5 -13.8†
SOCIO-ECONOMIC INDICES
NUMBER PERCENT 10-YR CHANGE
Median Household Income ($) 66,823 -- NA
Below Poverty Level 874 4 +9.3†
Childhood Poverty 239 4 -21.9†
Housing Vacancies 167 2 -15.5†
Same Place of Residence for 5 Years 15,173 73.8 +3.2†
High School Graduates 13,817 94.6 +3†
Unemployed 675 5.8 +5.7
Health Status Index Series Vol XV No II, pg. 152
< 5
5-17
18-24
25-64
65+
0 1 2 3 4 5 6 7
Age
(yea
rs)
Population (in thousands)
FemaleMale
Hispanic
NH-Asian
NH-Black
NH-White
NH-Other
NH-Multiple
0 3 6 9 12 15
Population (in thousands)
The reference year for 10-YR CHANGE is 1990.10-YR CHANGE is the relative percent change over time (e.g. 10% change is from 20 to 22) not the absolute percent change over time (e.g. 10% change is from 20 to 30). See methods section for more detail.
†Signifi cant difference (0.1 level)ND = No Data, data not collected in 1990 to calculate 10-YR CHANGE.NA = Appropriate data not available to calculate 10-YR CHANGE. Median Household Income is not infl ation-adjusted, 1990 and 2000 defi nitions for Other Race/Ethnicity are not the same.

2003 HEALTH MEASURES COMMUNITY AREA 72BEVERLY
2003 ALL-CAUSE MORTALITY: 167 DEATHS,802 PER 100,000, 17.1%† DECREASE FROM 1993.2003 BIRTHS: 260 BIRTHS, FERTILITY RATE IS57.8 PER 1000, 9.9%† DECREASE FROM 1993.
INFECTIOUS DISEASE
NUMBER RATE 10-YR CHANGE HIV/AIDS Deaths 0 * --
AIDS Cases (ages 13 and older) 18 101.1§ +100.7†
Chlamydia 71 322.8 ND
Gonorrhea 29 131.9 ND
Syphilis < 5 * ND
Infl uenza and Pneumonia Deaths 7 * --
Tuberculosis 1 * --
Hepatitis C 10 45.5§ ND
DISABILITIES (2000 CENSUS)
NUMBER PERCENT
Blind/Deaf 494 2.4
Physical 1,151 5.6
Mental 629 3.1
Requires Care 489 2.4
Home-Bound 852 5.1
Unable to Work 912 6.4
MATERNAL HEALTH
NUMBER PCT 10-YR CHANGE First Trimester Prenatal Care 237 91.2 +1.9
Smoking 16 6.2§ -40†
Caesarean Section 92 35.4 +42†
INFANT AND CHILD HEALTH
NUMBER RATE/PCT 10-YR CHANGE Very Low Birthweight (P) 9 3.5§ +68.6
Premature Birth (P) 41 15.8 +92†
Fetal Mortality (R) #
Infant Mortality (R) 4 * --
Lead Screening
Screened (P) 382 18.5 ND
Elevated(P) 8 2.1§ ND
CANCER DEATHS
NUMBER RATE 10-YR CHANGE All-cancers 30 139.4 -44.4†
Breast 4 * --
Colon 5 * --
Lung 7 * --
Prostate 1 * --
UNNATURAL CAUSES OF DEATH
NUMBER RATE 10-YR CHANGE Accidents 6 * --
Homicide 2 * --
Suicide 1 * --
CHRONIC DISEASE DEATHS
NUMBER RATE 10-YR CHANGE Heart Disease 51 243 -11.5
Stroke 9 * --
Lower Respiratory Disease 8 * --
Diabetes Mellitus 4 * --
Liver Disease and Cirrohosis 2 * --
Alzheimer’s Disease 3 * --
Health Status Index Series Vol XV No II, pg. 153
The reference year for 10-YR CHANGE is 1993. 10-YR CHANGE is the relative percent change over time (e.g. 10% change is from 20 to 22) not the absolute percent change over time (e.g. 10% change is from 20 to 30). See methods section for more detail. Calculation of 10-YR CHANGE using 1993 mortality data are comparability-adjusted.
*Rate or percent suppressed because count is less than 5 (or less than 21 for age-adjusted rates).§Use caution when interpreting data based on 20 or fewer events, the rate/percent is unreliable. See methods for more information.
†Signifi cant difference (0.1 level)ND = No Data, data not collected in 1993 to calculate 10-YR CHANGE.# = 2003 fetal mortality data not available at time of publication.
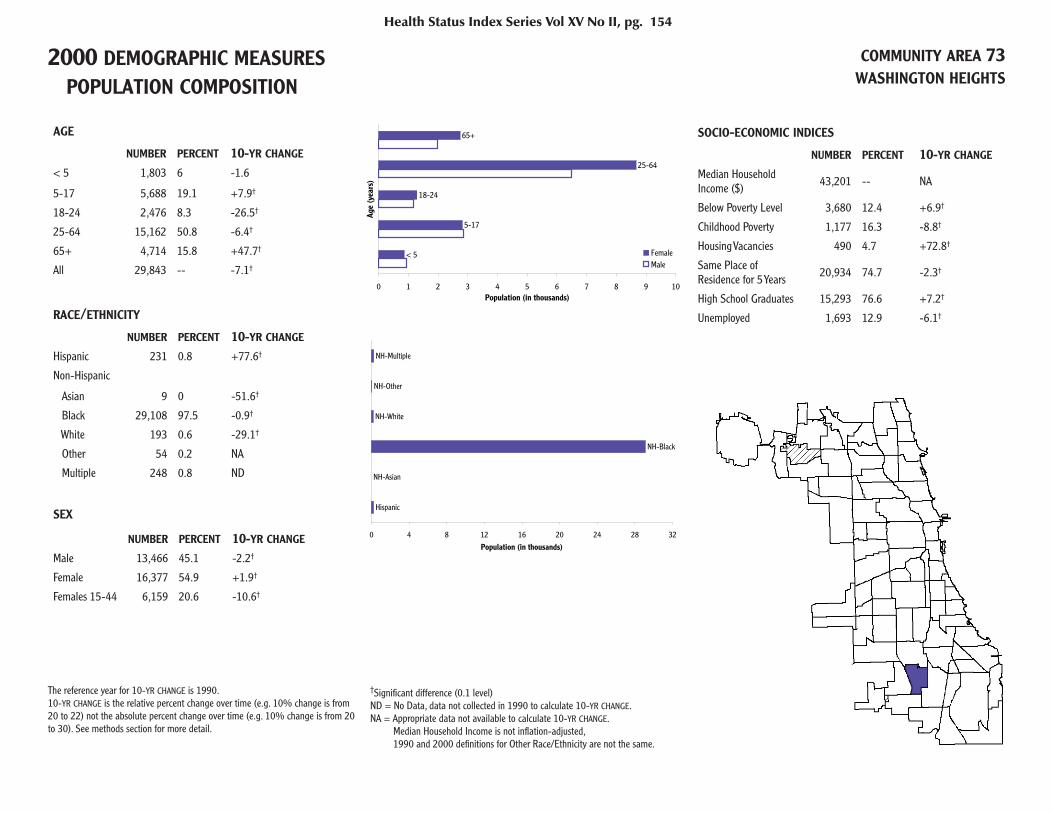
2000 DEMOGRAPHIC MEASURES POPULATION COMPOSITION
COMMUNITY AREA 73WASHINGTON HEIGHTS
AGE
NUMBER PERCENT 10-YR CHANGE < 5 1,803 6 -1.6
5-17 5,688 19.1 +7.9†
18-24 2,476 8.3 -26.5†
25-64 15,162 50.8 -6.4†
65+ 4,714 15.8 +47.7†
All 29,843 -- -7.1†
RACE/ETHNICITY
NUMBER PERCENT 10-YR CHANGE Hispanic 231 0.8 +77.6†
Non-Hispanic
Asian 9 0 -51.6†
Black 29,108 97.5 -0.9†
White 193 0.6 -29.1†
Other 54 0.2 NA
Multiple 248 0.8 ND
SEX
NUMBER PERCENT 10-YR CHANGE Male 13,466 45.1 -2.2†
Female 16,377 54.9 +1.9†
Females 15-44 6,159 20.6 -10.6†
SOCIO-ECONOMIC INDICES
NUMBER PERCENT 10-YR CHANGE
Median Household Income ($) 43,201 -- NA
Below Poverty Level 3,680 12.4 +6.9†
Childhood Poverty 1,177 16.3 -8.8†
Housing Vacancies 490 4.7 +72.8†
Same Place of Residence for 5 Years 20,934 74.7 -2.3†
High School Graduates 15,293 76.6 +7.2†
Unemployed 1,693 12.9 -6.1†
Health Status Index Series Vol XV No II, pg. 154
< 5
5-17
18-24
25-64
65+
0 1 2 3 4 5 6 7 8 9 10
Age
(yea
rs)
Population (in thousands)
FemaleMale
Hispanic
NH-Asian
NH-Black
NH-White
NH-Other
NH-Multiple
0 4 8 12 16 20 24 28 32
Population (in thousands)
The reference year for 10-YR CHANGE is 1990.10-YR CHANGE is the relative percent change over time (e.g. 10% change is from 20 to 22) not the absolute percent change over time (e.g. 10% change is from 20 to 30). See methods section for more detail.
†Signifi cant difference (0.1 level)ND = No Data, data not collected in 1990 to calculate 10-YR CHANGE.NA = Appropriate data not available to calculate 10-YR CHANGE. Median Household Income is not infl ation-adjusted, 1990 and 2000 defi nitions for Other Race/Ethnicity are not the same.
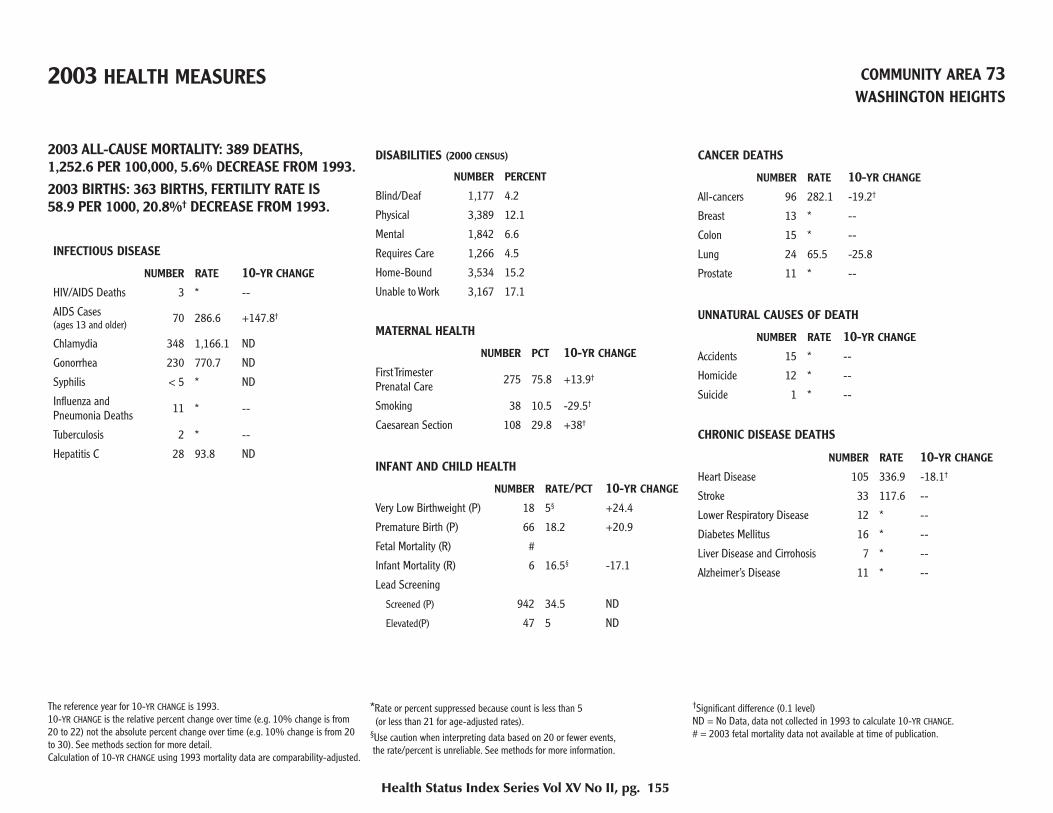
2003 HEALTH MEASURES COMMUNITY AREA 73WASHINGTON HEIGHTS
2003 ALL-CAUSE MORTALITY: 389 DEATHS,1,252.6 PER 100,000, 5.6% DECREASE FROM 1993.2003 BIRTHS: 363 BIRTHS, FERTILITY RATE IS58.9 PER 1000, 20.8%† DECREASE FROM 1993.
INFECTIOUS DISEASE
NUMBER RATE 10-YR CHANGE HIV/AIDS Deaths 3 * --
AIDS Cases(ages 13 and older) 70 286.6 +147.8†
Chlamydia 348 1,166.1 ND
Gonorrhea 230 770.7 ND
Syphilis < 5 * ND
Infl uenza and Pneumonia Deaths 11 * --
Tuberculosis 2 * --
Hepatitis C 28 93.8 ND
DISABILITIES (2000 CENSUS)
NUMBER PERCENT
Blind/Deaf 1,177 4.2
Physical 3,389 12.1
Mental 1,842 6.6
Requires Care 1,266 4.5
Home-Bound 3,534 15.2
Unable to Work 3,167 17.1
MATERNAL HEALTH
NUMBER PCT 10-YR CHANGE First Trimester Prenatal Care 275 75.8 +13.9†
Smoking 38 10.5 -29.5†
Caesarean Section 108 29.8 +38†
INFANT AND CHILD HEALTH
NUMBER RATE/PCT 10-YR CHANGE Very Low Birthweight (P) 18 5§ +24.4
Premature Birth (P) 66 18.2 +20.9
Fetal Mortality (R) #
Infant Mortality (R) 6 16.5§ -17.1
Lead Screening
Screened (P) 942 34.5 ND
Elevated(P) 47 5 ND
CANCER DEATHS
NUMBER RATE 10-YR CHANGE All-cancers 96 282.1 -19.2†
Breast 13 * --
Colon 15 * --
Lung 24 65.5 -25.8
Prostate 11 * --
UNNATURAL CAUSES OF DEATH
NUMBER RATE 10-YR CHANGE Accidents 15 * --
Homicide 12 * --
Suicide 1 * --
CHRONIC DISEASE DEATHS
NUMBER RATE 10-YR CHANGE Heart Disease 105 336.9 -18.1†
Stroke 33 117.6 --
Lower Respiratory Disease 12 * --
Diabetes Mellitus 16 * --
Liver Disease and Cirrohosis 7 * --
Alzheimer’s Disease 11 * --
Health Status Index Series Vol XV No II, pg. 155
The reference year for 10-YR CHANGE is 1993. 10-YR CHANGE is the relative percent change over time (e.g. 10% change is from 20 to 22) not the absolute percent change over time (e.g. 10% change is from 20 to 30). See methods section for more detail. Calculation of 10-YR CHANGE using 1993 mortality data are comparability-adjusted.
*Rate or percent suppressed because count is less than 5 (or less than 21 for age-adjusted rates).§Use caution when interpreting data based on 20 or fewer events, the rate/percent is unreliable. See methods for more information.
†Signifi cant difference (0.1 level)ND = No Data, data not collected in 1993 to calculate 10-YR CHANGE.# = 2003 fetal mortality data not available at time of publication.
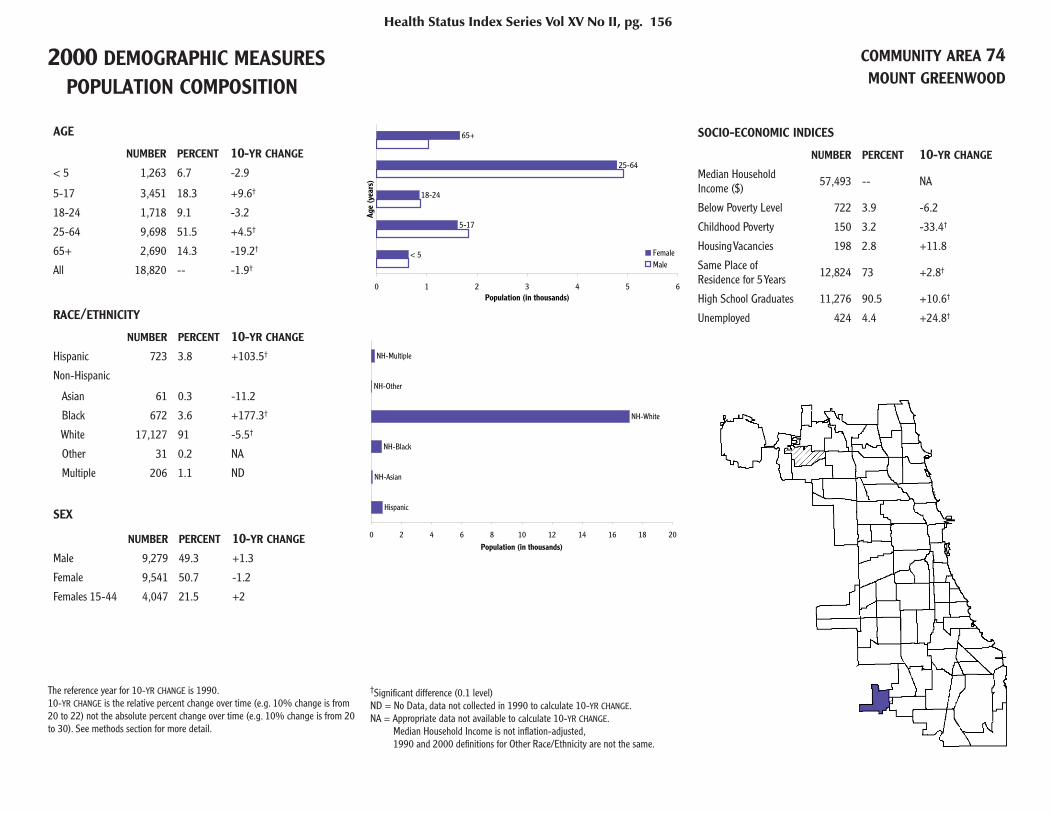
2000 DEMOGRAPHIC MEASURES POPULATION COMPOSITION
COMMUNITY AREA 74MOUNT GREENWOOD
AGE
NUMBER PERCENT 10-YR CHANGE < 5 1,263 6.7 -2.9
5-17 3,451 18.3 +9.6†
18-24 1,718 9.1 -3.2
25-64 9,698 51.5 +4.5†
65+ 2,690 14.3 -19.2†
All 18,820 -- -1.9†
RACE/ETHNICITY
NUMBER PERCENT 10-YR CHANGE Hispanic 723 3.8 +103.5†
Non-Hispanic
Asian 61 0.3 -11.2
Black 672 3.6 +177.3†
White 17,127 91 -5.5†
Other 31 0.2 NA
Multiple 206 1.1 ND
SEX
NUMBER PERCENT 10-YR CHANGE Male 9,279 49.3 +1.3
Female 9,541 50.7 -1.2
Females 15-44 4,047 21.5 +2
SOCIO-ECONOMIC INDICES
NUMBER PERCENT 10-YR CHANGE
Median Household Income ($) 57,493 -- NA
Below Poverty Level 722 3.9 -6.2
Childhood Poverty 150 3.2 -33.4†
Housing Vacancies 198 2.8 +11.8
Same Place of Residence for 5 Years 12,824 73 +2.8†
High School Graduates 11,276 90.5 +10.6†
Unemployed 424 4.4 +24.8†
Health Status Index Series Vol XV No II, pg. 156
< 5
5-17
18-24
25-64
65+
0 1 2 3 4 5 6
Age
(yea
rs)
Population (in thousands)
FemaleMale
Hispanic
NH-Asian
NH-Black
NH-White
NH-Other
NH-Multiple
0 2 4 6 8 10 12 14 16 18 20
Population (in thousands)
The reference year for 10-YR CHANGE is 1990.10-YR CHANGE is the relative percent change over time (e.g. 10% change is from 20 to 22) not the absolute percent change over time (e.g. 10% change is from 20 to 30). See methods section for more detail.
†Signifi cant difference (0.1 level)ND = No Data, data not collected in 1990 to calculate 10-YR CHANGE.NA = Appropriate data not available to calculate 10-YR CHANGE. Median Household Income is not infl ation-adjusted, 1990 and 2000 defi nitions for Other Race/Ethnicity are not the same.
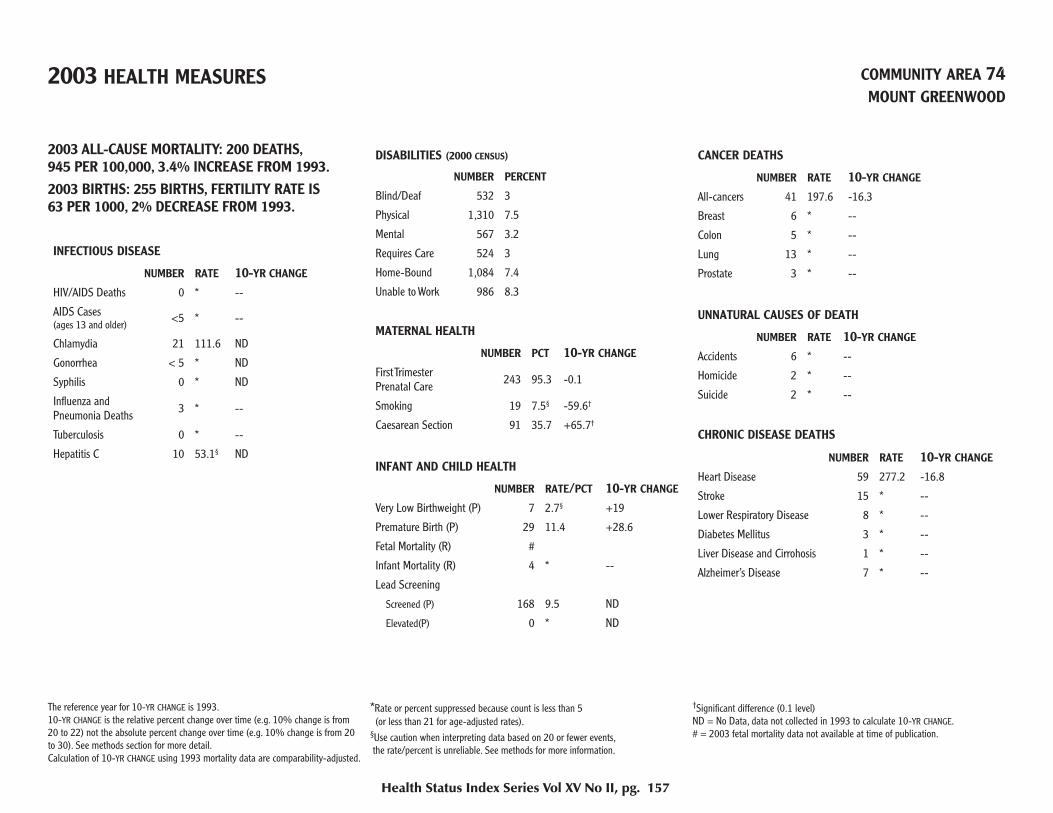
2003 HEALTH MEASURES COMMUNITY AREA 74MOUNT GREENWOOD
2003 ALL-CAUSE MORTALITY: 200 DEATHS,945 PER 100,000, 3.4% INCREASE FROM 1993.2003 BIRTHS: 255 BIRTHS, FERTILITY RATE IS63 PER 1000, 2% DECREASE FROM 1993.
INFECTIOUS DISEASE
NUMBER RATE 10-YR CHANGE HIV/AIDS Deaths 0 * --
AIDS Cases (ages 13 and older) <5 * --
Chlamydia 21 111.6 ND
Gonorrhea < 5 * ND
Syphilis 0 * ND
Infl uenza and Pneumonia Deaths 3 * --
Tuberculosis 0 * --
Hepatitis C 10 53.1§ ND
DISABILITIES (2000 CENSUS)
NUMBER PERCENT
Blind/Deaf 532 3
Physical 1,310 7.5
Mental 567 3.2
Requires Care 524 3
Home-Bound 1,084 7.4
Unable to Work 986 8.3
MATERNAL HEALTH
NUMBER PCT 10-YR CHANGE First Trimester Prenatal Care 243 95.3 -0.1
Smoking 19 7.5§ -59.6†
Caesarean Section 91 35.7 +65.7†
INFANT AND CHILD HEALTH
NUMBER RATE/PCT 10-YR CHANGE Very Low Birthweight (P) 7 2.7§ +19
Premature Birth (P) 29 11.4 +28.6
Fetal Mortality (R) #
Infant Mortality (R) 4 * --
Lead Screening
Screened (P) 168 9.5 ND
Elevated(P) 0 * ND
CANCER DEATHS
NUMBER RATE 10-YR CHANGE All-cancers 41 197.6 -16.3
Breast 6 * --
Colon 5 * --
Lung 13 * --
Prostate 3 * --
UNNATURAL CAUSES OF DEATH
NUMBER RATE 10-YR CHANGE Accidents 6 * --
Homicide 2 * --
Suicide 2 * --
CHRONIC DISEASE DEATHS
NUMBER RATE 10-YR CHANGE Heart Disease 59 277.2 -16.8
Stroke 15 * --
Lower Respiratory Disease 8 * --
Diabetes Mellitus 3 * --
Liver Disease and Cirrohosis 1 * --
Alzheimer’s Disease 7 * --
Health Status Index Series Vol XV No II, pg. 157
The reference year for 10-YR CHANGE is 1993. 10-YR CHANGE is the relative percent change over time (e.g. 10% change is from 20 to 22) not the absolute percent change over time (e.g. 10% change is from 20 to 30). See methods section for more detail. Calculation of 10-YR CHANGE using 1993 mortality data are comparability-adjusted.
*Rate or percent suppressed because count is less than 5 (or less than 21 for age-adjusted rates).§Use caution when interpreting data based on 20 or fewer events, the rate/percent is unreliable. See methods for more information.
†Signifi cant difference (0.1 level)ND = No Data, data not collected in 1993 to calculate 10-YR CHANGE.# = 2003 fetal mortality data not available at time of publication.
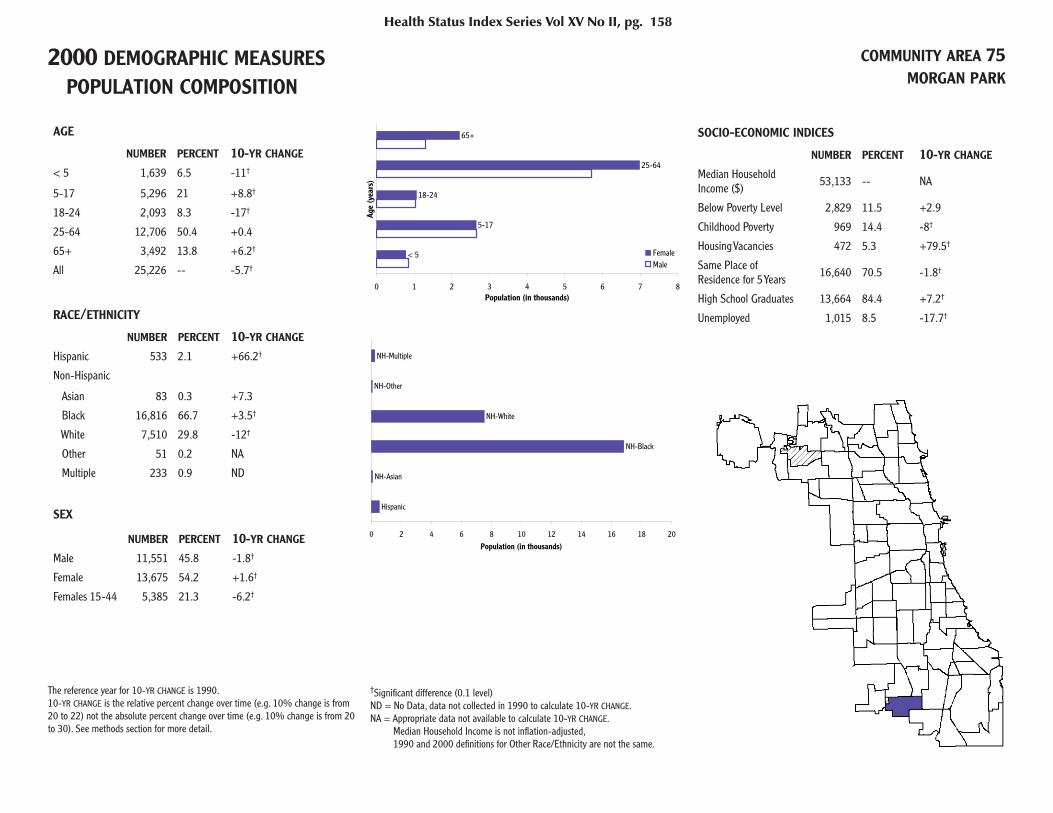
2000 DEMOGRAPHIC MEASURES POPULATION COMPOSITION
COMMUNITY AREA 75MORGAN PARK
AGE
NUMBER PERCENT 10-YR CHANGE < 5 1,639 6.5 -11†
5-17 5,296 21 +8.8†
18-24 2,093 8.3 -17†
25-64 12,706 50.4 +0.4
65+ 3,492 13.8 +6.2†
All 25,226 -- -5.7†
RACE/ETHNICITY
NUMBER PERCENT 10-YR CHANGE Hispanic 533 2.1 +66.2†
Non-Hispanic
Asian 83 0.3 +7.3
Black 16,816 66.7 +3.5†
White 7,510 29.8 -12†
Other 51 0.2 NA
Multiple 233 0.9 ND
SEX
NUMBER PERCENT 10-YR CHANGE Male 11,551 45.8 -1.8†
Female 13,675 54.2 +1.6†
Females 15-44 5,385 21.3 -6.2†
SOCIO-ECONOMIC INDICES
NUMBER PERCENT 10-YR CHANGE
Median Household Income ($) 53,133 -- NA
Below Poverty Level 2,829 11.5 +2.9
Childhood Poverty 969 14.4 -8†
Housing Vacancies 472 5.3 +79.5†
Same Place of Residence for 5 Years 16,640 70.5 -1.8†
High School Graduates 13,664 84.4 +7.2†
Unemployed 1,015 8.5 -17.7†
Health Status Index Series Vol XV No II, pg. 158
< 5
5-17
18-24
25-64
65+
0 1 2 3 4 5 6 7 8
Age
(yea
rs)
Population (in thousands)
FemaleMale
Hispanic
NH-Asian
NH-Black
NH-White
NH-Other
NH-Multiple
0 2 4 6 8 10 12 14 16 18 20
Population (in thousands)
The reference year for 10-YR CHANGE is 1990.10-YR CHANGE is the relative percent change over time (e.g. 10% change is from 20 to 22) not the absolute percent change over time (e.g. 10% change is from 20 to 30). See methods section for more detail.
†Signifi cant difference (0.1 level)ND = No Data, data not collected in 1990 to calculate 10-YR CHANGE.NA = Appropriate data not available to calculate 10-YR CHANGE. Median Household Income is not infl ation-adjusted, 1990 and 2000 defi nitions for Other Race/Ethnicity are not the same.

2003 HEALTH MEASURES COMMUNITY AREA 75MORGAN PARK
2003 ALL-CAUSE MORTALITY: 280 DEATHS,1,010.2 PER 100,000, 11.5%† DECREASE FROM 1993.2003 BIRTHS: 315 BIRTHS, FERTILITY RATE IS58.5 PER 1000, 28.1%† DECREASE FROM 1993.
INFECTIOUS DISEASE
NUMBER RATE 10-YR CHANGE HIV/AIDS Deaths 3 * --
AIDS Cases (ages 13 and older) 46 226.8 +188.6†
Chlamydia 201 796.8 ND
Gonorrhea 149 590.7 ND
Syphilis < 5 * ND
Infl uenza and Pneumonia Deaths 11 * --
Tuberculosis 4 * --
Hepatitis C 15 59.5§ ND
DISABILITIES (2000 CENSUS)
NUMBER PERCENT
Blind/Deaf 762 3.2
Physical 2,016 8.5
Mental 1,129 4.8
Requires Care 674 2.9
Home-Bound 2,032 10.6
Unable to Work 2,269 14.5
MATERNAL HEALTH
NUMBER PCT 10-YR CHANGE First Trimester Prenatal Care 267 84.8 +7.9†
Smoking 21 6.7 -49.2†
Caesarean Section 98 31.1 +57.1†
INFANT AND CHILD HEALTH
NUMBER RATE/PCT 10-YR CHANGE Very Low Birthweight (P) 18 5.7§ +157.1†
Premature Birth (P) 46 14.6 +14.7
Fetal Mortality (R) #
Infant Mortality (R) 1 * --
Lead Screening
Screened (P) 538 22.2 ND
Elevated(P) 25 4.6 ND
CANCER DEATHS
NUMBER RATE 10-YR CHANGE All-cancers 74 271 -5.4
Breast 3 * --
Colon 9 * --
Lung 23 84.3 -13.9
Prostate 6 * --
UNNATURAL CAUSES OF DEATH
NUMBER RATE 10-YR CHANGE Accidents 9 * --
Homicide 5 * --
Suicide 1 * --
CHRONIC DISEASE DEATHS
NUMBER RATE 10-YR CHANGE Heart Disease 75 273.1 -30.1†
Stroke 17 * --
Lower Respiratory Disease 7 * --
Diabetes Mellitus 6 * --
Liver Disease and Cirrohosis 2 * --
Alzheimer’s Disease 10 * --
Health Status Index Series Vol XV No II, pg. 159
The reference year for 10-YR CHANGE is 1993. 10-YR CHANGE is the relative percent change over time (e.g. 10% change is from 20 to 22) not the absolute percent change over time (e.g. 10% change is from 20 to 30). See methods section for more detail. Calculation of 10-YR CHANGE using 1993 mortality data are comparability-adjusted.
*Rate or percent suppressed because count is less than 5 (or less than 21 for age-adjusted rates).§Use caution when interpreting data based on 20 or fewer events, the rate/percent is unreliable. See methods for more information.
†Signifi cant difference (0.1 level)ND = No Data, data not collected in 1993 to calculate 10-YR CHANGE.# = 2003 fetal mortality data not available at time of publication.
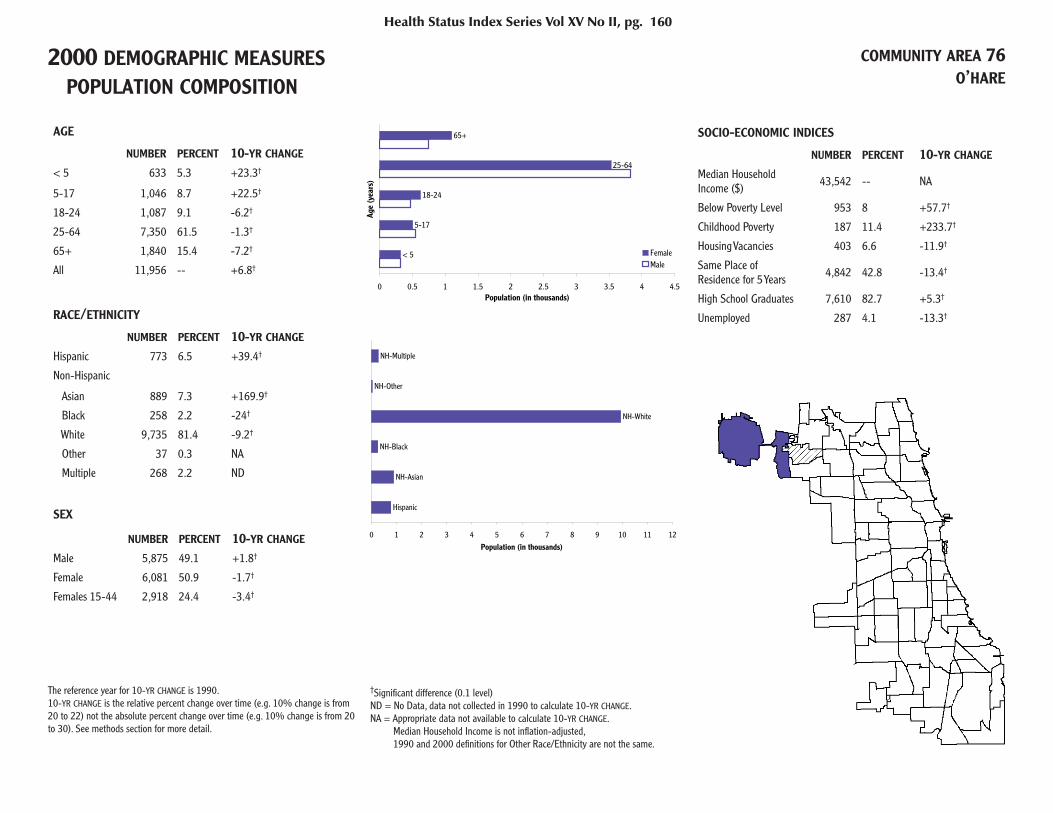
2000 DEMOGRAPHIC MEASURES POPULATION COMPOSITION
COMMUNITY AREA 76O’HARE
AGE
NUMBER PERCENT 10-YR CHANGE < 5 633 5.3 +23.3†
5-17 1,046 8.7 +22.5†
18-24 1,087 9.1 -6.2†
25-64 7,350 61.5 -1.3†
65+ 1,840 15.4 -7.2†
All 11,956 -- +6.8†
RACE/ETHNICITY
NUMBER PERCENT 10-YR CHANGE Hispanic 773 6.5 +39.4†
Non-Hispanic
Asian 889 7.3 +169.9†
Black 258 2.2 -24†
White 9,735 81.4 -9.2†
Other 37 0.3 NA
Multiple 268 2.2 ND
SEX
NUMBER PERCENT 10-YR CHANGE Male 5,875 49.1 +1.8†
Female 6,081 50.9 -1.7†
Females 15-44 2,918 24.4 -3.4†
SOCIO-ECONOMIC INDICES
NUMBER PERCENT 10-YR CHANGE
Median Household Income ($) 43,542 -- NA
Below Poverty Level 953 8 +57.7†
Childhood Poverty 187 11.4 +233.7†
Housing Vacancies 403 6.6 -11.9†
Same Place of Residence for 5 Years 4,842 42.8 -13.4†
High School Graduates 7,610 82.7 +5.3†
Unemployed 287 4.1 -13.3†
Health Status Index Series Vol XV No II, pg. 160
< 5
5-17
18-24
25-64
65+
0 0.5 1 1.5 2 2.5 3 3.5 4 4.5
Age
(yea
rs)
Population (in thousands)
FemaleMale
Hispanic
NH-Asian
NH-Black
NH-White
NH-Other
NH-Multiple
0 1 2 3 4 5 6 7 8 9 10 11 12
Population (in thousands)
The reference year for 10-YR CHANGE is 1990.10-YR CHANGE is the relative percent change over time (e.g. 10% change is from 20 to 22) not the absolute percent change over time (e.g. 10% change is from 20 to 30). See methods section for more detail.
†Signifi cant difference (0.1 level)ND = No Data, data not collected in 1990 to calculate 10-YR CHANGE.NA = Appropriate data not available to calculate 10-YR CHANGE. Median Household Income is not infl ation-adjusted, 1990 and 2000 defi nitions for Other Race/Ethnicity are not the same.
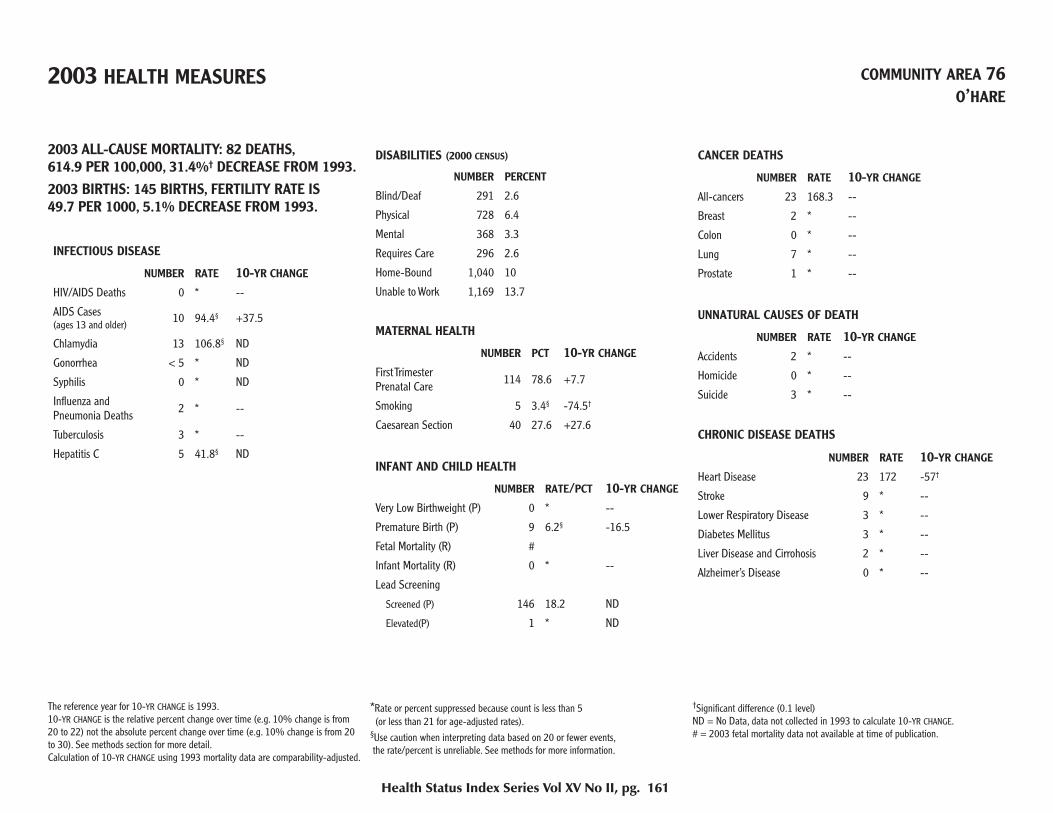
2003 HEALTH MEASURES COMMUNITY AREA 76O’HARE
2003 ALL-CAUSE MORTALITY: 82 DEATHS,614.9 PER 100,000, 31.4%† DECREASE FROM 1993.2003 BIRTHS: 145 BIRTHS, FERTILITY RATE IS49.7 PER 1000, 5.1% DECREASE FROM 1993.
INFECTIOUS DISEASE
NUMBER RATE 10-YR CHANGE HIV/AIDS Deaths 0 * --
AIDS Cases (ages 13 and older) 10 94.4§ +37.5
Chlamydia 13 106.8§ ND
Gonorrhea < 5 * ND
Syphilis 0 * ND
Infl uenza and Pneumonia Deaths 2 * --
Tuberculosis 3 * --
Hepatitis C 5 41.8§ ND
DISABILITIES (2000 CENSUS)
NUMBER PERCENT
Blind/Deaf 291 2.6
Physical 728 6.4
Mental 368 3.3
Requires Care 296 2.6
Home-Bound 1,040 10
Unable to Work 1,169 13.7
MATERNAL HEALTH
NUMBER PCT 10-YR CHANGE First Trimester Prenatal Care 114 78.6 +7.7
Smoking 5 3.4§ -74.5†
Caesarean Section 40 27.6 +27.6
INFANT AND CHILD HEALTH
NUMBER RATE/PCT 10-YR CHANGE Very Low Birthweight (P) 0 * --
Premature Birth (P) 9 6.2§ -16.5
Fetal Mortality (R) #
Infant Mortality (R) 0 * --
Lead Screening
Screened (P) 146 18.2 ND
Elevated(P) 1 * ND
CANCER DEATHS
NUMBER RATE 10-YR CHANGE All-cancers 23 168.3 --
Breast 2 * --
Colon 0 * --
Lung 7 * --
Prostate 1 * --
UNNATURAL CAUSES OF DEATH
NUMBER RATE 10-YR CHANGE Accidents 2 * --
Homicide 0 * --
Suicide 3 * --
CHRONIC DISEASE DEATHS
NUMBER RATE 10-YR CHANGE Heart Disease 23 172 -57†
Stroke 9 * --
Lower Respiratory Disease 3 * --
Diabetes Mellitus 3 * --
Liver Disease and Cirrohosis 2 * --
Alzheimer’s Disease 0 * --
Health Status Index Series Vol XV No II, pg. 161
The reference year for 10-YR CHANGE is 1993. 10-YR CHANGE is the relative percent change over time (e.g. 10% change is from 20 to 22) not the absolute percent change over time (e.g. 10% change is from 20 to 30). See methods section for more detail. Calculation of 10-YR CHANGE using 1993 mortality data are comparability-adjusted.
*Rate or percent suppressed because count is less than 5 (or less than 21 for age-adjusted rates).§Use caution when interpreting data based on 20 or fewer events, the rate/percent is unreliable. See methods for more information.
†Signifi cant difference (0.1 level)ND = No Data, data not collected in 1993 to calculate 10-YR CHANGE.# = 2003 fetal mortality data not available at time of publication.
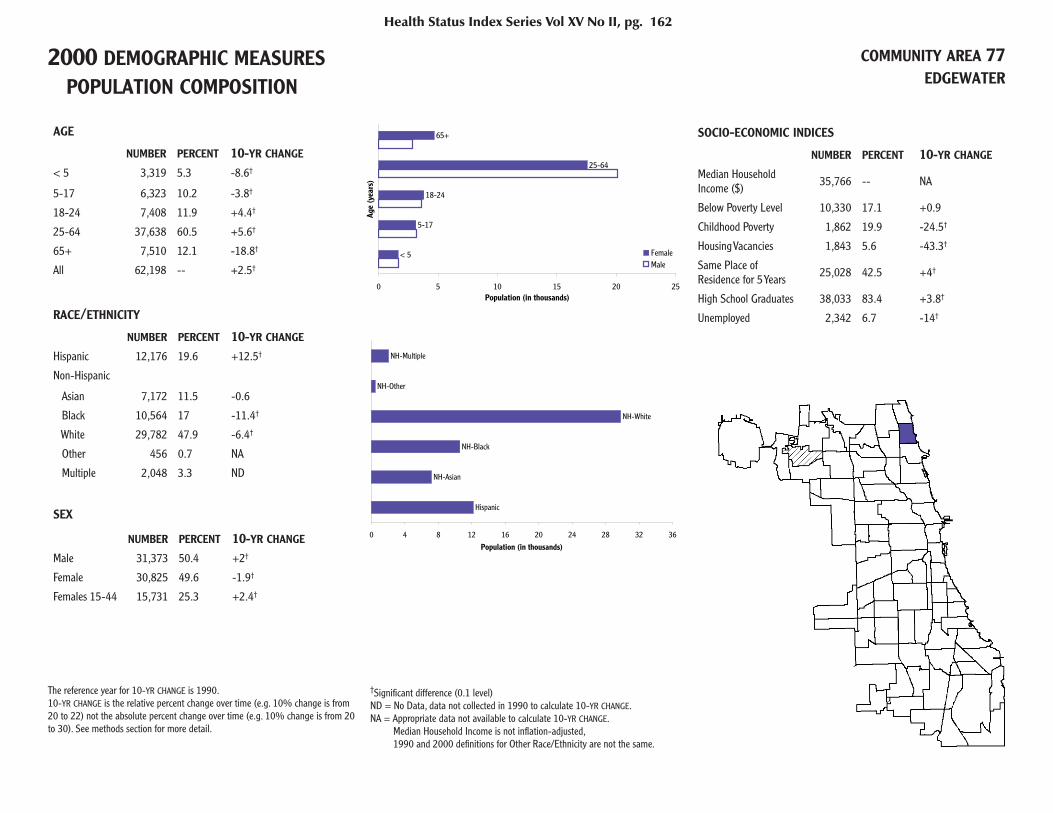
2000 DEMOGRAPHIC MEASURES POPULATION COMPOSITION
COMMUNITY AREA 77EDGEWATER
AGE
NUMBER PERCENT 10-YR CHANGE < 5 3,319 5.3 -8.6†
5-17 6,323 10.2 -3.8†
18-24 7,408 11.9 +4.4†
25-64 37,638 60.5 +5.6†
65+ 7,510 12.1 -18.8†
All 62,198 -- +2.5†
RACE/ETHNICITY
NUMBER PERCENT 10-YR CHANGE Hispanic 12,176 19.6 +12.5†
Non-Hispanic
Asian 7,172 11.5 -0.6
Black 10,564 17 -11.4†
White 29,782 47.9 -6.4†
Other 456 0.7 NA
Multiple 2,048 3.3 ND
SEX
NUMBER PERCENT 10-YR CHANGE Male 31,373 50.4 +2†
Female 30,825 49.6 -1.9†
Females 15-44 15,731 25.3 +2.4†
SOCIO-ECONOMIC INDICES
NUMBER PERCENT 10-YR CHANGE
Median Household Income ($) 35,766 -- NA
Below Poverty Level 10,330 17.1 +0.9
Childhood Poverty 1,862 19.9 -24.5†
Housing Vacancies 1,843 5.6 -43.3†
Same Place of Residence for 5 Years 25,028 42.5 +4†
High School Graduates 38,033 83.4 +3.8†
Unemployed 2,342 6.7 -14†
Health Status Index Series Vol XV No II, pg. 162
< 5
5-17
18-24
25-64
65+
0 5 10 15 20 25
Age
(yea
rs)
Population (in thousands)
FemaleMale
Hispanic
NH-Asian
NH-Black
NH-White
NH-Other
NH-Multiple
0 4 8 12 16 20 24 28 32 36
Population (in thousands)
The reference year for 10-YR CHANGE is 1990.10-YR CHANGE is the relative percent change over time (e.g. 10% change is from 20 to 22) not the absolute percent change over time (e.g. 10% change is from 20 to 30). See methods section for more detail.
†Signifi cant difference (0.1 level)ND = No Data, data not collected in 1990 to calculate 10-YR CHANGE.NA = Appropriate data not available to calculate 10-YR CHANGE. Median Household Income is not infl ation-adjusted, 1990 and 2000 defi nitions for Other Race/Ethnicity are not the same.
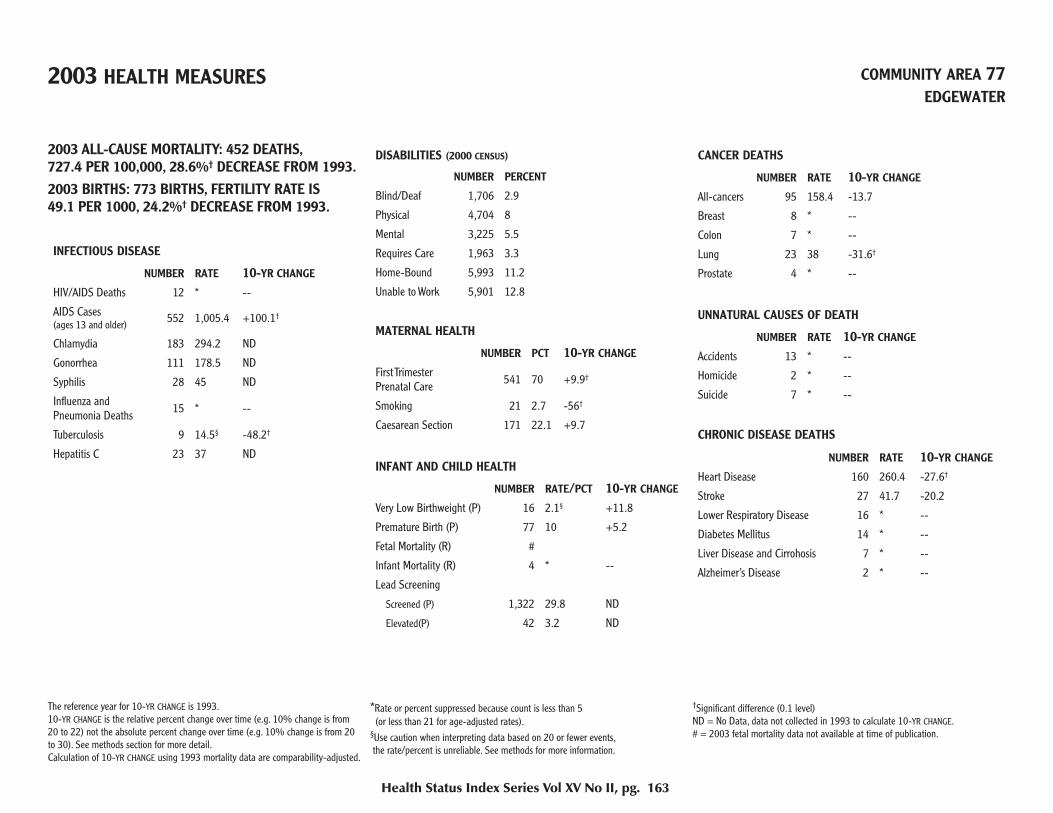
2003 HEALTH MEASURES COMMUNITY AREA 77EDGEWATER
2003 ALL-CAUSE MORTALITY: 452 DEATHS,727.4 PER 100,000, 28.6%† DECREASE FROM 1993.2003 BIRTHS: 773 BIRTHS, FERTILITY RATE IS49.1 PER 1000, 24.2%† DECREASE FROM 1993.
INFECTIOUS DISEASE
NUMBER RATE 10-YR CHANGE HIV/AIDS Deaths 12 * --
AIDS Cases (ages 13 and older) 552 1,005.4 +100.1†
Chlamydia 183 294.2 ND
Gonorrhea 111 178.5 ND
Syphilis 28 45 ND
Infl uenza and Pneumonia Deaths 15 * --
Tuberculosis 9 14.5§ -48.2†
Hepatitis C 23 37 ND
DISABILITIES (2000 CENSUS)
NUMBER PERCENT
Blind/Deaf 1,706 2.9
Physical 4,704 8
Mental 3,225 5.5
Requires Care 1,963 3.3
Home-Bound 5,993 11.2
Unable to Work 5,901 12.8
MATERNAL HEALTH
NUMBER PCT 10-YR CHANGE First Trimester Prenatal Care 541 70 +9.9†
Smoking 21 2.7 -56†
Caesarean Section 171 22.1 +9.7
INFANT AND CHILD HEALTH
NUMBER RATE/PCT 10-YR CHANGE Very Low Birthweight (P) 16 2.1§ +11.8
Premature Birth (P) 77 10 +5.2
Fetal Mortality (R) #
Infant Mortality (R) 4 * --
Lead Screening
Screened (P) 1,322 29.8 ND
Elevated(P) 42 3.2 ND
CANCER DEATHS
NUMBER RATE 10-YR CHANGE All-cancers 95 158.4 -13.7
Breast 8 * --
Colon 7 * --
Lung 23 38 -31.6†
Prostate 4 * --
UNNATURAL CAUSES OF DEATH
NUMBER RATE 10-YR CHANGE Accidents 13 * --
Homicide 2 * --
Suicide 7 * --
CHRONIC DISEASE DEATHS
NUMBER RATE 10-YR CHANGE Heart Disease 160 260.4 -27.6†
Stroke 27 41.7 -20.2
Lower Respiratory Disease 16 * --
Diabetes Mellitus 14 * --
Liver Disease and Cirrohosis 7 * --
Alzheimer’s Disease 2 * --
Health Status Index Series Vol XV No II, pg. 163
The reference year for 10-YR CHANGE is 1993. 10-YR CHANGE is the relative percent change over time (e.g. 10% change is from 20 to 22) not the absolute percent change over time (e.g. 10% change is from 20 to 30). See methods section for more detail. Calculation of 10-YR CHANGE using 1993 mortality data are comparability-adjusted.
*Rate or percent suppressed because count is less than 5 (or less than 21 for age-adjusted rates).§Use caution when interpreting data based on 20 or fewer events, the rate/percent is unreliable. See methods for more information.
†Signifi cant difference (0.1 level)ND = No Data, data not collected in 1993 to calculate 10-YR CHANGE.# = 2003 fetal mortality data not available at time of publication.


![INDEX [gov.mb.ca] · PDF fileWorld Martial Arts Championship, ... Agricultural waste management corporation. Status report . Mihychuk, ... Hansard Index . Agriculture](https://static.fdocuments.net/doc/165x107/5a7171b17f8b9ac0538cdb2e/index-govmbca-nbsppdf-fileworld-martial-arts-championship-.jpg)