HEALTH SECTOR PUBLIC EXPENDITURE REVIEW 2010/11
69
HEALTH SECTOR PUBLIC EXPENDITURE REVIEW 2010/11 THE UNITED REPUBLIC OF TANZANIA MINISTRY OF HEALTH AND SOCIAL WELFARE Prepared by: Directorate of Policy and Planning Ministry of Health and Social Welfare Dar es Salaam, Tanzania July 2012
Transcript of HEALTH SECTOR PUBLIC EXPENDITURE REVIEW 2010/11

HEALTH SECTOR
PUBLIC EXPENDITURE REVIEW
2010/11
THE UNITED REPUBLIC OF TANZANIA
MINISTRY OF HEALTH AND SOCIAL WELFARE
Prepared by:
Directorate of Policy and Planning
Ministry of Health and Social Welfare
Dar es Salaam, Tanzania
July 2012

July 2012
Recommended Citation: Directorate of Policy and Planning, Ministry of Health and Social Welfare. July
2012. Health Sector Public Expenditure Review, 2010/11. Dar es Salaam, Tanzania and Health Systems 20/20
project, Abt Associates Inc.

HEALTH SECTOR
PUBLIC EXPENDITURE REVIEW
2010/11


V
CONTENTS
Contents ......................................................................................... v
Acronyms ...................................................................................... ix
Acknowledgments ........................................................................ xi
Executive Summary ................................................................... xiii
1. Introduction ....................................................................... 1
2. Review of PER FY09 Recommendations and Actions
Taken 3
3. Health Budget and Expenditure Analysis ...................... 7
3.1 Introduction ....................................................................... 7
3.2 Total Public Health Spending .......................................... 7
3.3 Sources of Funds for the Public Health Expenditure .. 11
3.4 Trends in Recurrent and Development
Expenditures .................................................................... 13
3.5 Performance of the Health Sector Budget ................. 14 3.5.1 Performance of Recurrent and Development Budget .... 14
3.5.2 Performance of Government and Foreign Funds ............ 15
3.5.3 Budget Execution Performance among Levels of
Government .................................................................................... 16
3.5.4 Budget Performance of MoHSW Departments ............... 17
3.5.5 Expenditures by Key Intervention Areas ........................... 18
3.6 Health Sector Budget and Expenditure by Levels of
Government .................................................................... 19
4. Complementary Health Financing ................................ 23
4.1 Health Services Fund ...................................................... 23
4.2 The National Health Insurance Fund............................ 23
4.3 The Community Health Fund ........................................ 26
5. Local Government Health Sector Spending ................ 29
5.1 Introduction ..................................................................... 29
5.2 Sources of Funds to Finance Health Services in
LGAs ................................................................................. 29
5.3 Budget Performance in LGAs ....................................... 32
5.4 Health Spending at the LGA Level by Sub-Votes ...... 33
5.5 Health Spending by Programs ...................................... 35
5.6 Human Resources for Health ........................................ 36
6. Conclusions and Recommendations .............................. 37
6.1 Highlights of PER FY11 Findings ...................................... 37
6.2 Recommendations ......................................................... 38
Annex A: Aggregate Data Used for Analysis (MN TZS) ........ 43

Annex B: Glossary of Terms .................................................... 47
Annex C: List of Tracer Medicines/Items for
Comprehensive Council Health Plans ....................................... 49
LIST OF TABLES
Table 2.1: Implementation status of the PER FY10
recommendations ...................................................... 3 Table 3.1: Indicators of Public Health Financing ...................... 9 Table 3.2: Sources of Health Financing (Mn TZS) .................... 12 Table 3.3: Summary of Recurrent and Development
Budget and Expenditures (Bn TZS) ......................... 13 Table 3.4: Budget Execution Performance Indicators ........... 14 Table 3.5: Budget Performance among Layers of
Government .............................................................. 17 Table 3.6: MoHSW Budget Performance by Department,
2010/11 ....................................................................... 18 Table 3.7: MoHSW Expenditure by Key Intervention Area,
2010/11 ....................................................................... 19 Table 3.8: Health Spending by Level of Government (Bn
TZS) .............................................................................. 20 Table 3.9: Share of Health Resources to the Different
Levels of Government .............................................. 20 Table 4.1: Health Services Fund (Mn TZS) ................................ 23 Table 4.2: NHIF Income and Reimbursements (Mn TZS) ........ 24 Table 4.3: NHIF Expenditure by Component (Mn TZS) ........... 24 Table 4.4: Reimbursement by Type of Health Facility
Ownership, 2010/11 (Mn TZS) .................................. 25 Table 4.5: Reimbursement by Level of Health Facility,
2010/11
(Mn TZS) ...................................................................... 25 Table 4.6: Membership in CHF/TIKA ......................................... 27 Table 4.7: Implementation of CHF Action Plan ...................... 27 Table 4.8 Insurance Coverage to Total Population,
2010/11 ....................................................................... 28 Table 5.1: Sources of Funds and Total Amount for 125
LGAs (TZS) ................................................................... 30 Table 5.2: Percent Share of Sources of Funds for
Health Expenditures ................................................. 31 Table 5.3: Local Government Health Spending (TZS) ............ 32 Table 5.4: Budget Performance in 125 LGAs (TZS) ................. 33 Table 5.5: Budget Performance of the Sampled Seven
LGAs (TZS) ................................................................... 33 Table 5.6: Health Spending at the LGA Level by Sub-vote
(Mn TZS) ...................................................................... 34 Table 5.7: Average Shares of Total Expenditure per Sub-
vote for
125 LGAs .................................................................... 34

VII
Table 5.8: Recurrent Block Grant Allocations per Sub-vote,
2010/11 ....................................................................... 35 Table 5.9 Health Spending by Program (TZS) ......................... 35 Table 5.10: Human Resource Gap ........................................... 36
LIST OF FIGURES
Figure 3.1: Public Health Budget and Expenditure Trends
(Bn TZS) ..................................................................................... 8 Figure 3.2: Health Shares in Government Budget and
Expenditure ............................................................................. 8 Figure 3.3: Trends of Per Capita Public Health Budget and
Expenditure ........................................................................... 10 Figure 3.4: Government and Foreign Contribution to
Health Expenditures ............................................................. 12 Figure 3.5: Trend of Shares of Recurrent and Development
Budget and Expenditures ................................................... 14 Figure 3.6: Recurrent and Development Budget
Performance ......................................................................... 15 Figure 3.7: Performance of Government and Foreign
Funds ...................................................................................... 16 Figure 3.8: Performance of Basket and Non-basket
Foreign Funds........................................................................ 16 Figure 3.9: Trend of Distribution of Resources between
Central
and Local Levels .................................................................. 21 Figure 3.10: Health Financing by Government Level, with
Medicines Isolated ............................................................... 21


IX
ACRONYMS
ADDOs Accredited Drug Dispensing Outlets
AMO Assistant Medical Officers
Bn Billion
CC City Council
CCHPs Comprehensive Council Health Plans
CFS Consolidated Fund Services
CHF Community Health Fund
CIDA Canadian International Development Agency
COIA Commission for Information and Accountability
DC District Council
DMO District Medical Officer
DRF Drug Revolving Fund
FY Fiscal Year
Global Fund Global Fund to Fight Aids, Tuberculosis and Malaria
HSDG Health Sector Development Grant
HSF Health Service Fund
HSSP Health Sector Strategic Plan
JRF Joint Rehabilitation Fund
LDGD Local Government Development Grant
LGAs Local Government Authorities
MC Municipal Council
MDGs Millennium Development Goals
MMAM Primary Health Services Development Program
Mn Million
MoF Ministry of Finance
MoHSW Ministry of Health and Social Welfare
MSD Medical Stores Department
MTEF Medium-Term Expenditure Framework
NASA National Aids Spending Assessments
NCDs Noncommunicable Diseases
NHA National Health Accounts
NHIF National Health Insurance Fund
NSGRP MKUKUTA Mkakati wa Kukuza Uchumi na Kupunguza Umaskini Tanzania
(National Strategy for Growth and Reduction of Poverty)
OC Other Charges
PE Personal Emoluments
PER Public Expenditure Review
PFM Public Financial Management
PMO-RALG Prime Minister’s Office, Regional Administration and Local Government
SWAp Sector-Wide Approach
TB Tuberculosis
TC Town Council
TFIRs Technical and Financial Implementation Reports
TIKA Tiba kwa Kadi (urban equivalent of the CHF)
TZS Tanzanian Shilling
USD U.S. Dollar
WHO World Health Organization

XI
ACKNOWLEDGMENTS
The 2010/11 Public Health Sector Expenditure review was a collaborative activity among various
stakeholders in the health sector. In particular, we appreciate the guidance provided by the Health
Financing Committee and for their time in reviewing the draft report. Their comments assisted in
enriching and focusing the report. Special thanks go to Regina Kikuli, Ministry of Health and Social
Welfare for overseeing the entire PER process and Mariam Ally for her tireless effort to ensure this
report is produced in good time.
Technical assistance was provided by the USAID-funded Health System 20/20 project, through Dr
Flora Kessy a consultant, and project staffs Stephen Muchiri, Rebecca Patsika, Stephen Musau and
Alledia Adams.
The Ministry of Health and Social Welfare would like to thank all those who participated in one way
or another in the preparation of the PER report. We appreciate the support from Ministry of
Finance and the Prime Minister’s Office-Regional Administration and Local Government in allowing
the data collector’s access to valuable records under their custody which were used in the
compilation of this report.
Finally, the Ministry of Health and social Welfare would like to acknowledge the financial support
provided by the United States Agency for International Development (USAID). Without this
support, it would have been difficult to complete this PER report.


XIII
EXECUTIVE SUMMARY
1. OBJECTIVES
The main objective of Health Sector Public Expenditure Review for fiscal year (FY) 2011 (PER FY11)
was to assess the budgetary allocations and expenditures to inform stakeholders about progress
made in key health financing milestones over the 2006/07–2011/12 period. Specifically, the Health
Sector PER sets out to provide:
A review of PER FY10 findings and actions taken by the sector in response to those findings,
indicating unaccomplished/pending actions, and identifying follow-up actions for FY11
Analysis of the trend of recurrent and development budget and expenditures for the past five
FYs
Analysis of the trends in the sources of funding for the health sector for the past five FYs
Analysis of budget and expenditure trends for the different sectoral and subsectoral levels
including the central-local government split
Assessment of budget performance (allocation versus actual spending) by classification
(development and recurrent), funding sources (government funding and foreign funding), and
different levels (central and local)
Analysis of the core or priority areas/items of expenditure as highlighted in the Health Sector
Strategic Plan III (HSSP-III) and the National Strategy for Growth and Reduction of Poverty
(MKUKUTA)
A detailed analysis of income and expenditure at the district level
2. KEY PER 2010/11 HIGHLIGHTS
Public health sector financing has more than doubled over the five-year period under
review, but the share of the health budget in the total government budget still remains
below the 15 percent recommended under the Abuja Declaration. The health sector
budget has increased in nominal terms from TZS520 billion in 2006/07 to TZS1.164 trillion in
2011/12. However, the share of public spending on health out of total government expenditure
(excluding Consolidated Fund Services [CFS]) declined from 13.1 percent in 2009/10 to 12.0 percent
in 2010/11; while the share of public health allocation in the total government budget (excluding
CFS) also declined from 12.3 percent in the 2010/11 budget to 10.0 percent in the 2011/12 budget.
This level of expenditure (which includes donor funding) is below the Abuja target, despite the
government’s stated commitment to increase the share of health allocation in the budget to 15
percent of the total government budget.1 In 2010/11, public health expenditures were only about 2.7
percent of GDP, while public health budgetary allocations were down to 2.8 percent of GDP in the
2011/12 budget compared to 3.5 percent of GDP in the 2010/11 budget.2
Per capita public health allocations have almost doubled in nominal terms between
2006/07 and 2010/11, but the real increase was only modest. Further, per capita health
spending is still low, and falls significantly short of the World Health Organization
1Equinet has created a definition of how to measure progress toward the Abuja target, as it is just domestic financing.
However, mathematically, if the overall financing envelope (domestic + foreign) doesn’t meet the “Abuja target” as
presented in this PER, then the domestic financing alone will be very far from it. 2 Based on the available data, government funds to the health sector have oscillated between 1.6–1.9 percent of GDP for
actual health spending.
(WHO)-recommended target of USD54 to address health challenges, and is well below
the HSSP-III projections of USD15.75 per capita spending by 2009/10. In nominal terms,
public health allocations per capita increased by 108 percent from TZS13,785 (USD11) in 2006/07 to
TZS28,673 (USD19.80) in 2010/11 before falling (by 7 percent) to TZS26,563 (USD17.30) in
2011/12. Actual per capita health spending increased by 58 percent from TZS13,698 (USD11) in
2006/07 to TZS21,635 (USD14.90) in 2010/11. In real terms, however, per capita allocations for
health increased by 70 percent from TZS9,069 (USD7.30) to a peak of TZS15,425 (USD10.60) in
2010/11 before falling to TZS13,348 (USD8.70). Actual public health per capita expenditures rose
from TZS9,012 (USD7.20) to a peak of TZS12,818 (USD8.80) in 2009/10, and down to TZS11,639
(USD8) in 2010/11, which is a 10 percent decline.
Government funding remains the dominant source of health sector financing, but the
share of foreign financing in health has increased noticeably during the period under
review.3 Government contribution to health expenditures declined from 71 percent in 2006/07,
reaching a low of 53 percent in 2010/11, and is estimated at 59 percent of the 2011/12 budget.
However, because of much higher execution of local funds in the implementation of the budget, the
share of government funds in the actual health spending has always remained above 60 percent
throughout the review period. The share of external health financing increased from 29 percent in
the 2006/07 budget to a maximum of 47 percent in the 2010/11 budget, and is estimated at 41
percent in the 2011/12 budget. Also, it is worth noting that foreign funding still accounts for a
dominant (88.8 percent) share of the development budget in health interventions. This trend points
to a potential threat to the sustainability of health sector financing in case of unanticipated declines in
donor funding in the sector.
The performance of the health sector budget execution was satisfactory throughout
the review period, but it still remains vulnerable to low execution of foreign funds, and
persistent challenges in the execution of the development budget, notably the low
absorption capacity of spending units, non-release of funds, delays in the release of
funds, and lengthy and cumbersome procurement processes. The execution of the health
sector budget was generally good throughout the review period, with annual average execution of
91 percent, except for 2010/11 when only 75 percent of the budgeted funds were utilized. The
performance of the recurrent budget has been generally higher than the development budget, which
recorded a very low execution of 57 percent in 2010/11. Performance of government funds was
generally higher than foreign funds for the past three fiscal years. With regard to foreign funds, the
execution of basket funds was better than the non-basket funds, which recorded a very low
execution of 51 percent in 2010/11. Budget performance continues to be hindered by among other
factors: the low absorption capacity of the spending units; delays in the release of funds; non-release
of the funds; over-ambitious budgeting (given the past performance); and lengthy and cumbersome
procurement processes, which affect particularly the implementation of development projects.
The overall performance of the recurrent budget for the Ministry of Health and Social
Welfare (MoHSW) departments is excellent (92.7 percent), except for the Social
Welfare and Finance and Accounts Departments that only have average performance,
and the Internal Audit Department, which has poor performance with an execution of
only about 34 percent. The poor performance of the Audit Department is due to non-release of
the allocated funds. Non-release of funds to the Audit Department threatens the functioning of the
unit and the entire public financial management (PFM) system of the MoHSW.
Health sector financing continues to be concentrated at the central level, and the pace
towards decentralization has slowed in 2011/12. However, there is a significant share of
3 These findings are different from those reported in the National Health Accounts because private contributions are not
included.

XV
health financing that is centrally controlled, but goes to the local level in the form of
pharmaceutical and medical supplies. The share of public health financing controlled at the
central level has declined generally, from 64 percent in 2006/07 to 60 percent in 2011/12. However,
if the pharmaceutical component is excluded from the central spending, the share of health financing
controlled at the central level goes down to 37 percent in 2011/12. The share of medicines, which
eventually go to the local level, has increased from 15 percent of the health budget in 2006/07 to 28
percent in 2010/11, before declining to a projected 20 percent of the health budget in 2011/12.
The other sources of funding at the local level (which are mostly off-budget) increased from 7
percent in 2009/10 to 14 percent of the council budget in the 2010/2011. Actual expenditure from
councils’ own resources remained constant at 2 percent, which raises a concern about the
sustainability of health interventions should there be a shock to the funds from the central level
(government and development partners).
Complementary health financing continues to grow in importance, but only a small
proportion of the Tanzanian population (about 14 percent) is currently insured with the
National Health Insurance Fund (NHIF) and Community Health Fund (CHF) based on
the current estimates from NHIF reports. Between 2007/08 and 2010/11, receipts from the
Health Service Fund (HSF) have almost doubled. Although this could be reflecting an increase in
population, it is also reflecting the fact that majority of the population is not insured; only 14 percent
of Tanzanians are insured (NHIF and CHF combined). Further, the HSF still has unspent balances,
which in 2010/11 were equivalent to 20 percent of the receipts, a decline from 26 percent observed
in 2009/10. In both 2009/10 and 2010/11, more was spent than collected which resulted in the
decrease of the unspent balance. NHIF continues to accumulate huge reserves although compared to
2008/09 figures, they have declined from 63 percent to 59 percent of the total annual income. These
funds (HSF and NHIF) should be used to improve health services promptly while maintaining
prudent, actuarially determined reserves. Holding very large reserves defeats the whole purpose of
collecting these funds.
Following the accreditation of the Drug Dispensing Outlets, and improvements in the procurement
of medicines by the Local Government Authorities (LGAs) from the Medical Stores Department
(MSD), access to tracer drugs has significantly improved in the LGAs. Access to tracer drugs from
the sampled health facilities was found to be high. This reflects efforts made by councils in procuring
medicines from the Medical Stores Department but also accrediting Part I Pharmacies and
Accredited Drug Dispensing Outlets (ADDOs) to serve the NHIF/CHF clients. These pharmacies
and ADDOs are key conduits for making medicine accessible to rural marginalized areas, and more
efforts should be made to work with ADDOs. This is also an area where the CHF funds could be
used effectively.
Following the improvement in the budget allocation for training and deployment of
human resource for health, the overall human resource gap has narrowed to 41 percent
in 2010/11 from 65 percent in 2006/07. The improvement in budget allocation for training and
deployment of human resources for health has helped in bringing the overall human resource gap
down to 41 percent in 2010/11. In terms of cadres, the gap for assistant medical officers (AMOs) has
almost closed (73 percent available), followed by laboratory technicians (63 percent available), but
the shortage of dentists and pharmacy technicians still persists (only 35 percent and 59 percent
available, respectively).
3. RECOMMENDATIONS
1. Despite the government’s stated commitment to increase the share of health sector
financing in the government budget to at least the 15 percent recommended in the
Abuja Declaration, this has yet to be achieved, and the share has fallen below 12 percent
in 2011/12. It is important that this commitment is honored with the deserved political
will if progress is to be made in addressing the key challenges in the sector, particularly
in human resources (recruitments to fill the existing gap identified in the HSSP-III and
retention of workers) and infrastructure.
2. Execution of the development budget continues to be plagued by several impediments,
including: low absorption capacity; non-release or delayed release of funds; and
complexities in the procurement processes. Efforts should be increased to address these
impediments to ensure smooth implementation of the budget.
3. Although the delivery of health services is largely concentrated at the local government
level, the largest share of health sector financing is still managed at the central level.
Despite this observation, it is worth noting that a significant portion of the funds
managed at the central level eventually goes down to the local level, particularly in the
form of drugs and medical supplies. Nonetheless, the process of decentralization should
be expedited, with particular focus on capacity strengthening for local government
authorities in the areas of financial management and procurement.4
4. The poor performance of the Internal Audit Unit of MoHSW due to non-release of the
allocated funds threatens the functioning of the department and the entire PFM system
of the MoHSW. Thus, it is imperative to release funds as budgeted so as to enable the
unit to perform its functions effectively.
5. Efforts to promote enrollment of households in the CHF are evident at different levels.
Lessons from best-performing districts and programs such as Tanzanian German
Program to Support Health and the Swiss Development Cooperation-funded CHF
Strengthening program in Dodoma should be harnessed and applied nationwide. The
major actors here include NHIF and LGAs.
6. Accreditation of Part I Pharmacies and ADDOs to serve the NHIF/CHF clients is an
excellent move. These pharmacies and ADDOs are key conduits for making medicine
accessible to rural, marginalized areas and more efforts should be made to work with
ADDOs. The NHIF and Tanzania Food and Drugs Authority are key actors here.
7. The government should intensify efforts to strengthen the linkages between CHF and
NHIF in working towards universal coverage.
4See World Bank (2011), Basic Health Services Project on capacity-building mechanisms to improve the capacity of local
governments to manage their health services, including training and systems strengthening interventions, with a focus on
improved PFM.

1
1. INTRODUCTION
In the National Strategy for Growth and Reduction of Poverty (Kiswahili acronym MKUKUTA), the
government aims to improve people’s health by building stronger capacities to prevent and cure
diseases. MKUKUTA points to the need to increase the population’s access to health care and scale
up efforts to reduce child and maternal mortality and eliminate malnutrition. Following the adoption
of the new Health Policy in 2007 and the design of a Health Sector Strategic Plan III (HSSP-III)
(2009–2015), access to health services has increased, though modestly. New health facilities
(dispensaries, health centers, and hospitals) have been constructed, and availability of equipment and
medicines has improved. However, although there have been modest gains in the health sector over
the past decade – notably the decline in maternal and infant mortality and a decline in the prevalence
of HIV/AIDS and tuberculosis (TB) – there are persistent challenges, particularly with regard to
adequacy and quality of health services, and shortages of skilled personnel. Addressing these
challenges requires commitment to allocate adequate resources to the sector and ensure efficient
utilization.
After two years of implementation of the HSSP-III, the Health Sector Public Expenditure Review
(PER) for fiscal year (FY) 2011 provides a hands-on tool to immediately track the progress made in
key health financing indicators, identify challenges, and make relevant recommendations for
successful implementation of the strategy. The health systems approach adopted by HSSP-III
prioritizes certain key areas aiming to improve the performance of the health sector, including:
infrastructure expansion and improvement; strengthening referral services; increasing the number
and quality of human resources; improving management capacity at the council level; and increasing
and broadening mechanisms of health financing. These interventions provide the framework for
planning, budgeting, and allocation of resources in the health sector, as efforts continue to reverse
the poor health status indicators, contribute toward poverty reduction and attainment of growth
objectives of the country, and realize the Millennium Development Goals (MDGs).
The Health Sector PER FY11 sets out to assess the budgetary allocations and expenditures to inform
stakeholders about progress made in key health financing milestones over the 2006/07–2011/12
period. Specifically, the PER FY11 provides:
A review of PER FY10 findings and actions taken by the sector in response to those findings,
indicating unaccomplished/pending actions, and identifying follow-up actions for FY11
Analysis of the trend of recurrent and development budget and expenditures for the past five
fiscal years
Analysis of the trends in the sources of funding for the health sector for the past five fiscal years
Analysis of budget and expenditure trends for the different sectoral and subsectoral levels
including the central-local government split
Assessment of budget performance (allocation versus actual spending) by classification
(development and recurrent), funding sources (government funding and foreign funding), and
different levels (central and local)
Analysis of the core or priority areas/items of expenditure as highlighted in the HSSP-III and the
MKUKUTA
A detailed analysis of income and expenditure at the district level
This review is informed by data collected from both the central-level institutions and Local
Government Authorities (LGAs). The central-level institutions include: the Ministry of Finance

(MoF); the MoHSW; the Prime Minister’s Office, Regional Administration and Local Government
(PMO-RALG), and the National Health Insurance Fund (NHIF). Data from the LGAs were collected
from, among other sources, the Comprehensive Council Health Plans (CCHPs) and Technical and
Financial Implementation Reports (TFIRs). From the sampled seven districts, data were collected
from the District Medical Officer (DMO) offices and sampled hospitals, health centers, and
dispensaries.
The PER FY11 is organized in six chapters. After the introduction in Chapter 1, the second chapter
presents a review of PER FY10 recommendations and follow-up actions. Chapter 3 summarizes
trends in overall public health spending (trends in the total public health budget and expenditures)
and various subsector trends, with some detailed analysis of particular recurrent expenditure items
and the development budget. Budget execution at different levels, expenditure by MoHSW
departments, and expenditure by key intervention areas is also presented in this chapter. Analysis of
the contribution of complementary financing in health care financing is presented in Chapter 4.
Chapter 5 gives an overview of budgets and expenditures in 125 districts and a detailed assessment
of the financial flows in seven tracked councils. Chapter 6 points out key messages from the analysis
and provides recommendations for the way forward.
3
2. REVIEW OF PER FY09
RECOMMENDATIONS AND ACTIONS
TAKEN
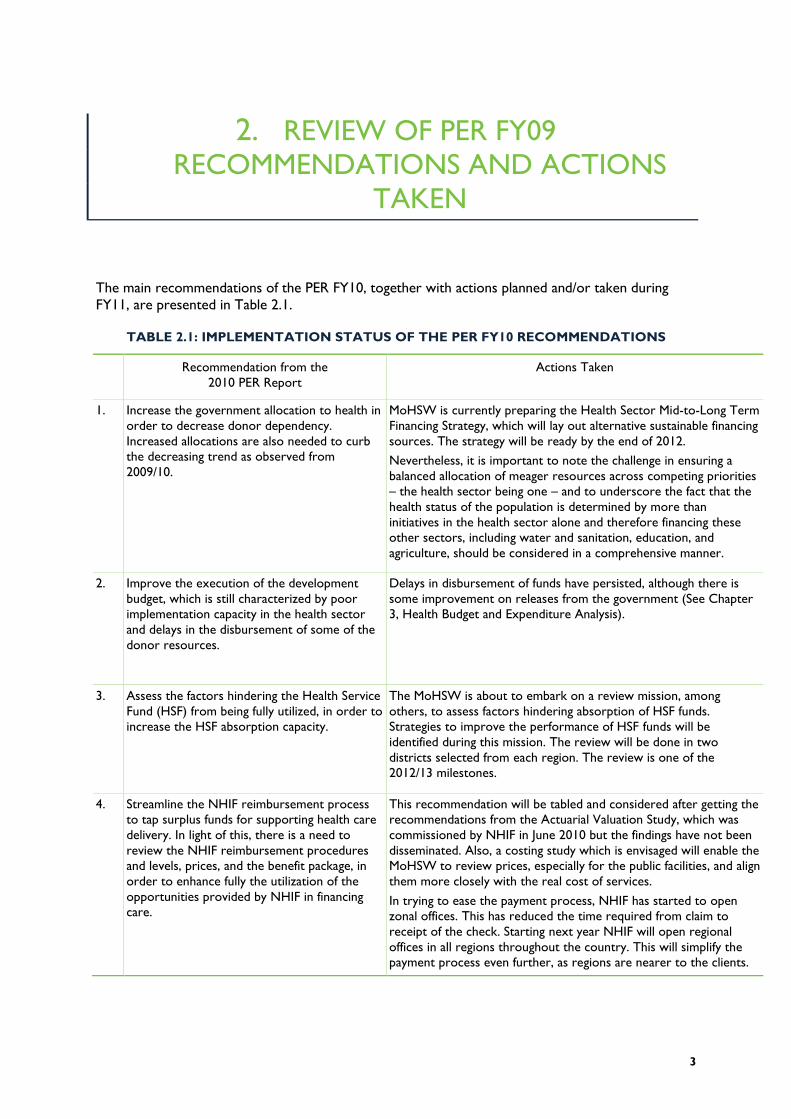
The main recommendations of the PER FY10, together with actions planned and/or taken during
FY11, are presented in Table 2.1.
TABLE 2.1: IMPLEMENTATION STATUS OF THE PER FY10 RECOMMENDATIONS
Recommendation from the
2010 PER Report
Actions Taken
1. Increase the government allocation to health in
order to decrease donor dependency.
Increased allocations are also needed to curb
the decreasing trend as observed from
2009/10.
MoHSW is currently preparing the Health Sector Mid-to-Long Term
Financing Strategy, which will lay out alternative sustainable financing
sources. The strategy will be ready by the end of 2012.
Nevertheless, it is important to note the challenge in ensuring a
balanced allocation of meager resources across competing priorities
– the health sector being one – and to underscore the fact that the
health status of the population is determined by more than
initiatives in the health sector alone and therefore financing these
other sectors, including water and sanitation, education, and
agriculture, should be considered in a comprehensive manner.
2. Improve the execution of the development
budget, which is still characterized by poor
implementation capacity in the health sector
and delays in the disbursement of some of the
donor resources.
Delays in disbursement of funds have persisted, although there is
some improvement on releases from the government (See Chapter
3, Health Budget and Expenditure Analysis).
3. Assess the factors hindering the Health Service
Fund (HSF) from being fully utilized, in order to
increase the HSF absorption capacity.
The MoHSW is about to embark on a review mission, among
others, to assess factors hindering absorption of HSF funds.
Strategies to improve the performance of HSF funds will be
identified during this mission. The review will be done in two
districts selected from each region. The review is one of the
2012/13 milestones.
4. Streamline the NHIF reimbursement process
to tap surplus funds for supporting health care
delivery. In light of this, there is a need to
review the NHIF reimbursement procedures
and levels, prices, and the benefit package, in
order to enhance fully the utilization of the
opportunities provided by NHIF in financing
care.
This recommendation will be tabled and considered after getting the
recommendations from the Actuarial Valuation Study, which was
commissioned by NHIF in June 2010 but the findings have not been
disseminated. Also, a costing study which is envisaged will enable the
MoHSW to review prices, especially for the public facilities, and align
them more closely with the real cost of services.
In trying to ease the payment process, NHIF has started to open
zonal offices. This has reduced the time required from claim to
receipt of the check. Starting next year NHIF will open regional
offices in all regions throughout the country. This will simplify the
payment process even further, as regions are nearer to the clients.

Recommendation from the
2010 PER Report
Actions Taken
6. TIKA (the urban equivalent of the Community
Health Fund [CHF]) has been rolled out in only
three councils (Tanga City Council, Dodoma
Municipal Council [MC], and Moshi MC). It has
however been noted that these cities did not
follow the proposed TIKA modality. What has
been introduced in these MCs follows the CHF
principles. It is imperative to roll out TIKA in
Dar es Salaam as the model city due to its
complexities, and further apply lessons learned
to other cities.
A study has been commissioned to collect public perceptions
toward TIKA establishment at Temeke MC. The study will provide
recommendations on strategies to improve the performance of
TIKA. Based on these recommendations, TIKA will be launched in
Dar es Salaam in July 2012.
7. Consider developing a resource-tracking
database to improve reporting systems and
data availability for monitoring financial
resource inflow and expenditures. This will
institutionalize the PER and other resource
tracking initiatives such as National Health
Accounts (NHA) and National AIDS Spending
Assessments (NASA).
There are efforts from government and various partners to support
the institutionalization of a health expenditure-tracking database.
This is in line with implementation of the recommendations of the
Commission for Information and Accountability (COIA) for
Women’s and Children Health.
PlanRep II* has been introduced and training given to all councils
throughout the country. The plan is to introduce a database which
will be linked with all PlanRep in the councils. The World Health
Organization (WHO) and Canadian International Development
Agency (CIDA) intend to support this activity.
8. Simplify the procedures for LGAs to access the
budgeted funds from own sources earmarked
for health. Also, barriers should be minimized
to make CHF funds more accessible to the
health facilities.
As mentioned above, the MoHSW is about to embark on a review
mission among others to assess factors hindering absorption of HSF
funds. Recommendations from this study will also be used to
develop strategies to improve the performance of budgeted funds
from own sources and CHF.
9. Ensure timely releases of funds from the
Treasury to the LGAs for all expenditure
categories including the other charges, to
improve health budget execution in the LGAs.
Efforts have been made toward ensuring timely release of the funds.
However, under the cash budget system, not much can be done if
collected revenue is short of the envisaged allocations.
10. Ensure timely flow of information about
transfer of funds and purpose of those
transfers from the Treasury to the District
Executive Director, and to the DMO, to
reduce the misallocation of health funds at
LGA level. This is especially important in light
of the new consolidation of bank accounts at
the LGAs.
PMO-RALG organized trainings which involved Regional Health
Management Teams, Council Health Management Teams, Council
Treasurers, and District Planning Officers, to discuss the new CCHP
guidelines, PlanRep III, and how to improve the flow of financial
information.
11. In addressing inequality in spending, efforts
should be made to use the agreed-upon
resource allocation formula.
The MoHSW, in collaboration with health sector partners, has
started to review the resource allocation formula. The revised
formula is expected to be ready by the end of 2012. Since the
process would be consultative and inclusive it is expected that all
stakeholders will adhere to the formula. This is particularly so since
the new formula will be comprehensive; it will include (as much as
possible)all concerns from the stakeholders.
12. Commission a study to assess 10 years for
Sector Wide Approach (SWAp) arrangements
to show impact (if any) in the financing of the
health sector, with regard to the level and
Discussion with health sector partners on mid-term review of
HSSP-III is ongoing. Review of SWAp approach and its impacts will
be one of the terms of reference in the review. Further, MoF is
undertaking a study on sectors’ coordination for General Budget

5
Recommendation from the
2010 PER Report
Actions Taken
composition of funding, the financing agents,
and alignment of partner systems with the
government.
Support and Basket Fund.
13. In the next PER, effort should be made to
unpack development expenditures in order to
estimate how much is spent on real capital
investment and the amount of recurrent
expenditures within the development
expenditures.
See Chapter 2 of the Macro PER for the reclassification of the health
budget in terms of the split between wages, non-wage recurrent,
and true capital spending.
* Plan-Rep is the Planning and Reporting software used by all LGAs to prepare annual plans and budgets. It has a reporting
component that allows councils to report on the financial implementation of their budgets in accordance with the objectives,
targets, and activities in the budget plan.

7
3. HEALTH BUDGET AND
EXPENDITURE ANALYSIS
3.1 INTRODUCTION
This chapter presents an assessment of public health budget and expenditure trends between
2006/07 and 2010/11. The chapter also evaluates the sector budgetary absorptive capacity and
resource allocation to key priority areas to support the HSSP-III and MKUKUTA. The focus of this
chapter is on public health sector outlays that are financed by the government of Tanzania and by
development partners (through health basket and non-basket mechanisms), households (through
official user fees paid at public facilities), and insurance contributions. The data used to carry out the
analysis is appended at the end of this report (Annex A). Annex B provides the list of key
terminologies used in this PER.
3.2 TOTAL PUBLIC HEALTH SPENDING
Total public health actual spending increased significantly from TZS520 billion in 2006/07 to TZS924
billion in 2010/11, and is projected to increase further toTZS1.164 trillion in 2011/12.That is,
between 2006/07 and 2011/12 there has been a 124 percent increase in the public health budget in
nominal terms, and a 78 percent increase in nominal actual public health spending. However, in real
terms, the total health budget increased by only about 71 percent, from TZS342 billion in 2006/07 to
TZS585 billion in 2011/12; while actual public health spending increased by only 46 percent in real
terms over the period to 2010/11.
The share of public health budget in total government budget, excluding the Consolidated Fund
Services (CFS),was 12.3 percent in 2010/11 but has declined to 10.0 percent in 2011/12.With the
CFS included, the share of health budget actually fell from 10.5 percent in 2010/11 to a mere 8.6
percent in 2011/12. Similarly, the share of actual health spending in total government spending
(excluding CFS) declined from 13.1 percent in 2009/10 to 11.9 percent in 2010/11, while with CFS
included the decline in the share of health spending was rather modest from 9.9 percent in 2009/10
to 9.5 percent in 2010/11. Figure 3.1 shows the trends of public health budget and actual spending in
nominal and real terms between 2006/07 and 2011/12. Figure 3.2 shows the share of public health
budget and expenditure in the total government budget, including and excluding CFS. It is quite clear
that the share of government budget that goes to the health sector has not kept pace with general
government spending between 2005/06 and 2009/10, and only increased in 2010/11 before falling
back to pre-2005/06 levels.
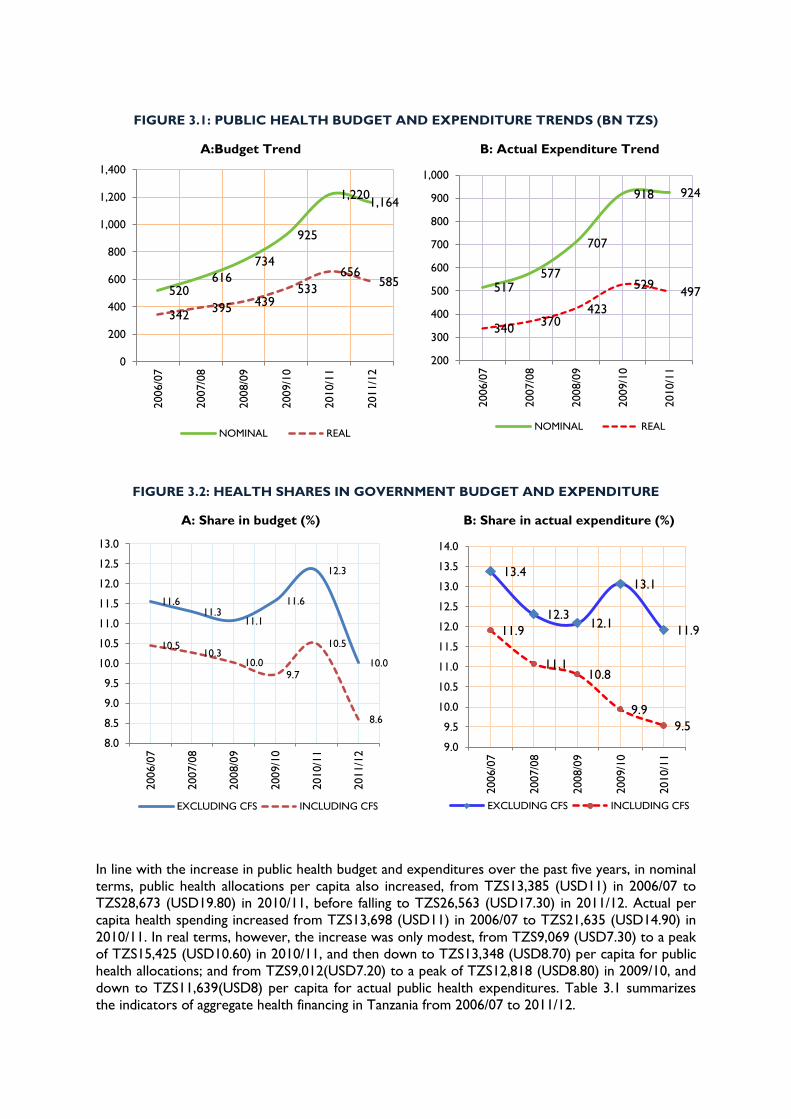
FIGURE 3.1: PUBLIC HEALTH BUDGET AND EXPENDITURE TRENDS (BN TZS)
A:Budget Trend B: Actual Expenditure Trend
FIGURE 3.2: HEALTH SHARES IN GOVERNMENT BUDGET AND EXPENDITURE
A: Share in budget (%) B: Share in actual expenditure (%)
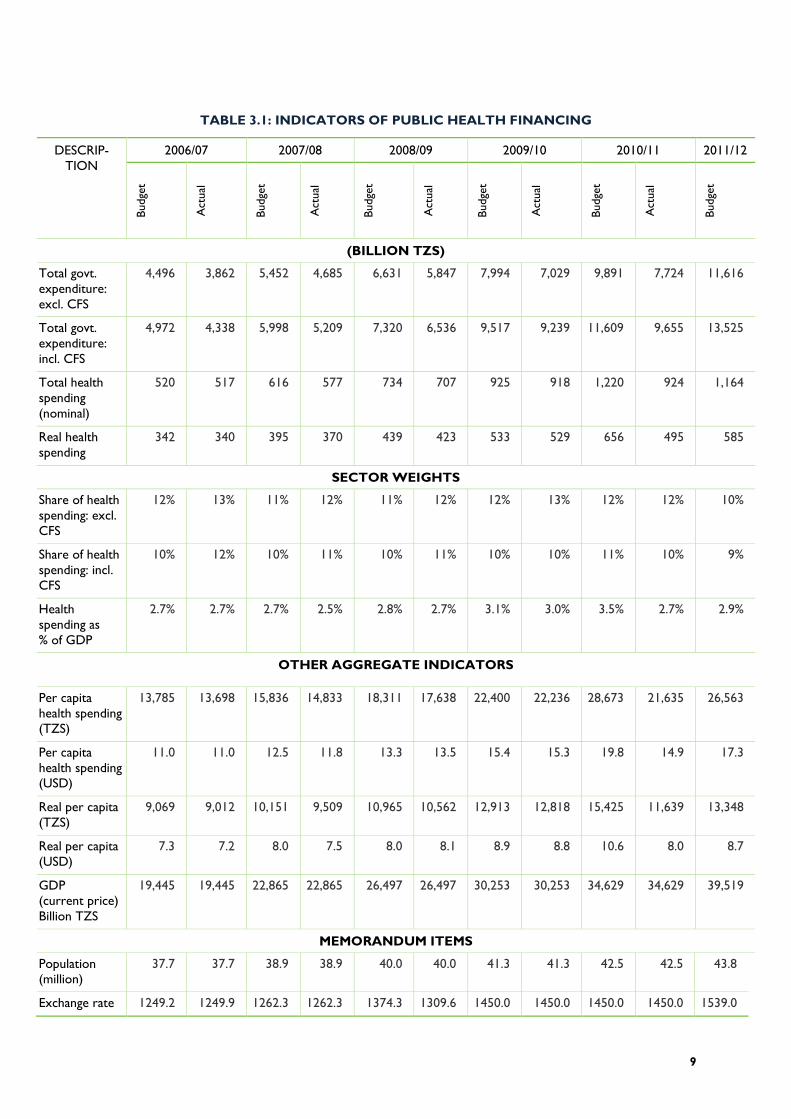
In line with the increase in public health budget and expenditures over the past five years, in nominal
terms, public health allocations per capita also increased, from TZS13,385 (USD11) in 2006/07 to
TZS28,673 (USD19.80) in 2010/11, before falling to TZS26,563 (USD17.30) in 2011/12. Actual per
capita health spending increased from TZS13,698 (USD11) in 2006/07 to TZS21,635 (USD14.90) in
2010/11. In real terms, however, the increase was only modest, from TZS9,069 (USD7.30) to a peak
of TZS15,425 (USD10.60) in 2010/11, and then down to TZS13,348 (USD8.70) per capita for public
health allocations; and from TZS9,012(USD7.20) to a peak of TZS12,818 (USD8.80) in 2009/10, and
down to TZS11,639(USD8) per capita for actual public health expenditures. Table 3.1 summarizes
the indicators of aggregate health financing in Tanzania from 2006/07 to 2011/12.
520 616
734
925
1,220 1,164
342 395
439 533
656 585
0
200
400
600
800
1,000
1,200
1,4002006/0
7
2007/0
8
2008/0
9
2009/1
0
2010/1
1
2011/1
2
NOMINAL REAL
517 577
707
918 924
340 370
423
529 497
200
300
400
500
600
700
800
900
1,000
2006/0
7
2007/0
8
2008/0
9
2009/1
0
2010/1
1
NOMINAL REAL
11.6 11.3
11.1
11.6
12.3
10.0
10.5 10.3
10.0 9.7
10.5
8.6
8.0
8.5
9.0
9.5
10.0
10.5
11.0
11.5
12.0
12.5
13.0
2006/0
7
2007/0
8
2008/0
9
2009/1
0
2010/1
1
2011/1
2
EXCLUDING CFS INCLUDING CFS
13.4
12.3 12.1
13.1
11.9 11.9
11.1 10.8
9.9
9.5
9.0
9.5
10.0
10.5
11.0
11.5
12.0
12.5
13.0
13.5
14.0
2006/0
7
2007/0
8
2008/0
9
2009/1
0
2010/1
1
EXCLUDING CFS INCLUDING CFS
9
TABLE 3.1: INDICATORS OF PUBLIC HEALTH FINANCING
DESCRIP-
TION
2006/07 2007/08 2008/09 2009/10 2010/11 2011/12 B
udge
t
Act
ual
Budge
t
Act
ual
Budge
t
Act
ual
Budge
t
Act
ual
Budge
t
Act
ual
Budge
t
(BILLION TZS)
Total govt.
expenditure:
excl. CFS
4,496 3,862 5,452 4,685 6,631 5,847 7,994 7,029 9,891 7,724 11,616
Total govt.
expenditure:
incl. CFS
4,972 4,338 5,998 5,209 7,320 6,536 9,517 9,239 11,609 9,655 13,525
Total health
spending
(nominal)
520 517 616 577 734 707 925 918 1,220 924 1,164
Real health
spending
342 340 395 370 439 423 533 529 656 495 585
SECTOR WEIGHTS
Share of health
spending: excl.
CFS
12% 13% 11% 12% 11% 12% 12% 13% 12% 12% 10%
Share of health
spending: incl.
CFS
10% 12% 10% 11% 10% 11% 10% 10% 11% 10% 9%
Health
spending as
% of GDP
2.7% 2.7% 2.7% 2.5% 2.8% 2.7% 3.1% 3.0% 3.5% 2.7% 2.9%
OTHER AGGREGATE INDICATORS
Per capita
health spending
(TZS)
13,785 13,698 15,836 14,833 18,311 17,638 22,400 22,236 28,673 21,635 26,563
Per capita
health spending
(USD)
11.0 11.0 12.5 11.8 13.3 13.5 15.4 15.3 19.8 14.9 17.3
Real per capita
(TZS)
9,069 9,012 10,151 9,509 10,965 10,562 12,913 12,818 15,425 11,639 13,348
Real per capita
(USD)
7.3 7.2 8.0 7.5 8.0 8.1 8.9 8.8 10.6 8.0 8.7
GDP
(current price)
Billion TZS
19,445 19,445 22,865 22,865 26,497 26,497 30,253 30,253 34,629 34,629 39,519
MEMORANDUM ITEMS
Population
(million)
37.7 37.7 38.9 38.9 40.0 40.0 41.3 41.3 42.5 42.5 43.8
Exchange rate 1249.2 1249.9 1262.3 1262.3 1374.3 1309.6 1450.0 1450.0 1450.0 1450.0 1539.0

DESCRIP-
TION
2006/07 2007/08 2008/09 2009/10 2010/11 2011/12 B
udge
t
Act
ual
Budge
t
Act
ual
Budge
t
Act
ual
Budge
t
Act
ual
Budge
t
Act
ual
Budge
t
Deflator 1.52 1.52 1.56 1.56 1.67 1.67 1.73 1.73 1.86 1.86 1.99
Figure 3.3 presents trends in per capita public health budget and actual spending in nominal and real
terms. It is worth noting that per capita health budget and expenditures have increased consistently
in nominal terms during the review period, except for the 5 percent decline in 2011/12 from the
previous budget. However, in real terms, per capita health allocations have remained below
TZS14,000, while per capita health expenditures have also remained below TZS12,000 throughout
the review period. Because of domestic inflation and depreciation of the shilling, the estimated per
capita health budget and expenditures in real terms have consistently remained below USD10
throughout the review period.
FIGURE 3.3: TRENDS OF PER CAPITA PUBLIC HEALTH BUDGET AND EXPENDITURE
A: Per Capita Health Budget (TZS) B: Per Capital Health Spending(Actual) (TZS)
13,785
15,836
18,311
22,400
28,673
26,563
9,069 10,151
10,965
12,913
15,425
13,348
8,500
13,500
18,500
23,500
28,500
33,500
2006/0
7
2007/0
8
2008/0
9
2009/1
0
2010/1
1
2011/1
2
NOMINAL REAL
13,698
14,833
17,638
22,236 21,635
9,012 9,509
10,562
12,818
11,639
8,500
10,500
12,500
14,500
16,500
18,500
20,500
22,500
24,500
2006/0
7
2007/0
8
2008/0
9
2009/1
0
2010/1
1
NOMINAL REAL
11
C: Per Capita Health Budget (USD) D: Per Capita Health Spending (Actual) (USD)
3.3 SOURCES OF FUNDS FOR THE PUBLIC HEALTH
EXPENDITURE
Government funding remains the dominant source of public health financing, but the share of foreign
funding in the health budget has increased significantly from 29 percent(TZS164 billion) in 2006/07 to
41 percent(TZS340 billion) in 2011/12, matched by a corresponding decline in government funding
from 71 percent to 59 percent over the same period.5Government funds in the health budget
increased from TZS371 billion in 2006/07 to TZS692 billion in 2011/12, while actual spending of
government funds in health increased from TZS349 billion in 2006/07 to TZS569 billion in 2010/11.
In absolute terms, the budget of foreign funding in health more than tripled, from TZS149 billion in
2006/07 to TZS472 billion in 2011/12. The biggest increase in foreign funding happened in the non-
basket component, increasing more than six-fold from TZS49 billion in 2006/07 to TZS313 billion in
the 2011/12 health budget. The main driver of this increase is the Global Fund to Fight AIDS,
Tuberculosis and Malaria (Global Fund). Figure 3.4 portrays the shares of government funding and
foreign resources in health financing.
5 As noted earlier, these percentages are different from those reported in the NHA because private contributions
are not included.
11.0
12.5 13.3
15.4
19.8
17.3
7.3 8.0 8.0
8.9
10.6
8.7
6.0
8.0
10.0
12.0
14.0
16.0
18.0
20.0
22.02006/0
7
2007/0
8
2008/0
9
2009/1
0
2010/1
1
2011/1
2
NOMINAL REAL
11.0
11.8
13.5
15.3
14.9
7.2 7.5
8.1
8.8
8.0
6.0
7.0
8.0
9.0
10.0
11.0
12.0
13.0
14.0
15.0
16.0
2006/0
7
2007/0
8
2008/0
9
2009/1
0
2010/1
1
NOMINAL REAL

FIGURE 3.4: GOVERNMENT AND FOREIGN CONTRIBUTION TO HEALTH
EXPENDITURES
Basket funds in the health budget increased from about TZS100 billion in 2006/07 to TZS157 billion
in 2011/12, and recorded a peak of TZS161 billion in 2010/11. The dominance of non-basket foreign
funding clearly indicates that development partners, notably the Global Fund and PEPFAR, are
increasingly channelling their support to the health sector through projects. This trend poses
challenges, especially regarding aid coordination and harmonization in health interventions, and the
government should be seen to be in the driver’s seat in directing funding to mutually agreed
priorities. Off-budget health financing, which is composed largely of the HSF (in the form of official
user fees), increased from TZS3 billion in 2006/07 to TZS14 billion in 2010/11.Table 3.2 presents a
summary of government and donor funds in health budget and expenditures from 2006/07 to
2011/12.
TABLE 1.2: SOURCES OF HEALTH FINANCING (MN TZS)
2006/07 2007/08 2008/09 2009/10 2010/11 2011/12
Actual Actual Budget Actual Budget Actual Budget Actual Budget
Governme
nt funds
348,890 378,114 459,495 461,504
548,658
578,682 643,011 569,494 691,628
Foreign
funding
164,716
192,960 304,098 239,569 376,441 328,845 576,797 340,425 471,946
Basket 103,204 80,957 99,730 85,401 121,640 128,796 160,596 126,446 158,613
Non-
basket
61,512 112,003 204,368 154,168 254,801 200,049 416,201 213,979 313,333
Off-
budget
2,964 5,696 - 5,858 - 10,784 - 14,212 -
Grand
total
516,570 576,770 763,593 706,931 925,099 918,311 1,219,80
8
924,131 1,163,57
4
71% 68% 67% 66%
60% 66%
59% 64%
53%
63% 59%
29% 32% 33% 34%
40% 34%
41% 36%
47%
37% 41%
0%
10%
20%
30%
40%
50%
60%
70%
80%
Budget Actual Budget Actual Budget Actual Budget Actual Budget Actual Budget
2006/07 2007/08 2008/09 2009/10 2010/11 2011/12
Government Funds Foreign

13
3.4 TRENDS IN RECURRENT AND DEVELOPMENT
EXPENDITURES
During the review period (2006/07–2011/12), the development budget increased from TZS122
billion to a peak of TZS641 billion in 2010/11 (a 425 percent increase), before sliding back to
TZS532 billion in the 2011/12 budget. Actual development expenditure also increased about
threefold from TZS122 billion in 2006/07 to TZS369in 2010/11. The development budget in 2010/11
(TZS641 billion) was higher than recurrent budget (TZS579 billion) because large amounts of
resources from the Global Fund were classified as development budget allocations. However, the
development budget does not only contain “development spending” in the sense of investment
spending, but had a significant component of recurrent spending that could not be separated within
the scope of this PER.6 Although the development budget was higher than the recurrent budget,
actual recurrent spending (TZS541 billion) was higher than actual development spending (TZS369).
The recurrent budget has grown consistently throughout the review period, increasing by 59
percent from TZS398 billion in 2006/07 to TZS632 billion in 2011/12. Table 3.3 presents a summary
of the development and recurrent budget and actual expenditures from 2006/07 to 2011/12.
TABLE 3.3: SUMMARY OF RECURRENT AND DEVELOPMENT BUDGET
AND EXPENDITURES (BN TZS)
2006/07 2007/08 2008/09 2009/10 2010/11 2011/1
2
Bu
dget
Actu
al
Bu
dget
Actu
al
Bu
dget
Actu
al
Bu
dget
Actu
al
Bu
dget
Actu
al
Bu
dget
Recurrent 398 392 395 360 402 429 499 533 579 541 632
Development 122 122 221 211 361 273 426 375 641 369 532
Total 520 514 616 571 764 701 925 908 1,220 910 1,164
Percentage of Total
Recurrent 76.5% 76.3% 64.1% 63.1% 52.7% 61.1% 53.9% 58.7% 47.4% 59.4% 54.3%
Development 23.5% 23.7% 35.9% 36.9% 47.3% 38.9% 46.1% 41.3% 52.6% 40.6% 45.7%
Following faster growth in the development budget and expenditures relative to recurrent budget
and expenditures, the share of the development budget has increased significantly from 23.5 percent
in 2006/07 to 45.7 percent in 2011/12. Also, the share of development actual expenditure increased
from 23.7 percent in 2006/07 to 40.6 percent in 2010/11. Figure 3.5 presents the trend of the
relative shares of development and recurrent budget and expenditures during the period under
review.
6A detailed analysis of the recurrent expenditure within development expenditure is available in the Tanzania Public
Expenditure Review 2011, Chapter 2(Public Expenditure Review in the Health Sector), Dar es Salaam, May, 2012, Draft.

FIGURE 3.5: TREND OF SHARES OF RECURRENT AND DEVELOPMENT
BUDGET AND EXPENDITURES
3.5 PERFORMANCE OF THE HEALTH SECTOR BUDGET
Table 3.4 presents budget performance indicators over the period 2006/07–2010/11, summarized
according to budget classification (recurrent and development budget), and sources of funds
(government and foreign funds).
TABLE 3.4: BUDGET EXECUTION PERFORMANCE INDICATORS
2006/07 2007/08 2008/09 2009/10 2010/11
Execution of total budget 99% 93% 92% 98% 75%
Execution of recurrent budget 99% 91% 107% 107% 94%
Execution of development budget 100% 95% 75% 88% 58%
Execution of government funds 94% 91% 100% 105% 89%
Execution of foreign funds 111% 95% 79% 87% 59%
Execution of basket funds 103% 100% 86% 106% 79%
Execution of non-basket funds 126% 92% 75% 79% 51%
3.5.1 PERFORMANCE OF RECURRENT AND DEVELOPMENT BUDGET
In general, performance of the health sector budget has been satisfactory throughout the review
period, with an average annual execution rate of about 91 percent. However, the execution of the
budget in 2010/11 was only 75 percent, the lowest recorded in the past five years. The execution of
the recurrent budget has consistently exceeded 90 percent throughout the review period, and in
2007/08 and 2009/10 the performance was 107 percent, which is a reflection of the utilization of
76.5% 76.3%
64.1% 63.1%
52.7%
61.1%
53.9% 58.7%
47.4%
59.4% 54.3%
23.5% 23.7%
35.9% 36.9%
47.3%
38.9%
46.1% 41.3%
52.6%
40.6% 45.7%
0%
10%
20%
30%
40%
50%
60%
70%
80%
90%
Budget Actual Budget Actual Budget Actual Budget Actual Budget Actual Budget
2006/07 2007/08 2008/09 2009/10 2010/11 2011/12
RECURRENT DEVELOPMENT

15
funds after budget reallocations,7 based on the updated information. After 100 percent performance
in 2006/07 and 95 percent in 2007/08, the execution of the development budget fell to 75 percent in
2008/09, and even lower, to 57 percent, in 2010/11. The execution performance of the development
budget has been generally lower than for the recurrent budget, partly attributable to the lengthy and
difficult procurement procedures which cause delays in the implementation of the development
budget. Figure 3.6 shows the trend of recurrent and development budget performance.
FIGURE 3.6: RECURRENT AND DEVELOPMENT BUDGET PERFORMANCE
3.5.2 PERFORMANCE OF GOVERNMENT AND FOREIGN FUNDS
The budget execution of government funds has generally been higher than that of foreign funds
throughout the review period. However, in 2010/11, the performance of government funds was only
89 percent, down from 100 percent performance in the previous two fiscal years; and the
performance of foreign funds was even worse, with only about 59 percent of the budgeted funds
executed. Within foreign funds, the execution of the budgeted basket funds has generally been
better than that of the budgeted non-basket funds. The performance of non-basket funds has fallen
significantly to about 51 percent in 2010/11. The low execution of foreign funds is partly a result of
non-release of the budgeted funds. Figure 3.7 shows a comparison of execution of budgeted
government and foreign funds.
It is important to note that execution of government funds is higher than that of foreign funds mainly
because most of the planned government funds are released, while a significant chunk of budgeted
foreign funds is not released. Furthermore, most of the government funds are for recurrent
expenditures, and very little is for development expenditures where most of the procurement work
is done. Cumbersome procurement procedures hinder the absorption of the development funds
(and as a corollary, donor funds) as they are mainly meant for development activities.
7 It is important to note that reallocations are part of the “official budget” – but they come after the originally approved
estimates (by the parliament, in June–July/August). This is why any addition after that, and subsequent spending of the same,
would cause “performance” to exceed 100 percent; that is, expenditures exceeded what was originally budgeted.
Mathematically, if reallocations are added to the approved estimates (or removed), then budget performance will not
exceed 100 percent.
99%
91%
107% 107%
94% 100%
95%
75%
88%
57%
40%
50%
60%
70%
80%
90%
100%
110%
120%
2006/07 2007/08 2008/09 2009/10 2010/11
RECURRENT DEVELOPMENT

FIGURE 3.7: PERFORMANCE OF GOVERNMENT AND FOREIGN FUNDS
Figure 3.7shows a declining trend in the performance of foreign funds almost throughout the review
period. This trend has resulted from declining performance in both the execution of foreign basket
and non-basket funds as portrayed in Figure 3.8, reflecting non-release of budgeted funds by the
donors and the cumbersome procurement procedures.
FIGURE 3.8: PERFORMANCE OF BASKET AND NON-BASKET FOREIGN FUNDS
3.5.3 BUDGET EXECUTION PERFORMANCE AMONG LEVELS OF
GOVERNMENT
Based on collected information, there are variations in budget execution among layers of
government spending, with performance at regional and LGA levels being generally higher than other
layers. Table 3.5 provides a summary of budget performance among levels of the government.
94% 91%
100% 105%
89%
111%
95%
79%
87%
59%
40%
50%
60%
70%
80%
90%
100%
110%
120%
2006/07 2007/08 2008/09 2009/10 2010/11
Government Funds Foreign Funds
103% 100%
86%
106%
79%
126%
92%
75% 79%
51%
40%
50%
60%
70%
80%
90%
100%
110%
120%
130%
2006/07 2007/08 2008/09 2009/10 2010/11
Basket Funds Non-Basket Funds

17
TABLE 3.5: BUDGET PERFORMANCE AMONG LAYERS OF GOVERNMENT
2006/07 2007/08 2008/09 2009/10 2010/11
Central 97% 90% 92% 100% 69%
Regions 107% 94% 98% 104% 50%
LGAs 114% 97% 97% 94% 82%
3.5.4 BUDGET PERFORMANCE OF MOHSW DEPARTMENTS
For consistency, the performance of activities by different departments is categorized in four levels
as follows:
Level 1: Departments with a funds utilization rate above 80 percent are considered to have fully
implemented the activities as stipulated in the Medium-Term Expenditure Framework (MTEF)
(excellent performance).
Level 2: Departments with a funds utilization rate between 61 and 80 percent are considered to
have partially implemented the activities as stipulated in the MTEF (very good performance).
Level 3: Departments with a funds utilization rate between 41 and 60 percent are considered to
have partially implemented the activities as stipulated in the MTEF (average performance).
Level 4: Departments with a funds utilization rate between 0 and 40 percent are considered poor
performers.
Based on these categorizations of performance, only three departments fall under Level 1 (excellent
performance), which are: Curative Services (97.2 percent), Chief Medical Officer (96.9 percent), and
Human Resource Development (85.3 percent) (Table 3.6). The performance of the Curative
Services Department is excellent given that it includes funds for medicines (about 50 percent of the
“Other Charges”) which are sent directly to the Medical Stores Department (MSD).
The second level (very good performance) also has three departments: Preventive Services,
Administration and Personnel, and Policy and Planning. Social Welfare and Finance and Accounts
departments fall under the average performance category, while the Internal Audit Department has
poor performance with an execution rate of only about 34 percent. The poor performance of the
Audit Department is due to non-release of the allocated funds. Non-release of funds to the Audit
Unit threatens the functioning of the Unit and the entire Public Financial Management (PFM) system
of the MoHSW. The overall recurrent budget execution stands at 92.7 percent, which would fall
under excellent category, while development budget execution in only average at 55.1 percent.
TABLE 3.6: MOHSW BUDGET PERFORMANCE BY DEPARTMENT, 2010/11
MoHSW
Department/Units
Budget
(Mn TZS)
Actual Expenditure (Mn
TZS)
Execution
Performance
Level 1 (Departments with performance above 80%)
2001 Curative Health Services 151,313 147,064 97.2%
2003 Chief Medical Officer 6,678 6,470 96.9%
5001 Human Resource
Development
13,929 11,882 85.3%
Level 2 (Departments with performance between 61% and 80%)
3001 Preventive Services 26,952 20,564 76.3%
1001 Administration and
Personnel
3,202 2,267 70.8%
1003 Policy and Planning 272 175 64.2%
Level 3 (Departments with performance between 41% and 60%)
4002 Social Welfare 1,611 867 53.8%
1002 Finance and Accounts 186 85 45.9%
Level 4 (Departments/Units with performance 40% and below)
1004 Internal Audit Unit 92 32 34.3%
Aggregate departmental performance
Total recurrent 204,235 189,405 92.7%
Development 447,863 246,928 55.1%
Note: The recurrent budget and expenditure presented in the table excludes the MoHSW Personal Emoluments (PE) but includes the
PE for parastatals as this is allocated in the Other Charges (OC) budget.
3.5.5 EXPENDITURES BY KEY INTERVENTION AREAS
In the implementation of the 2010/11 budget, the MoHSW utilized about 76.8 percent of the
budgeted recurrent funds, and only about 53 percent of the budgeted development funds for key
intervention areas (Table 3.7). Apart from TZS6 billion in development funds allocated for
reproductive health, which were fully utilized (100 percent), the budget execution in other key
intervention areas (for recurrent expenditures) did not exceed 83 percent (in fact, only HIV/AIDS
and malaria reached 80 percent). Despite a low allocation for non-communicable diseases (NCDs)
(about TZS146 million), only TZS17 million were spent, equivalent to an 11.9 percent execution
rate.8 Budget execution in reproductive and child health interventions was 62 percent, with child
health interventions alone slightly behind, utilizing only 60 percent of the allocated funds.
8 The budget for NCDs has been small because initially, the country was facing a higher burden of communicable diseases.
It is just recently that the double burden (of communicable and non-communicable diseases) has been realized. Thus, the
government is striving to allocate more resources for NCDs, especially on the preventive and promotive aspects.

19
TABLE 3.7: MOHSW EXPENDITURE BY KEY INTERVENTION AREA, 2010/11
2010/2011 2011/2012
Budget Actual
Expenditure
Performance Budget
(Mn TZS)
Recurrent
Malaria 187 154 82.4% 249
TB 277 193 69.7% 221
NCDs 146 17 11.9% 1,125
HIV/AIDS 6,526 5,279 80.9% 2,368
Reproductive health 539 347 64.4% 437
Child health 550 331 60.1% 1,394
Total 8,225 6,321 76.8% 5,793
Development
Malaria 186,383 65,696 35.2% 48,802
TB 6,400 5,100 79.7% 155,730
HIV/AIDS 93,720 78,130 83.4% 90,357
Reproductive health 6,000 6,000 100.0% 8,000
Total 292,504 154,927 53.0% 302,889
Going forward, the overall allocation for intervention areas in the 2011/12 budget has increased by
about 3 percent, courtesy of a30-fold increase in the allocation for the development budget in TB
interventions. These funds are from various sources including the Global Fund and the central
government. If these resources for TB interventions are treated separately, the total allocations for
the other key intervention areas declined by about 48 percent in the 2011/12 budget. Despite the
seven-fold increase in recurrent allocation for NCDs and an approximately three-fold increase in
allocations for child health interventions, the total recurrent allocations for key intervention areas
declined by 30 percent. Furthermore, recurrent and development allocations for HIV/AIDS
interventions declined by 64 percent and 4 percent, respectively. Development spending for malaria
declined by 74 percent, while recurrent allocations for malaria increased by 33 percent. Poor
performance of the NCDs budget poses a concern given the threat these diseases pose to current
societies.
3.6 HEALTH SECTOR BUDGET AND EXPENDITURE BY
LEVELS OF GOVERNMENT
The relative shares of resources among levels of government have not changed much over the
review period, with the share of resources controlled by the MoHSW remaining dominant
throughout. However, the MoHSW share has declined slightly from 59.1 percent of the budget in
2006/07 to 52 percent in 2011/12, and from 58.2 percent of actual spending in 2006/07to 51.4
percent in 2010/11. Similarly, the share of centrally controlled resources, which includes MoHSW,
PMO-RALG, and the NHIF, declined from 67.9 percent in 2006/07 to 57.7 percent in 2011/12. The
share of resources going to the LGAs has increased from 27.7 percent of the budget in 2006/07 to
36.3 percent of the budget in 2011/12. Tables 3.8 and 3.9 present a summary of total funding and
shares of resources for the health sector at different levels of the government.

TABLE 3.8: HEALTH SPENDING BY LEVEL OF GOVERNMENT (BN TZS)
2006/07 2007/08 2008/09 2009/10 2010/11 2011/12 B
ud
get
Actu
al
Bu
dget
Actu
al
Bu
dget
Actu
al
Bu
dget
Actu
al
Bu
dget
Actu
al
Bu
dget
Central 353 325 379 343 481 426 521 521 743 536 672
Regions 23 25 42 40 52 51 57 60 72 40 69
LGAs 144 164 194 188 231 225 347 327 405 334 422
Total 520 514 616 571 764 701 925 908 1,220 910 1,164
TABLE 3.9: SHARE OF HEALTH RESOURCES TO THE DIFFERENT LEVELS OF
GOVERNMENT
2006/07 2007/08 2008/09 2009/10 2010/11 2011/12
Bu
dget
Actu
al
Bu
dget
Actu
al
Bu
dget
Actu
al
Bu
dget
Actu
al
Bu
dget
Actu
al
Bu
dget
Central 67.9% 63.3% 61.6% 60.1% 62.9% 60.7% 56.3% 57.4% 60.9% 58.9% 57.7%
Regions 4.4% 4.8% 6.9% 6.9% 6.8% 7.2% 6.2% 6.6% 5.9% 4.4% 5.9%
LGAs 27.7% 31.9% 31.5% 32.9% 30.3% 32.0% 37.5% 36.1% 33.2% 36.7% 36.3%
Total 100% 100% 100% 100% 100% 100% 100% 100% 100% 100% 100%
Table 3.9 gives an assessment of the shares of health sector budget and expenditures among two
broad levels – the central and local levels. The central level is aggregated to include the resources
controlled by the MoHSW, as well as resources under the NHIF and the PMO-RALG. The local
level includes resources under LGAs and regions. Health sector budget and expenditures have
continued to be concentrated at the central level, although there is slow progress in shifting the
share of resources to the local levels. The share of centrally controlled resources has declined from
68 percent of the budget in 2006/07 to 58 percent of the budget in 2011/12. Figure 3.9 shows the
relative shares of health budget and expenditure at the central and local levels.

21
FIGURE 3.9: TREND OF DISTRIBUTION OF RESOURCES
BETWEEN CENTRAL AND LOCAL LEVELS
Budget Actual Expenditure
The persistent dominance of central control of resources is partly a result of the procurement of
medical supplies (most of which eventually go down to the local level) and the payment of wages and
salaries, which are managed at the central level. Based on the available budget data, during the
review period, the share of medicines in the health budget increased from 15 percent in 2006/07 to
a maximum of 28 percent in 2010/11, before declining to 20 percent in 2011/12. By taking into
consideration the medicines budget, separation of health financing shares by government level
portrays a slightly different picture, with the central share declining to 37 percent in 2011/12. Figure
3.10 shows the trend of health financing shares with the medicine component isolated.
FIGURE 3.10: HEALTH FINANCING BY GOVERNMENT LEVEL, WITH MEDICINES
ISOLATED
68% 62% 63%
56% 61% 58%
32% 38% 37%
44% 39%
42%
0%
10%
20%
30%
40%
50%
60%
70%
80%
90%
100%
2006/0
7
2007/0
8
2008/0
9
2009/1
0
2010/1
1
2011/1
2
Central
63% 60% 61% 57% 59%
37% 40% 39% 43% 41%
0%
10%
20%
30%
40%
50%
60%
70%
80%
90%
100%
2006/0
7
2007/0
8
2008/0
9
2009/1
0
2010/1
1
46% 41% 34% 33% 37%
15% 22%
22% 28%
20%
38% 37% 44% 39% 42%
0%
10%
20%
30%
40%
50%
60%
70%
80%
90%
100%
2007/08 2008/09 2009/10 2010/11 2011/12
Local
Medicine
Central
Central
Local Local


23
4. COMPLEMENTARY HEALTH FINANCING
4.1 HEALTH SERVICES FUND
The HSF continues to be an important source of funding for health facilities especially for operations
and maintenance. The HSF receipts accounted for 3 percent of health expenditures by the LGAs in
2010/11.The same level of financing was observed in 2009/10.
Receipts from the HSF almost doubled between 2007/08 (TZS5.089 billion) and 2010/11 (TZS10.117
billion).This could be a reflection of the increase in population, but also the fact that the majority of
the population is not insured (see the discussion in Section 4.3, The Community Health Fund)9 and
hence end up paying out of pocket for health services. On the other hand, this might be reflecting an
increase in the utilization of services and/or better strategies for fee collection by the health facilities.
The HSF still has significant unspent funds, which by 2010/11 were equivalent to 20 percent of the
receipts – a decline from 26 percent observed in 2009/10. Both in 2009/10 and 2010/11, spent funds
exceeded the amounted collected which resulted in a decline in unspent balances (Table 4.1). Since
user fees are known to limit access to care especially for the poor, it is important to ensure that all
funds collected are utilized to improve service delivery, and as a corollary, stimulate the demand for
health services. It is also important to continue sensitizing communities on the advantages and
importance of prepayment schemes, especially in rural areas where incomes are not predictable.
TABLE 2: HEALTH SERVICES FUND (MN TZS)
2007/08 2008/09 2009/10 2010/11
Balance brought forward 3,016 1,614 3,905 2,037
Receipts 5,696 5,858 7,870 10,078
Payments 5,089 5,280 9,767 10,117
Unspent balance 3,615 2,192 2,008 1,998
Unspent balance as a % of receipts 63% 37% 26% 20%
4.2 THE NATIONAL HEALTH INSURANCE FUND
The NHIF mobilizes funds from employees and employers to finance health care services for its
members. The contribution rate is provided in the act establishing the fund as 6 percent of the
employee’s gross monthly salary (met equally by both employer and employee – 3 percent each).
NHIF membership size for the year 2010/11 is as follows: principal members, 468,611; dependents,
2,030,309; total beneficiaries, 2,498,920.
9 There could be other factors for the increase but identifying those is beyond the scope of this PER. A research project has to be commissioned to explore other factors, including whether there has been an increase in user-fee levels or
whether many more people seem to be coming to the public facilities versus the private facilities, which may indicate
improved attractiveness of the public facilities.
A comparison of figures from 2009/10 and 2010/11 indicate a continued increase in the premium
contribution to NHIF and income from other sources such as investment (about 50 percent for both
sources). This increase emphasizes the importance of NHIF in financing health services. However,
total funds paid to health facilities remains low at 27 percent (or 65 percent of total expenditure)
due to a number of challenges, some of which are discussed below.
Compared to FY09 figures, the NHIF unspent balance has declined slightly from 63 percent to 59
percent of the total annual income (Table 4.2), which is a concern considering the financing
shortages facing the health sector. Table 4.3shows the NHIF expenditures by component. Benefit
payments accounted for 65.2 percent of the total expenditures in 2010/11, which is a slight increase
from 2009/10, followed by administrative expenses (27.8 percent).
TABLE 3: NHIF INCOME AND REIMBURSEMENTS (MN TZS)
2006/07 2007/08 2008/09 2009/10 2010/11
Contributions 45,516 55,472 73,282 90,084 134,891
Total income (incl. income from investments and
others)
56,884 72,168 76,512 108,845 164,146
Percentage of funds paid out to health services
against total income of NHIF
14.4% 14.1% 18.4% 23.0% 27.0%
Actual spending including administration 23,950 26,719 34,325 39,782 68,048
Unspent balance as % of total income 58% 63% 55% 63% 59%
Source: NHIF (2012) and authors’ calculations.
TABLE 4: NHIF EXPENDITURE BY COMPONENT (MN TZS)
Expenditure Components 2009/10 2010/11
Expenditure % of total Expenditure % of total
Administrative expenses 12,180.45 30.6% 18,946 27.8
Benefits payment (reimbursement) 25,154.06 63.2% 44,352 65.2
Members services 2,426.51 6.1% 4,723 6.9
Finance charges 21.02 0.1% 28 0.04
Total expenditure for the NHIF 39,782.04 100.0% 68,048 100.0%
Source: NHIF (2012) and authors’ calculations.
Tables 4.4 and 4.5 present information on reimbursements by ownership category and by the level
of health facility, respectively. One notable aspect is the reimbursements made to faith-based health
facilities and pharmacies, which received 54 percent of the total. Faith-based health facilities are
important actors in health service delivery, especially in marginalized areas. Payments to Part I
Pharmacies alone accounted for 9.6 percent of the total disbursements. These are important entities
in addressing the problem of access to medicines. Disbursement to ADDOs is small, which is partly
a reflection of the size of these entities countrywide. However, the ADDOs are key conduits for
making medicine accessible to rural marginalized areas and more efforts should be made to
collaborate with these entities. This is also an area where the CHF funds could be used effectively.

25
TABLE 5: REIMBURSEMENT BY TYPE OF HEALTH FACILITY OWNERSHIP, 2010/11 (MN
TZS)
Ownership Amount % of Total Payment
Government facilities 14,471,051 32.6%
Faith-based/NGO facilities 19,707,673 44.4%
Private facilities (excluding pharmacies and ADDOs) 5,860,353 13.2%
Pharmacies 4,241,981 9.6%
ADDOs 70,496 0.2%
Total 44,351,555 100.0%
TABLE 6: REIMBURSEMENT BY LEVEL OF HEALTH FACILITY, 2010/11 (MN TZS)
Level of Facility 2010/11 2011/12
Budget Actual Estimates
Hospitals Referral 14,628,329 23,292,492 27,569,863
Regional 3,278,730 5,220,678 6,850,554
District 3,472,588 5,612,227 6,714,488
Health centers 1,721,931 2,741,807 3,312,869
Dispensaries 1,992,023 3,171,872 3,574,468
Pharmacies 2,597,834 4,241,981 4,600,607
ADDOs 162,564 70,496 137,033
Total 27,853,999 44,351,554 52,759,882
That government facilities are receiving 32.6 percent of total reimbursement is cause for concern
given the fact that they provide more services than faith-based facilities. The reimbursement is
according to fees for service. It is understandable that the government facilities receive less given
their lower charges, but this would effectively mean that the government is subsidizing the NHIF.
Over half of the budget and spending is going to referral hospitals (Table 4.5). There are many
factors involved in this, including the following:
Most of the services provided at the referral level are very expensive compared to lower levels
Prices per service are higher at the referral level and most referral hospitals have reviewed their
fee schedules
Most of the NHIF “Green Card10 “members are found at the urban centers compared to rural
areas
10 Majority of teachers and nurses reside in rural areas and they are all members of NHIF. However, these are the
members with brown card not green card which allows access to limited number of services. Contrary, those in urban
areas some have big salaries and thus qualify for green card. With green card, they consume more advanced services.
The NHIF faces several challenges in executing its functions, including:
i. Fraudulent practices among the accredited health facilities. The fund receives a number of
fraudulent claims from some accredited health service providers, featuring over-invoicing,
irrational medical practices(for instance, overuse of investigations), non-adherence to the
National Essential Medicine List and Standard Treatment Guidelines, extension of hospital
admission days or reporting of false admissions, and missing patient signatures or forged
signatures.
ii. Retrieval of NHIF membership ID cards of retired members and others whose membership
has expired. This is a problem because most staff leave their employers with their NHIF ID
cards, which makes it difficult to trace them.
iii. Frequent stock-outs of medicines in most accredited health facilities.
iv. Uncontrolled and frequent fluctuation of prices for services, medicines, and medical
consumables in the general market.
v. Insufficient health services and health personnel, particularly in rural areas where most NHIF
“Brown Card11” members reside. This means that NHIF members in those areas do not
receive services consistent with their expectations of the benefits of their membership.
vi. Negative attitude by some health providers towards NHIF members on the use of cards
versus cash due to immediate need of cash by heath facilities.
4.3 THE COMMUNITY HEALTH FUND
The CHF scheme was initiated in 1997/98 after the Igunga District Council (DC) pilot in 1996. By
2011, CHF had enrolled a total of 561,370 households, which is only 7.4 percent of the total
population (Table 4.6). CHF envisaged increasing membership from 400,000 households as of
December 2009/10 to 600,000 by June 2011, a level which was almost reached. However, the
ambition to increase the enrollment to 1,000,000 by 2012 will most likely not be achieved. Table 4.7
presents the actual figures as of December 2011, which shows a decline of enrolled households from
561,370 in June to 531,734 and which is equivalent to an estimated coverage of 7.4 percent of the
total population. TIKA (the urban equivalent of the CHF) has not picked up substantially, and only
150,138 households were enrolled in 2010/11.The number is projected to increase only to 171,156
in 2011/12.
Underperformance of CHF is a result of several factors, including lack of access to medicines. As a
result, some LGAs have lowered their premiums (Table 4.7). Efforts to promote enrollment of
households in CHF are evident at different levels. For instance, advocacy meetings have been
organized to impart CHF knowledge, data, and information to participants as shown in Table 4.7.
There are other efforts to promote CHF enrollment by international and national organizations such
the German Development Corporation (GIZ) and the German development bank, KFW, through
Tanzanian German Program to Support Health, Swiss Development Cooperation in Dodoma, and
Ifakara Health Institute in Morogoro Region.
11 See note 10.

27
TABLE 7: MEMBERSHIP IN CHF/TIKA
2010/11 (Actual) 2011/12 (Estimates)
CHF
Households 561,370 721,474
Beneficiaries 3,368,220 4,328,844
Payment of matching funds 2,016,739,000 4,000,000,000
Others 0 0
TIKA
Households 25,023 28,526
Beneficiaries 150,138 171,156
Payment of matching funds 30,938,000 100,000,000
TABLE 8: IMPLEMENTATION OF CHF ACTION PLAN
Area Components Status as of
June 30, 2011
Status as of Dec.
30, 2011
Remarks
CHF coverage Total households
registered
561,370 531,734 The CHF coverage with an average family
size of 6 represents 7.4% of the total
population (based on the 2011 population
projections) Councils that reported 108 108
Total population covered 3,368,220 3,190,404
Household
contributions
profile
Amount which
households contribute
per year(each)
TZS5,000–
20,000
TZS5,000–
20,000
13 councils have revised their premiums
upward: Bukombe, Moshi Municipal,
Korogwe, Mtwara Municipal, Tandahimba,
Nachingwea, Ruangwa, Songea Municipal,
Namtumbo, Morogoro District, Bukoba
District, Kilolo, and Igunga.
3 councils lowered their premiums;
Sumbawanga, Bagamoyo, and
Ngorongoro.
CHF benefits
package and
referral
arrangements
Standard basic benefit
package covers
reproductive and child
health care,
communicable diseases,
NCDs and trauma, and
clinical support services
Varies in its
applicability
among councils
Varies in its
applicability
among councils
Though the package was provided in the
CHF operational guidelines in 1999, most
users are not aware of this – each council
offers what seems to be convenient to
them. The matter has been brought to the
attention of the Directorate of Medical
and Technical Services at NHIF, especially
regarding the TIKA benefit package.
Matching funds Payments made to
councils whose
applications qualify to be
matched with
government grants
TZS2.5 Bn TZS3.5Bn As of December 2011

Area Components Status as of
June 30, 2011
Status as of Dec.
30, 2011
Remarks
Matching funds under
process
0 TZS840.3Mn Most applications that were received
were found to have anomalies; hence,
correspondence with respective
zones/councils was made.
Advocacy on
CHF by
headquarters
Participants imparted
with CHF knowledge,
data, and information.
550 960 410 participants from Lindi, Health
Financing Committee, Tanga, and Arusha
(CRDB Microfinance) were sensitized or
informed on CHF between June and
December 2011.
Councils status
of operation
Councils with by-laws and
instruments
108 108 There have been no changes during the
period under review. However,
promoting TIKA is expected to increase
the rollover.
Dormant councils (did
not apply for matching
fund in the last two years)
24 21 The list of dormant councils has been
shrinking, as it started with 48 in 2009/10.
Considering the statistics presented in Table 4.8 below, about 6 million people out of Tanzania’s
population of about 43 million (based on the 2011 population projections) has access to health
services through the two parallel schemes(the NHIF and the CHF). This is equivalent to about 14
percent of the total population. This means the majority of Tanzanians who are not exempted from
paying for health services must pay at the point of service delivery, as discussed in section 4.1,
Health Services Fund. It is estimated that only about 3 percent of Tanzanians are insured through
private health insurance, and 1 percent through the National Social Security Fund.
TABLE 9: INSURANCE COVERAGE TO TOTAL POPULATION, 2010/11
Principal
Members
Dependents Total
Beneficiaries
Coverage to
Total Population*
NHIF membership 468,611 2,030,309 2,498,920 5.8%
CHF membership 561,370 2,806,850 3,368,220 7.8%
Total NHIF and CHF beneficiaries 1,029,981 4,837,159 5,867,140 13.6%
*Using 2011 population projections
29
5. LOCAL GOVERNMENT HEALTH SECTOR
SPENDING
5.1 INTRODUCTION
This chapter presents an analysis of local government health spending based on the data compiled
from the CCHPs; TFIRs in 125 out of the 133 LGAs; and data from the seven tracked districts.
While the data from the 125 LGAs were meant to shed light on the sources of health financing and
allocations to different sub-votes and programs, the data from the tracked districts go further by
providing some information on service delivery in terms of availability of essential drugs. A total of
14 dispensaries, 19 health centers, 4 districts hospitals, and 4 regional hospitals participated in the
tracking study. The primary purpose of collecting the service delivery information is to gauge the
value for money – that is, whether the disbursed funds as analyzed in the PER have an impact on
service delivery.
5.2 SOURCES OF FUNDS TO FINANCE HEALTH SERVICES IN
LGA
The sources of funding to finance the health sector are in five major categories: the budgetary
allocations from the government (block grants); donor basket and non-basket funds; funds from
council own sources; fees and subscriptions from various schemes; and other sources that are
unclassified. Table 5.1shows the sources of funds, allocations, and expenditures for 2010/11. Block
grants from the government constitutes the largest share (57.4 percent of actual expenditures),
followed by donor basket funds (18 percent of the actual expenditures). The share of block grants
increased from 52.2 percent in 2009/10 to 57.4 percent in 2010/11. Meanwhile, the share of basket
funds has declined from 21.3 percent in 2009/10 to 18 percent in 2010/11.
The average expenditure from in-kind sources amounted to 8 percent of the total expenditure.
Further, other funding sources (not specified) contributed about 6 percent of the total expenditure,
and this contribution is expected to reach 9 percent based on the 2011/12 budget estimates. These
unpredictable and substantial off-budget funds pose challenges to LGAs’ planning processes. The
average actual expenditure from councils’ own resources accounted for only 1 percent in 2010/11,
which is a decline from 2 percent in 2009/10; it is estimated to return to2 percent for 2011/12. This
low allocation from LGAs’ own revenue threatens the sustainability of health interventions should
there be a shock to the funds from the central level (government and development partners).
Some districts indicated the Primary Health Services Development Program (in Swahili, acronym
MMAM) as a source of funds and it accounted for 5 percent of the total actual expenditures of the
surveyed LGAs. This is a huge increase compared to the share reported in the 2009/10 PER (0.6
percent). This could be a reflection of the fact that more districts are reporting MMAM as a source
of funds rather than an increase of the disbursements. It has been reported that there are large
amounts of unrealized funds from development partners. Also there are challenges in the way this
fund is allocated – using a recurrent formula rather than assessing the needs for infrastructure
development against objectively determined requirements. This leads to some councils not having
sufficient funds to do what they need to do. These funds come from a combination of government
and development partner sources and are earmarked for MMAM activities.
There is concern over LGA budgeting for some sources. LGAs seem to be overambitious in
budgeting and the budgeting for some sources do not reflect the previous spending. This is notable

for NHIF, cost sharing, and MMAM funds (Table 5.1). For instance, the estimate for 2011/12 for
MMAM is more than double the actual expenditure in 2010/11. This is not realistic.
TABLE 5.1: SOURCES OF FUNDS AND TOTAL AMOUNT FOR 125 LGAS (TZS)
Sources 2010/2011 2011/2012
Approved Budget Actual Expenditure Actual
Expenditure
(% of Total)
Estimates
Block grants 216,454,617,771 170,980,370,156 57.4% 275,144,699,103
Basket fund 57,378,810,288 53,762,902,631 18.0% 65,992,031,177
Global Fund 4,788,370,409 844,741,984 0.3% 4,792,297,004
UNICEF 1,951,577,906 910,947,561 0.3% 10,721,692
CHF 3,519,419,856 2,627,257,173 0.9% 4,411,925,252
NHIF 1,657,255,399 1,036,486,116 0.3% 2,453,000,212
Cost sharing 9,497,199,609 7,156,968,446 2.4% 12,465,167,399
Own source 6,439,655,159 2,703,534,631 0.9% 9,202,929,745
DRF 346,419,322 439,892,812 0.1% 459,369,100
In-kind 199,884,711,219 24,020,575,605 8.1% 40,310,387,269
JRF 495,966,083 428,269,210 0.1% 388,804,735
LGDG 2,297,364,394 1,128,398,612 0.4% 5,913,877,254
MMAM 32,898,294,754 14,397,617,202 4.8% 37,039,790,240
Others 43,494,961,697 17,692,256,874 5.9% 44,571,021,795
TOTAL 581,104,623,869 298,130,219,016 100.0% 503,156,021,977
Note: DRF=Drug Revolving Fund; JRF=Joint Rehabilitation Fund; LGDG=Local Government Development Grant; MMAM=Mpango
wa Maendeleo ya Afya ya Msingi
It is important to note that there are variations in sources of funds per council which are masked by
the nationally presented averages. Table 5.2 illustrates the sources of funding in the seven LGAs
tracked for the year 2010/11. Noticeably, there are significant variations in the composition of funds
from the identified sources across LGAs. Budget allocations from the central government in form of
block grants range from 83 percent in Babati Town Council (TC) to 39 percent in Kondoa DC.
Basket funding ranges from a low of 13 percent of the total public health sector funds in 2010/11 in
Arusha City Council (CC) to a high of 23 percent in Mbozi DC. This variation is a cause for concern
given that the government budget and health basket funds are meant to be applied by same formula;
that is, the ratio should be stable even if other sources vary by district. While the ratio for Kondoa
DC was 2:1, the one for Muleba was 8:1, which is a huge variation.

31
TABLE 5.2: PERCENT SHARE OF SOURCES OF FUNDS FOR HEALTH EXPENDITURES
Name of District Block
Grant
Basket
Fund
Complementary
Financing
Council Own
Fund
In-Kind
Receipts
Other
Sources
1. Rufiji DC 59.5% 18.4% 6.8% 0.3% 11.0% 4.1%
2. Mbozi DC 63.6% 23.5% 4.6% 0.5% 0.0% 7.8%
3. Kondoa DC 39.2% 20.4% 2.1% 1.3% 0.0% 37.0%
4. Muleba DC 46.1% 15.6% 38.3% 0.0% 0.0% 0.0%
5. Arusha CC 62.2% 12.7% 2.3% 13.5% 0.0% 9.3%
6. Babati TC 83.2% 9.7% - 0.0% 0.0% 7.2%
7. Mtwara MC 49.3% 20.5% 0.4% 0.1% 6.8% 23.1%
There is significant health funding in the LGAs from “other sources.” Kondoa DC has the highest
share of expenditure from other sources (37 percent), followed by Mtwara MC (23 percent).
Mostly, the funds from other sources are off-budget and are not reported at the central level. These
are sources which are specific to the councils, e.g., funds from private bilateral arrangements for
direct project support. Most LGAs didn’t report the in-kind support, but it has been found to be 7
percent and 11 percent, respectively, for Mtwara MC and Rufiji DC. Complementary financing is
very high in Muleba DC (38 percent) as a result of significant financing from the NHIF and HSF.
Muleba DC is also well networked with faith-based organizations – their fees are a bit higher, but the
council is good about claiming for reimbursement as shown in several NHIF reimbursements
reports. Expenditures from council own funds are insignificant in all councils except Arusha CC (13.5
percent).
It is important to note that expenditure data collected at the central level on overall health spending
at the LGA level is different from the data collected at the LGA level. According to the information
collected from MoF, LGAs spent a total of TZS333,863 million on health services in 2010/11,
compared to TZS298,130 million reported at LGA level by the 125 LGAs. The difference is
significant, and it could be echoing poor record-keeping at the LGA level, but also the fact that only
125 councils have been included in the analysis.
Of the total TZS298,139 million expended by the LGAs, TZS170,980 million (57 percent) went to
recurrent expenditures, and 86 percent was utilized for personnel emoluments (Table 5.3). The
central government contributed 63 percent of funds spent at the LGAs in 2010/11. Development
expenditures were largely financed by development partners mainly through basket funding,
accounting for about 42 percent, which is a decline from 59 percent observed in 2009/10.

TABLE 5.3: LOCAL GOVERNMENT HEALTH SPENDING (TZS)
Sources of Funds 2010/11 2011/12
Approved
Estimates
Actual
Expenditure
% of Total
(Actual)
Approved Estimates
Government Fund (PE) 178,143,254,266 146,401,509,485 85.62% 242,360,873,095
Government Fund (OC) 38,311,363,505 24,578,860,672 14.38% 32,783,826,008
RECURRENT 216,454,617,771 170,980,370,156 57.35% 275,144,699,103
DEVELOPMENT TOTAL 364,650,006,098 127,149,848,860 42.65% 228,011,322,874
Grand Total 581,104,623,868 298,130,219,016 100% 503,156,021,976
5.3 BUDGET PERFORMANCE IN LGAS
Table 5.4 presents the figures on budget performance by the 125 LGAs studied. According to the
classifications stipulated in Section 3.5.4, Budget Performance of MoHSW Departments, overall,
councils have very good performance (77 percent). It is worth noting that in the analysis, the Global
Fund, in-kind support, and funds from other sources have been omitted since they are unpredictable
and, in most cases, not released. The basket fund and Drug Revolving Fund (DRF) have excellent
performance (94 percent and 86 percent, respectively). For the DRF funds, the expenditure exceeds
the budget which may reflect under budgeting and possible reallocation of funds. Contrary to
2009/10 when CHF had the lowest performance (50 percent), Table 5.4 shows that 74 percent of
the budgeted funds were actually spent. However, the councils collected only half of what was
estimated.
The seven districts that were tracked in this study showed an impressive budget performance, apart
from Babati DC and Mbozi DC (Table 5.5). As shown in Table 5.2, only Rufiji DC and Mtwara MC
reported expenditures from in-kind support, while Kondoa DC and Mtwara MC reported large
expenditures from other sources. These two sources of funds have the lowest budget performance
(19 percent and 14 percent, respectively). These funds have contributed to the low performance
observed in the respective districts.

33
TABLE 5.4: BUDGET PERFORMANCE IN 125 LGAS (TZS)
Sources 2010/2011 2011/2012
Approved Budget Actual
Expenditure
% Expenditure Estimates
Block grants 216,454,617,771 170,980,370,156 78.99% 275,144,699,103
Basket fund 57,378,810,288 53,762,902,631 93.70% 65,992,031,177
UNICEF 1,951,577,906 910,947,561 46.68% 10,721,692
CHF 3,519,419,856 2,627,257,173 74.65% 4,411,925,252
NHIF 1,657,255,399 1,036,486,116 62.54% 2,453,000,212
Cost sharing 9,497,199,609 7,156,968,446 75.36% 12,465,167,399
Own source 6,439,655,159 2,703,534,631 41.98% 9,202,929,745
DRF 346,419,322 439,892,812 126.98% 459,369,100
JRF 495,966,083 428,269,210 86.35% 388,804,735
LGDG 2,297,364,394 1,128,398,612 49.12% 5,913,877,254
MMAM 32,898,294,754 14,397,617,202 43.76% 37,039,790,240
TOTAL 332,936,580,541 255,572,644,550 76.76% 413,482,315,909
TABLE 5.5: BUDGET PERFORMANCE OF THE SAMPLED SEVEN LGAS (TZS)
Name of District Budget Actual Expenditure % Expenditure
1. Rufiji DC 4,529,672,583 3,468,018,903 76.56%
2. Mbozi DC 4,751,658,415 3,248,974,697 68.38%
3. Kondoa DC 10,109,795,116 7,596,788,718 75.14%
4. Muleba DC 763,634,663 699,583,952 91.61%
5. Arusha CC 4,054,710,000 3,889,893,425 95.94%
6. Babati TC 1,854,255,827 1,242,272,601 67.00%
7. Mtwara MC 2,301,039,418 2,131,964,623 92.65%
5.4 HEALTH SPENDING AT THE LGA LEVEL BY SUB-VOTES
Information on intergovernmental transfers for the sector (i.e. the recurrent block grants and any
development grants), is disaggregated by four sub-votes in the LGA budget as per government
official estimates. The sub-votes are:
5010 Health Services (largely curative and includes any Council District Hospital and District
Designated Hospitals, and allocations for Council Health Management Teams and Council Health
Services Board)
5011 Preventive Services (these include preventive outreach services and health education)
5012 Health Centers
5013 Dispensaries
Table 5.6 shows the allocation of funds by these sub-votes. It is important to note that since
2009/10, another category has been introduced in the CCHPs – namely, “Community Initiatives.” It
is noted from Table 5.6 that the actual amount spent in 2010/11 falls short of the approved amount

by only 17 percent. Further, health spending at the LGA level has increased by 24 percent from
2009/10.
TABLE 5.6: HEALTH SPENDING AT THE LGA LEVEL BY SUB-VOTE (MN TZS)
2007/08 2008/09 2009/10 2010/11 2011/12
Approved Estimates
Actual Expenditure
Approved Estimates
Actual Expenditure
Approved Estimates
Actual Expenditure
Approved Estimates
Actual Expenditure
Approved Estimates
5010
(Health
Services)
41,033 41,033 48,071 48,071 49,646 42,423 68,057 50,423 62,384
5011
(Preventive
Services)
16,710 16,710 17,293 17,293 72,023 60,496 54,962 72,166 95,519
5012
(Health
Centers)
35,128 35,128 35,598 35,598 61,846 48,592 83,206 60,890 83,700
5013
(Dispensaries)
44,592 44,592 43,940 43,940 78,920 63,200 116,638 87,889 102,369
Community
Initiatives
35,872 17,788 28,831 17,589 24,539
TOTAL 137,463 137,463 144,902 144,902 298,308 232,499 351,694 288,957 369,511
Table 5.7 shows the shares of expenditures by sub-votes. The shares were almost constant across
the sub-votes from 2006/07 to 2008/09, with Health Services (sub-vote 5010) and Dispensaries (sub-
vote 5013) receiving the biggest share, followed by Health Centers (sub-vote 5012). However, from
2009/10, there is a notable change, with Preventive Services receiving a larger share than Health
Services.
TABLE5.7: AVERAGE SHARES OF TOTAL EXPENDITURE PER SUB-VOTE FOR 125 LGAS
2007/08 2008/09 2009/10 2010/11 2010/11
(Estimates)
5010 (Health Services) 30% 33% 18% 17% 17%
5011 (Preventive Services) 12% 12% 26% 25% 26%
5012 (Health Centers) 26% 25% 21% 21% 23%
5013 (Dispensaries) 32% 30% 27% 30% 28%
Community Initiatives NA NA 8% 6% 7%

35
Again, these averages (average for 125 LGAs) mask the district variations as observed in the six
tracked districts (Table 5.8).There is no consistency in funds allocated by sub-votes across the six
councils that provided data. For instance, while Mbozi DC allocated only 10 percent of funds to sub-
vote 5010 (Health Services), Arusha CC allocated the highest amount (52 percent) of all the
councils. No clear pattern of expenditure by sub-vote can be noted from Table 5.8.
TABLE 5.8: RECURRENT BLOCK GRANT ALLOCATIONS PER SUB-VOTE, 2010/11
District/Sub-Vote Health
Services
Preventive
Services
Health
Centers
Dispensaries Community
Initiatives
VAH
1. Rufiji DC 11% 35% 22% 30% 1% 0%
2. Mbozi DC 10% 45% 30% 13% 2% 0%
3. Kondoa DC 35% 17% 19% 28% 2% 0%
4. Arusha CC 52% 4% 39% - 3% 2%
5. Babati TC 23% 15% 22% 35% 5% 0%
6. Mtwara MC 19% 6% 22% 32% 21% 0%
VAH=Voluntary Agencies Hospital
5.5 HEALTH SPENDING BY PROGRAMS
Pharmaceuticals command 50 percent of the total expenditures on programs, followed by
expenditures on reproductive and child health (Table 5.9). These levels of spending are a reflection
of the national priorities as stipulated in the HSSP-III.
TABLE 5.9: HEALTH SPENDING BY PROGRAM (TZS)
2010/11 2011/12
Estimates Actual % Expenditure Estimates
HIV 11,886,902,874 6,944,387,965 14% 13,480,857,036
Malaria 1,754,450,178 1,268,099,850 3% 4,700,397,592
Pharmaceuticals 33,160,999,255 24,172,634,994 50% 44,400,364,460
TB 3,553,871,372 1,371,884,430 3% 3,061,168,454
Reproductive and
child health
20,172,569,882 14,609,470,296 30% 30,733,854,467
TOTAL 70,528,793,562 48,366,477,536 100% 96,376,642,008
Analysis of availability of tracer drugs in the sampled councils shows that most of the tracer drugs
were available during the survey period: at dispensaries (79 percent); health centers (80 percent),
district hospitals (95 percent), and regional hospitals (100 percent). Annex C shows the list of tracer
drugs on which information was sought.

5.6 HUMAN RESOURCES FOR HEALTH
Data collected from the central level show great improvement in deployment of human resource for
health. This improvement is a reflection of the budget allocation for training and deployment of
human resource for health. The overall gap in 2010/11 is 41 percent. The gap for AMOs has almost
closed, followed by laboratory technicians (Table 5.10). A huge gap is still observed with dentists and
pharmacy technicians.
TABLE 5.10: HUMAN RESOURCE GAP
Cadre Required Available % of Required Staff
Available
% Human Resource
Gap
Doctors 1031 578 56.1 44.0
AMOs 2093 1527 73.0 27.0
Dentists 184 65 35.3 64.7
Dental assistants 1022 422 41.3 58.7
Pharmacists 220 129 58.6 41.4
Pharmacy techs 464 200 43.1 56.9
Clinicians 9963 5781 58.0 42.0
Nurses 15753 9268 58.8 41.2
MCH aide 866 855 98.7 1.3
Laboratory staff 733 461 62.9 37.1
Radiology staff 237 132 55.7 44.3
Health officers 2278 1242 54.5 45.5
Others 700 316 45.1 54.9
TOTAL 35544 20976 59.0 41.0
Source: MoHSW Human Resource Department, and report presented to the Parliamentary Committee with regard to progress
made in implementing MMAM.

37
6. CONCLUSIONS AND
RECOMMENDATIONS
6.1 HIGHLIGHTS OF PER FY11 FINDINGS
General trend of health financing
The share of the public health budget in the total government budget, excluding CFS, has declined
from 12.3 percent in 2010/11 to 10.0 percent in 2011/12; with the CFS included, the share of health
budget fell from 10.5 percent in 2010/11 to a mere 8.6 percent in 2011/12. Similarly, the share of
actual health spending in total government spending (excluding CFS) declined from 13.1 percent in
2009/10 to 11.9 percent in 2010/11, while with CFS included the decline in the share of health
spending was modest, from 9.9 percent in 2009/10 to 9.5 percent in 2010/11. This level of
expenditure (which includes donor funding) is below the Abuja target, despite the reiterated
commitment by the government to increase the share of health allocation in the budget to 15
percent of total government budget. In 2010/11, public health expenditures were only about 2.7
percent of GDP, while public health budgetary allocations were down to 2.8 percent of GDP in the
2011/12 budget compared to 3.5 percent of GDP in the 2010/11 budget.
Per capita expenditures
In nominal terms, public health allocations per capita increased from TZS13,385 (USD11) in 2006/07
to TZS28,673 (USD19.80) in 2010/11, before falling to TZS26,563 (USD17.30) in 2011/12. Actual
per capita health spending increased from TZS13,698 (USD11) in 2006/07 to TZS21,635 (USD14.90)
in 2010/11. In real terms however, the increase was only modest, from TZS9,069 (USD7.30) to a
peak of TZS15,425 (USD10.60) in 2010/11, and then down to TZS13,348 (USD8.70) per capita for
public health allocations; and from TZS9,012 (USD7.20) to a peak of TZS12,236 (USD8.80) in
2009/10, and then back down to TZS11,639 (USD8) per capita for actual public health expenditures.
Thus, the per capita health spending is still low, and falls significantly short of the WHO
recommended target of USD54 to address health challenges. It is also well below the HSSP-III
projections of USD15.75 per capita spending by 2009/10.
Government contribution
Government contribution to health expenditures declined from 71 percent in 2006/07 to a low of
53 percent in 2010/11, and is estimated at 59 percent in the 2011/12 budget. However, because of
much higher execution of local funds in the implementation of the budget, the share of government
funds in the actual health spending has remained above 60 percent throughout the review period.
The share of external health financing increased from 29 percent in the 2006/07 budget to a
maximum of 47 percent in the 2010/11 budget, and is estimated at 41 percent in the 2011/12 budget.
Also, it is worth noting that foreign funding still accounts for a dominant share of the development
budget in health interventions. This trend points to a potential threat to the sustainability of health
sector financing in case of an unanticipated decline in donor funding in the sector.
Budget performance
Although the execution of the health sector budget was generally good throughout the review
period, with annual average execution of 91 percent, the performance of the 2010/11 budget was
very low (only 75 percent of the budgeted funds utilized). The performance of the recurrent budget
has been generally higher than the development budget, which recorded a very low execution of 58
percent in 2010/11. Performance of government funds was generally higher than foreign funds for

the past three fiscal years. With regard to foreign funds, the execution of basket funds was better
than the non-basket funds, which recorded a very low execution of 51 percent in 2010/11. Budget
performance continues to be hindered by factors including the low absorption capacity of the
spending units, delays in the release of funds, non-release of funds, and lengthy and cumbersome
procurement processes, which affect particularly the implementation of development projects.
Complementary financing
Between 2007/08 and 2010/11, receipts from the HSF have almost doubled. Although this could be
reflecting an increase in population, it is also reflecting the fact that majority of the population is not
insured; only 14 percent of Tanzanians are insured through NHIF and CHF combined. Further, the
HSF continues to accumulate unspent balances, and in 2010/11 the balance was equivalent to 20
percent of receipts, which is a decline from 26 percent observed in 2009/10. In both 2009/10 and
2010/11, more was spent than was collected which resulted in decreases of the unspent balance.
NHIF also has a large unspent balance, although this balance has declined from 63 percent in 2009/10
to 59 percent in 2010/11 of the total annual income. These funds (HSF and NHIF) should be used to
improve health services promptly while maintaining prudent, actuarially determined reserves.
Holding very large reserves defeats the whole purpose of collecting these funds.
Local government spending
“Other” sources of funding (which are substantially off-budget) increased from 7 percent in 2009/10
to 14 percent in 2010/11. Further, actual expenditure from councils’ own resources remained
constant at 2 percent. This is a threat to the sustainability of health interventions should there be a
shock to the funds from the central level (government and development partners).
Access to tracer drugs
Access to tracer drugs from the sampled health facilities was found to be high. This reflects efforts
made by councils to procure medicines from MSD, but also reflects the accreditation of Part I
Pharmacies and ADDOs to serve NHIF/CHF clients. These pharmacies and ADDOs are key
conduits for making medicine accessible to rural, marginalized areas, and more efforts should be
made to work with ADDOs. This is also an area where the CHF funds could be used effectively.
Human resource for health
There has been great improvement in the deployment of human resource for health, which is a
reflection of budget allocations to training and deployment of human resource for health. The overall
gap in 2010/11 is 41 percent, compared to about 65 percent in 2006/07.
6.2 RECOMMENDATIONS
1. Despite the reiterated commitment to increase the share of health sector financing in the
government budget to at least the 15 percent recommended in the Abuja Declaration, this has
yet to be achieved, and the share shrank to below 12 percent in2011/12. It is high time that
this commitment is honored with the deserved political will if progress is to be made in
addressing the key challenges in the sector, particularly in human resources (retention and
recruitments to fill the existing gap) and infrastructure.
2. Execution of the development budget continues to be plagued by several impediments,
including the low absorption capacity, delayed release of funds, non-release of funds, and
complexities in the procurement processes. Efforts should be scaled up to address these
impediments to ensure smooth implementation of the budget.
3. Although the delivery of health services is largely concentrated at the local government level,
the largest share of health sector financing is still managed at the central level. Despite this
observation, it is worth noting that a significant portion of the funds managed at the central

39
level eventually goes down to the local level, particularly in the form of medical supplies.
Nonetheless, the process of decentralization should be expedited, with particular focus on
capacity strengthening for LGAs in the areas of finance management and procurement.
4. The poor performance of the MoHSW Internal Audit Unit due to non-release of the allocated
funds threatens the functioning of the unit and the entire MoHSW PFM system. Thus, it is
imperative to release funds as budgeted so as to enable the unit to perform its functions
effectively.
5. Efforts to promote enrollment of households in CHF are evident at different levels. Lessons
from best-performing districts and programs such as Tanzanian German Program to Support
Health and Swiss Development Cooperation’s CHF Strengthening program in Dodoma should
be harnessed and applied nationwide. The major actors here include NHIF and LGAs.
6. Accreditation of Part I Pharmacies and ADDOs to serve the NHIF/CHF clients is an excellent
move. These pharmacies and ADDOs are key conduits for making medicine accessible to
rural, marginalized areas, and more efforts should be made to work with ADDOs. The NHIF
and Tanzania Food and Drugs Authority are key actors here.
7. The government should intensify efforts on the linkages between CHF to NHIF to work
toward universal coverage.


41
ANNEXES


43
ANNEX A: AGGREGATE DATA USED
FOR ANALYSIS (MN TZS)
2006/07 2007/08 2008/09 2009/10 2010/11 2011/12
Approved
Estimates
Actual
Expenditure
Approved
Estimates
Actual
Expenditure
Approved
Estimates
Actual
Expenditure
Approved
Estimates
Actual
Expenditure
Approved
Estimates
Actual
Expenditure
Approved
Estimates
Recurrent
National Health Insurance
Fund
24,050 23,950 27,971 26,719 30,177 34,325 41,283 39,782 63,700 68,048 85,538
Ministry of Health
Government funds 195,981 178,822 192,875 168,379 196,378 207,521 218,393 221,575 229,979 220,629 219,367
Donor basket funds 20,389 31,482 - - - - - - - - -
Regional Administration (Regions)
Government funds 19,115 19,052 28,761 26,024 30,927 32,218 37,447 36,214 42,933 36,036 49,650
Local Government Authorities
Government funds 114,779 115,392 145,286 139,168 144,902 154,494 201,488 235,171 242,000 216,088 277,281
Donor basket funds 23,331 23,094 - - - - - - - - -
Total recurrent 397,645 391,792 394,893 360,290 402,384 428,558 498,611 532,742 578,612 540,801 631,836
Development
Ministry of Health
Government funds 7,123 7,010 5,481 4,940 13,029 11,778 13,029 9,339 9,874 6,973 9,874
Donor basket funds 34,766 25,534 36,595 36,595 49,302 36,247 50,331 64,606 58,315 53,781 72,736
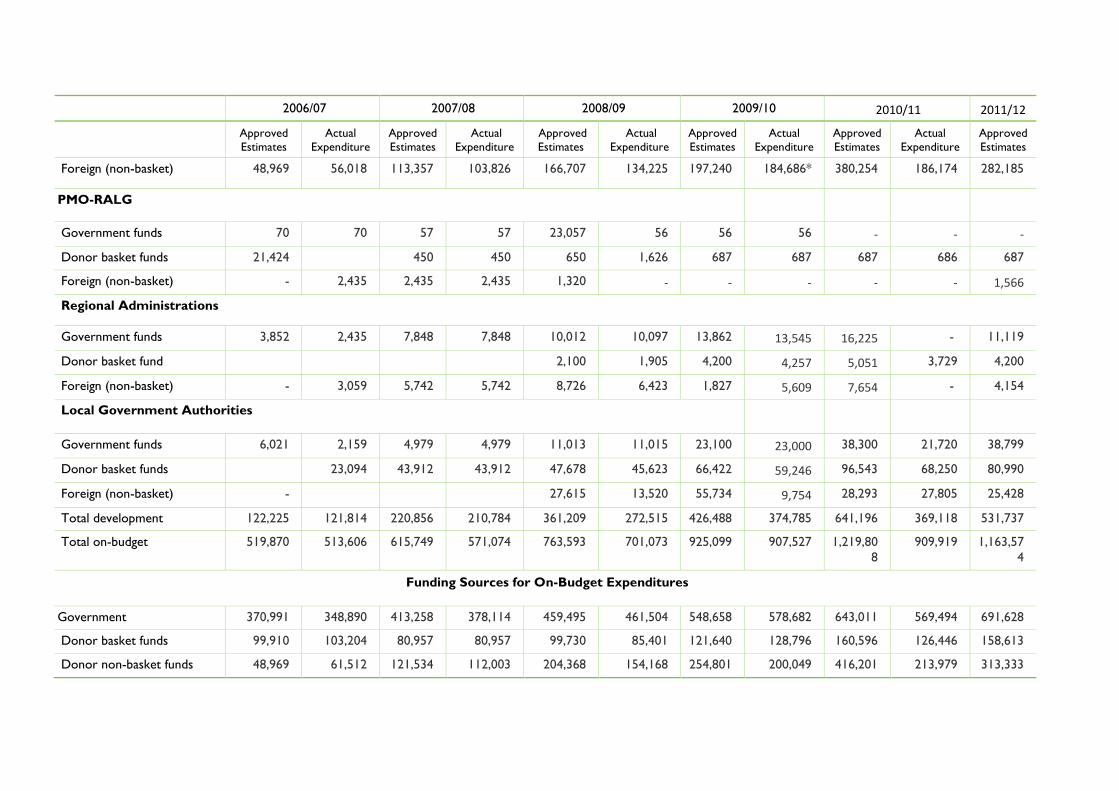
2006/07 2007/08 2008/09 2009/10 2010/11 2011/12
Approved
Estimates
Actual
Expenditure
Approved
Estimates
Actual
Expenditure
Approved
Estimates
Actual
Expenditure
Approved
Estimates
Actual
Expenditure
Approved
Estimates
Actual
Expenditure
Approved
Estimates
Foreign (non-basket) 48,969 56,018 113,357 103,826 166,707 134,225 197,240 184,686* 380,254 186,174 282,185
PMO-RALG
Government funds 70 70 57 57 23,057 56 56 56 - - -
Donor basket funds 21,424 450 450 650 1,626 687 687 687 686 687
Foreign (non-basket) - 2,435 2,435 2,435 1,320 - - - - - 1,566
Regional Administrations
Government funds 3,852 2,435 7,848 7,848 10,012 10,097 13,862 13,545 16,225 - 11,119
Donor basket fund 2,100 1,905 4,200 4,257 5,051 3,729 4,200
Foreign (non-basket) - 3,059 5,742 5,742 8,726 6,423 1,827 5,609 7,654 - 4,154
Local Government Authorities
Government funds 6,021 2,159 4,979 4,979 11,013 11,015 23,100 23,000 38,300 21,720 38,799
Donor basket funds 23,094 43,912 43,912 47,678 45,623 66,422 59,246 96,543 68,250 80,990
Foreign (non-basket) - 27,615 13,520 55,734 9,754 28,293 27,805 25,428
Total development 122,225 121,814 220,856 210,784 361,209 272,515 426,488 374,785 641,196 369,118 531,737
Total on-budget 519,870 513,606 615,749 571,074 763,593 701,073 925,099 907,527 1,219,80
8
909,919 1,163,57
4
Funding Sources for On-Budget Expenditures
Government 370,991 348,890 413,258 378,114 459,495 461,504 548,658 578,682 643,011 569,494 691,628
Donor basket funds 99,910 103,204 80,957 80,957 99,730 85,401 121,640 128,796 160,596 126,446 158,613
Donor non-basket funds 48,969 61,512 121,534 112,003 204,368 154,168 254,801 200,049 416,201 213,979 313,333

45
2006/07 2007/08 2008/09 2009/10 2010/11 2011/12
Approved
Estimates
Actual
Expenditure
Approved
Estimates
Actual
Expenditure
Approved
Estimates
Actual
Expenditure
Approved
Estimates
Actual
Expenditure
Approved
Estimates
Actual
Expenditure
Approved
Estimates
TOTAL 519,870 513,606 615,749 571,074 763,593 701,073 925,099 907,527 1,219,80
8
909,919 1,163,57
4
Off-Budget Expenditure
Cost sharing
Health Services Fund –
hospital/cost sharing
-
2,964
-
5,696
- 5,858 - 9,767 - 10,116 -
Community Health Fund –
primary health care
- - - - - - - 1,017 - 4,096 -
Total off-budget - 2,964 - 5,696 - 5,858 - 10,784 - 14,212 -
Grand total 519,871 516,570 615,748 576,769 733,878 706,931 925,099 918,311 1,219,80
8
924,131 1,163,57
4
*There was a typing error with this figure in the 2009/10 Health Sector Public Expenditure Review. The correct figure is 184,686, not 84,686


47
ANNEX B: GLOSSARY OF TERMS
Consolidated Fund Services (CFS): The component of government spending that covers public
debt service.
Exchange Rate: The price of one currency in terms of another (in this report, exchange rate
refers to the price of 1 U.S. dollar [USD] in terms of Tanzanian shillings [TZS]).
Community Health Fund (CHF): CHF is a voluntary pre-payment scheme whereby members
pay a small contribution on a regular basis to offset the risk of needing to pay a much larger amount
at the health facility through user fees if they become sick. It was instituted as possible mechanism
that could help in granting access to basic health care services to populations in the rural areas and
the informal sector in the country.
Drug Revolving Fund (DRF): This fund was established as a source of revenue for replenishing
drugs in the public facilities. The idea was for patients to pay 50 percent of the cost of the drug at
the public health facilities. The money collected would be used by hospitals to supplement the
government budget allocation for drugs.
Health Services Fund (HSF): HSF are funds that are collected at the point of service delivery at
the public health facilities as cost sharing in health for people who are not insured through CHF,
NHIF, TIKA, or any other health insurance agency.
Joint Rehabilitation Fund (JRF): The JRF came into operation in 2004 as the means of
earmarking and channelling funds for the rehabilitation of primary health care facilities in poor
condition. The main contributors were the government, Danida, and the Health Basket Fund. A
small amount of funding was also provided to Regional Health Management Teams for supervision
and to the Prime Minister’s Office-Regional Administration and Local Government for technical
support to councils, audit, and coordination and monitoring.
JRF was replaced by the Health Sector Development Grant (HSDG) in 2008/09. This operated as a
“window” within the broader Local Government Development Grant system, using the same
allocation formula as the health Other Charges and the Health Basket Fund. Subsequent years’
allocations were expected to be based also on performance. Funds under HSDG are to support the
implementation of the Primary Health Services Development Program (MMAM in Swahili) with the
aim of improving access to quality health services. It is a 10-year program (2007–2017) which is
geared toward improving access to primary health services.
Local Government Development Grant (LDGD): The LGDG system was initiated under the
Local Government Reform Program to provide additional funds for capital development at the Local
Government Authority (LGA) level. There are two types of grant – the LGDG for those councils
meeting a minimum set of criteria reflecting both existence of necessary structures as well as
performance; and Capacity Building Grants for those councils which did not meet the criteria.
Matching Fund: This is the fund paid to the LGAs based on how much they have collected in
terms of CHF and TIKA (the urban equivalent of CHF). The fund matches what the LGAs have
collected. The matching fund is paid by NHIF but not out of members’ contributions or income from
its investments; the money is from a WB loan facility. For instance, if an LGA has collected TZS100
million, then the National Health Insurance Fund matches it by paying TZS100 million to the
respective council.

National Health Insurance Fund (NHIF): The NHIF mobilizes funds from employees and
employers to finance health care services for its members. The contribution rate is provided in the
act establishing the fund, which sets the premium at 6 percent of the employee’s gross monthly
salary (met equally by both employer and employee – 3 percent each).
Nominal Expenditure: The value of expenditure reported at current prices.
Real Expenditure: The value of expenditure adjusted for the effect of price changes
(inflation/deflation).
Deflator: A factor used to adjust the nominal values to real values by removing the effect of price
changes.
Off-Budget: Expenditure items that are not captured in the budget records.
Tiba kwa Kadi (TIKA): TIKA is the urban equivalent of the CHF. This has been introduced in
urban areas in order to address urban-specific dynamics in living arrangements and accessing health
care.

49
ANNEX C: LIST OF TRACER
MEDICINES/ITEMS FOR COMPREHENSIVE
COUNCIL HEALTH PLANS
(VACCINES, MEDICINES, CONTRACEPTIVES, AND MEDICAL AND
LABORATORY SUPPLIES)
Select 1 or 0:1=Available; 0=Not available
If Not available, then select A, B, or C:
A= Not available less than 1 week;
B= Not available for 1–3 weeks;
C= Not available the whole month.
Line
No.
Description Available? If “No” Stock-Out Rate
1 DPT + HepB/HiB vaccine for immunization 1=Yes
0=No
A: <1 week
B: 1–3 weeks
C: whole month
2 Artemether/Lumefantrine (ALu) oral
3 Amoxycillin or
Cotrimoxazole oral
4 Albendazole or
Mebendazole oral
5 Oral rehydration salts
6 Ergometrine or
Oxytocin injectable or
Misoprostol oral
7 Medroxyprogesterone injectable
contraceptive
8 Dextrose 5% or
Sodium Chloride + Dextrose IV solution
9 Syringe and needle, disposable
10 Malaria rapid diagnostic test (MRDT) or
Supplies for malaria microscopy
11 Optional Line 1:
12 Optional Line 2:

TRACER LINES FOR HEALTH MANAGEMENT INFORMATION
SYSTEM (MTUHA)
Background
The Ministry of Health and Social Welfare has revised and updated the indicator on the availability of
drugs, medical supplies, laboratory reagents, and vaccines that will be part of the pilot new health
management information system (MTUHA). The indicator reports a number of “tracer” lines/items
that is set to a maximum of 10, to keep the burden of reporting manageable. There can be an
additional two lines left as blanks on the data collection form to be defined according to local
interest (at the districts/regions each year)– for example, safe delivery kits/packs for mothers.
Definition of Availability
For each tracer line, “availability” is defined as continuous supply of the specified item or therapeutic
equivalent. If the required service or treatment was provided to clients and patients of all age groups
throughout the month, then the tracer line is defined as available.
EXAMPLE 1: If labor was managed with oxytocin injection while ergometrine injection was out of
stock, then the Tracer Line 6 is reported as available, because the case was managed with a
therapeutic equivalent. If all of the therapeutic alternatives (oxytoxin, ergometrine, or misoprostol)
were out of stock, then Line 6 is reported as not available because the recommended treatment
could not be provided.
EXAMPLE 2: If cases of malaria in one of the age groups could not be treated, then the Tracer Line 2
for the antimalarial medicine “ALu” is reported as not available. If an adult with malaria was
dispensed ALu in two strips of 6 X 2 (instead of one strip of 6 X 4) then ALu is reported as
available, because the treatment dose was provided.
Purpose
The purpose of this tracer indicator is to report on the Comprehensive Council Health Plan
indicator on availability: “Proportion of health facilities by level with constant supply of
drugs/medical supplies and laboratory agents at hospital, health center, and dispensary
level.”
Reporting
Each health facility reports availability (Yes/No) of tracer items during the reporting period
(1calendar month). If “No,” then facility reports the duration of stock-out (<1 week. 1–3 weeks, or
whole month). The district report tabulates the number and proportion of health facilities reporting
continuous supply for each tracer line. Secondary analysis tabulates the number of facilities having
stock-out of all therapeutic alternatives in the tracer line, and the number falling in each category (A,
B, or C).