Health Quality Partners’ Model of Community-based Care ... · Health Quality Partners’ Model of...
26
Health Quality Partners’ Model of Community-based Care Management: An Innovation that Improves Health Care Delivery, Outcomes, and Cost in Chronically Ill Older Adults Ken Coburn, MD, MPH CEO & Medical Director [email protected] Thanks to: HQP staff & Board (Fritz Wenzel, Chair), Doylestown Hospital (Rich Reif, CEO), Mary Naylor, CMS (CMMI/Medicare Demonstration and Rapid Cycle Evaluation Groups), Mathematica Policy Research, Aetna, Clinical Care Associates of UPHS (Ron Barg, Exec Dir), Crozer-Keystone Health System, St. Mary Medical Center (Langhorne, PA), hundreds of physicians, NPs, nurses, and other health care and community service providers, and thousands of Medicare beneficiaries © 2012 Health Quality Partners, Inc. All rights reserved.
-
Upload
dangkhuong -
Category
Documents
-
view
219 -
download
0
Transcript of Health Quality Partners’ Model of Community-based Care ... · Health Quality Partners’ Model of...

Health Quality Partners’ Model of Community-based Care Management: An Innovation that Improves Health Care Delivery, Outcomes, and Cost in Chronically Ill Older Adults
Ken Coburn, MD, MPH
CEO & Medical Director
Thanks to: HQP staff & Board (Fritz Wenzel, Chair), Doylestown Hospital (Rich Reif, CEO), Mary Naylor, CMS (CMMI/Medicare Demonstration and Rapid Cycle Evaluation Groups), Mathematica Policy Research, Aetna, Clinical Care Associates of UPHS (Ron Barg, Exec Dir), Crozer-Keystone Health System, St. Mary Medical Center (Langhorne, PA), hundreds of physicians, NPs, nurses, and other health care and community service providers, and thousands of Medicare beneficiaries
© 2012 Health Quality Partners, Inc. All rights reserved.

Chronic Disease: Healthcare’s Defining Challenge in the Modern Age
• Global rise of non-communicable chronic disease
– Leading cause of death worldwide (WHO report 2010)
– Cardiovascular, cancer, diabetes, chronic lung
• Overall decline of acute infectious diseases
• This transformation has been rapid
– Technology driven (antimicrobials, vaccines, sanitation)
© 2012 Health Quality Partners, Inc. All rights reserved.
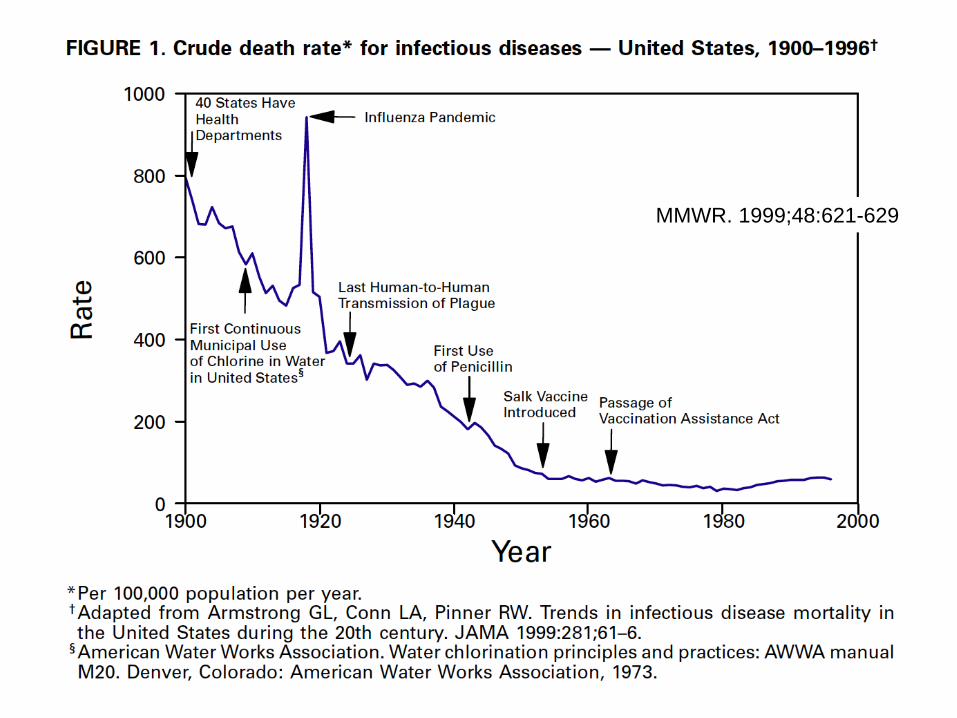
MMWR. 1999;48:621-629

Shift in Causes of Death in U.S.
Not so long ago; (Two of my grandparents were born in 1905 & 1906)
Healthy People 2010: Understanding and Improving Health
1997
1900


0%
5%
10%
15%
20%
25%
30%
1900 1910 1920 1930 1940 1950 1960 1970 1980 1990 2000 2010 2020 2030 2040 2050
% 60+ % 65+ % 85+
From HHS, Administration on Aging website
Older Population by Age: 1900-2050 - Percent 60+, Percent 65+, and 85+

The Impact on Health Care Costs
• Costliest 25% of Medicare beneficiaries accounted for 85% of spending in 2001
• Advanced age and prevalence of chronic conditions was strongly linked to high expenditures and use of medical services – More than 75% of high-cost beneficiaries had one
or more of 7 major chronic conditions • Much less prevalent among low cost beneficiaries
From: CBO, High-cost Medicare Beneficiaries, May 2005
© 2012 Health Quality Partners, Inc. All rights reserved.

Health Quality Partners (HQP)
• A 20-person non-profit in Doylestown, Pennsylvania dedicated to improving population health through system redesign and applied R&D
– 11 years as HQP & core team together 3+ yrs prior
– Intense mission focus and constancy to purpose
– Population-based analysis, reporting, and care management systems
– Design and implementation of quality and performance improvement systems
• System and process design, team models, and information rich management tools
– Sensitivity to operations and high-reliability
© 2012 Health Quality Partners, Inc. All rights reserved.

Current Areas of Work at HQP
• Medicare Coordinated Care Demonstration (CMS)
• Medicare Advantage (higher-risk) care management (Aetna)
• Improving Systems Initiative (Doylestown Hospital)
• Cancer care coordination model (Clinical Cancer Center
at Froedtert & the Medical College of Wisconsin)
© 2012 Health Quality Partners, Inc. All rights reserved.

HQP Collaborating Partners
Doylestown Hospital (lead hospital)
HQP Main Office
Physician Practices
HQP Collaborating Physician Practices & Service Area
Tested in primarily in 4 counties in eastern Pennsylvania, with 90+ primary care practices
© 2012 Health Quality Partners, Inc. All rights reserved.
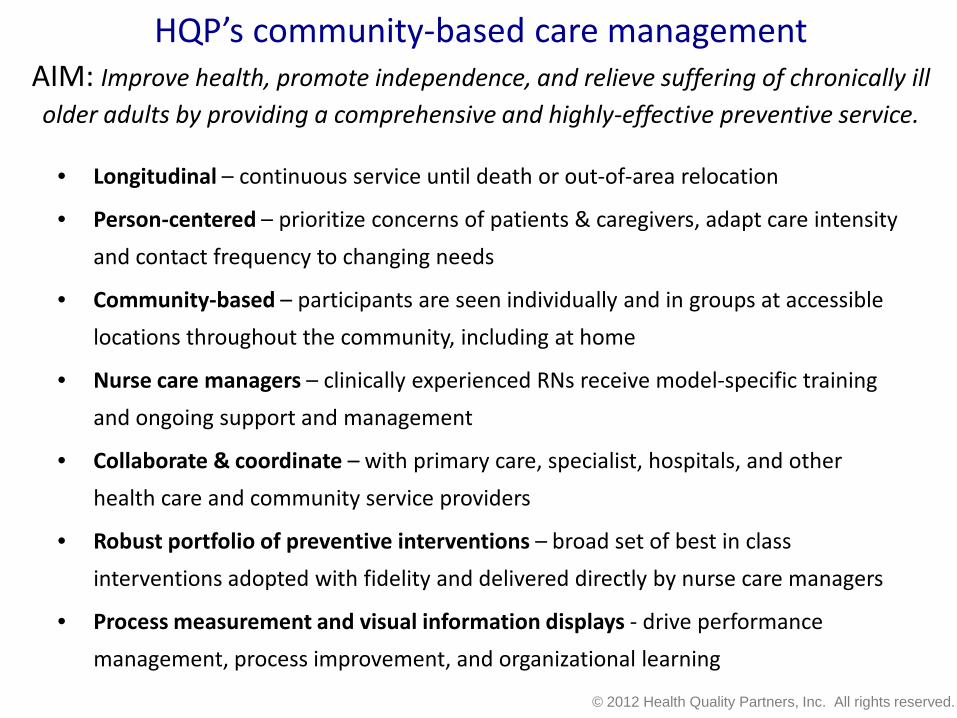
HQP’s community-based care management AIM: Improve health, promote independence, and relieve suffering of chronically ill older adults by providing a comprehensive and highly-effective preventive service.
• Longitudinal – continuous service until death or out-of-area relocation
• Person-centered – prioritize concerns of patients & caregivers, adapt care intensity
and contact frequency to changing needs
• Community-based – participants are seen individually and in groups at accessible
locations throughout the community, including at home
• Nurse care managers – clinically experienced RNs receive model-specific training
and ongoing support and management
• Collaborate & coordinate – with primary care, specialist, hospitals, and other
health care and community service providers
• Robust portfolio of preventive interventions – broad set of best in class
interventions adopted with fidelity and delivered directly by nurse care managers
• Process measurement and visual information displays - drive performance
management, process improvement, and organizational learning
© 2012 Health Quality Partners, Inc. All rights reserved.

Recap: Guiding Principles of HQP’s Model
• A robust portfolio of evidence-based, best in class interventions provided directly by nurses
• Long-term, person-centered helping relationships
– In-person contacts at a frequency that supports the patient’s evolving needs
• Focus on multidimensional determinants of health
• Systems approach
• Continuous organizational learning / improvement
– High reliability
© 2012 Health Quality Partners, Inc. All rights reserved.
Presenter
Presentation Notes

1997 1998 1999 2000 2001 2002 2003 2004 2005 2006 2007 2008 2009
Time
Pro
gram
Com
pone
nts
Disease Specific Care Managers Geriatric Specific Care ManagersIntegrated Disease & Geriatric Care Managers Patient Referrals by PhysiciansPatient Referrals through Claims and Practice Data Prioritization - Claims and Other DataStratification - Diagnosis based Stratification - Geriatric & Disease Risk AssessmentComprehensive Assessments 1:1 Education & Self ManagementGroup Education Structured Weight LossLifestyle Physicial Activity & Exercise FallProof Balance & Mobility ProgramAggregate Data Analysis Data Analysis- cohort, patient, management Care Transitions Protocol
University of Pennsylvania
PennCARE
Health Quality Partners - MCCD
HQP’s model has evolved greatly over 14 years and several settings; a robust SET of interventions, delivered reliably, are required to be effective
© 2012 Health Quality Partners, Inc. All rights reserved.

Management Practices that Support High Performance of the Nurse Care Management Team
• Selective recruitment
• Extensive orientation and training with a Clinical Lead
• Weekly team ‘huddles’
• Ongoing training, education, certifications
• One-on-one supervision
• Supervisory observation visits
• Guidance is a phone call away – Standards for shared
accountability & supervisory notification
– Clinical Leads and Director invite and encourage collaborative problem solving, case review and nursing support
© 2012 Health Quality Partners, Inc. All rights reserved.

Integrated Management and Performance Monitoring System
• Aimed at standardizing performance & ensuring reliability
• Essential for growth and expansion without loss of effectiveness
• HQP’s program is demanding to implement and requires – Considerable initial and ongoing staff training
– Tight adherence to standards and process specifications
– Reliable execution (low process variation)
– Continuous refinement, learning and adaptation
– A management process that is dedicated to » Using data and advanced analysis
» Understanding causes of variation
» Coaching, mentoring and providing continuous feedback
© 2012 Health Quality Partners, Inc. All rights reserved.

© 2012 Health Quality Partners, Inc. All rights reserved.

Process/Outcome Dashboards; Web-based Report Combines Process Reliability and Outcomes
By Nurse Care Manager Caseload – LDL
Total
Pop
ulatio
n /
Multip
le Me
asur
es
Click
Sing
le me
asur
e by
nurse
pane
l
© 2012 Health Quality Partners, Inc. All rights reserved.
Presenter
Presentation Notes

One Preventive Care Measure Example; Flu vaccination 2010 – 2011 Season
Web-based statistical process control charting is used extensively to robustly compare performance between groups or over time; here’s a ‘cross-sectional’ p-chart of flu vaccination coverage by nurse
95.8%
© 2012 Health Quality Partners, Inc. All rights reserved.

Care Manager / Team Performance
Cross-sectional p-chart comparing the rate of monthly “no contacts” by care manager; example shows: low variation between nurses, performance within spec. limit, but still with ‘outliers’ (including a positive deviant)
© 2012 Health Quality Partners, Inc. All rights reserved.

• Medicare Coordinated Care Demonstration
– Randomized, controlled trial; HQP model vs. usual care
– Implemented in 90+ practices in 4 counties of eastern PA
– April 2002 to present, 2,600+ traditional Medicare beneficiaries
– Low, moderate, and high risk patients served during first 8 years
– Serving higher-risk patients since late 2010
• HF, CAD, DM, COPD and 1+ hospitalizations in prior year
• Aetna Medicare Advantage
– Difference-in-differences analysis; trend of HQP cohort vs. like comparison
– 50+ practices in eastern PA, started 2010
– Serving higher-risk patients selected by diagnoses, utilization, and Aetna
proprietary risk scoring methodology
Program Implementation & Evaluation: A Decade of R&D
© 2012 Health Quality Partners, Inc. All rights reserved.

Medicare Coordinated Care Demonstration (MCCD); longest, most rigorous, evaluation of care coordination
Randomized, controlled trial testing ‘Care Coordination’ models for chronically ill Medicare beneficiaries (Authorized in BBA 1997, Started April 2002)
• April, 2002: 15 different programs were competitively selected from 58 applications
• April, 2006: 11 programs continued
• April, 2008: 2 programs continued
• June, 2010: 1 program continued (Health Quality Partners) with extension through June 2013 and CMS request to expand regionally
© 2012 Health Quality Partners, Inc. All rights reserved.
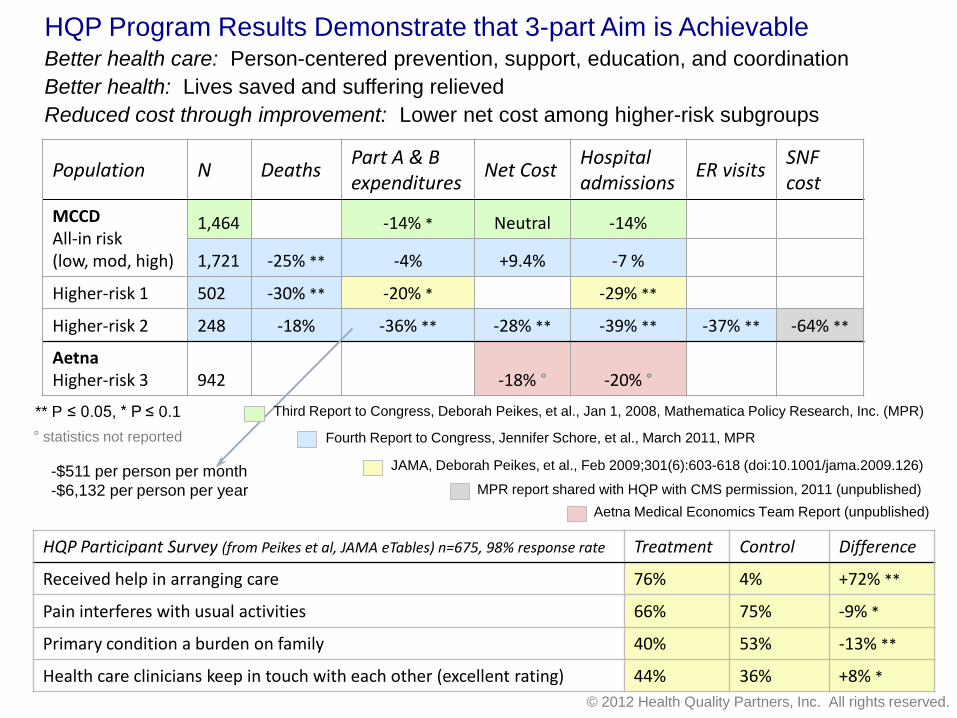
Population N Deaths Part A & B expenditures
Net Cost Hospital admissions
ER visits SNF cost
MCCD All-in risk (low, mod, high)
1,464 -14% * Neutral -14%
1,721 -25% ** -4% +9.4% -7 %
Higher-risk 1 502 -30% ** -20% * -29% **
Higher-risk 2 248 -18% -36% ** -28% ** -39% ** -37% ** -64% **
Aetna Higher-risk 3 942 -18% ° -20% °
HQP Program Results Demonstrate that 3-part Aim is Achievable Better health care: Person-centered prevention, support, education, and coordination Better health: Lives saved and suffering relieved Reduced cost through improvement: Lower net cost among higher-risk subgroups
** P ≤ 0.05, * P ≤ 0.1 Fourth Report to Congress, Jennifer Schore, et al., March 2011, MPR
JAMA, Deborah Peikes, et al., Feb 2009;301(6):603-618 (doi:10.1001/jama.2009.126)
MPR report shared with HQP with CMS permission, 2011 (unpublished) Aetna Medical Economics Team Report (unpublished)
HQP Participant Survey (from Peikes et al, JAMA eTables) n=675, 98% response rate Treatment Control Difference
Received help in arranging care 76% 4% +72% **
Pain interferes with usual activities 66% 75% -9% *
Primary condition a burden on family 40% 53% -13% **
Health care clinicians keep in touch with each other (excellent rating) 44% 36% +8% *
-$511 per person per month -$6,132 per person per year
° statistics not reported
Third Report to Congress, Deborah Peikes, et al., Jan 1, 2008, Mathematica Policy Research, Inc. (MPR)
© 2012 Health Quality Partners, Inc. All rights reserved.

Readmissions among HQP’s MCCD Participants at Doylestown Hospital; April 2002 thru March 2009
© 2012 Health Quality Partners, Inc. All rights reserved.

Kaplan-Meier Plots of Death up to 5 Years from Enrollment: Control (blue) versus Intervention (red)
All enrollees; n=1,736 25% decrease in relative risk of death
Top tertile geriatric risk on intake; n=568 34% decrease in relative risk of death
Coronary heart disease as primary Dx on intake; n=300 48% decrease in relative risk of death
The ability to improve survival is a clear indication of the impact of effective prevention in this population
© 2012 Health Quality Partners, Inc. All rights reserved.

Insights gained and future opportunities • Variables that significantly impact savings
– Target population, effectiveness in improving health outcomes, program cost (start-up, scale, and
demonstration-related overhead), and time frame
• Access to Data on diagnoses, health service utilization, and clinical tests
– Would significantly improve efficiency (case-finding), and effectiveness (better monitoring)
• Incentives for hospitals and PCPs to partner with effective providers of this model could
– Accelerate dissemination
– Optimize efficiency and fidelity to program implementation to preserve effectiveness
• Complementary to / synergistic with emerging primary care models
– Interface can be designed to minimize redundancy of work and be mutually reinforcing
• HQP’s Replication and Reliability Platform
– An integrated suite of tools to support training, decision support, performance analysis, and program
monitoring and guidance would boost scalability and enhance reliability
• Robust and sustained research & development effort seems warranted
– Design, adapt, and test variations of the HQP model to serve other vulnerable, at-risk populations
• Scale it up! The next frontier …
– Supporting scalability R&D could fit portfolio of CMMI, other HHS agencies, and/or foundations
– Unique opportunity for ACO’s and consortia of health systems, physician groups, and health plans
© 2012 Health Quality Partners, Inc. All rights reserved.

HQP looks forward to further collaboration to create a better health system and improve the health of
vulnerable populations
http://www.hqp.org