Health Promotion and Aging - lghttp.48653.nexcesscdn.netlghttp.48653.nexcesscdn.net › ... ›...
62
Health Promotion and Aging edition 5
Transcript of Health Promotion and Aging - lghttp.48653.nexcesscdn.netlghttp.48653.nexcesscdn.net › ... ›...

Health Promotion and Aging
edition5

David Haber, PhD, is the John and Janice Fisher Distinguished Professor of Wellness and Gerontology at Ball State University in Muncie, Indiana. Dr. Haber was a professor at the University of Texas Medical Branch in Galveston, and before that he served as the director of Creighton University’s multidisciplinary shopping mall–based Center for Healthy Aging in Omaha, Nebraska. Dr. Haber received his PhD in sociology from the Andrus Gerontology Center at the University of Southern California at Los Angeles.
Dr. Haber is a fellow in the Gerontological Society of Amer-ica, and he is recognized for two Best Practice Awards from the National Council on Aging, the Distinguished Teacher Award from the Association for Gerontology in Higher Education, and the Molly Mettler Award for Leadership in Health Promotion from the National Council on Aging. The third edition of his book, Health Promotion and Aging, was selected for the 2004 Book of the Year Award by the American Journal of Nursing in two categories: Gerontologic Nursing, and Community and Public Health. Dr. Haber also authored Health Care for an Aging Society.
Dr. Haber has authored more than 80 academic publications while teaching three experientially oriented classes per semester, and is actively involved in community health interventions funded by research grants. He has been project director or principal inves-tigator and author of 20 research or demonstration grants related to health and aging. Typically, these applied projects have involved health profession and gerontology students leading community health promotion ventures with older adults, and contributing to the evaluation of these programs. His current research interests are contracts and life reviews.
David Haber, PhD
edition5
Health Promotion and Aging
Practical Applications for Health Professionals

Copyright © 2010 Springer Publishing Company, LLC
All rights reserved.
No part of this publication may be reproduced, stored in a retrieval system, or trans-mitted in any form or by any means, electronic, mechanical, photocopying, record-ing, or otherwise, without the prior permission of Springer Publishing Company, LLC, or authorization through payment of the appropriate fees to the Copyright Clearance Center, Inc., 222 Rosewood Drive, Danvers, MA 01923, 978-750-8400, fax 978-646-8600, [email protected] or on the Web at www.copyright.com.
Springer Publishing Company, LLC11 West 42nd StreetNew York, NY 10036www.springerpub.com
Acquisitions Editor: Sheri W. SussmanSenior Editor: Rose Mary PiscitelliCover design: TG DesignProject Management/Composition: Becca Mosher/Publication Services, Inc.
ISBN: 978-0-8261-0598-1Ebook ISBN: 978-0-8261-0599-8
10 11 12 13/ 5 4 3 2 1
The author and the publisher of this Work have made every effort to use sources believed to be reliable to provide information that is accurate and compatible with the standards generally accepted at the time of publication. Because medical science is continually advancing, our knowledge base continues to expand. Therefore, as new information becomes available, changes in procedures become necessary. We recommend that the reader always consult current research and specific institu-tional policies before performing any clinical procedure. The author and publisher shall not be liable for any special, consequential, or exemplary damages resulting, in whole or in part, from the readers’ use of, or reliance on, the information contained in this book. The publisher has no responsibility for the persistence or accuracy of URLs for external or third-party Internet Web sites referred to in this publication and does not guarantee that any content on such Web sites is, or will remain, accu-rate or appropriate.
Library of Congress Cataloging-in-Publication Data
Haber, David, 1944- Health promotion and aging : practical applications for health professionals / David Haber. -- 5 ed. p. ; cm. Includes bibliographical references. ISBN 978-0-8261-0598-1 (alk. paper) 1. Preventive health services for older people--United States. 2. Health promo-tion--United States. 3. Older people--Health and hygiene. I. Title. [DNLM: 1. Primary Prevention--methods. 2. Aged. 3. Health Behavior. 4. Health Education--methods. 5. Health Promotion--methods. WA 108 H114hb 2010] RA564.8.H33 2010 362.198'9700973--dc22 2010010655
Printed in the United States of America by Bang Printing.

v
List of Figures xiList of Tables xvForeword xviiPreface xixAcknowledgments xxiii
1 INTRODUCTION 1Healthy People Initiatives ● 2Sociodemographic Trends ● 6Definitions of Healthy Aging ● 21Health Perspectives and Aging ● 29Health Care ● 31
2 HEALTH EDUCATORS: COLLABORATION AND COMMUNICATION 37
Collaboration● 39Communication● 48Cruising the Internet ● 52Communication Barriers Between Health Professionals ●
and Older Clients 60
3 CLINICAL PREVENTIVE SERVICES 67Medical Screenings and Prophylaxis: ●
Considerable Controversy 68Breast Cancer● 71Menopause and the Hormone Replacement Therapy ●
(HRT) Controversy 77Blood Pressure ● 80Osteoporosis● 83Cholesterol● 85Cervical Cancer ● 90
Contents

vi Contents
Colorectal Cancer ● 91Prostate Cancer ● 93Skin Cancer ● 95Hearing and Vision ● 96Oral Health ● 98Diabetes● 99Depression● 100Other Medical (and Dog and Cat) Screenings ● 101Immunizations● 103Aspirin Prophylaxis ● 105The Polypill ● 106Medicare Prevention ● 107A Final Word ● 112
4 HEALTH BEHAVIOR CHANGE 115Health Behavior Assessments and Interventions ● 117Ten Tips for Changing Health Behaviors ● 130Health Behavior Theories ● 136A Health Promotion and Aging Model ● 148
5 EXERCISE 153Surgeon General’s Report on Physical Activity and ●
Health 154The Most Popular Activity of All: Walking ● 157Exercise for Disease Prevention and Functional ●
Improvement 159The Four Components of My Exercise Class ● 167Other Exercises ● 183
●
Arthritis: A Barrier to Exercise and Activity ● 187Selected Topics ● 191
6 NUTRITION 197The Food Guide Pyramid ● 200The Personalized Nutrition ● Bull’s-Eye 206Good Nutritional Habits ● 209Fat● 210Cholesterol● 215Carbohydrates and Fiber ● 217Sugar● 219Protein● 219Water● 221
The Activity Pyramid 186
Contents vii
Vitamins and Minerals ● 222Sodium and High Blood Pressure ● 225Calcium and Osteoporosis ● 228Nutrition Labels ● 229Malnutrition● 232Selected Topics ● 233
7 WEIGHT MANAGEMENT 245Trends in Weight Gain ● 246Surgeon Generals and Directors of Centers for Disease ●
Control and Prevention 248Overweight and Obesity ● 249Genetics, Lifestyle, and Environment ● 251Should We Gain Weight With Age? ● 255Body Composition ● 256Exercise● 258Low-Carbohydrate, High-Protein Diets ● 260Other Weight Loss Programs ● 263Bariatric Surgery ● 267Caloric Input and Expenditure ● 269Ten Tips for Weight Loss or Maintenance ● 272Selected Weight Management Topics ● 274
8 COMPLEMENTARY AND ALTERNATIVE MEDICINE 281
National Center for Complementary and Alternative ●
Medicine 282Prevalence of Complementary and Alternative ●
Medicine 284Types of CAM ● 285CAM and Medical Education ● 293Selected CAM Topics and Resources ● 295Dietary Supplements ● 298Vitamin and Mineral Supplements ● 301Herbs● 310Hormone Supplements ● 314Other Dietary Supplements ● 317ConsumerLab.com and the Dietary Supplement ●
Verification Program 318Nutraceuticals, or Functional Foods ●
and Drinks 320

viii Contents
9 SELECTED HEALTH EDUCATION TOPICS 323
Smoking● 325Alcohol● 340Medication Usage ● 347Injury Prevention ● 354Sleep● 363
10 SOCIAL SUPPORT 369Definition of Social Support ● 370Family, Friends, Church, and Others ● 372Lay Support ● 374Online Support ● 375Pet Support ● 377Religious or Spiritual Support ● 381Types of Intimate Support ● 385Terminally Ill ● 389Peer Support Groups ● 392Intergenerational Support ● 397Physician and Allied Health ●
Professional Support 398
11 MENTAL HEALTH 401Mental Health and Mental Illness ● 402Depression● 404Alzheimer’s Disease ● 409Other Mental Disorders ● 414Insurance Coverage ● 415Chronic Stress ● 416Stress Management ● 420Mental Health and Aging Resources ● 426
12 COMMUNITY HEALTH 429Community Organizations ● 430Model Health Promotion Programs ● 441Professional Associations ● 450Community● Volunteering 452Community Health Advocacy ● 456

Contents ix
13 DIVERSITY 461Age● 462Sex and Gender ● 464Race and Ethnicity ● 466Culture● 476Socioeconomic Status ● 478Gay Aging ● 480Spirituality and Religion ● 487Rural Aging ● 494Global Aging ● 496
14 PUBLIC HEALTH 501Wellness General of the United States ● 504An Opposing Point of View (Sort of) ● 515And Now for the Rest of the Wellness General’s ●
Platform 516Conclusion● 538
15 GLIMPSE INTO THE FUTURE 539Reengagement● 542Wellness Center ● 550Physical Health ● 552Mental Health ● 555Supportive Housing ● 559Conclusion● 565
Bibliography 567Index 619


xi
Figures
Chapter 1
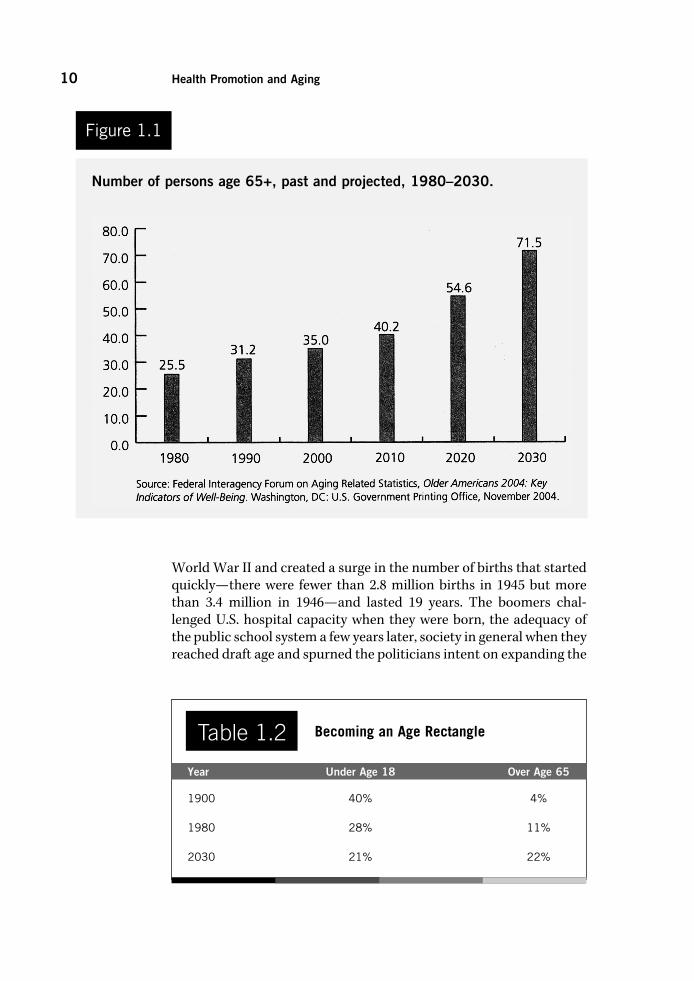
1.1 Number of persons age 65+, past and projected, 1980–2030. 10
1.2 Labor force participation rates of persons age 65–69 and 65+, 1985–2004. 18
1.3 Three levels of prevention. 24
1.4 Compression of morbidity. 28
Chapter 3
3.1 Nursing student teaching older adult to take a blood pressure reading in one of the author’s health education classes. 82
3.2 The late Elizabeth “Grandma” Layton took her first art class at age 68, and she drew a picture of her husband, Glenn, on a bathroom scale when he was concerned about weight loss and malnutrition. 87
Chapter 4
4.1 Health contract. 124
4.2 Health calendar. 125
Chapter 5
5.1 Prevalence of no leisure-time physical activity increases as Americans age. 155
5.2 End-of-semester photograph of one of the author’s exercise classes, taught by occupational therapy students. 167
5.3 Horizontal triceps press performed in one of the author’s exercise classes. 174

xii Figures
5.4 Isometric exercise for quadriceps that avoids knee pain. 177
5.5 Shoulder roll. 180
5.6 A photograph of two fellows with pretty good balance, taken by the author in China. 182
5.7 Activity pyramid. 186
Chapter 6
6.1 Food guide pyramid. 201
6.2a, b MyPyramid. 203–204
6.3 Personalized Nutrition Bull’s-Eye. 208
6.4a, b Determine Your Nutritional Health. 234–235
Chapter 7
7.1 The 10-calorie diet. 267
Chapter 8
8.1 Belly breath. 287
Chapter 9
9.1 Motorcycle riding is not just for young adults and boomers. 362
Chapter 10
10.1 The author’s son visiting a resident in a nursing home (1984). 379
10.2 Dog from a pet companion program visiting an older adult in the author’s community health education class. 381
10.3 Massage. 388
10.4 “Dear Dr. Haber” letter. 395
10.5 Older adult assisting student with her reading comprehension. 399
Chapter 11
11.1 What do you see? 419

Figures xiii
Chapter 12
12.1 Chinese Tai Chi. 449
12.2 Maggie Kuhn, founder of the Gray Panthers advocacy group. 456
Chapter 14
14.1 Wellness General of the United States. 508


xv
Tables
Chapter 1
1.1 Healthy People 2010: Leading Health Indicators 3
1.2 Becoming an Age Rectangle 10
1.3 Leading Chronic Conditions among Older Adults 13
1.4 Ten Leading Causes of Death in 2006 15
1.5 Seven Dimensions of Wellness 26
Chapter 3
3.1 Medicare Prevention 108
Chapter 4
4.1 Health Contract Directions for Exercise 126
4.2 Food Behavior Diary 139
Chapter 5
5.1 Target Heart Rate by Decades 168
5.2 Modified Borg Scale of Perceived Exertion 170
5.3 Different Exercises and Benefits 185
Chapter 6
6.1 Recommended Dietary Allowances (RDA) for Selected Vitamins and Minerals by the National Academy of Sciences 223
6.2 Nutrients and Clinical Manifestation of Deficiency in Older Adults 225
6.3 Good Sources of Nutrition for Older Adults 226

xvi Tables
6.4 Risk Factors for Malnourishment in Older Adults 232
Chapter 7
7.1 Age and Recommended Body Fat Ranges 257
7.2 Low-Carbohydrate and High-Protein Diets 261
Chapter 8
8.1 Characteristics of Complementary and Alternative Medicine and the Biomedical Model 284
Chapter 9
9.1 Primary Risk Factors for Falling 356
9.2 Causes of, and Interventions for, Sleep Disorders 366
Chapter 13
13.1 Percentage of Persons Age 65+ in the United States by Race and Origin 468
13.2 Percentage of Persons Age 45 –55 Caring for Parents, by Ethnicity 474

xvii
Foreword
Dr. Haber’s comprehensive approach to aging speaks directly to five of my roles professionally and personally. First, as President of the Association for Gerontology/Geriatrics in Higher Education (AGHE); second, as Director for Geriatric Education and Research in a college of osteopathic medicine and professor in graduate health profes-sions education; third, as Director for U-ExCEL (UNE-Exercise and Conditioning for Easier Living), a functional fitness program for older adults with varied abilities; fourth, as the primary informal caregiver for both of my parents as they cruised into their 80s and through the dying process; and fifth, as a young-old person.
As I read Dr Haber’s book with these roles in mind, I found it relevant to issues pertinent to the many facets of daily life across the generations. Dr. Haber’s book frames America’s demographic impera-tive. Life expectancy nearly doubled during the twentieth century, resulting in a 10-fold increase in the number of Americans age 65 and older. An expected 10,000 baby boomers will be turning 65 each day beginning January 1, 2011, and continuing at that rate for the next 20 years. Older people of today have the opportunity to live longer and, if fortunate, healthier lives.
It is evident that we need skilled practitioners and workers to meet the desires and needs of those who will be part of this impending boom. Dr Haber is highly qualified in the field of gerontology and well-ness, as evidenced by his being named John and Janice Fisher Distin-guished Professor of Wellness and Gerontology and being given the Distinguished Teacher Award from the Association for Gerontology/Geriatrics in Higher Education. Dr. Haber has been working since the early 1980s in this field with a focus on health promotion and optimi-zation of aging.
This book does a fantastic job of presenting the myriad issues involved in educating about and promoting health in the later years. There is no question that aging gets a bad rap in our society. We often entrench ourselves in the ever-popular disease/decline model of aging, which opposes the empowerment and self-determination

xviii Foreword
models. Whether you plan on working in the field of aging or not, there is no question that sometime in life you will interact with and most likely play a role in the care of an older adult—a parent, grand-parent, relative, or friend. Working with or caring for an older adult will be more challenging if you are not aware of the range of resources and familiar with the lexicon of terms related to aging.
Dr. Haber provides an all-inclusive overview of the world of older adult health, including health care and health care reform, services, and resources; he then contextualizes these to impart a greater under-standing and improve prospects for application. Of special note are the questions interspersed throughout the chapters, which are worded in the second person to offer opportunities for self-reflection.
There is much education to be accomplished in the field of aging. I applaud Dr. Haber for addressing key concepts and issues in health promotion and aging and making them accessible, respectful, mind-ful, and empowering.
Dr. Haber’s levity and singular voice are used effectively to convey important concepts regarding policy issues and the future landscape of aging. Read on and improve your scope and depth of knowledge in promoting health and quality of life during the aging process!
Marilyn R. Gugliucci, MA, PhD, AGSF, GSAF, AGHEFDirector, Geriatrics Education and ResearchDepartment of Geriatric MedicineUniversity of New England College of Osteopathic MedicineBiddeford, MEPresident, Association for Gerontology in Higher Education (2008–2010)Washington, DC

xix
Preface
I was trained at the University of Southern California as a sociologist specializing in gerontology, but I spent my career implementing and evaluating health promotion projects in the local community. This contradiction between training and practice has informed me on why promoting health is possible but difficult.
From a sociological perspective it is clear to me that American society is not particularly health-promoting. For example, comput-ers are increasingly promoting sedentary behavior, both at work and at play. A fast-paced society encourages us to seek convenient food and drink choices, and ubiquitous advertising—to the tune of tens of billions of dollars per year—promotes questionable foods and drinks over good nutrition. And the considerable stress engendered by a dynamic society leads to smoking, excessive drinking of alcohol, or engaging in other risky behaviors.
At the same time, however, we are becoming increasingly well educated on health matters and eager to learn more from research findings that quickly reach Web sites, books, magazines, newspapers, and television news. Primarily through public education we were able to cut smoking rates in half between 1965 and 1990, and perhaps we can do the same with obesity and inactivity if we direct a similar amount of attention to these problems.
While sociological truths are not to be denied, there is still con-siderable potential to empower individuals, groups, and organiza-tions to live a healthy lifestyle. And while a vacuum of leadership has been created by a mostly hands-off federal government, an increas-ing number of local organizations are taking the initiative in health promotion: religious institutions, businesses, community centers, hospitals, medical clinics, educational institutions, shopping malls, and city governments.
As we continue our journey in the new millennium, research is providing convincing evidence that health promotion works—regardless of one’s age and even after decades of practicing unhealthy habits. The findings are also providing specific ideas on what we

xx Preface
need to do and how we ought to go about doing it. In some areas the strategies for improving health have proved a lot less onerous than we thought they had to be. For example, progressing from a sedentary lifestyle to engage in brisk walking for up to a half hour most days of the week can do your health a world of good.
Even the dreadful piece of legislation enacted in 1994, the Dietary Supplement Health and Education Act, may have some value in spite of the plethora of worthless and even harmful over-the-counter prod-ucts that it allows to be promoted with ridiculous claims, such as “reverses aging.” Perhaps it will be valuable in helping the American public become a bit more judicious in evaluating claims about what swallowing a pill can accomplish.
I would also like to note that the terms in the title of this book, Health Promotion and Aging, are not as straightforward as they might seem. Matters relating to health, for instance, are often dominated by medical issues. And it is not clear which terms are most salient to aging people: health promotion, disease prevention, management of chronic disease, health education, or some other designation.
And when does aging start? At the government-protected age of 40 for workers, at the AARP-eligible age of 50, at the traditional retire-ment age of 65, at the eligibility age of 75 for some geriatric clinics, or at the demographically significant age of 80 or 85? And how should we feel about the anti-aging movement, which urges us to defy the aging process? The anti-aging perspective appeals to many who have a vision of living vigorously and looking youthful for as long as pos-sible. But what about us pro-agers, who embrace the aging process, accept its drawbacks, and creatively uncover its strengths?
The fifth edition of Health Promotion and Aging has been sub-stantially revised and updated. There are multiple new subsections, topics, and terms in each chapter of this edition. To name a few, out of countless examples, there are the following new subjects: gay aging, Jewish aging, social networking, brain games, the Obama administration’s health care reform, mental health parity, Exploritas, Wii-habilitation, Elderspeak, skin cancer, Family Smoking Prevention and Tobacco Control Act, Senator Ted Kennedy’s government-run long-term care proposal, sleep-related medical disorders, and the Art Buchwald phenomenon. In addition, the topics carried over from the prior edition have been updated.
This book is focused on current research findings and practical applications, and includes detailed descriptions of two of my programs that have been recognized by the National Council on the Aging and included in their Best Practices in Health Promotion and Aging. These consist of a comprehensive exercise program in the community that includes aerobics, strength building, flexibility and balance, and health education (Chapter 5); and a health contract/calendar used to help

Preface xxi
older adults change their health behaviors (Chapter 4). I have also done recent work on life reviews in the community and in educational set-tings, and some of that work is detailed in this edition (Chapters 11 and 15).
This edition also has a few new wrinkles, such as the Key Terms and Learning Objectives at the start of each chapter; questions to ponder in each chapter; and boxes containing information to reflect upon.
I have attempted to make the book practical by including health-promoting tools, resource lists, assessment tools, illustrations, check-lists, and tables; thoughtful by raising controversial issues and taking positions that you can agree or disagree with; and humorous, because humor is essential to health promotion.


xxiii
Acknowledgments
I would like to thank my wife, Jeanne St. Pierre, who has enriched my life in so many ways; my children, Benjamin and Rik (neé Audrey), who would make any parent proud; my 95-year-old mother-in-law, Beatrice, who is a role model for those who aspire to run a business, drive a car, and live independently at that age; my university, Ball State, for its consistent support of my academic career; my publisher, Springer Publishing Company, Sheri W. Sussman, and Kerry Vegli-ando, and the other fine folks there who encourage me and support each new edition of this book; and Dave Mason at Publication Ser-vices, who is an exceptional copy editor.


Contents xxv
Health Promotion and Aging
edition5


1
Introduction1Healthy People 2010 initiative
libertarian paternalism
baby boomers, older adults,
and older old
health promotion and disease
prevention
age rectangle
chronic conditions and
disability
activities of daily living
instrumental activities of daily
living
centenarians
biogerontology
life expectancy and health
expectancy
primary, secondary, and
tertiary prevention
wellness
anti-aging versus pro-aging
compression of morbidity
Medicare versus Medicaid
medical care versus health
care
Key Terms
Critically evaluate the role of the federal ●
government in promoting health.Discuss whether health promotion, dis- ●
ease prevention, and chronic disease management save money.
Describe the impact of sociodemo- ●
graphic trends on healthy aging.Contrast the baby boomers, older ●
adults, and the older old.
Learning Objectives
Did you know that the federal government establishes goals for healthy aging? In 1990, for instance, the U.S. Public Health Service established the goal of increasing the number of years of healthy life remaining at age 65 from 11.8 years, as it was in 1990, to 14 years by 2000. It turned out, however, that this goal for the decade was not met, though minority elders made substantially more progress than non-minority elders. Although healthy life remaining at age 65 had increased only 0.4 years, to 12.2 years, the data indicated an additional 1.3 years for Blacks and 1.8 years for Hispanics during this decade (Healthy People 2000 Final Review, U.S. Public Health Service, 2000).
This, of course, raises some questions: How long has the federal government been doing this? Are they still doing it? Is it helping to promote healthy aging? For those readers who are impatient, the three answers are: more than 30 years; yes; and sorry, you will have to read on to find out.
Healthy People InitiativesIn 1979 an influential document, Healthy People: The Surgeon General’s Report on Health Promotion and Disease Prevention, was published (U.S. Department of Health and Human Services [USDHHS], 1979).
2 Health Promotion and Aging
Differentiate chronic disease and ●
disability.Explore the future of centenarians. ●
Examine the consequences of rising ●
educational levels on older adults.Contrast definitions of healthy aging, ●
and express your own definition.Identify extraordinary accomplishments ●
of older adults.Distinguish among primary, secondary, ●
and tertiary prevention.
Evaluate the anti-aging movement. ●
Define compression of morbidity, and ●
analyze its likely future course.Contrast health expectancy with life ●
expectancy.Discuss physical versus emotional ●
aspects of aging.Describe the Medicare and Medicaid ●
programs.Explain why medical care and health ●
care are not synonymous.

Introduction 3
Over the years this report was widely cited by the popular media as well as in professional journals and at health conferences. Many attribute to it a seminal role in fostering health-promoting initiatives throughout the nation. It was followed by a report by the U.S. Public Health Service in 1980, Promoting Health/Preventing Disease: Objec-tives for the Nation, which outlined 226 objectives for the nation to achieve over the following 10 years.
A decade later, in 1990, another national effort, Healthy People 2000, was initiated by the U.S. Public Health Service in an effort to reduce preventable death and disability for Americans by the year 2000. The Healthy People 2000 initiative focused on three broad public health goals for Americans: to increase the span of healthy life, to reduce health disparities, and to achieve access to preventive services.
In 2000, the Healthy People 2010 initiative was launched, with the number of objectives increased to 467, distributed over 28 priority areas. An interagency work group with the U.S. Department of Health and Human Services, however, pared this list to 10 leading health indicators (Table 1.1).
As you can observe, the table does not consist of an age-specific list of health indicators. Sexual irresponsibility and smoking, for instance, are much more prevalent problems among younger adults
Healthy People 2010: Leading Health Indicators
1. Physical activity
2. Overweight and obesity
3. Tobacco use
4. Substance abuse
5. Responsible sexual behavior
6. Mental health
7. Injury and violence
8. Environmental quality
9. Immunization
10. Access to health care
Table 1.1
From “Healthy People 2010.” Healthy People 2010, Vol. I. Washington, DC: U.S. Department of Health and Human Services, January 2000, p. 24.

4 Health Promotion and Aging
than among older adults. And access to health care is pri-marily an issue for younger persons without health insur-ance. Another limitation, unrelated to age, is that there are few federal funds earmarked specifically to accom-plish improvement among these 10 health indicators.
On the positive side, setting health care priorities is no longer a simple matter of tabulating the number of deaths from a few diseases and then organizing a campaign against the most prevalent ones, like heart disease and cancer. The Healthy People initiatives are health oriented, not disease oriented, and as such they recognize the com-plexity of the socioeconomic, lifestyle, and other nonmedi-
cal influences that impact our ability to attain and maintain health.A second major benefit of the initiatives is that they are focused
on documenting baselines, setting objectives, and monitoring prog-ress. They are not, however, focused on providing support to achieve objectives. Not surprisingly, only a minority of the objectives have been achieved. According to the National Report Card on Healthy Aging (Merck Company Foundation, The State of Aging and Health in America, 2007), only 36% of the objectives for the year 2010 were being met (final report due out in 2011), and the U.S. public were falling far short of achieving the remaining target goals.
For example, in an area where there was no financial support for encouraging change—being overweight or obese—the trend in the United States for adults between the ages of 20 and 74 has been in the opposite direction. There has been a steady increase in weight gain for Americans over the decade. There has been a similar result with respect to sedentary behavior among Americans. In the absence of financial support for encouraging change in this area, the average amount of light to moderate physical activity performed on a near-daily basis by those between the ages of 18 and 74 has not improved over the decade.
Focusing on those age 65 and over, the Merck Institute on Aging & Health (go to www.merck.com/cr) cited results from a report card on the Healthy People 2010 initiative and reported many fail-ing grades. Older Americans were falling far short of the 2010 target goals for not only physical activity and obesity, but also eating fruits and vegetables, tooth loss, and reducing hip fractures and fall-related deaths. Again, financial support for achieving target goals was largely or completely absent.
In contrast to the mere monitoring of most Healthy People 2010 target goals, financial assistance was provided to older adults through Medicare for medical screenings and immunizations. Thus, choles-terol, colorectal, and mammogram screening goals were met. Pneumo-coccal and influenza vaccination goals would have been met—after all, the percentage of compliance in these two areas doubled among older
Question: What do you think is the most important health objective to set for older adults for the Healthy People 2020 initiative? Why? What should the federal and state govern-ments, health professionals, and laypersons do to help achieve this objective?

Introduction 5
adults during the decade between 1990 and 2000, meeting Healthy People 2000 target goals—but the target goals were unrealistically raised to 90% of the population for Healthy People 2010. Another goal,
Example of Libertarian Paternalism
The author is not thrilled with the effectiveness of Healthy People 2010, but libertarian paternalists may be, after they make a few tweaks in the implementation of it.
Libertarian paternalism tries to appeal to both the libertarian (the less government intervention, the better off society will be) and the traditional liberal (there is a role for government to play, particularly in such an important objective as a healthy society).
Two colleagues at the University of Chicago, Richard Thaler of the Graduate School of Business and Cass Sunstein of the Law School, proposed the idea of libertarian paternalism. The libertar-ian component of this term suggests the allotment of no addi-tional federal monies to help with implementing the successors to the Healthy People 2010 initiative. The paternalism component suggests the dissemination of more information associated with the successors of the Healthy People 2010 initiative. What is the problem? Why is it important? What do we need to do to solve the problem?
For example, as individuals in society get heavier each year, the problem is financial and functional for the individual (more medical bills, less mobility, and reduced quality of life) and for society (costlier health care plans and less productive citizens). What do we need to do? Disseminate which health interven-tions work; which businesses, religious institutions, community centers, hospitals, medical clinics, academic medical centers, health plans, educational institutions, shopping malls, and city governments are doing these interventions; and what have been the benefits?
This combination pleases the libertarian (individuals are free to do what they please, and little government money is being spent) and the liberal (better data and methods to disseminate programs that work will encourage their replication). The basic premise of libertarian paternalism is that people and organiza-tions are busy, lives are complicated, and even intelligent indi-viduals and smart organizations make foolish choices. Successors to the Healthy People 2020 initiative can nudge—Thaler and Sunstein’s term—people and organizations in the right direction without too much governmental intrusion and cost.
BOX 1.1

6 Health Promotion and Aging
less than 12% of the older adult population smoking, also received financial support and was met. This goal received financial support from some states through the tobacco industry settlement to cover Medicaid expenses caused by smoking-related illnesses (see Chapter 9) and also through coverage by Medicare (see Chapter 3).
This raises the question of whether the federal government should be doing more than monitoring data changes and setting lofty goals when it comes to promoting healthy aging. A comparable ques-tion can be asked of state governments. The Healthy People initia-tives are supposed to have a counterpart initiative at each of the state health departments. In my experience with several states, however, either this initiative has been ignored or the state health department accomplished a modest project more than a decade ago but did not follow up with additional activity. In addition, many states used their tobacco settlement monies for non-health purposes.
I will come back to this issue, whether the federal and state gov-ernments should be doing more than setting goals and monitoring data changes, in Chapter 14 of this book. In the meantime, to find out more about the Healthy People 2010 initiative, go to www.health.gov/healthypeople/state/toolkit. And, finally, back to the question “Does establishing goals help to promote healthy aging?” The answer is what you might expect: not if you are only setting goals and monitoring.
Sociodemographic TrendsIt has been almost obligatory over the past 30 years to begin a geron-tological book or article with comments about the rapid aging of society. About 15 to 20 years ago we began to see two slight variations of this ritual: many writings beginning with comments about the aging of the aged, and an additional spate of writings on the coming onslaught of aging baby boomers, born between 1946 and 1964.
In 2006, when the vanguard of baby boomers became sexagenar-ians, both ends of the older age spectrum commanded our atten-tion. The robust baby boomers–cum–gerontology boomers made it obvious to all but the most ageist of the young that the vitality of aging persons remained strong. The stereotype of aging as a process synonymous with physical and mental deterioration was convinc-ingly challenged. At the other end of the age spectrum, among persons age 85 and older, the growth in the percentage of the very old began to startle—about a 40% growth per decade. In 1980 there were 2.2 million Americans aged 85 and over, in 1990 about 3 million, in 2000 around 4.3 million, and in 2010 about 6 million.

Introduction 7
Along with the increasing breadth of the age span of Americans comes increasing complexity. Fifty-year-olds are eligible for mem-bership in AARP (formerly the American Association of Retired Persons), but they are quite different from 70-year-olds, who in turn are significantly different from 90-year-olds. Moreover, 90-year-olds are different from one another. A few of them are pumping iron and throwing away their canes, while others are waiting to die.
What aging Americans have in common, be they 50 or 90, robust or frail, is a future with an intensified demand for medical care (euphemistically referred to in America as health care) and the ongo-ing escalation of medical care costs. Driving these demands and costs are the increasing numbers of aging persons with both chronic and acute medical conditions and an expensive, high-tech, acute care–oriented medical system.
As we entered the third millennium, this demand for costly and sophisticated medical care collided with an unpredictable federal budget. In less than 6 months’ time during the year 2001, the United States went from a record-breaking, astoundingly huge budget surplus to budget deficits of enormous size and uncertain duration—thanks to the one-two punch of federal legislation that launched a 10-year tax cut and the surging costs of both domestic programs and a war on ter-rorism. In September 2008 the United States and the rest of the world experienced the beginning of an economic meltdown unrivaled since the Wall Street crash of 1929. As retirement savings and home values plunged, a virtually unregulated financial system fueled by risky mort-gage lending practices gone bust led to many financial institutions failing, selling out, or being taken over by the government.
Paralleling the uncertainty of our overall economic future was the deterioration of Medicare finances. Medicare expenditures totaled more than $1 trillion in 2008—about one-third of the federal bud-get—and Medicare is expected to run out of money by 2017. The American public’s voracious appetite for medical care combined with unmanageable medical cost inflation leads to two politically unpopu-lar solutions: We need to increase taxes or reduce medical costs.
Others argue that an alternative to these unpopular actions is to practice health promotion, disease prevention, and chronic disease management. Health promotion advocates, however, often fail to consider that prevention/promotion/management entails substan-tial costs in the attempt to screen and counsel everyone, and many will not benefit from an intervention. And even if these interventions were to prove effective for most people, individuals will live longer on Social Security and Medicare, only to die of other costly medical conditions. Health promotion advocates respond to these concerns with data showing that people who are overweight and underactive are living nearly as long as those with healthier lifestyles but are much

8 Health Promotion and Aging
sicker for a longer period of time and require more costly interven-tions (see Chapter 7, Weight Management).
Whichever side is right, the media has taken a stand, allocating considerable time and space to the merits of promoting good health practices to improve quality of life and realize medical care cost sav-ings. Joining the media are the federal and state governments, which have strongly endorsed disease prevention and, to an increasing extent, health promotion and disease management; the health professions, which have proclaimed its importance in the education and training of students; the business community, which has firmly supported this approach for employees; and the individuals who often discuss their attempts at these practices, both successful and otherwise.
If disease prevention, health promotion, and chronic disease man-agement strategies as a way of controlling medical costs have been vying for center stage in society, it has been the stage of a not-very-prosperous community theater. The federal government plays a limited role in disease prevention and chronic disease management, and does not sub-sidize health promotion. State governments have been more concerned about the expenditures that the federal government has passed along to them (welfare reform, Medicaid expenses, and antiterrorist measures being among the more costly) than on new disease prevention/health promotion/disease management initiatives that require funding.
Health professionals, too, have provided mostly lip service to pro-moting health because they have not been reimbursed for it. Health science students have received only a modicum of health promotion instruction and training, and experience in applying it is the exception rather than the rule (Haber & Looney, 2000; Haber et al., 2000, 1997). The business community has devoted resources to health promotion (calling it worksite wellness) but has stopped short of focusing on those who need it most—older and more sedentary employees.
And last but not least, individuals have spent more time and money on health promotion. But they also have spent more time and money at restaurants, eating larger portions of food with higher fat content; and on computers, in front of which they sit for an increasing number of hours.
Perhaps the disparity between the promise of health promotion, disease prevention, and chronic disease management and the associ-ated attention shown to these activities, on the one hand, and the lack of government resource allocation adequate to supporting them, originates in the American value of individual responsibility. Unlike medicine, where we know we are not responsible for prescribing our own drugs or conducting surgery on ourselves or our family mem-bers, we feel capable of walking briskly and eating healthfully—if we choose—without the need of experts, health programs, or taxpayer financial support. Thus, though most people are not doing as good a

Introduction 9
job as they would like at promoting their health, we tend to believe it is up to the individual to take responsibility for it.
Individual responsibility is an important American value, but individuals are imperfect and need help. If support can be provided by some combination of government, business, the media, the commu-nity, health professionals, religious institutions, family, and friends, we will be able to do much better at promoting our own health and that of the people we love.
The following chapters of this book offer ample ideas and infor-mation on health promotion and aging to provide some basis for optimism and to inspire additional initiatives—from the individual to all major institutions of society, including family, work, government, religion, health care, and education. Sociodemographic data suggest that aging adults not only may be the leading cause of escalating medical costs, but also have the potential to lead the way in the imple-mentation of creative and cost-effective health promotion strategies. The data reveal that the educational level of aging Americans has risen, that these individuals are increasingly health-conscious, and that they are active in community health-promoting endeavors.
Much of the information in the next section is taken from sum-maries of data provided by sources including the U.S. Bureau of the Census, the Administration on Aging, the National Center for Health Statistics, the Federal Interagency Forum on Aging-Related Statistics, The State of Aging and Health in America from the Merck Company Foundation, and Centers for Disease Control and Prevention.
POPULATION GROWTH OVER AGE 65All but the most uninformed know that the average age of the American population has been increasing dramatically. Since 1900 the percentage of Americans age 65 and over has more than tripled, from 4% in 1900 to almost 13% in 2008, and their number has increased 12-fold, from 3 million to 37 million. This trend will continue for several decades. Between 2000 and 2030, the number of people 65 and older is expected to more than double, from 35 million to 71.5 million (Figure 1.1), and the percentage who are age 65 and over is projected to reach 20%.
The percentages in Table 1.2 show why the population “age pyramid”—a few older adults at the top and many children at the bottom—is rapidly becoming an “age rectangle.”
THE BABY BOOMERSThe baby boomers are the 76 million persons who were born in the United States between 1946 and 1964. Most were conceived when the millions of soldiers, sailors, and marines returned home from
10 Health Promotion and Aging
World War II and created a surge in the number of births that started quickly—there were fewer than 2.8 million births in 1945 but more than 3.4 million in 1946—and lasted 19 years. The boomers chal-lenged U.S. hospital capacity when they were born, the adequacy of the public school system a few years later, society in general when they reached draft age and spurned the politicians intent on expanding the
Number of persons age 65+, past and projected, 1980–2030.
Figure 1.1
Becoming an Age Rectangle
Year Under Age 18 Over Age 65
1900 40% 4%
1980 28% 11%
2030 21% 22%
Table 1.2

Introduction 11
Vietnam War, and still later the sufficiency of available housing for raising their families.
The baby boomers’ impact on society as they have reached middle age is still unclear. Will they be known as the spoiled descendents of the Greatest Generation or as pioneers in social reform and civil rights? Their impact on society as older persons raises an even more troublesome question, one posed by the Beatles in a song lyric that asks society if it would “still need me when I’m 64.” If the Beatles had been more knowledgeable about aging, they would have substituted 84 for 64, as it more accurately represents a threshold to frailty and incompetence. (As far as they were concerned 64 was the same as 84: too old to differentiate.) Hopefully we will be able to answer this question in the affirmative by the time the first boomers reach age 84 in 2030.
In 2010 the number of Americans between the ages of 45 and 64 was about twice that of those age 65 and over: roughly 79 million ver-sus 38 million. And boomers will bring into retirement not only their large numbers and a history of advocacy, but also a powerful interest in, and impact on, the solvency of the Social Security and Medicare programs. Their influence on society is likely to be dramatic and widespread as they become retirees in increasing numbers.
As eloquently stated by Frank Whittington, director of Georgia State’s Gerontology Center (and paraphrased here),
On January 2, 2008, shortly after 9 a.m., a simple bureaucratic event was the harbinger of a fundamental change in American society. Kathleen Casey-Kirschling—the first baby boomer, who had been born one second after midnight on January 1, 1946—walked into the local office of the Social Security Administration and applied for retirement benefits. She celebrated her 62nd birthday on New Year’s Day and applied for early Social Security benefits at her first opportunity. Over the next couple of decades over 70 million of her peers will follow suit. We must not doubt that when Kathleen Casey-Kirschling strode up to the counter to ask for her benefits, all of our lives had begun to change.
When boomers retire they will make enormous demands on both the Social Security and Medicare programs, which, at the same time, will be supported by a shrinking taxpaying workforce. By the time the last boomer turns 65 in the year 2029, the retirees drawing Social Security and Medicare benefits will account for one in five Americans.
THE OLDER OLDThe older population itself is getting older. The percentage of persons age 85 and over is growing faster than any other age group. There was a 36% increase among Americans 85 and over from 1980 to 1990
12 Health Promotion and Aging
(from 2.2 million to 3 million), a 43% increase from 1990 to 2000 (from 3 million to 4.3 million), and a 40% increase from 2000 to 2010 (from 4.3 million to about 6 million). Every decade there is another 40% increase in the number of persons aged 85 and over.
This demographic trend is significant for two reasons. On the positive side, the rapid growth of this segment of the population has made what was previously an age level rarely attained into an increas-ingly common stage of the life cycle. Moreover, the percentage of older adults age 75 and over who report good health or better is 66%.
Experts believe that today’s 70-year-old is more like the 60-year-old of previous generations (Trafford, 2000). Older adults have the same perception about themselves. The National Council on the Aging (2002) together with the Harris National Survey reported that 51% of persons between the ages of 65 and 74 and 33% of persons age 75 and over perceive themselves as middle-age or younger! This certainly is evidence that many older adults are redefining old age as beginning later in the life cycle.
On the challenging side, for both individuals and society, is that the ability of this age group to function fully is significantly less than for the younger old. Whereas only 6% of individuals age 65 to 69 reported difficulties with at least one activity of daily living (ADL) task, 28% of those age 85+ had such difficulties. Similarly, only 1% of persons age 65 were residents of nursing homes, but 22% of persons age 85+ were residents. The older old person places more demands on family caregivers and societal resources.
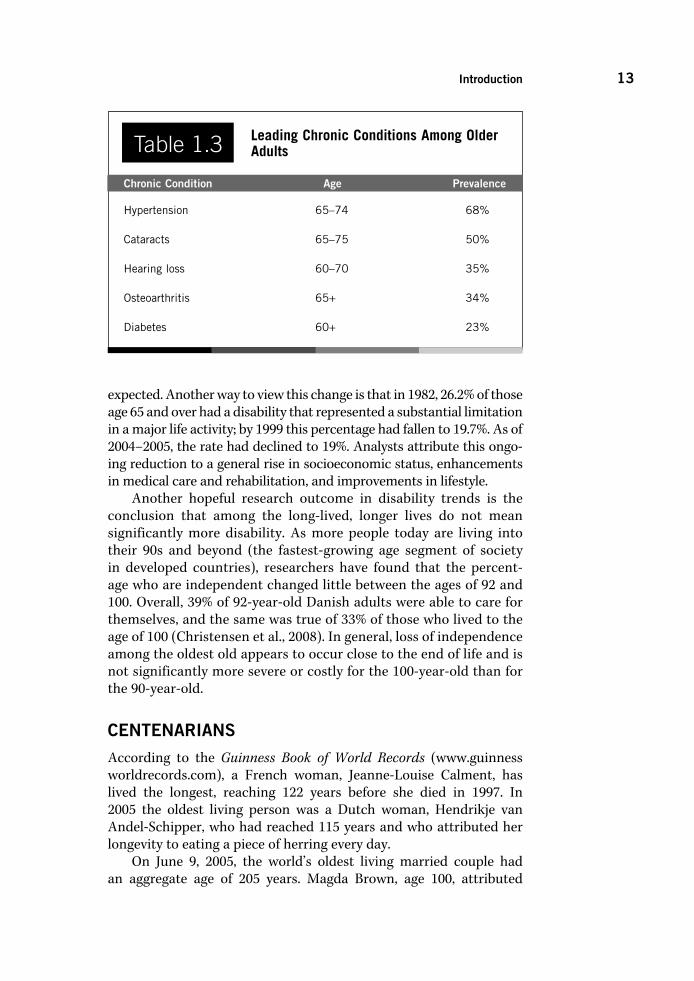
CHRONIC CONDITIONS AND DISABILITYThe leading chronic conditions among older adults (Mauk, 2009) are listed in Table 1.3. The prevalence of each condition increases in old age, and many persons over age 80 have multiple chronic conditions and multiple physical impairments.
By age 75, approximately 10% have difficulty performing an ADL such as bathing, transferring, dressing, toileting, or eating; or difficulty walking. And about 19% have difficulty with an instrumental activity of daily living (IADL) such as shopping, preparing meals, managing money, doing light housework, or getting around the community. At age 85+, however, the percentage having difficulty with ADLs (28%) and IADLs (40%) is more than double that of the younger old.
Although chronic conditions and functional limitations increase with age, disability rates for older Americans have been declining. In 1982 the disabled older population in the United States totaled 6.4 million. If the 1982 rate had continued, the number of disabled would have climbed to about 9.3 million in 1999. Instead, it rose to only 7 million—less than a quarter of the increase that might have been
Introduction 13
expected. Another way to view this change is that in 1982, 26.2% of those age 65 and over had a disability that represented a substantial limitation in a major life activity; by 1999 this percentage had fallen to 19.7%. As of 2004–2005, the rate had declined to 19%. Analysts attribute this ongo-ing reduction to a general rise in socioeconomic status, enhancements in medical care and rehabilitation, and improvements in lifestyle.
Another hopeful research outcome in disability trends is the conclusion that among the long-lived, longer lives do not mean significantly more disability. As more people today are living into their 90s and beyond (the fastest-growing age segment of society in developed countries), researchers have found that the percent-age who are independent changed little between the ages of 92 and 100. Overall, 39% of 92-year-old Danish adults were able to care for themselves, and the same was true of 33% of those who lived to the age of 100 (Christensen et al., 2008). In general, loss of independence among the oldest old appears to occur close to the end of life and is not significantly more severe or costly for the 100-year-old than for the 90-year-old.
CENTENARIANSAccording to the Guinness Book of World Records (www.guinness worldrecords.com), a French woman, Jeanne-Louise Calment, has lived the longest, reaching 122 years before she died in 1997. In 2005 the oldest living person was a Dutch woman, Hendrikje van Andel-Schipper, who had reached 115 years and who attributed her longevity to eating a piece of herring every day.
On June 9, 2005, the world’s oldest living married couple had an aggregate age of 205 years. Magda Brown, age 100, attributed
Leading Chronic Conditions Among Older Adults
Chronic Condition Age Prevalence
Hypertension 65–74 68%
Cataracts 65–75 50%
Hearing loss 60–70 35%
Osteoarthritis 65+ 34%
Diabetes 60+ 23%
Table 1.3

14 Health Promotion and Aging
her 74-year union to Herbert Brown, age 105, to her taking the lead (“I am the strong one”) and his following (“He is the easygoing one”). Apparently, Herbert is more than just easygoing. He survived the Nazi concentration camp at Dachau.
On December 5, 2004, Johannes Heesters celebrated his 101st birthday. He announced at that time that he had no plans to take what he called “early retirement.” This Dutch-born German singer-dancer-actor was still appearing on stage. As he noted, “The stage is my life and I’d have been dead and gone long, long ago if it hadn’t been for the audience’s applause.” Mr. Heesters, however, was not the oldest worker in 2004. Ray Crist, age 104, still worked as a research scientist at Messiah College in Pennsylvania. He earned his doctorate in chemistry from Columbia University in 1926 and was still putting it to good use.
As centenarians, Andel-Schipper, the Browns, Heesters, and Crist have a lot of company. There were 71,000 people age 100 or older in 2005, with the U.S. Census Bureau projecting the number at 114,000 in 2010 and 241,000 in 2020. Some census projections forecast as many as one million centenarians by the year 2050, when the baby boomers begin reaching age 100.
A USA Today/ABC News poll in 2005 reported that only 25% of Americans want to live to be 100 or older. The majority of Americans are concerned that they will become disabled and a burden to their families. And yet many Americans are fascinated by the idea of an increasing number of people becoming centenarians.
The same holds true for scientists. One scientist, though, is not content with being a mere centenarian. Aubrey de Grey is a contro-versial practitioner of biogerontology, which focuses on the biology, physiology, and genetics of aging. He believes that the first person who will live to be 1,000 might be age 60 today. While this Englishman’s ideas are far from the scientific mainstream, he has inspired considerable interest in his theories, having been invited to deliver 33 presentations in the United States in 2005. This interest may have been stimulated in part by his offer of a $20,000 cash prize for anyone who can disprove the scientific basis of his theories, as determined by a review panel of independent molecular biologists. His provocative ideas on increased longevity range from stem cells that can regrow diseased tissue, to implanting bacteria to clean up waste that builds up inside cells.
LIFE EXPECTANCYThe life expectancy of Americans in 2007 was the highest it has ever been, 78.2 years, according to the National Center for Health Statis-tics. Before we break out the champagne, though, it should be noted that the United States was behind 28 other UN member nations in this category.

Introduction 15
Americans’ life expectancy has been rising almost without interruption since 1900, thanks to advances in sanitation, medi-cine, and health behavior (particularly smoking cessation). It is by no means certain whether these increases in life expectancy will continue unabated. Increases in obesity, and the related conditions of hypertension and diabetes, may reverse this trend; while the advent of cholesterol-lowering drugs and other advances in medicine may foster it. The future may also be determined by changes in the health behavior patterns of eating, exercising, and nonsmoking.
For women life expectancy reached 80 years in 2007, and for men 75 years. The gender differential has been narrowing, with this 5-year differential the smallest since 1946. Medical experts speculate that women are working harder, smoking more, and undergoing more stress. The disparity between Blacks and Whites is also declining, with Black men reaching a life expectancy of 70 years in 2007 and Black women just under 77 years.
Table 1.4 lists the leading causes of death in 2006, according to the CDC, with Alzheimer’s forging ahead of influenza and pneumonia due to a 2% increase in its incidence, along with a 7% decline in the latter diseases. There were also considerable declines in deaths from heart disease and stroke.
HOSPITAL STAYS AND PHYSICIAN VISITSIn 1964 the average length of a hospital stay for an older patient was more than 12 days. By 1986 it was reduced to 8.5 days, in 1996 to 6.5 days, in 1999 to 5 days, and in 2007 to 4.6 days. Hospital expenses no longer accounted for the largest percentage of health expenditures for older persons, falling slightly behind medical/outpatient costs.
Ten Leading Causes of Death in 2006
6. Diabetes, 72,000
7. Alzheimer’s disease, 72,000
8. Influenza and pneumonia, 56,000
9. Kidney disease, 51,000
10. Septicemia (blood infection), 34,000
Table 1.4 1. Heart disease, 632,000
deaths
2. Cancer, 560,000
3. Stroke, 137,000
4. Chronic lower respiratory diseases, 125,000
5. Accidents, 122,000

16 Health Promotion and Aging
Quickening hospital discharge over the past few decades, however, has led to older adults now representing a higher percentage of hospital stays. Older adults accounted for 20% of hospital stays and used one-third of the total days of hospital care in 1970; by 2000 they accounted for 40% of hospital stays and almost one-half of the days of hospital care (Hall & Owings, 2002).
In 1998 the average Medicare beneficiary visited or consulted with a physician 13 times during the year (Federal Interagency Forum on Aging-Related Statistics, 2000). It is estimated that older patients occupy almost 50% of the time of health care practitioners, and it is predicted with near certainty that the percentage of time that health care practitioners spend with older patients will continue to increase.
MEDICATIONSIn 2005 older adults constituted 13% of the population but consumed 32% of all prescription drugs and 40% of over-the-counter drugs. Accompanying the volume of drug consumption among older adults has been the burden of rising prescription drug costs over the past several years. The growth in prescription drug expenditures was double-digit every year from 1994 to 2001. The annual rate of growth in such expenditures reached an astonishing 19.7% in 1999, although it declined some in 2000 (16.4%) and 2001 (15.7%) as employers increased co-payments.
Among persons age 65 and over, 85% used a prescription drug in 2002, up 11% from 1994. There was an even greater increase, 17%, among older adults using three or more prescription drugs during this time period, from 35% to 52%.
By 2001 prescription drugs accounted for 9.9% of all health expen-ditures, due to higher-priced new drugs, advertising of prescription drugs on television, and an increase in the number of prescriptions written by physicians. In 2005 prices for brand-name prescription medications rose 6%, while inflation overall was 3.4%. That was the sixth year in a row that medication increases had outpaced inflation. Medicare Part D was launched in 2006 and stimulated medication price growth that was three times the rate of inflation (see Chapter 14). The good news in 2006 was that 63% of new prescriptions were filled with generics, versus only 53% in 2005. Many popular medica-tions are coming off of patent protection.
HEALTH HABITSOn the brighter side, the health habits of older adults may, on bal-ance, be slightly superior to those of younger adults. People age 65 and over, for instance, are less likely to smoke, drink alcohol, be obese, or

Introduction 17
report high stress. They eat more sensibly than do younger adults, are as likely to walk for exercise, and are more likely to check their blood pressure regularly. Older adults over the past decade had a higher rate of participation in medical screenings and immunizations, and adults in general increased their seat belt use (D. Nelson et al., 2002).
On the darker side, older adults are more likely to be sedentary and malnourished. And their advantage in being less stressed may be merely the result of less awareness of or less willingness to report stress; and the lower percentage of smokers may be due to the fact that smokers are more likely to die before age 65. Also, when older adults engage in risk behaviors such as excessive alcohol consumption, sedentary behavior, poor nutrition, and failure to use seat belts, their vulnerability to morbidity and mortality is greater.
To put things in perspective, though, few adults in the United States, young or old, live a comprehensively healthy lifestyle. National data reveal that only 3% of the population engage in all four of the following lifestyle choices: nonsmoking, healthy weight, five fruit and vegetable servings per day, and regular physical activity (Reeves & Rafferty, 2005). Among older adults, one-third do not get any leisure-time physical activity, two-thirds do not eat five servings of fruit or vegetables a day, and one-fifth are 30 pounds or more overweight.
PERCEPTIONS OF HEALTHMost people who are elderly tend to view their health positively. Seventy-six percent of the younger old, age 65 to 74, rate their health as being good, very good, or excellent. Among those age 75 and over, 66% report good, very good, or excellent health. This percentage declines to 56% among older adults 65 and over without a high school diploma, and to 52% among minorities who are age 75 and older.
VOLUNTEERINGMany older adults are active and productive, and some choose to engage in volunteer opportunities. In any given year, almost one-fifth of older Americans engage in unpaid volunteer work for organizations such as churches, schools, or civic organizations. In addition, an unknown per-centage of older adults do other types of volunteer work, such as help-ing the sick or disabled, or assisting with the care of grandchildren.
Surprisingly, those who continue to work after age 65 are not less likely to volunteer than those older adults who retire (Caro & Morris, 2001). Researchers believe that the potential for increasing volunteer-ism among retired older adults is significant, and that “in the period immediately after retirement there is a heightened receptivity to vol-unteerism” (Caro & Morris, 2001, p. 349).
18 Health Promotion and Aging
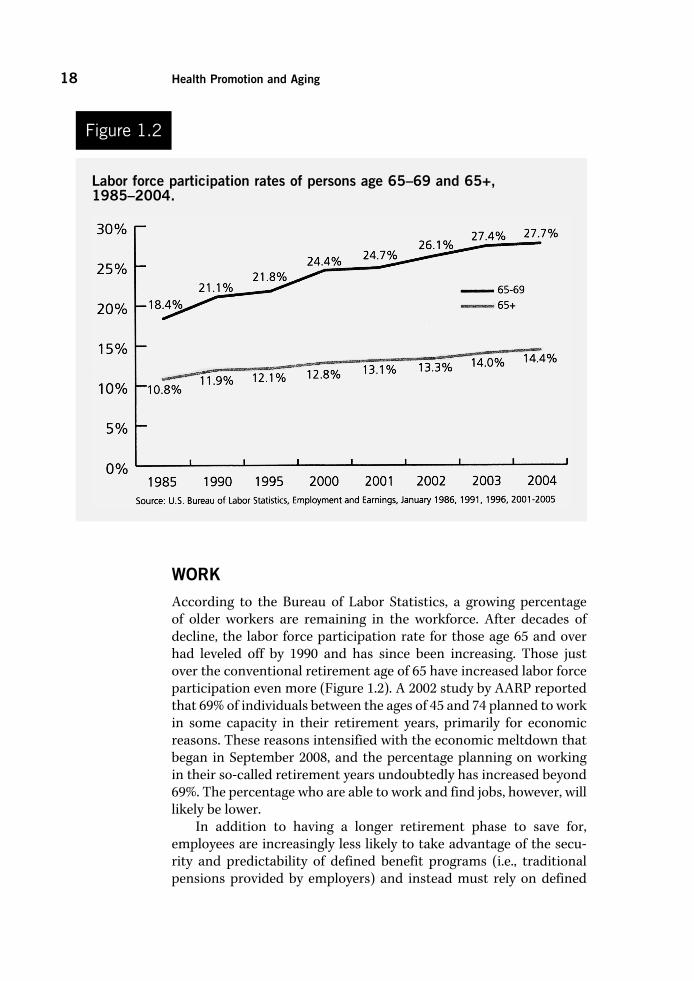
WORKAccording to the Bureau of Labor Statistics, a growing percentage of older workers are remaining in the workforce. After decades of decline, the labor force participation rate for those age 65 and over had leveled off by 1990 and has since been increasing. Those just over the conventional retirement age of 65 have increased labor force participation even more (Figure 1.2). A 2002 study by AARP reported that 69% of individuals between the ages of 45 and 74 planned to work in some capacity in their retirement years, primarily for economic reasons. These reasons intensified with the economic meltdown that began in September 2008, and the percentage planning on working in their so-called retirement years undoubtedly has increased beyond 69%. The percentage who are able to work and find jobs, however, will likely be lower.
In addition to having a longer retirement phase to save for, employees are increasingly less likely to take advantage of the secu-rity and predictability of defined benefit programs (i.e., traditional pensions provided by employers) and instead must rely on defined
Figure 1.2
Labor force participation rates of persons age 65–69 and 65+, 1985–2004.

Introduction 19
contribution programs (i.e., do-it-yourself-retirement savings plans that are subject to the whims of the stock market).
Labor force participation is higher in the United States than in most other countries, including France, Germany, Italy, Sweden, United Kingdom, and Canada; although it is lower than the rate in Japan (36% for men and 16% for women).
EDUCATIONAL STATUSBetween 1960 and 1989, the median level of education among older adults increased from 8.3 to 12.1 years. The percentage of older adults who completed high school rose from 18% in 1950, to 28% in 1970, to 70% in 2000. By 2000 the median number of years of education for people who had reached age 65 was equivalent to that of all adults age 25 and over (almost 13 years).
Unfortunately, the percentage of older adults in 2000 who had completed high school varied considerably by race and ethnic origin: 74% of Whites and 63% of Asians and Pacific Islanders, but only 46% of Blacks and 37% of Hispanics. The boomers in 2008, however, have reached the highest educational levels: 89% are high school graduates and 34% (and counting) are college graduates.
By 2007 there were more than 400 lifelong learning programs in the United States and Canada, almost all of them linked with colleges and universities and many of them loosely associated with Explori-tas (formerly Elderhostel) or the Osher Lifelong Learning Institutes, funded by the Bernard Osher Foundation. There were also a variety of other lifelong learning opportunities, such as the Adventures in Learning programs at Shepherd’s Centers, the educational programs at OASIS Centers, and other innovative educational options at com-munity colleges, community centers, art museums, and hospitals (see Chapter 12, on Community Health).
About 16% of older adults in 2000 had a bachelor’s degree or higher, up from 4% in 1950. And, as noted, this percentage will more than double as the boomers continue to attend and graduate from college. If Nola Ochs can get her undergraduate degree from Fort Hays State University in Kansas in 2007 at the age of 95, not many boomers are likely to be discouraged from attending college because of their age. Nola was not the only nonagenarian that year with such an impressive educational achievement. Phyliss Turner, at age 94, received her master’s degree in medical science at the University of Adelaide in Australia.
As the formal educational level of older adults continues to rise, this may well correlate with an increase in their interest in seeking out health information and engaging in health-promoting activities in their communities.
20 Health Promotion and Aging
POLITICAL POWERThe Federal Election Commission reports that older adults are dis-proportionately likely to vote. Moreover, the percentage of voting elders has increased over the past 20 years. In 1978 older adults gen-erated 19% of all votes cast, in 1986 21%, and in 1998 23%. However, older adults in 1998 constituted only 13% of the population.
Older adults are more likely to demonstrate high levels of civic engagement, paying more attention to politics and public affairs than younger adults (Binstock & Quadagno, 2001). Voting differences, however, are greater among older adults than between younger and older adults, as socioeconomic class, ethnicity, gender, and religion are more important influences on voting patterns than age. One exception to this trend was when older voters in the 2008 presidential election were the only age group that gave a majority of their votes to the considerably older candidate, John McCain (Binstock, 2009).
INTERNET ACCESSA 2004 national survey from the Pew Internet and American Life Proj-ect reported that the percentage of older adults who accessed the Inter-net had increased 47% between 2000 and 2004. This increase comes primarily from persons who are aging into senior status, versus those in their seventies and older, who by and large remain non-users. While the level of online usage by older adults continues to lag that of younger adults, the difference between older boomers and younger adults is not substantively significant. Thus, the Internet access gap between younger and older adults will close rapidly in the near future.
Gender differences have disappeared during this time period, with older women as likely to use the computer as older men. Income and education levels, however, still govern differences in computer usage.
POVERTYThe poverty rate among older persons has fallen from 35% of those age 65 and over, in 1969, to 9.7% in 2009. Without Social Security and cost-of-living increases, the rate would have risen to 50% over this time. Thanks to a variety of sources of income—Social Security (42%), public and private pensions (19%), earnings (18%), asset income (18%), and other (3%)—the poverty rate for older adults has fallen below the rate for persons age 18 to 64.
The declining poverty rate for older adults may be overstated, however. The U.S. Bureau of the Census assumes that the costs of food and other necessities are lower for older adults and do not adequately take into account the rising costs of medical care, transportation, and
Introduction 21
housing expenses. Also, there are hidden poor among the older popu-lation who reside in nursing homes or who live with relatives and are not counted in the official census statistics (Hooyman & Kiyak, 2008). The National Academy of Science estimates the poverty rate for older Americans at 19%.
The poverty rate is two to three times higher for older Hispanics and Blacks than for older Whites, and more than twice as high for older women than for older men. Combining gender and ethnicity, poverty in 2008 was twice as high for older Hispanic women and almost three times as high for older Black women compared with older White women.
RACIAL AND ETHNIC COMPOSITIONThe diversity of the older adult population in America is increasing. Between 1990 and 2030, the increase in the population age 65+ will be 131% among African Americans, 147% among Native Americans, 285% among Asians and Pacific Islanders, and 328% among Hispanic Americans. Non-Hispanic White older Americans, who are now in the majority, will increase only by 81%.
Although health professionals will need to become more knowl-edgeable about the ethnic backgrounds of their older clients, there is great diversity within ethnic groups as well. Age, gender, region, religion, English-speaking skills, income, education, lifestyle, physical disability, marital status, place of birth, and length of residence in the United States are examples of important variables to consider within each ethnic group.
There is also a continuum of acculturation that occurs among elders within each ethnic group. Acculturation is the degree to which individuals incorporate the cultural values, beliefs, language, and skills of the mainstream culture. To avoid stereotyping ethnic groups, there needs to be recognition of the many distinctive ethnic sub-groups (Haber, 2005a).
Definitions of Healthy AgingHealth professionals need to be cautious about defining good health for older adults. This is the message delivered by Faith Fitzgerald in an editorial in the New England Journal of Medicine (Fitzgerald, 1994): “We must beware of developing a zealotry about health, in which we take ourselves too seriously and believe that we know enough to dictate human behavior, penalize people for disagreeing with us, and even
Question: What is yourdefinition of healthy aging?

22 Health Promotion and Aging
deny people charity, empathy, and understanding because they act in a way of which we disapprove. Perhaps (we need to) debate more openly the definition of health” (pp. 197–198).
THE FEDERAL GOVERNMENTOne such “cautious” definition of health is provided by the federal government’s Public Health Service through its 1990 Health Objec-tives for the Nation. This broad definition of health includes the fol-lowing three components:
1. Disease prevention, which comprises strategies to maintain and to improve health through medical care, such as high blood pres-sure control and immunization.
2. Health protection, which includes strategies for modifying environ-mental and social structural health risks, such as toxic agent and radiation control, and accident prevention and injury control.
3. Health promotion, which includes strategies for reducing lifestyle risk factors, such as avoiding smoking and the misuse of alcohol and drugs, and adopting good nutritional habits and a proper and adequate exercise regimen.
EXTRAORDINARY ACCOMPLISHMENTThe definition of good health in late life can be reframed substan-tially by viewing it from the unique perspective of extraordinary accomplishment. At age 99 Mieczyslaw Horszowski, a classical pia-nist, recorded a new album. At age 91 Hulda Crooks climbed Mount Whitney, the highest mountain in the continental United States. A 63-year-old climbed one of the Himalayan peaks in 1998, a peak that only elite alpinists can ascend.
At age 61 a California woman named Arceli Keh lied about her age (she said she was 51) in order to become eligible for a fertility program in which she was implanted with an embryo from an anony-mous donor. In 1996, at age 63, she became the oldest woman on record to have a baby. Her record was surpassed in 2006 when Maria del Carmen Bousada, a 66-year-old Spanish woman, who had become pregnant after receiving in vitro fertilization treatment, gave birth to twins by Cesarean section in a hospital in Barcelona. The wisdom of this accomplishment was called into question in 2009, when she died from cancer at age 69, leaving behind boys not yet 3.
In 2006 the average age of a United States senator was 62 years, the oldest it has ever been. Not surprisingly, the term senate derives from the Latin word for “old.” Similarly, Golda Meir became prime minister of Israel at age 71.

Introduction 23
Kozo Haraguchi ran the 100 meters in 22.04 seconds, setting a record for the 95–99 age group. This 95-year-old Japanese man said he had to run cautiously because the outdoor track was slick with rain. Another runner, Johnny Kelley, won the Boston Marathon twice. Even more remarkable was that he had started this annual race 61 times during his lifetime, completing the entire 26.2 miles 58 times. Mr. Kelley died in 2004, at the age of 97. Another nonagenarian, though, continued to race in 2004. Fauja Singh moved from India to England and decided to take up running at the age of 82. At the age of 92 he set a world record for his age group by running the Toronto Marathon in 5 hours and 40 minutes.
Ken Mink was a basketball player at Roane State, a junior college about 35 miles west of Knoxville, Tennessee. The 6-foot, 190-pound player was listed as a senior on the basketball roster. No kidding! Ken Mink was 73 years of age in 2008, more than a half-century older than his teammates. In fact, this septuagenarian was the oldest person ever to play college basketball.
In 2009, 10 women ranging in age from 89 to 96 each memorized Hebrew in order to become a bat mitzvah, a Jewish girl who is marking the transition into religious adulthood. Unlike a bar mitzvah, for a boy, a bat mitzvah was rare until the 1960s, and these women decided to make up for what they were denied as children. They met weekly for several months with a rabbi to study Hebrew to prepare for their rite of passage at the synagogue of the Menorah Park senior residence in Cleveland, Ohio. Although three used walkers and another carried a small oxygen tank to the podium, all successfully completed their deferred quest.
At 77 John Glenn completed the rigorous physical preparation necessary to become the oldest space traveler in history. At 80 George Burns won his first Oscar. And to end on an ironic note, in 2004, at the age of 91, Red Rountree became the oldest known bank robber in United States history. Currently serving a 12-year term—likely a life sentence—in Texas, Red said he robbed banks for fun: “I feel good, awfully good for days after robbing a bank.” After two successful heists, the third time apparently was not the charm. The teller at the third bank, responding to his demand for money, asked, “Are you kidding?”
While I marvel at these examples of unusual achievement by aging adults, I do not use them as inspiration for older, or even younger, per-sons. These models are astonishing, but they do little to enhance the confidence of aging adults who do not believe they can—and perhaps do not want to—come close to achieving similar milestones.
As Betty Friedan (1993) noted in her book The Fountain of Age, as an older adult one may “attempt to hold on to, or judge oneself by, youthful parameters of love, work and power. For this is what blinds us to the new strengths and possibilities emerging in ourselves.”

24 Health Promotion and Aging
PREVENTIONPrevention is often categorized as primary, secondary, or tertiary (Figure 1.3). Primary prevention focuses on an asymptomatic individual in whom potential risk factors have been identified and targeted. Pri-mary preventive measures, such as regular exercise, good nutrition, smoking cessation, or immunizations, are recommended to decrease the probability of the onset of specific diseases or dysfunction. Primary prevention is different from health promotion in that it is less broad in scope and tends to be used by clinicians in a medical setting.
Secondary prevention is practiced with an asymptomatic indi-vidual in whom actual (rather than potential) risk factors have been identified even though the underlying disease is not yet clinically apparent. A medical screening, as an example of secondary preven-tion, is cost-effective only when there is hope of lessening the severity or shortening the duration of a pathological process. Blood pressure screenings, cholesterol screenings, and bone densitometry are the most widely implemented forms of secondary prevention.
Tertiary prevention, which takes place after the individual with a disease or disability becomes symptomatic, focuses on the reha-bilitation or maintenance of function. Health professionals attempt to restore or maintain the maximum level of functioning possible, within the constraints of a medical problem, to prevent further dis-ability and dependency on others.
Tertiary prevention corresponds to phase 2 (rehabilitation of outpatients) and phase 3 (long-term maintenance) of the rehabilita-tion of a cardiac patient (phase 1 is the care of a hospitalized cardiac patient). Randomized clinical trials with patients who had myocardial infarctions revealed that programs of tertiary prevention reduced the likelihood of cardiovascular mortality by 25%.
A focus on prevention may be more appealing to some older adults than an emphasis on health promotion. Older adults are likely to be coping with chronic conditions, and the prevention, delay, or
Three levels of prevention.
Figure 1.3
________________________________________________________________________
No Disease Preclinical or Asymptomatic Disease Symptomatic Disease
| | |
Primary Prevention Secondary Prevention Tertiary Prevention
________________________________________________________________________
Introduction 25
reduction of disability and dependency is a much more salient issue for them than it is for most younger adults.
Moreover, among medical professionals the relevancy of the term prevention is enhanced, because the costs of several prevention activities, such as mammograms, are reimbursable through Medicare. Prevention has gotten its foot in the door, so to speak, in the system of health care reimbursement, whereas the activities of health promo-tion have not.
One advantage of the use of the term health promotion, however, is that it encompasses mental and spiritual health concerns. In con-trast to clients and health professionals fixated on risk factors and the prevention of disease or disability, health promotion or wellness can be viewed as an affirming, even joyful, process. As health profession-als who promote health, for instance, we can encourage playing with grandchildren or the joy of bird watching to an older client and not concern ourselves with its ability to prevent disease or illness.
Health promotion is also a more proactive approach than primary prevention, which tends to imply a reaction to the prospect of disease. Directing a client’s anger or frustration into political advocacy work, for example, is a proactive, health-promoting enterprise that benefits both the individual and society.
WELLNESSAlthough the term wellness has had many supporters in the health professions over the past 25 years (Jonas, 2000), particularly among persons who conduct health programs at large U.S. corporations (Jacob, 2002), it tends to be embraced less than the terms health promotion and disease prevention. Nonetheless, wellness conveys an important message—that good health is more than physical well-being. In fact, seven dimensions are usually touted among wellness advocates, as shown in Table 1.5.
Wellness sends a welcome and important reminder about the breadth of health promotion that is not conveyed by most other terms. The only limitation to the term wellness is that it tends to be identified with “alternative” activities—acupuncture, homeopathy, spiritual healing, aromatherapy—to the exclusion of more main-stream activities such as exercise and nutrition. Thus, it suggests fringe pursuits or flakiness to some.
ANTI-OLD AND ANTI-AGINGWho is healthier, an old person or an older adult? Is this a prepos-terous question? Maybe not. Do the terms old and older reflect our prejudices? One of the leaders in the field of gerontological language,

26 Health Promotion and Aging
Erdman Palmore, thinks so. Palmore suggests that most of the syn-onyms for old are unhealthy in some way—words like debilitated,infirm, and frail. Older adult, on the other hand, is a more neutral term; and perhaps the term elder connotes an even healthier role for older persons in society (Palmore, 2000).
And yet I am reminded of a conversation I once had with Maggie Kuhn, the founder of the advocacy organization the Gray Panthers. She reported on an exchange that she had with President Gerald Ford at a hearing on a pension bill in Washington, DC. Once she had gotten President Ford’s attention, he asked, “And what do you have to say, young lady?” Maggie replied, “First of all, I’m not a young lady. I’m an old woman.” She was making the statement that she was proud of being old, and that she had earned that label.
A related concern is the anti-aging movement and its chief proponent, the American Academy of Anti-Aging Medicine. This pro-fessional society is “pursuing the fountain of youth with their lucrative nostrums and illusory interventions, [while] we geriatricians remain solidly in the trenches caring for our patients, the most aged, com-plex, frail, and vulnerable—far removed from the fantasies of eternal life, much less the fountain of youth” (Hazzard, 2005, p. 1435).
Most proponents of the anti-aging movement are focused not on the most aged, but on the middle-aged and the young old, those most concerned with combating the signs of aging. One key weapon in their
Seven Dimensions of Wellness
Physical—Exercise, eat a well-balanced diet, get enough sleep, protect yourself.
Emotional—Express a wide range of feelings, acknowledge stress, channel positive energy.
Intellectual—Embrace lifelong learning, discover new skills and interests.
Vocational—Do something you love, balance work with leisure time.
Social—Laugh often, spend time with friends/family, join a club, respect cultural differences.
Environmental—Recycle daily, use energy-efficient products, walk or bike, grow a garden.
Spiritual—Seek meaning and purpose, take time to reflect, connect with the universe.
Table 1.5

Introduction 27
arsenal is the cosmeceutical, a combination of the terms cosmetic and pharmaceutical that refers to a topical skin treatment formulated to eliminate the wrinkles and other signs of aging. If the cosmeceutical intervention proves insufficient, there are Botox injections, micro-dermabrasion, chemical peels, collagen injections, and plastic sur-geries. Anti-agers deliver a clear message that aging is a disease that needs to be cured—at least cosmetically and temporarily.
Another segment of the anti-aging movement believe in the power of human growth hormone (HGH). A review of 31 randomized, controlled studies, however, concluded that the risks outweigh any potential anti-aging benefits of HGH when taken by healthy older adults (Liu et al., 2007). Side effects may include diabetes, hyperten-sion, hardening of the arteries, and abnormal growth of bones or inter-nal organs. Nonetheless, government officials estimate that 25,000 to 30,000 American take injections of HGH for anti-aging purposes, paying up to $1,000 a month. While it is illegal to prescribe HGH for healthy people in the United States, speakers at the annual confer-ence of the American Academy of Anti-Aging Medicine have told physicians in the audience how they can diagnose a mild hormone deficiency so that they can legally prescribe HGH (Wilson, 2007).
I think, however, that we need a pro-aging movement, one that emphasizes the healthy aspects of aging and the benefits that accrue with age. No longer needing to impress employers, in-laws, or peers, older adults are free to be themselves. The old have the opportunity to be not only freer, but also wiser, more conscious of the present, and more willing to be advocates for a healthy future. Maggie Kuhn certainly practiced a pro-aging lifestyle.
I am not the first to use the term pro-aging. Over the last few years advertisements for Dove beauty products have consistently asked the question “Are you anti-age or pro-age?” Unfortunately, Dove’s pro-age movement consists entirely of selling moisturizers and other skin products. This is not what I have in mind when I talk about promot-ing a healthy attitude toward aging and being old.
COMPRESSION OF MORBIDITYBy definition, chronic diseases are not curable. The onset of chronic disease, however, may be postponed through the modification of risk factors. As the onset is delayed to later ages approaching the limit of the human life span, the result is a compression of morbidity. The goal is to live in robust health to a point as close as one can come to the end of the life span, so that one can die after only a brief period of ill-ness. In short, spend a longer time living and a shorter time dying.
For most people, though, the prospect of living long past one’s 65th birthday is a mixed blessing. With Americans living longer

28 Health Promotion and Aging
today than ever before, we have come to dread a prolonged period of disability and dependency in late life.
One definition of healthy aging, then, is to be able to live life fully until death. Unfortunately, very few Americans who die at age 65 or later are fully functional in the last year of life. Moreover, the longer one has lived, the longer the period of disability before death. At age 65 the average American has about 17 years left to live, with 6.5 (38%) of those years spent in a dependent state. Less than 6% of those between the ages of 65 and 74 are receiving help in the basic activities of daily living. In contrast, at age 85 we have an average of 7 years left to live, with 4.4 (63%) of those years spent in a dependent state. More than one-quarter of people in that age group require help in the basic activities of daily living.
Pessimists argue that the period of morbidity preceding death will lengthen in the future as a result of (a) limited biomedical research funds available to improve the physical and mental capacity of the very old; (b) the fact that some major diseases, such as Alzheimer’s, do not have recognized lifestyle risk factors that we can modify; and (c) medical advances, such as dialysis and bypass surgery, that will increase the life expectancy of individuals with disease rather than prevent the occurrence of disease.
Optimists, on the other hand, claim that there will be a compres-sion of morbidity (see Figure 1.4) in the future due to (a) the likelihood of advances in biomedical research that will prevent or delay the occurrence of disease and (b) the continued potential for reducing risk factors such as smoking, high blood pressure, poor nutritional habits, and sedentary lifestyles, which will result in better health.
Even as the general population further delays the onset of chronic disease due to these risk factors, the life span (the maximum number of years for a member of the species) is likely fixed. Thus, argue the
Compression of morbidity.Figure 1.4
Severity
Morbidity
of Disease
Compressionof Morbidity
Age 75 100Duration of Disease
Age

Introduction 29
compressionists, we will not only delay morbidity, but we will also shorten it.
Studies by Manton and colleagues (C. Connolly, 2001; Manton et al., 2006, 1998) analyzed data from the 1982 to 2004–2005 results of the National Long Term Care Survey, a federal study that regu-larly surveys almost 20,000 people age 65 and older. The researchers arrived at the unexpected conclusion that the percentage of chroni-cally disabled older persons—those having impairments for three months or longer that impede daily activities—has been slowly fall-ing. Whereas 25% of people over age 65 reported chronic disability in 1982, only 21% reported this to be the case in 1994 and 19% did so in 2004–2005. Also, the percentage of persons over age 65 reporting no disabilities continued to rise.
Are these unexpected findings linked to initiatives in health pro-motion, such as better diet, more exercise, and smoking cessation? To improved medical access and advances such as treatment for arthritis and cataracts? To increased use of devices such as canes, walkers, walk-in showers, support rails, and handicapped-accessible facilities? To societal improvements such as increased education and income levels? We do not yet know which factors are most important.
Health Perspectives and AgingHEALTH EXPECTANCY VERSUS LIFE EXPECTANCYThose who live to the age of 65 are likely to live into their 80s. Of the remaining 17 years, on average, of life after age 65, 12 are likely to be healthy and 5 will be years in which there is some functional impair-ment (National Center for Health Statistics, 1990a).
Place yourself in the shoes of the person who has just reached age 65. Are you primarily interested in extending your life beyond the 17 years you are likely to remain alive, or are you most interested in how many of these remaining years will find you healthy and independent?
Your health expectancy, or the number of healthy years you can expect to have left, depends to a great extent on your level of physi-cal activity, nutritional intake, social support network, access to good medical care, health education, and utilization of health services. Health expectancy is more important to older adults than life expec-tancy. Unfortunately, we have not made much progress on this front. The goal of Healthy People 2000 was to increase the number of years of healthy life remaining after age 65 to 14. It increased only to 12.2 years, however, an advance of only 0.4 year over the prior decade.

30 Health Promotion and Aging
PHYSICAL VERSUS EMOTIONAL ASPECTS OF AGINGThere is a strong reciprocal relationship between the physical and emotional aspects of health. When our physical health is threatened, so typically is our emotional health. The converse is equally true.
As we age, however, it may be the case that good health becomes less dependent on physical status than on emotional status. Stud-ies report shifting perspectives of health over time, with older par-ticipants expecting physical health problems because of their age and discounting them somewhat, when they do appear, because of this expectation. A study of 85-year-olds living in the Netherlands reported that physical function was not the most important com-ponent of successful aging. These older adults were able to adapt successfully to physical limitations. The researchers reported social contacts as the most important factor in well-being, and the quality of the contacts was more important than their number (Von Faber et al., 2001). Open-ended interviews reveal more than 100 characteristics of health that are important to older adults besides physical health, including the ability to enjoy life and good personal relationships. Many older adults who are frail and sometimes disabled do not evalu-ate their health or life negatively.
Most health professionals subscribe to the notion that health is more than the absence of illness. Were this not the case, they would have to label the vast majority of older adults, 90% of whom are cop-ing with a chronic condition, unhealthy. The chronic diseases that older persons contend with do not necessarily relate to their ability to perform daily activities. Disease, in fact, may not be evident even to the person who has it.
The presence or absence of disease, therefore, may not be a source of great concern to older adults. The ability to perform activi-ties of daily living, however, is of great concern to older adults, who desire as much independence as possible. The definition of health, especially among older adults, should not be linked with disease or its absence, as the medical model suggests, but with independence, the ability to accomplish one’s goals, and the presence of satisfying relationships.
A health perspective that emphasizes the psychological status of older adults does not view health as a continuum ranging from physi-cal disability and illness at one end, with a neutral point in the middle where there is no discernible illness or wellness, to a high level of well-ness at the other end. Critics of this type of health continuum argue that even a person who is functionally impaired or disabled, and thus residing at one end of the alleged continuum, can focus considerable

Introduction 31
attention on a high level of wellness and devote energy to health awareness, health education, and psychological growth.
Finally, health professionals need to walk a fine line with older clients. On the one hand, they have been accused of ignoring the medical needs of older adults by discounting the viability of certain medical interventions due to advanced patient age. In fact, patients in their 80s can benefit as much from surgical interventions as can younger patients (Varghese & Norman, 2004). On the other hand, health professionals can unduly focus on the (reimbursable) medical needs of very old clients and neglect the personal values that inform the quality of life of the older adult and how they might shape a deci-sion to risk surgery and its after-effects.
Health CareMEDICAREMedicare was enacted in 1965 to help persons age 65 or older pay for medical care. In 2008 Medicare covered 45 million older adults and more than 5 million younger persons who are disabled. Medicare is a major payer in the United States health care system, spending $309 billion in 2004 with projections of $670 billion in 2015. Ironi-cally, despite the generous reimbursements they receive through the Medicare program ($11,000 per beneficiary in 2008), older Americans spend more money out-of-pocket now (almost $5,000 per beneficiary in 2008), after controlling for inflation, than they did prior to the inauguration of Medicare.
Medicare Part A is referred to as hospital insurance, and most people do not have to pay a monthly premium for this insurance because they are eligible through the taxes they paid while working. Part A includes hospital care ($1,068 deductible in 2009), inpatient psychiatric care (190-day lifetime maximum), skilled nursing facility care (100 days), rehabilitation or home care following a hospitaliza-tion, and hospice care for the terminally ill. There are restrictions on what kinds of conditions are covered and the length of coverage. Co-payments apply as well.
Medicare Part B is referred to as medical insurance and cov-ers physician services, outpatient hospital care, and other medical services such as physical and occupational therapy and some home health care. Part B requires a premium of $96.40 per month and gen-erally pays 80% of physician and outpatient services after an annual $135 deductible (in 2009). Part B includes most medical screenings

32 Health Promotion and Aging
and clinical laboratory tests but does not cover dental services, hearing aids, eyeglasses, and most long-term care services. Chronic conditions are, for the most part, not covered by Medicare, and prevention coverage is limited primarily to medical screenings and immunizations.
Beginning in 2007 Medicare shifted, for the first time, to means-based testing for Part B premiums. As of 2009, only individuals earn-ing less than $85,000 a year ($170,000 for married couples) paid the $96.40 premium; individuals who exceeded this income level had their premiums increased, based on how much additional income they earned. Use of this type of income indexing will continue to increase in the coming years, and some project that beneficiaries with high incomes may pay at least three times the basic premium amount.
Part C refers to private health insurance plans that provide Medi-care benefits. At the time of this writing, the Obama administration was seeking to eliminate this component of Medicare on the grounds that the private insurers were being additionally subsidized at tax-payers’ expense compared with the traditional Medicare option (see Chapter 14, Public Health).
Part D refers to the Medicare Prescription Drug plan, which went into effect on January 1, 2006. This part is also administered by private health insurance companies (and will also be examined in Chapter 14).
A little over one-fourth of the federal outlay for older adults is for Medicare, and these expenditures have been rising (and continue to rise) rapidly. Between 1960 (five years before the onset of Medicare) and 1990, the proportion of the federal budget spent on programs serving older adults had doubled, from 15% to 30%. Much of this increase occurred between 1975 and 1988, when personal health care expenditures under Medicare increased an average 14.4% per year, more than twice the rate of inflation. Stated in absolute dollars, Medicare spending increased from $7.5 billion in 1970 to $114 billion in 1991.
Although the growth in Medicare spending has slowed since then, it is still dramatic. Medicare spending more than doubled between 1991 and 2001 ($114 billion to $238 billion) and six years later, by 2007, had almost doubled again ($431 billion). With the advent of Medicare Part D prescription benefits in 2006, spending continued to escalate, with prescription drug costs increasing 8.5% that year.
It is not surprising, therefore, that even though the single largest component of out-of-pocket costs for older adults is much-needed long-term care, the federal government has resisted overtures to include substantial long-term care coverage under Medicare.

Introduction 33
Even without the additional expense of long-term care, Medicare is projected to become insolvent by 2017. This insolvency might occur sooner if Medicare Part D prescription drug costs continue to rise unabated, if additional payments to private health plans continue, and if government revenues become much lower than originally predicted because of the economic meltdown that began in September 2008.
An interesting line of research has shown that Medicare spend-ing across the country varies greatly, but health outcomes tend to be the same no matter how much money is spent in a particular region. Some argue, therefore, that Medicare costs could be reduced significantly if the entire nation could bring its costs down to match the lower-spending regions. Landrum and colleagues (2008) agree with this premise, with one caveat. While increased area-level spend-ing does not correlate with improved patient outcomes overall, in certain cases increased spending is beneficial. The problem is that high-spending areas also spent too much money on health care prob-lems where little or no benefit results. The authors concluded that Medicare could save money not by capping costs, but by applying comparative effectiveness studies, that is, determining which treat-ments work best for which patients, and whether the benefits are commensurate with the costs.
The Centers for Medicare and Medicaid Services oversees all financial and regulatory aspects of the Medicare and Medicaid systems. For additional information, call 800-MEDICARE (800-633-4227) or go to the Medicare Web site at www.medicare.gov.
MEDICAIDMedicaid is different from Medicare in that it is not focused primarily on older adults; it is a state-run, not a federally managed, program; and it is funded jointly by the states and the federal government, not by the federal government alone. The most significant difference is that Medicaid is the largest source of funding for medical and health-related services for people with limited income—what used to be referred to as a welfare program—as opposed to Medicare, which is partially financed by users through payroll taxes.
Because it is state run, Medicaid policies for eligibility, services, and payment vary considerably. One aspect of Medicaid that has not varied much, regardless of state, is that costs have increased steadily throughout the country, now constituting, on average, a quarter of each state’s budget. Medicaid spending totaled $304 billion in 2006 and is projected to grow to $670 billion in 2015.
On a gerontological note, Medicaid pays for nearly 60% of the care for all nursing home residents, most of whom are older adults. It is the
34 Health Promotion and Aging
primary insurance plan covering institutional long-term care. Medic-aid is based on the premise that individuals pay out-of-pocket until becoming impoverished to the point where they are eligible for cover-age. Moreover, an older person who gives away money from a bank account to a relative during the five years prior to applying for Medic-aid cannot qualify for assistance with their long-term care expenses.
SOCIETAL HEALTH CARE COSTS VERSUS QUALITY OF CAREIn a democratic society there is stiff competition for societal resources that are taxpayer subsidized. Health care, however (typically referring primarily to medical care), has consistently maintained its status in this country as a very high priority for these limited resources. Spending for national health care grew from 5% of the gross domestic product (GDP) in 1960 to 16% in 2008. This represents an increase from $27 billion in 1960 to $2.3 trillion in 2008. (As an aside, I would like to note that on more than one occasion I have seen “trillion” mistakenly replaced by “billion” in the health care expenditure litera-ture. It is difficult to comprehend the definition of a trillion—which perhaps explains why one of the definitions in the 10th edition of Merriam-Webster’s Collegiate Dictionary for “trillion” is “a very large number.”)
The United States spends 16% of its GDP on health care, while other developed countries spend between 6% and 11%. Much of the discrepancy in health care costs with other countries began in 1980 with the rise of private health care insurers (and their profits) and the use of sophisticated medical technology. In the past three decades health expenditures doubled in other countries, but more than tripled in the United States. This disparity would be even greater if we did not have 46 million younger Americans lacking health insurance coverage, and if we increased coverage for the millions who have inad-equate insurance.
By all accounts we spend the most on health care of any other country, but this does not necessarily mean we have the best health care. “Best” can be defined in a number of ways—for example, as access to medical care by all citizens or as a priority on disease prevention and health promotion over costly specialized medical procedures.
The World Health Organization made its first attempt to mea-sure quality health care in its World Health Report, published in June 2000. The rankings were controversial, but clearly the reader needs to be alarmed that the United States ranked 37th. It is sobering to note that U.S. health care expenditures per capita were more than double those of Japan in 1999, and yet Japanese citizens were expected to

Introduction 35
live 74.5 years of healthy life, versus only 70 for United States citizens (Crossette, 2000).
Another international study of health care quality was conducted in 2006, and the United States ranked last compared with Australia, Canada, Germany, New Zealand, and the United Kingdom. The per capita health expenditures of these five countries ranged from 33% to 53% of the United States’, yet among 51 indicators—including such health promotion measures as use of mammograms, flu shots, medication reviews, and diet and exercise advice—the United States ranked last or tied for last on 27 (Monaghan, 2006).
Yet another international study compared the United States, Australia, Canada, France, Germany, the Netherlands, New Zealand, and Britain, and suggested that the supremacy of American health care may be limited to a handful of preeminent medical centers. While the United States does well in such important aspects of health care as providing prompt access to some of the best specialists in the world, 43% of insured (!) Americans skipped care at some point during the year because they could not afford the high out-of-pocket costs (Schoen et al., 2009).
HEALTH CARE VERSUS MEDICAL CAREIt is estimated that 60% of early deaths in the United States are due to behavioral, social, and environmental circumstances, versus 10% that result from shortfalls in medical care (with genetic predisposition responsible for the remainder) (McGinnis et al., 2002). Paradoxically, however, the behavioral, social, and environmental components of health care have not constituted a high priority for the health care dollar. In fact, only about 3% of the nation’s $2.3 trillion spent on health care in 2008 was spent on health-promoting and disease-preventing activities.
Most of that 3% goes either to the physician’s office or to other clinical settings for preventive measures, such as medical screen-ings and vaccinations (about 35%), or toward health protection in the physical environment, such as toxic agent and radiation control (about 30%). And only a portion of the remainder is spent on chang-ing unhealthy behaviors.
Although there has been undeniable financial neglect at the federal level in addressing unhealthy lifestyles among the American people, increasing public attention has been focused on this prob-lem behavior ever since the publication of the landmark document Healthy People: The Surgeon General’s Report on Health Promotion and Disease Prevention (USDHHS, 1979). This report provided con-siderable credence to the idea that any major gains in health and
Question: Why do we call medical care “health care”?

36 Health Promotion and Aging
independence in the future will likely come from personal lifestyle changes.
Dr. John Rowe, director of the MacArthur Founda-tion’s Consortium on Successful Aging, supported this report by concluding that our vigor and health in old age is mostly a matter of managing how we live. A classic article in the Journal of the American Medical Association(McGinnis & Foege, 1993) suggested that we no longer should view death as being due to heart disease, cancer,
stroke, and COPD; rather, we should see it as the result of tobacco use, inactivity, poor diet, alcohol abuse, microbial and toxic agents, risky sexual behavior, motor vehicle injuries, and illicit or inappropriate use of drugs.
We devote most of our money to medical care, but we need to focus more of our attention on health care.
Question: What are two of the most important changes needed to make to convert our medi-cal care system into a health care system? How can we make these changes?