Trends in hospitalised childhood injury in Australia 1999-07 (full ...

Jessup et al. BMC Health Services Research (2017) 17:52 DOI 10.1186/s12913-016-1973-6
RESEARCH ARTICLE Open Access
Health literacy of recently hospitalisedpatients: a cross-sectional survey using theHealth Literacy Questionnaire (HLQ)
Rebecca L. Jessup1,2*, Richard H. Osborne1, Alison Beauchamp1, Allison Bourne2,3 and Rachelle Buchbinder2,3Abstract
Background: Health literacy is simply defined as an individual’s ability to access, understand and use informationin ways that promote and maintain good health. Lower health literacy has been found to be associated withincreased emergency department presentations and potentially avoidable hospitalisations. This study aimed todetermine the health literacy of hospital inpatients, and to examine if associations exist between differentdimensions of their health literacy, sociodemographic characteristics and hospital services use.
Methods: A written survey was sent to 3,252 people aged ≥18 years in English, Arabic, Chinese, Vietnamese, Italianor Greek. The survey included demographic and health questions, and the Health Literacy Questionnaire (HLQ).The HLQ is a multidimensional instrument comprising nine independent scales. Use of hospital services was measuredby length of stay, number of admissions in 12 months and number of emergency department presentations. Effect size(ES) for standardised differences in means described the magnitude of differences in HLQ scale scores betweendemographic and socioeconomic groups.
Results: 385 questionnaires were returned (13%); mean age 64 years (SD 17), 49% female. Aged ≥65 years (55%),using the Internet < once a month (37%), failure to complete high school (67%), low household income (39%),receiving means-tested government benefits (61%) and being from a culturally and linguistically diverse (CALD)background (24%), were all associated with lower scores in some health literacy scales. Being aged ≥65 years, notcurrently employed, receiving government benefits, and being from a CALD background were also associated withincreased use of some hospital services. There was no association between lower scores on any HLQ scale and greateruse of hospital services.
Conclusion: We found no association between lower health literacy and greater use of hospital health services.However increased age, having a CALD background and not speaking English at home were all associated with havingthe most health literacy challenges Strategies to address these are needed to reduce health inequalities.
Keywords: Health literacy, Hospitalisation, Equity, Access
* Correspondence: [email protected] University, Health Systems Improvement Unit, Centre for PopulationHealth Research, School of Health and Social Development, Geelong, Victoria3220, Australia2Monash Department of Clinical Epidemiology, Cabrini Institute, Malvern, VIC3144, AustraliaFull list of author information is available at the end of the article
© The Author(s). 2017 Open Access This articInternational License (http://creativecommonsreproduction in any medium, provided you gthe Creative Commons license, and indicate if(http://creativecommons.org/publicdomain/ze
le is distributed under the terms of the Creative Commons Attribution 4.0.org/licenses/by/4.0/), which permits unrestricted use, distribution, andive appropriate credit to the original author(s) and the source, provide a link tochanges were made. The Creative Commons Public Domain Dedication waiverro/1.0/) applies to the data made available in this article, unless otherwise stated.

Jessup et al. BMC Health Services Research (2017) 17:52 Page 2 of 12
BackgroundThe provision of safe, equitable and accessible health careis an ongoing challenge for all health service providers. Inthe face of increasing pressure from an ageing population[1, 2], growth in chronic and preventable disease [3], in-creasing healthcare costs and workforce shortages [4–8],and changing community expectations [9, 10] hospitalsare under unprecedented pressure to deliver the rightcare, at the right time. An ongoing challenge for hospitalsis the management of potentially avoidable hospitalisa-tions for conditions that may have been treated or man-aged out of hospital [11]. While the reasons for requiringhospitalisation are complex and multifactorial, addressinga patient’s health literacy needs may be one potential strat-egy for reducing avoidable hospitalisations.Health literacy is defined by the World Health
Organisation as ‘the cognitive and social skills which de-termine the motivation and ability of individuals to gainaccess to, understand and use information in ways whichpromote and maintain good health’ [12]. Individualsrequire good health literacy in order to access and under-stand all the information and support they require toappropriately manage unexpected acute illness or exist-ing chronic conditions [13, 14].Several studies have found an association between
lower health literacy and potentially avoidable hospitali-sations [15–17]. However these studies have generallyused health literacy tools that are unidimensional, andonly capture one aspect of health literacy, i.e. health-related reading +/− numeracy ability [18]. As implied bythe definition above and empirical data [19], health literacyis a multidimensional concept that cannot be fully capturedby a single skill or attribute. The influence of contextual,social and cultural factors, and the ability of healthcarepractitioners and healthcare organisations to meet patients’health literacy needs have received little attention.The Health Literacy Questionnaire (HLQ) is a multi-
dimensional instrument designed to generate a profile ofan individual’s or population’s health literacy strengthsand weaknesses [20]. It comprises 44 items across nineindependent scales: Feeling understood and supported byhealthcare providers; Having sufficient information tomanage my health; Actively managing my health; Socialsupport for health; Appraisal of health information;Ability to actively engage with healthcare providers;Navigating the healthcare system; Ability to find goodhealth information; and Understanding health informa-tion enough to know what to do. In contrast to singledimensional measures, the HLQ has been demonstratedto provide a detailed profile of an individual’s health lit-eracy skills and needs. It has also been used to provideguidance for the development of interventions to ad-dress these needs [21], and therefore may also be usefulto guide development of interventions to reduce
avoidable hospitalisations. The aim of this study wasto determine the health literacy strengths and weak-nesses of a cohort of hospital inpatients, and toexamine if associations exist between the differentdimensions of health literacy and patients’ demo-graphic and socioeconomic characteristics and use ofhospital services.
MethodsA cross-sectional survey was posted to patients who hadrecently (less than 30 days) attended an acute publichospital in Victoria, Australia. This hospital is located inMelbourne’s northern suburbs and provides care to a di-verse community. The hospital’s catchment includes ahigher proportion of people and households withlower income, lower educational attainment, highernumbers of migrants, and higher rates of unemploy-ment than Victorian State averages [22]. The utilisa-tion rates for hospital interpreter services identifiesthat over 120 languages are spoken amongst patientsattending this service.Data collection took place over six months from
January to June 2015. Each month, 500 participantswere invited to participate. Potential participantswere identified through the hospital’s computerizedclinical and administrative data warehouse. Partici-pants were eligible if they had been hospitalised forat least 24 h in the past 30 days, and if they spokeEnglish, Arabic, Chinese, Vietnamese, Greek or Italian,all languages in the top 10 most spoken languages in theregion. Participants were excluded if they had beenhospitalised for less than 24 h to ensure that we excludedpatients admitted for day medical procedures, day oncol-ogy, dialysis or those briefly attending emergency. Partici-pants were also excluded if they were aged under 18, hada history of cognitive impairment, or if they were dis-charged to another institution rather than returning home.Each month, purposive sampling was used to identify allpatients who spoke one of the non-English target lan-guages to ensure oversampling of these groups. Theremaining participants were randomly selected fromeligible English speaking patients.To maximise the survey response rate, each partici-
pant was sent a pre-notification letter written in theirlanguage and signed by the hospital’s Chief ExecutiveOfficer (CEO). The letter encouraged participation inorder to assist the hospital to improve services. A weeklater, participants were mailed the participant informa-tion and consent form, the HLQ and a brief survey ofhealth and demographic and socio-economic variables intheir language. A late return/reminder letter was senttwo weeks following the mail out of the survey.The study was approved by the Northern Health and
Deakin University Human Research and Ethics Committees.

Jessup et al. BMC Health Services Research (2017) 17:52 Page 3 of 12
HypothesesIn keeping with previous studies, we hypothesised that beingolder, not speaking English at home, being born in a countrywhere English was not the first language, and/or living alonewould be associated with lower scores across all nine HLQscales [21]. We also hypothesised an association betweenlower scores across the nine HLQ scales and lower socio-economic status (unemployment, leaving school beforecompletion, household income less than $30,000, on gov-ernment means tested benefits, not having private health in-surance) and minimal Internet use (less than once a month).With respect to use of hospital services, we hypothe-
sized an association between lower health literacy andindicators of lower socioeconomic status and higher self-reported attendance at any hospital ED for non-urgentconditions in the previous 12 months, increased ED pre-sentations for non-urgent conditions at the same hospitalin the last 12 months, increased number of hospitaladmissions at the same hospital in the last 12 months, andlonger length of stay for the index hospitalisation.
MeasuresHealth Literacy Questionnaire: The questionnaire takesbetween 7 and 40 min to complete [Jessup R, BeauchampA, Buchbinder R, Osborne R: Psychometric properties andcomparability of four health literacy assessment instru-ments in the hospital setting, submitted]. Each domain ofthe HLQ consists of either 4 or 5 items. Items in the firstfive domains are scored from 1 to 4 (strongly disagree = 1to strongly agree = 4), while the last four domains arescored 1 to 5 (cannot do or always difficult = 1 to veryeasy = 5), A domain score is calculated by adding up thescores within each domain and then dividing this value bythe number of items in the respective domain with higherscores indicating higher health literacy. Each HLQ domainhas been demonstrated to be conceptually distinct andmeasure independent constructs using confirmatory factoranalysis, consequently a total score is not generated [20].The HLQ was translated from English into Arabic,
Chinese (simplified, so it was suitable for both Cantoneseand Mandarin speakers), Vietnamese, Italian and Greek asthese 5 languages are in the top 10 most spoken languagesin the region. The translation process consisted of forward,backward then forward translation, followed by furtherverification with native speakers to ensure that the intendedmeaning of items was consistent with the item intent.Demographic and socioeconomic data: We collected
data about age, sex, living arrangements (alone or withothers), indigenous status, country of birth, primarylanguage spoken at home (English or another language),educational attainment (completion of high school ornot), work status (employed or not working (unemployed,retired, ill)), household income (< or ≥ $30,000 perannum) and receipt of means-tested government benefits.
Use of hospital services: To examine use of services atthe hospital where the research was based, we extractedservice use information from the hospital’s data ware-house for both respondents and non-respondents. Dataextracted included: whether the admission was planned(or the patient was admitted via ED), the number of daysthey were hospitalised, number of hospital admissions atthis hospital in the last 12 months (including the indexone), and number non-urgent ED presentations to thisED in the last 12 months. In addition, we also asked re-spondents to self-report whether they had attended anyED at any hospital in the last 12 months.
Statistical AnalysisTo determine whether an association between demo-graphic and socioeconomic variables and hospital serviceuse rates existed, we conducted Pearson chi-square testsusing SPSS® version 22 [23]. Effect sizes were calculatedusing the phi coefficient, a measure of the association be-tween two binary variables, with a small effect size classi-fied as being between 0.10 and 0.30, a medium effect sizefrom 0.30 to 0.50, and large effect size >0.50 [24].Cohen’s effect sizes (ES) for standardised differences in
means of HLQ scales across comparator variables werecalculated using Stata® software [25]. The pooled stand-ard deviation (PSD) was used as the denominator anddifference within scales as the numerator. In this case,the effect size describes the magnitude of differences inHLQ scale scores between groups, with scores between0.20-0.50 considered small, 0.50-0.80 considered medium,and > 0.80 considered large as described by Cohen[24]. A p < 0.05 was regarded as statistically significantfor all tests.We assessed the relationship between use of hospital
services and demographic and socio-economic character-istics and the key outcome variable, health literacy, withthe aim of advancing to multiple regression analyses if anassociation was found between health literacy and use ofhospital services.
Results3252 surveys were sent and responses were receivedfrom 384 participants (response rate 13%) (Fig. 1). Thehighest response was from participants completed thequestionnaire in Chinese (n = 8/44, 18.0%), followed byEnglish (n = 307/1981, 15.5%), Greek (n = 18/171,10.5%), Italian (n = 28/350, 8.0%), Arabic (n = 22/314,7.0%), and Vietnamese (n = 1/50, 2.0%).Table 1 displays the demographic and socioeconomic
details, hospital services use and reason for admission ofrespondents, and non-respondents where available. Themean age of participants was 64 years (SD 17) and 49%were female. By comparison, mean age of non-respondentswas lower (55 years (SD 21)) but the proportion of females
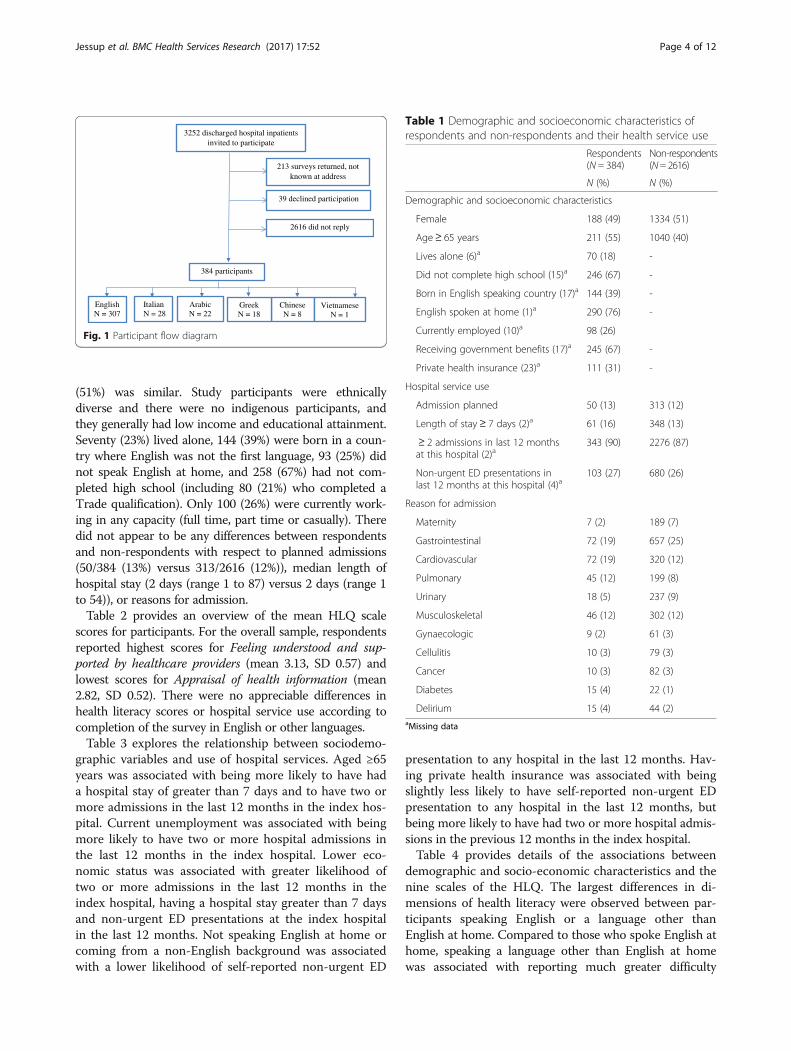
Table 1 Demographic and socioeconomic characteristics ofrespondents and non-respondents and their health service use
Respondents(N = 384)
Non-respondents(N= 2616)
N (%) N (%)
Demographic and socioeconomic characteristics
Female 188 (49) 1334 (51)
Age≥ 65 years 211 (55) 1040 (40)
Lives alone (6)a 70 (18) -
Did not complete high school (15)a 246 (67) -
Born in English speaking country (17)a 144 (39) -
English spoken at home (1)a 290 (76) -
Currently employed (10)a 98 (26)
Receiving government benefits (17)a 245 (67) -
Private health insurance (23)a 111 (31) -
Hospital service use
Admission planned 50 (13) 313 (12)
Length of stay≥ 7 days (2)a 61 (16) 348 (13)
≥ 2 admissions in last 12 monthsat this hospital (2)a
343 (90) 2276 (87)
Non-urgent ED presentations inlast 12 months at this hospital (4)a
103 (27) 680 (26)
Reason for admission
Maternity 7 (2) 189 (7)
Gastrointestinal 72 (19) 657 (25)
Cardiovascular 72 (19) 320 (12)
Pulmonary 45 (12) 199 (8)
Urinary 18 (5) 237 (9)
Musculoskeletal 46 (12) 302 (12)
Gynaecologic 9 (2) 61 (3)
Cellulitis 10 (3) 79 (3)
Cancer 10 (3) 82 (3)
Diabetes 15 (4) 22 (1)
Delirium 15 (4) 44 (2)aMissing data
3252 discharged hospital inpatients invited to participate
213 surveys returned, not known at address
39 declined participation
384 participants
EnglishN = 307
2616 did not reply
Arabic N = 22
Chinese N = 8
Greek N = 18
ItalianN = 28
Vietnamese N = 1
Fig. 1 Participant flow diagram
Jessup et al. BMC Health Services Research (2017) 17:52 Page 4 of 12
(51%) was similar. Study participants were ethnicallydiverse and there were no indigenous participants, andthey generally had low income and educational attainment.Seventy (23%) lived alone, 144 (39%) were born in a coun-try where English was not the first language, 93 (25%) didnot speak English at home, and 258 (67%) had not com-pleted high school (including 80 (21%) who completed aTrade qualification). Only 100 (26%) were currently work-ing in any capacity (full time, part time or casually). Theredid not appear to be any differences between respondentsand non-respondents with respect to planned admissions(50/384 (13%) versus 313/2616 (12%)), median length ofhospital stay (2 days (range 1 to 87) versus 2 days (range 1to 54)), or reasons for admission.Table 2 provides an overview of the mean HLQ scale
scores for participants. For the overall sample, respondentsreported highest scores for Feeling understood and sup-ported by healthcare providers (mean 3.13, SD 0.57) andlowest scores for Appraisal of health information (mean2.82, SD 0.52). There were no appreciable differences inhealth literacy scores or hospital service use according tocompletion of the survey in English or other languages.Table 3 explores the relationship between sociodemo-
graphic variables and use of hospital services. Aged ≥65years was associated with being more likely to have hada hospital stay of greater than 7 days and to have two ormore admissions in the last 12 months in the index hos-pital. Current unemployment was associated with beingmore likely to have two or more hospital admissions inthe last 12 months in the index hospital. Lower eco-nomic status was associated with greater likelihood oftwo or more admissions in the last 12 months in theindex hospital, having a hospital stay greater than 7 daysand non-urgent ED presentations at the index hospitalin the last 12 months. Not speaking English at home orcoming from a non-English background was associatedwith a lower likelihood of self-reported non-urgent ED
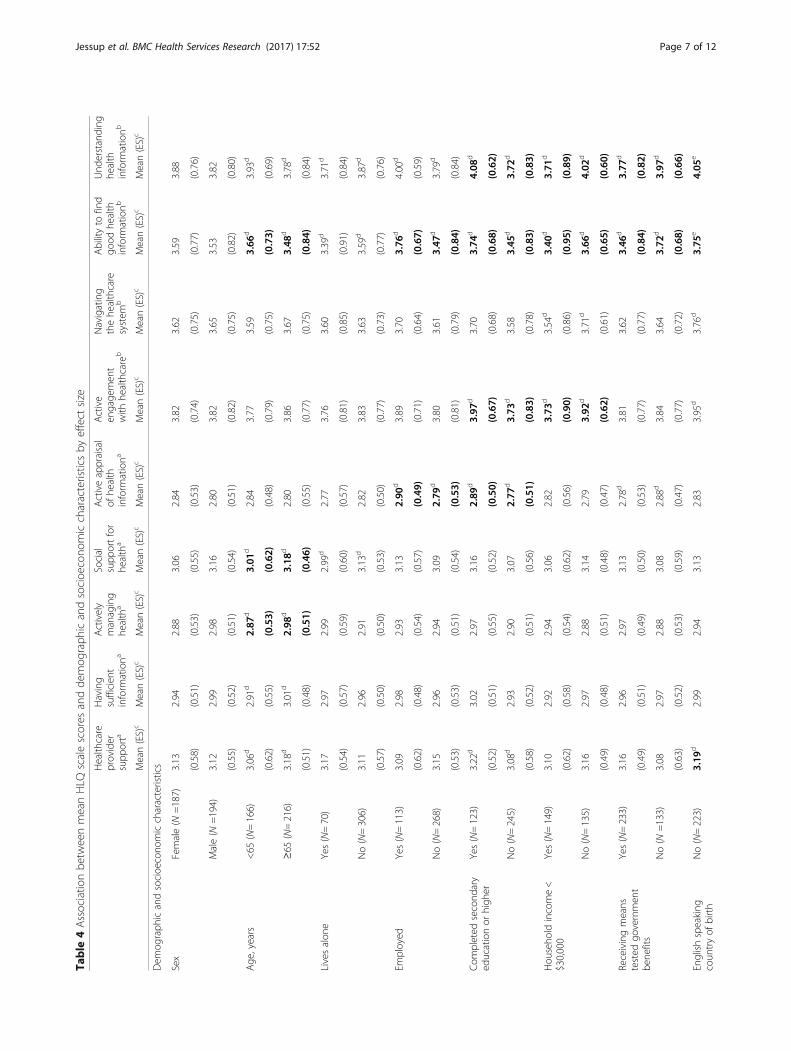
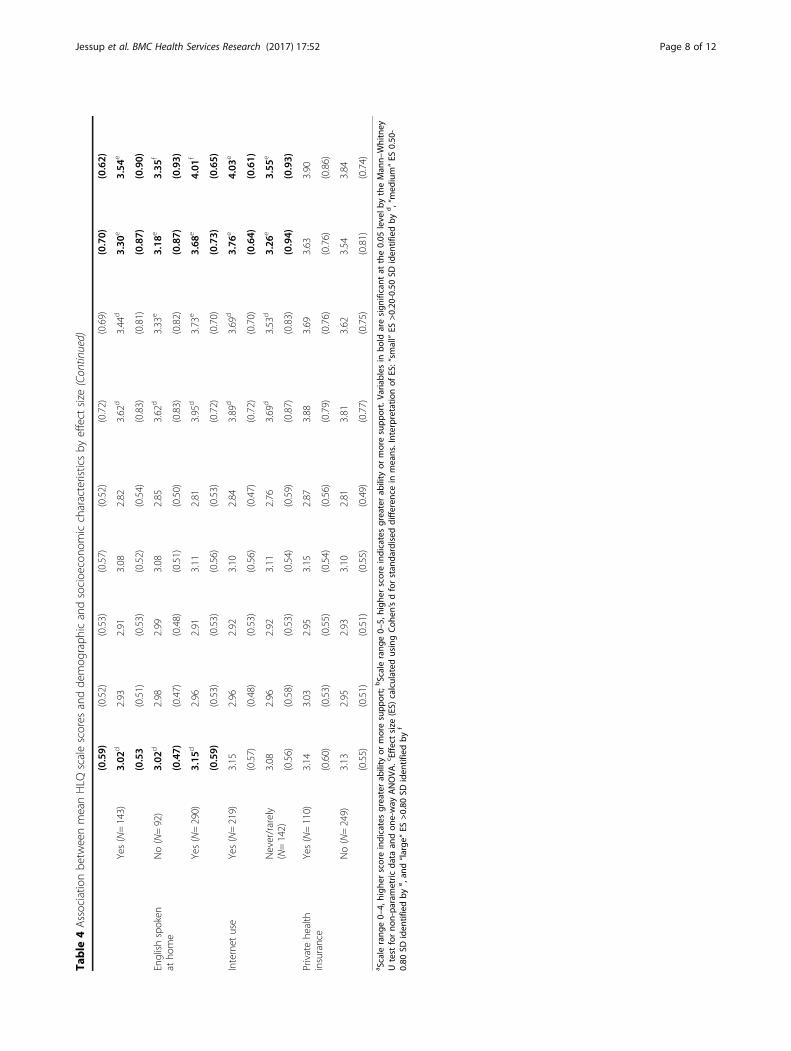
presentation to any hospital in the last 12 months. Hav-ing private health insurance was associated with beingslightly less likely to have self-reported non-urgent EDpresentation to any hospital in the last 12 months, butbeing more likely to have had two or more hospital admis-sions in the previous 12 months in the index hospital.Table 4 provides details of the associations between
demographic and socio-economic characteristics and thenine scales of the HLQ. The largest differences in di-mensions of health literacy were observed between par-ticipants speaking English or a language other thanEnglish at home. Compared to those who spoke English athome, speaking a language other than English at homewas associated with reporting much greater difficulty

Table 2 Health literacy and health service use of participants, all and by survey language (N = 384)
All N = 384 English N = 307 Arabic N = 22 Chinese N = 8 Greek N = 18 Italian N = 28 VietnameseN = 1
Mean (SD) Mean (SD) Mean (SD) Mean (SD) Mean (SD) Mean (SD) Mean
Health Literacy Questionnaire (HLQ)
Feeling understood and supported byhealthcare providersa
3.13 (0.57) 3.17 (0.57) 2.92 (0.50) 3.06 (0.40) 3.01 (0.33) 2.91 (0.71) 3.25
Having sufficient information to managehealtha
2.97 (0.52) 2.98 (0.52) 2.81 (0.52) 2.91 (0.30) 2.9 (0.27) 2.98 (0.70) 3.00
Actively managing my healtha 2.93 (0.52) 2.93 (0.52) 2.87 (0.53) 2.95 (0.54) 2.93 (0.34) 3.05 (0.61) 2.80
Social support for healtha 3.11 (0.55) 3.12 (0.55) 3.08 (0.46) 2.93 (0.59) 3.19 (0.43) 3.06 (0.66) 2.80
Appraisal of health informationa 2.82 (0.52) 2.81 (0.52) 2.93 (0.47) 2.9 (0.44) 2.89 (0.42) 2.83 (0.67) 3.00
Ability to actively engage with healthcare providersb
3.82 (0.78) 3.93 (0.71) 3.7 (0.64) 3.43 (0.82) 3.33 (0.95) 3.21 (1.06) 4.00
Navigating the healthcare systemb 3.63 (0.75) 3.73 (0.69) 3.46 (0.73) 3.17 (0.79) 2.97 (0.81) 3.26 (1.02) 4.00
Ability to find good health informationb 3.56 (0.80) 3.67 (0.73) 3.44 (0.77) 3.33 (0.87) 2.65 (0.99) 3.14 (0.95) 3.20
Reading and understanding healthinformation enough to know what to dob
3.85 (0.78) 3.97 (0.67) 3.85 (0.72) 3.28 (1.00) 3.21 (0.89) 3.19 (1.12) 3.00
Hospital service use
Length of stay, days 4 (8) 5 (9) 4 (5) 3 (2) 5 (4) 5 (5) 1
Number of hospital admissions in thelast 12 months at this hospital
1 (1) 1 (1) 1 (0) 1 (0) 1 (1) 2 (1) 1
Number of non-urgent ED presentationsin the last 12 months at this hospital
1 (4) 1 (4) 0 (1) 0 (1) 1 (1) 1 (3) 0
aScale range 0–4, higher score indicates greater ability or more supportbScale range 0–5, higher score indicates greater ability or more support
Jessup et al. BMC Health Services Research (2017) 17:52 Page 5 of 12
Understanding health information enough to know whatto do (ES 0.93 versus 0.65), poorer Ability to find goodhealth information (ES 0.87 vs 0.73) and greater difficultyNavigating the health care system (ES 0.82 versus 0.70).Similar differences in mean scores on these scales werealso observed between participants born in a countrywhere English was or was not the first language. The scalethat appeared most sensitive to detecting differencesacross sociodemographic characteristics was Ability tofind good health information. We also found that thosewho rarely or never used the Internet reported finding itmore difficult to Understanding health informationenough to know what to do (ES 0.65) and poorer Ability tofind good health information (ES 0.65). They also found itmore difficult Navigating the health care system (ES 0.22)and Actively engaging with healthcare providers (ES 0.26).Of the three conventional indicators of socioeconomic
status (education, employment status and income),education showed the largest group differences for somevariables. The only consistent finding across all three in-dicators was that participants with lower socioeconomicstatus reported more difficulty (lower scores) in Abilityto find good health information (Education ES 0.38,Occupational Status 0.37 and Income 0.32). We foundno relationship between any of the HLQ scales andprivate health insurance status.
There did not appear to be an association betweengreater use of hospital services and lower scores acrossany of the health literacy scales (Table 5). Having threeor more hospital admissions at the index hospital in thepast 12 months was associated with higher scores forFeeling understood and supported by healthcare pro-viders and Social support for health, while a greaternumber of self-reported ED presentations in the last 12months to any hospital was associated with higher scoresfor Active engagement with healthcare and Navigatingthe healthcare system. No differences in health literacywere seen based upon length of hospital stay (<7 days vs≥7 days) or ED presentations (<2 versus ≥2 ED presenta-tions). As no strong differences were found in thesecomparisons, multiple regression with adjustment forsociodemographic variables, was not undertaken.
DiscussionWe identified a range of potentially modifiable health lit-eracy needs in hospitalised patients. Consistent with ourhypotheses, we found associations between increasedage, coming from CALD background, having lower edu-cation and lower socioeconomic status, little use of theInternet and lower scores on some health literacy scales.Age, employment status, receiving means-tested govern-ment benefits and being from a CALD background were

Table 3 Association between demographic and socioeconomic variables and hospital service use
Self-reported presentationto ED in last 12 months(any hospital)
Length ofstay ≥7 days
Two or more hospitaladmissions in last 12 monthsat this hospital
Two or more non-urgentED presentations in last12 months at this hospital
% % % %
Age
< 65 years (n = 173) 90 8a 18a 10
≥ 65 years (N = 211) 92 16a 33a 13
Home living arrangement
Lives with others (N = 307) 90 12 26 12
Lives alone (N = 70) 97 16 24 13
Employment status
Currently employed (N = 113) 91 7 17a 11
Currently not working (unemployed/retired/ill)(N = 269)
91 15 30a 12
Education
Completed secondary education orhigher (N = 133)
93 13 28 11
Did not complete secondaryeducation (N = 234)
91 13 24 17
Economic status
Household income < $30,000 (N =149) 93 15 31a 17a
Household income≥ $30,000 (N =135) 93 12 21a 4a
Receipt of means tested government benefits
No (N = 133) 93 16a 31a 13
Yes (N = 234) 90 8a 17a 8
Language in country of birth
English (Australia, New Zealand, Britain)(N = 219)
96a 11 26 12
Non-English (N = 138) 81a 15 27 13
Language spoken at home
English (N = 283) 96a 12 26 11
Another language (N = 90) 78a 14 26 13
Use of internet
At least once a month (N = 218) 93 10 25 12
Less than once a month or not at all (N = 139) 90 15 31 13
Private health insurance
No (N = 249) 96a 9 16a 8
Yes (N = 110) 89a 14 30a 13
Variables in bold are significantly different between demographic or socioeconomic groups for hospital use (chi square tests p < 0.05)a‘Small’ effect size (ES) > 0.10-0.0.30 calculated using phi co-efficient
Jessup et al. BMC Health Services Research (2017) 17:52 Page 6 of 12
associated with increased use of some hospital services.However the data did not support our hypothesis, orprevious studies [15–17, 26], that low health literacywould be associated with greater use of hospital services.On the contrary, we found that people with higherscores for two aspects of health literacy, Feeling under-stood and supported by healthcare providers and Socialsupport for health were likely to be more frequent usersof hospital services.
There is an extensive body of research that has dem-onstrated associations between being from a CALDbackground, lower health literacy, and health outcomes,including increased hospital utilisation [21, 27–31].Being from a CALD background not only presents chal-lenges for people in finding and understanding relevantand culturally appropriate health information and supportin their language, but also presents challenges arounddiffering health care delivery contexts. Our finding of an
Table
4Associatio
nbe
tweenmeanHLQ
scalescores
andde
mog
raph
icandsocioe
cono
miccharacteristicsby
effect
size
Health
care
provider
supp
orta
Having
sufficien
tinform
ationa
Actively
managing
health
a
Social
supp
ortfor
health
a
Activeappraisal
ofhe
alth
inform
ationa
Active
engage
men
twith
healthcare
b
Navigating
thehe
althcare
system
b
Abilityto
find
good
health
inform
ationb
Und
erstanding
health
inform
ationb
Mean(ES)c
Mean(ES)c
Mean(ES)c
Mean(ES)c
Mean(ES)c
Mean(ES)c
Mean(ES)c
Mean(ES)c
Mean(ES)c
Dem
ograph
icandsocioe
cono
miccharacteristics
Sex
Female(N
=187)
3.13
2.94
2.88
3.06
2.84
3.82
3.62
3.59
3.88
(0.58)
(0.51)
(0.53)
(0.55)
(0.53)
(0.74)
(0.75)
(0.77)
(0.76)
Male(N
=194)
3.12
2.99
2.98
3.16
2.80
3.82
3.65
3.53
3.82
(0.55)
(0.52)
(0.51)
(0.54)
(0.51)
(0.82)
(0.75)
(0.82)
(0.80)
Age
,years
<65
(N=166)
3.06
d2.91
d2.87
d3.01
d2.84
3.77
3.59
3.66
d3.93
d
(0.62)
(0.55)
(0.53)
(0.62)
(0.48)
(0.79)
(0.75)
(0.73)
(0.69)
≥65
(N=216)
3.18
d3.01
d2.98
d3.18
d2.80
3.86
3.67
3.48
d3.78
d
(0.51)
(0.48)
(0.51)
(0.46)
(0.55)
(0.77)
(0.75)
(0.84)
(0.84)
Livesalon
eYes(N=70)
3.17
2.97
2.99
2.99
d2.77
3.76
3.60
3.39
d3.71
d
(0.54)
(0.57)
(0.59)
(0.60)
(0.57)
(0.81)
(0.85)
(0.91)
(0.84)
No(N=306)
3.11
2.96
2.91
3.13
d2.82
3.83
3.63
3.59
d3.87
d
(0.57)
(0.50)
(0.50)
(0.53)
(0.50)
(0.77)
(0.73)
(0.77)
(0.76)
Employed
Yes(N=113)
3.09
2.98
2.93
3.13
2.90
d3.89
3.70
3.76
d4.00
d
(0.62)
(0.48)
(0.54)
(0.57)
(0.49)
(0.71)
(0.64)
(0.67)
(0.59)
No(N=268)
3.15
2.96
2.94
3.09
2.79
d3.80
3.61
3.47
d3.79
d
(0.53)
(0.53)
(0.51)
(0.54)
(0.53)
(0.81)
(0.79)
(0.84)
(0.84)
Com
pleted
second
ary
educationor
high
erYes(N=123)
3.22
d3.02
2.97
3.16
2.89
d3.97
d3.70
3.74
d4.08
d
(0.52)
(0.51)
(0.55)
(0.52)
(0.50)
(0.67)
(0.68)
(0.68)
(0.62)
No(N=245)
3.08
d2.93
2.90
3.07
2.77
d3.73
d3.58
3.45
d3.72
d
(0.58)
(0.52)
(0.51)
(0.56)
(0.51)
(0.83)
(0.78)
(0.83)
(0.83)
Hou
seho
ldincome<
$30,000
Yes(N=149)
3.10
2.92
2.94
3.06
2.82
3.73
d3.54
d3.40
d3.71
d
(0.62)
(0.58)
(0.54)
(0.62)
(0.56)
(0.90)
(0.86)
(0.95)
(0.89)
No(N=135)
3.16
2.97
2.88
3.14
2.79
3.92
d3.71
d3.66
d4.02
d
(0.49)
(0.48)
(0.51)
(0.48)
(0.47)
(0.62)
(0.61)
(0.65)
(0.60)
Receivingmeans
tested
governmen
tbe
nefits
Yes(N=233)
3.16
2.96
2.97
3.13
2.78
d3.81
3.62
3.46
d3.77
d
(0.49)
(0.51)
(0.49)
(0.50)
(0.53)
(0.77)
(0.77)
(0.84)
(0.82)
No(N
=133)
3.08
2.97
2.88
3.08
2.88
d3.84
3.64
3.72
d3.97
d
(0.63)
(0.52)
(0.53)
(0.59)
(0.47)
(0.77)
(0.72)
(0.68)
(0.66)
Englishspeaking
coun
tryof
birth
No(N=223)
3.19
d2.99
2.94
3.13
2.83
3.95
d3.76
d3.75
e4.05
e
Jessup et al. BMC Health Services Research (2017) 17:52 Page 7 of 12
Table
4Associatio
nbe
tweenmeanHLQ
scalescores
andde
mog
raph
icandsocioe
cono
miccharacteristicsby
effect
size
(Con
tinued)
(0.59)
(0.52)
(0.53)
(0.57)
(0.52)
(0.72)
(0.69)
(0.70)
(0.62)
Yes(N=143)
3.02
d2.93
2.91
3.08
2.82
3.62
d3.44
d3.30
e3.54
e
(0.53
(0.51)
(0.53)
(0.52)
(0.54)
(0.83)
(0.81)
(0.87)
(0.90)
Englishspoken
atho
me
No(N=92)
3.02
d2.98
2.99
3.08
2.85
3.62
d3.33
e3.18
e3.35
f
(0.47)
(0.47)
(0.48)
(0.51)
(0.50)
(0.83)
(0.82)
(0.87)
(0.93)
Yes(N=290)
3.15
d2.96
2.91
3.11
2.81
3.95
d3.73
e3.68
e4.01
f
(0.59)
(0.53)
(0.53)
(0.56)
(0.53)
(0.72)
(0.70)
(0.73)
(0.65)
Internet
use
Yes(N=219)
3.15
2.96
2.92
3.10
2.84
3.89
d3.69
d3.76
e4.03
e
(0.57)
(0.48)
(0.53)
(0.56)
(0.47)
(0.72)
(0.70)
(0.64)
(0.61)
Never/rarely
(N=142)
3.08
2.96
2.92
3.11
2.76
3.69
d3.53
d3.26
e3.55
e
(0.56)
(0.58)
(0.53)
(0.54)
(0.59)
(0.87)
(0.83)
(0.94)
(0.93)
Privatehe
alth
insurance
Yes(N=110)
3.14
3.03
2.95
3.15
2.87
3.88
3.69
3.63
3.90
(0.60)
(0.53)
(0.55)
(0.54)
(0.56)
(0.79)
(0.76)
(0.76)
(0.86)
No(N=249)
3.13
2.95
2.93
3.10
2.81
3.81
3.62
3.54
3.84
(0.55)
(0.51)
(0.51)
(0.55)
(0.49)
(0.77)
(0.75)
(0.81)
(0.74)
a Scale
rang
e0–
4,high
erscoreindicatesgreaterab
ility
ormoresupp
ort;
bScalerang
e0–
5,high
erscoreindicatesgreaterab
ility
ormoresupp
ort.Va
riables
inbo
ldaresign
ificant
atthe0.05
levelb
ytheMan
n–Whitney
Utest
forno
n-pa
rametric
data
andon
e-way
ANOVA
.cEffect
size
(ES)
calculated
usingCoh
en’sdforstan
dardised
differen
cein
means.Interpretationof
ES:“sm
all”ES
>0.20
-0.50SD
iden
tifiedby
d,“med
ium”ES
0.50
-0.80
SDiden
tifiedby
e ,an
d“large
”ES
>0.80
SDiden
tifiedby
f
Jessup et al. BMC Health Services Research (2017) 17:52 Page 8 of 12

Table
5Associatio
nbe
tweenhe
alth
literacyandho
spitalservice
use
nHealth
care
provider
supp
orta
Having
sufficien
tinform
ationa
Actively
managing
health
a
Social
supp
ort
forhe
alth
a
Activeappraisal
ofhe
alth
inform
ationa
Active
engage
men
twith
healthcare
b
Navigating
thehe
althcare
system
b
Abilityto
find
good
health
inform
ationb
Und
erstanding
health
inform
ationb
Mean(ES)c
Mean(ES)c
Mean(ES)c
Mean(ES)c
Mean(ES)c
Mean(ES)c
Mean(ES)c
Mean(ES)c
Mean(ES)c
Self-repo
rted
non-urge
ntED
attend
ance
last
12mon
ths(any
hospital)
Yes(N
=340)
3.14
d2.97
d2.94
d3.12
d2.82
3.84
d3.65
d3.56
3.85
d
(0.57)
(0.52)
(0.52)
(0.55)
(0.52)
(0.78)
(0.74)
(0.80)
(0.78)
No(N
=32)
2.97
d2.84
d2.80
d2.98
d2.80
3.56
d3.32
d3.45
3.70
d
(0.10)
(0.48)
(0.55)
(0.47)
(0.56)
(0.81)
(0.79)
(0.80)
(0.78)
Leng
thof
stay
<7days
Yes(N
=332)
3.13
2.98
d2.94
3.11
2.82
3.82
3.63
3.57
3.86
(0.56)
(0.51)
(0.52)
(0.54)
(0.51)
(0.79)
(0.77)
(0.80)
(0.78)
No(N
=48)
3.09
2.86
d2.88
3.07
2.80
3.79
3.63
3.48
3.72
(0.62)
(0.53)
(0.53)
(0.61)
(0.58)
(0.72)
(0.64)
(0.82)
(0.75)
≥3admission
sin
last
12mon
thsin
thisho
spital
Yes(N
=28)
3.38
d3.11
d3.09
d3.30
d2.85
3.88
3.64
3.46
3.88
(0.48)
(0.55)
(0.42)
(0.58)
(0.56)
(0.72)
(0.82)
(0.78)
(0.70)
No(N
=350)
3.11
d2.95
d2.92
d3.09
d2.82
3.81
3.63
3.56
3.84
(0.57)
(0.51)
(0.53)
(0.54)
(0.52)
(0.78)
(0.75)
(0.80)
(0.79)
≥2no
n-urge
ntED
presen
tatio
nsin
last
12mon
thsin
thisho
spital
Yes(N
=45)
3.10
3.02
3.02
d3.19
2.88
3.72
3.59
3.48
3.81
(0.64)
(0.61)
(0.59)
(0.65)
(0.60)
(0.90)
(0.89)
(0.98)
(0.89)
No(N
=334)
3.13
2.96
2.92
d3.10
2.81
3.83
3.63
3.56
3.85
(0.56)
(0.50)
(0.51)
(0.53)
(0.51)
(0.76)
(0.73)
(0.77)
(0.77)
a Scale
rang
e0–
4,high
erscoreindicatesgreaterab
ility
ormoresupp
ort;
bScalerang
e0–
5,high
erscoreindicatesgreaterab
ility
ormoresupp
ort.Va
riables
inbo
ldaresign
ificant
atthe0.05
levelb
ytheMan
n–Whitney
Utest
forno
n-pa
rametric
data
andon
e-way
ANOVA
.cEffect
size
(ES)
calculated
usingCoh
en’sdforstan
dardised
differen
cein
means.d‘Small’effect
size
(ES)>0.20
-0.50
Jessup et al. BMC Health Services Research (2017) 17:52 Page 9 of 12

Jessup et al. BMC Health Services Research (2017) 17:52 Page 10 of 12
association between being born in a country where Eng-lish was not the primary language and lower health liter-acy may correspond to differences in health care contexts(particularly pertinent for navigating the healthcare sys-tem), and differences in childhood opportunity, with theseindividuals likely to be migrants or descendants of mi-grants whose educational attainment and incomeopportunity may have been limited [32]. Our finding of anassociation between increased age, lower educational at-tainment and low socioeconomic status and lower healthliteracy is also in keeping with findings from previousstudies [30, 31, 33–35]. However, unlike the prevailingliterature [26–28], we did not find being from a CALDbackground was associated with increased use of hospitalservices – in fact we found that people from a CALDbackground were more likely to report less attendances atany ED over the last 12 month months.Our finding of an association between older age, lower
educational attainment and low socioeconomic statusand lower health literacy is also in keeping with findingsfrom previous studies [30, 31, 33, 35]. Our findings ex-tend previous work by providing information on therelative strengths of these associations using effect sizes.In contrast to previous studies [15–17], we did not ob-
serve an association between lower scores across any ofthe HLQ scales and higher use of hospital services. Sev-eral factors may explain these differences. We used amulti-dimensional self-report measure of health literacywhereas previous studies used functional health literacytests that directly assess health-related reading, compre-hension and numeracy. The correlation between thesedifferent measures has been found to be low. It is pos-sible that the participants in our study, who all have freeaccess to hospital services as part of the Australianhealthcare system, are in an environment of high diseaseburden and overall low health literacy. It may also bethat health literacy is irrelevant to individuals who re-quire timely acute hospital-based care. As health literacyis a multidimensional concept, it may also be that look-ing for associations between individual scales of healthliteracy and use of hospital services is less relevant thanconsidering an individual as a whole as strengths insome scales may offset limitations in other scales. Fur-ther investigation using different analytic techniquessuch as grouping individuals on the basis of specifichealth literacy levels may shed new light on theserelationships.Our study has several limitations. Our low response
rate may limit the generalisability of our results to thebroader hospitalised population, however we expect thedata to have reasonable internal validity. Importantly,age, gender, reason for admission and use of hospitalservices were similar between respondents and non-respondents, suggesting minimal response bias. Low
response rates for mailed surveys in low socioeconomicpopulations show that those who return surveys aremore likely to have higher socioeconomic indicators andhealth literacy [35–38]. This implies that our study mayhave underrepresented individuals with low and verylow health literacy. While our data are internally valid,underrepresentation of people with low and very lowhealth literacy may also have limited our ability to detecta relationship, if it exists, between health literacy andhospital services use. While availability of the HLQ inseveral languages likely improved the response rate frompeople with CALD backgrounds, with the exception ofChinese respondents, the response rate was still lowerfor these groups. Further, while care was taken in thetranslation of the HLQ to other languages, there is stillsome possibility that the intended meaning of items wasconceptualised differently in groups from different cul-tures resulting in potential response bias [39]. Future re-search should consider alternative methods (such asface-to-face) for collecting data from CALD populations.Our study also has some strengths. Use of the HLQ to
measure health literacy provides insight across a broadrange of domains of health literacy in addition to an in-dividual’s health-related reading, comprehension and nu-meracy skills, which has been the focus of many paststudies utilizing functional health literacy instruments[35]. We also used Cohen’s effect sizes to improve theunderstanding of the relative strength of associations.This information assists with making decisions aboutwhere health literacy interventions should be focused tohave the largest impact.This study has provided new insights into the com-
plexity of health literacy, including not only an individ-ual’s skills in terms of finding, understanding and usinghealth-related information but also their ability to navi-gate the health system and engage with health profes-sionals, and their social supports. The HLQ embracesthe full concept of health literacy by encompassingmeasurement of both a set of different individual skillsand the lived experience of a person interacting with theservices, systems and environment. These need to beconsidered together. For example, we found that in-creased age was associated with greater difficulty in find-ing health information, but older individuals were alsomore likely to report greater healthcare provider andsocial support than those under age 65 years. Thissuggests that social and health professional supports canoffset other health literacy difficulties, while lack of thesesupports might indicate a need to provide additionalassistance and resources.
ConclusionUsing a panel of nine fine-grained indicators of healthliteracy (the HLQ), this study did not find an association
Jessup et al. BMC Health Services Research (2017) 17:52 Page 11 of 12
between lower health literacy and greater use of hospitalhealth services. However we did find that increased age(≥65 years), having a CALD background and not speak-ing English at home were all associated with having themost health literacy challenges, particularly aroundengaging with and feeling supported by health care pro-viders, navigating the health system and finding andusing health information. Strategies are needed thataddress these health literacy needs and should be evalu-ated to determine if they improve the quality of care andimprove patient-relevant outcomes including reducingavoidable admissions. This type of approach may alsoreduce health inequalities.
AbbreviationsCALD: Culturally and linguistically diverse; ED: Emergency department;HLQ: Health Literacy Questionnaire
AcknowledgementsThe authors would like to thank the staff and patients of Northern Health fortheir support and participation in this study. Rebecca Jessup is funded by aNational Health and Medical Research Council (NHMRC) PhD Scholarship#1075250. Richard Osborne is funded in part by a NHMRC Senior ResearchFellowship #APP1059122. Alison Beauchamp is funded by an ARC LinkageIndustry Fellowship. RB is funded by an NHMRC Senior Principle ResearchFellowship #APP1082138.
FundingA Deakin University Higher Degree Research Grant assisted with the cost ofpostage of surveys for this study.
Availability of data and materialsThe datasets generated during and/or analysed during the current study areavailable from the corresponding author on reasonable request.
Authors’ contributionsThe overall study and its design were devised by RB, RHO, ABe. RJ performedthe data collection, statistical analysis and drafted the manuscript. All authorscontributed to the analysis strategy and interpretation of results and hadextensive input into the manuscript. All authors approved the final draft.
Competing interestsThe authors declare that they have no competing interests.
Consent for publicationNot applicable.
Ethics approval and consent to participateThis study was approved by the Northern Health (study no. P11/13,approved 20/05/2014) and Deakin University (study no. 2014–137, approved10/06/2014). Human Research and Ethics Committees. Informed writtenconsent was obtained from all participants. All data is de-identified so noconsent to publish is required, however participants were informed of theintention to publish in the information and consent form.
Author details1Deakin University, Health Systems Improvement Unit, Centre for PopulationHealth Research, School of Health and Social Development, Geelong, Victoria3220, Australia. 2Monash Department of Clinical Epidemiology, CabriniInstitute, Malvern, VIC 3144, Australia. 3Department of Epidemiology andPreventive Medicine, School of Public Health and Preventive Medicine,Monash University, Suite 41 Cabrini Medical Centre, 183 Wattletree Road,Malvern, VIC 3144, Australia.
Received: 14 September 2016 Accepted: 23 December 2016
References1. Walker AS, University of Canberra. National Centre for, and M. Economic.
Australia’s ageing population. Vol. no. 27. Canberra: National Centre forSocial and Economic Modelling, University of Canberra; 1998.
2. Healey J. Ageing. Vol. 277. Thirrou: Spinney Press; 2008.3. Australian Institute of Health and Welfare. Risk factors contributing
to chronic disease. Canberra: Australian Institute of Health andWelfare; 2012.
4. Gordon B. Solving the workforce shortage. Health Prog. 2003;84(2):59.5. Del Mar C. New investments in primary care in Australia. BMC Health Serv Res.
2011;11(1):39–9.6. Brooks PM, Robinson L, Ellis N. Options for expanding the health workforce,
Australian health review. publ Aust Hosp Assoc. 2008;32(1):156.7. Buchan J, Naccarella L, Brooks P. Is health workforce sustainability in
Australia and New Zealand a realistic policy goal? Australian health review.Publ Aust Hosp Assoc. 2011;35(2):152.
8. Australia’s Health Workforce Productivity Commission Research Report.Canberra. 2005.
9. Hill S. The knowledgeable patient: communication and participation inhealth. West Sussex: Wiley-Blackwell; 2011.
10. National Health Strategy. Health participation: achieving greater publicparticipation and accountability in the Australian health care system.Melbourne. 1993. ISBN 0642191867.
11. National Health Performance Authority. Healthy Communities: Selectedpotentially avoidable hospitalisations in 2011–12. Sydney: Commonwealthof Australia; 2013.
12. World Health Organization. Health Promotion Glossary. Health Promot Int.1998;13(4):349–64.
13. Williams MV, Baker DW, Parker RM, Nurss JR. Relationship of functionalhealth literacy to patients’ knowledge of their chronic disease: a study ofpatients with hypertension and diabetes. Arch Intern Med.1998;158(2):166–72.
14. Scott TL, Gazmararian JA, Williams MV, Baker DW. Health literacy andpreventive health care use among Medicare enrollees in a managed careorganization. Med Care. 2002;40(5):395–404.
15. Baker DW, Gazmararian JA, Williams MV, Scott T, Parker RM, Green D,Ren J, Peel J. Functional health literacy and the risk of hospitaladmission among Medicare managed care enrollees. Am J PublicHealth. 2002;92(8):1278–83.
16. Baker DW, Parker RM, Williams MV, Clark WS. Health literacy and the risk ofhospital admission. J Gen Intern Med. 1998;13(12):791–8.
17. Mitchell SE, Sadikova E, Jack BW, Paasche-Orlow MK. Health literacy and30-day postdischarge hospital utilization. J Health Commun.2012;17(sup3):325–38.
18. Jordan J, Osborne RH, Buchbinder R. Critical appraisal of health literacyindices reveals variable underlying constructs, narrow content andpsychometric weaknesses. J Clin Epidemiol. 2010;64(4):366–79.
19. Jordan JE, Buchbinder R, Osborne RH. Conceptualising health literacy fromthe patient perspective. Patient Educ Couns. 2010;79(1):36–42.
20. Osborne RH, Batterham R, Elsworth G, Hawkins M, Buchbinder R.The grounded psychometric development and initial validationof the Health Literacy Questionnaire (HLQ). BMC Public Health.2013;13(1):658.
21. Beauchamp A, Buchbinder R, Dodson S, Batterham RW, Elsworth GR,McPhee C, Sparkes L, M. Hawkins M, Osborne RH. Distribution of healthliteracy strengths and weaknesses across socio-demographic groups:a cross-sectional survey using the Health Literacy Questionnaire (HLQ).BMC Public Health. 2015;15(678):1–13.
22. State Government of Victoria. Index of Relative SocioeconomicDisadvantage. 2015 [cited 2015 February 23].
23. IBM Corp., IBM SPSS Statistics for Windows, Version 22.0. Armonk, NY,Released 2013.
24. Cohen J. Statistical power analysis for the behavioral sciences (2nd Edition).Hillsdale: Lawrence Erlbaum Associates; 1988.
25. StataCorp, Stata Statistical Software: Release 14. College Station, TX, 201526. Cimasi RJ, Sharamitaro AP, Seiler RL. The association between health literacy
and preventable hospitalizations in Missouri: implications in an era of reform.J Health Care Finance. 2013;WINTER:1–16.
27. Wolf MS, Knight SJ, Lyons EA, Durazo-Arvizu R, Pickard SA, Arseven A, et al.Literacy, race, and PSA level among low-income men newly diagnosed withprostate cancer. Urology. 2006;68(1):89–93.

Jessup et al. BMC Health Services Research (2017) 17:52 Page 12 of 12
28. Bailey SC, Pandit AU, Yin S, Federman A, Davis TC, Parker RM, Wolf MS.Predictors of misunderstanding pediatric liquid medication instructions.Fam Med. 2009;41(10):715–21.
29. Howard DH, Sentell T, Gazmararian JA. Impact of health literacy onsocioeconomic and racial differences in health in an elderly population.J Gen Intern Med. 2006;21(8):857–61.
30. Sentell TL, Halpin HA. Importance of adult literacy in understanding healthdisparities. J Gen Intern Med. 2006;21(8):862–6.
31. Paasche-Orlow MK, Parker RM, Gazmarian JA, Nielsen-Bohlman LT, Rudd RR.The prevalence of limited health literacy. J Gen Intern Med.2005;20(2):175–84.
32. Braveman PA, Cubbin C, Dgerter S, Chideya S, Marchi KS, Metzler M, Posner S.Socioeconomic status in health research: one size does not fit all. JAMA.2005;294(22):2879–88.
33. Gazmararian JA, Baker DW, Williams MV, Parker RM, Scott TL, Green DC,Fehrenbach SN, Ren J, Koplan JP, Fehrenbach SN, Ren J, Koplan J. Healthliteracy among Medicare enrollees in a managed care organization. JAMA.1999;281(6):545–51.
34. Baker DW, Wolf MS, Feinglass J, Thompson JA, Gazmararian JA, Huang J.Health literacy and mortality among elderly persons. Arch Intern Med.2007;167(14):1503–9.
35. Barber MN, Staples M, Osborne RH, Clerehan R, Elder C, Buchbinder R.Up to a quarter of the Australian population may have suboptimal healthliteracy depending upon the measurement tool: results from a population-based survey. Health Promot Int. 2009;24(3):252–61.
36. Fredrickson D, Jones T, Molgaard C, Carman C, Schukman J, Dismuke S,Ablah E. Optimal design features for surveying low-income populations.J Health Care Poor Underserved. 2005;16(4):677–90.
37. Gibson PJ, Koepsell TD, Diehr P, Hale C. Increasing response rates for mailedsurveys of Medicaid clients and other low-income populations. Am J Epidemiol.1999;149(11):1057–62.
38. Beebe TJ, Davern ME, McAlpine DD, Call KT, Rockwood TH. Increasingresponse rates in a survey of Medicaid enrollees: the effect of a prepaidmonetary incentive and mixed modes (mail and telephone). Med Care.2005;43(4):411–4.
39. Warnecke RB, Johnson TP, Chavez N, Sudman S, O’rourke DP, Lacey L,Horm J. Improving question wording in surveys of culturally diverse populations.Ann Epidemiol. 1997;7(5):334–42.
• We accept pre-submission inquiries
• Our selector tool helps you to find the most relevant journal
• We provide round the clock customer support
• Convenient online submission
• Thorough peer review
• Inclusion in PubMed and all major indexing services
• Maximum visibility for your research
Submit your manuscript atwww.biomedcentral.com/submit
Submit your next manuscript to BioMed Central and we will help you at every step: