HEALTH LABOUR MARKET TRENDS IN OECD COUNTRIES · HEALTH LABOUR MARKET TRENDS IN OECD COUNTRIES ......
14
HEALTH LABOUR MARKET TRENDS IN OECD COUNTRIES Michael Schoenstein, OECD Health Division 3 rd Global Health Workforce Alliance Forum Recife, 11 November 2013
-
Upload
nguyendiep -
Category
Documents
-
view
214 -
download
0
Transcript of HEALTH LABOUR MARKET TRENDS IN OECD COUNTRIES · HEALTH LABOUR MARKET TRENDS IN OECD COUNTRIES ......
HEALTH LABOUR MARKET TRENDS IN OECD COUNTRIES Michael Schoenstein, OECD Health Division 3rd Global Health Workforce Alliance Forum Recife, 11 November 2013

• The crisis had a rapid impact on health workers and policy priorities.
• Human resource allocation is the most salient topic in OECD countries.
• A labour productivity agenda will need to address skills mismatch.
2
Main health labour market issues
in OECD countries since 2008

Crisis-related adjustment in the
health sector has fallen on wages…
3
-4.0%
-2.0%
0.0%
2.0%
4.0%
6.0%
8.0%
10.0%
2005 2006 2007 2008 2009 2010 2011
HungaryNurses
GPs
Specialists
Average wage
-2.0%
-1.0%
0.0%
1.0%
2.0%
3.0%
4.0%
5.0%
6.0%
7.0%
8.0%
2005 2006 2007 2008 2009 2010 2011
DenmarkNurses
Doctors (GPs and specialists)Average wage
-2.0%
-1.0%
0.0%
1.0%
2.0%
3.0%
4.0%
5.0%
6.0%
2005 2006 2007 2008 2009 2010 2011
FranceNurses
GPs
Specialists
Average wage
-2.0%
0.0%
2.0%
4.0%
6.0%
8.0%
10.0%
12.0%
2005 2006 2007 2008 2009 2010 2011
BelgiumNurses
GPs
Specialists
Average wage

Employment held up well: more doctors
and nurses than before the crisis
4 Source: OECD Health Data 2013
90
100
110
120
130
140
150
2000 2001 2002 2003 2004 2005 2006 2007 2008 2009 2010 2011
USA
Doctors
Nurses
90
100
110
120
130
140
150
2000 2001 2002 2003 2004 2005 2006 2007 2008 2009 2010 2011 2012
Italy
Doctors
Nurses
90
100
110
120
130
140
150
2000 2001 2002 2003 2004 2005 2006 2007 2008 2009 2010 2011 2012
France
Doctors
Nurses
90
100
110
120
130
140
150
2002 2003 2004 2005 2006 2007 2008 2009 2010
Japan
Doctors
Nurses
5
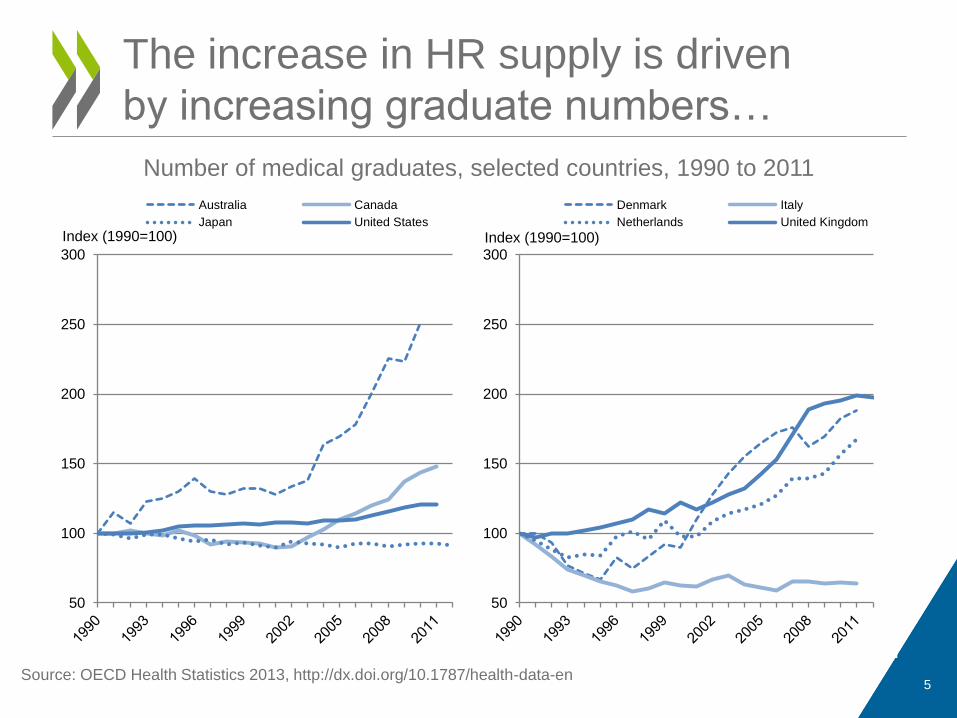
The increase in HR supply is driven
by increasing graduate numbers…
50
100
150
200
250
300
Australia Canada
Japan United States
Index (1990=100)
50
100
150
200
250
300
Denmark Italy
Netherlands United Kingdom
Index (1990=100)
Number of medical graduates, selected countries, 1990 to 2011
Source: OECD Health Statistics 2013, http://dx.doi.org/10.1787/health-data-en
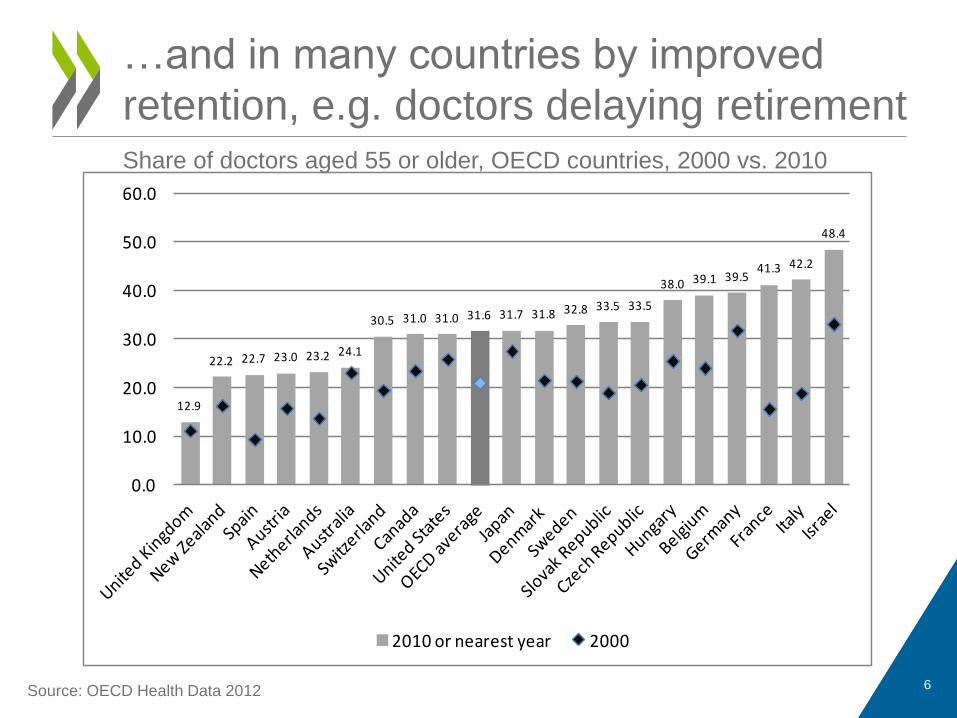
…and in many countries by improved
retention, e.g. doctors delaying retirement
12.9
22.2 22.7 23.0 23.2 24.1
30.5 31.0 31.0 31.6 31.7 31.8 32.8 33.5 33.5
38.0 39.1 39.541.3 42.2
48.4
0.0
10.0
20.0
30.0
40.0
50.0
60.0
2010 or nearest year 2000
6 Source: OECD Health Data 2012
Share of doctors aged 55 or older, OECD countries, 2000 vs. 2010

Policy priorities have changed to issues
about allocation of human resources
0
5
10
15
20
25
30
No particular issue
Maintaining the current level of
physician
suppply
Meeting increasing
demand
Maintaining the current share of
GPs
Identified shortage in some
specialties
Mal-distribution of physician
supply
7
Source: OECD Health System Characteristics Survey 2012-13
“No particular issue”: Netherlands

8
All OECD countries consider geographic
maldistribution of MDs a key challenge
Source: OECD Regions at a
Glance (forthcoming)
Australia
Austria
Belgium
Canada
Czech Republic
Denmark
Estonia
Finland
France
Germany
Greece
Hungary
Iceland
Ireland
Israel
Italy
Japan
Korea
Luxembourg
Mexico
Netherlands
New Zealand
Norway
Poland
Portugal
Slovak Republic
Slovenia
Spain
Sweden
Switzerland
Turkey
United Kingdom
United States
Vienna
Brussels
Prague
Lisboa
Bratislava
0
1
2
3
4
5
6
7
8
9
10
11
12
13
14
15
16
17
18
19
20
21
22
23
24
25
26
27
28
29
30
31
32
0 2 4 6 8 10
Physicians density (per 1 000 population)
Doctors per 1 000 inhabitants, TL2 regions, 2011
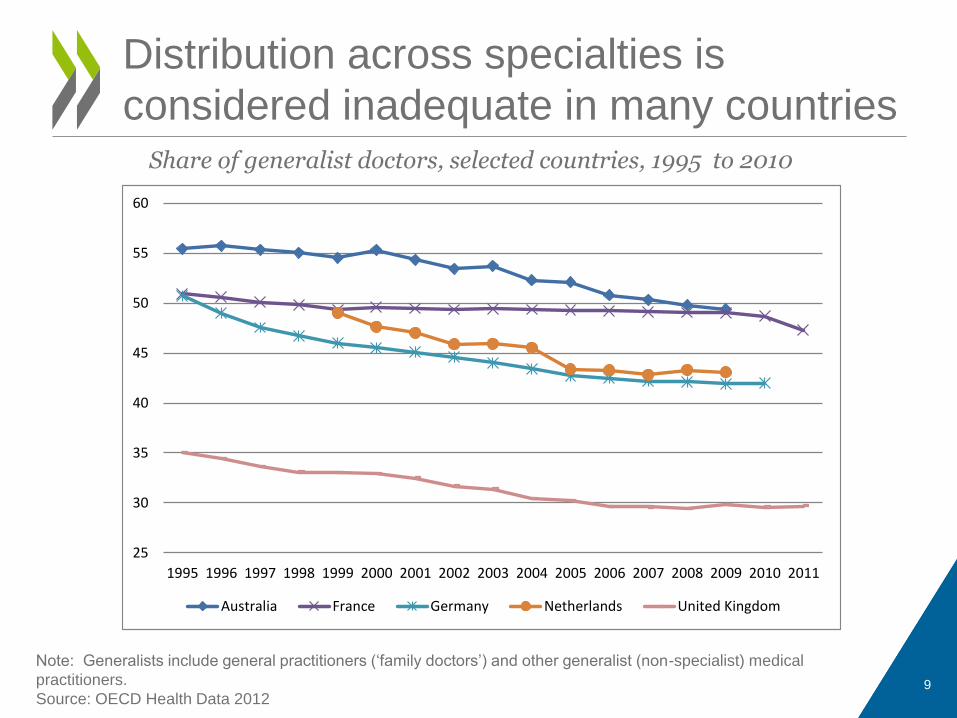
Distribution across specialties is
considered inadequate in many countries
9
Note: Generalists include general practitioners (‘family doctors’) and other generalist (non-specialist) medical
practitioners.
Source: OECD Health Data 2012
Share of generalist doctors, selected countries, 1995 to 2010
25
30
35
40
45
50
55
60
1995 1996 1997 1998 1999 2000 2001 2002 2003 2004 2005 2006 2007 2008 2009 2010 2011
Australia France Germany Netherlands United Kingdom

Changing team composition is a fast-
moving target for many OECD countries
0
5000
10000
15000
20000
0
5000
10000
15000
20000
2000 2005 2010
NP
PA
MD
Sources: OECD Health Data 2013, US National Commission on Certification of Physician Assistants “Certified Physician Assistant
Population Trends (PA-Cs)”, American Association of Colleges of Nursing 2000-2010 Annual Surveys 10
Increase in NP/PA, relative to MD, USA, 2000 to 2010
11
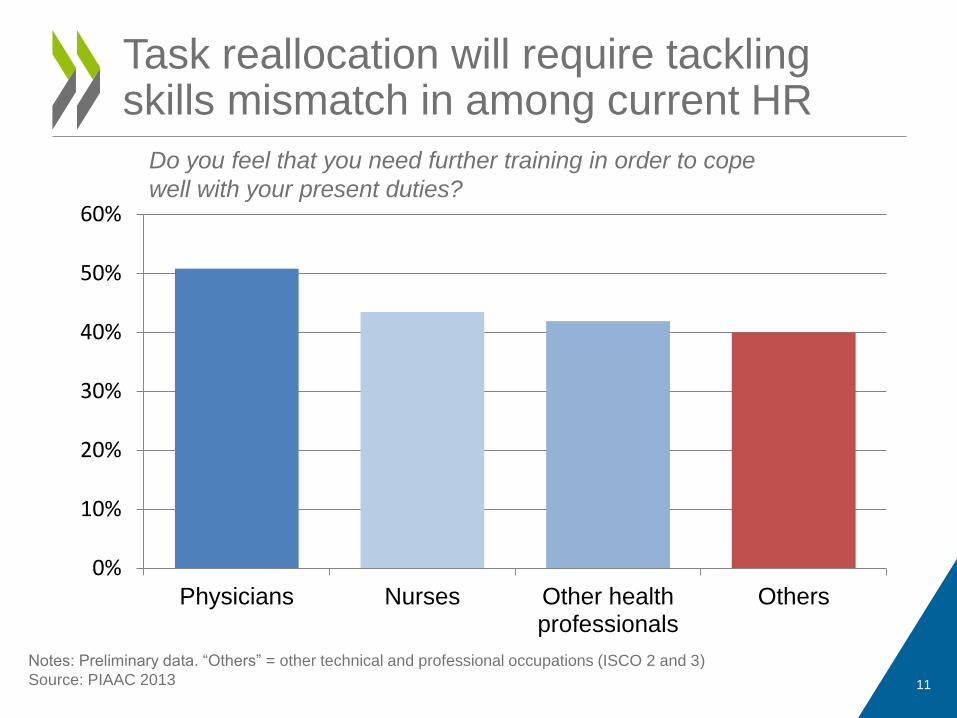
Task reallocation will require tackling skills mismatch in among current HR
0%
10%
20%
30%
40%
50%
60%
Physicians Nurses Other healthprofessionals
Others
Do you feel that you need further training in order to cope
well with your present duties?
Notes: Preliminary data. “Others” = other technical and professional occupations (ISCO 2 and 3)
Source: PIAAC 2013

• The crisis had an immediate impact on health workers and policy priorities.
• Human resource allocation is the most salient topic in OECD countries.
• A labour productivity agenda will need to address skills mismatch.
12
Main health labour market issues
in OECD countries since 2008

www.oecd.org/health:
• Health at a Glance 2013 – 21 November
• Health workforce planning in OECD countries – WP 62
• The crisis impact on health markets, WP 6x – forthcoming in December
• Geographic imbalances in physician supply and policy responses, WP 6x – forthcoming in December
13
More information

HEALTH LABOUR MARKET TRENDS IN OECD COUNTRIES Michael Schoenstein, OECD Health Division 3rd Global Health Workforce Alliance Forum Recife, 11 November 2013