HEALTH INSURANCE MARKETPLACES 2016 OPEN ENROLLMENT … · 6 These data are consistent with the CMS...
48
Department of Health and Human Services Office of the Assistant Secretary for Planning and Evaluation http://aspe.hhs.gov ASPE ISSUE BRIEF HEALTH INSURANCE MARKETPLACES 2016 OPEN ENROLLMENT PERIOD: FINAL ENROLLMENT REPORT For the period: November 1, 2015 – February 1, 2016 1 March 11, 2016 During the third open enrollment period, the Health Insurance Marketplaces (“the Marketplaces”) continued to play an important role in fulfilling one of the Affordable Care Act’s central goals: reducing the number of uninsured Americans by providing affordable, high-quality health insurance. This report provides data summarizing enrollment-related activity in the individual market Marketplaces during the 2016 Open Enrollment Period (2016 OEP) for all 50 states and the District of Columbia (based on data for the period 11-1-15 to 2-1-16). The report indicates that about 12.7 million individuals selected or were automatically reenrolled in Marketplace plans during the 2016 OEP (see Table 1). This does not include data relating to individuals who have been enrolled in a Basic Health Plan. 2 The report also includes detailed state-level data on the characteristics of these individuals — including separate breakouts on new consumers and those who are reenrolling in coverage (including consumers who actively reenrolled, and consumers who were automatically reenrolled into Marketplace coverage). 3,4,5,6 The report includes data on 1 For purposes of this Enrollment Report, an effort was made to align the reporting periods for the HealthCare.gov states and SBMs using their own Marketplace platforms with the reporting periods for the data that were included in the Week 13 CMS Marketplace Enrollment Snapshot (which can be accessed at https://www.cms.gov/Newsroom/MediaReleaseDatabase/Fact- sheets/2016-Fact-sheets-items/2016-02-04.html). Most of the data in this report are for the 11-1-15 to 2-1-16 reporting period with the following exception: the data for 9 SBMs that are using their own Marketplace platforms (California, District of Columbia, Idaho, Kentucky, Maryland, New York, Rhode Island, Vermont, and Washington) are for the 11-1-15 to 1-31-16 reporting period. 2 Minnesota and New York have begun enrolling individuals in a Basic Health Plan. These individuals are not included in reports of total Marketplace plan selections for these states. 3 The data in this report reflect the total number of plan selections cumulatively from the beginning of Open Enrollment to the end of the reporting period, net of any cancellations from a consumer or cancellations from an insurer during that time. Because of further automation in communication with issuers, the number of net plan selections reported this year account for issuer- initiated plan cancellations that occur before the end of Open Enrollment for reasons such as non-payment of premiums. This change will result in a larger number of cancellations being accounted for during Open Enrollment than last year. Last year, these cancellations were reflected only in reports on effectuated enrollment (the number of people who have paid monthly premiums to the insurer) after the end of Open Enrollment. 4 This report does not include data on effectuated enrollment. The Centers for Medicare & Medicaid Services (CMS) will be publishing data on effectuated enrollment for the 2016 coverage year separately. The most recent CMS quarterly snapshot on effectuated enrollment in the Marketplaces is available at https://www.cms.gov/Newsroom/MediaReleaseDatabase/Fact- sheets/2016-Fact-sheets-items/2016-03-11.html.
Transcript of HEALTH INSURANCE MARKETPLACES 2016 OPEN ENROLLMENT … · 6 These data are consistent with the CMS...
Department of Health and Human Services Office of the Assistant Secretary for Planning and Evaluation
http://aspe.hhs.gov
ASPE ISSUE BRIEF
HEALTH INSURANCE MARKETPLACES 2016 OPEN ENROLLMENT PERIOD:
FINAL ENROLLMENT REPORT
For the period: November 1, 2015 – February 1, 2016 1
March 11, 2016
During the third open enrollment period, the Health Insurance Marketplaces (“the
Marketplaces”) continued to play an important role in fulfilling one of the Affordable Care Act’s
central goals: reducing the number of uninsured Americans by providing affordable, high-quality
health insurance.
This report provides data summarizing enrollment-related activity in the individual market
Marketplaces during the 2016 Open Enrollment Period (2016 OEP) for all 50 states and the
District of Columbia (based on data for the period 11-1-15 to 2-1-16). The report indicates that
about 12.7 million individuals selected or were automatically reenrolled in Marketplace plans
during the 2016 OEP (see Table 1). This does not include data relating to individuals who have
been enrolled in a Basic Health Plan.2 The report also includes detailed state-level data on the
characteristics of these individuals — including separate breakouts on new consumers and those
who are reenrolling in coverage (including consumers who actively reenrolled, and consumers
who were automatically reenrolled into Marketplace coverage). 3,4,5,6
The report includes data on
1 For purposes of this Enrollment Report, an effort was made to align the reporting periods for the HealthCare.gov states and
SBMs using their own Marketplace platforms with the reporting periods for the data that were included in the Week 13 CMS
Marketplace Enrollment Snapshot (which can be accessed at https://www.cms.gov/Newsroom/MediaReleaseDatabase/Fact-
sheets/2016-Fact-sheets-items/2016-02-04.html). Most of the data in this report are for the 11-1-15 to 2-1-16 reporting period
with the following exception: the data for 9 SBMs that are using their own Marketplace platforms (California, District of
Columbia, Idaho, Kentucky, Maryland, New York, Rhode Island, Vermont, and Washington) are for the 11-1-15 to 1-31-16
reporting period. 2 Minnesota and New York have begun enrolling individuals in a Basic Health Plan. These individuals are not included in reports
of total Marketplace plan selections for these states. 3 The data in this report reflect the total number of plan selections cumulatively from the beginning of Open Enrollment to the
end of the reporting period, net of any cancellations from a consumer or cancellations from an insurer during that time. Because
of further automation in communication with issuers, the number of net plan selections reported this year account for issuer-
initiated plan cancellations that occur before the end of Open Enrollment for reasons such as non-payment of premiums. This
change will result in a larger number of cancellations being accounted for during Open Enrollment than last year. Last year, these
cancellations were reflected only in reports on effectuated enrollment (the number of people who have paid monthly premiums to
the insurer) after the end of Open Enrollment. 4 This report does not include data on effectuated enrollment. The Centers for Medicare & Medicaid Services (CMS) will be
publishing data on effectuated enrollment for the 2016 coverage year separately. The most recent CMS quarterly snapshot on
effectuated enrollment in the Marketplaces is available at https://www.cms.gov/Newsroom/MediaReleaseDatabase/Fact-
sheets/2016-Fact-sheets-items/2016-03-11.html.
https://www.cms.gov/Newsroom/MediaReleaseDatabase/Fact-sheets/2016-Fact-sheets-items/2016-02-04.html
https://www.cms.gov/Newsroom/MediaReleaseDatabase/Fact-sheets/2016-Fact-sheets-items/2016-02-04.html
ASPE Issue Brief Page 2
ASPE Office of Health Policy March 2016
completed applications, eligibility determinations, website visitors, and call center activity; and
data on the overall distribution of plan selections through the Marketplaces by gender, age, metal
level, and financial assistance status (i.e., whether the consumer has been determined eligible for
advance premium tax credits (APTC) and/or cost-sharing reductions). These data are available
for the 38 states that are using the HealthCare.gov eligibility and enrollment platform
(HealthCare.gov states) as well as for the 13 State-Based Marketplaces (SBMs) that are using
their own Marketplace enrollment platforms for the 2016 coverage year.7
Additionally, for the 38 states that are using the HealthCare.gov eligibility and enrollment
platform, the report includes: data on the distribution of plan selections by self-reported
race/ethnicity, rural location, and household income; data on the number of reenrollees who
actively reenrolled and/or changed plans, including average premium savings; and statistics that
measure the impact of the advance premium tax credit and plan switching on net premium costs
for these states.
5 The 38 HealthCare.gov states include 37 states that used the HealthCare.gov eligibility and enrollment platform in 2015 and
Hawaii, which is new to the HealthCare.gov eligibility and enrollment platform in 2016. For more information about data on
plan selections through the Marketplaces for the 2015 coverage year, please see the Health Insurance Marketplaces 2015 Open
Enrollment Period March Enrollment Report, which is available at https://aspe.hhs.gov/pdf-report/health-insurance-marketplace-
2015-open-enrollment-period-march-enrollment-report. 6 These data are consistent with the CMS Week 13 Health Insurance Marketplace Open Enrollment Snapshot, available at
https://www.cms.gov/Newsroom/MediaReleaseDatabase/Fact-sheets/2016-Fact-sheets-items/2016-02-04.html. 7 For the SBMs that are using their own Marketplace platforms, data availability for certain metrics varies by State. See the
Addendum for a summary of the metrics that are available for each state. The Addendum of this report also includes some Basic
Health Program enrollment data for New York. Under the Affordable Care Act, states have the option of using the Basic Health
Program to provide affordable health coverage for low-income residents who would generally otherwise be eligible to purchase
coverage through the Health Insurance Marketplace.
ASPE Issue Brief Page 3
ASPE Office of Health Policy March 2016
Key Highlights
For all the Marketplaces:
• About 12.7 million individuals selected, or were automatically reenrolled into, a
2016 Marketplace plan (including 4.9 million new consumers and 7.8 million that
reenrolled) as of 2-1-16.8
• More than 3.5 million individuals who selected, or were automatically reenrolled in,
a 2016 Marketplace plan are ages 18 - 34 (28 percent of total plan selections).
• Almost 10.5 million individuals who selected, or were automatically reenrolled in a
2016 Marketplace plan qualify for the advance premium tax credit (tax credit or
APTC) to make coverage more affordable.
For the 38 states using the HealthCare.gov eligibility and enrollment platform:
• More than 8 in 10 individuals (more than 8.1 million, or 85 percent) who selected or
were automatically enrolled in a 2016 Marketplace plan qualify for an advance
premium tax credit9 with an average value of $290 per person per month.
10
• The average advance premium tax credit covers about 73 percent of the gross
premium for individuals who qualify for an average advance premium tax credit.
• The average net premium after advance premium tax credit is $106 per month11
among individuals with 2016 plan selections through the Marketplaces in the
HealthCare.gov states who qualify for an advance premium tax credit.
• Nearly 7 in 10 of the consumers who selected, or were automatically enrolled into, a
plan in the HealthCare.gov states had the option of selecting a 2016 Marketplace plan
with a net premium of $75 or less per month after the advance premium tax credit.
• HealthCare.gov users are actively shopping and saving money. More than 3.9 million
people (or 70 percent) who reenrolled actively selected a plan. Of those actively
reenrolling, 61 percent switched to a different plan than they had in 2015.
• More consumers switched issuers than metal level. Specifically, 64 percent of the 2.4
million switchers changed issuers during the 2016 OEP (with or without changing
their metal level), while only 31 percent of switchers changed metal level (with or
without changing their issuer).
8 This figure includes all individuals associated with these Marketplace plan selections, including subscribers and dependents. 9 This represents the number of Marketplace plan selections by individuals eligible to receive an APTC. For purposes of this
analysis, an individual qualifying for an advance premium tax credit was defined as any individual with an APTC amount >$0. 10 Averages in this brief refer to plan-selection-weighted averages across individuals with plan selections with advance premium
tax credits in the 37 states using the HealthCare.gov eligibility and enrollment platform (prior to the addition of Hawaii in 2016).
For more information, see the ASPE Issue Brief “Health Insurance Marketplace 2015: Average Premiums After Advance
Premium Tax Credits Through January 30 in 37 States Using the HealthCare.gov Platform,” which is available at
http://www.aspe.hhs.gov/health/reports/2015/MarketPlaceEnrollment/APTC/ib_APTC.pdf. 11 This represents the difference between the $396 average monthly premium before advance premium tax credit and the $290
average monthly advance premium tax credit.
ASPE Issue Brief Page 4
ASPE Office of Health Policy March 2016
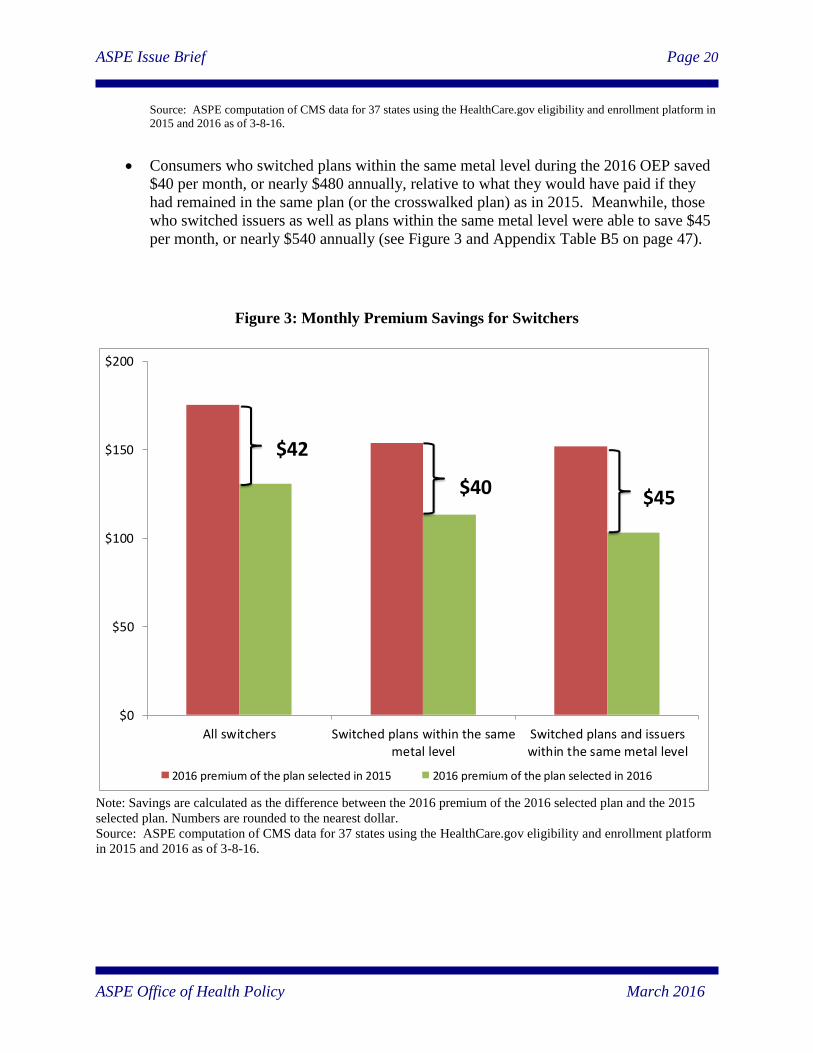
• Consumers who switched plans within the same metal level during the 2016 OEP
saved $40 per month, or nearly $480 annually, relative to what they would have paid
if they had remained in the same plan (or the crosswalked plan) as in 2015. Those
who switched issuers as well as plans within the same metal level were able to save
$45 per month, or nearly $540 annually.
ASPE Issue Brief Page 5
ASPE Office of Health Policy March 2016
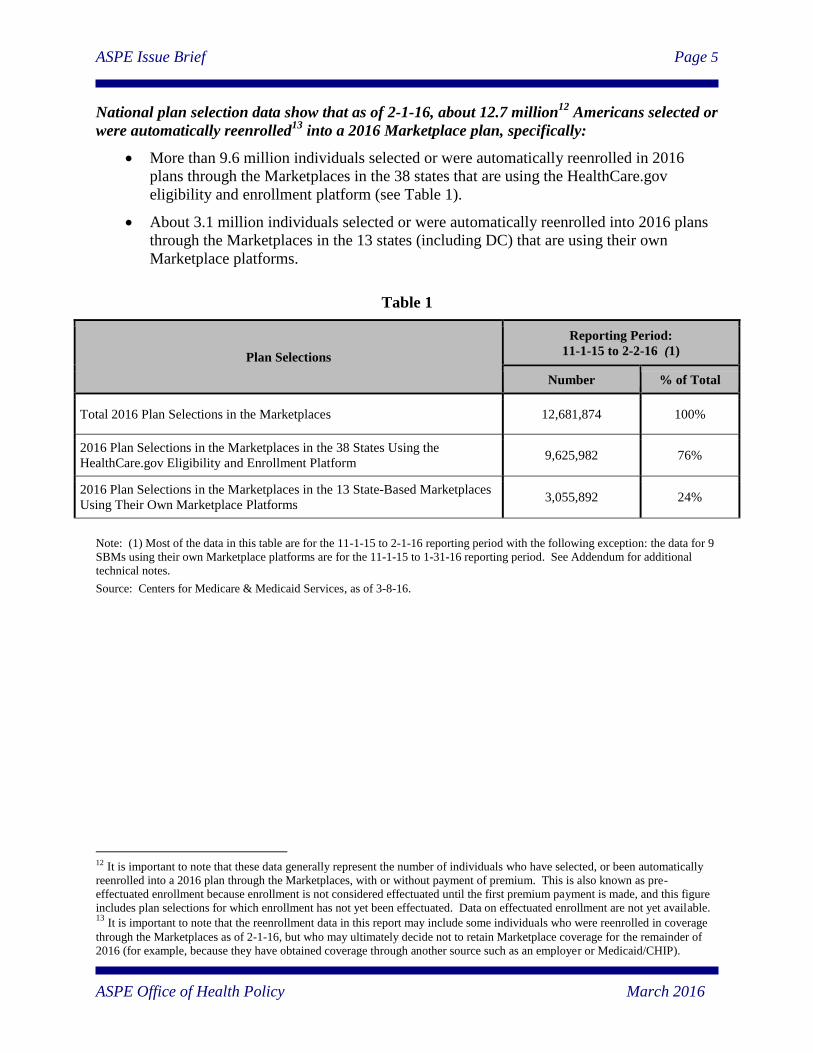
National plan selection data show that as of 2-1-16, about 12.7 million12
Americans selected or
were automatically reenrolled13
into a 2016 Marketplace plan, specifically:
More than 9.6 million individuals selected or were automatically reenrolled in 2016
plans through the Marketplaces in the 38 states that are using the HealthCare.gov
eligibility and enrollment platform (see Table 1).
About 3.1 million individuals selected or were automatically reenrolled into 2016 plans
through the Marketplaces in the 13 states (including DC) that are using their own
Marketplace platforms.
Table 1
Plan Selections
Reporting Period:
11-1-15 to 2-2-16 (1)
Number % of Total
Total 2016 Plan Selections in the Marketplaces 12,681,874 100%
2016 Plan Selections in the Marketplaces in the 38 States Using the
HealthCare.gov Eligibility and Enrollment Platform 9,625,982 76%
2016 Plan Selections in the Marketplaces in the 13 State-Based Marketplaces
Using Their Own Marketplace Platforms 3,055,892 24%
Note: (1) Most of the data in this table are for the 11-1-15 to 2-1-16 reporting period with the following exception: the data for 9
SBMs using their own Marketplace platforms are for the 11-1-15 to 1-31-16 reporting period. See Addendum for additional
technical notes. Source: Centers for Medicare & Medicaid Services, as of 3-8-16.
12 It is important to note that these data generally represent the number of individuals who have selected, or been automatically
reenrolled into a 2016 plan through the Marketplaces, with or without payment of premium. This is also known as pre-
effectuated enrollment because enrollment is not considered effectuated until the first premium payment is made, and this figure
includes plan selections for which enrollment has not yet been effectuated. Data on effectuated enrollment are not yet available. 13
It is important to note that the reenrollment data in this report may include some individuals who were reenrolled in coverage
through the Marketplaces as of 2-1-16, but who may ultimately decide not to retain Marketplace coverage for the remainder of
2016 (for example, because they have obtained coverage through another source such as an employer or Medicaid/CHIP).
ASPE Issue Brief Page 6
ASPE Office of Health Policy March 2016
The Number of Marketplace Plan Selections in the HealthCare.gov States Has Been Higher,
and Consumers Have Selected or Been Automatically Reenrolled into Marketplace Plans
Earlier During the 2016 OEP Than in the 2015 OEP
The total number of consumers who selected or were automatically reenrolled into a
Marketplace plan in the HealthCare.gov states during the 2016 OEP is 9 percent higher
relative to the 2015 OEP (9.6 million vs. 8.8 million).14
o The number of Marketplace plan selections in the HealthCare.gov states was
generally higher during each week of the 2016 OEP, versus comparable weeks
during the 2015 OEP (see Figure 1).15
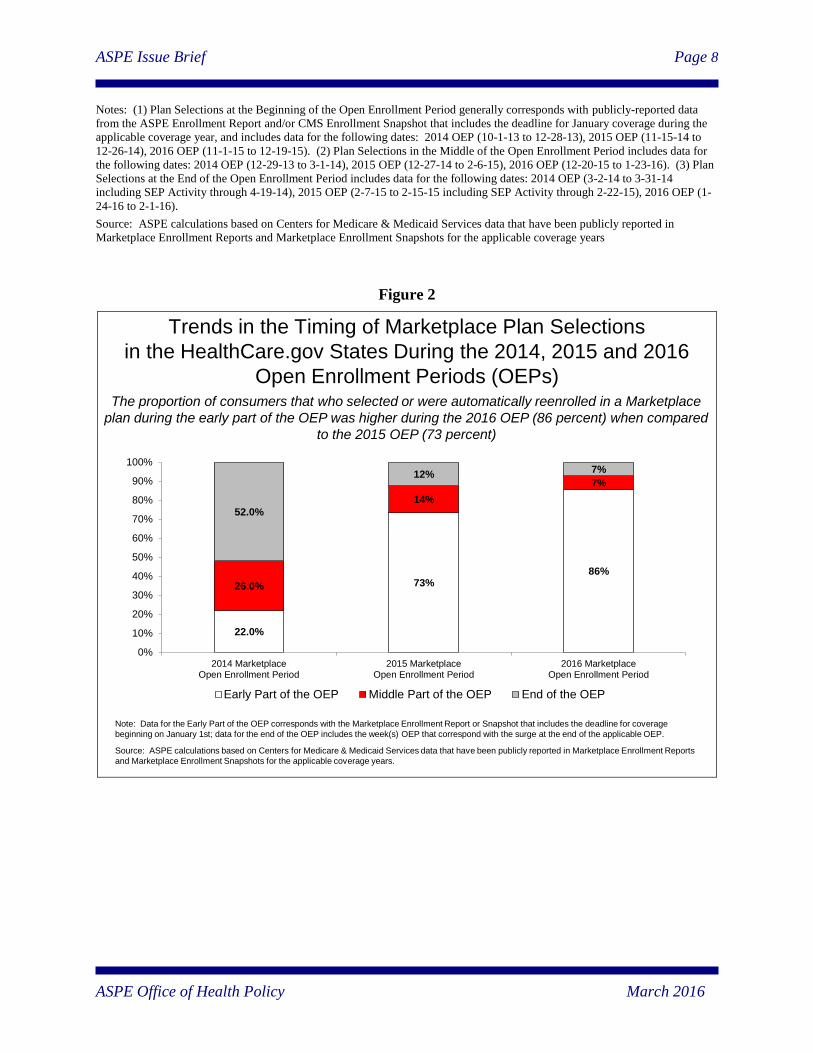
The proportion of consumers selecting or being automatically reenrolled into
Marketplace plans during the early weeks of the OEP has continued to increase, and the
proportion selecting a plan during the last few weeks of the OEP continued to decrease
(see Table 2).
o The proportion of consumers who selected or were automatically reenrolled in a
Marketplace plan during the early part of the OEP was higher during the 2016
OEP (86 percent) when compared to the 2015 OEP (73 percent)16
(see Figure
2).
14 It is important to note that because of further automation in communication with issuers, the number of net plan selections
reported for the 2016 OEP account for issuer-initiated plan cancellations that occur before the end of Open Enrollment for
reasons such as non-payment of premiums. This change will result in a larger number of issuer-initiated cancellations being
accounted for during the 2016 OEP than during the 2015 OEP. Last year, these cancellations were reflected only in reports on
effectuated enrollment (the number of people who have paid monthly premiums to the insurer) after the end of Open Enrollment. 15 This comparison is based on the weekly data that were reported in the 2015 and 2016 CMS Health Insurance Marketplace
Open Enrollment Snapshots. 16 For each coverage year, this analysis is based on publicly-reported data from the ASPE Marketplace Enrollment Report and/or
CMS Enrollment Snapshot that included the deadline for January coverage during the applicable coverage year, and includes data
for the following reporting periods: 2014 OEP (10-1-13 to 12-28-13), 2015 OEP (11-15-14 to 12-26-14), 2016 OEP (11-1-15 to
12-19-15).

ASPE Issue Brief Page 7
ASPE Office of Health Policy March 2016
Figure 1
Trends in the Cumulative Number of Individuals Who Selected a
Marketplace Plan in States Using the HealthCare.gov Platform,
2015 and 2016 Open Enrollment Periods (OEPs)
Notes: Represents cumulative sums of weekly data on the number of unique individuals who have been determined eligible to enroll in a plan through the states using
the HealthCare.gov platform, and have actively selected a plan (with or without the first premium payment having been received by the issuer), based on data
published in the Weekly Enrollment Snapshots. Number of states using the HealthCare.gov platform: 37 states during the 2015 coverage year, and 38 states during
the 2016 coverage year.
Source: Centers for Medicare & Medicaid Services, 2015 and 2016 Health Insurance Marketplace Weekly Enrollment Snapshots
During the 2016 OEP, the number of Marketplace plan selections in the HealthCare.gov states has been higher,
and consumers selected plans earlier when compared with the 2015 OEP
Impact of Batch Automatic
Reenrollments
12-17-15 Deadline for
January coverage
12-15-14 Deadline for
January coverage
Surge at end of
OEP (including
in-line SEP)
Table 2
Comparison of the Timing of
Marketplace Plan Selections in the
States Using the HealthCare.gov
Eligibility and Enrollment Platform
During the 2014 , 2015 and 2016
Open Enrollment Periods
2014 Open
Enrollment Period
(36 States)
2015 Open
Enrollment Period
(37 States)
2016 Open
Enrollment Period
(38 States)
Number
% of
Total Number
% of
Total Number
% of
Total
Plan Selections at the Beginning of
the Open Enrollment Period (1) 1,196,430 22% 6,490,492 73% 8,250,276 86%
Plan Selections in the Middle of the
Open Enrollment Period (2) 1,424,656 26% 1,258,883 14% 688,998 7%
Plan Selections At the End of the
Open Enrollment Period (3) 2,825,092 52% 1,088,916 12% 686,708 7%
Total Plan Selections in the
HealthCare.gov States During the
Open Enrollment Period 5,446,178 100% 8,838,291 100% 9,625,982 100%
ASPE Issue Brief Page 8
ASPE Office of Health Policy March 2016
Notes: (1) Plan Selections at the Beginning of the Open Enrollment Period generally corresponds with publicly-reported data
from the ASPE Enrollment Report and/or CMS Enrollment Snapshot that includes the deadline for January coverage during the
applicable coverage year, and includes data for the following dates: 2014 OEP (10-1-13 to 12-28-13), 2015 OEP (11-15-14 to
12-26-14), 2016 OEP (11-1-15 to 12-19-15). (2) Plan Selections in the Middle of the Open Enrollment Period includes data for
the following dates: 2014 OEP (12-29-13 to 3-1-14), 2015 OEP (12-27-14 to 2-6-15), 2016 OEP (12-20-15 to 1-23-16). (3) Plan
Selections at the End of the Open Enrollment Period includes data for the following dates: 2014 OEP (3-2-14 to 3-31-14
including SEP Activity through 4-19-14), 2015 OEP (2-7-15 to 2-15-15 including SEP Activity through 2-22-15), 2016 OEP (1-
24-16 to 2-1-16). Source: ASPE calculations based on Centers for Medicare & Medicaid Services data that have been publicly reported in
Marketplace Enrollment Reports and Marketplace Enrollment Snapshots for the applicable coverage years
Figure 2
22.0%
73%86%
26.0%
14%
7%
52.0%
12%7%
0%
10%
20%
30%
40%
50%
60%
70%
80%
90%
100%
2014 MarketplaceOpen Enrollment Period
2015 MarketplaceOpen Enrollment Period
2016 MarketplaceOpen Enrollment Period
Early Part of the OEP Middle Part of the OEP End of the OEP
Trends in the Timing of Marketplace Plan Selections
in the HealthCare.gov States During the 2014, 2015 and 2016
Open Enrollment Periods (OEPs)The proportion of consumers that who selected or were automatically reenrolled in a Marketplace
plan during the early part of the OEP was higher during the 2016 OEP (86 percent) when compared
to the 2015 OEP (73 percent)
Note: Data for the Early Part of the OEP corresponds with the Marketplace Enrollment Report or Snapshot that includes the deadline for coverage
beginning on January 1st; data for the end of the OEP includes the week(s) OEP that correspond with the surge at the end of the applicable OEP.
Source: ASPE calculations based on Centers for Medicare & Medicaid Services data that have been publicly reported in Marketplace Enrollment Reports
and Marketplace Enrollment Snapshots for the applicable coverage years.
ASPE Issue Brief Page 9
ASPE Office of Health Policy March 2016
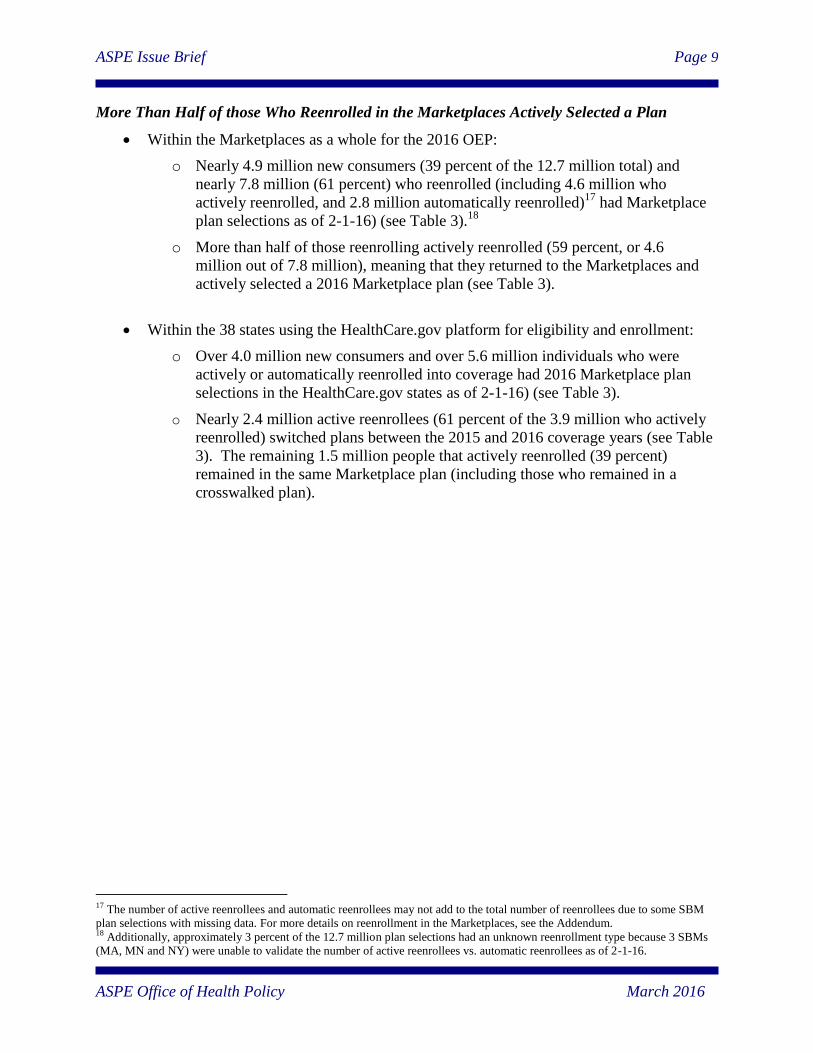
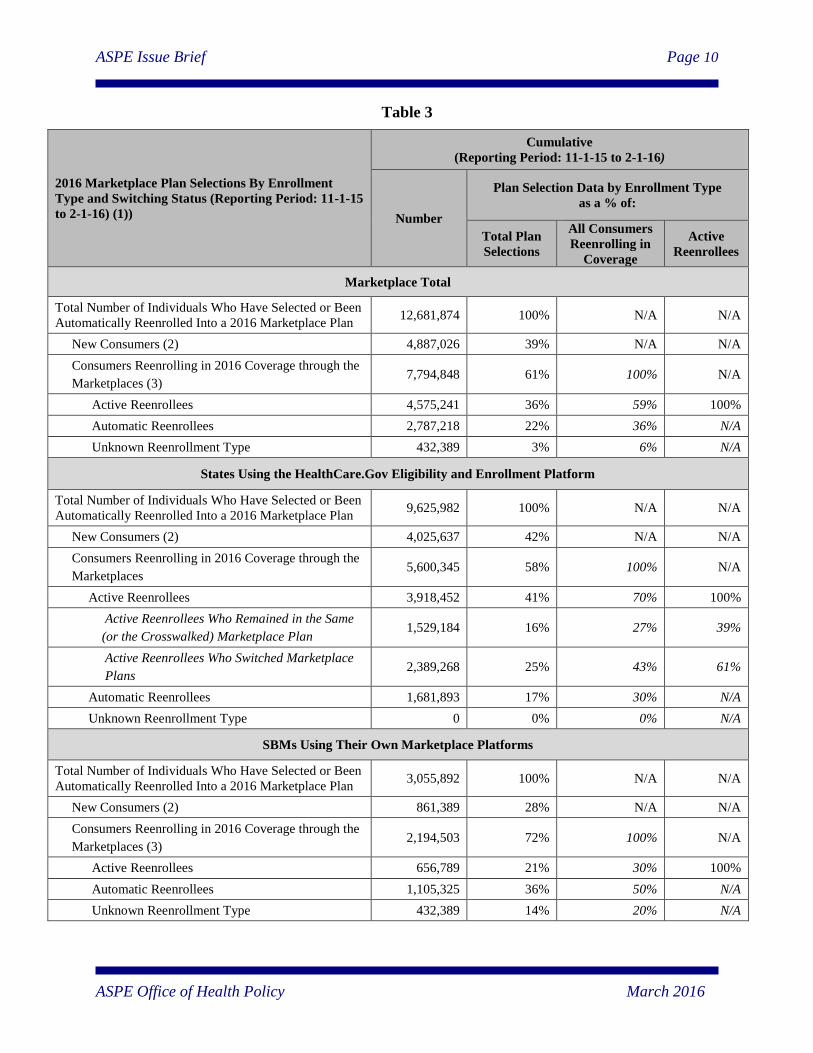
More Than Half of those Who Reenrolled in the Marketplaces Actively Selected a Plan
Within the Marketplaces as a whole for the 2016 OEP:
o Nearly 4.9 million new consumers (39 percent of the 12.7 million total) and
nearly 7.8 million (61 percent) who reenrolled (including 4.6 million who
actively reenrolled, and 2.8 million automatically reenrolled)17
had Marketplace
plan selections as of 2-1-16) (see Table 3).18
o More than half of those reenrolling actively reenrolled (59 percent, or 4.6
million out of 7.8 million), meaning that they returned to the Marketplaces and
actively selected a 2016 Marketplace plan (see Table 3).
Within the 38 states using the HealthCare.gov platform for eligibility and enrollment:
o Over 4.0 million new consumers and over 5.6 million individuals who were
actively or automatically reenrolled into coverage had 2016 Marketplace plan
selections in the HealthCare.gov states as of 2-1-16) (see Table 3).
o Nearly 2.4 million active reenrollees (61 percent of the 3.9 million who actively
reenrolled) switched plans between the 2015 and 2016 coverage years (see Table
3). The remaining 1.5 million people that actively reenrolled (39 percent)
remained in the same Marketplace plan (including those who remained in a
crosswalked plan).
17 The number of active reenrollees and automatic reenrollees may not add to the total number of reenrollees due to some SBM
plan selections with missing data. For more details on reenrollment in the Marketplaces, see the Addendum. 18 Additionally, approximately 3 percent of the 12.7 million plan selections had an unknown reenrollment type because 3 SBMs
(MA, MN and NY) were unable to validate the number of active reenrollees vs. automatic reenrollees as of 2-1-16.
ASPE Issue Brief Page 10
ASPE Office of Health Policy March 2016
Table 3
2016 Marketplace Plan Selections By Enrollment
Type and Switching Status (Reporting Period: 11-1-15
to 2-1-16) (1))
Cumulative
(Reporting Period: 11-1-15 to 2-1-16)
Number
Plan Selection Data by Enrollment Type
as a % of:
Total Plan
Selections
All Consumers
Reenrolling in
Coverage
Active
Reenrollees
Marketplace Total
Total Number of Individuals Who Have Selected or Been
Automatically Reenrolled Into a 2016 Marketplace Plan 12,681,874 100% N/A N/A
New Consumers (2) 4,887,026 39% N/A N/A
Consumers Reenrolling in 2016 Coverage through the
Marketplaces (3) 7,794,848 61% 100% N/A
Active Reenrollees 4,575,241 36% 59% 100%
Automatic Reenrollees 2,787,218 22% 36% N/A
Unknown Reenrollment Type 432,389 3% 6% N/A
States Using the HealthCare.Gov Eligibility and Enrollment Platform
Total Number of Individuals Who Have Selected or Been
Automatically Reenrolled Into a 2016 Marketplace Plan 9,625,982 100% N/A N/A
New Consumers (2) 4,025,637 42% N/A N/A
Consumers Reenrolling in 2016 Coverage through the
Marketplaces 5,600,345 58% 100% N/A
Active Reenrollees 3,918,452 41% 70% 100%
Active Reenrollees Who Remained in the Same
(or the Crosswalked) Marketplace Plan 1,529,184 16% 27% 39%
Active Reenrollees Who Switched Marketplace
Plans 2,389,268 25% 43% 61%
Automatic Reenrollees 1,681,893 17% 30% N/A
Unknown Reenrollment Type 0 0% 0% N/A
SBMs Using Their Own Marketplace Platforms
Total Number of Individuals Who Have Selected or Been
Automatically Reenrolled Into a 2016 Marketplace Plan 3,055,892 100% N/A N/A
New Consumers (2) 861,389 28% N/A N/A
Consumers Reenrolling in 2016 Coverage through the
Marketplaces (3) 2,194,503 72% 100% N/A
Active Reenrollees 656,789 21% 30% 100%
Automatic Reenrollees 1,105,325 36% 50% N/A
Unknown Reenrollment Type 432,389 14% 20% N/A
ASPE Issue Brief Page 11
ASPE Office of Health Policy March 2016
Note: (1) Most of the data in this table are for the 11-1-15 to 2-1-16 reporting period with the following exception: the data for 9
SBMs using their own Marketplace platforms are for the 11-1-15 to 1-31-16 reporting period. See Addendum for additional
technical notes. (2) The number of New Consumers includes most of the 2016 plan selections for HI, which began using the
HealthCare.gov platform for the 2016 coverage year. (3) For SBMs using their own Marketplace platforms, the number of active
reenrollees and automatic reenrollees does not add to the total number of reenrollees due to some SBM plan selections with
missing data. (4) Three SBMs (MA, MN and NY) were unable to validate the number of active reenrollees vs. automatic
reenrollees as of 2-1-16.
Source: Centers for Medicare & Medicaid Services, as of 3-8-16.
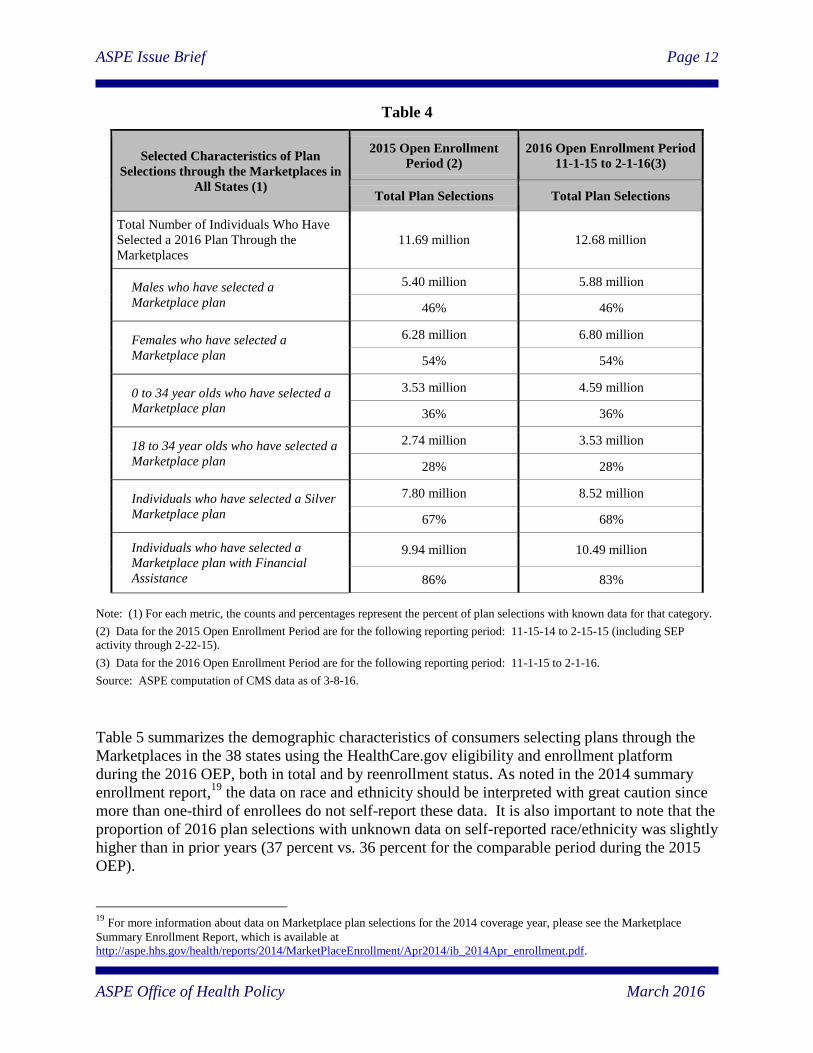
Demographic Characteristics of Individuals Selecting Marketplace Plans
Table 4 summarizes the demographic characteristics of individuals selecting plans through the
Marketplaces as a whole during the 2016 OEP. (Note that the totals and percentages reported in
Table 4 reflect only those plan selections for which data are available on the relevant
characteristic. The share of plan selections with unknown data has decreased between the 2015
OEP and the 2016 OEP, so care should be taken when comparing data for the 2015 and 2016
Open Enrollment periods).
• Approximately 36 percent of the individuals who selected, or were automatically
reenrolled in, a 2016 Marketplace plan are younger than 35 (4.6 million out of 12.7
million).
• Approximately 28 percent of the individuals who selected, or were automatically
reenrolled in, a 2016 Marketplace plan are ages 18 to 34 (3.5 million out of 12.7
million).
ASPE Issue Brief Page 12
ASPE Office of Health Policy March 2016
Table 4
Selected Characteristics of Plan
Selections through the Marketplaces in
All States (1)
2015 Open Enrollment
Period (2)
2016 Open Enrollment Period
11-1-15 to 2-1-16(3)
Total Plan Selections Total Plan Selections
Total Number of Individuals Who Have
Selected a 2016 Plan Through the
Marketplaces
11.69 million 12.68 million
Males who have selected a
Marketplace plan
5.40 million 5.88 million
46% 46%
Females who have selected a
Marketplace plan
6.28 million 6.80 million
54% 54%
0 to 34 year olds who have selected a
Marketplace plan
3.53 million 4.59 million
36% 36%
18 to 34 year olds who have selected a
Marketplace plan
2.74 million 3.53 million
28% 28%
Individuals who have selected a Silver
Marketplace plan
7.80 million 8.52 million
67% 68%
Individuals who have selected a
Marketplace plan with Financial
Assistance
9.94 million 10.49 million
86% 83%
Note: (1) For each metric, the counts and percentages represent the percent of plan selections with known data for that category.
(2) Data for the 2015 Open Enrollment Period are for the following reporting period: 11-15-14 to 2-15-15 (including SEP
activity through 2-22-15).
(3) Data for the 2016 Open Enrollment Period are for the following reporting period: 11-1-15 to 2-1-16.
Source: ASPE computation of CMS data as of 3-8-16.
Table 5 summarizes the demographic characteristics of consumers selecting plans through the
Marketplaces in the 38 states using the HealthCare.gov eligibility and enrollment platform
during the 2016 OEP, both in total and by reenrollment status. As noted in the 2014 summary
enrollment report,19
the data on race and ethnicity should be interpreted with great caution since
more than one-third of enrollees do not self-report these data. It is also important to note that the
proportion of 2016 plan selections with unknown data on self-reported race/ethnicity was slightly
higher than in prior years (37 percent vs. 36 percent for the comparable period during the 2015
OEP).
19
For more information about data on Marketplace plan selections for the 2014 coverage year, please see the Marketplace
Summary Enrollment Report, which is available at
http://aspe.hhs.gov/health/reports/2014/MarketPlaceEnrollment/Apr2014/ib_2014Apr_enrollment.pdf.

ASPE Issue Brief Page 13
ASPE Office of Health Policy March 2016
Table 5
Selected Characteristics of Plan
Selections through the Marketplaces
in States Using the HealthCare.gov
Eligibility and Enrollment Platform
(1)
2015 Open
Enrollment
Period (2)
2016 Open Enrollment Period
11-1-15 to 2-1-16 (3)
Total
Plan
Selections
Total
Plan
Selections
By Reenrollment Status
New
Consumers
(%)
Active
Reenrollees
(%)
Automatic
Reenrollees
(%)
Total Number of Individuals Who Have
Selected a 2016 Plan Through the
Marketplaces in the HealthCare.gov
States
8.84 million 9.63 million 4.03 million 3.92 million 1.68 million
Males who have selected a
Marketplace plan
4.04 million 4.41 million 1.90 million 1.73 million 0.79 million
46% 46% 47% 44% 47%
Females who have selected a
Marketplace plan
4.80 million 5.21 million 2.13 million 2.19 million 0.90 million
54% 54% 53% 56% 53%
0 to 34 year olds who have selected a
Marketplace plan
3.20 million 3.56 million 1.72 million 1.22 million 0.62 million
36% 37% 43% 31% 37%
18 to 34 year olds who have selected
a Marketplace plan
2.48 million 2.68 million 1.33 million 0.87 million 0.47 million
28% 28% 33% 22% 28%
Individuals who have selected a Silver
Marketplace plan
6.09 million 6.82 million 2.77 million 2.89 million 1.16 million
69% 71% 69% 74% 69%
Individuals who have selected a
Marketplace plan with Financial
Assistance
7.69 million 8.18 million 3.36 million 3.52 million 1.30 million
87% 85% 84% 90% 77%
African-Americans who have selected
a Marketplace plan (4)
0.79 million 0.71 million 0.34 million 0.24 million 0.13 million
14% 12% 16% 8% 12%
Latinos who have selected a
Marketplace plan (4)
0.61 million 0.92 million 0.37 million 0.40 million 0.14 million
11% 15% 17% 14% 14%
Whites who have selected a
Marketplace plan (4)
3.65 million 3.81 million 1.27 million 1.88 million 0.67 million
62% 63% 57% 66% 65%
Individuals in ZIP Codes designated
as rural who have selected a
Marketplace plan
1.54 million 1.71 million 0.66 million 0.71 million 0.33 million
17% 18% 17% 18% 20%
Note: (1) For each metric, the percentages represent the percent of plan selections with known data for that category.
ASPE Issue Brief Page 14
ASPE Office of Health Policy March 2016
(2) Data for the 2015 Open Enrollment Period are for the following reporting period: 11-15-14 to 2-15-15 (including SEP
activity through 2-22-15). During the 2015 Marketplace coverage year, there were a total of 37 states using the HealthCare.gov
platform, including 35 states that are states that used the HealthCare.gov platform in both 2014 and 2015, and two states which
are new to the HealthCare.gov platform in 2015 (Oregon and Nevada).
(3) Data for the 2016 Open Enrollment Period are for the following reporting period: 11-1-15 to 2-1-16. During the 2016
Marketplace coverage year, there were a total of 38 states using the HealthCare.gov platform, including 37 states that are states
that used the HealthCare.gov platform in both 2014 and 2015, and one state which is new to the HealthCare.gov platform in 2016
(Hawaii).
(4) The percentages by race/ethnicity are based on the total number of plan selections with known self-reported data on
race/ethnicity. CMS has updated the methodology for identifying Latinos applying for 2016 coverage by incorporating the
selection of “Other” ethnicity as Latino. Specifically, all consumers who selected “Other ethnicity” on their application are now
counted as Latino. Latino ethnicity is indicated when Mexican, Mexican American, Chicano/a, Puerto Rican, Cuban, and/or
Other is selected. This has led to an increase in the number of reported Latinos compared to previous years. Please see the
Addendum for additional information.
Source: ASPE computation of CMS data for 38 states using the HealthCare.gov Eligibility and Enrollment platform as of 3-8-16.
ASPE Issue Brief Page 15
ASPE Office of Health Policy March 2016
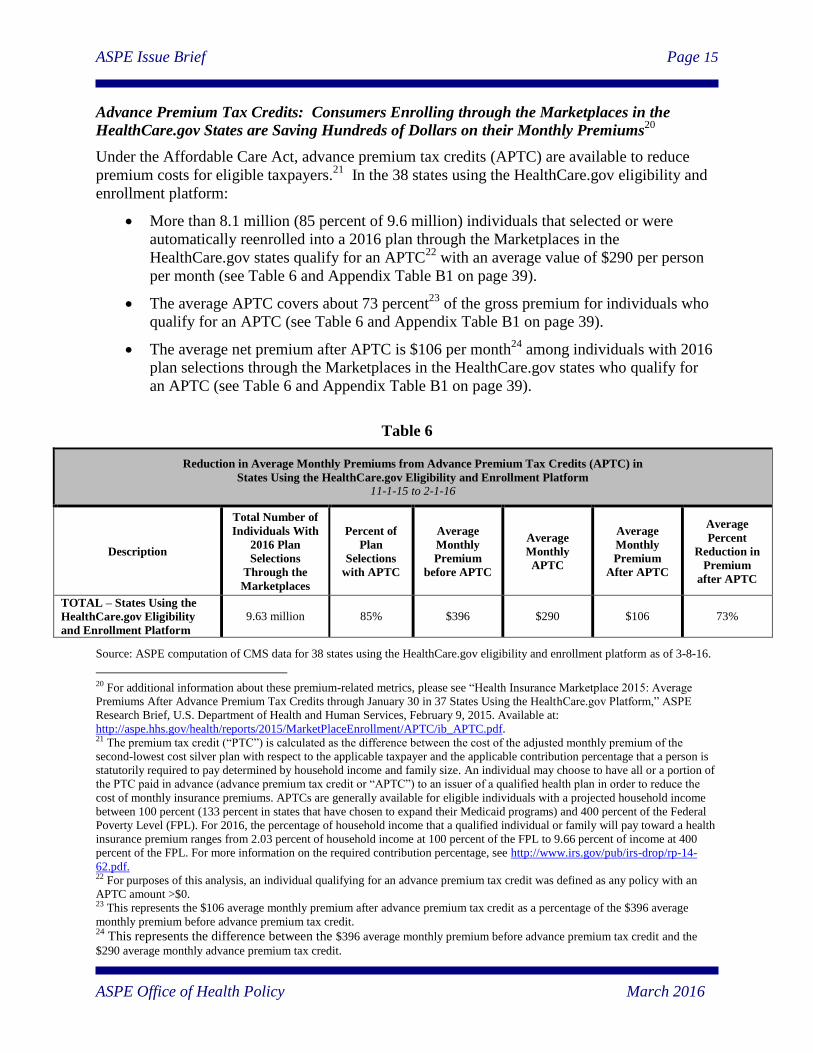
Advance Premium Tax Credits: Consumers Enrolling through the Marketplaces in the
HealthCare.gov States are Saving Hundreds of Dollars on their Monthly Premiums20
Under the Affordable Care Act, advance premium tax credits (APTC) are available to reduce
premium costs for eligible taxpayers.21
In the 38 states using the HealthCare.gov eligibility and
enrollment platform:
More than 8.1 million (85 percent of 9.6 million) individuals that selected or were
automatically reenrolled into a 2016 plan through the Marketplaces in the
HealthCare.gov states qualify for an APTC22
with an average value of $290 per person
per month (see Table 6 and Appendix Table B1 on page 39).
The average APTC covers about 73 percent23
of the gross premium for individuals who
qualify for an APTC (see Table 6 and Appendix Table B1 on page 39).
The average net premium after APTC is $106 per month24
among individuals with 2016
plan selections through the Marketplaces in the HealthCare.gov states who qualify for
an APTC (see Table 6 and Appendix Table B1 on page 39).
Table 6
Reduction in Average Monthly Premiums from Advance Premium Tax Credits (APTC) in
States Using the HealthCare.gov Eligibility and Enrollment Platform 11-1-15 to 2-1-16
Description
Total Number of
Individuals With
2016 Plan
Selections
Through the
Marketplaces
Percent of
Plan
Selections
with APTC
Average
Monthly
Premium
before APTC
Average
Monthly
APTC
Average
Monthly
Premium
After APTC
Average
Percent
Reduction in
Premium
after APTC
TOTAL – States Using the
HealthCare.gov Eligibility
and Enrollment Platform
9.63 million 85% $396 $290 $106 73%
Source: ASPE computation of CMS data for 38 states using the HealthCare.gov eligibility and enrollment platform as of 3-8-16.
20 For additional information about these premium-related metrics, please see “Health Insurance Marketplace 2015: Average
Premiums After Advance Premium Tax Credits through January 30 in 37 States Using the HealthCare.gov Platform,” ASPE
Research Brief, U.S. Department of Health and Human Services, February 9, 2015. Available at:
http://aspe.hhs.gov/health/reports/2015/MarketPlaceEnrollment/APTC/ib_APTC.pdf. 21 The premium tax credit (“PTC”) is calculated as the difference between the cost of the adjusted monthly premium of the
second-lowest cost silver plan with respect to the applicable taxpayer and the applicable contribution percentage that a person is
statutorily required to pay determined by household income and family size. An individual may choose to have all or a portion of
the PTC paid in advance (advance premium tax credit or “APTC”) to an issuer of a qualified health plan in order to reduce the
cost of monthly insurance premiums. APTCs are generally available for eligible individuals with a projected household income
between 100 percent (133 percent in states that have chosen to expand their Medicaid programs) and 400 percent of the Federal
Poverty Level (FPL). For 2016, the percentage of household income that a qualified individual or family will pay toward a health
insurance premium ranges from 2.03 percent of household income at 100 percent of the FPL to 9.66 percent of income at 400
percent of the FPL. For more information on the required contribution percentage, see http://www.irs.gov/pub/irs-drop/rp-14-
62.pdf. 22 For purposes of this analysis, an individual qualifying for an advance premium tax credit was defined as any policy with an
APTC amount >$0. 23 This represents the $106 average monthly premium after advance premium tax credit as a percentage of the $396 average
monthly premium before advance premium tax credit. 24
This represents the difference between the $396 average monthly premium before advance premium tax credit and the
$290 average monthly advance premium tax credit.
ASPE Issue Brief Page 16
ASPE Office of Health Policy March 2016
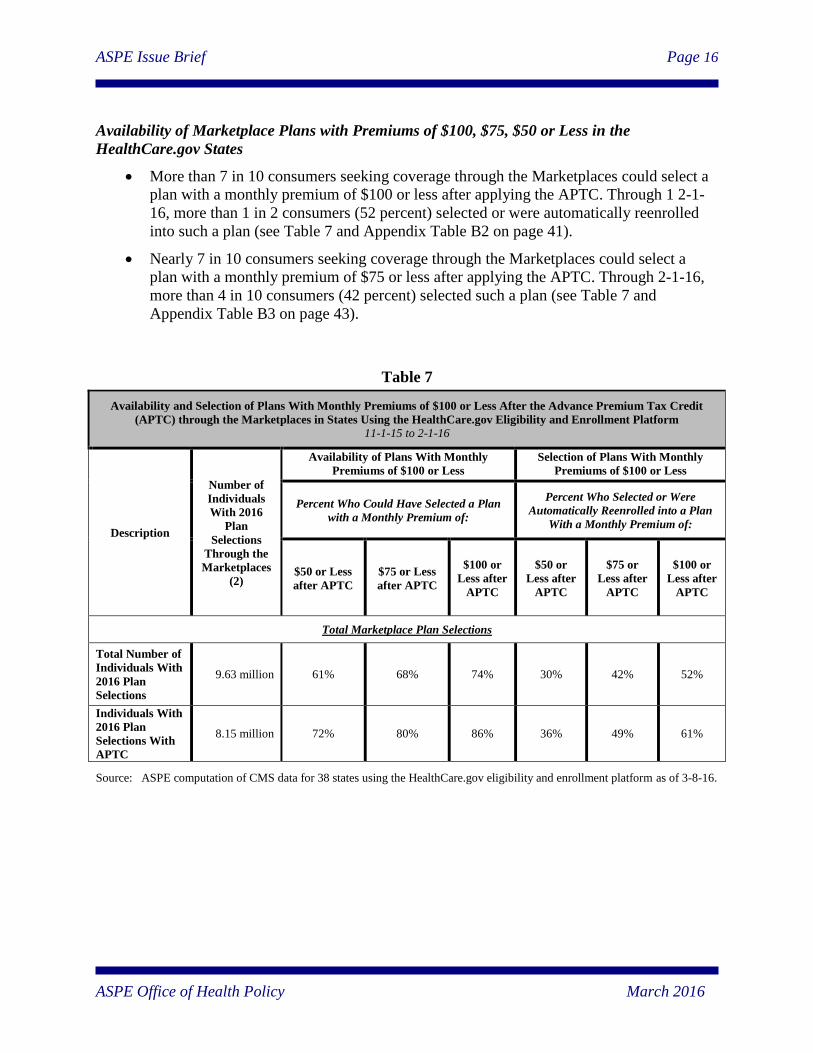
Availability of Marketplace Plans with Premiums of $100, $75, $50 or Less in the
HealthCare.gov States
More than 7 in 10 consumers seeking coverage through the Marketplaces could select a
plan with a monthly premium of $100 or less after applying the APTC. Through 1 2-1-
16, more than 1 in 2 consumers (52 percent) selected or were automatically reenrolled
into such a plan (see Table 7 and Appendix Table B2 on page 41).
Nearly 7 in 10 consumers seeking coverage through the Marketplaces could select a
plan with a monthly premium of $75 or less after applying the APTC. Through 2-1-16,
more than 4 in 10 consumers (42 percent) selected such a plan (see Table 7 and
Appendix Table B3 on page 43).
Table 7
Availability and Selection of Plans With Monthly Premiums of $100 or Less After the Advance Premium Tax Credit
(APTC) through the Marketplaces in States Using the HealthCare.gov Eligibility and Enrollment Platform 11-1-15 to 2-1-16
Description
Number of
Individuals
With 2016
Plan
Selections
Through the
Marketplaces
(2)
Availability of Plans With Monthly
Premiums of $100 or Less
Selection of Plans With Monthly
Premiums of $100 or Less
Percent Who Could Have Selected a Plan
with a Monthly Premium of:
Percent Who Selected or Were
Automatically Reenrolled into a Plan
With a Monthly Premium of:
$50 or Less
after APTC
$75 or Less
after APTC
$100 or
Less after
APTC
$50 or
Less after
APTC
$75 or
Less after
APTC
$100 or
Less after
APTC
Total Marketplace Plan Selections
Total Number of
Individuals With
2016 Plan
Selections
9.63 million 61% 68% 74% 30% 42% 52%
Individuals With
2016 Plan
Selections With
APTC
8.15 million 72% 80% 86% 36% 49% 61%
Source: ASPE computation of CMS data for 38 states using the HealthCare.gov eligibility and enrollment platform as of 3-8-16.
ASPE Issue Brief Page 17
ASPE Office of Health Policy March 2016
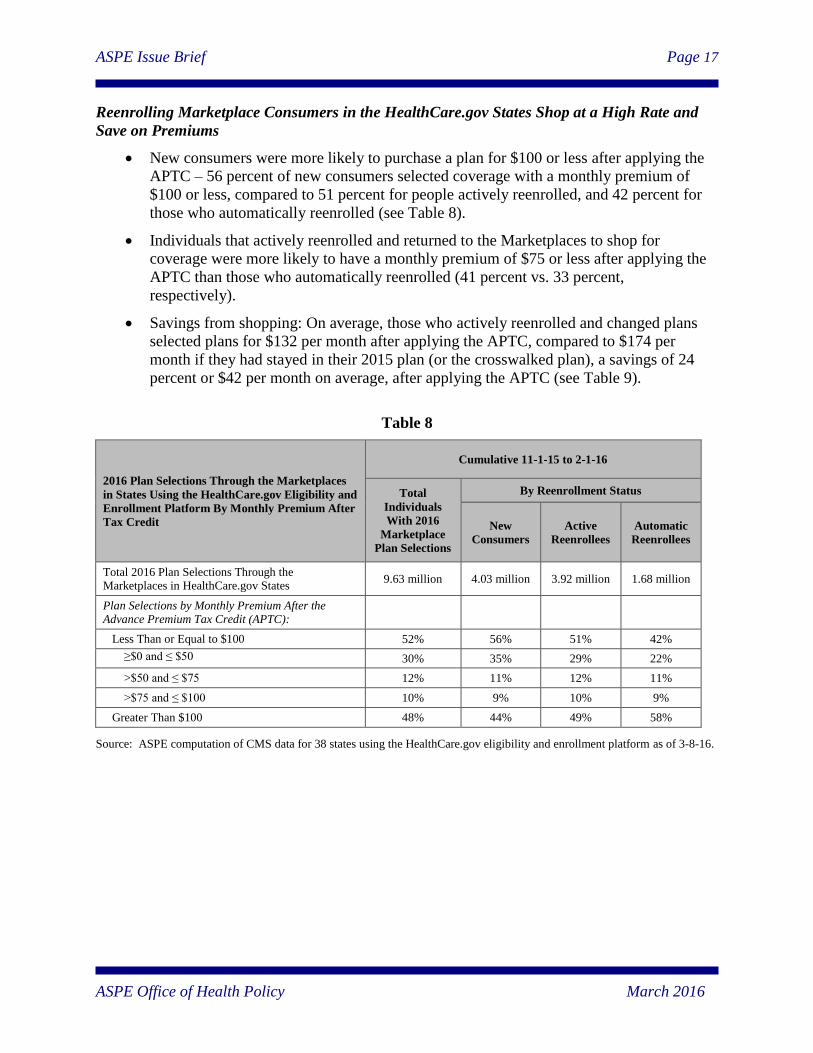
Reenrolling Marketplace Consumers in the HealthCare.gov States Shop at a High Rate and
Save on Premiums
New consumers were more likely to purchase a plan for $100 or less after applying the
APTC – 56 percent of new consumers selected coverage with a monthly premium of
$100 or less, compared to 51 percent for people actively reenrolled, and 42 percent for
those who automatically reenrolled (see Table 8).
Individuals that actively reenrolled and returned to the Marketplaces to shop for
coverage were more likely to have a monthly premium of $75 or less after applying the
APTC than those who automatically reenrolled (41 percent vs. 33 percent,
respectively).
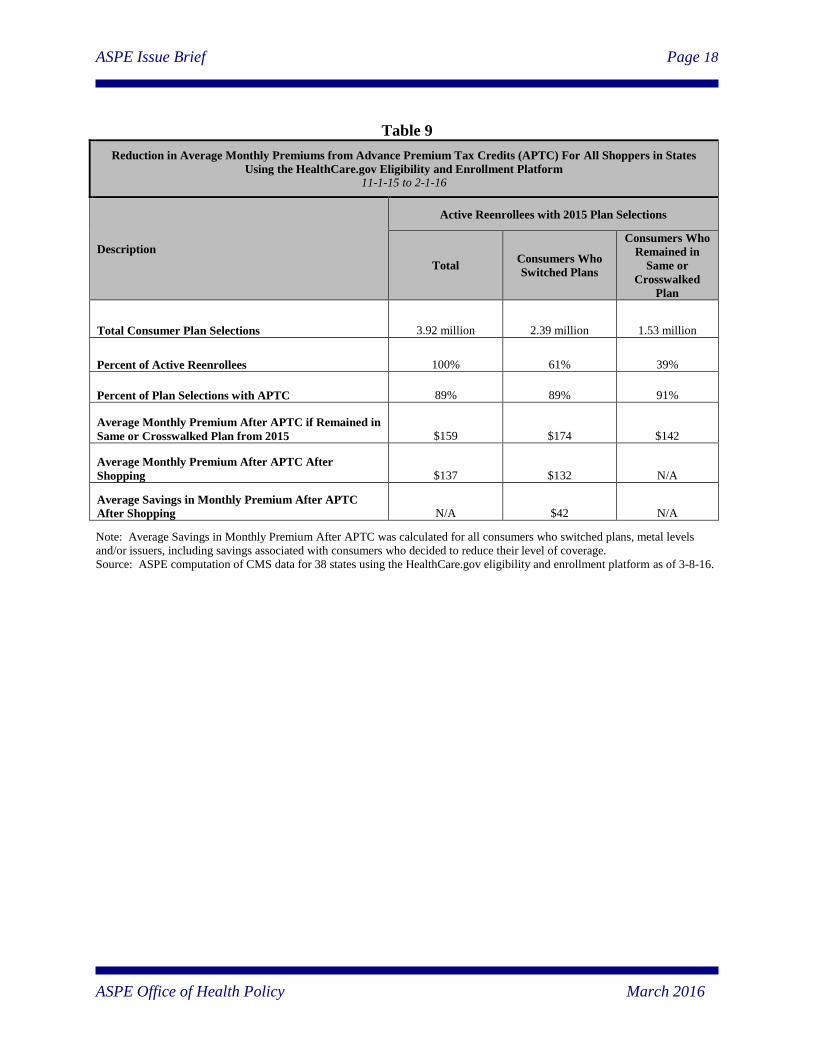
Savings from shopping: On average, those who actively reenrolled and changed plans
selected plans for $132 per month after applying the APTC, compared to $174 per
month if they had stayed in their 2015 plan (or the crosswalked plan), a savings of 24
percent or $42 per month on average, after applying the APTC (see Table 9).
Table 8
2016 Plan Selections Through the Marketplaces
in States Using the HealthCare.gov Eligibility and
Enrollment Platform By Monthly Premium After
Tax Credit
Cumulative 11-1-15 to 2-1-16
Total
Individuals
With 2016
Marketplace
Plan Selections
By Reenrollment Status
New
Consumers
Active
Reenrollees
Automatic
Reenrollees
Total 2016 Plan Selections Through the Marketplaces in HealthCare.gov States
9.63 million 4.03 million 3.92 million 1.68 million
Plan Selections by Monthly Premium After the Advance Premium Tax Credit (APTC):
Less Than or Equal to $100 52% 56% 51% 42%
≥$0 and ≤ $50 30% 35% 29% 22%
>$50 and ≤ $75 12% 11% 12% 11%
>$75 and ≤ $100 10% 9% 10% 9%
Greater Than $100 48% 44% 49% 58%
Source: ASPE computation of CMS data for 38 states using the HealthCare.gov eligibility and enrollment platform as of 3-8-16.
ASPE Issue Brief Page 18
ASPE Office of Health Policy March 2016
Table 9
Reduction in Average Monthly Premiums from Advance Premium Tax Credits (APTC) For All Shoppers in States
Using the HealthCare.gov Eligibility and Enrollment Platform 11-1-15 to 2-1-16
Description
Active Reenrollees with 2015 Plan Selections
Total Consumers Who
Switched Plans
Consumers Who
Remained in
Same or
Crosswalked
Plan
Total Consumer Plan Selections 3.92 million 2.39 million 1.53 million
Percent of Active Reenrollees 100% 61% 39%
Percent of Plan Selections with APTC 89% 89% 91%
Average Monthly Premium After APTC if Remained in
Same or Crosswalked Plan from 2015 $159 $174 $142
Average Monthly Premium After APTC After
Shopping $137 $132 N/A
Average Savings in Monthly Premium After APTC
After Shopping N/A $42 N/A
Note: Average Savings in Monthly Premium After APTC was calculated for all consumers who switched plans, metal levels
and/or issuers, including savings associated with consumers who decided to reduce their level of coverage.
Source: ASPE computation of CMS data for 38 states using the HealthCare.gov eligibility and enrollment platform as of 3-8-16.

ASPE Issue Brief Page 19
ASPE Office of Health Policy March 2016
Over One-Third of the Consumers Reenrolling in Marketplace Coverage in the
HealthCare.gov States Switched Plans
Among the 5.6 million consumers who reenrolled in Marketplace plans in the
HealthCare.gov states, 43 percent switched to a new plan during the 2016 OEP (see
Table 10). The proportion of consumers reenrolling in coverage who switched plans
continues to be higher than the levels of switching seen in other programs, such as for
Medicare Part D enrollees, active employees with Federal Employee Health Benefit Plan
coverage, and individuals with employer-sponsored coverage.
Among consumers who switched plans, more consumers switched issuers than metal
levels (see Table 10). Specifically, 47 percent of switchers changed only their issuer
during the 2016 OEP, while 15 percent of switchers changed only their metal level
during the 2016 OEP, and 16 percent of switchers changed both issuers and metal levels.
o A total of 64 percent of switchers changed their issuer, with or without also
changing their metal level.
o A total of 31 percent of switchers changed their metal level with or without also
changing their issuer.
Table 10
2016 Issuer and Metal Level Choices of Switchers
Description
Percent of All Reenrollees
N = 5.6 million
Percent of All Switchers
N = 2.4 million
Total Reenrollees in the HealthCare.gov States 100% N/A
Switchers 43% 100%
Active Reenrollees Who Changed Plans but Not
Metal Level or Issuer 9% 21%
Active Reenrollees Who Changed Issuer but Not
Metal Level 20% 47%
Active Reenrollees Who Changed Metal Level but
Not Issuer 6% 15%
Active Reenrollees Who Changed Metal Level and
Issuer 7% 16%
Active Reenrollees Who Changed Metal Level (with or
without changing issuer) (non-add) 13% 31%
Active Reenrollees Who Changed Issuer (with or without
changing metal level) (non-add) 27% 64%
Active Reenrollees Who Switched Without Having a
Valid 2015 Crosswalk Plan (non-add) 0% 0%
Non-Switchers 57% N/A
Active Reenrollees Who Remained in The Same
(or the Crosswalked) Marketplace Plan 27% N/A
Automatic Reenrollees 30% N/A
ASPE Issue Brief Page 20
ASPE Office of Health Policy March 2016
Source: ASPE computation of CMS data for 37 states using the HealthCare.gov eligibility and enrollment platform in
2015 and 2016 as of 3-8-16.
Consumers who switched plans within the same metal level during the 2016 OEP saved
$40 per month, or nearly $480 annually, relative to what they would have paid if they
had remained in the same plan (or the crosswalked plan) as in 2015. Meanwhile, those
who switched issuers as well as plans within the same metal level were able to save $45
per month, or nearly $540 annually (see Figure 3 and Appendix Table B5 on page 47).
Figure 3: Monthly Premium Savings for Switchers
$0
$50
$100
$150
$200
All switchers Switched plans within the samemetal level
Switched plans and issuerswithin the same metal level
2016 premium of the plan selected in 2015 2016 premium of the plan selected in 2016
$40
$42
$45
Note: Savings are calculated as the difference between the 2016 premium of the 2016 selected plan and the 2015
selected plan. Numbers are rounded to the nearest dollar. Source: ASPE computation of CMS data for 37 states using the HealthCare.gov eligibility and enrollment platform
in 2015 and 2016 as of 3-8-16.

ASPE Issue Brief Page 21
ASPE Office of Health Policy March 2016
SECTION II. METHODOLOGICAL OVERVIEW
The data reported here have been obtained from the information systems of the Centers for
Medicare & Medicaid Services (CMS), based on information collected for 38 states using the
HealthCare.gov eligibility and enrollment platform. We also obtained more limited data reported
to CMS by the 13 states (including DC) that are using their own Marketplace platforms. Data for
the Small Business Health Options Program (SHOP) Marketplaces are not included in this
report.
This report includes data that are currently available on enrollment-related activity for the 2016
Open Enrollment period – which generally corresponds with data from 11-1-15 to 2-1-16 for the
38 states using the HealthCare.gov eligibility and enrollment platform and for states that are
using their own Marketplace platforms for the 2016 coverage year.
Table 11 Marketplace Type Reporting Period (1)
States Using the HealthCare.gov Marketplace Eligibility and Enrollment Platform (38
states) 11-1-15 to 2-1-16
State Based Marketplaces (SBMs) Using Their Own Marketplace Platform (13 states)
9 States: California, District of Columbia, Idaho, Kentucky,
Maryland, New York, Rhode Island, Vermont, Washington 11-1-15 to 1-31-16
4 States: Colorado, Connecticut, Massachusetts, Minnesota 11-1-15 to 2-1-16
Note: (1) For purposes of the Final Enrollment Report, an effort was made to align the reporting periods for the HealthCare.gov
states and SBMs using their own Marketplace platforms with the reporting periods for the data that were included in the Week 13
CMS Marketplace Enrollment Snapshot (which can be accessed at
https://www.cms.gov/Newsroom/MediaReleaseDatabase/Fact-sheets/2016-Fact-sheets-items/2016-02-04.html).
Data for certain metrics are not available for several of the states that are using their own
Marketplace platforms.
It is important to note that some of the 13 states that are using their own Marketplace platforms
are not reporting data separately for consumers who are actively reenrolling in coverage and
consumers who have been automatically reenrolled into coverage through the Marketplaces.
Please refer to the Addendum for additional technical notes.
This report also includes available data on the characteristics of individuals who have selected a
plan through the Marketplaces for the 38 states that are using the HealthCare.gov eligibility and
enrollment platform for 2016, and the 13 states that are using their own Marketplace platforms.
In some cases, the data for certain characteristics of Marketplace plan selections are not yet
available in selected states.
The information contained in this issue brief provides the most systematic summary of
enrollment-related activity in the Marketplaces for the 2016 Open Enrollment period because the
data for the various metrics are counted using comparable definitions for data elements across
states and Marketplace types.
ASPE Issue Brief Page 22
ASPE Office of Health Policy March 2016
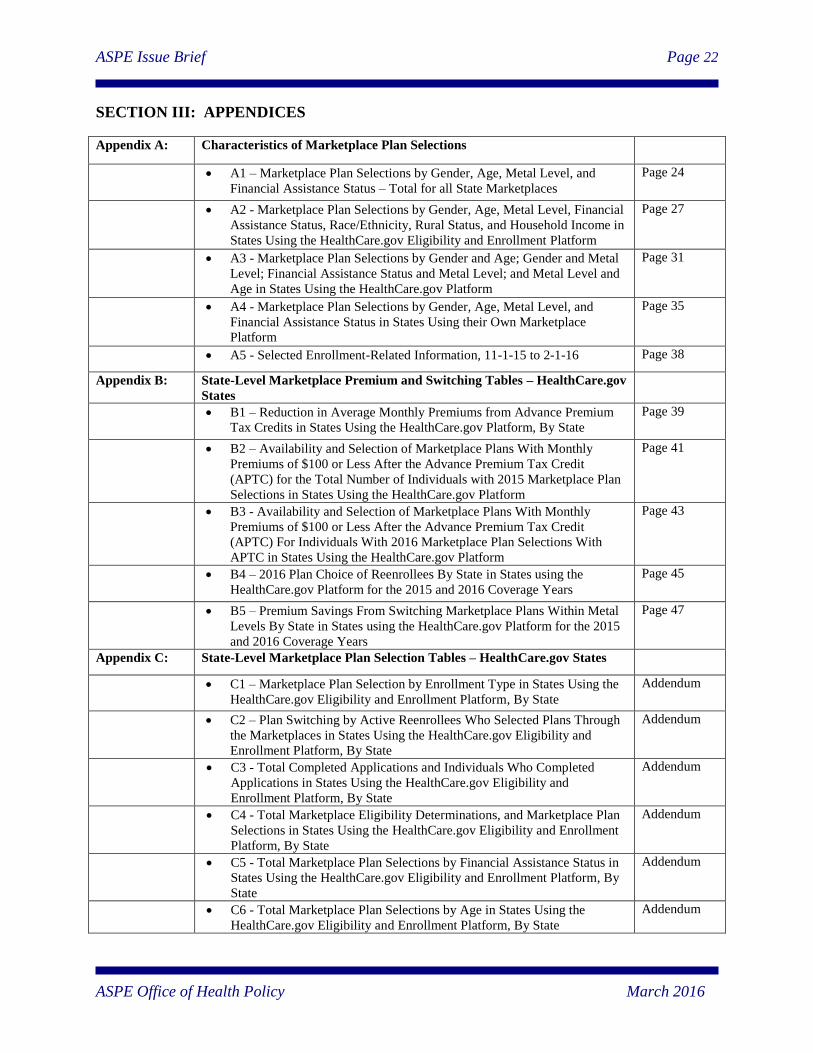
SECTION III: APPENDICES
Appendix A: Characteristics of Marketplace Plan Selections
A1 – Marketplace Plan Selections by Gender, Age, Metal Level, and
Financial Assistance Status – Total for all State Marketplaces
Page 24
A2 - Marketplace Plan Selections by Gender, Age, Metal Level, Financial
Assistance Status, Race/Ethnicity, Rural Status, and Household Income in
States Using the HealthCare.gov Eligibility and Enrollment Platform
Page 27
A3 - Marketplace Plan Selections by Gender and Age; Gender and Metal
Level; Financial Assistance Status and Metal Level; and Metal Level and
Age in States Using the HealthCare.gov Platform
Page 31
A4 - Marketplace Plan Selections by Gender, Age, Metal Level, and
Financial Assistance Status in States Using their Own Marketplace
Platform
Page 35
A5 - Selected Enrollment-Related Information, 11-1-15 to 2-1-16 Page 38
Appendix B: State-Level Marketplace Premium and Switching Tables – HealthCare.gov
States
B1 – Reduction in Average Monthly Premiums from Advance Premium
Tax Credits in States Using the HealthCare.gov Platform, By State
Page 39
B2 – Availability and Selection of Marketplace Plans With Monthly
Premiums of $100 or Less After the Advance Premium Tax Credit
(APTC) for the Total Number of Individuals with 2015 Marketplace Plan
Selections in States Using the HealthCare.gov Platform
Page 41
B3 - Availability and Selection of Marketplace Plans With Monthly
Premiums of $100 or Less After the Advance Premium Tax Credit
(APTC) For Individuals With 2016 Marketplace Plan Selections With
APTC in States Using the HealthCare.gov Platform
Page 43
B4 – 2016 Plan Choice of Reenrollees By State in States using the
HealthCare.gov Platform for the 2015 and 2016 Coverage Years
Page 45
B5 – Premium Savings From Switching Marketplace Plans Within Metal
Levels By State in States using the HealthCare.gov Platform for the 2015
and 2016 Coverage Years
Page 47
Appendix C: State-Level Marketplace Plan Selection Tables – HealthCare.gov States
C1 – Marketplace Plan Selection by Enrollment Type in States Using the
HealthCare.gov Eligibility and Enrollment Platform, By State
Addendum
C2 – Plan Switching by Active Reenrollees Who Selected Plans Through
the Marketplaces in States Using the HealthCare.gov Eligibility and
Enrollment Platform, By State
Addendum
C3 - Total Completed Applications and Individuals Who Completed
Applications in States Using the HealthCare.gov Eligibility and
Enrollment Platform, By State
Addendum
C4 - Total Marketplace Eligibility Determinations, and Marketplace Plan
Selections in States Using the HealthCare.gov Eligibility and Enrollment
Platform, By State
Addendum
C5 - Total Marketplace Plan Selections by Financial Assistance Status in
States Using the HealthCare.gov Eligibility and Enrollment Platform, By
State
Addendum
C6 - Total Marketplace Plan Selections by Age in States Using the
HealthCare.gov Eligibility and Enrollment Platform, By State
Addendum

ASPE Issue Brief Page 23
ASPE Office of Health Policy March 2016
C7 - Total Marketplace Plan Selections by Gender in States Using the
HealthCare.gov Eligibility and Enrollment Platform, By State
Addendum
C8 - Total Marketplace Plan Selections by Metal Level in States Using
the HealthCare.gov Eligibility and Enrollment Platform, By State
Addendum
C9 - Total Marketplace Plan Selections by Race/Ethnicity in States Using
the HealthCare.gov Eligibility and Enrollment Platform, By State
Addendum
C10 - Total Marketplace Plan Selections by Rural Status in States Using
the HealthCare.gov Eligibility and Enrollment Platform, By State
Addendum
C11 - Total Marketplace Plan Selections by Household Income in States
Using the HealthCare.gov Eligibility and Enrollment Platform, By State
Addendum
C12 - Total Marketplace Plan Selections by Gender and Age in States
Using the HealthCare.gov Eligibility and Enrollment Platform, By State
Addendum
C13 - Total Marketplace Plan Selections by Gender and Metal Level in
States Using the HealthCare.gov Eligibility and Enrollment Platform, By
State
Addendum
C14 - Total Marketplace Plan Selections by Financial Assistance Status
and Metal Level in States Using the HealthCare.gov Eligibility and
Enrollment Platform, By State
Addendum
C15 - Total Marketplace Plan Selections by Metal Level and Age in
States Using the HealthCare.gov Eligibility and Enrollment Platform, By
State
Addendum
Appendix D: State-Level Marketplace Plan Selection Tables – States Using Their Own
Marketplace Platforms
D1 – Marketplace Plan Selection by Enrollment Type in States Using
Their Own Marketplace Platforms, By State, By State
Addendum
D2 - Total Completed Applications and Individuals Who Completed
Applications in States Using Their Own Marketplace Platforms, By State
Addendum
D3 - Total Marketplace Eligibility Determinations, and Marketplace Plan
Selections in States Using Their Own Marketplace Platforms, By State
Addendum
D4 - Total Marketplace Plan Selections by Financial Assistance Status in
States Using Their Own Marketplace Platforms, By State
Addendum
D5 - Total Marketplace Plan Selections by Age in States Using Their
Own Marketplace Platforms, By State
Addendum
D6 - Total Marketplace Plan Selections by Gender in States Using Their
Own Marketplace Platforms, By State
Addendum
D7 - Total Marketplace Plan Selections by Metal Level in States Using
Their Own Marketplace Platforms, By State
Addendum
Appendix E: Technical Notes Addendum
ASPE Issue Brief Page 24
ASPE Office of Health Policy March 2016
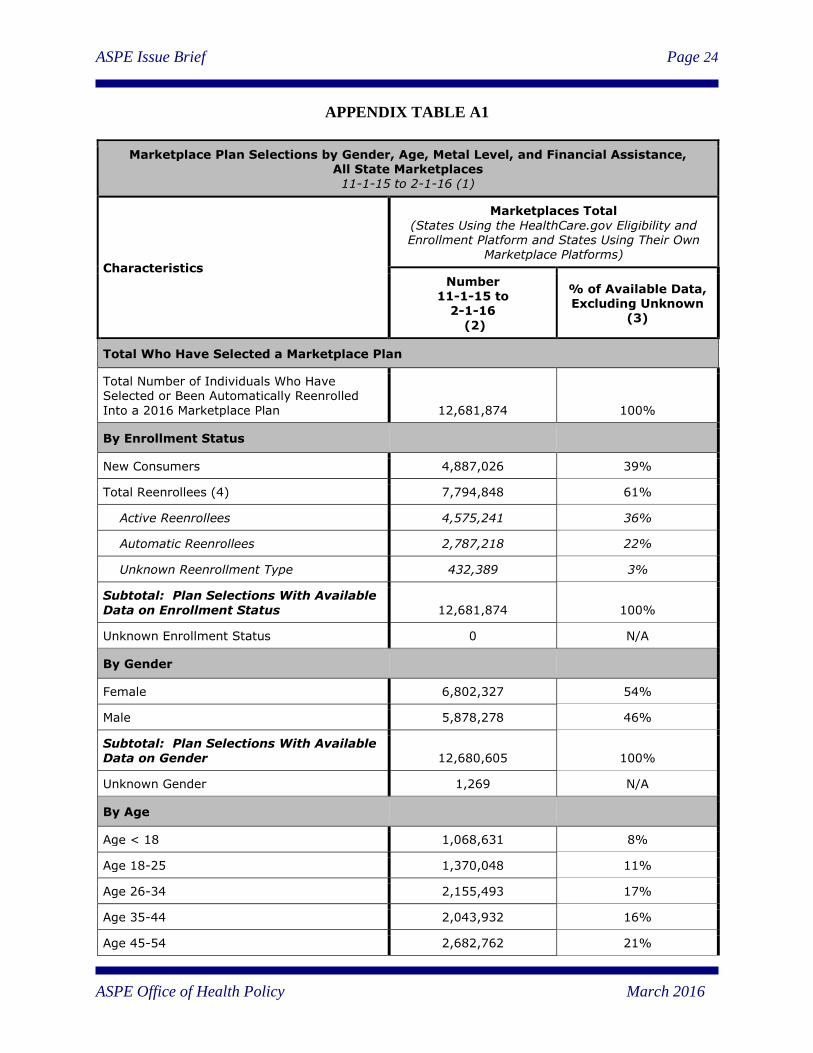
APPENDIX TABLE A1
Marketplace Plan Selections by Gender, Age, Metal Level, and Financial Assistance, All State Marketplaces
11-1-15 to 2-1-16 (1)
Characteristics
Marketplaces Total
(States Using the HealthCare.gov Eligibility and Enrollment Platform and States Using Their Own
Marketplace Platforms)
Number 11-1-15 to
2-1-16
(2)
% of Available Data, Excluding Unknown
(3)
Total Who Have Selected a Marketplace Plan
Total Number of Individuals Who Have Selected or Been Automatically Reenrolled
Into a 2016 Marketplace Plan 12,681,874 100%
By Enrollment Status
New Consumers 4,887,026 39%
Total Reenrollees (4) 7,794,848 61%
Active Reenrollees 4,575,241 36%
Automatic Reenrollees 2,787,218 22%
Unknown Reenrollment Type 432,389 3%
Subtotal: Plan Selections With Available
Data on Enrollment Status 12,681,874 100%
Unknown Enrollment Status 0 N/A
By Gender
Female 6,802,327 54%
Male 5,878,278 46%
Subtotal: Plan Selections With Available
Data on Gender 12,680,605 100%
Unknown Gender 1,269 N/A
By Age
Age < 18 1,068,631 8%
Age 18-25 1,370,048 11%
Age 26-34 2,155,493 17%
Age 35-44 2,043,932 16%
Age 45-54 2,682,762 21%
ASPE Issue Brief Page 25
ASPE Office of Health Policy March 2016
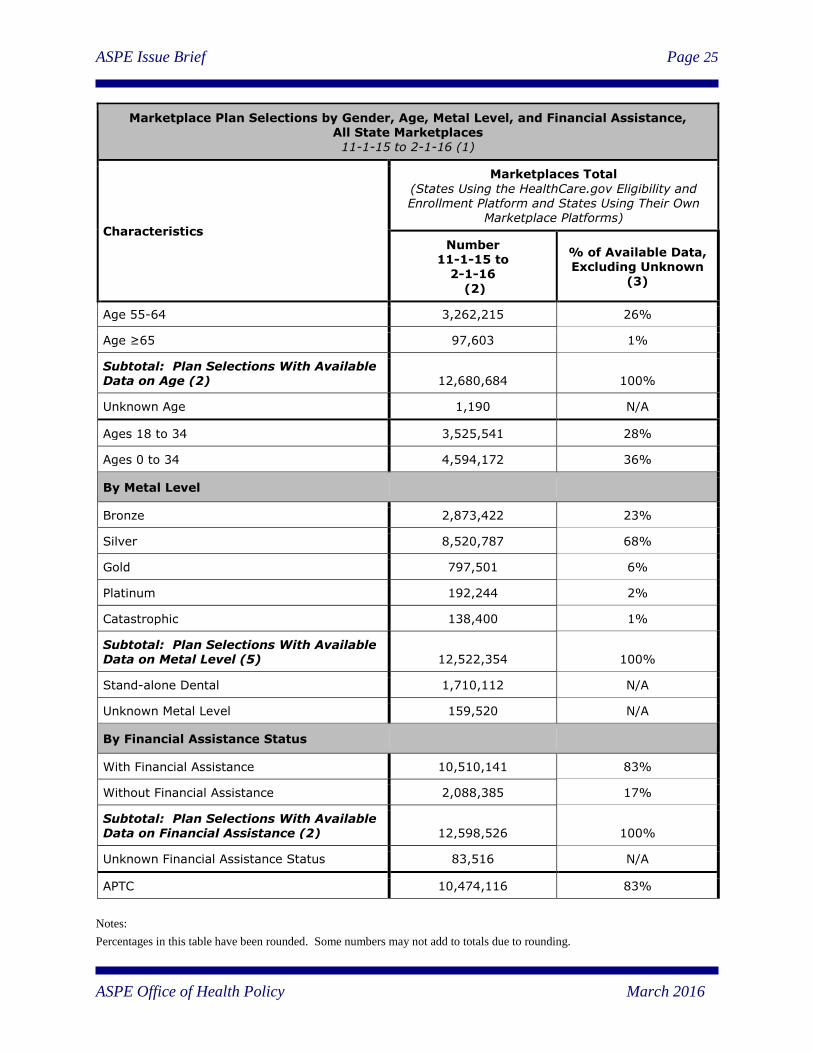
Marketplace Plan Selections by Gender, Age, Metal Level, and Financial Assistance, All State Marketplaces
11-1-15 to 2-1-16 (1)
Characteristics
Marketplaces Total
(States Using the HealthCare.gov Eligibility and Enrollment Platform and States Using Their Own
Marketplace Platforms)
Number 11-1-15 to
2-1-16
(2)
% of Available Data, Excluding Unknown
(3)
Age 55-64 3,262,215 26%
Age ≥65 97,603 1%
Subtotal: Plan Selections With Available Data on Age (2) 12,680,684 100%
Unknown Age 1,190 N/A
Ages 18 to 34 3,525,541 28%
Ages 0 to 34 4,594,172 36%
By Metal Level
Bronze 2,873,422 23%
Silver 8,520,787 68%
Gold 797,501 6%
Platinum 192,244 2%
Catastrophic 138,400 1%
Subtotal: Plan Selections With Available Data on Metal Level (5) 12,522,354 100%
Stand-alone Dental 1,710,112 N/A
Unknown Metal Level 159,520 N/A
By Financial Assistance Status
With Financial Assistance 10,510,141 83%
Without Financial Assistance 2,088,385 17%
Subtotal: Plan Selections With Available Data on Financial Assistance (2) 12,598,526 100%
Unknown Financial Assistance Status 83,516 N/A
APTC 10,474,116 83%
Notes:
Percentages in this table have been rounded. Some numbers may not add to totals due to rounding.
ASPE Issue Brief Page 26
ASPE Office of Health Policy March 2016
(1) Unless otherwise noted, the data in this table represent cumulative data on the number of unique individuals who have been
determined eligible to enroll in a Marketplace plan, and have selected or been automatically reenrolled into a Marketplace
medical plan (with or without the first premium payment having been received by the issuer). Individuals who have cancelled or
terminated their Marketplace plans are not included in the total number of plan selections for all but two states (Minnesota and
DC). These data also do not include: stand-alone dental plan selections; or individuals who may have selected a 2015
Marketplace plan during the reporting period, as a result of having been eligible for a Special Enrollment Period (SEP). For
additional technical notes, please refer to the Addendum of this report.
(2) For each metric, the data represent the total number of “Individuals Applying for 2016 Coverage in Completed Applications”
who have selected a 2016 medical Marketplace plan for enrollment through the Marketplace (with or without the first premium
payment having been received directly by the issuer) during the reference period, excluding plan selections with unknown data
for a given metric. This is also known as pre-effectuated enrollment, because enrollment is not considered effectuated until the
first premium payment is made, and this figure includes plan selections for which enrollment has not yet been effectuated. Most
of the data in this table are for the 11-1-15 to 2-1-16 reporting period with the following exception: the data for 9 SBMs using
their own Marketplace platforms are for the 11-1-15 to 1-31-16 reporting period.
(3) In some cases, the data for certain characteristics of Marketplace plan selections are not yet available. For this reason, for
each metric, we have calculated the comparable percentages based on the number of plan selections with known data for that
metric.
(4) The number of active reenrollees and automatic reenrollees may not add to the total number of reenrollees due to some SBM
plan selections with missing data.
(5) The subtotals for each metal tier type do not sum to the total number partially due to a small number of individuals who have
multiple 2016 Marketplace plan selections in the system that will be resolved through data cleanup processes, but primarily due
to Massachusetts counting 158,512 individuals enrolled in its Connector Care Program as unknowns. Connector Care plans are
closest to Silver plans, but their actuarial value is higher than that of a Silver Plan. Data for stand-alone dental plan selections are
shown in this section, but are not included in any of the other metrics in this report.
Source: Centers for Medicare & Medicaid Services, as of 3-8-16.
ASPE Issue Brief Page 27
ASPE Office of Health Policy March 2016
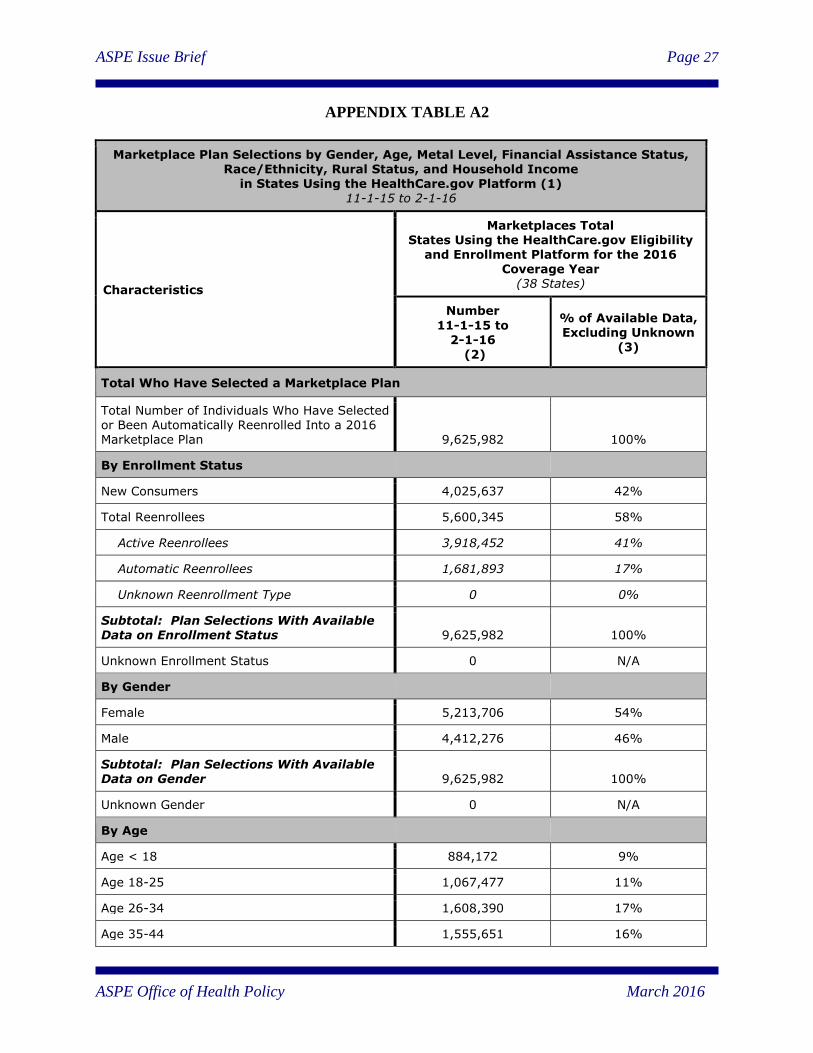
APPENDIX TABLE A2
Marketplace Plan Selections by Gender, Age, Metal Level, Financial Assistance Status, Race/Ethnicity, Rural Status, and Household Income
in States Using the HealthCare.gov Platform (1) 11-1-15 to 2-1-16
Characteristics
Marketplaces Total States Using the HealthCare.gov Eligibility
and Enrollment Platform for the 2016 Coverage Year
(38 States)
Number
11-1-15 to 2-1-16
(2)
% of Available Data, Excluding Unknown
(3)
Total Who Have Selected a Marketplace Plan
Total Number of Individuals Who Have Selected or Been Automatically Reenrolled Into a 2016 Marketplace Plan 9,625,982 100%
By Enrollment Status
New Consumers 4,025,637 42%
Total Reenrollees 5,600,345 58%
Active Reenrollees 3,918,452 41%
Automatic Reenrollees 1,681,893 17%
Unknown Reenrollment Type 0 0%
Subtotal: Plan Selections With Available Data on Enrollment Status 9,625,982 100%
Unknown Enrollment Status 0 N/A
By Gender
Female 5,213,706 54%
Male 4,412,276 46%
Subtotal: Plan Selections With Available Data on Gender 9,625,982 100%
Unknown Gender 0 N/A
By Age
Age < 18 884,172 9%
Age 18-25 1,067,477 11%
Age 26-34 1,608,390 17%
Age 35-44 1,555,651 16%
ASPE Issue Brief Page 28
ASPE Office of Health Policy March 2016
Marketplace Plan Selections by Gender, Age, Metal Level, Financial Assistance Status, Race/Ethnicity, Rural Status, and Household Income
in States Using the HealthCare.gov Platform (1) 11-1-15 to 2-1-16
Characteristics
Marketplaces Total States Using the HealthCare.gov Eligibility
and Enrollment Platform for the 2016 Coverage Year
(38 States)
Number
11-1-15 to 2-1-16
(2)
% of Available Data, Excluding Unknown
(3)
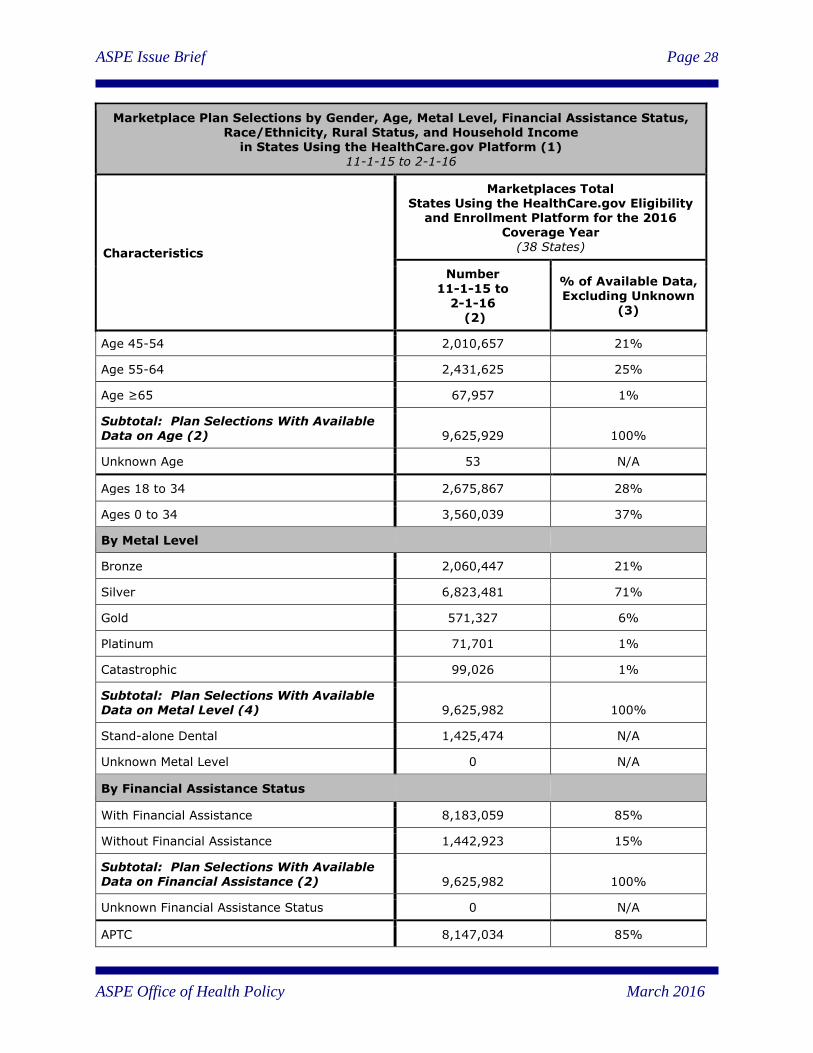
Age 45-54 2,010,657 21%
Age 55-64 2,431,625 25%
Age ≥65 67,957 1%
Subtotal: Plan Selections With Available Data on Age (2) 9,625,929 100%
Unknown Age 53 N/A
Ages 18 to 34 2,675,867 28%
Ages 0 to 34 3,560,039 37%
By Metal Level
Bronze 2,060,447 21%
Silver 6,823,481 71%
Gold 571,327 6%
Platinum 71,701 1%
Catastrophic 99,026 1%
Subtotal: Plan Selections With Available Data on Metal Level (4) 9,625,982 100%
Stand-alone Dental 1,425,474 N/A
Unknown Metal Level 0 N/A
By Financial Assistance Status
With Financial Assistance 8,183,059 85%
Without Financial Assistance 1,442,923 15%
Subtotal: Plan Selections With Available Data on Financial Assistance (2) 9,625,982 100%
Unknown Financial Assistance Status 0 N/A
APTC 8,147,034 85%
ASPE Issue Brief Page 29
ASPE Office of Health Policy March 2016
Marketplace Plan Selections by Gender, Age, Metal Level, Financial Assistance Status, Race/Ethnicity, Rural Status, and Household Income
in States Using the HealthCare.gov Platform (1) 11-1-15 to 2-1-16
Characteristics
Marketplaces Total States Using the HealthCare.gov Eligibility
and Enrollment Platform for the 2016 Coverage Year
(38 States)
Number
11-1-15 to 2-1-16
(2)
% of Available Data, Excluding Unknown
(3)
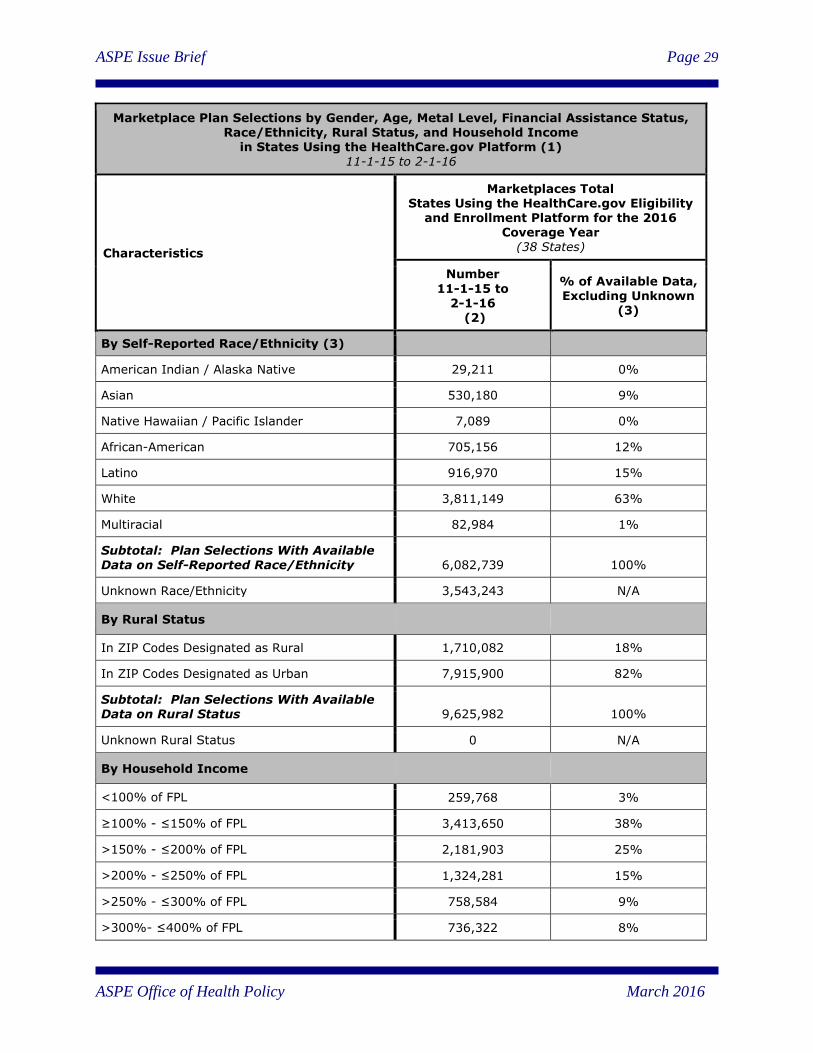
By Self-Reported Race/Ethnicity (3)
American Indian / Alaska Native 29,211 0%
Asian 530,180 9%
Native Hawaiian / Pacific Islander 7,089 0%
African-American 705,156 12%
Latino 916,970 15%
White 3,811,149 63%
Multiracial 82,984 1%
Subtotal: Plan Selections With Available Data on Self-Reported Race/Ethnicity 6,082,739 100%
Unknown Race/Ethnicity 3,543,243 N/A
By Rural Status
In ZIP Codes Designated as Rural 1,710,082 18%
In ZIP Codes Designated as Urban 7,915,900 82%
Subtotal: Plan Selections With Available Data on Rural Status 9,625,982 100%
Unknown Rural Status 0 N/A
By Household Income
<100% of FPL 259,768 3%
≥100% - ≤150% of FPL 3,413,650 38%
>150% - ≤200% of FPL 2,181,903 25%
>200% - ≤250% of FPL 1,324,281 15%
>250% - ≤300% of FPL 758,584 9%
>300%- ≤400% of FPL 736,322 8%
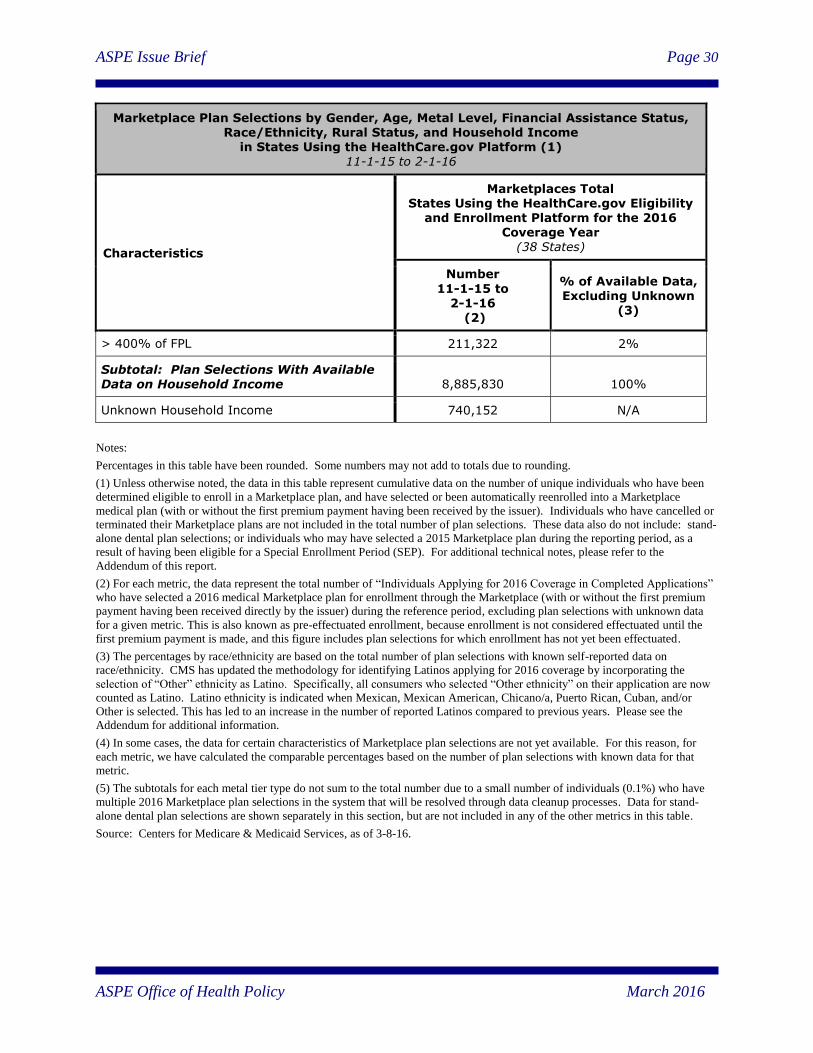
ASPE Issue Brief Page 30
ASPE Office of Health Policy March 2016
Marketplace Plan Selections by Gender, Age, Metal Level, Financial Assistance Status, Race/Ethnicity, Rural Status, and Household Income
in States Using the HealthCare.gov Platform (1) 11-1-15 to 2-1-16
Characteristics
Marketplaces Total States Using the HealthCare.gov Eligibility
and Enrollment Platform for the 2016 Coverage Year
(38 States)
Number
11-1-15 to 2-1-16
(2)
% of Available Data, Excluding Unknown
(3)
> 400% of FPL 211,322 2%
Subtotal: Plan Selections With Available Data on Household Income 8,885,830 100%
Unknown Household Income 740,152 N/A
Notes:
Percentages in this table have been rounded. Some numbers may not add to totals due to rounding.
(1) Unless otherwise noted, the data in this table represent cumulative data on the number of unique individuals who have been
determined eligible to enroll in a Marketplace plan, and have selected or been automatically reenrolled into a Marketplace
medical plan (with or without the first premium payment having been received by the issuer). Individuals who have cancelled or
terminated their Marketplace plans are not included in the total number of plan selections. These data also do not include: stand-
alone dental plan selections; or individuals who may have selected a 2015 Marketplace plan during the reporting period, as a
result of having been eligible for a Special Enrollment Period (SEP). For additional technical notes, please refer to the
Addendum of this report.
(2) For each metric, the data represent the total number of “Individuals Applying for 2016 Coverage in Completed Applications”
who have selected a 2016 medical Marketplace plan for enrollment through the Marketplace (with or without the first premium
payment having been received directly by the issuer) during the reference period, excluding plan selections with unknown data
for a given metric. This is also known as pre-effectuated enrollment, because enrollment is not considered effectuated until the
first premium payment is made, and this figure includes plan selections for which enrollment has not yet been effectuated.
(3) The percentages by race/ethnicity are based on the total number of plan selections with known self-reported data on
race/ethnicity. CMS has updated the methodology for identifying Latinos applying for 2016 coverage by incorporating the
selection of “Other” ethnicity as Latino. Specifically, all consumers who selected “Other ethnicity” on their application are now
counted as Latino. Latino ethnicity is indicated when Mexican, Mexican American, Chicano/a, Puerto Rican, Cuban, and/or
Other is selected. This has led to an increase in the number of reported Latinos compared to previous years. Please see the
Addendum for additional information.
(4) In some cases, the data for certain characteristics of Marketplace plan selections are not yet available. For this reason, for
each metric, we have calculated the comparable percentages based on the number of plan selections with known data for that
metric.
(5) The subtotals for each metal tier type do not sum to the total number due to a small number of individuals (0.1%) who have
multiple 2016 Marketplace plan selections in the system that will be resolved through data cleanup processes. Data for stand-
alone dental plan selections are shown separately in this section, but are not included in any of the other metrics in this table.
Source: Centers for Medicare & Medicaid Services, as of 3-8-16.
ASPE Issue Brief Page 31
ASPE Office of Health Policy March 2016
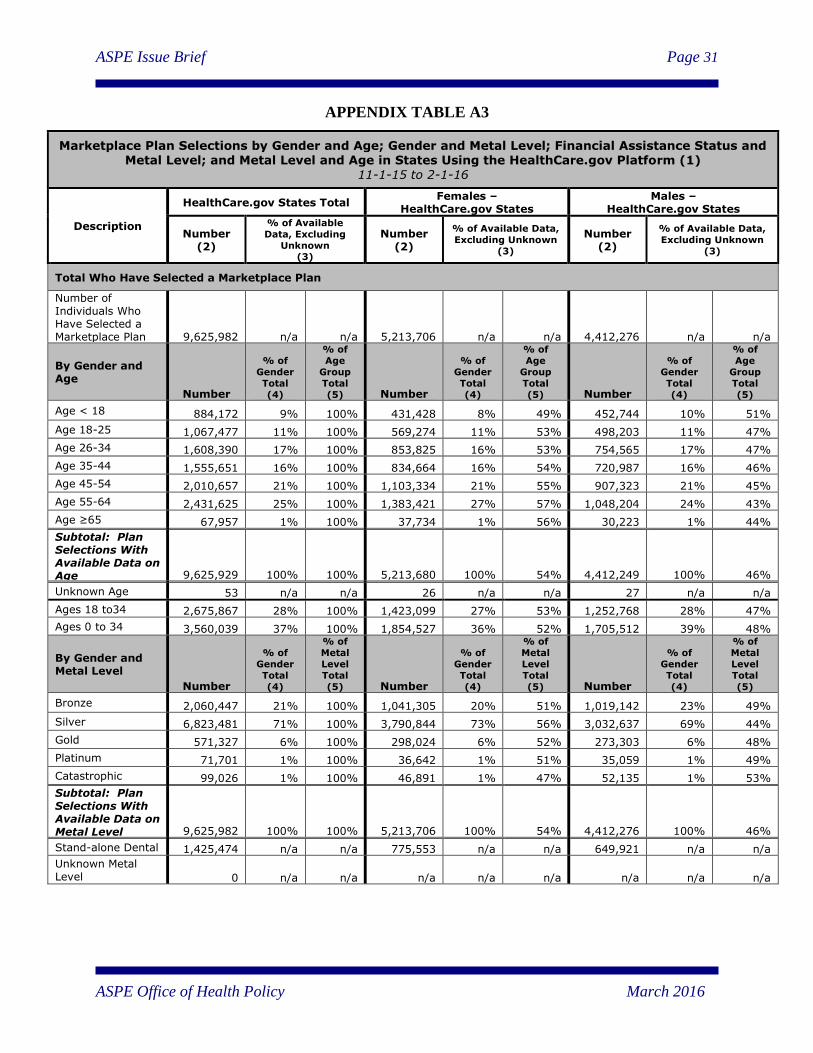
APPENDIX TABLE A3
Marketplace Plan Selections by Gender and Age; Gender and Metal Level; Financial Assistance Status and Metal Level; and Metal Level and Age in States Using the HealthCare.gov Platform (1)
11-1-15 to 2-1-16
Description
HealthCare.gov States Total Females –
HealthCare.gov States Males –
HealthCare.gov States
Number (2)
% of Available
Data, Excluding
Unknown (3)
Number (2)
% of Available Data,
Excluding Unknown
(3)
Number (2)
% of Available Data,
Excluding Unknown
(3)
Total Who Have Selected a Marketplace Plan
Number of Individuals Who Have Selected a Marketplace Plan 9,625,982 n/a n/a 5,213,706 n/a n/a 4,412,276 n/a n/a
By Gender and Age
Number
% of
Gender
Total
(4)
% of
Age
Group
Total
(5) Number
% of
Gender
Total
(4)
% of
Age
Group
Total
(5) Number
% of
Gender
Total
(4)
% of
Age
Group
Total
(5)
Age < 18 884,172 9% 100% 431,428 8% 49% 452,744 10% 51%
Age 18-25 1,067,477 11% 100% 569,274 11% 53% 498,203 11% 47%
Age 26-34 1,608,390 17% 100% 853,825 16% 53% 754,565 17% 47%
Age 35-44 1,555,651 16% 100% 834,664 16% 54% 720,987 16% 46%
Age 45-54 2,010,657 21% 100% 1,103,334 21% 55% 907,323 21% 45%
Age 55-64 2,431,625 25% 100% 1,383,421 27% 57% 1,048,204 24% 43%
Age ≥65 67,957 1% 100% 37,734 1% 56% 30,223 1% 44%
Subtotal: Plan Selections With Available Data on Age 9,625,929 100% 100% 5,213,680 100% 54% 4,412,249 100% 46%
Unknown Age 53 n/a n/a 26 n/a n/a 27 n/a n/a
Ages 18 to34 2,675,867 28% 100% 1,423,099 27% 53% 1,252,768 28% 47%
Ages 0 to 34 3,560,039 37% 100% 1,854,527 36% 52% 1,705,512 39% 48%
By Gender and Metal Level
Number
% of
Gender
Total
(4)
% of
Metal
Level
Total
(5) Number
% of
Gender
Total
(4)
% of
Metal
Level
Total
(5) Number
% of
Gender
Total
(4)
% of
Metal
Level
Total
(5)
Bronze 2,060,447 21% 100% 1,041,305 20% 51% 1,019,142 23% 49%
Silver 6,823,481 71% 100% 3,790,844 73% 56% 3,032,637 69% 44%
Gold 571,327 6% 100% 298,024 6% 52% 273,303 6% 48%
Platinum 71,701 1% 100% 36,642 1% 51% 35,059 1% 49%
Catastrophic 99,026 1% 100% 46,891 1% 47% 52,135 1% 53%
Subtotal: Plan Selections With Available Data on Metal Level 9,625,982 100% 100% 5,213,706 100% 54% 4,412,276 100% 46%
Stand-alone Dental 1,425,474 n/a n/a 775,553 n/a n/a 649,921 n/a n/a
Unknown Metal Level 0 n/a n/a n/a n/a n/a n/a n/a n/a
ASPE Issue Brief Page 32
ASPE Office of Health Policy March 2016
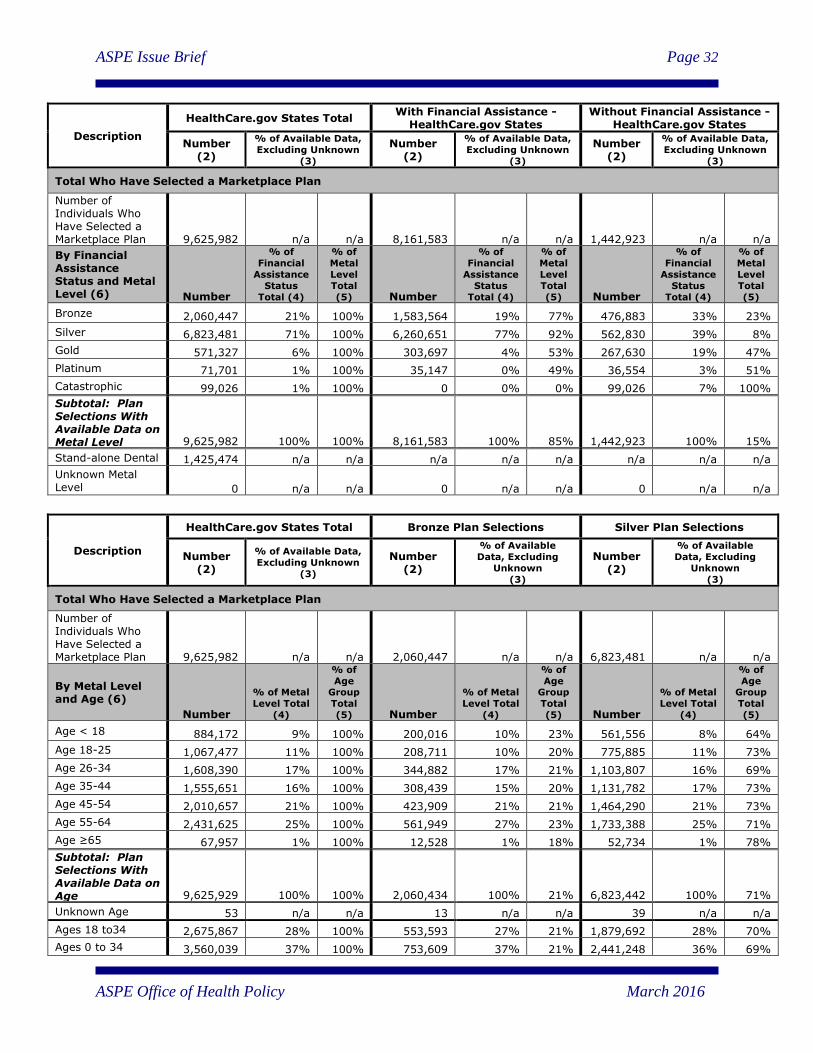
Description
HealthCare.gov States Total With Financial Assistance -
HealthCare.gov States Without Financial Assistance -
HealthCare.gov States
Number (2)
% of Available Data,
Excluding Unknown
(3)
Number (2)
% of Available Data,
Excluding Unknown
(3)
Number (2)
% of Available Data,
Excluding Unknown
(3)
Total Who Have Selected a Marketplace Plan
Number of Individuals Who Have Selected a Marketplace Plan 9,625,982 n/a n/a 8,161,583 n/a n/a 1,442,923 n/a n/a
By Financial Assistance Status and Metal Level (6) Number
% of
Financial
Assistance
Status
Total (4)
% of
Metal
Level
Total
(5) Number
% of
Financial
Assistance
Status
Total (4)
% of
Metal
Level
Total
(5) Number
% of
Financial
Assistance
Status
Total (4)
% of
Metal
Level
Total
(5)
Bronze 2,060,447 21% 100% 1,583,564 19% 77% 476,883 33% 23%
Silver 6,823,481 71% 100% 6,260,651 77% 92% 562,830 39% 8%
Gold 571,327 6% 100% 303,697 4% 53% 267,630 19% 47%
Platinum 71,701 1% 100% 35,147 0% 49% 36,554 3% 51%
Catastrophic 99,026 1% 100% 0 0% 0% 99,026 7% 100%
Subtotal: Plan Selections With Available Data on Metal Level 9,625,982 100% 100% 8,161,583 100% 85% 1,442,923 100% 15%
Stand-alone Dental 1,425,474 n/a n/a n/a n/a n/a n/a n/a n/a
Unknown Metal Level 0 n/a n/a 0 n/a n/a 0 n/a n/a
Description
HealthCare.gov States Total Bronze Plan Selections Silver Plan Selections
Number (2)
% of Available Data,
Excluding Unknown
(3)
Number (2)
% of Available
Data, Excluding
Unknown
(3)
Number (2)
% of Available
Data, Excluding
Unknown
(3)
Total Who Have Selected a Marketplace Plan
Number of Individuals Who Have Selected a Marketplace Plan 9,625,982 n/a n/a 2,060,447 n/a n/a 6,823,481 n/a n/a
By Metal Level and Age (6)
Number
% of Metal
Level Total
(4)
% of
Age Group
Total
(5) Number
% of Metal
Level Total
(4)
% of
Age Group
Total
(5) Number
% of Metal
Level Total
(4)
% of
Age Group
Total
(5)
Age < 18 884,172 9% 100% 200,016 10% 23% 561,556 8% 64%
Age 18-25 1,067,477 11% 100% 208,711 10% 20% 775,885 11% 73%
Age 26-34 1,608,390 17% 100% 344,882 17% 21% 1,103,807 16% 69%
Age 35-44 1,555,651 16% 100% 308,439 15% 20% 1,131,782 17% 73%
Age 45-54 2,010,657 21% 100% 423,909 21% 21% 1,464,290 21% 73%
Age 55-64 2,431,625 25% 100% 561,949 27% 23% 1,733,388 25% 71%
Age ≥65 67,957 1% 100% 12,528 1% 18% 52,734 1% 78%
Subtotal: Plan Selections With Available Data on Age 9,625,929 100% 100% 2,060,434 100% 21% 6,823,442 100% 71%
Unknown Age 53 n/a n/a 13 n/a n/a 39 n/a n/a
Ages 18 to34 2,675,867 28% 100% 553,593 27% 21% 1,879,692 28% 70%
Ages 0 to 34 3,560,039 37% 100% 753,609 37% 21% 2,441,248 36% 69%

ASPE Issue Brief Page 33
ASPE Office of Health Policy March 2016
Description
Gold Plan Selections Platinum Plan Selections Catastrophic Plan Selections
Number (2)
% of Available
Data, Excluding
Unknown
(3)
Number (2)
% of Available
Data, Excluding
Unknown
(3)
Number (2)
% of Available
Data, Excluding
Unknown
(3)
Total Who Have Selected a Marketplace Plan
Number of Individuals Who Have Selected a Marketplace Plan 571,327 n/a n/a 71,701 n/a n/a 99,026 n/a n/a
By Metal Level and Age (6)
Number
% of
Metal
Level
Total
(4)
% of
Age
Group
Total
(5) Number
% of
Metal
Level
Total
(4)
% of
Age
Group
Total
(5) Number
% of
Metal
Level
Total (4)
% of
Age
Group
Total
(5)
Age < 18 104,497 18% 12% 11,986 17% 1% 6,117 6% 1%
Age 18-25 45,321 8% 4% 6,061 8% 1% 31,499 32% 3%
Age 26-34 95,497 17% 6% 14,239 20% 1% 49,965 50% 3%
Age 35-44 95,844 17% 6% 14,175 20% 1% 5,411 5% 0%
Age 45-54 105,421 18% 5% 13,233 18% 1% 3,804 4% 0%
Age 55-64 122,479 21% 5% 11,633 16% 0% 2,176 2% 0%
Age ≥65 2,267 0% 3% 374 1% 1% 54 0% 0%
Subtotal: Plan Selections With Available Data on Age 571,326 100% 6% 71,701 100% 1% 99,026 100% 1%
Unknown Age 0 n/a n/a 0 n/a n/a 0 n/a n/a
Ages 18 to34 140,818 25% 5% 20,300 28% 1% 81,464 82% 3%
Ages 0 to 34 245,315 43% 7% 32,286 45% 1% 87,581 88% 2%
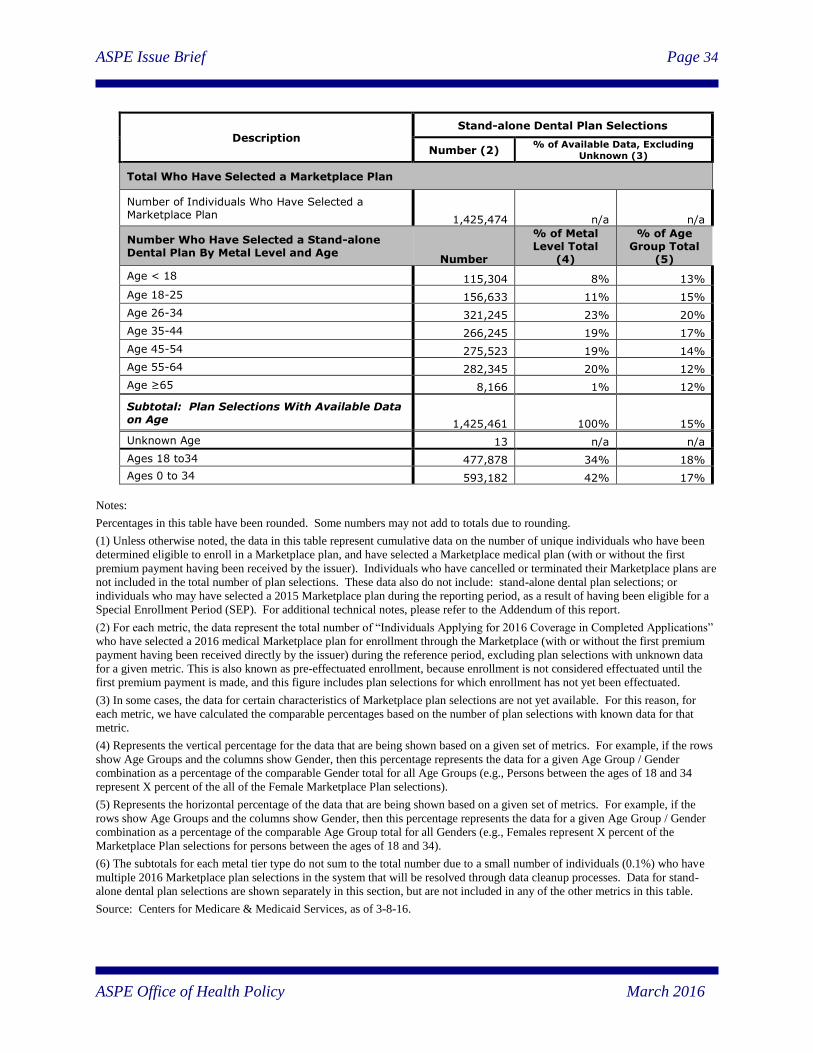
ASPE Issue Brief Page 34
ASPE Office of Health Policy March 2016
Description Stand-alone Dental Plan Selections
Number (2) % of Available Data, Excluding
Unknown (3)
Total Who Have Selected a Marketplace Plan
Number of Individuals Who Have Selected a Marketplace Plan 1,425,474 n/a n/a
Number Who Have Selected a Stand-alone Dental Plan By Metal Level and Age
Number
% of Metal Level Total
(4)
% of Age Group Total
(5)
Age < 18 115,304 8% 13%
Age 18-25 156,633 11% 15%
Age 26-34 321,245 23% 20%
Age 35-44 266,245 19% 17%
Age 45-54 275,523 19% 14%
Age 55-64 282,345 20% 12%
Age ≥65 8,166 1% 12%
Subtotal: Plan Selections With Available Data on Age 1,425,461 100% 15%
Unknown Age 13 n/a n/a
Ages 18 to34 477,878 34% 18%
Ages 0 to 34 593,182 42% 17%
Notes:
Percentages in this table have been rounded. Some numbers may not add to totals due to rounding.
(1) Unless otherwise noted, the data in this table represent cumulative data on the number of unique individuals who have been
determined eligible to enroll in a Marketplace plan, and have selected a Marketplace medical plan (with or without the first
premium payment having been received by the issuer). Individuals who have cancelled or terminated their Marketplace plans are
not included in the total number of plan selections. These data also do not include: stand-alone dental plan selections; or
individuals who may have selected a 2015 Marketplace plan during the reporting period, as a result of having been eligible for a
Special Enrollment Period (SEP). For additional technical notes, please refer to the Addendum of this report.
(2) For each metric, the data represent the total number of “Individuals Applying for 2016 Coverage in Completed Applications”
who have selected a 2016 medical Marketplace plan for enrollment through the Marketplace (with or without the first premium
payment having been received directly by the issuer) during the reference period, excluding plan selections with unknown data
for a given metric. This is also known as pre-effectuated enrollment, because enrollment is not considered effectuated until the
first premium payment is made, and this figure includes plan selections for which enrollment has not yet been effectuated.
(3) In some cases, the data for certain characteristics of Marketplace plan selections are not yet available. For this reason, for
each metric, we have calculated the comparable percentages based on the number of plan selections with known data for that
metric.
(4) Represents the vertical percentage for the data that are being shown based on a given set of metrics. For example, if the rows
show Age Groups and the columns show Gender, then this percentage represents the data for a given Age Group / Gender
combination as a percentage of the comparable Gender total for all Age Groups (e.g., Persons between the ages of 18 and 34
represent X percent of the all of the Female Marketplace Plan selections).
(5) Represents the horizontal percentage of the data that are being shown based on a given set of metrics. For example, if the
rows show Age Groups and the columns show Gender, then this percentage represents the data for a given Age Group / Gender
combination as a percentage of the comparable Age Group total for all Genders (e.g., Females represent X percent of the
Marketplace Plan selections for persons between the ages of 18 and 34).
(6) The subtotals for each metal tier type do not sum to the total number due to a small number of individuals (0.1%) who have
multiple 2016 Marketplace plan selections in the system that will be resolved through data cleanup processes. Data for stand-
alone dental plan selections are shown separately in this section, but are not included in any of the other metrics in this table.
Source: Centers for Medicare & Medicaid Services, as of 3-8-16.
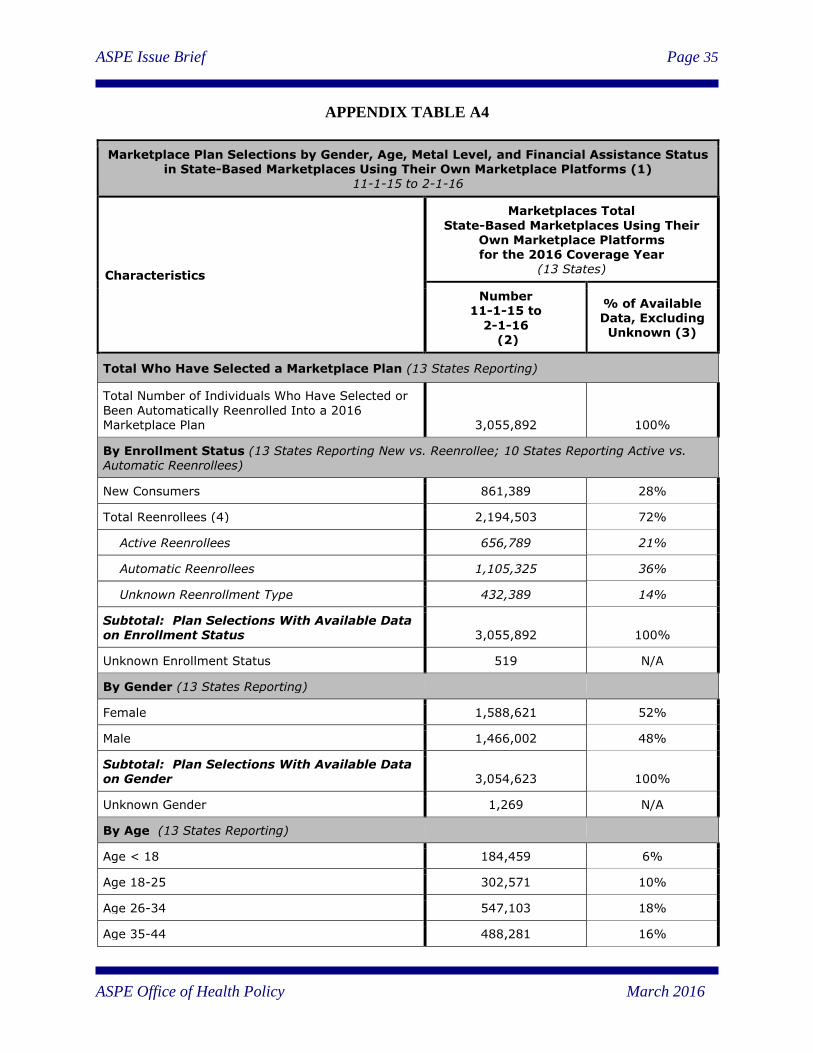
ASPE Issue Brief Page 35
ASPE Office of Health Policy March 2016
APPENDIX TABLE A4
Marketplace Plan Selections by Gender, Age, Metal Level, and Financial Assistance Status in State-Based Marketplaces Using Their Own Marketplace Platforms (1)
11-1-15 to 2-1-16
Characteristics
Marketplaces Total
State-Based Marketplaces Using Their Own Marketplace Platforms for the 2016 Coverage Year
(13 States)
Number 11-1-15 to
2-1-16 (2)
% of Available Data, Excluding Unknown (3)
Total Who Have Selected a Marketplace Plan (13 States Reporting)
Total Number of Individuals Who Have Selected or
Been Automatically Reenrolled Into a 2016 Marketplace Plan 3,055,892 100%
By Enrollment Status (13 States Reporting New vs. Reenrollee; 10 States Reporting Active vs. Automatic Reenrollees)
New Consumers 861,389 28%
Total Reenrollees (4) 2,194,503 72%
Active Reenrollees 656,789 21%
Automatic Reenrollees 1,105,325 36%
Unknown Reenrollment Type 432,389 14%
Subtotal: Plan Selections With Available Data on Enrollment Status 3,055,892 100%
Unknown Enrollment Status 519 N/A
By Gender (13 States Reporting)
Female 1,588,621 52%
Male 1,466,002 48%
Subtotal: Plan Selections With Available Data on Gender 3,054,623 100%
Unknown Gender 1,269 N/A
By Age (13 States Reporting)
Age < 18 184,459 6%
Age 18-25 302,571 10%
Age 26-34 547,103 18%
Age 35-44 488,281 16%
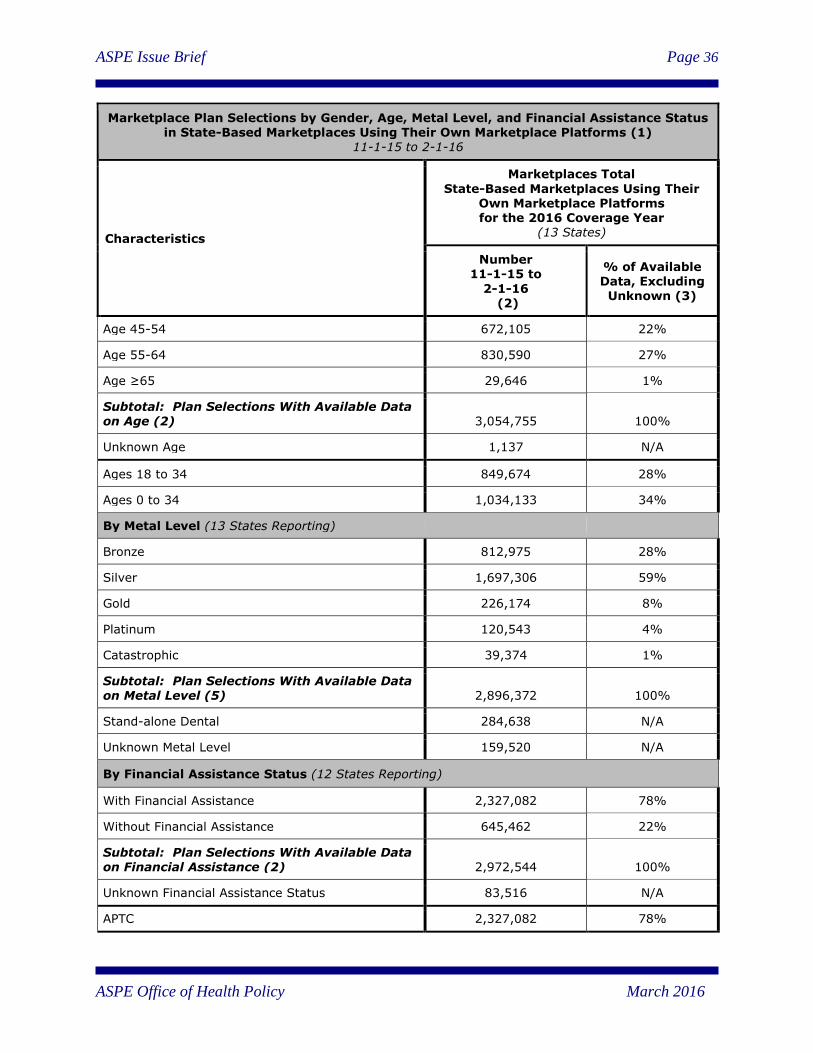
ASPE Issue Brief Page 36
ASPE Office of Health Policy March 2016
Marketplace Plan Selections by Gender, Age, Metal Level, and Financial Assistance Status in State-Based Marketplaces Using Their Own Marketplace Platforms (1)
11-1-15 to 2-1-16
Characteristics
Marketplaces Total
State-Based Marketplaces Using Their Own Marketplace Platforms for the 2016 Coverage Year
(13 States)
Number 11-1-15 to
2-1-16 (2)
% of Available Data, Excluding Unknown (3)
Age 45-54 672,105 22%
Age 55-64 830,590 27%
Age ≥65 29,646 1%
Subtotal: Plan Selections With Available Data on Age (2) 3,054,755 100%
Unknown Age 1,137 N/A
Ages 18 to 34 849,674 28%
Ages 0 to 34 1,034,133 34%
By Metal Level (13 States Reporting)
Bronze 812,975 28%
Silver 1,697,306 59%
Gold 226,174 8%
Platinum 120,543 4%
Catastrophic 39,374 1%
Subtotal: Plan Selections With Available Data on Metal Level (5) 2,896,372 100%
Stand-alone Dental 284,638 N/A
Unknown Metal Level 159,520 N/A
By Financial Assistance Status (12 States Reporting)
With Financial Assistance 2,327,082 78%
Without Financial Assistance 645,462 22%
Subtotal: Plan Selections With Available Data on Financial Assistance (2) 2,972,544 100%
Unknown Financial Assistance Status 83,516 N/A
APTC 2,327,082 78%
ASPE Issue Brief Page 37
ASPE Office of Health Policy March 2016
Notes:
Percentages in this table have been rounded. Some numbers may not add to totals due to rounding.
(1) Unless otherwise noted, the data in this table represent cumulative data on the number of unique individuals who have been
determined eligible to enroll in a Marketplace plan, and have selected or been automatically reenrolled into a Marketplace
medical plan (with or without the first premium payment having been received by the issuer). Individuals who have cancelled or
terminated their Marketplace plans are not included in the total number of plan selections for all but two states (Minnesota and
DC). These data also do not include: stand-alone dental plan selections; or individuals who may have selected a 2015
Marketplace plan during the reporting period, as a result of having been eligible for a Special Enrollment Period (SEP). For
additional technical notes, please refer to the Addendum of this report.
(2) For each metric, the data represent the total number of “Individuals Applying for 2016 Coverage in Completed Applications”
who have selected a 2016 medical Marketplace plan for enrollment through the Marketplace (with or without the first premium
payment having been received directly by the issuer) during the reference period, excluding plan selections with unknown data
for a given metric. This is also known as pre-effectuated enrollment, because enrollment is not considered effectuated until the
first premium payment is made, and this figure includes plan selections for which enrollment has not yet been effectuated. Most
of the data in this table are for the 11-1-15 to 2-1-16 reporting period with the following exception: the data for 9 SBMs using
their own Marketplace platforms are for the 11-1-15 to 1-31-16 reporting period.
(3) In some cases, the data for certain characteristics of Marketplace plan selections are not yet available. For this reason, for
each metric, we have calculated the comparable percentages based on the number of plan selections with known data for that
metric.
(4) The number of active reenrollees and automatic reenrollees may not add to the total number of reenrollees due to some SBM
plan selections with missing data.
(5) The subtotals for each metal tier type do not sum to the total number partially due to a small number of individuals who have
multiple 2016 Marketplace plan selections in the system that will be resolved through data cleanup processes, but primarily due
to Massachusetts counting 158,512 individuals enrolled in its Connector Care Program as unknowns. Connector Care plans are
closest to Silver plans, but their actuarial value is higher than that of a Silver Plan. Data for stand-alone dental plan selections are
shown in this section, but are not included in any of the other metrics in this report.
Source: Centers for Medicare & Medicaid Services, as of 3-8-16.
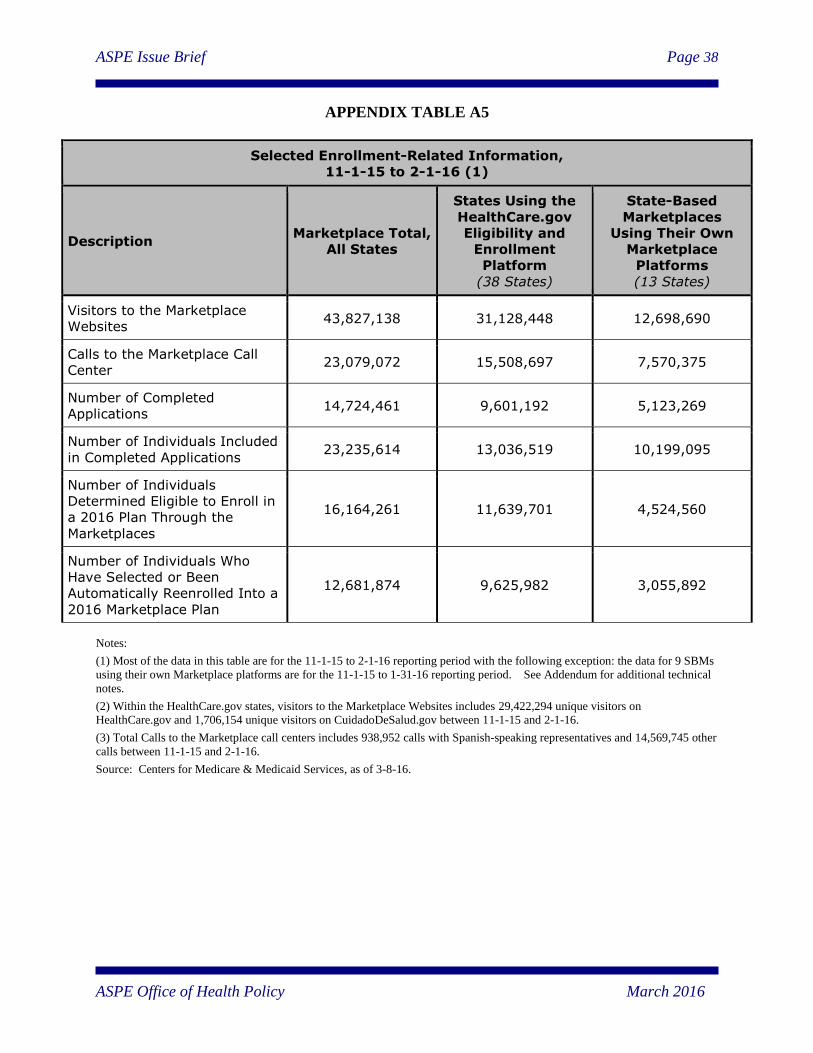
ASPE Issue Brief Page 38
ASPE Office of Health Policy March 2016
APPENDIX TABLE A5
Selected Enrollment-Related Information,
11-1-15 to 2-1-16 (1)
Description Marketplace Total,
All States
States Using the
HealthCare.gov
Eligibility and
Enrollment
Platform
(38 States)
State-Based
Marketplaces
Using Their Own
Marketplace
Platforms
(13 States)
Visitors to the Marketplace
Websites 43,827,138 31,128,448 12,698,690
Calls to the Marketplace Call
Center 23,079,072 15,508,697 7,570,375
Number of Completed
Applications 14,724,461 9,601,192 5,123,269
Number of Individuals Included
in Completed Applications 23,235,614 13,036,519 10,199,095
Number of Individuals
Determined Eligible to Enroll in
a 2016 Plan Through the
Marketplaces
16,164,261 11,639,701 4,524,560
Number of Individuals Who
Have Selected or Been
Automatically Reenrolled Into a
2016 Marketplace Plan
12,681,874 9,625,982 3,055,892
Notes:
(1) Most of the data in this table are for the 11-1-15 to 2-1-16 reporting period with the following exception: the data for 9 SBMs
using their own Marketplace platforms are for the 11-1-15 to 1-31-16 reporting period. See Addendum for additional technical
notes.
(2) Within the HealthCare.gov states, visitors to the Marketplace Websites includes 29,422,294 unique visitors on
HealthCare.gov and 1,706,154 unique visitors on CuidadoDeSalud.gov between 11-1-15 and 2-1-16.
(3) Total Calls to the Marketplace call centers includes 938,952 calls with Spanish-speaking representatives and 14,569,745 other
calls between 11-1-15 and 2-1-16.
Source: Centers for Medicare & Medicaid Services, as of 3-8-16.
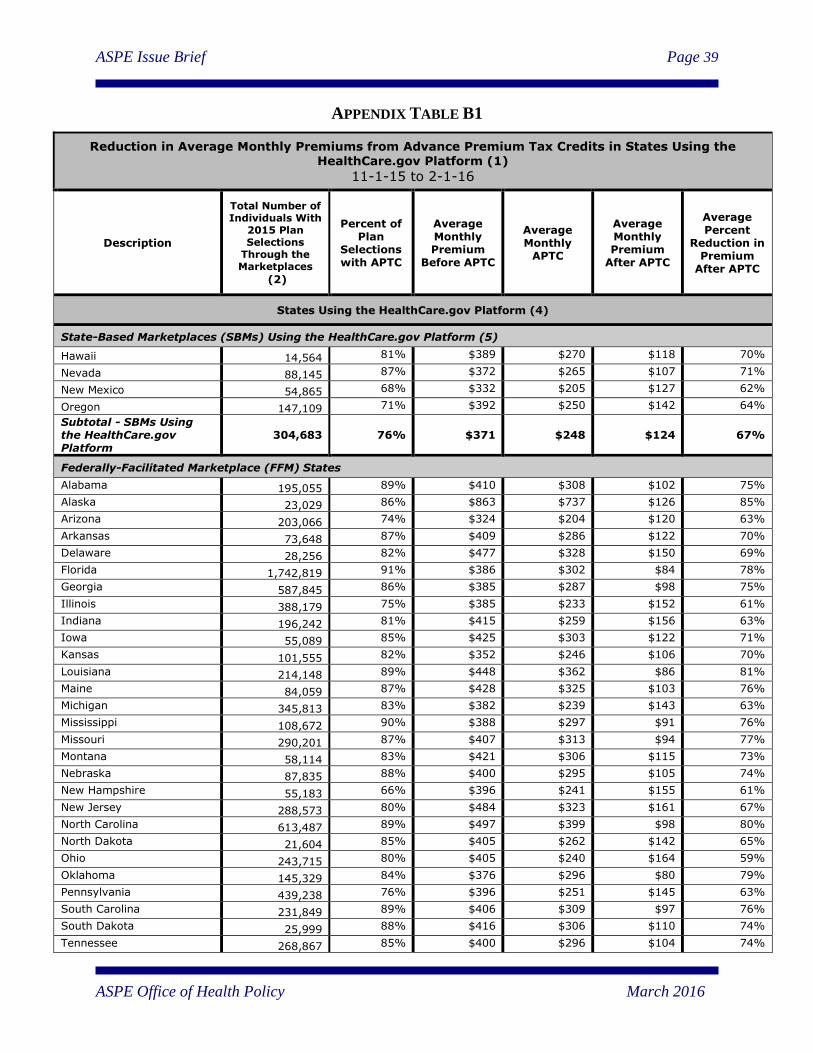
ASPE Issue Brief Page 39
ASPE Office of Health Policy March 2016
APPENDIX TABLE B1
Reduction in Average Monthly Premiums from Advance Premium Tax Credits in States Using the HealthCare.gov Platform (1)
11-1-15 to 2-1-16
Description
Total Number of Individuals With
2015 Plan Selections
Through the Marketplaces
(2)
Percent of Plan
Selections with APTC
Average Monthly Premium
Before APTC
Average Monthly
APTC
Average Monthly Premium
After APTC
Average Percent
Reduction in Premium
After APTC
States Using the HealthCare.gov Platform (4)
State-Based Marketplaces (SBMs) Using the HealthCare.gov Platform (5)
Hawaii 14,564 81% $389 $270 $118 70%
Nevada 88,145 87% $372 $265 $107 71%
New Mexico 54,865 68% $332 $205 $127 62%
Oregon 147,109 71% $392 $250 $142 64%
Subtotal - SBMs Using the HealthCare.gov Platform
304,683 76% $371 $248 $124 67%
Federally-Facilitated Marketplace (FFM) States
Alabama 195,055 89% $410 $308 $102 75%
Alaska 23,029 86% $863 $737 $126 85%
Arizona 203,066 74% $324 $204 $120 63%
Arkansas 73,648 87% $409 $286 $122 70%
Delaware 28,256 82% $477 $328 $150 69%
Florida 1,742,819 91% $386 $302 $84 78%
Georgia 587,845 86% $385 $287 $98 75%
Illinois 388,179 75% $385 $233 $152 61%
Indiana 196,242 81% $415 $259 $156 63%
Iowa 55,089 85% $425 $303 $122 71%
Kansas 101,555 82% $352 $246 $106 70%
Louisiana 214,148 89% $448 $362 $86 81%
Maine 84,059 87% $428 $325 $103 76%
Michigan 345,813 83% $382 $239 $143 63%
Mississippi 108,672 90% $388 $297 $91 76%
Missouri 290,201 87% $407 $313 $94 77%
Montana 58,114 83% $421 $306 $115 73%
Nebraska 87,835 88% $400 $295 $105 74%
New Hampshire 55,183 66% $396 $241 $155 61%
New Jersey 288,573 80% $484 $323 $161 67%
North Carolina 613,487 89% $497 $399 $98 80%
North Dakota 21,604 85% $405 $262 $142 65%
Ohio 243,715 80% $405 $240 $164 59%
Oklahoma 145,329 84% $376 $296 $80 79%
Pennsylvania 439,238 76% $396 $251 $145 63%
South Carolina 231,849 89% $406 $309 $97 76%
South Dakota 25,999 88% $416 $306 $110 74%
Tennessee 268,867 85% $400 $296 $104 74%
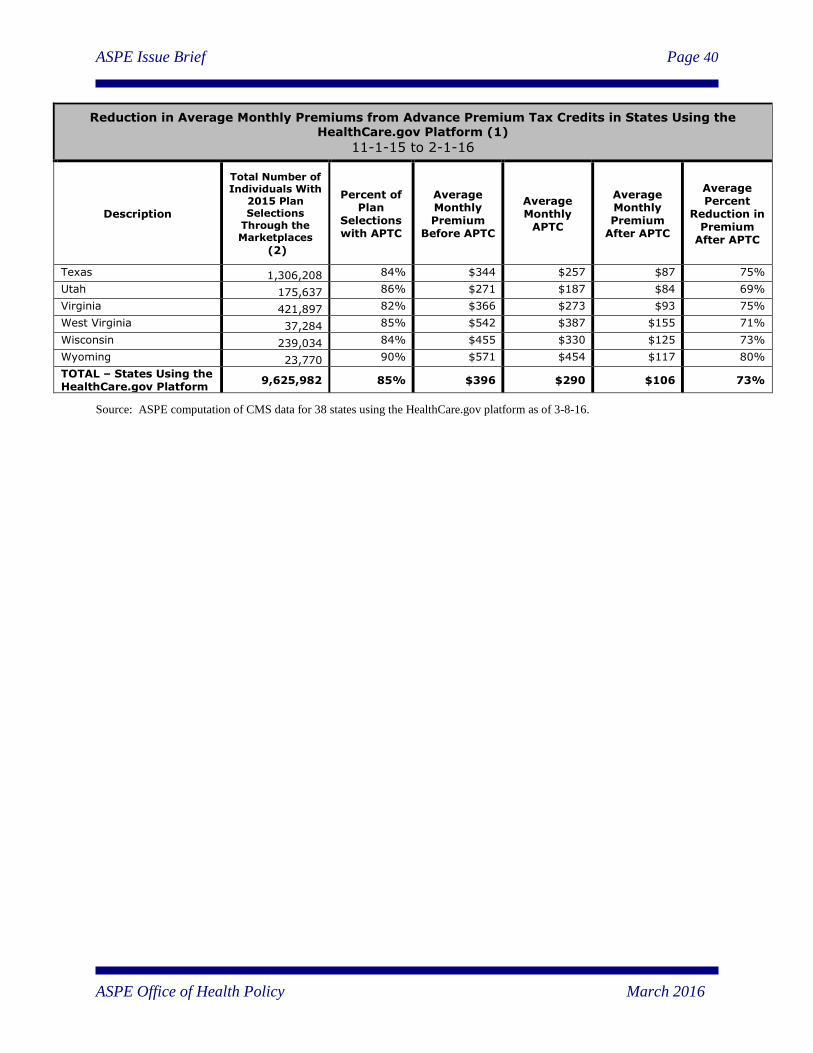
ASPE Issue Brief Page 40
ASPE Office of Health Policy March 2016
Reduction in Average Monthly Premiums from Advance Premium Tax Credits in States Using the HealthCare.gov Platform (1)
11-1-15 to 2-1-16
Description
Total Number of Individuals With
2015 Plan Selections
Through the Marketplaces
(2)
Percent of Plan
Selections with APTC
Average Monthly Premium
Before APTC
Average Monthly
APTC
Average Monthly Premium
After APTC
Average Percent
Reduction in Premium
After APTC
Texas 1,306,208 84% $344 $257 $87 75%
Utah 175,637 86% $271 $187 $84 69%
Virginia 421,897 82% $366 $273 $93 75%
West Virginia 37,284 85% $542 $387 $155 71%
Wisconsin 239,034 84% $455 $330 $125 73%
Wyoming 23,770 90% $571 $454 $117 80%
TOTAL – States Using the HealthCare.gov Platform
9,625,982 85% $396 $290 $106 73%
Source: ASPE computation of CMS data for 38 states using the HealthCare.gov platform as of 3-8-16.
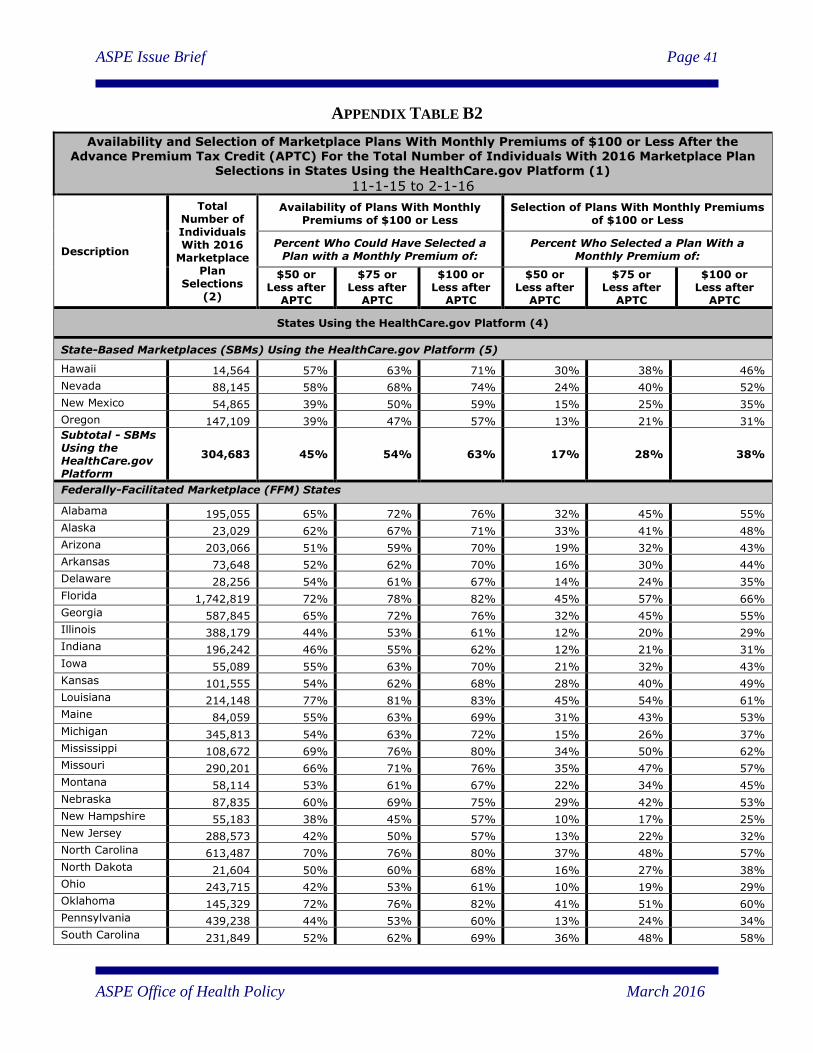
ASPE Issue Brief Page 41
ASPE Office of Health Policy March 2016
APPENDIX TABLE B2
Availability and Selection of Marketplace Plans With Monthly Premiums of $100 or Less After the Advance Premium Tax Credit (APTC) For the Total Number of Individuals With 2016 Marketplace Plan
Selections in States Using the HealthCare.gov Platform (1)
11-1-15 to 2-1-16
Description
Total Number of Individuals With 2016
Marketplace Plan
Selections (2)
Availability of Plans With Monthly Premiums of $100 or Less
Selection of Plans With Monthly Premiums of $100 or Less
Percent Who Could Have Selected a Plan with a Monthly Premium of:
Percent Who Selected a Plan With a Monthly Premium of:
$50 or Less after
APTC
$75 or Less after
APTC
$100 or Less after
APTC
$50 or Less after
APTC
$75 or Less after
APTC
$100 or Less after
APTC
States Using the HealthCare.gov Platform (4)
State-Based Marketplaces (SBMs) Using the HealthCare.gov Platform (5)
Hawaii 14,564 57% 63% 71% 30% 38% 46%
Nevada 88,145 58% 68% 74% 24% 40% 52%
New Mexico 54,865 39% 50% 59% 15% 25% 35%
Oregon 147,109 39% 47% 57% 13% 21% 31%
Subtotal - SBMs Using the HealthCare.gov Platform
304,683 45% 54% 63% 17% 28% 38%
Federally-Facilitated Marketplace (FFM) States
Alabama 195,055 65% 72% 76% 32% 45% 55%
Alaska 23,029 62% 67% 71% 33% 41% 48%
Arizona 203,066 51% 59% 70% 19% 32% 43%
Arkansas 73,648 52% 62% 70% 16% 30% 44%
Delaware 28,256 54% 61% 67% 14% 24% 35%
Florida 1,742,819 72% 78% 82% 45% 57% 66%
Georgia 587,845 65% 72% 76% 32% 45% 55%
Illinois 388,179 44% 53% 61% 12% 20% 29%
Indiana 196,242 46% 55% 62% 12% 21% 31%
Iowa 55,089 55% 63% 70% 21% 32% 43%
Kansas 101,555 54% 62% 68% 28% 40% 49%
Louisiana 214,148 77% 81% 83% 45% 54% 61%
Maine 84,059 55% 63% 69% 31% 43% 53%
Michigan 345,813 54% 63% 72% 15% 26% 37%
Mississippi 108,672 69% 76% 80% 34% 50% 62%
Missouri 290,201 66% 71% 76% 35% 47% 57%
Montana 58,114 53% 61% 67% 22% 34% 45%
Nebraska 87,835 60% 69% 75% 29% 42% 53%
New Hampshire 55,183 38% 45% 57% 10% 17% 25%
New Jersey 288,573 42% 50% 57% 13% 22% 32%
North Carolina 613,487 70% 76% 80% 37% 48% 57%
North Dakota 21,604 50% 60% 68% 16% 27% 38%
Ohio 243,715 42% 53% 61% 10% 19% 29%
Oklahoma 145,329 72% 76% 82% 41% 51% 60%
Pennsylvania 439,238 44% 53% 60% 13% 24% 34%
South Carolina 231,849 52% 62% 69% 36% 48% 58%
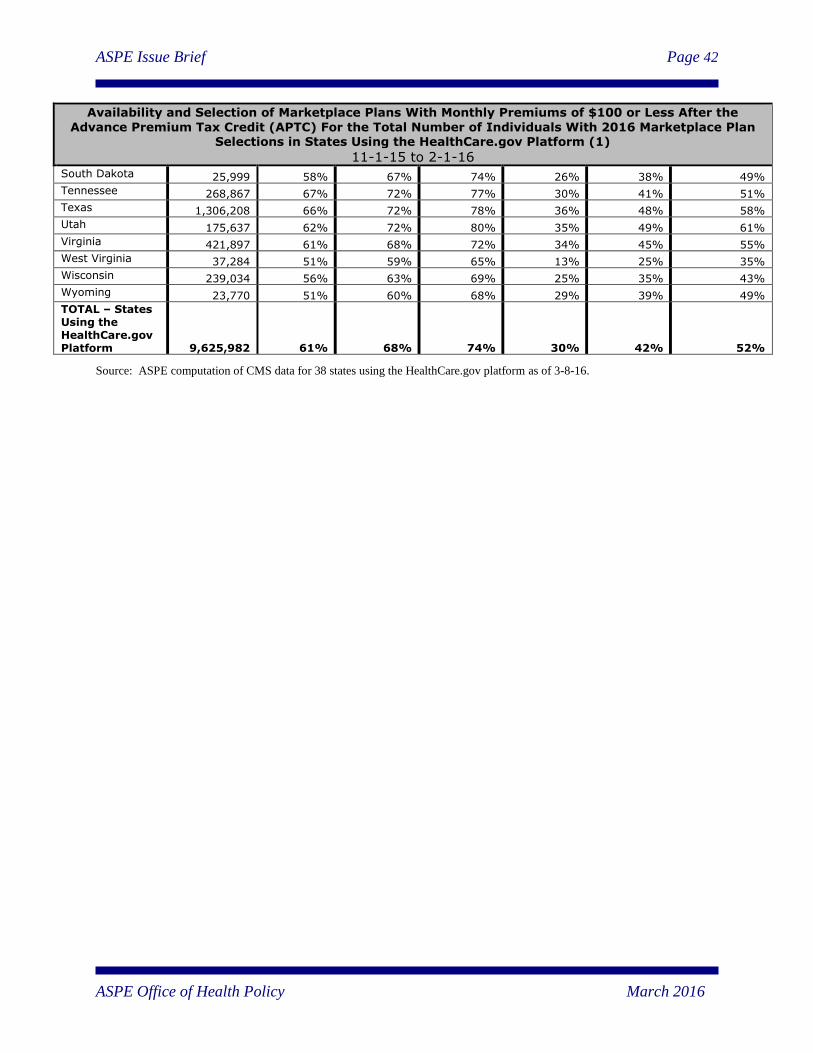
ASPE Issue Brief Page 42
ASPE Office of Health Policy March 2016
Availability and Selection of Marketplace Plans With Monthly Premiums of $100 or Less After the
Advance Premium Tax Credit (APTC) For the Total Number of Individuals With 2016 Marketplace Plan Selections in States Using the HealthCare.gov Platform (1)
11-1-15 to 2-1-16
South Dakota 25,999 58% 67% 74% 26% 38% 49%
Tennessee 268,867 67% 72% 77% 30% 41% 51%
Texas 1,306,208 66% 72% 78% 36% 48% 58%
Utah 175,637 62% 72% 80% 35% 49% 61%
Virginia 421,897 61% 68% 72% 34% 45% 55%
West Virginia 37,284 51% 59% 65% 13% 25% 35%
Wisconsin 239,034 56% 63% 69% 25% 35% 43%
Wyoming 23,770 51% 60% 68% 29% 39% 49%
TOTAL – States Using the HealthCare.gov Platform 9,625,982 61% 68% 74% 30% 42% 52%
Source: ASPE computation of CMS data for 38 states using the HealthCare.gov platform as of 3-8-16.
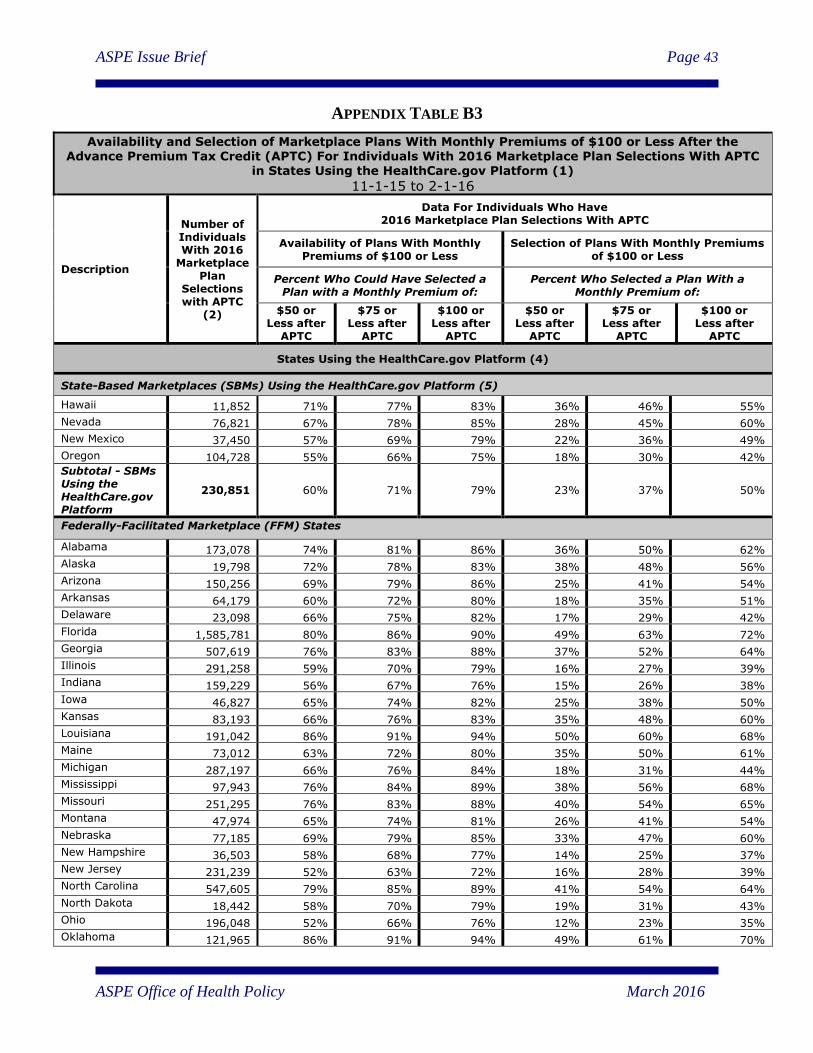
ASPE Issue Brief Page 43
ASPE Office of Health Policy March 2016
APPENDIX TABLE B3
Availability and Selection of Marketplace Plans With Monthly Premiums of $100 or Less After the Advance Premium Tax Credit (APTC) For Individuals With 2016 Marketplace Plan Selections With APTC
in States Using the HealthCare.gov Platform (1)
11-1-15 to 2-1-16
Description
Number of Individuals With 2016
Marketplace Plan
Selections with APTC
(2)
Data For Individuals Who Have 2016 Marketplace Plan Selections With APTC
Availability of Plans With Monthly Premiums of $100 or Less
Selection of Plans With Monthly Premiums of $100 or Less
Percent Who Could Have Selected a Plan with a Monthly Premium of:
Percent Who Selected a Plan With a Monthly Premium of:
$50 or Less after
APTC
$75 or Less after
APTC
$100 or Less after
APTC
$50 or Less after
APTC
$75 or Less after
APTC
$100 or Less after
APTC
States Using the HealthCare.gov Platform (4)
State-Based Marketplaces (SBMs) Using the HealthCare.gov Platform (5)
Hawaii 11,852 71% 77% 83% 36% 46% 55%
Nevada 76,821 67% 78% 85% 28% 45% 60%
New Mexico 37,450 57% 69% 79% 22% 36% 49%
Oregon 104,728 55% 66% 75% 18% 30% 42%
Subtotal - SBMs Using the HealthCare.gov Platform
230,851 60% 71% 79% 23% 37% 50%
Federally-Facilitated Marketplace (FFM) States
Alabama 173,078 74% 81% 86% 36% 50% 62%
Alaska 19,798 72% 78% 83% 38% 48% 56%
Arizona 150,256 69% 79% 86% 25% 41% 54%
Arkansas 64,179 60% 72% 80% 18% 35% 51%
Delaware 23,098 66% 75% 82% 17% 29% 42%
Florida 1,585,781 80% 86% 90% 49% 63% 72%
Georgia 507,619 76% 83% 88% 37% 52% 64%
Illinois 291,258 59% 70% 79% 16% 27% 39%
Indiana 159,229 56% 67% 76% 15% 26% 38%
Iowa 46,827 65% 74% 82% 25% 38% 50%
Kansas 83,193 66% 76% 83% 35% 48% 60%
Louisiana 191,042 86% 91% 94% 50% 60% 68%
Maine 73,012 63% 72% 80% 35% 50% 61%
Michigan 287,197 66% 76% 84% 18% 31% 44%
Mississippi 97,943 76% 84% 89% 38% 56% 68%
Missouri 251,295 76% 83% 88% 40% 54% 65%
Montana 47,974 65% 74% 81% 26% 41% 54%
Nebraska 77,185 69% 79% 85% 33% 47% 60%
New Hampshire 36,503 58% 68% 77% 14% 25% 37%
New Jersey 231,239 52% 63% 72% 16% 28% 39%
North Carolina 547,605 79% 85% 89% 41% 54% 64%
North Dakota 18,442 58% 70% 79% 19% 31% 43%
Ohio 196,048 52% 66% 76% 12% 23% 35%
Oklahoma 121,965 86% 91% 94% 49% 61% 70%
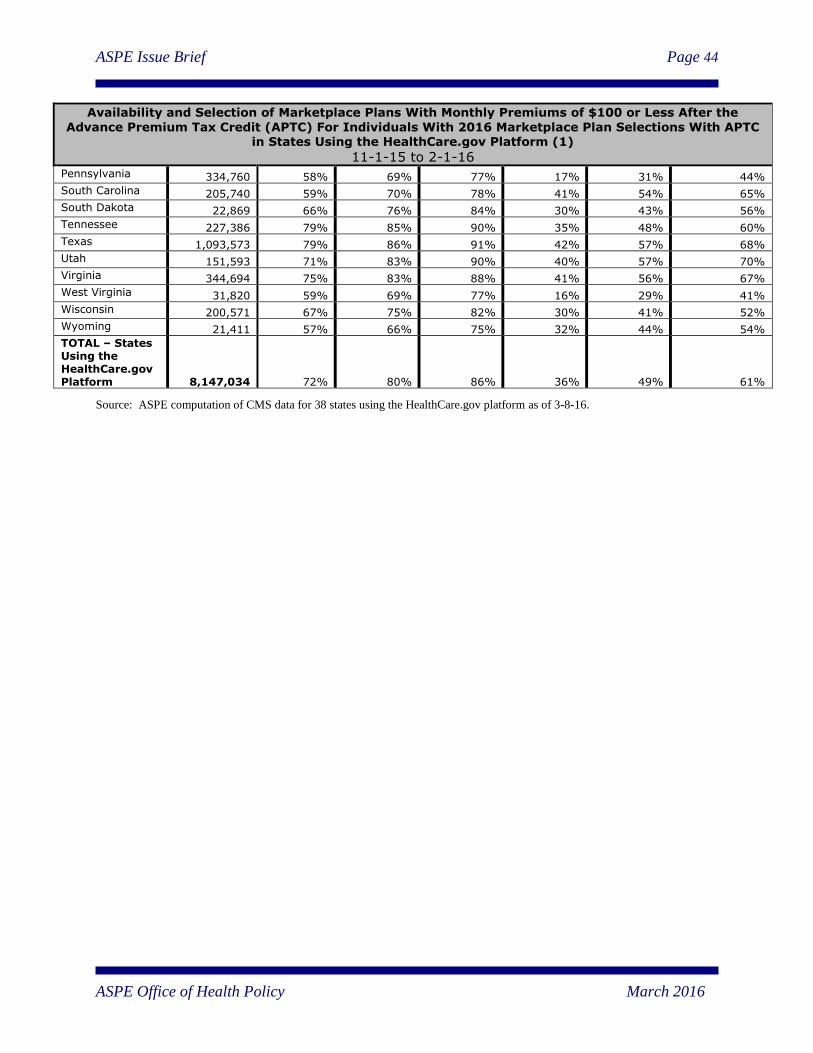
ASPE Issue Brief Page 44
ASPE Office of Health Policy March 2016
Availability and Selection of Marketplace Plans With Monthly Premiums of $100 or Less After the
Advance Premium Tax Credit (APTC) For Individuals With 2016 Marketplace Plan Selections With APTC in States Using the HealthCare.gov Platform (1)
11-1-15 to 2-1-16
Pennsylvania 334,760 58% 69% 77% 17% 31% 44%
South Carolina 205,740 59% 70% 78% 41% 54% 65%
South Dakota 22,869 66% 76% 84% 30% 43% 56%
Tennessee 227,386 79% 85% 90% 35% 48% 60%
Texas 1,093,573 79% 86% 91% 42% 57% 68%
Utah 151,593 71% 83% 90% 40% 57% 70%
Virginia 344,694 75% 83% 88% 41% 56% 67%
West Virginia 31,820 59% 69% 77% 16% 29% 41%
Wisconsin 200,571 67% 75% 82% 30% 41% 52%
Wyoming 21,411 57% 66% 75% 32% 44% 54%
TOTAL – States Using the HealthCare.gov Platform 8,147,034 72% 80% 86% 36% 49% 61%
Source: ASPE computation of CMS data for 38 states using the HealthCare.gov platform as of 3-8-16.
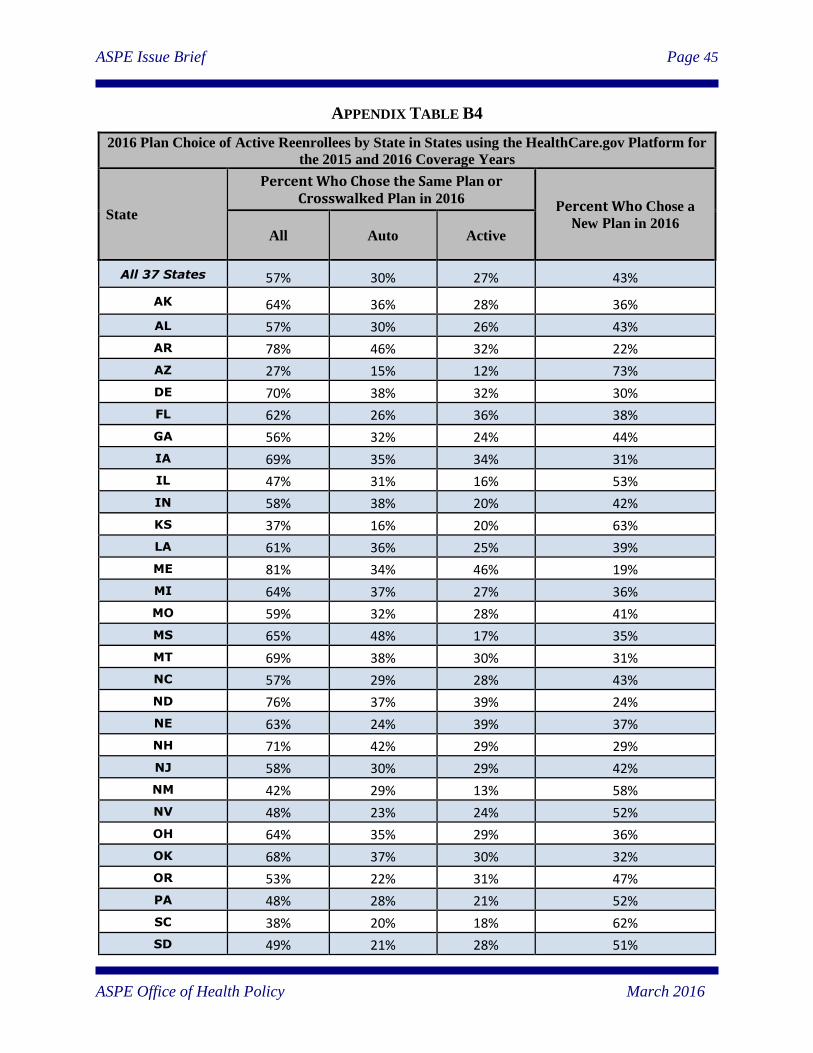
ASPE Issue Brief Page 45
ASPE Office of Health Policy March 2016
APPENDIX TABLE B4
2016 Plan Choice of Active Reenrollees by State in States using the HealthCare.gov Platform for
the 2015 and 2016 Coverage Years
State
Percent Who Chose the Same Plan or Crosswalked Plan in 2016
Percent Who Chose a
New Plan in 2016 All Auto Active
All 37 States 57% 30% 27% 43%
AK 64% 36% 28% 36%
AL 57% 30% 26% 43%
AR 78% 46% 32% 22%
AZ 27% 15% 12% 73%
DE 70% 38% 32% 30%
FL 62% 26% 36% 38%
GA 56% 32% 24% 44%
IA 69% 35% 34% 31%
IL 47% 31% 16% 53%
IN 58% 38% 20% 42%
KS 37% 16% 20% 63%
LA 61% 36% 25% 39%
ME 81% 34% 46% 19%
MI 64% 37% 27% 36%
MO 59% 32% 28% 41%
MS 65% 48% 17% 35%
MT 69% 38% 30% 31%
NC 57% 29% 28% 43%
ND 76% 37% 39% 24%
NE 63% 24% 39% 37%
NH 71% 42% 29% 29%
NJ 58% 30% 29% 42%
NM 42% 29% 13% 58%
NV 48% 23% 24% 52%
OH 64% 35% 29% 36%
OK 68% 37% 30% 32%
OR 53% 22% 31% 47%
PA 48% 28% 21% 52%
SC 38% 20% 18% 62%
SD 49% 21% 28% 51%
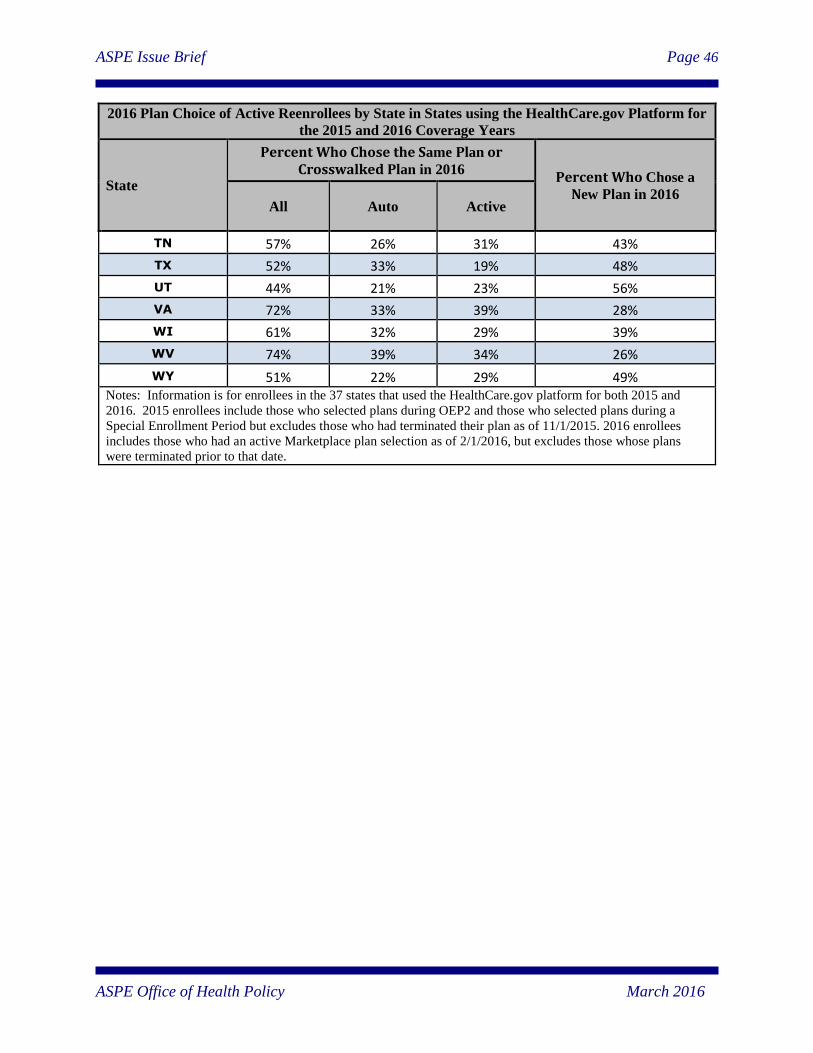
ASPE Issue Brief Page 46
ASPE Office of Health Policy March 2016
2016 Plan Choice of Active Reenrollees by State in States using the HealthCare.gov Platform for
the 2015 and 2016 Coverage Years
State
Percent Who Chose the Same Plan or Crosswalked Plan in 2016
Percent Who Chose a
New Plan in 2016 All Auto Active
TN 57% 26% 31% 43%
TX 52% 33% 19% 48%
UT 44% 21% 23% 56%
VA 72% 33% 39% 28%
WI 61% 32% 29% 39%
WV 74% 39% 34% 26%
WY 51% 22% 29% 49%
Notes: Information is for enrollees in the 37 states that used the HealthCare.gov platform for both 2015 and
2016. 2015 enrollees include those who selected plans during OEP2 and those who selected plans during a
Special Enrollment Period but excludes those who had terminated their plan as of 11/1/2015. 2016 enrollees
includes those who had an active Marketplace plan selection as of 2/1/2016, but excludes those whose plans
were terminated prior to that date.
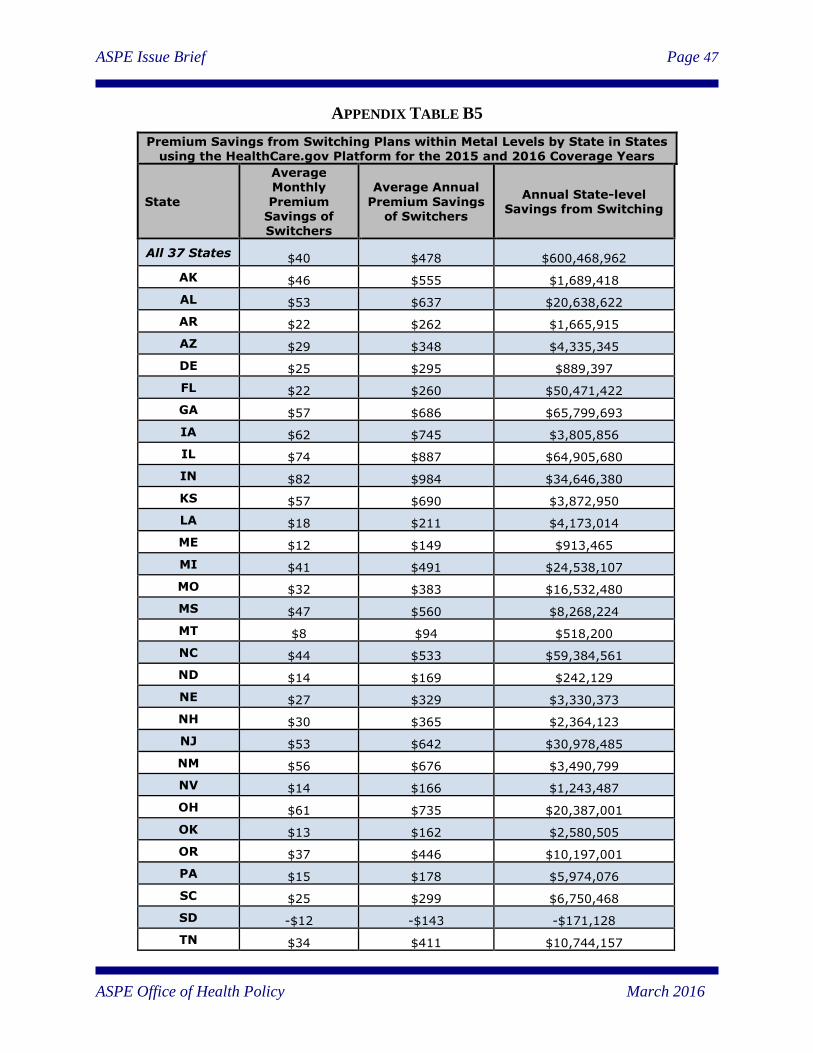
ASPE Issue Brief Page 47
ASPE Office of Health Policy March 2016
APPENDIX TABLE B5
Premium Savings from Switching Plans within Metal Levels by State in States using the HealthCare.gov Platform for the 2015 and 2016 Coverage Years
State
Average Monthly
Premium Savings of Switchers
Average Annual
Premium Savings of Switchers
Annual State-level Savings from Switching
All 37 States $40 $478 $600,468,962
AK $46 $555 $1,689,418
AL $53 $637 $20,638,622
AR $22 $262 $1,665,915
AZ $29 $348 $4,335,345
DE $25 $295 $889,397
FL $22 $260 $50,471,422
GA $57 $686 $65,799,693
IA $62 $745 $3,805,856
IL $74 $887 $64,905,680
IN $82 $984 $34,646,380
KS $57 $690 $3,872,950
LA $18 $211 $4,173,014
ME $12 $149 $913,465
MI $41 $491 $24,538,107
MO $32 $383 $16,532,480
MS $47 $560 $8,268,224
MT $8 $94 $518,200
NC $44 $533 $59,384,561
ND $14 $169 $242,129
NE $27 $329 $3,330,373
NH $30 $365 $2,364,123
NJ $53 $642 $30,978,485
NM $56 $676 $3,490,799
NV $14 $166 $1,243,487
OH $61 $735 $20,387,001
OK $13 $162 $2,580,505
OR $37 $446 $10,197,001
PA $15 $178 $5,974,076
SC $25 $299 $6,750,468
SD -$12 -$143 -$171,128
TN $34 $411 $10,744,157
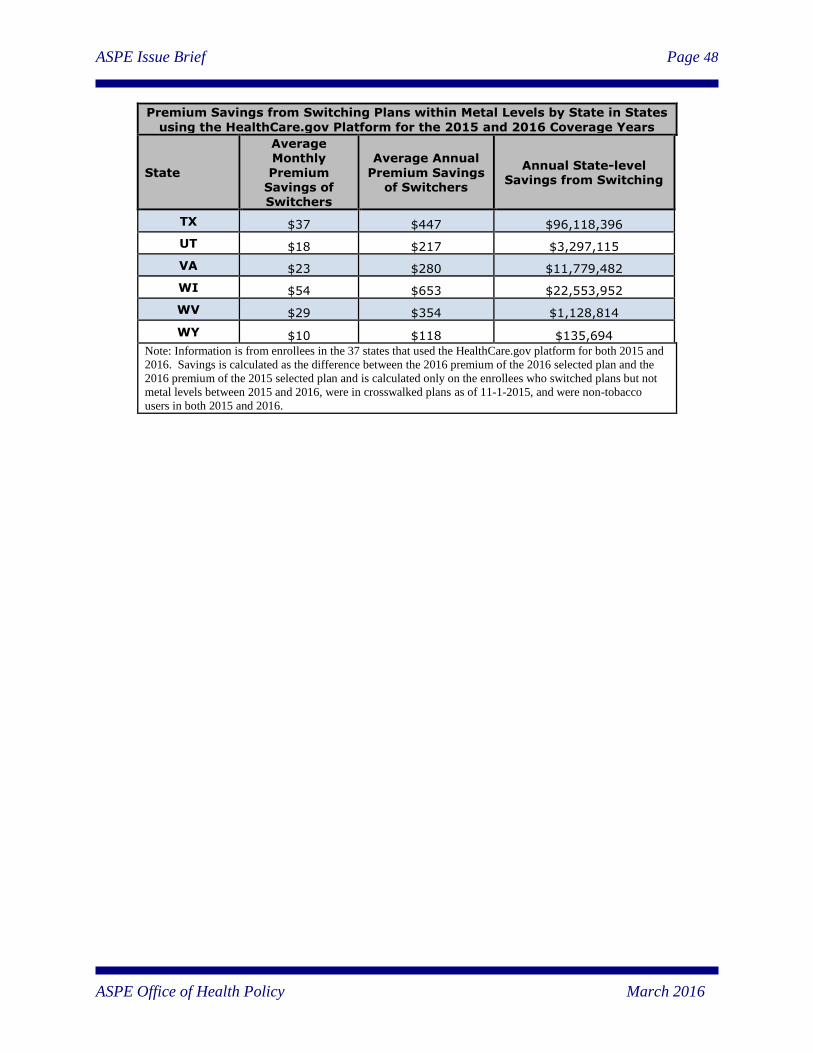
ASPE Issue Brief Page 48
ASPE Office of Health Policy March 2016
Premium Savings from Switching Plans within Metal Levels by State in States
using the HealthCare.gov Platform for the 2015 and 2016 Coverage Years
State
Average Monthly
Premium Savings of Switchers
Average Annual
Premium Savings of Switchers
Annual State-level Savings from Switching
TX $37 $447 $96,118,396
UT $18 $217 $3,297,115
VA $23 $280 $11,779,482
WI $54 $653 $22,553,952
WV $29 $354 $1,128,814
WY $10 $118 $135,694
Note: Information is from enrollees in the 37 states that used the HealthCare.gov platform for both 2015 and
2016. Savings is calculated as the difference between the 2016 premium of the 2016 selected plan and the
2016 premium of the 2015 selected plan and is calculated only on the enrollees who switched plans but not
metal levels between 2015 and 2016, were in crosswalked plans as of 11-1-2015, and were non-tobacco
users in both 2015 and 2016.