Health Indicators and Environmental Factors Related to ... · Health Indicators and Environmental...
98
Health Indicators and Environmental Factors Related to Obesity for Antioch, Bay Point, and Pittsburg Contra Costa Health Services May 2013
Transcript of Health Indicators and Environmental Factors Related to ... · Health Indicators and Environmental...

I
Health Indicators and Environmental Factors Related to Obesity for Antioch, Bay Point, and Pittsburg Contra Costa Health Services May 2013


I
Foreword
Chronic diseases – cancer, heart disease, stroke, and diabetes are the leading causes of preventable morbidity and premature mortality in Contra Costa County and the major drivers of health inequities in our communities. Chronic diseases are linked to income, education and ethnicity; they are more prevalent in areas of poverty, low educational attainment, and communities of color. Obesity is a major risk factor for chronic diseases, along with poor nutrition, lack of physical activity, tobacco use, and drug and alcohol consumption. These risk factors in turn are heavily influenced by social, economic, and environmental conditions that influence behavior.
Individuals certainly need education about healthy behaviors and access to quality medical care. But most chronic diseases cannot be addressed effectively through education or preventive health care alone. Without addressing the social and economic conditions, as well as the physical environment, community attitudes, and social norms that influence community health, behavior change is difficult to sustain and chronic disease risk factors cannot be controlled.
This report examines some of the key social, economic, and physical or built environmental factors related to obesity in Antioch, Bay Point, and Pittsburg- communities in the heart of East Contra Costa. Addressing these factors, and reducing rates of mortality and morbidity from chronic diseases in these areas, will take a collaborative effort between the County Health Department, local governments, community organizations, residents, and foundations.
By helping to frame a broad conversation about health in East County, this report serves as a planning tool for what we hope is a collaborative “call to action” to invest in reducing the injustice of health disparities in Antioch, Bay Point, and Pittsburg.
Wendel Brunner PhD, MD Director of Public HealthContra Costa Health Services

II
Acknowledgements Authors
Tracey Rattray, MSW, MPH
Abigail Kroch, PhD, MPH
Miranda Ritterman-Weintraub, PhD, MPH
Tanya Rovira-Osterwalder, MS
Denise Milosevich, MPH
Contra Costa Health Services
Wendel Brunner, MD, PhD
Healthy East County Steering Committee
Alejandra Plascencia, First 5 Contra Costa
Charlotte Dickson, California Center for Public Health Advocacy
Christy Kaplan, John Muir Health
Coire Reilly, Contra Costa Health Services
Diana Camacho, John Muir Health
Ed Diokno, Supervisor Federal Glover’s Office
Elaine Prendergast, Center for Human Development
Elysia Fong, Pittsburg Unified School District
Estela Cerda, Center for Human Development
Jamie Birch, Center for Human Development
Leandra Turner, Center for Human Development
Marianne Balin, Kaiser Permanente
Mary Jane Kiefer, WIC
Mary Rocha, Brighter Beginnings
Matthew Belasco, Pittsburg Unified School District
Michael Kent, Contra Costa Health Services
Molly Bergstrom, Kaiser Permanente
Nuria Jovel, Center for Human Development
Patricia Dalbey, La Clinica de la Raza
Rhea Laughlin, First 5
Teresa Flores, Contra Costa Interfaith Community Supporting Organization
Tonya Love, Healthy and Active Before 5
Key Informant Interviews
Interviewer - Wendy-Jo Escamilla, Contra Costa Health Services
Participants
Carissa Patague, Heights Elementary School
Debbie Fabriquer, Contra Costa & Solano County Food Bank
Ed Diokno, Supervisor Federal Glover’s Office
Itika Greene, African American Health Collaborative
Kibibi Columbus, Resident
Kitty Lenhart, Contra Costa Childcare Council
Mary Rocha, Brighter Beginnings
Matthew Belasco, Pittsburg Unified School District
Maureen Toms, Department of Conservation & Development
Rebecca Jacobo, Resident
Shannon Ladner-Beasley, CCHS and Resident
Teresa Flores, CCISCO
This report was partially funded by:
Kaiser Permanente
The 2013 Health Indicators and Environmental Factors Related to Obesity for Antioch, Bay Point and Pittsburg Report is available on Contra Costa Health Services website at www.cchealth.org/prevention/ For more information, contact the Community Wellness and Prevention Program at 925-313-6808 or [email protected] (Rev.6.11.13)
III
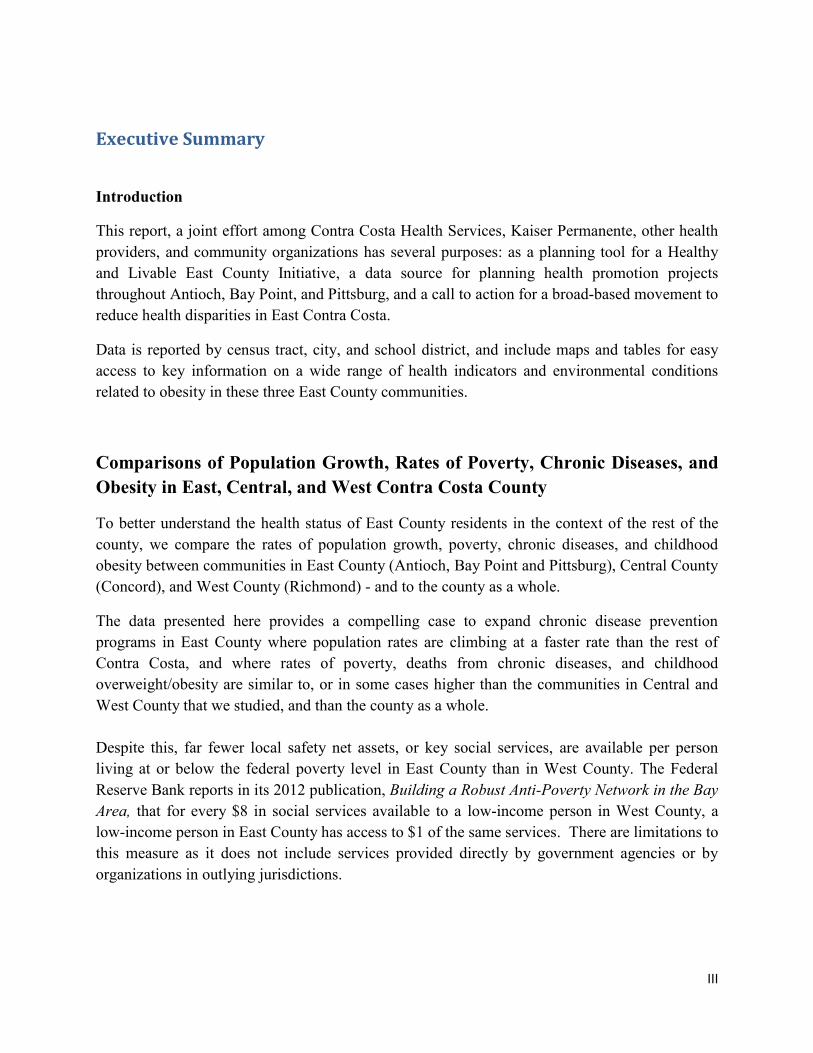
Executive Summary
Introduction
This report, a joint effort among Contra Costa Health Services, Kaiser Permanente, other health providers, and community organizations has several purposes: as a planning tool for a Healthy and Livable East County Initiative, a data source for planning health promotion projects throughout Antioch, Bay Point, and Pittsburg, and a call to action for a broad-based movement to reduce health disparities in East Contra Costa.
Data is reported by census tract, city, and school district, and include maps and tables for easy access to key information on a wide range of health indicators and environmental conditions related to obesity in these three East County communities.
Comparisons of Population Growth, Rates of Poverty, Chronic Diseases, and Obesity in East, Central, and West Contra Costa County
To better understand the health status of East County residents in the context of the rest of the county, we compare the rates of population growth, poverty, chronic diseases, and childhood obesity between communities in East County (Antioch, Bay Point and Pittsburg), Central County (Concord), and West County (Richmond) - and to the county as a whole.
The data presented here provides a compelling case to expand chronic disease prevention programs in East County where population rates are climbing at a faster rate than the rest of Contra Costa, and where rates of poverty, deaths from chronic diseases, and childhood overweight/obesity are similar to, or in some cases higher than the communities in Central and West County that we studied, and than the county as a whole. Despite this, far fewer local safety net assets, or key social services, are available per person living at or below the federal poverty level in East County than in West County. The Federal Reserve Bank reports in its 2012 publication, Building a Robust Anti-Poverty Network in the Bay Area, that for every $8 in social services available to a low-income person in West County, a low-income person in East County has access to $1 of the same services. There are limitations to this measure as it does not include services provided directly by government agencies or by organizations in outlying jurisdictions.

IV
Population Growth
1990 2010 Percent Change
Antioch 62,195 102,745 65%
Bay Point (Formerly W. Pittsburg) 17,453 24,340 39%
Pittsburg 47,564 63,510 34%
Concord 111,348 122,067 10%
Richmond 87,425 103,701 19%
Contra Costa County 803,732 1,052,827 31% U.S. Census Bureau, 1990 and 2010 Decennial Census
Poverty Level
Poverty Rate 2010 (Percent of population at 100% Federal Poverty Rate)
Antioch 12.1%
Bay Point* 31.9%
Pittsburg 16.3%
Concord 9.5%
Richmond 18.3%
U. S. Census Bureau, 2010,* 2009-2011 American Community Survey
Chronic Diseases Mortality Rates
Cancer (all types)
Heart Disease
Stroke Diabetes
Antioch 200.8* 211.1* 56.1 35.1*
Bay Point 130.2 121.7 NA NA
Pittsburg 180.0 181.5* 71.9* 37.0*
Concord 172.4 153.8 51.9 22.2
Richmond 177.7 210.2* 61.5* 32.4*
Contra Costa 162.0 147.5 46.7 18.9
*Significantly higher rate than the county overall. Rates per 100,000 people. Rates of death attributed to chronic diseases in selected Contra Costa communities 2005-2007 (Contra Costa Community Indicators Report 2010).

V
Childhood obesity is definitely a problem in our
community…I can see it with my own eyes
being out in the community. I do see a shift in
kinder and first graders, but kids in middle
school and older you see a prevalence of
obesity. ~Pittsburg Key Informant
Personally, I like the diversity of the population.
I like that you are almost forced to meet people
of other races every day. That means all kinds
of celebrations: different people, different
cultures, and different food! ~Bay Point Key Informant
Childhood Overweight/Obesity Rates
Childhood Overweight/Obese Prevalence
Antioch Unified School District 41.2%
Mount Diablo Unified School District 35.5%
Pittsburg Unified School District 43.7%
West Contra Costa County Unified School District
43.6%
Rates of childhood overweight/obese are from the 2010 Fitnessgram data, by school district. The exam (a required public school student fitness assessment) is conducted annually with 5th, 7th, and 9th graders, with results reported to the California Department of Education. Both Concord and Bay Point are located in the Mt. Diablo Unified School District.
Highlights from Analysis of Health Indicators and Environmental Factors Related to Obesity for Antioch, Bay Point, and Pittsburg
Demographics
The populations of Antioch, Pittsburg, and the unincorporated community of Bay Point have grown at a faster rate than the county overall. In 2010, Antioch had a total population of 102,745, followed by Pittsburg with 63,510 people, and Bay Point at 24,340. These communities have also experienced complex demographic shifts in the past twenty years in race and ethnicity, with a substantial decrease in the non-Hispanic white population in Pittsburg, down by 51%, followed by Bay Point, down 43%, and Antioch, down 24%. The Black population grew most dramatically in Antioch, with a 698% increase, followed by Pittsburg, up 62%, and Bay Point, up 49%. All communities showed significant increases in Hispanic/Latino populations, with Antioch’s increase at 328%, followed by Bay Point at 265%, and Pittsburg with an increase of 141%.

VI
I do not want my kids to walk by
themselves to school. Our community is
getting crowded. There are people even
in our community who are getting
assaulted, you hear things that happen to
kids, and I will not take that chance. ~Antioch Key Informant
Economic Security and Health Service Access
Antioch, Pittsburg, and Bay Point all have census tracts with concentrated poverty, where 48% to 59% of residents live below 200% of the federal poverty level, or have an annual income of less than $21,660 for an individual, or $44,100 for a family of four. Employment rates in these communities are similar to the county overall, with an average 2012 unemployment rate of 25%. All three communities have a higher percentage of people with no health coverage than the county as a whole. In Bay Point, 20% of residents have no health insurance coverage, followed by Pittsburg at 19%, and Antioch at 16%. In the county as a whole, 12% of people don’t have health insurance coverage.
Education and School Environment
Antioch, Pittsburg, and Bay Point each have higher percentages of residents with less than a high school diploma than Contra Costa as a whole. Each community has a higher percentage of residents who have graduated from high school compared to the county overall; but they also have fewer residents with a Bachelor’s degree or above, lowering their overall educational attainment.
Crime and Safety
Violent crimes occur at a much higher rate in Antioch than in Contra Costa as a whole, and property crimes occur at a higher rate in Pittsburg and Antioch than in the county. The rate of reported violent crime (homicide, forcible rape, robbery and aggravated assault) in Antioch is 494.3 per 100,000 residents, followed by rates of 487.2 in Bay Point and 243.4 in Pittsburg.
Food and Nutrition Environment
The Retail Food Environment Index (RFEI), developed by the California Center for Public Health Advocacy, is a ratio of the relative abundance of retail food outlets offering unhealthy food options (fast food restaurants and convenience stores) to those providing healthier food (grocery stores, produce markets, farmers markets). Antioch has the highest RFEI with 7.4, followed by Pittsburg at 7.0, and Bay Point at 1.7. The RFEI is 5.4 in the county as a whole.

VII
They can improve the bike lanes out here.
For example when I’m riding my bike, I
wish there were more bike lanes. There
are a few, but I would like to see that
extended to Willow Pass Road; that is a
very busy street and a very scary ride! ~Pittsburg Key Informant
Physical Activity and Built Environment
Over half of the residents of these three communities live within a quarter mile of a park, with Antioch having the highest percentage at 72.8%, followed by Bay Point at 58.8%, and Pittsburg at 58.0%. According to Walkscore.com data, most public schools in all three regions are rated car-dependent or somewhat walkable. There are lower rates of bicycle and pedestrian injuries in the three regions compared to the county overall. This may be due to lower rates of walking and biking. Most of the population resides within a half mile of a bus stop; a minority living within a half mile of a transit station.
Housing
All three communities have more than fifty percent of residents paying more than 30% of their household income on housing, with some census tracts having as many as 75% of residents paying 30% or more of their income on housing. The most recently available foreclosure data (2007-2008), estimates that 10% of homes in some Antioch and Pittsburg neighborhoods are in foreclosure. The foreclosure crisis has likely attributed to housing instability.
Social Connectivity
All three communities have a lower turnout of registered voters than the county as a whole. Antioch has the highest voter turnout with 52%, followed by Pittsburg at 47.7%, and Bay Point at 37.9%. Neighborhoods with the greatest proportion of linguistically isolated households appear to be concentrated in Bay Point and Pittsburg. In addition, these communities have high rates of resident mobility, with some census tracts where one-third of the population hasn’t lived in the same home for one year.
Key Informant Interviews
The Community Wellness & Prevention Program (CWPP) conducted key informant interviews with selected community members and representatives from various organizations in Antioch, Bay Point, and Pittsburg. Informants identified childhood obesity as a significant health issue in all three communities. Poverty, lack of access to affordable healthy food, poor walkability, the disproportionate availability of fresh produce compared to unhealthy options, and growing violence were identified as contributing to the rising rates of obesity.
VIII
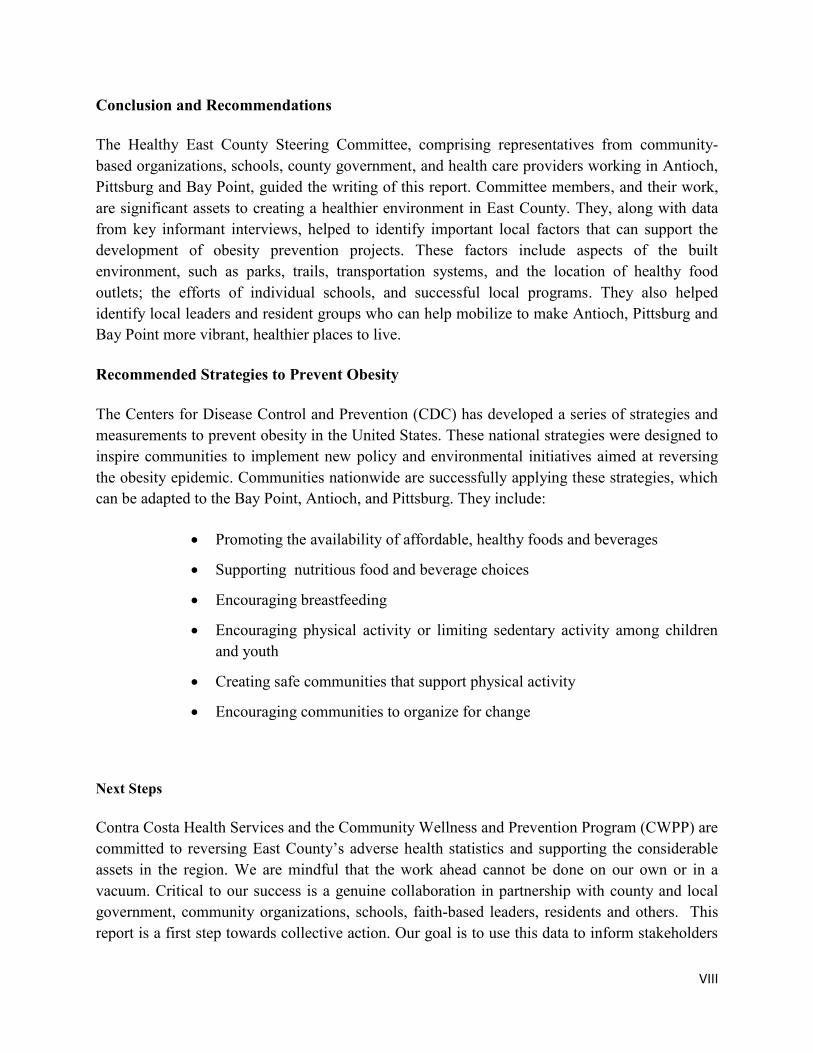
Conclusion and Recommendations
The Healthy East County Steering Committee, comprising representatives from community-based organizations, schools, county government, and health care providers working in Antioch, Pittsburg and Bay Point, guided the writing of this report. Committee members, and their work, are significant assets to creating a healthier environment in East County. They, along with data from key informant interviews, helped to identify important local factors that can support the development of obesity prevention projects. These factors include aspects of the built environment, such as parks, trails, transportation systems, and the location of healthy food outlets; the efforts of individual schools, and successful local programs. They also helped identify local leaders and resident groups who can help mobilize to make Antioch, Pittsburg and Bay Point more vibrant, healthier places to live.
Recommended Strategies to Prevent Obesity
The Centers for Disease Control and Prevention (CDC) has developed a series of strategies and measurements to prevent obesity in the United States. These national strategies were designed to inspire communities to implement new policy and environmental initiatives aimed at reversing the obesity epidemic. Communities nationwide are successfully applying these strategies, which can be adapted to the Bay Point, Antioch, and Pittsburg. They include:
Promoting the availability of affordable, healthy foods and beverages
Supporting nutritious food and beverage choices
Encouraging breastfeeding
Encouraging physical activity or limiting sedentary activity among children and youth
Creating safe communities that support physical activity
Encouraging communities to organize for change
Next Steps
Contra Costa Health Services and the Community Wellness and Prevention Program (CWPP) are committed to reversing East County’s adverse health statistics and supporting the considerable assets in the region. We are mindful that the work ahead cannot be done on our own or in a vacuum. Critical to our success is a genuine collaboration in partnership with county and local government, community organizations, schools, faith-based leaders, residents and others. This report is a first step towards collective action. Our goal is to use this data to inform stakeholders

IX
and stimulate action to reduce rates of obesity and other risk factors for chronic diseases. We hope to bring East County’s health challenges to the attention of the philanthropic community and funders to encourage financial investment in much needed interventions to promote community health in this vital region.
“Reversing the obesity epidemic is a shared responsibility. Social and environmental changes are influenced by the efforts of many. There is a role for everyone in discovering ways to create supportive environments to help individuals and families to easily make healthy food choices, enjoy a physically active lifestyle, and move toward a healthy weight.”
~Centers for Disease Control and Prevention

1
Introduction
Chronic diseases such as heart disease, cancer, stroke, diabetes, and asthma are the leading causes of mortality and morbidity in Contra Costa County and indeed, the rest of the country. Health disparities are evident in rates of chronic disease, with low-income groups and communities of color having disproportionately high rates of death from chronic disease and high rates of individuals living with chronic illnesses. The Community Wellness and Prevention Program (CWPP) of Contra Costa Health Services aims to reduce mortality and morbidity from chronic diseases and injuries by:
Identifying environmental, social, behavioral, and economic factors that influence health and health disparities
Supporting factors that promote community health and reduce health disparities Reducing risk factors that contribute to the leading causes of chronic disease, injury, and
premature death
To meet these aims, CWPP operates several programs to promote good nutrition, physical activity and a healthy built environment and to prevent tobacco use and exposure to second hand smoke, injuries, and lead poisoning. Obesity and tobacco are the two leading preventable causes of chronic diseases and reducing these, as well as other risk factors, requires a range of health promotion strategies. The purpose of this report is to provide data about health indicators and environmental factors that influence obesity and other health conditions in three selected communities of East Contra Costa County – the cities of Antioch and Pittsburg, and the unincorporated community of Bay Point. These communities, the fastest growing in the county, have some of the highest rates of chronic diseases and related health disparities compared to Contra Costa as a whole. This report focuses on health indicators and environmental factors related to obesity, though many of these factors also influence the rates of tobacco use and other risk factors for chronic disease. Obesity, which has been increasing so rapidly throughout the U.S. it’s considered a public health crisis, is linked to heart disease, stroke, cancer, diabetes, and other chronic conditions.
It is not enough to educate individuals about the importance of healthy eating and exercise. Healthcare professionals and their community partners must work to ensure that all people live in environments that support health with access to nutritious, appealing, affordable foods and opportunities for safe and pleasurable outdoor activities such as walking, biking, and playing.
Using the data in this report as a guide, CWPP is expanding its complete range of health promotion and prevention programs to East County. In some cases, CWPP will build on existing

2
efforts. It will also establish new programs in partnership with county and local government, community organizations, schools, faith-based leaders, residents and others.
Specifically, this includes the creation of a Healthy and Livable East County Initiative, in partnership with Kaiser Permanente and other funders. The area’s health indicators, along with information from key informants, as presented in this report, provide valuable insight on the location, planning and implementation of this Initiative.
Health Data Indicators Health indicators for this report were compiled by the Epidemiology, Planning and Evaluation (EPE) Unit of Contra Costa Health Services. The EPE Unit compiles and analyzes data to assist in community and population health assessments and in public health program planning and evaluation. Indicators were selected by the Healthy East County Steering Committee for their relevance to the community and their direct or indirect relationship to obesity and the environmental determinants of health. Each indicator includes a description of what is being measured, an explanation of its importance to health, and a map and/or table that visually illustrates the data in the selected East Contra Costa communities. Throughout this report, a color-coded legend is provided to differentiate between Antioch, Bay Point, and Pittsburg.

3
Table of Contents Foreward ........................................................................................................................................................ I
Acknowledgements ...................................................................................................................................... II
Executive Summary .................................................................................................................................... III
Introduction ................................................................................................................................................... 1
Table of Contents .......................................................................................................................................... 3
A Call to Action: A Comparison of Population Growth and Rates of Poverty, Chronic Disease and Obesity in East, Central, and West County ................................................................................................... 7
Demographics and Baseline Data ............................................................................................................... 11
Geography ............................................................................................................................................... 12
Population ............................................................................................................................................... 13
Population Change .................................................................................................................................. 14
Chart 1: Population change for racial and ethnic groups from 1990-2010 ......................................... 14
Table 1: Population change by race and ethnic category .................................................................... 14
Chart 2: Change in percent of population living below federal poverty level from 1990-2010 ......... 15
Table 2: Percent living in poverty from 1990-2010 ............................................................................ 15
Youth Population .................................................................................................................................... 16
Gender and Age ...................................................................................................................................... 16
Table 3: Population by gender and age ............................................................................................... 16
Race and Ethnicity .................................................................................................................................. 17
Table 4: Population by race and ethnic category ................................................................................ 17
Language ................................................................................................................................................. 18
Table 5: Language spoken at home among population age 5 years and over .................................... 18
Nativity ................................................................................................................................................... 19
Table 6: Population by nativity ........................................................................................................... 19
Education and School Environment ............................................................................................................ 21
Educational Attainment .......................................................................................................................... 22
Table 7: Educational attainment for the population 25 years and older .............................................. 22
Residents 25 Years and Older with Less Than a High School Degree ................................................... 23
Table 8: Dropout rate by school district .............................................................................................. 23
Free or Reduced Price Meals .................................................................................................................. 24
Table 9: Free/reduced meal qualification by school district ............................................................... 25
Poverty and Service Access ........................................................................................................................ 27
4
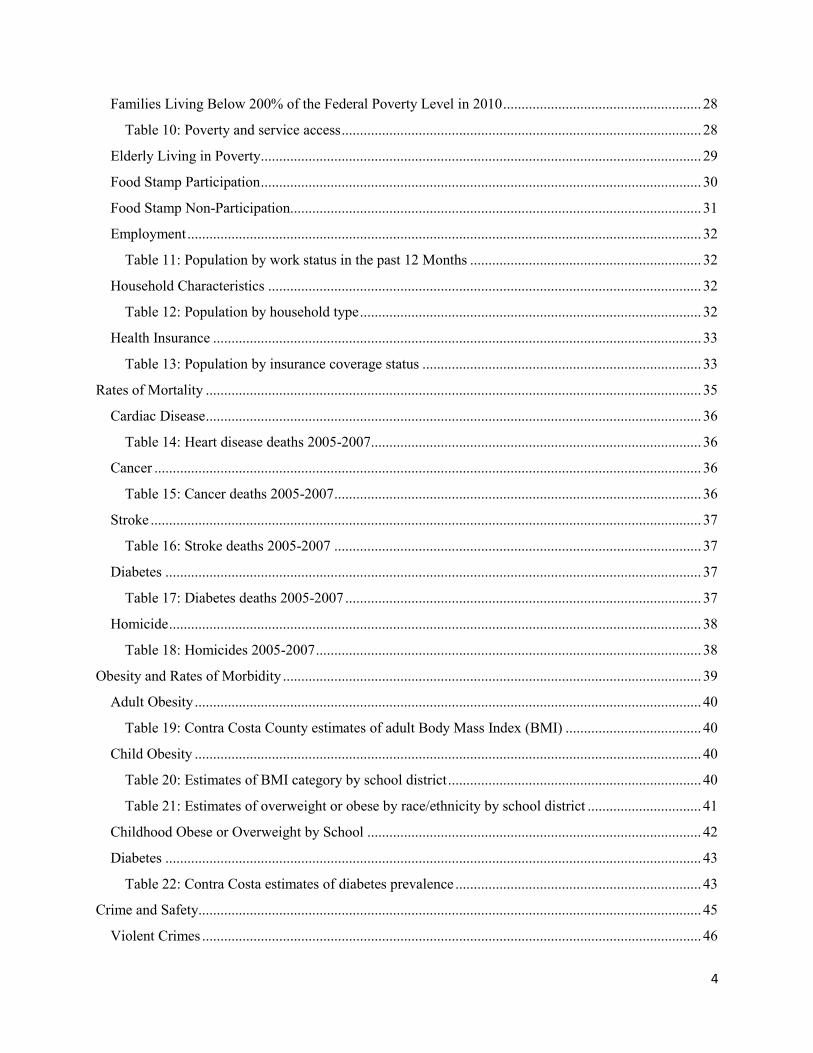
Families Living Below 200% of the Federal Poverty Level in 2010 ...................................................... 28
Table 10: Poverty and service access .................................................................................................. 28
Elderly Living in Poverty ........................................................................................................................ 29
Food Stamp Participation ........................................................................................................................ 30
Food Stamp Non-Participation................................................................................................................ 31
Employment ............................................................................................................................................ 32
Table 11: Population by work status in the past 12 Months ............................................................... 32
Household Characteristics ...................................................................................................................... 32
Table 12: Population by household type ............................................................................................. 32
Health Insurance ..................................................................................................................................... 33
Table 13: Population by insurance coverage status ............................................................................ 33
Rates of Mortality ....................................................................................................................................... 35
Cardiac Disease ....................................................................................................................................... 36
Table 14: Heart disease deaths 2005-2007.......................................................................................... 36
Cancer ..................................................................................................................................................... 36
Table 15: Cancer deaths 2005-2007 .................................................................................................... 36
Stroke ...................................................................................................................................................... 37
Table 16: Stroke deaths 2005-2007 .................................................................................................... 37
Diabetes .................................................................................................................................................. 37
Table 17: Diabetes deaths 2005-2007 ................................................................................................. 37
Homicide ................................................................................................................................................. 38
Table 18: Homicides 2005-2007 ......................................................................................................... 38
Obesity and Rates of Morbidity .................................................................................................................. 39
Adult Obesity .......................................................................................................................................... 40
Table 19: Contra Costa County estimates of adult Body Mass Index (BMI) ..................................... 40
Child Obesity .......................................................................................................................................... 40
Table 20: Estimates of BMI category by school district ..................................................................... 40
Table 21: Estimates of overweight or obese by race/ethnicity by school district ............................... 41
Childhood Obese or Overweight by School ........................................................................................... 42
Diabetes .................................................................................................................................................. 43
Table 22: Contra Costa estimates of diabetes prevalence ................................................................... 43
Crime and Safety......................................................................................................................................... 45
Violent Crimes ........................................................................................................................................ 46

5
Table 23: Violent crimes – 2010 ......................................................................................................... 46
Property Crimes ...................................................................................................................................... 47
Table 24: Property crimes – 2010 ....................................................................................................... 47
Food and Nutrition Environment ................................................................................................................ 49
Sugar Sweetened Beverage Consumption among Adults, Adolescents and Children ............................ 50
Table 25: Contra Costa County estimates of sugary drink consumption ............................................ 50
Fruit and Vegetable Consumption (Adult and Child) ............................................................................. 51
Table 26: Contra Costa County estimates of adult and child consumption of five or more servings of fruits and vegetables ........................................................................................................................... 51
Retail Food Environment ........................................................................................................................ 52
Chart 3: Retail Food Environment ...................................................................................................... 53
Food Insecurity ....................................................................................................................................... 54
Table 27: Contra Costa estimates of food insecurity among low income individuals ........................ 54
Breastfeeding .......................................................................................................................................... 54
Table 28: Contra Costa County estimates of breast feeding ............................................................... 54
Physical Activity and Built Environment ................................................................................................... 55
People Living Near Parks ....................................................................................................................... 56
Table 29: Population residing within ¼ mile of a park by city ........................................................... 56
Bike and Pedestrian Safety ..................................................................................................................... 57
Table 30: Number and rate of motor vehicle accidents ...................................................................... 58
Public Transportation Availability .......................................................................................................... 59
Table 31: Public transit availability by city ........................................................................................ 59
Walkability .............................................................................................................................................. 60
Outdoor Air Quality ................................................................................................................................ 61
People Living in Transportation Corridors ............................................................................................. 63
Table 32: People living in transportation corridors by city ................................................................. 63
Travel Time to Workplace ...................................................................................................................... 64
Table 33: Travel time to workplace by city ........................................................................................ 64
Housing ....................................................................................................................................................... 65
Percent Spending More Than 30% of Income on Housing ..................................................................... 66
Table 34: Percent spending more than 30% of income on housing by city ........................................ 66
Foreclosure Rate ..................................................................................................................................... 67
Table 35: Foreclosure rate by city ....................................................................................................... 67

6
Social Connectivity ..................................................................................................................................... 69
Residential Mobility ................................................................................................................................ 70
Table 36: Residential mobility by city ................................................................................................ 70
Voter Turnout.......................................................................................................................................... 71
Table 37: Voter turnout - 2010 General Election ............................................................................... 71
Linguistic Isolation ................................................................................................................................. 72
Table 38: Language spoken at home for population age 5 years and over ......................................... 72
Key Informant Interviews ........................................................................................................................... 73
Conclusion and Recommendations ............................................................................................................. 79
Limitations .................................................................................................................................................. 81
Appendices .................................................................................................................................................. 82
East County Health Service Facilities ..................................................................................................... 82
Data Sources ........................................................................................................................................... 83
References ............................................................................................................................................... 85

7
A Call to Action: A Comparison of Population Growth and Rates of Poverty, Chronic Disease and Obesity in East, Central, and West County The data presented in this report provides a compelling case to expand chronic disease prevention programs in East County where population rates are climbing at a faster rate than the rest of the county. Here, we compare rates of population growth, poverty, death rates from chronic diseases, and childhood obesity/overweight in selected areas of Contra Costa County: East (Antioch, Bay Point, Pittsburg), West (Richmond) and Central (Concord). Our analysis indicates that the rates of population growth, poverty, deaths from chronic diseases, and childhood overweight/obesity in the East County communities are similar to, and often higher than those of the Central and West County communities we studied, as well as the county overall. Despite this, far fewer local safety net assets, or key social services are available per person living at or below the federal poverty level in East County than in West. The Federal Reserve Bank, in its 2012 publication, Building a Robust Anti-Poverty Network in the Bay Area, reports that for every $8 in social services available to a low income person in West County, a low income person in East County has access to $1 of the same services. There are limitations to this measure as it does not include services provided directly by government agencies or by organizations in outlying jurisdictions. Population – East Contra Costa County has experienced significant population growth in the past ten years, with East County cities having the highest rates of growth in the county.
1990 2010 Percent Change
Bay Point (W. Pittsburg) unincorporated 17,453 24,340 39% Antioch 62,195 102,745 65% Pittsburg 47,564 63,510 34% Concord 111,348 122,067 10% Richmond 87,425 103,701 19% Contra Costa County 803,732 1,052,827 31% U. S. Census Bureau, 1990 and 2010 Decennial Census

8
Poverty – There is considerable variation in the poverty rate of the three regions. Bay Point has the highest poverty rate by far among the regions we compare.
100% Federal Poverty Level
Poverty Rate 2010
Antioch 12.1%
Bay Point* 31.9%
Concord 9.5%
Pittsburg 16.3%
Richmond 18.3%
U.S. Census Bureau, 2010 American Community Survey, *2009-2011 American Community Survey
Chronic Disease - East County communities have among the highest rates of death from the selected categories of chronic disease, and childhood overweight/obesity compared to the West and Central communities we studied and to the county overall.
The tables below compare the rates of obesity, and deaths from chronic diseases associated with obesity, in selected areas of Contra Costa County: East (Antioch, Pittsburg and the unincorporated area of Bay Point), West (Richmond) and Central (Concord). Death Rates From Select Chronic Diseases –
Cancer (all types) Heart Disease Stroke Diabetes
Antioch 200.8* 211.1* 56.1 35.1*
Pittsburg 180.0 181.5* 71.9* 37.0*
Bay Point 130.2 121.7 NA NA
Concord 172.4 153.8 51.9 22.2
Richmond 177.7 210.2* 61.5* 32.4*
Contra Costa 162.0 147.5 46.7 18.9
*Significantly higher rate than the county overall. Rates per 100,000 people. Rates of death attributed to chronic disease in selected cities and an unincorporated area of Contra Costa 2005-2007 (Contra Costa Community Indicators Report 2010).

9
Childhood Obesity –
Childhood Overweight/Obese Rates
Antioch Unified School District (East County) 41.2%
Mount Diablo Unified School District (Central County)
35.5%
Pittsburg Unified School District (East County) 43.7%
West Contra Costa County Unified School District 43.6%
Rates of childhood overweight and obese are from the 2010 Fitnessgram data by school district. The Fitnessgram exam is conducted with 5th, 7th, and 9th graders and results are reported to the California Department of Education. Both Concord and Bay Point are located in the Mt. Diablo Unified School District.
Safety Net Assets The Federal Reserve Bank sheds important light on disparities in available social services for the poor in Contra Costa County. In its 2012 publication, Building a Robust Anti-Poverty Network in the Bay Area, the bank reports that local safety net assets, or key social services, available per person living at or below the federal poverty level in East County are much lower than in West County. For every $8 in social services available to a poor person in West County, a poor person in East County has access to $1 of the same services. The bank reports that this measure has limitations as it does not include services provided directly by government agencies or by organizations in outlying jurisdictions. Nevertheless, this ratio provides a convincing case for expanding investment in East County. A Call to Action Reducing health disparities and improving community health in East County must take place on several fronts including improving the environmental conditions that support health, reducing risks for chronic diseases, and expanding access to healthcare and social services. It is essential that change occurs in partnership with residents and local and regional organizations to meaningfully address health disparities. In some cases, this will involve increasing capacity among existing organizations. New networks and organizations will also need to be created to design and implement effective programs.
Contra Costa Health Services and the Community Wellness and Prevention Program (CWPP) are committed to reversing East County’s adverse health statistics, and supporting the considerable assets in the region. We are mindful that the work ahead cannot be done on our own or in a vacuum. Critical to the success of this endeavor is a genuine collaboration in partnership with

10
county and local government, community organizations, schools, faith-based leaders, residents and others. This report is a first step towards collective action. Our goal is to use this data to inform stakeholders and stimulate action to address obesity. We hope to bring East County’s health challenges to the attention of the philanthropic community and funders to encourage financial investment in much needed interventions that promote community health in this vital region.

11
Demographics and Baseline Data
Description of Data Demographic data is collected by the United States Census Bureau in the Decennial Census and the American Community Survey. In this section, we compare demographics over time, and look closely at current demographic data for Antioch, Bay Point, and Pittsburg. A comparison of data from 1990 to 2010 shows significant population growth in this region, and demographic shifts of race, ethnicity, and poverty. Over these two decades, Antioch has the highest growth rate of the three communities, which have all grown at a faster rate than Contra Costa as a whole. We also see fast growth in the Latino population and in the percentage of people living below the federal poverty level.
Why is this important for obesity prevention? Demographic data highlights health disparities and provides information on obesity risk and related factors relevant to obesity prevention program planning.
“Personally, I like the diversity of the population. I like that you are almost forced to meet people of other races every day. That means all kinds of celebrations: different people, different cultures, and different food!” ~Bay Point Key Informant

12
Geography
This map presents an aerial view of unincorporated Bay Point and the cities of Antioch and Pittsburg. A major highway, Highway 4, passes through the three areas. This region is bordered by the San Francisco Bay on the north and Mount Diablo to the south.

13
Population
This map presents the population of the Antioch, Bay Point, and Pittsburg at the census block level from the 2010 U.S. Census. Census blocks with the highest density are colored red, while those with the least density are colored green. The densest populations are in census blocks in Pittsburg and Antioch.

14
Population Change
Chart 1: Population change for racial and ethnic groups from 1990-2010
Antioch, Bay Point, and Pittsburg have grown at a faster rate than the county overall, with Antioch growing at a rate of more than double the county. There has been a decrease in the Non-Hispanic White population and an increase in the Hispanic/Latino population. This shift is more pronounced in these communities than the equivalent trend in the county.
Table 1: Population change by race and ethnic category
Non-Hispanic White Alone Black Alone Hispanic or
Latino All other
races Total
Contra Costa 1990 560,146 72,799 91,282 79,505 805,722 2010 502,751 92,992 257,409 199,675 1,054,837 % Change -10% 28% 182% 151% 31% Bay Point* 1990 9,670 1,986 3,768 2,029 17,453 2010 5,508 2,963 13,771 2,098 24,340 % Change -43% 49% 265% 3% 39% Pittsburg 1990 22,433 8,117 11,288 5,726 47,564 2010 10,980 13,181 27,248 12,101 63,510 % Change -51% 62% 141% 111% 34% Antioch 1990 47,454 1,563 9,719 3,459 62,195 2010 31,533 12,473 41,602 17,137 102,745 % Change -24% 698% 328% 395% 65% * Previously known as West Pittsburg. 2010 estimates from the 2008-2011 American Community Survey; 1990 Decennial Census, 2010 1 year American Community Survey Estimates
Po
pu
lati
on
*Previously known as West Pittsburg; Yearly estimates are not available for Bay Point, therefore Bay Point 2010 estimates were obtained from the 2008-2011 American Community Survey. Other sources include 1990 and 2000 Decennial Census, 2010 American Community Survey, U.S. Census Bureau
0
200,000
400,000
600,000
800,000
1,000,000
1,200,000
1990 2000 2010
Contra Costa
All other races White Alone Black Alone Hispanic/Latino
0
20,000
40,000
60,000
80,000
100,000
1990 2000 2010
Pittsburg
0
20,000
40,000
60,000
80,000
100,000
1990 2000 2010
Bay Point*
0
20,000
40,000
60,000
80,000
100,000
1990 2000 2010
Antioch

15
Chart 2: Change in percent of population living below federal poverty level from 1990-2010
The poverty rate for Antioch, Bay Point, Pittsburg, and Contra Costa has increased since 1990. A steep growth occurred in Pittsburg and Bay Point since 2000. For 2010, the federal poverty level was an annual income of $10,830 for an individual and $22,050 for a family of four.
0%
5%
10%
15%
20%
25%
30%
35%
Bay Point Pittsburg Antioch Contra Costa
Perc
ent o
f Peo
ple
Livi
ng B
elow
Fed
eral
Pov
erty
Lev
el
1990 2000 2010
Table 2: Percent living in poverty from 1990-2010
Year Contra Costa Bay Point Pittsburg Antioch 1990 7.3% 13.7% 10.7% 9.1% 2000 7.6% 17.2% 11.5% 8.5% 2010 9.2% 31.9% 16.3% 12.1% As yearly estimates are not available for Bay Point, therefore Bay Point 2010 estimates were obtained from the 2008-2011 American Community Survey; other sources include the 1990 and 2000 Decennial Census, 2010 1 year American Community Survey Estimates, U.S. Census Bureau.

16
Youth Population
This map presents the proportion of the population under 18 years at the census tract level. Red areas have the largest proportion of people under 18 in the three regions. These data elucidate neighborhoods with a concentration of youth.
Gender and Age
Table 3: Population by gender and age Contra Costa County Antioch Bay Point Pittsburg Male 49% 48% 51% 48% Female 51% 52% 49% 52% Under 5 years 6% 8% 9% 7% 5 to 19 years 21% 23% 29% 21% Under 18 years 25% 29% 31% 27% 20 to 34 years 18% 21% 23% 24% 35 to 54 years 30% 27% 27% 28% 55 to 64 years 12% 12% 7% 11% 65 to 74 years 7% 6% 4% 5% 75 years and older 6% 4% 2% 4% Source: U.S. Census Bureau, 2007-2011 American Community Survey 5-Year Estimates

17
Race and Ethnicity
Table 4: Population by race and ethnic category
Contra Costa County Antioch Bay Point Pittsburg
Hispanic or Latino (of any race) 24.4% 32.2% 56.6% 42.4% Not Hispanic or Latino 75.6% 67.8% 43.4% 57.6% White 47.8% 35.7% 22.6% 19.8% Black or African American 8.8% 16.6% 12.2% 17.6% Asian 14.3% 9.6% 4.8% 14.5% Native Hawaiian and Pacific Islander 0.5% 1.3% 0.5% 1.4%
Two or more races 3.7% 3.7% 3.0% 3.9% Source: U. S. Census Bureau, 2007-2011 American Community Survey 5-Year Estimates
This table shows that Antioch, Bay Point, and Pittsburg have different racial and ethnic distributions compared to Contra Costa County and to each other.

18
Language
This map illustrates the proportion of residents who speak a language other than English at home. Bay Point and Pittsburg have multiple census tracts where 60% or more of the population speak a non-English language at home.
Table 5: Language spoken at home among population age 5 years and over Contra Costa County Antioch Bay Point Pittsburg English 67.2% 66.3% 44.0% 53.2% Spanish 17.4% 22.0% 47.3% 32.2% Asian/Pacific Islander Languages 8.9% 6.5% 6.1% 9.8% Other 6.4% 5.1% 2.5% 4.7% Source: U. S. Census Bureau, 2007-2011 American Community Survey 5-Year Estimates

19
Nativity
Table 6: Population by nativity Contra Costa
County Antioch Bay Point Pittsburg
Native born 76% 81% 65% 67% Foreign born 24% 19% 35% 33% Naturalized U.S. citizen 50% 55% 37% 43% Not a U.S. citizen 50% 45% 63% 57% Source: U. S. Census Bureau, 2007-2011 American Community Survey 5-Year Estimates
The majority of the population of Antioch, Bay Point, and Pittsburg are native born to the United States, with the highest percentage of foreign born in Bay Point. Of those who were foreign born, Bay Point also has the highest percentage of residents who are not U.S. citizens.


Education and School Environment
Description of Data Educational attainment, as defined by an individual having a high school diploma or the equivalent, is measured in the American Community Survey (ACS), an annual household survey conducted by the U.S. Census Bureau. All three East County communities have a higher percentage of residents reporting less than a high school education than Contra Costa County as a whole. The drop-out rate by school district is presented here, obtained from the California Department of Education.
The school environment is determined by many factors. This report includes the percentage of students receiving free or reduced price school meals, as reported by the California Department of Education in the 2010-2011 school year. Eligibility for this program is based on family income. All three communities show a high proportion of students who qualify for free or reduced price meals.
Why is this important for obesity prevention? Education is associated with health through three key interconnected pathways: health literacy or knowledge and behaviors, employment and income, and social psychological factors. Higher educational attainment leads to more opportunities for higher paying jobs and higher income, which in turn makes it easier for people to obtain healthy nutritious food, live in a safe neighborhood, and access healthcare. Schools play an important role in obesity prevention by providing a supportive environment where children develop lifelong habits that foster wellness and academic success.
Source: Robert Wood Johnson Foundation, Education Matters for Health. Centers for Disease Control and Prevention (CDC), School Health Guidelines to Promote Healthy Eating and Physical Activity.
“Antioch was hit
hard by the first
and second
foreclosure wave
and it is ongoing.
This makes the
community not
stable. The more
foreclosures you
have, the less
property tax you
have. This is really
reflected in the
schools.
Unfortunately there
isn’t that much
money available to
schools, and we see
that obviously in
the graduation
rates and drop-out
rates.”
~Antioch Key Informant

22
Educational Attainment
Table 7: Educational attainment for the population 25 years and older
Educational Attainment Contra Costa County Antioch Bay Point Pittsburg
No Schooling 1.3% 1.6% 2.9% 2.4%
Less than High School 10.2% 13.5% 27.1% 19.4%
High School Graduate or Equivalent 19.7% 27.7% 27.9% 28.3%
Some College 22.4% 28.3% 19.1% 25.1%
Associate’s Degree 8.1% 9.4% 8.1% 8.5%
Bachelor’s Degree 24.5% 14.8% 12.0% 12.0%
Master’s, Professional or Doctorate Degree 13.9% 4.8% 2.9% 4.4% Source: U. S. Census Bureau, 2007-2011 American Community Survey 5-Year Estimates
Antioch, Bay Point and Pittsburg each have higher percentages of individuals who have less than a high school diploma than the county as a whole. The overall educational attainment is also lower in the three regions, as they have fewer people with a Bachelor’s degree or above. Higher educational attainment leads to better opportunities for better paying jobs and higher income which allow a person and family to obtain healthier and nutritious food, live in a safer neighborhood, and access healthcare when needed.

23
Residents 25 Years and Older with Less Than a High School Degree
The above map illustrates the proportion of residents with less than a high school degree at the census tract level. The purpose of this map is to show neighborhoods with concentrations of low educational attainment. Antioch, Bay Point, and Pittsburg have pockets where greater than 27% of residents have less than a high school diploma or equivalent.
Table 8: Dropout rate by school district Contra Costa County Antioch Mt Diablo Pittsburg Dropout Rate 2.7 % 4.4 % 2.9 % 7.2 % Source: California Department of Education, 2011-2012

24
Free or Reduced Price Meals

25
Free or Reduced Price Meals The preceding map illustrates the proportion of students who qualify for free or reduced price meals for high schools, middle schools, and elementary schools in Antioch, Bay Point, and Pittsburg. All three regions have schools with a high proportion of students qualifying for free or reduced price meals, which is based on family income level and therefore a measure of family economic security.
Table 9: Free/reduced meal qualification by school district Contra Costa County Antioch Mt Diablo Pittsburg Free/Reduced Price Meal Rate
37.7 %
57.8 %
39.6 %
80.9 %
Source: California Department of Education 2010-2011


27
Poverty and Service Access Description of Data
The indicators in this section were collected by the American Community Survey. Poverty rates were determined using the federal poverty level, which is based on a comparison of family size and annual household income. For 2010, the federal poverty level for an individual was an annual income of $10,830, and $22,050 for a family of four. All three regions have census tracts with concentrated poverty where 48% to 59% of individuals are living below 200% of the federal poverty level. This report also examines food stamp participation. There are census tracts in all three East County communities where 15% to 24% of individuals living in poverty were not receiving food stamps. Employment rates for the communities were similar to the county overall. The rate of single head of households (both male and female) was higher than for the county as a whole.
Why is this important for obesity prevention? Many studies have demonstrated a direct correlation between poverty and negative health outcomes. This relationship can be confusing, because health status is both a cause, and a result, of poverty. Individuals living in poverty experience higher rates of adverse health in part because they tend to have limited access to health care, healthy food choices, and safe neighborhoods supporting outdoor physical activity. Behaviors associated with poverty include a sedentary lifestyle, smoking, and a diet lacking in fiber, fresh fruits, and vegetables. Connecting poor individuals to services such as food stamps, healthcare, and employment can help mitigate negative health outcomes.
Source: World Health Organization (WHO), Social Determinants of Health (2nd Edition) Available online at http://www.euro.who.int/__data/assets/pdf_file/0005/98438/e81384.pdf County Health Rankings and Roadmaps. Health Factors Available online at http://www.countyhealthrankings.org/health-factors/employment
“There are a lot of people that live their entire lives with diabetes and never get care because they can’t afford it.” ~Antioch Key Informant

28
Families Living Below 200% of the Federal Poverty Level in 2010
The above map illustrates census tracts in Antioch, Bay Point, and Pittsburg with concentrations of poverty. All three regions have neighborhoods where the proportion of people living below 200% of the federal poverty level exceeds 48%. Two hundred percent of the federal poverty level in 2010 was an annual income of $21,660 for an individual and $44,100 for a family of four.
Table 10: Poverty and service access Contra Costa County Antioch Bay Point Pittsburg
Families Living Below 200% of the Federal Poverty Level
17.7 % 25.0 % 43.4 % 31.9 %
Elderly* Living Below 200% of the Federal Poverty Level
21.5 % 27.6 % 46.9 % 34.0 %
Food Stamp Participation 4.1 % 8.5 % 12.7 % 8.6 %
Proportion of Food Stamp Non-Participation Households Living in Poverty
7.1 % 8.4 % 16.5 % 9.9 %
Source: U.S. Census Bureau, 2007-2011 American Community Survey 5-Year Estimates. * Population 65 years and older

29
Elderly Living in Poverty
The above map illustrates census tracts in Antioch, Bay Point, and Pittsburg with varying concentrations of seniors living in poverty. All three regions have neighborhoods where the proportion of seniors living below 200% of the federal poverty level exceeds 44%. 200% of the federal poverty level in 2010 was an annual income of $21,660 for an individual and $44,100 for a family of four.

30
Food Stamp Participation
The above map illustrates the proportion of the population receiving food stamps in Antioch, Bay Point, and Pittsburg. All three regions have neighborhoods where the proportion of people receiving food stamps exceeds 11%.
31
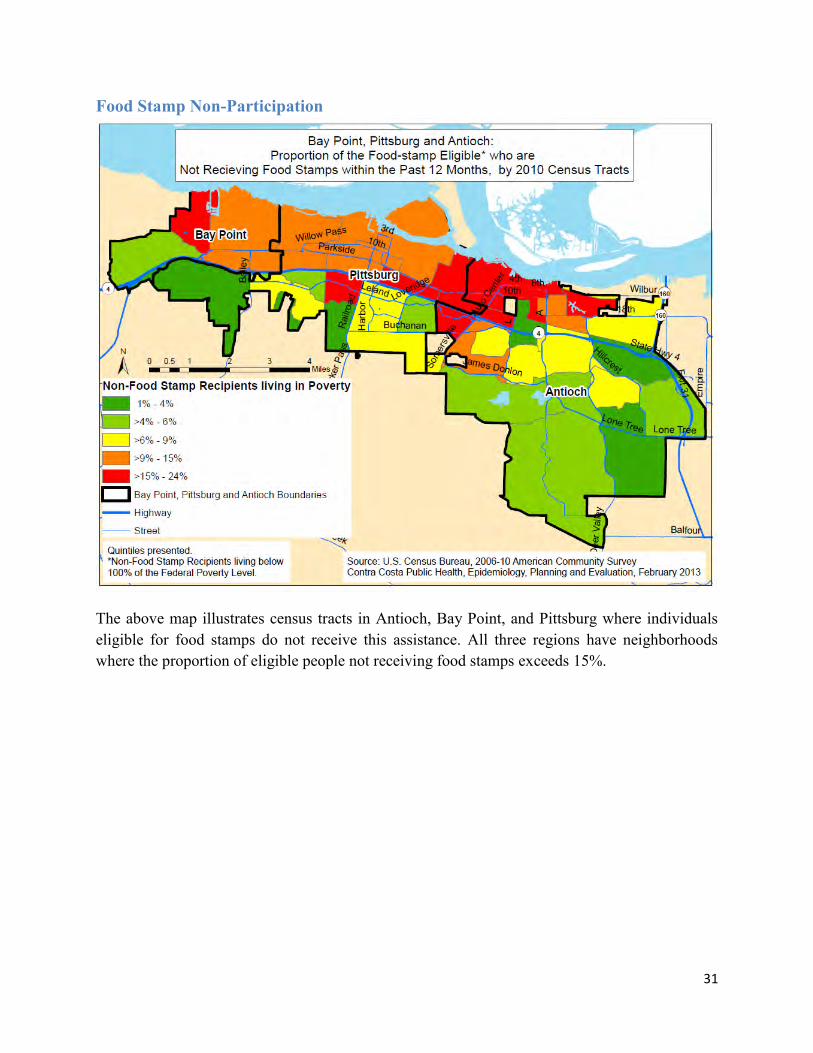
Food Stamp Non-Participation
The above map illustrates census tracts in Antioch, Bay Point, and Pittsburg where individuals eligible for food stamps do not receive this assistance. All three regions have neighborhoods where the proportion of eligible people not receiving food stamps exceeds 15%.

32
Employment
Table 11: Population by work status in the past 12 Months Hours normally worked per week
Contra Costa County Antioch Bay Point Pittsburg
Usually worked 35 or more hours 54% 51% 51% 53%
Usually worked 15 to 34 hours 16% 16% 17% 17% Usually worked 1 to 14 hours 4% 4% 3% 3% Did not work 25% 29% 29% 27% Source: U.S. Census Bureau, 2007-2011 American Community Survey 5-Year Estimates
The above table compares the population by work status in Antioch, Bay Point, and Pittsburg. The percent of individuals who did not work in the past 12 months is slightly greater in the three communities than in the county as a whole. The percent of part time workers is similar to that of the county.
Household Characteristics
Table 12: Population by household type
Types of Households Contra Costa County Antioch Bay Point Pittsburg
Family households 71% 78% 78% 76% With own children under 18 years 34% 40% 44% 39%
Husband-wife family 53% 53% 49% 50% With own children under 18 years 25% 26% 28% 26%
Male householder, no wife present 5% 7% 9% 7% With own children under 18 years 3% 4% 4% 3%
Female householder, no husband present 12% 18% 20% 18%
With own children under 18 years 6% 10% 11% 10% Source: U.S. Census Bureau, 2007-2011 American Community Survey 5-Year Estimates
The U.S. Census defines a household as everyone residing in a housing unit, regardless of relationship, and a family household as two or more people residing in a housing unit who are related by birth, marriage, or adoption. The above table compares the population by household type in Antioch, Bay Point, and Pittsburg. The percent of single female households is higher in all three regions than in the county as a whole.

33
Health Insurance
Table 13: Population by insurance coverage status
Health Insurance Coverage Contra Costa County Antioch Bay Point Pittsburg
With coverage 88% 84% 80% 81% private health insurance 74% 65% 48% 60% public coverage 25% 28% 37% 28% No health insurance coverage 12% 16% 20% 19% Source: U. S. Census Bureau, 2007-2011 American Community Survey 5-Year Estimates
The above table compares the population by health insurance status in Antioch, Bay Point, and Pittsburg. The percent of individuals with no health coverage is higher in all three regions than in the county as a whole.

Rates of Mortality
Description of Data Mortality rates are obtained from the number of deaths reported on county-issued death certificates compared to the relative number and age of the population. Bay Point, Antioch, and Pittsburg death rates due to heart disease, stroke, cancer, and diabetes are higher than in Contra Costa as a whole. Note that rates are difficult to obtain for Bay Point, due to its smaller population size. Rates are reported per 100,000 individuals and were taken from the Contra Costa County Communities Indicators Report, 2010.
Why is this important for obesity prevention? Obesity is associated with an increased prevalence of morbidity and mortality from chronic diseases including heart disease, cancer, stroke, and diabetes. Reducing rates of obesity improves health outcomes and increases life expectancies.
Source: Centers for Disease Control and Prevention (CDC), Health Disparities and Inequalities Report 2011 Available online at http://www.cdc.gov/mmwr/pdf/other/su6001.pdf The Surgeon General’s Report, A Healthy and Fit Nation Available online at http://www.surgeongeneral.gov/initiatives/healthy-fit-nation/obesityvision2010.pdf
“People are dying before their time; premature death because of the lack of health care.” ~Antioch Key Informant

36
Cardiac Disease
Table 14: Heart disease deaths 2005-2007
Region Number of Deaths
Percent of Heart Disease Deaths Rate
Antioch 405 8.7% 211.1* Pittsburg 254 5.4% 181.5* Bay Point 48 1.0% 121.7
Contra Costa 4,664 100.0% 147.5 These are age-adjusted rates per 100,000 residents. Contra Costa total includes cities not listed above. * Significantly higher rate than the county overall.
Between 2005 and 2007, Antioch and Pittsburg had the fourth and fifth greatest number of deaths from heart disease, respectively, compared to all cities in Contra Costa County. Both cities had death rates from heart disease that exceeded the county average. Bay Point had the lowest heart disease death rate in the county.
Obesity and tobacco use are the leading risk factors for cardiac disease.
Cancer
Table 15: Cancer deaths 2005-2007
Region Number of Deaths
Percent of Cancer Deaths Rate
Antioch 430 8.4% 200.8* Pittsburg 268 5.2% 180.0 Bay Point 60 1.2% 130.2
Contra Costa 5,131 100.0% 162.0 These are age-adjusted rates per 100,000 residents. Contra Costa total includes cities not listed above. * Significantly higher rate than the county overall.
Between 2005-2007, Antioch and Pittsburg had the fourth and fifth greatest number of deaths from cancer, respectively, compared to all cities in Contra Costa County. Antioch’s death rate from cancer exceeded the county average. Bay Point had the lowest cancer death rate in the county.
Obesity and tobacco use are the leading risk factors for cancer.
37
Stroke
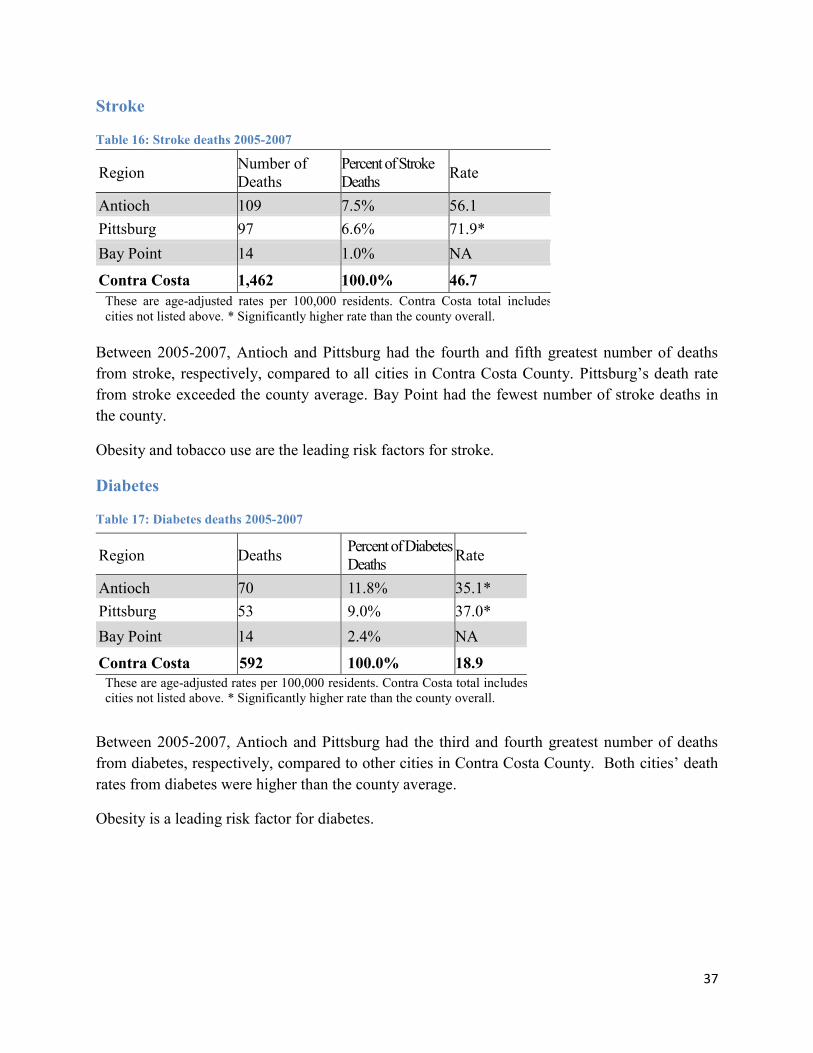
Table 16: Stroke deaths 2005-2007
Region Number of Deaths
Percent of Stroke Deaths Rate
Antioch 109 7.5% 56.1 Pittsburg 97 6.6% 71.9* Bay Point 14 1.0% NA
Contra Costa 1,462 100.0% 46.7 These are age-adjusted rates per 100,000 residents. Contra Costa total includes cities not listed above. * Significantly higher rate than the county overall.
Between 2005-2007, Antioch and Pittsburg had the fourth and fifth greatest number of deaths from stroke, respectively, compared to all cities in Contra Costa County. Pittsburg’s death rate from stroke exceeded the county average. Bay Point had the fewest number of stroke deaths in the county.
Obesity and tobacco use are the leading risk factors for stroke.
Diabetes
Table 17: Diabetes deaths 2005-2007 Region Deaths Percent of Diabetes
Deaths Rate
Antioch 70 11.8% 35.1* Pittsburg 53 9.0% 37.0* Bay Point 14 2.4% NA
Contra Costa 592 100.0% 18.9 These are age-adjusted rates per 100,000 residents. Contra Costa total includes cities not listed above. * Significantly higher rate than the county overall.
Between 2005-2007, Antioch and Pittsburg had the third and fourth greatest number of deaths from diabetes, respectively, compared to other cities in Contra Costa County. Both cities’ death rates from diabetes were higher than the county average.
Obesity is a leading risk factor for diabetes.

38
Homicide
Table 18: Homicides 2005-2007
Region Number of
Death Percent of Homicide Deaths Rate
Antioch 35 12.2% 11.7 Pittsburg 22 7.7% 11.7 Bay Point 7 2.4% NA
Contra Costa 287 100.0% 9.3 These are age-adjusted rates per 100,000 residents. Contra Costa total includes cities not listed above.
Between 2005-2007, Antioch and Pittsburg had the second and fourth greatest number of deaths from homicide, respectively, compared to all cities in Contra Costa County.

39
Obesity and Rates of Morbidity Description of Data
Morbidity rates, or the rate of a disease or medical condition, cannot be determined in small communities due to inadequate sample sizes in population-based health surveys. In this section we include several data sources to help estimate morbidity and obesity rates for Bay Point, Antioch, and Pittsburg. The California Health Interview Survey (CHIS) reports county level rates of obesity and diabetes. Based on the higher rates of obesity and diabetes among Latinos and African Americans, and the relative population of these groups in Bay Point, Antioch and Pittsburg, we expect rates of these conditions to occur more frequently in these communities than in Contra Costa overall. Childhood obesity rates were obtained from public school Fitnessgram results, a fitness assessment reported by schools to the California Department of Education. The obesity rate is based on the number of students whose height and weight put them above the 95th percentile on BMI growth charts. In this section, we distinguish between overweight and obesity rates because the health impacts for obese people are far greater than for overweight. Since being overweight is a risk factor for obesity, interventions should address both conditions. Over 30% of students in every public school in Antioch, Bay Point, and Pittsburg were considered overweight or obese in 2010.
Why is this important for obesity prevention? Adults and children who are overweight or obese have higher rates of mortality and morbidity from chronic diseases, disabilities, and depression.
Source: Centers for Disease Control and Prevention (CDC), Health Disparities and Inequalities Report 2011 Available online at http://www.cdc.gov/mmwr/pdf/other/su6001.pdf The Surgeon General’s Report, A Healthy and Fit Nation, Available online at http://www.surgeongeneral.gov/initiatives/healthy-fit-nation/obesityvision2010.pdf
“Childhood obesity
is definitely a
problem in our
community…I can
see it with my own
eyes being out in
the community. I
do see a shift in
kinder and first
graders, but kids in
middle school and
older you see a
prevalence of
obesity.”
~Pittsburg Key Informant

40
Adult Obesity
Table 19: Contra Costa County estimates of adult Body Mass Index (BMI)
In Contra Costa County in 2009, 40.4% of men and 29.7% of women were overweight, and roughly 20% of both men and women were considered obese.
Child Obesity
Table 20: Estimates of BMI category by school district
Contra Costa
Antioch Unified
Mt. Diablo Unified
Pittsburg Unified
Underweight 3% 2% 2% 2% Normal weight 63% 56% 62% 51% Overweight 17% 19% 18% 19% Obese 17% 23%* 18%* 27%* Source: 2010 Fitnessgram results, California Department of Education
* Statistically significantly higher than county overall
Adults age 18 and older (2009) BMI Categories Males Females All 0 – 18.49 (Underweight) 1.7%* 4.3%* 3.0%
18.5 – 24.99 (Normal) 38.3% 45.8% 42.1%
25.0 – 29.99 (Overweight) 40.4% 29.7% 34.9%
30.0 or higher (Obese) 19.6% 20.2% 19.9%
Total 100.0% 100.0% 100.0% Source: California Health Interview Survey (CHIS), 2009 *Statistically unstable

41
Table 21: Estimates of overweight or obese by race/ethnicity by school district
Contra Costa
Antioch Unified
Mt. Diablo Unified
Pittsburg Unified
Latino 45% 49% 48% 44% African American 44% 44% 46% 45% White 24% 36% 28% 47% Asian 24% 33% 25% 44% Other and Declined to State 37% 39% 38% 44% All
33% 42%* 36%* 44%* Source: 2010 Fitnessgram results, California Department of Education
* Statistically significantly higher than county overall

42
Childhood Obese or Overweight by School

43
California public schools conduct the annual Fitnessgram exam, a required fitness assessment. The body composition component captured in the exam can be converted to a BMI percentile, allowing an estimate of the percent of overweight or obese students in each school (California Department of Education, 2010). On the preceding map, the percent of overweight or obese students attending public schools is broken down into quartiles. Each public school is color-coded accordingly. Over 30% of students in every public school in Antioch, Bay Point, and Pittsburg were considered overweight or obese in 2010.
Diabetes
Table 22: Contra Costa estimates of diabetes prevalence
Ever Diagnosed with Diabetes
Contra Costa County 6.3%
Bay Area 6.1%
Latino 7.0% White 5.1% African American 10.2% Differences are not statistically significant. A larger sample size for the Bay Area would have more statistical power to determine whether the higher prevalence of diabetes diagnoses reported by Latino and African American respondents compared to White respondents in all of California perpetuate in the Bay Area.
Source: California Health Interview Survey (CHIS), 2009
The California Health Interview Survey, a comprehensive statewide survey conducted every two years, estimates the prevalence of diabetes. The sampling of this survey allows for estimation at the county but not city level. In the above table we show the prevalence of diabetes in Contra Costa, the entire Bay Area, and for Bay Area residents broken down by race and ethnicity.
Individuals who are overweight or obese, tend to eat unhealthy diets, and/or have sedentary lifestyles are at an increased risk for diabetes.

44

Crime and Safety
Description of Data Pittsburg and Antioch crime data in this report was obtained from the Federal Bureau of Investigation’s (FBI) Uniform Crime Statistics, a division of the U.S. Department of Justice. Police departments are required to report crime data to the Justice Department. As Bay Point does not have an independent police jurisdiction, Bay Point data was obtained from the Contra Costa County Sheriff’s Department, which provides law enforcement services to the unincorporated community. The rates are reported here per 100,000 residents. Rates of violent and property crimes are much higher in Antioch than in Bay Point, Pittsburg, and the county overall.
Why is this important for obesity prevention? Crime and violence have a deleterious effect on the health of a community. Violence, and the fear of violence, lead people to stay indoors, limiting their options for physical activity. Fear of violence also changes purchasing patterns by causing people to avoid certain neighborhoods or areas, limiting their access to healthy foods. Witnesses of violence report decreased motivation, which affects their diet and activity level. At the community level, violence reduces the social interactions that contribute to cohesion.
“I would not want my kids to walk by themselves to school. Our community is getting crowded. There are people even in our community who are getting assaulted, you hear things that happen to kids, and I will not take that chance.”
~Antioch Key Informant

Source: Prevention Institute (This report was prepared with funding from Kaiser Permanente) Addressing the Intersection: Preventing Violence and Promoting Healthy Eating and Active Living available online at http://www.preventioninstitute.org/component/jlibrary/article/id-267/127.html
Violent Crimes
Table 23: Violent crimes – 2010 Antioch Bay Point Pittsburg Homicide
Number 13 3 6 Rate (per 100,000) 12.7 14.05 9.5
Forcible Rape Number 32 5 4 Rate (per 100,000) 31.3 23.4 6.3
Robbery Number 313 48 83 Rate (per 100,000) 305.7 224.9 131.2
Aggravated Assault Number 506 44 61 Rate (per 100,000) 494.3 206.1 96.4
Total Number 864 104 154 Rate (per 100,000) 844.0 487.2 243.4
Source: Criminal Justice Profiles, Contra Costa County, 2010; Contra Costa Sheriff’s Department Denominators for rates from 2010 U.S. Census.
Violent crime rates are reported to the U.S. Department of Justice. Bay Point data was obtained from the Contra Costa Sheriff’s Office. Rates were calculated using population numbers from the 2010 Census. These data show that higher rates of violent crime in Antioch than in Pittsburg or Bay Point.
Violence, and the fear of violence, causes people to limit their outdoor physical activity and to change their purchasing patterns, limiting access to healthy food.
47
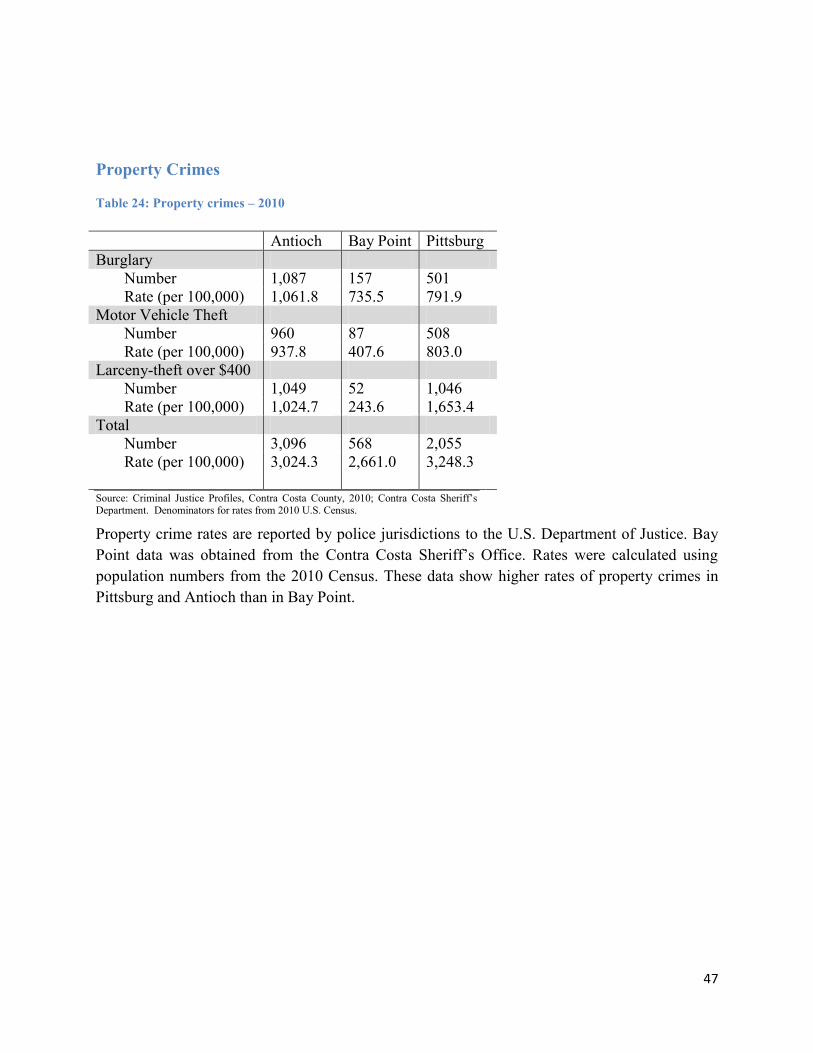
Property Crimes
Table 24: Property crimes – 2010 Antioch Bay Point Pittsburg Burglary
Number 1,087 157 501 Rate (per 100,000) 1,061.8 735.5 791.9
Motor Vehicle Theft Number 960 87 508 Rate (per 100,000) 937.8 407.6 803.0
Larceny-theft over $400 Number 1,049 52 1,046 Rate (per 100,000) 1,024.7 243.6 1,653.4
Total Number 3,096 568 2,055 Rate (per 100,000) 3,024.3 2,661.0 3,248.3
Source: Criminal Justice Profiles, Contra Costa County, 2010; Contra Costa Sheriff’s Department. Denominators for rates from 2010 U.S. Census.
Property crime rates are reported by police jurisdictions to the U.S. Department of Justice. Bay Point data was obtained from the Contra Costa Sheriff’s Office. Rates were calculated using population numbers from the 2010 Census. These data show higher rates of property crimes in Pittsburg and Antioch than in Bay Point.


Food and Nutrition Environment
Description of Data The California Health Interview Survey reports on nutrition behaviors, including for Contra Costa County. These data, however, are not representative for Antioch, Bay Point, and Pittsburg because of limited sample sizes. Based on the survey’s Bay Area rates of soda, fruit, and vegetable consumption by race and ethnicity, we expect that the nutrition behaviors in Antioch, Pittsburg, and Bay Point aren’t equivalent to the county as a whole. We estimate that soda intake is higher, and fruit and vegetable intake lower in the East County communities. Food insecurity may be a substantial problem in these communities, as more than 30% of low income individuals countywide report they can’t afford enough food. The Retail Food Environment Index (RFEI), developed by the California Center for Public Health Advocacy, is calculated by dividing the total number of fast food restaurants and convenience stores by the total number of supermarkets, produce stores, and farmers markets in a region. The final value is the ratio of the relative abundance of retail food outlets offering unhealthy food options, to those with healthier choices. The RFEI is higher in Antioch and Pittsburg than for the county overall. The marketing and promotion of healthy and unhealthy foods and beverages are important components of a community’s food and nutrition environment. There currently aren’t sufficient data to fully describe the exposure of East County residents to food and beverage marketing and promotional messages. Qualitative measures and expert opinion can provide useful insight.
Why is this important for obesity prevention? The Centers for Disease Control and Prevention (CDC) Children’s Food Environment Report indicates that a community’s lack of access to retail venues offering healthy foods is associated with a lower quality diet and increased risk of obesity.
Source: Centers for Disease Control and Prevention (CDC)Children’s food Environment State Indicator Report 2011 State Indicator Report on Fruits and Vegetables Consumption 2009
“The standard grocery stores are typical places residents are able to shop for food; of course these grocery stores have healthy options. Whether they are affordable or not, that is the big question.”
~Bay Point Key Informant
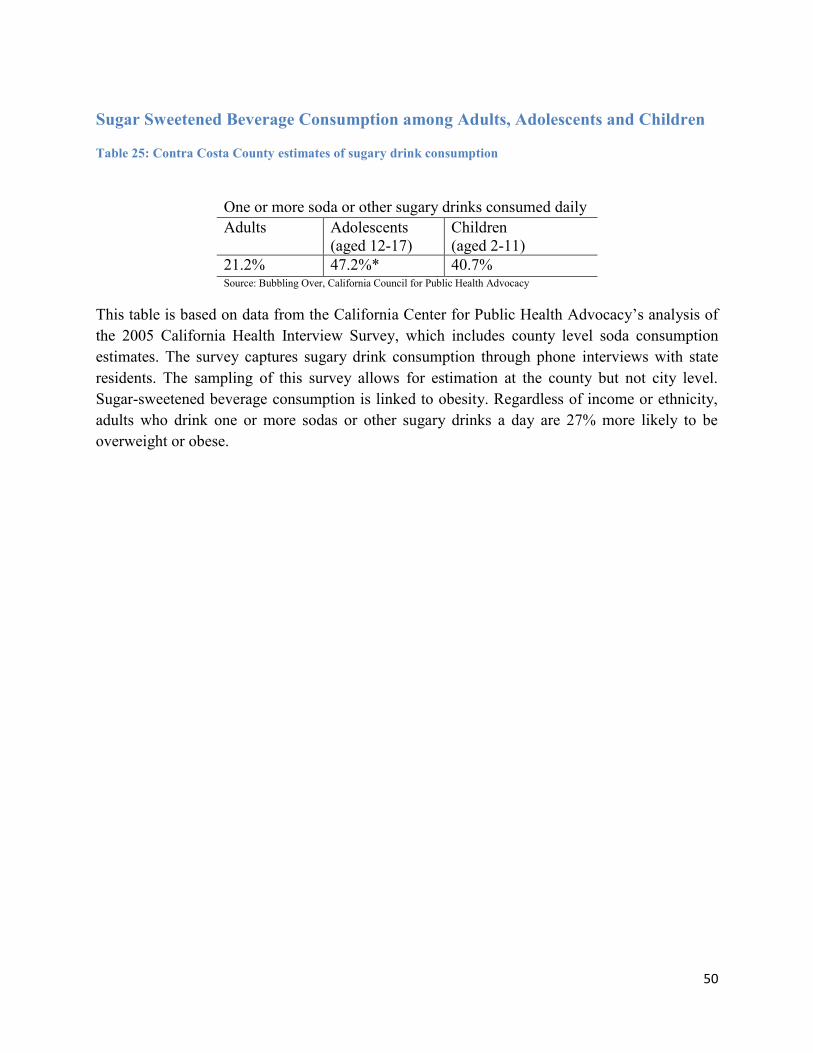
50
Sugar Sweetened Beverage Consumption among Adults, Adolescents and Children
Table 25: Contra Costa County estimates of sugary drink consumption
One or more soda or other sugary drinks consumed daily Adults Adolescents
(aged 12-17) Children (aged 2-11)
21.2% 47.2%* 40.7% Source: Bubbling Over, California Council for Public Health Advocacy
This table is based on data from the California Center for Public Health Advocacy’s analysis of the 2005 California Health Interview Survey, which includes county level soda consumption estimates. The survey captures sugary drink consumption through phone interviews with state residents. The sampling of this survey allows for estimation at the county but not city level. Sugar-sweetened beverage consumption is linked to obesity. Regardless of income or ethnicity, adults who drink one or more sodas or other sugary drinks a day are 27% more likely to be overweight or obese.

51
Fruit and Vegetable Consumption (Adult and Child)
Table 26: Contra Costa County estimates of adult and child consumption of five or more servings of fruits and vegetables
The California Health Interview Survey estimates fruit and vegetable consumption through a phone survey with California residents. The sampling of this survey allows for estimation at the county, but not city level. The above table shows the percent of adults and children who report consuming five or more servings of vegetables daily, compared by gender.
Adults (2005) Children age 2 or older (2009) Eat ≥ 5 servings of fruits/vegetables daily
Males* Females All Male Female All
Yes 58.7% 40.5% 49.3% 46.2% 53.2% 49.6% No 41.3% 59.5% 50.7% 53.8% 46.8% 50.4% Total 100.0% 100.0% 100.0% 100.0% 100.0% 100.0% Source: California Health Interview Survey (CHIS) *The proportion of adult males reporting consuming five or more servings of fruits and vegetables per day is significantly greater (p<0.05) than that of adult females.

52
Retail Food Environment

53
Chart 3: Retail Food Environment
The Retail Food Environment Index (RFEI) was developed by the California Center for Public Health Advocacy. It is calculated by dividing the total number of fast food restaurants and convenience stores by the total number of supermarkets, produce stores and farmers markets in a region. The final value is the ratio of the relative abundance of retail food outlets that offer unhealthy food options, to those that provide healthy choices. The marketing and promotion of healthy and unhealthy foods and beverages are important components of a community’s food and nutrition environment. Good data or indicators on marketing efforts aren’t available. The use of qualitative measures and expert opinion provide useful insight.
7.4
1.7
7.0
5.4
0.00 2.00 4.00 6.00 8.00
Antioch
Bay Point
Pittsburg
Contra CostaCounty
East Contra Costa County: Retail Food Environment Index (RFEI*) 2010
*RFEI= (# fast food restaurants+ # convenience store) / (# supermarkets + # produce store + # farmers market)

54
Food Insecurity
Table 27: Contra Costa estimates of food insecurity among low income individuals
The
California Health Interview Survey interviews individuals of all economic levels, but questions on food security are only asked of those reporting a household income that is below 200% of the federal poverty level. The sampling of this survey allows for estimation at the county but not city level. The above table shows the prevalence of low-income individuals who report they’re unable to afford enough food in Contra Costa County, the entire Bay Area, and Bay Area residents by race and ethnicity.
Breastfeeding
Table 28: Contra Costa County estimates of breast feeding
Upon hospital discharge new mothers report an intention of any or exclusive breast feeding. These data show that African American mothers report a lower breastfeeding intention rate than White and Latino mothers.
Not able to afford enough food Contra Costa County 58%
Bay Area 44%
Latino 53% White (non-Latino) 28% African American (non-Latino) 49%
Differences are not statistically significant. A larger sample size for the Bay Area would have more statistical power to determine whether the higher prevalence of food insecurity reported by low income Latino respondents compared to White and African American respondents in all of California perpetuate in the Bay Area. Source: California Health Interview Survey (CHIS), 2009
Intention for Any Breast Feeding
Intention for Exclusive Breast Feeding
Contra Costa County 93.2% 62.2%
Latino 94.8% 60.5% White 92.9% 66.0% African American 84.6% 53.5%
Source: Community Health Indicators for Contra Costa County, 2010; Contra Costa County Hospitals, 2006

55
Physical Activity and Built Environment Description of Data
The built environment is a key indicator of the availability of physical activity opportunities for local residents. Several data sources are used here to describe the built environments for Antioch, Bay Point, and Pittsburg. The maps show access to parks and public transportation, as well as bike and pedestrian safety. Additionally, we use the highway system and population to determine those regions where individuals live close to major transportation corridors an indication of local air quality. Although there is no air quality monitoring station in Antioch, Bay Point or Pittsburg, we include data from nearby monitoring stations in Concord and Bethel Island, which provide insight into the air quality of the three communities. Smoke-free parks and trails are also reported, as an important factor for encouraging physical activity.
Why is this important for obesity prevention? The Centers for Disease Control and Prevention’s (CDC) 2010 Report on Physical Activity indicates the importance of physical activity for overall health, obesity prevention, chronic disease risk reduction, and improving mental health. The CDC’s goal of increasing physical activity is reinforced by key strategy recommendations including creating or enhancing access to places for physical activity by supporting street-scape design, and land use and transportation policies. The World Health Organization (WHO) states that cycling, walking, and the use of public transportation promote health in four ways: providing exercise, reducing fatal accidents, increasing social contact, and reducing air pollution.
“They can improve
the bike lanes out
here. For example
when I am riding
my bike, I wish
there were more
bike lanes. There
are a few but I
would like to see
that extended to
Willow Pass Road;
that is a very busy
street and a very
scary ride!”
~Pittsburg Key Informant

56
Source: Centers for Disease Control and Prevention (CDC) State Indicator Report on Physical Activity 2010 World Health Organization (WHO) Social Determinants of Health (2nd Edition)
People Living Near Parks
The above map illustrates the populations of Antioch, Bay Point, and Pittsburg living in census blocks that are within ¼ mile of a park a common measure for a walkable distance. The map demonstrates that Bay Point residents have the fewest available parks in the region.
Smoke-free recreational areas are healthier and more appealing for physical activity. Unincorporated Bay Point is covered by the county’s comprehensive Secondhand Smoke Protections Ordinance, which prohibits smoking in public parks and rail systems, among other locations. The cities of Antioch and Pittsburg do not have secondhand smoke protections.
Table 29: Population residing within ¼ mile of a park by city Contra Costa County Antioch Bay Point Pittsburg
People Living Near Parks 60.7 % 72.8 % 58.5 % 58.0 % Source: TeleAtlas 2010

57
Bike and Pedestrian Safety
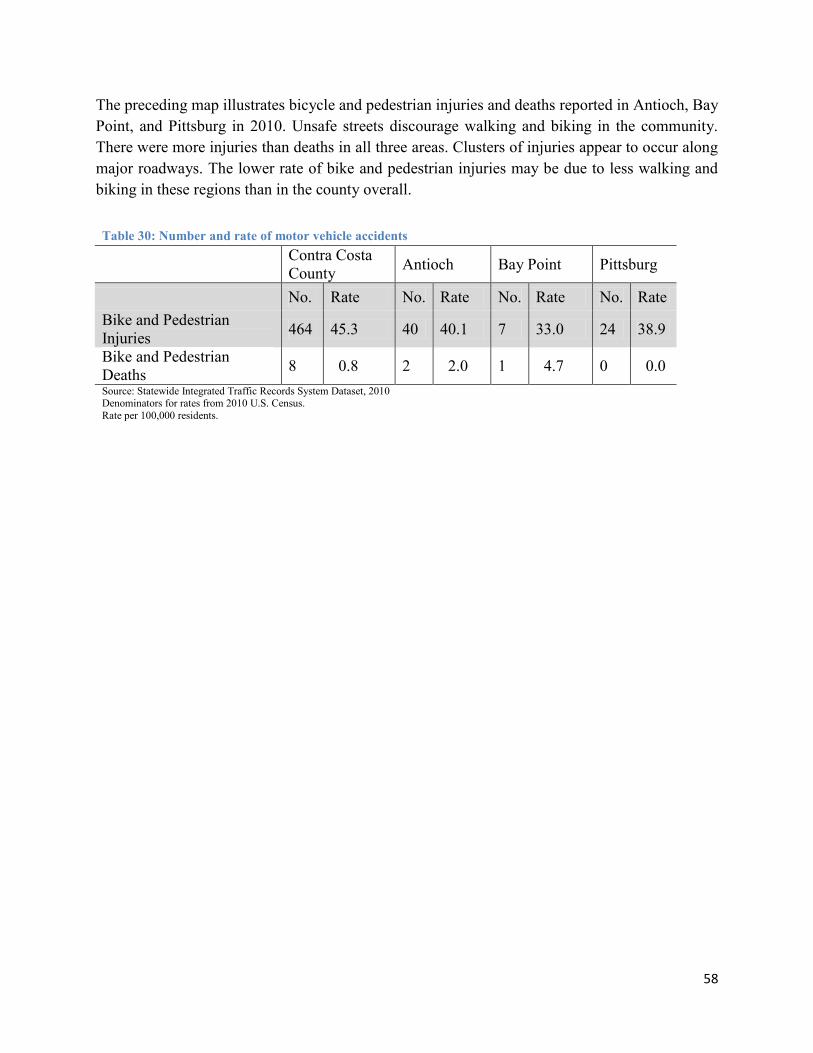
58
The preceding map illustrates bicycle and pedestrian injuries and deaths reported in Antioch, Bay Point, and Pittsburg in 2010. Unsafe streets discourage walking and biking in the community. There were more injuries than deaths in all three areas. Clusters of injuries appear to occur along major roadways. The lower rate of bike and pedestrian injuries may be due to less walking and biking in these regions than in the county overall.
Table 30: Number and rate of motor vehicle accidents
Contra Costa County Antioch Bay Point Pittsburg
No. Rate No. Rate No. Rate No. Rate Bike and Pedestrian Injuries 464 45.3 40 40.1 7 33.0 24 38.9
Bike and Pedestrian Deaths 8 0.8 2 2.0 1 4.7 0 0.0 Source: Statewide Integrated Traffic Records System Dataset, 2010 Denominators for rates from 2010 U.S. Census. Rate per 100,000 residents.

59
Public Transportation Availability
The above map illustrates the proximity to transit stations and bus stops in the cities of Bay Point, Pittsburg, and Antioch. The majority of the population resides within a quarter mile of a bus stop.
Table 31: Public transit availability by city Contra Costa County Antioch Bay Point Pittsburg People living ¼ mile from a bus stop 86.5 % 90.4 % 96.4 % 93.3 %
People living ¼ mile from a transit center 2.8 % 0.0 % 7.4 % 2.5 % Source: Metropolitan Transportation Commission (MTC) of Oakland, 2010

60
Walkability

61
The preceding map illustrates the walkability of schools located in the cities of Antioch, Bay Point, and Pittsburg. Many schools in these communities are in car dependent locations according to Walkscore.com. Walk scores are based on an algorithm that calculates the distance to amenities including businesses, parks, theaters, and other common destinations. Amenities within a ¼ mile of the location are assigned the maximum number of points, a high walk score and amenities that are one or more miles away are not given any points. The points are summed and normalized to yield a score from 0 to 100, 0 being “car-dependent” and 100 being a “walker’s paradise.”
Outdoor Air Quality An air pollutant of particular concern in East Contra Costa County is ground level ozone, also called smog. Ground level ozone is created when precursors (volatile organic hydrocarbons and nitrogen dioxide, two combustion byproducts of cars, factories, and other sources) react in sunlight and heat.
High ozone levels can cause eye and lung irritation and breathing difficulties making outdoor physical activity unsafe and challenging
The Bay Area Air Quality Management District (BAAQMD) maintains a network of ambient air quality monitoring stations throughout the Bay Area that measure ozone, as well as a number of other pollutants. The U.S. Environmental Protection Agency (EPA), and the California Air Resources Board (CARB) have set health-based standards for ozone. If Bay Area ozone levels exceed these standards on too many days a year, the whole area is considered out of attainment with these standards. The Bay Area is currently considered out of attainment for both state and federal ozone standards.
There are two ambient, or background, air quality monitoring stations relevant to East Contra Costa County, in Concord and in Bethel Island. In 2011, the Bethel Island monitoring station had the second highest 3-year average ozone level of all Bay Area stations. It also recorded the third highest number of days exceeding the state’s ozone standard. In 2011, the Concord station had the fourth highest 3-year average ozone level of all Bay Area monitoring stations, and the second highest number of days exceeding the state’s standard.
Ozone concentrations in East Contra Costa are highest late in the afternoon on hot summer days, after ozone precursors have had a chance to react in sunlight. On-shore weather patterns in the Bay Area also contribute to East County’s high ozone levels, because precursors emitted in the western part of the county are blown east during the day to create ozone.

62
Outdoor air quality monitoring by Bay Area Air Quality Management District
Monitoring Station
2011 three-year Average for Ozone
2011three-year Average for Ozone at the Monitoring station with the highest Bay Area Average
Number of days in 2011 out of compliance with the California 8-hour Ozone standard
Number of days in 2011 out of compliance with the California 8-hour Ozone standard at the Monitoring station with the highest Bay Area number
Bethel Island 74 ppm 76 ppm 4 9
Concord 73 ppm 76 5 9
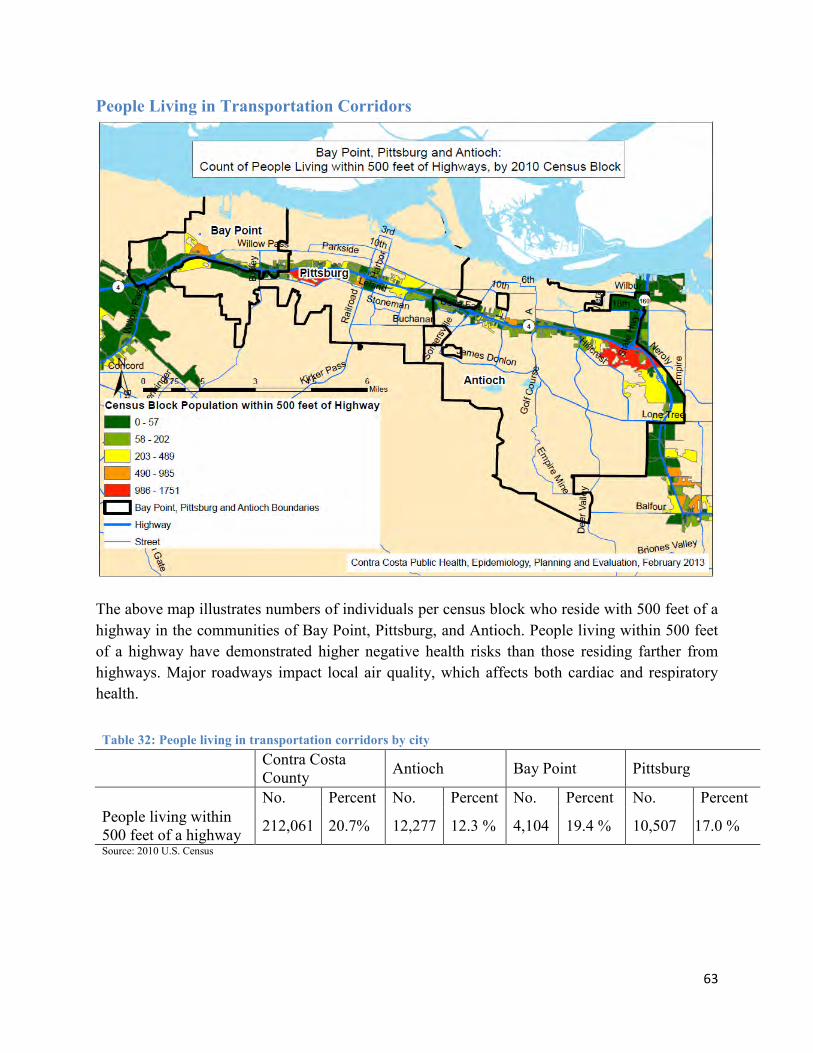
63
People Living in Transportation Corridors
The above map illustrates numbers of individuals per census block who reside with 500 feet of a highway in the communities of Bay Point, Pittsburg, and Antioch. People living within 500 feet of a highway have demonstrated higher negative health risks than those residing farther from highways. Major roadways impact local air quality, which affects both cardiac and respiratory health.
Table 32: People living in transportation corridors by city
Contra Costa County Antioch Bay Point Pittsburg
No. Percent No. Percent No. Percent No. Percent People living within 500 feet of a highway 212,061 20.7% 12,277 12.3 % 4,104 19.4 % 10,507 17.0 % Source: 2010 U.S. Census

64
Travel Time to Workplace
The above map illustrates commute times for workers residing in Antioch, Bay Point, and Pittsburg by census tract. Neighborhoods in all three communities have a high percentage of workers who travel more than 30 minutes to work. Neighborhoods with the highest percentage of workers commuting more than 30 minutes are located in Antioch. Longer work travel time decreases time available for physical activity and may decrease a sense of social cohesion.
Table 33: Travel time to workplace by city Contra Costa County Antioch Bay Point Pittsburg Mean travel time to work (minutes) 32.2 38.1 35.1 34.6 Source: United States Census Bureau, 2007-2011 American Community Survey 5-Year Estimates
65
Housing Description of Data
Housing data is collected through the U.S. Census Department’s American Community Survey. The ratio of income to housing expense, rent or mortgage, is relevant to both income stability and housing stability. Several census tracts in Antioch, Pittsburg, and Bay Point show high housing costs relative to income. In addition, some census tracts have more than 25% of residents report not having lived at the same residence for the past year. The foreclosure crisis, which strongly affects these three communities, has likely contributed to housing instability.
Why is this important for obesity prevention? Housing affordability, residential stability, and crowding have considerable health consequences. As families pay more than they can afford for housing, funds to meet other needs such as healthy food, transportation, and health insurance are reduced. Residential instability and crowding can lead to increased levels of psychological distress, helplessness, and high blood pressure. The foreclosure crisis may have led to increased rates of crowding, as displaced homeowners lack the money or credit for their own apartment or home.
Source: National Center for Healthy Housing, Housing and Health: New Opportunities for Dialogue. Available online at http://www.nhc.org/media/files/Health%20&%20Housing%20New%20Opportunities_r3%20final.pdf
“The cost of living and access to public transportation makes Bay Point an ok place to live.” ~Bay Point Key Informant
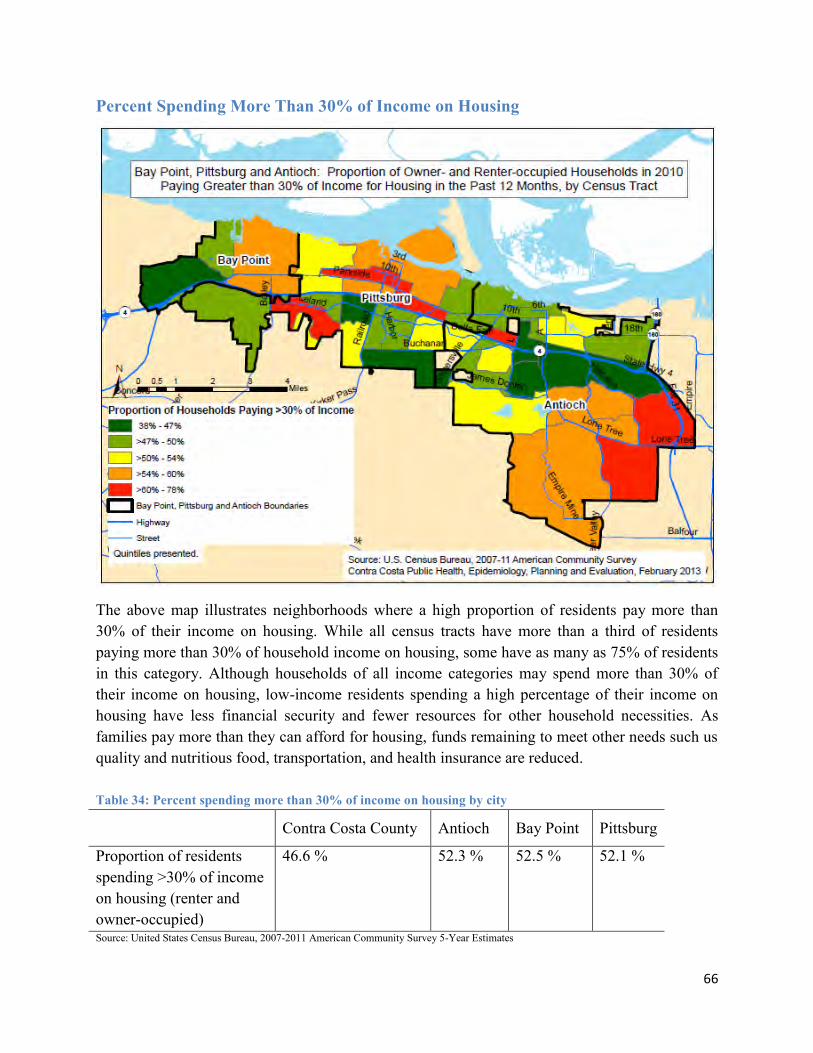
66
Percent Spending More Than 30% of Income on Housing
The above map illustrates neighborhoods where a high proportion of residents pay more than 30% of their income on housing. While all census tracts have more than a third of residents paying more than 30% of household income on housing, some have as many as 75% of residents in this category. Although households of all income categories may spend more than 30% of their income on housing, low-income residents spending a high percentage of their income on housing have less financial security and fewer resources for other household necessities. As families pay more than they can afford for housing, funds remaining to meet other needs such us quality and nutritious food, transportation, and health insurance are reduced.
Table 34: Percent spending more than 30% of income on housing by city Contra Costa County Antioch Bay Point Pittsburg
Proportion of residents spending >30% of income on housing (renter and owner-occupied)
46.6 % 52.3 % 52.5 % 52.1 %
Source: United States Census Bureau, 2007-2011 American Community Survey 5-Year Estimates

67
Foreclosure Rate
The above map illustrates neighborhoods with the highest foreclosure rates in Bay Point, Pittsburg, and Antioch. At the time this data was collected, it is estimated that neighborhoods in Antioch and Pittsburg had as many as 10% of homes in foreclosure. The foreclosure crisis began in 2005, although the above data represents only January 2007 to June 2008. Please note that the foreclosure crisis is believed to have begun in 2005 and continued beyond 2008, therefore given the limited data available for this map, we do not illustrate the full or differential impact of the crisis over time for the three communities. For Jan-Aug 2007, two Antioch zip codes demonstrated the highest number and rate of foreclosure in Contra Costa County, one of which demonstrated the highest rate of foreclosure in the Bay Area.
Table 35: Foreclosure rate by city Contra Costa County Antioch Bay Point Pittsburg
Foreclosure Rate 5.7 % 8.0 % 8.2 % 9.3 % Source: Housing and Urban Development (HUD), Jan 2007- June 2008


69
Social Connectivity Description of Data
Although an elusive indicator, social connectivity or connectedness is important to understand communities. This report uses civic participation and resident mobility as measures of social connectivity, as individuals who live in the same area longer and who have greater civic participation may feel a greater connection to their community. We also use linguistic isolation as a means to measure community isolation. The relatively large Spanish-speaking population in these communities has many resources and linguistic isolation may not be a good measure of social isolation. However, linguistic isolation remains a barrier to the access of human and social services, job opportunities, and communication with other social or linguistic groups. These population level indicators don’t fully describe a community’s social environment; the use of qualitative measures and expert opinion provide added insight.
Why is this important for obesity prevention? The World Health Organization (WHO) has determined that higher levels of perceived social connectedness are linked to lower blood pressure rates, better immune responses, and lower levels of stress hormones, all of which promote the prevention of chronic disease. Conversely, the increase of stress created by social isolation can lead to chronic disease risk factors such as depression, overeating, and a lack of physical activity. Communities with high levels of income inequality tend to have less social cohesion and more violent crimes.
Social cohesion may also be an indicator for predicting levels of community engagement necessary for comprehensive obesity prevention efforts.
Source: World Health Organization (WHO) Social Determinants of Health (2nd Edition) Available online at http://www.euro.who.int/__data/assets/pdf_file/0005/98438/e81384.pdf
“The City of Antioch
has always had a 4th
of July event and
because of budget
cuts the city had to
cancel this event
and it was really
sad to see families
and residents who
showed up and
there was no
event….. So, the
leaders in the
community got
together and went
fundraising and
raised $65,000 for
following year,
which was this year
2012 and we had
our big July 4th
celebration with a
parade and
everything. To me
every city needs to
have events that
are free for
families.”
~Antioch Key Informant

70
Residential Mobility
The above map illustrates neighborhoods with the highest proportion of residents who had not been living at the same residence in the past year at the time of the survey. Some census tracts in all three communities have as many as one third of residents who had not lived in the same residence in the past year.
Table 36: Residential mobility by city Contra Costa County Antioch Bay Point Pittsburg
Proportion of population not living at the same residence within the past year
14.8 % 18.7 % 15.0 % 17.6 %
Source: U. S. Census Bureau, 2007-2011 American Community Survey 5-Year Estimates

71
Voter Turnout
Voter turnout is a common measure for civic participation. The above map illustrates electoral precincts in Antioch, Bay Point, and Pittsburg with the highest voter turnouts. All three communities have precincts with the highest and lowest relative turnout, with an overall turnout rate higher among precincts in Antioch. Voter turnout is lower in all three regions than in the county as a whole. Voter turnout is relative to registered voters and does not reflect the percentage of all eligible voters (including those not registered) or the percentage of the population that is eligible to vote.
Table 37: Voter turnout - 2010 General Election Contra Costa County Antioch Bay Point Pittsburg
Percent of votes cast 66.1 % 52.5 % 37.0 % 47.7 % Source: Contra Costa County Elections Division, 2010 General Election
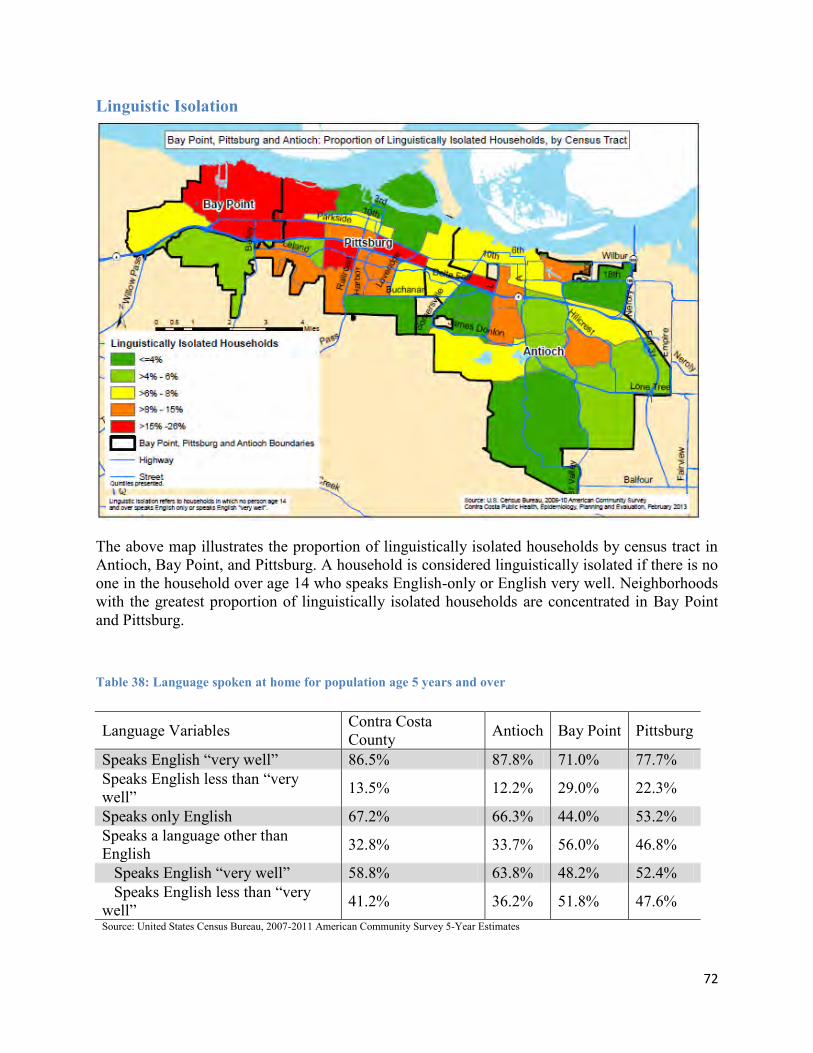
72
Linguistic Isolation
The above map illustrates the proportion of linguistically isolated households by census tract in Antioch, Bay Point, and Pittsburg. A household is considered linguistically isolated if there is no one in the household over age 14 who speaks English-only or English very well. Neighborhoods with the greatest proportion of linguistically isolated households are concentrated in Bay Point and Pittsburg.
Table 38: Language spoken at home for population age 5 years and over
Language Variables Contra Costa County Antioch Bay Point Pittsburg
Speaks English “very well” 86.5% 87.8% 71.0% 77.7% Speaks English less than “very well” 13.5% 12.2% 29.0% 22.3%
Speaks only English 67.2% 66.3% 44.0% 53.2% Speaks a language other than English 32.8% 33.7% 56.0% 46.8%
Speaks English “very well” 58.8% 63.8% 48.2% 52.4% Speaks English less than “very well” 41.2% 36.2% 51.8% 47.6% Source: United States Census Bureau, 2007-2011 American Community Survey 5-Year Estimates

73
Key Informant Interviews
RESULTS OF KEY INFORMANT INTERVIEWS WITH LOCAL LEADERS &
COMMUNITY RESIDENTS
METHODOLOGY
Between November 2012 and January 2013, the Contra Costa Health Services (CCHS) Community Wellness & Prevention Program (CWPP) conducted key informant interviews with selected community members and representatives from various organizations in Antioch, Bay Point, and Pittsburg. A key informant interview protocol was developed by the CWPP team. Community leaders and residents were chosen based on recommendations from the Healthy East County Steering Committee and CWPP staff with long-term experience in East Contra Costa. The mode of data collection included face-to-face and phone interviews, lasting about 45-60 minutes. Twelve interviews were conducted with representatives from community-based organizations, school district nutrition services, city and county government, food banks, and faith-based organizations.
The diversity of the informants provided a wealth and range of information. Each interviewee received the same questions. The questions were structured in the following topics: community strengths and emerging issues, childhood obesity, food environment, food access and food security, physical activity and active living, the built environment, and crime and violence.
Limitations of the interviews include the informants own impressions and biases.
Key informant interview questions were adapted from the Healthy Kids, Healthy Communities – Healthy Community, Healthy Eating and Active Living Policies and Practices – Key Informant Interview Sample Questions. Retrieved from http://www.healthykidshealthycommunities.org/HKHC_presentations
TOPIC: COMMUNITY STRENGTHS FINDINGS: Informants stated that overall, Bay Point, Antioch, and Pittsburg are good areas to live due to affordable housing, accessible transportation, good trail systems, strong long-term resident commitment to the community, rich diversity, and active faith groups. In Antioch, when the city faced a large budget cut due to a high foreclosure rate, residents volunteered to create neighborhood watch programs, an effective graffiti abatement team, and a group that raised money for a big community celebration.

74
COMMENTS FROM KEY INFORMANTS: “The City of Antioch has always had a 4th of July event and because of budget cuts the city had to cancel this event and it was really sad to see families and residents who showed up and there was no event. So, the following year people got really upset and people in general formed a group and said, ‘We are going to have a 4th of July event next year.’ So, the leaders in the community got together and went fundraising and raised 65,000 dollars for following year, which was this year 2012 and we had our big July 4th celebration with a parade and everything. To me every city needs to have events that are free for families.” ~Antioch
TOPIC: EMERGING ISSUES FINDINGS: Informants noted a big concern for the high foreclosure rate in these three geographical areas, and its impact on the fabric of the community, including a decrease in city resources and increases in crime and social and cultural clashes between long-term residents and new arrivals seeking affordable housing. In addition, inadequate public transportation, poor access to healthy, affordable foods, lack of affordable housing and safety were identified as problems affecting neighborhoods. Lack of access to healthcare and health prevention services are also perceived as a problem. In Pittsburg, an informant noted that in addition to obesity and obesity related diseases, HIV and cancer are recognized as issues that need to be addressed. COMMENTS FROM KEY INFORMANTS:
“Antioch was hit hard by the first and second foreclosure wave…this makes the community not stable. The more foreclosures you have, the less property taxes you have. This is really reflected in the schools. Unfortunately there isn’t that much money available to schools, and we see that obviously in the graduation rates and drop-out rates.” ~Antioch
TOPIC: CHILDHOOD OBESITY FINDINGS: Informants identified childhood obesity as a health issue in these three communities. Poverty, lack of access to healthy food, lack of walking opportunities, a disproportionate availability of fresh produce compared to unhealthy food, and violence were recognized as contributors to the rising obesity crisis.
75
COMMENTS FROM KEY INFORMANTS: “Childhood obesity is definitely a problem in our community (Pittsburg). …I can see it with my own eyes being out in the community. I do see a shift in kinder and first graders, but kids in middle school and older you see a prevalence of obesity.”
~Pittsburg TOPIC: FOOD ENVIRONMENT FINDINGS: Informants highlighted several barriers to nutritious eating including a lack of places to shop for healthy foods and fresh produce, smaller markets that do not carry a wide selection of fresh produce, a lack of access to farmer’s markets, and high food costs. Informants reported that residents have to go to several stores to meet their nutritional needs, and that the high price of gas reduces the availability of money for food and basic necessities. Augmenting the problem, informants stated that these three communities have an over-saturation of fast food chains offering cheap yet unhealthy food. Further, they said, in Pittsburg, the marketing and advertisement of these unhealthy foods is hard to escape. COMMENTS FROM KEY INFORMANTS:
“The 7-11 down the corner every now and then will have a carrot cake…that is their perception of a healthy choice. They are marketers; they are going to put a show of what they want people to buy.” ~Pittsburg
TOPIC: FOOD ACCESS /FOOD SECURITY FINDINGS: Informants revealed that some 99¢ stores have fresh produce on Tuesdays, and that word of mouth is significant in finding places with good prices and quality produce. Some of the local places where residents shop are: Mi Pueblo, 99¢ stores, Safeway, Raley’s, Winco, and Grocery Outlet. The food bank has a truck that brings fresh fruits and vegetables to certain locations. Residents must fill out a form stating their income and number of family members in order to receive the free produce. Community and school gardens are found in all three communities. Pittsburg, in particular the school district, is embracing school gardens to increase access to fresh produce. Some families have opted to grow their own food in their backyards, or to raise chickens, in spite of not having a local ordinance that supports this practice. Summer school lunch programs and faith-based organizations with food pantries are important for these communities.

76
COMMENTS FROM KEY INFORMANTS: “The standard grocery stores are typical places residents are able to shop for food; of course these grocery stores have healthy options. Whether they are affordable or not, that is the big question.” ~Bay Point
TOPIC: PHYSICAL ACTIVITY & ACTIVE LIVING FINDINGS: Informants in the three communities reported that trails are one venue for family exercise; but they unfortunately have a reputation for being unsafe and dangerous at night. Soccer, baseball, and bicycling are other types of exercise residents engage in for recreation and physical activity. In Antioch, residents feel that physical activity programs aren’t affordable to low-income residents. COMMENTS FROM KEY INFORMANTS: “I think that there are physical activity programs, but they are not very cost friendly.”
~Antioch
TOPIC: THE BUILT ENVIRONMENT FINDINGS: Informants revealed that all three geographical areas have a prevalence of abandoned houses that lead to vandalism and crime. Residents like to use trails, but fear crime and violence, especially when using them at night. In Antioch, budget cuts have led to a downsizing of city maintenance divisions. There’s desire for more bike lanes, but it was pointed out that even where there are lanes, such as in Pittsburg, automobiles dominate the streets scaring bicycle riders. Access to grocery stores depended on the neighborhood. COMMENTS FROM KEY INFORMANTS:
“They can improve the bike lanes out here. For example when I am riding my bike, I wish there were more bike lanes. There are a few but I would like to see that extended to Willow Pass Road; that is a very busy street and a very scary ride!”
~Pittsburg

77
TOPIC: CRIME & VIOLENCE FINDINGS: Informants expressed a rising concern with property crime, car vandalism, home invasions, gang violence, school truancy, and youth loitering. Abandoned houses, abandoned cars, abandoned shopping carts, and graffiti are on the rise in some of the areas. In some communities there are emerging neighborhood watch programs; and in some communities residents have mobilized and created volunteer programs such as the Antioch graffiti abatement program run by local volunteers. COMMENTS FROM KEY INFORMANTS:
“I would not want my kids to walk by themselves to school. Our community is getting crowded. There are people even in our community who are getting assaulted, you hear things that happen to kids, and I will not take that chance.” ~Antioch “Violence is a problem. The prevalence of violence in the streets, in the schools, in our culture, they are all related and it seems that is the way of solving conflicts; that could be deadly. There are other ways to solve conflicts.” ~Bay Point


79
Conclusion and Recommendations
The Healthy East County Steering Committee, comprising representatives from community-based organizations, schools, county government, and health care providers working in Antioch, Pittsburg and Bay Point, guided the writing of this report. Committee members, and their work, are significant assets to creating a healthier environment in East County. They, along with data from key informant interviews, helped to identify important local factors that can support the development of obesity prevention projects. These factors include aspects of the built environment, such as parks, trails, transportation systems, and the location of healthy food outlets; the efforts of individual schools, and successful local programs. They also helped identify local leaders and resident groups who can help mobilize to make Antioch, Pittsburg and Bay Point more vibrant, healthier places to live.
The Steering Committee helped to choose the indicators for this report, which illustrate the health status and environmental determinants of obesity in these three communities. The report brings to light marked health disparities in death rates from chronic health conditions linked to obesity such as cardiac disease, stroke, cancer, and diabetes. The rate of these conditions is higher in Antioch, Bay Point, and Pittsburg than in Contra Costa County as a whole. It’s also higher than in selected communities in Central and West County. Childhood obesity disproportionately affects Latinos and African Americans in these communities.
As presented in the data, population levels have increased dramatically in Antioch, Bay Point and Pittsburg. These communities also have high rates of poverty and low rates of educational attainment – both strongly associated with obesity and chronic diseases. Poverty and education are social determinants of health, associated with environments that don’t support healthy lifestyles by having a lack of access to nutritious, affordable food and to safe, appealing places to be physically active. Healthy food and exercise are major contributors to today’s alarming obesity health crisis.
Recommended Strategies to Prevent Obesity
The Centers for Disease Control and Prevention (CDC) has developed a series of strategies and measurements to prevent obesity in the United States. These national strategies were designed to inspire communities to implement new policy and environmental initiatives aimed at reversing the obesity epidemic. Communities nationwide are successfully applying these strategies, which can be adapted to the Bay Point, Antioch, and Pittsburg. They include:
Promoting the availability of affordable, healthy foods and beverages
Supporting nutritious food and beverage choices
80
Encouraging breastfeeding
Encouraging physical activity or limiting sedentary activity among children and youth
Creating safe communities that support physical activity
Encouraging communities to organize for change
Next Steps
Contra Costa Health Services and the Community Wellness and Prevention Program (CWPP) are committed to reversing East County’s adverse health statistics and supporting the considerable assets in the region. We are mindful that the work ahead cannot be done on our own or in a vacuum. Critical to our success is a genuine collaboration in partnership with county and local government, community organizations, schools, faith-based leaders, residents and others. This report is a first step towards collective action. Our goal is to use this data to inform stakeholders and stimulate action to reduce rates of obesity and other risk factors for chronic diseases. We hope to bring East County’s health challenges to the attention of the philanthropic community and funders to encourage financial investment in much needed interventions to promote community health in this vital region.
“Reversing the obesity epidemic is a shared responsibility. Social and environmental changes are influenced by the efforts of many. There is a role for everyone in discovering ways to create supportive environments to help individuals and families to easily make healthy food choices, enjoy a physically active lifestyle, and move toward a healthy weight.” ~Centers for Disease Control and Prevention

81
Limitations Population level data is collected in multiple ways by federal, state, and local entities. In the U.S. Census American Community Survey, sampling at the census tract level is aggregated over a five-year period to obtain adequate numbers to create estimates. These estimates are not a point in time and can have high levels of uncertainty. Caution should be taken when drawing inferences from comparing estimates from this survey at the census tract level. Morbidity data is often not collected at a sub-county level such as cities or in unincorporated areas such as Bay Point; therefore we must infer morbidity rates from larger geography estimates. For low prevalence responses, high uncertainty inhibits our ability to draw conclusions from comparisons. As there are multiple data sources, data is often collected at different time points for different purposes. An accurate estimate of uncertainty is always required to draw conclusions from comparing point estimates. In addition, information collected from informants is limited by their own biases and by sample size. Informant interviews were conducted during the November-December holiday season which created scheduling challenges and limited the number of people available.

82
Appendices
East County Health Service Facilities Health Service Facility Location
Antioch Health Center 3505 Lone Tree Way, First Floor Antioch, 94509
Bay Point Family Health Center 215 Pacifica Avenue, Bay Point, 94565
Brentwood Health Center 171 Sand Creek Road, Suite A Brentwood, 94513
Contra Costa County Mobile Clinics
Antioch High School 700 W. 18th St., Antioch 94509 Black Diamond High School 1157 Stoneman, Pittsburg 94596 Deer Valley High School 4700 Lone Tree Way, Antioch 94531 Fremont Elementary 1413 F St., Antioch 94509 Heights Elementary 163 West Blvd., Pittsburg 94565 Marina Vista Elementary 50 East 8th St., Pittsburg 94565 Marsh Elementary 2304 G St., Antioch 94509 Parkside Elementary 985 West 17th St., Pittsburg 94565 Pittsburg High School 1750 Harbor St., Pittsburg 94565
John Muir Medical Center-Brentwood 2400 Balfour Rd. Brentwood, CA 94513
Kaiser Permanente-Antioch 4501 Sand Creek Road, Antioch, 94531; 3400 Delta Fair Blvd., Antioch, 94509
La Clinica de La Raza-Pittsburg 2240 Gladstone Drive Suite 4 Pittsburg, 94565
Pittsburg Health Center 2311 Loveridge Road, Pittsburg, 94565

83
Data Sources
2010 Fitnessgram
http://www.cde.ca.gov/ta/tg/pf/pftresults.asp
American Community Survey 2006-2010 http://www.census.gov/acs/www/about_the_survey/american_community_survey_and_2010_census/
Bureau of Labor Statistics http://www.bls.gov/data/
California Department of Education Data Quest 2010 – 2012
http://www.cde.ca.gov/ds/sd/cb/dataquest.asp
California Department of Finance – Annual Historic Population Estimates
http://www.dof.ca.gov/research/demographic/reports/view.php
California Health Interview Survey (CHIS)
http://healthpolicy.ucla.edu/chis/Pages/default.aspx
California Office of Statewide Planning and Development Patient Discharge Data Files
http://www.oshpd.ca.gov/HID/Products/PatDischargeData/PublicDataSet/index.html
Contra Costa County Election Division
http://www.cocovote.us/content.aspx?id=66
Contra Costa Public Health, Epidemiology, Planning & Evaluation Unit
http://cchealth.org/health-data/
Criminal Justice Profiles, Contra Costa County 2009
http://stats.doj.ca.gov/cjsc_stats/prof09/07/11a.pdf
Federal Reserve Home Mortgage Disclosure Act Data
http://www.ffiec.gov/hmda/
Metropolitan Transportation Commission (MTC) of Oakland – 2010
http://www.mtc.ca.gov/maps_and_data/index.htm
Office of Federal Housing Enterprise Oversight Data
http://www.fedstats.gov/key_stats/index.php?id=ofheo
Statewide Integrated Traffic Records System Database 2010
http://iswitrs.chp.ca.gov/Reports/jsp/userLogin.jsp
US Census Bureau – 2010 Census
http://www.census.gov/2010census/
US Department of Housing and Urban Development (HUD)
http://www.huduser.org/portal/datasets/HUD_data_matrix.html
Walkscore.com 2010
http://www.walkscore.com/

85
References California Center for Public Health Advocacy (CCPHA). (2010). Overweight and obesity among children
by California cities report. Retrieved from
http://www.publichealthadvocacy.org/research/overweightdocs2012/Overweight_Contra%20Cost
a%20County%20fact%20sheet.pdf
Centers for Disease Control and Prevention (CDC). (2011). Health disparities and inequalities report.
Retrieved from http://www.cdc.gov/mmwr/pdf/other/su6001.pdf
Centers for Disease Control and Prevention (CDC). (2009). Recommended community strategies and
measurements to prevent obesity in the United States. Retrieved from
http://www.cdc.gov/mmwr/preview/mmwrhtml/rr5807a1.htm
Centers for Disease Control and Prevention (CDC). (2009). State indicator report on fruits and
vegetables consumption 2009. Retrieved from
http://www.cdc.gov/nutrition/downloads/StateIndicatorReport2009.pdf
Centers for Disease Control and Prevention (CDC). (2010). State indicator report on physical activity
2010. Retrieved from
http://www.cdc.gov/physicalactivity/downloads/PA_State_Indicator_Report_2010.pdf
Centers for Disease Control and Prevention (CDC). (2011). Children’s food environment state indicator
report 2011. Retrieved from
http://www.cdc.gov/obesity/downloads/ChildrensFoodEnvironment.pdf
Centers for Disease Control and Prevention (CDC). (2011). School health guidelines to promote healthy
eating and physical activity. Retrieved from http://www.cdc.gov/mmwr/pdf/rr/rr6005.pdf
Healthy Kids, Healthy Communities. (2012). Healthy community, healthy eating and active living
policies and practices - key informant interview sample questions. Retrieved from
http://www.healthykidshealthycommunities.org/HKHC_presentations

86
National Center for Healthy Housing. (2012). Housing and health: New opportunities for dialogue.
Retrieved from
http://www.nhc.org/media/files/Health%20&%20Housing%20New%20Opportunities_r3%20fina
l.pdf
Prevention Institute. (2010). Addressing the intersection: Preventing violence and promoting healthy
eating and active living. Retrieved from
http://www.preventioninstitute.org/component/jlibrary/article/id-267/127.html
Robert Wood Johnson Foundation. (2009). Education matters for health. Retrieved from
http://www.rwjf.org/content/rwjf/en/research-publications/find-rwjf-research/2009/09/education-
matters-for-health.html
Robert Wood Johnson Foundation. (2008). Overcoming obstacles to health Retrieved from
http://www.commissiononhealth.org/PDF/ObstaclesToHealth-Highlights.pdf
Schildt, C. (2012). Building a robust anti-poverty network in the Bay Area. Retrieved from Federal
Reserve Bank of San Francisco:
http://www.frbsf.org/publications/community/wpapers/2012/wp2012-03.pdf
The Surgeon General’s Report. (2010). A healthy and fit nation. Retrieved from
http://www.surgeongeneral.gov/initiatives/healthy-fit-nation/obesityvision2010.pdf
United States Government Accountability Office – Report to Congressional Requesters. (2007). Poverty
in America. Retrieved from http://www.gao.gov/new.items/d07344.pdf
World Health Organization (WHO). (2003). Social determinants of health (second edition). Retrieved
from http://www.euro.who.int/__data/assets/pdf_file/0005/98438/e81384.pdf