Health| Happiness | Wealth HEALTH | HAPPINESS | WEALTH · Yuyuan platform. As of 31st Dec 2018,...
37
1 Financial Results for 2018 March 26, 2019 HEALTH | HAPPINESS | WEALTH Health| Happiness | Wealth
Transcript of Health| Happiness | Wealth HEALTH | HAPPINESS | WEALTH · Yuyuan platform. As of 31st Dec 2018,...

1
Financial Results for 2018March 26, 2019
HEALTH | HAPPINESS | WEALTHHealth| Happiness | Wealth
Disclaimer
It is not the intention of this document to provide a full explanation of any relevant matters of Fosun International Limited (the
“Company”). You must refrain from relying on any information set out in this document. No statement, guarantee or undertaking is or
will be made or given at present or in the future in respect of the accuracy, fairness, reasonableness, correctness or completeness of
this document or any information or opinions set forth herein or any other information or opinions, whether written or oral, available to
any stakeholder or its advisers, nor is there or will there be any express or implied indication made in respect of the above content at
present or in the future. None of the Company or any of its shareholders, directors, officers, employees, affiliates, advisers or
representatives (the “Parties”) shall assume any liability, including but not limited to liability for default, for or in respect of the above
content at present or in the future. The Parties expressly state that they shall not be held liable for any loss resulting from the use of this
document or its content or in any other manner in connection with this document. It is assumed that information set out in this
document is appropriate for the current situation and such information could be subject to change without notice. None of the
Parties shall be held liable for procuring the receipt of information under this document by any recipients, updating information under
this document, or correcting any manifest error contained under this document. In the event of any conflict between this document
and the final results announcement of the Company for the whole year of 2018, and the annual report of the Company for the whole
year of 2018 (collectively, the “Annual Documents”), the Annual Documents shall prevail.
Cautionary Statement Regarding Forward-Looking Statements
This PPT includes forward-looking statements. All statements, other than statements of historical facts, that address activities, events or
developments that Fosun International Limited (the “Company”) expects or anticipates will or may occur in the future (including but
not limited to projections, targets, estimates and business plans) are forward-looking statements. The Company’s actual results or
developments may differ materially from those indicated by these forward-looking statements as a result of various factors and
uncertainties, and other risks and factors beyond our control. In addition, the Company makes the forward-looking statements
referred to herein as of today and undertakes no obligation to update these statements. The financial figures in this PPT are
calculated using the average exchange rate for the reporting period January 2018 to December 2018 (USD/CNY= 6.63379 HKD/CNY=
0.84641), and period-end exchange rate as of 2018/12/31 (USD/CNY= 6.86320 HKD/CNY= 0.87620 ), unless otherwise stated..
1
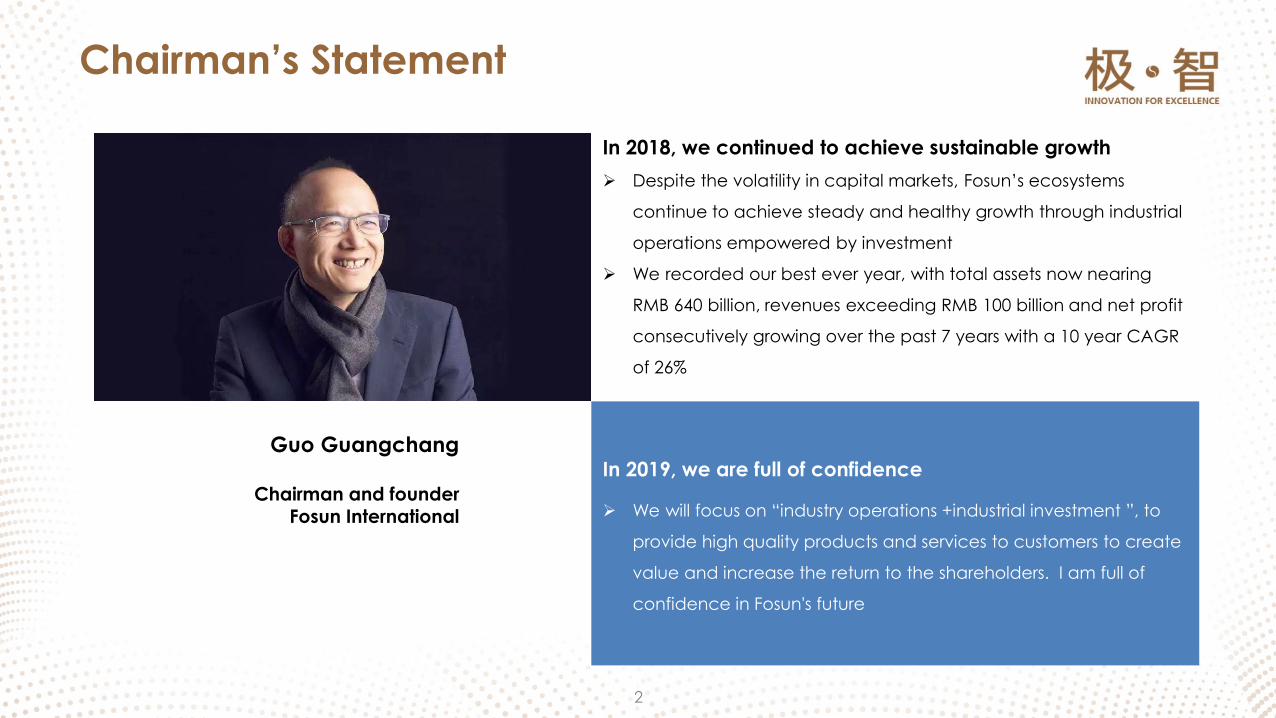
In 2018, we continued to achieve sustainable growth
Despite the volatility in capital markets, Fosun’s ecosystems
continue to achieve steady and healthy growth through industrial
operations empowered by investment
We recorded our best ever year, with total assets now nearing
RMB 640 billion, revenues exceeding RMB 100 billion and net profit
consecutively growing over the past 7 years with a 10 year CAGR
of 26%
In 2019, we are full of confidence
We will focus on “industry operations +industrial investment ”, to
provide high quality products and services to customers to create
value and increase the return to the shareholders. I am full of
confidence in Fosun's future
Guo Guangchang
Chairman and founderFosun International
2
Chairman’s Statement

1
2
3
4
A
Results highlights
Business review
Financial review
Outlook
Appendix
3
Table of Contents
RESULTS HIGHLIGHTS1
Note:1. Adjusted NAV per share = [market value of listed investments held at the group level+ the fair value of unlisted investments estimated by the management utilizing precedent transactions analysis or comparable company analysis-the net
debt at the group level] / the total issued number of the Company 2. Total debt includes short-term and long-term interest-bearing borrowings and convertible bonds; Total capital equals to equity plus total debt; 3. Net Gearing ratio = net debt /
equity, net debt = total debt - cash and bank balances and term deposits; 4. The dividend proposal of the board of directors is subject to adoption by the general meeting of shareholders.
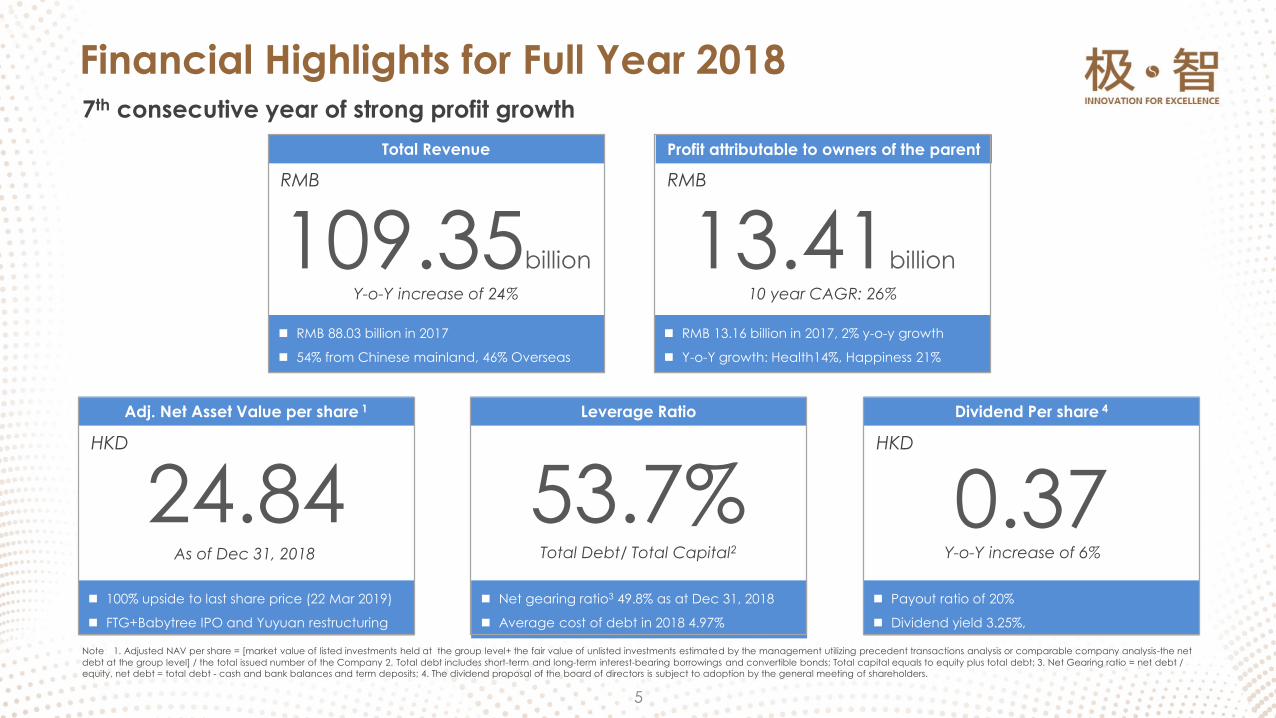
Financial Highlights for Full Year 20187th consecutive year of strong profit growth
5
Total Revenue
109.35billion
RMB 88.03 billion in 2017
54% from Chinese mainland, 46% Overseas
Y-o-Y increase of 24%
RMB
Profit attributable to owners of the parent
13.41billion
RMB 13.16 billion in 2017, 2% y-o-y growth
Y-o-Y growth: Health14%, Happiness 21%
10 year CAGR: 26%
RMB
Dividend Per share 4
Payout ratio of 20%
Dividend yield 3.25%,
Y-o-Y increase of 6%
0.37HKD
Leverage Ratio
53.7% Net gearing ratio3 49.8% as at Dec 31, 2018
Average cost of debt in 2018 4.97%
Total Debt/ Total Capital2
100% upside to last share price (22 Mar 2019)
FTG+Babytree IPO and Yuyuan restructuring
24.84
Adj. Net Asset Value per share 1
As of Dec 31, 2018
HKD
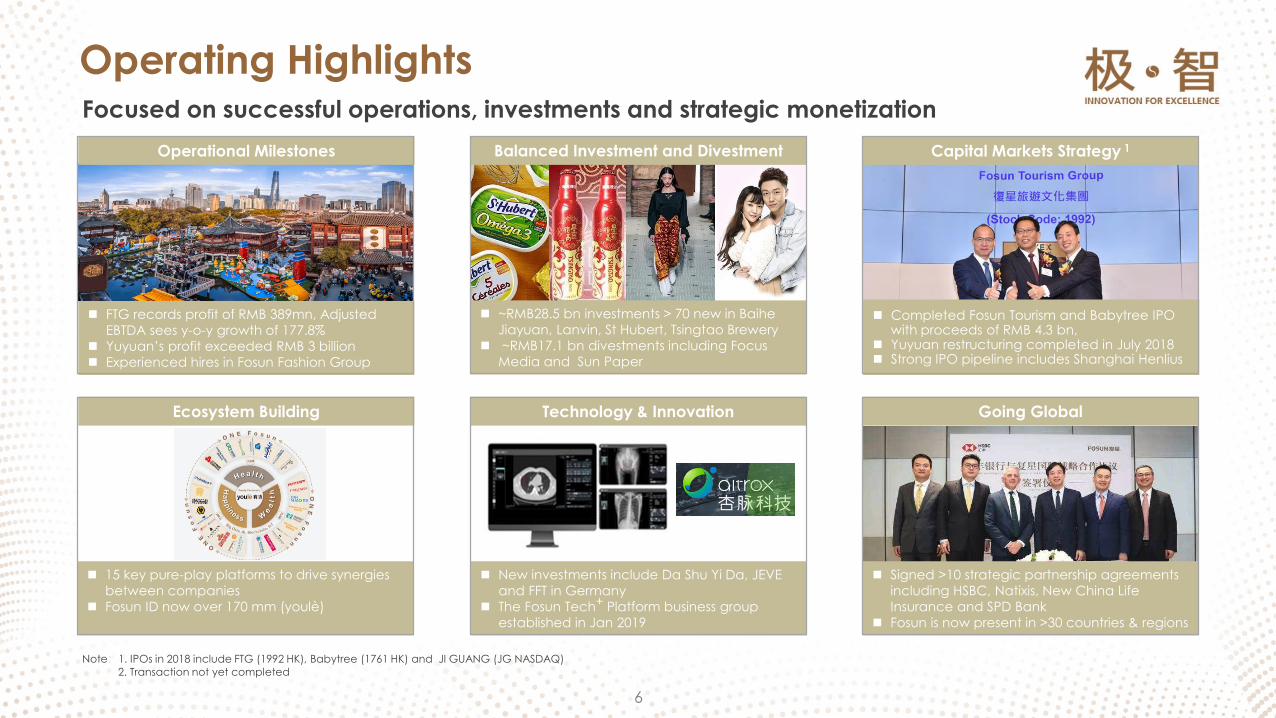
Operating HighlightsFocused on successful operations, investments and strategic monetization
6
Note:1. IPOs in 2018 include FTG (1992 HK), Babytree (1761 HK) and JI GUANG (JG NASDAQ)
2. Transaction not yet completed
Completed Fosun Tourism and Babytree IPO with proceeds of RMB 4.3 bn,
Yuyuan restructuring completed in July 2018 Strong IPO pipeline includes Shanghai Henlius
Capital Markets Strategy 1
FTG records profit of RMB 389mn, Adjusted
EBTDA sees y-o-y growth of 177.8%
Yuyuan’s profit exceeded RMB 3 billion
Experienced hires in Fosun Fashion Group
Operational Milestones
Ecosystem Building
15 key pure-play platforms to drive synergies
between companies
Fosun ID now over 170 mm (youlè)
~RMB28.5 bn investments > 70 new in Baihe
Jiayuan, Lanvin, St Hubert, Tsingtao Brewery
~RMB17.1 bn divestments including Focus
Media and Sun Paper
Balanced Investment and Divestment
Technology & Innovation
New investments include Da Shu Yi Da, JEVE
and FFT in Germany
The Fosun Tech+ Platform business group
established in Jan 2019
Going Global
Signed >10 strategic partnership agreements
including HSBC, Natixis, New China Life
Insurance and SPD Bank
Fosun is now present in >30 countries & regions

BUSINESS
REVIEW
2
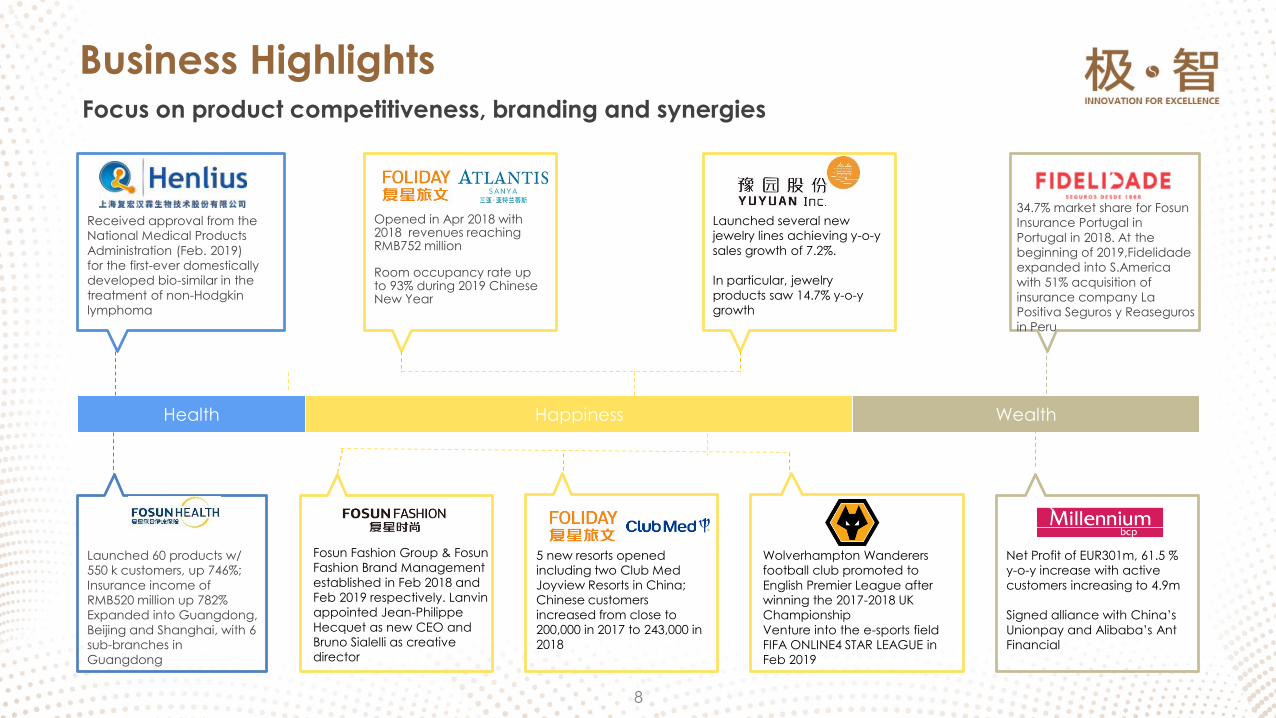
Launched 60 products w/ 550 k customers, up 746%;
Insurance income of RMB520 million up 782% Expanded into Guangdong,
Beijing and Shanghai, with 6 sub-branches in Guangdong
Health products Health WealthHappiness
Received approval from the National Medical Products
Administration (Feb. 2019) for the first-ever domestically developed bio-similar in the
treatment of non-Hodgkin lymphoma
5 new resorts opened including two Club Med Joyview Resorts in China; Chinese customers increased from close to 200,000 in 2017 to 243,000 in 2018
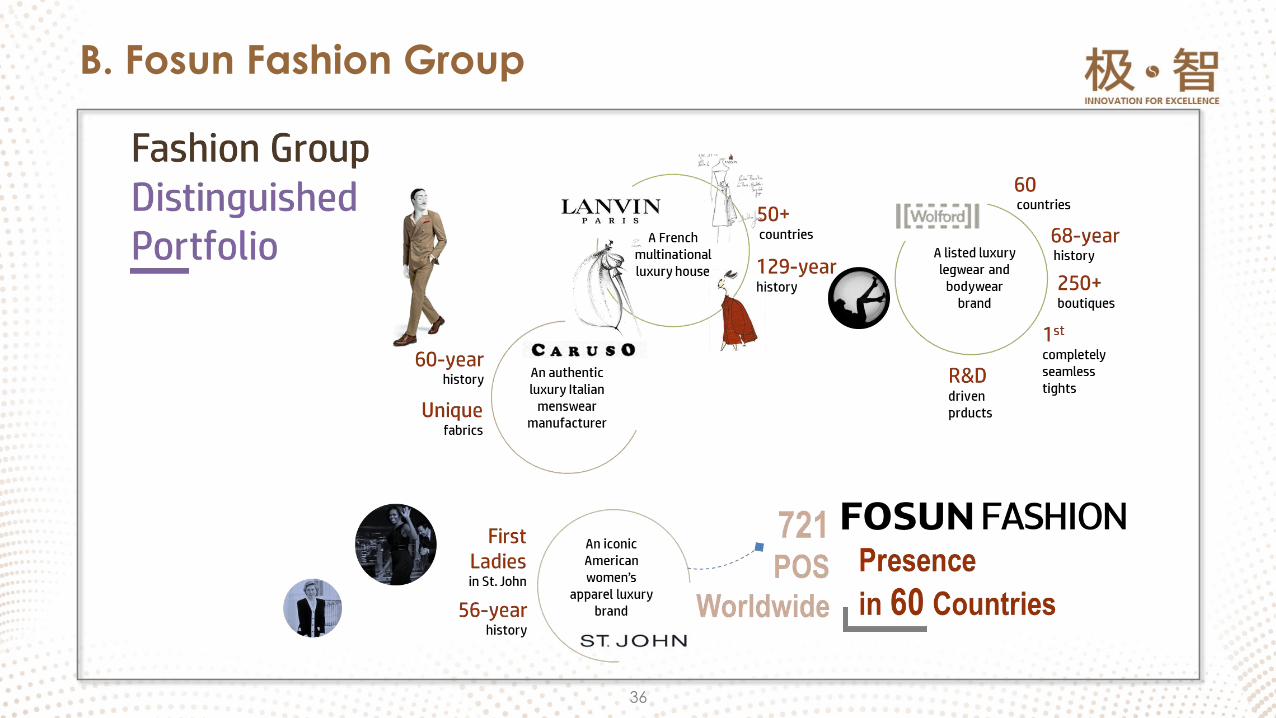
Fosun Fashion Group & FosunFashion Brand Management
established in Feb 2018 and Feb 2019 respectively. Lanvin appointed Jean-Philippe
Hecquet as new CEO and Bruno Sialelli as creative director
Opened in Apr 2018 with 2018 revenues reaching RMB752 million
Room occupancy rate up to 93% during 2019 Chinese New Year
Wolverhampton Wanderers football club promoted to
English Premier League after winning the 2017-2018 UK Championship
Venture into the e-sports field FIFA ONLINE4 STAR LEAGUE in Feb 2019
Launched several new jewelry lines achieving y-o-y
sales growth of 7.2%.
In particular, jewelry
products saw 14.7% y-o-y growth
Net Profit of EUR301m, 61.5 % y-o-y increase with active
customers increasing to 4.9m
Signed alliance with China’s
Unionpay and Alibaba’s Ant Financial
34.7% market share for FosunInsurance Portugal in
Portugal in 2018. At the beginning of 2019,Fidelidade expanded into S.America
with 51% acquisition of insurance company La Positiva Seguros y Reasegurosin Peru
8
Business HighlightsFocus on product competitiveness, branding and synergies
Health products 2017 20192018
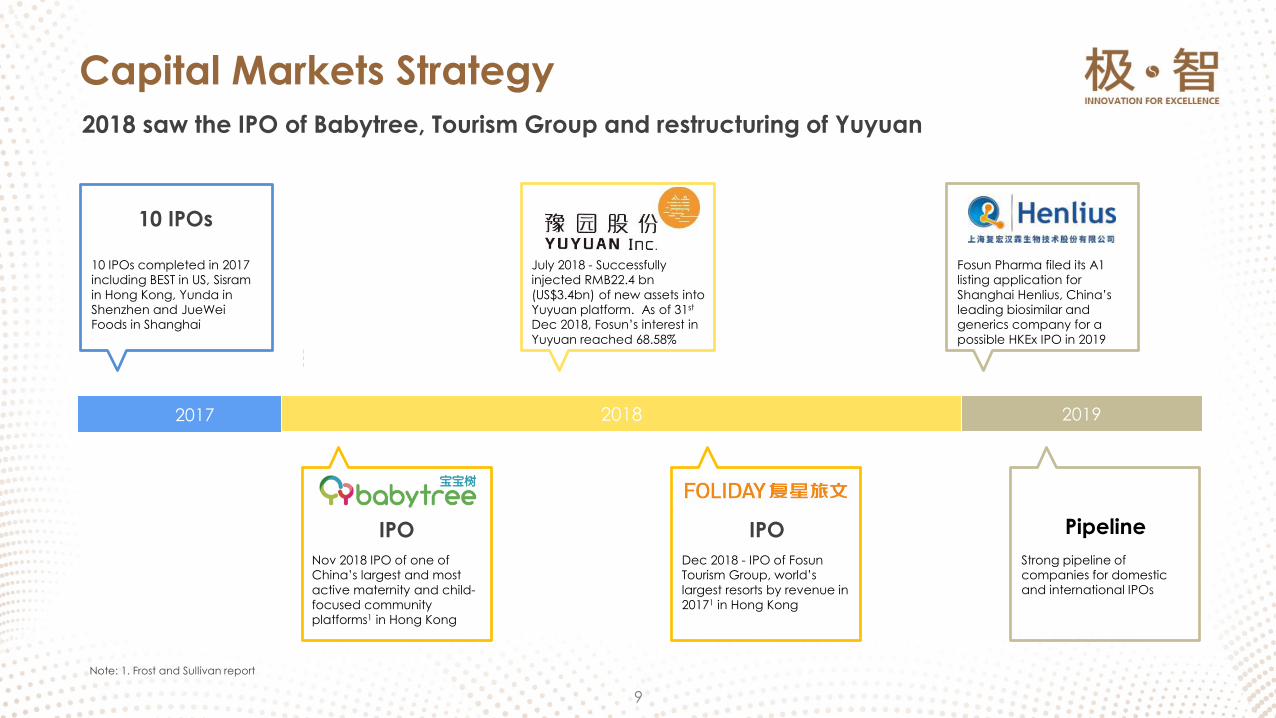
Fosun Pharma filed its A1 listing application for
Shanghai Henlius, China’s leading biosimilar and generics company for a
possible HKEx IPO in 2019
Pipeline
Strong pipeline of companies for domestic and international IPOs
Nov 2018 IPO of one of China’s largest and most
active maternity and child-focused community platforms1 in Hong Kong
10 IPOs completed in 2017 including BEST in US, Sisram
in Hong Kong, Yunda in Shenzhen and JueWeiFoods in Shanghai
10 IPOs
July 2018 - Successfully injected RMB22.4 bn
(US$3.4bn) of new assets into Yuyuan platform. As of 31st
Dec 2018, Fosun’s interest in
Yuyuan reached 68.58%
Dec 2018 - IPO of FosunTourism Group, world’s
largest resorts by revenue in 20171 in Hong Kong
IPO IPO
9
Capital Markets Strategy
2018 saw the IPO of Babytree, Tourism Group and restructuring of Yuyuan
Note: 1. Frost and Sullivan report
201720152013 2016
LloydsChambers
2014
Lloyds Chambers
2018
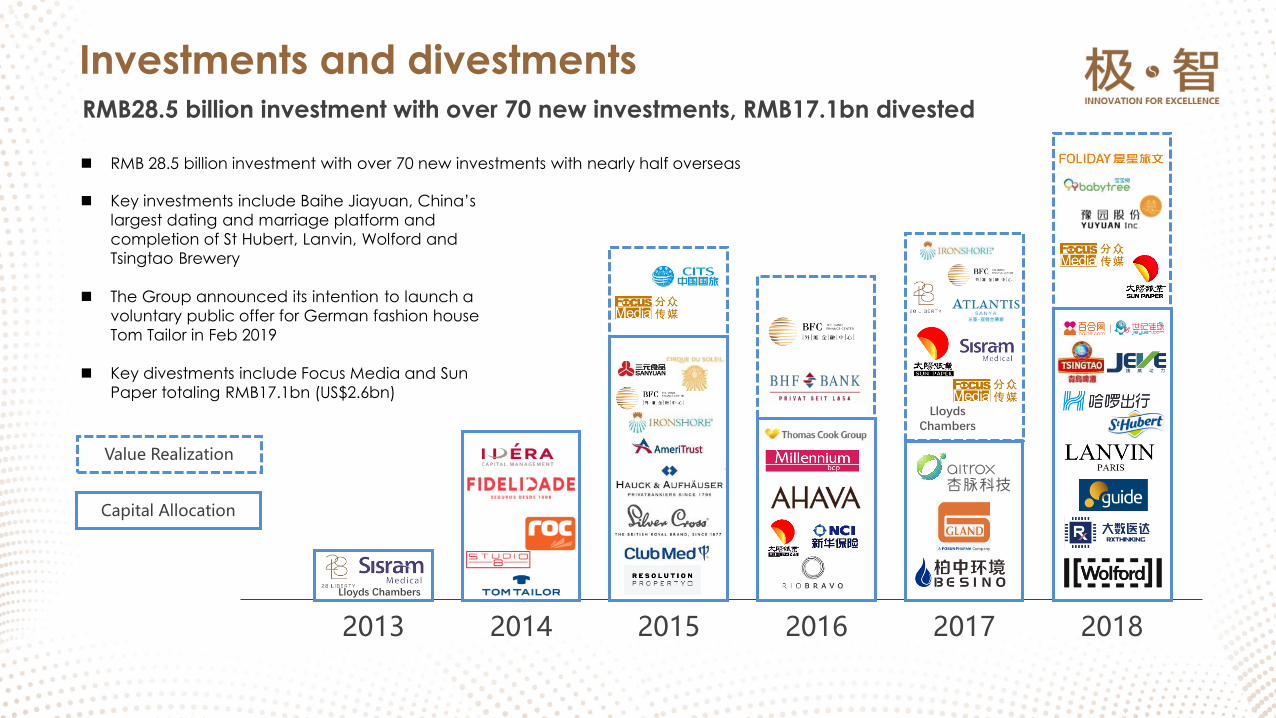
RMB 28.5 billion investment with over 70 new investments with nearly half overseas
Key investments include Baihe Jiayuan, China’s
largest dating and marriage platform and
completion of St Hubert, Lanvin, Wolford and
Tsingtao Brewery
The Group announced its intention to launch a
voluntary public offer for German fashion house
Tom Tailor in Feb 2019
Key divestments include Focus Media and Sun
Paper totaling RMB17.1bn (US$2.6bn)
Investments and divestments
Value Realization
Capital Allocation
RMB28.5 billion investment with over 70 new investments, RMB17.1bn divested
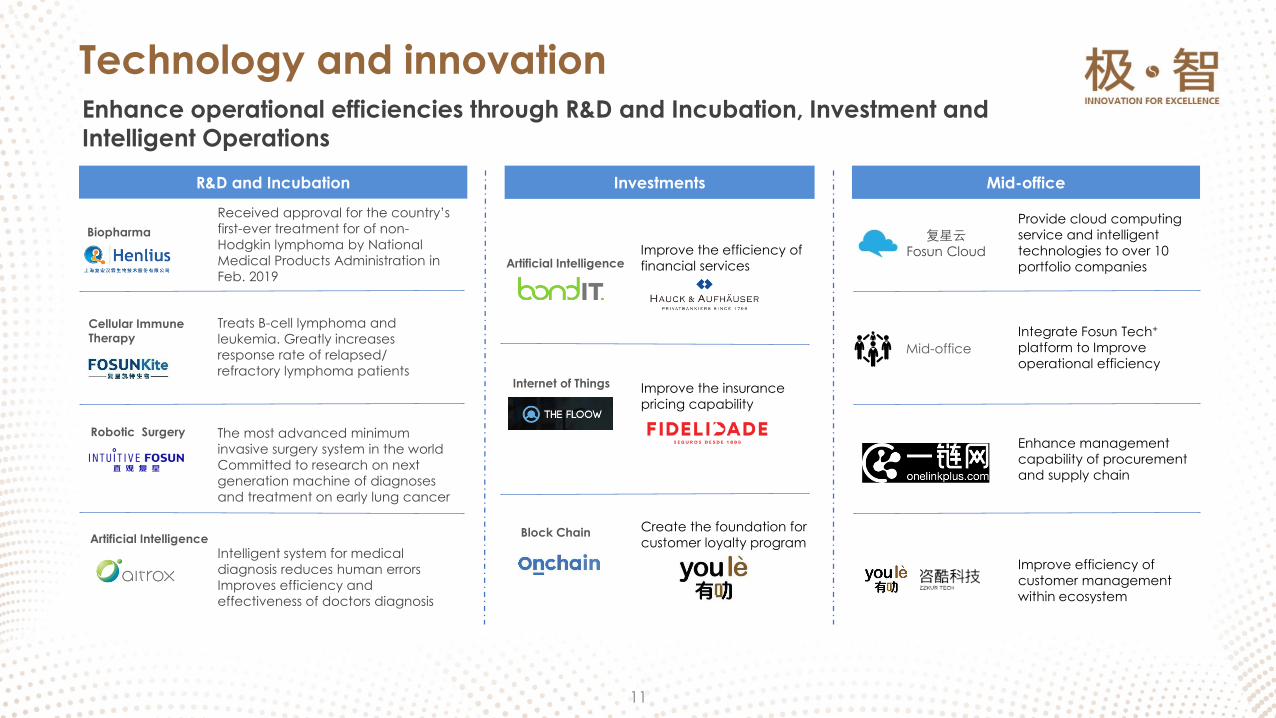
R&D and Incubation
Biopharma
Cellular Immune
Therapy
Robotic Surgery The most advanced minimum
invasive surgery system in the world
Committed to research on next
generation machine of diagnoses
and treatment on early lung cancer
Treats B-cell lymphoma and
leukemia. Greatly increases
response rate of relapsed/
refractory lymphoma patients
Received approval for the country’s
first-ever treatment for of non-
Hodgkin lymphoma by National
Medical Products Administration in
Feb. 2019
Artificial Intelligence
Intelligent system for medical
diagnosis reduces human errors
Improves efficiency and
effectiveness of doctors diagnosis
Improve the efficiency of
financial services
Improve the insurance
pricing capability
Create the foundation for
customer loyalty program
Investments
复星云Fosun Cloud
Provide cloud computing
service and intelligent
technologies to over 10
portfolio companies
Mid-office
Integrate Fosun Tech+
platform to Improve
operational efficiency
Enhance management
capability of procurement
and supply chain
Improve efficiency of
customer management
within ecosystem
Mid-office
11
Artificial Intelligence
Internet of Things
Block Chain
Technology and innovationEnhance operational efficiencies through R&D and Incubation, Investment and
Intelligent Operations
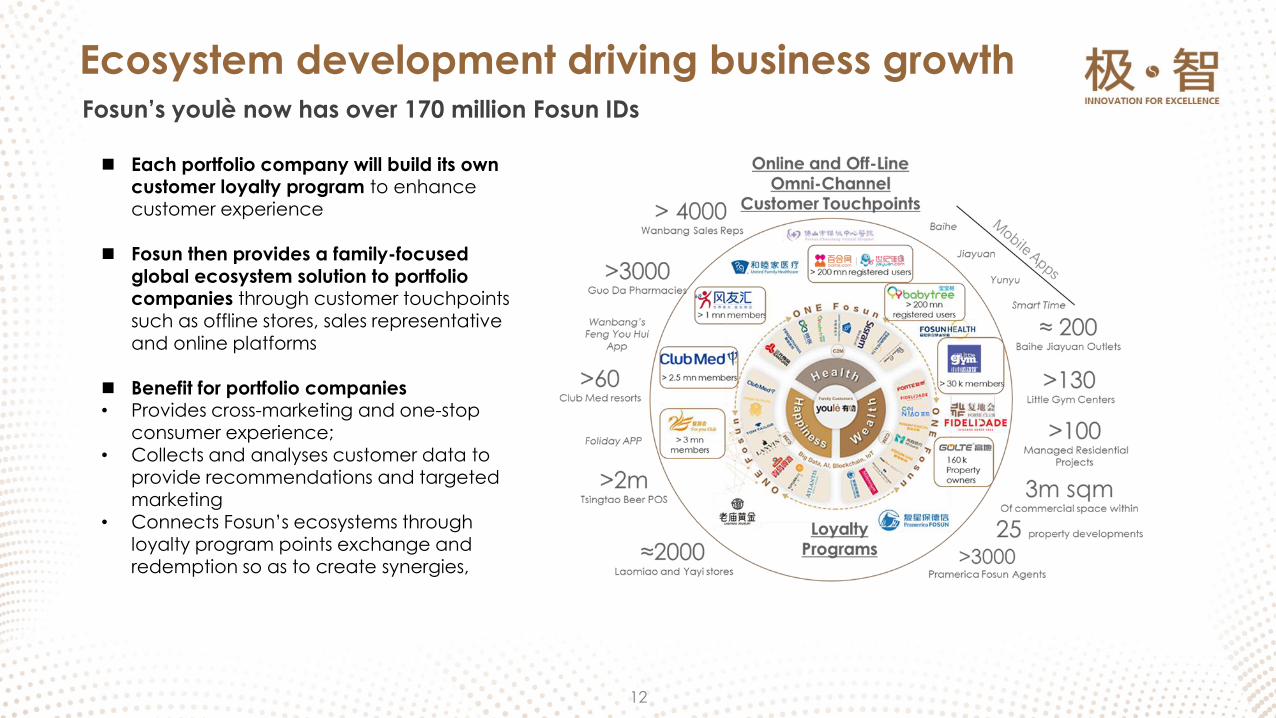
Each portfolio company will build its own customer loyalty program to enhance customer experience
Fosun then provides a family-focused global ecosystem solution to portfolio companies through customer touchpoints such as offline stores, sales representative and online platforms
Benefit for portfolio companies• Provides cross-marketing and one-stop
consumer experience;• Collects and analyses customer data to
provide recommendations and targeted marketing
• Connects Fosun’s ecosystems through loyalty program points exchange and redemption so as to create synergies,
Ecosystem development driving business growthFosun’s youlè now has over 170 million Fosun IDs
12

1414
Financial Review3
Note: 1. Adjusted NAV per share = [market value of listed investments held at the group level+ the fair value of unlisted investments estimated by the management utilizing precedent transactions analysis or comparable company analysis-the net debt at the group level] / the total issued number of the Company
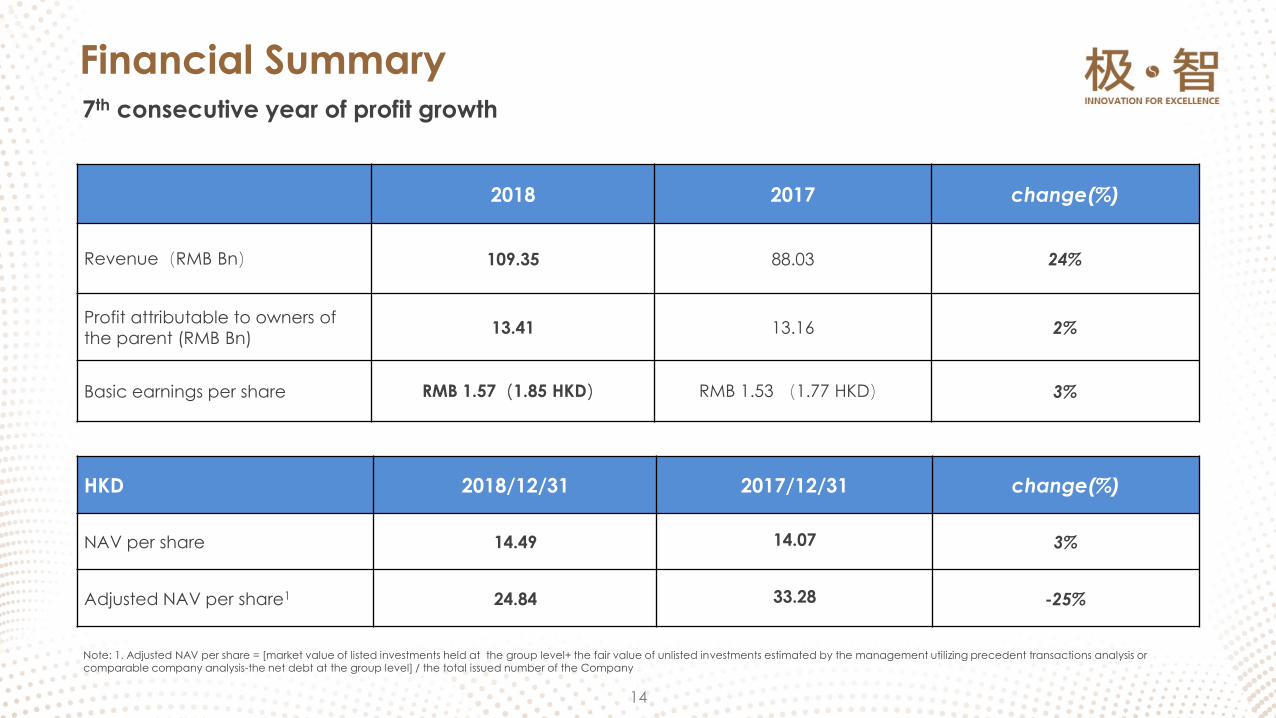
2018 2017 change(%)
Revenue(RMB Bn) 109.35 88.03 24%
Profit attributable to owners of
the parent (RMB Bn)13.41 13.16 2%
Basic earnings per share RMB 1.57(1.85 HKD) RMB 1.53 (1.77 HKD) 3%
HKD 2018/12/31 2017/12/31 change(%)
NAV per share 14.49 14.07 3%
Adjusted NAV per share1 24.84 33.28 -25%
Financial Summary7th consecutive year of profit growth
14
0
20
40
60
80
100
120
140
160
2008 2009 2010 2011 2012 2013 2014 2015 2016 2017 2018
0
0.2
0.4
0.6
0.8
1
1.2
1.4
1.6
2008 2009 2010 2011 2012 2013 2014 2015 2016 2017 2018
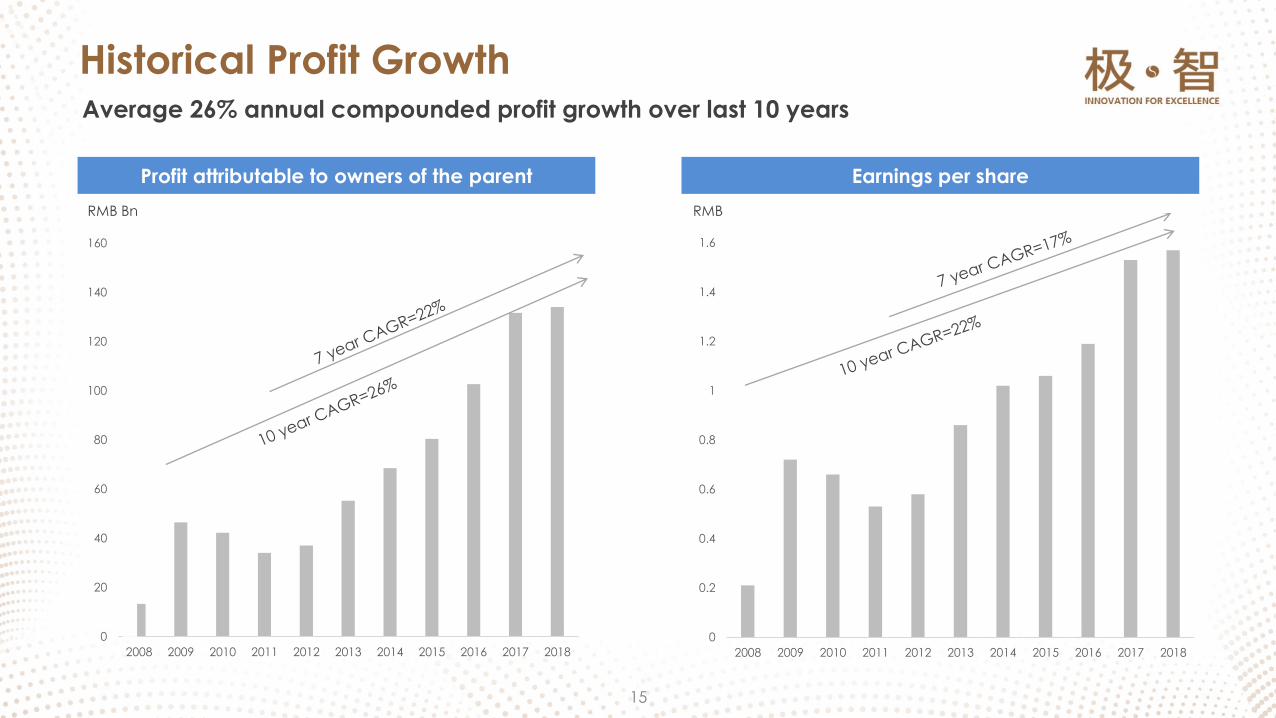
Profit attributable to owners of the parent Earnings per share
RMB Bn RMB
Historical Profit GrowthAverage 26% annual compounded profit growth over last 10 years
15
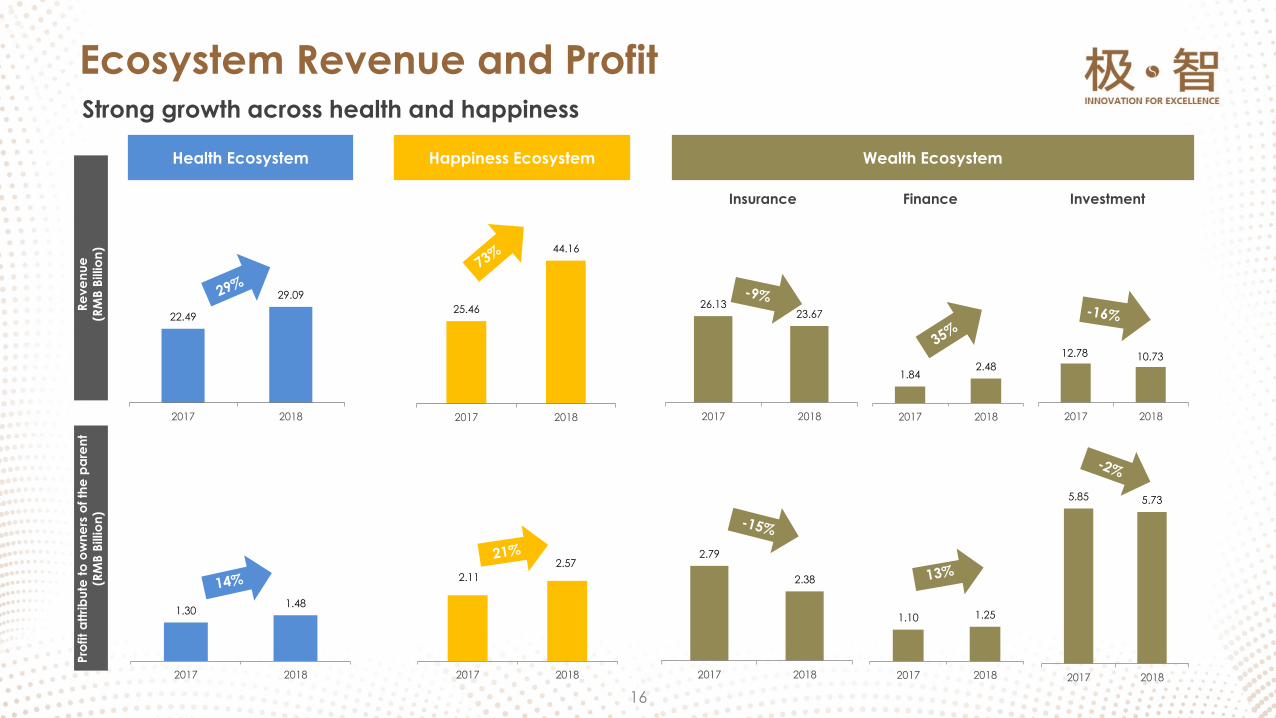
5.85 5.73
2017 2018
25.46
44.16
2017 2018
12.78 10.73
2017 2018
1.10 1.25
2017 2018
2.79
2.38
2017 2018
2.11
2.57
2017 2018
1.301.48
2017 2018
1.842.48
2017 2018
Health Ecosystem Happiness Ecosystem Wealth Ecosystem
Re
ve
nu
e
(RM
B B
illio
n)
Insurance Finance Investment
22.49
29.09
2017 2018
26.1323.67
2017 2018
Ecosystem Revenue and Profit Strong growth across health and happiness
16
Pro
fit
att
rib
ute
to
ow
ne
rs o
f th
e p
are
nt
(RM
B B
illio
n)
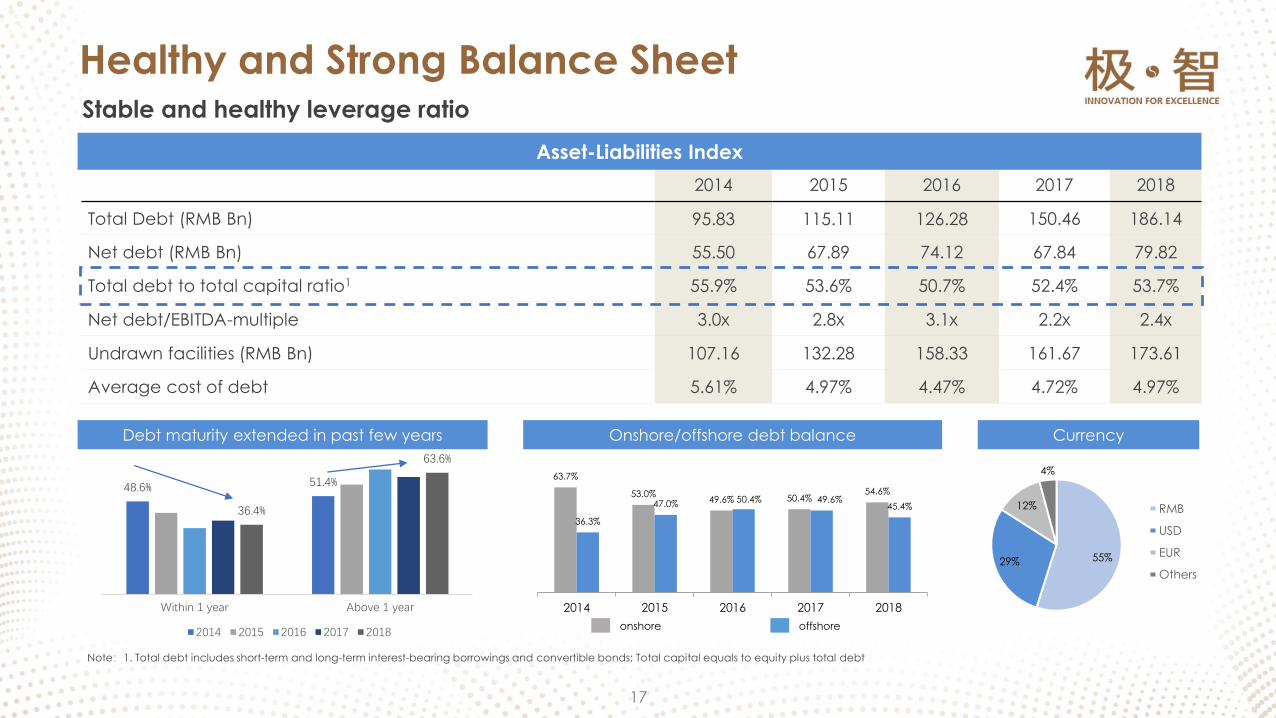
2014 2015 2016 2017 2018
Total Debt (RMB Bn) 95.83 115.11 126.28 150.46 186.14
Net debt (RMB Bn) 55.50 67.89 74.12 67.84 79.82
Total debt to total capital ratio1 55.9% 53.6% 50.7% 52.4% 53.7%
Net debt/EBITDA-multiple 3.0x 2.8x 3.1x 2.2x 2.4x
Undrawn facilities (RMB Bn) 107.16 132.28 158.33 161.67 173.61
Average cost of debt 5.61% 4.97% 4.47% 4.72% 4.97%
Note:1. Total debt includes short-term and long-term interest-bearing borrowings and convertible bonds; Total capital equals to equity plus total debt
Debt maturity extended in past few years Onshore/offshore debt balance
Asset-Liabilities Index
Currency
63.7%
53.0%49.6% 50.4%
54.6%
36.3%
47.0%50.4% 49.6%
45.4%
2014 2015 2016 2017 2018
Healthy and Strong Balance Sheet Stable and healthy leverage ratio
17
55%29%
12%
4%
RMB
USD
EUR
Others
onshore offshore
48.6% 51.4%
36.4%
63.6%
Within 1 year Above 1 year
2014 2015 2016 2017 2018
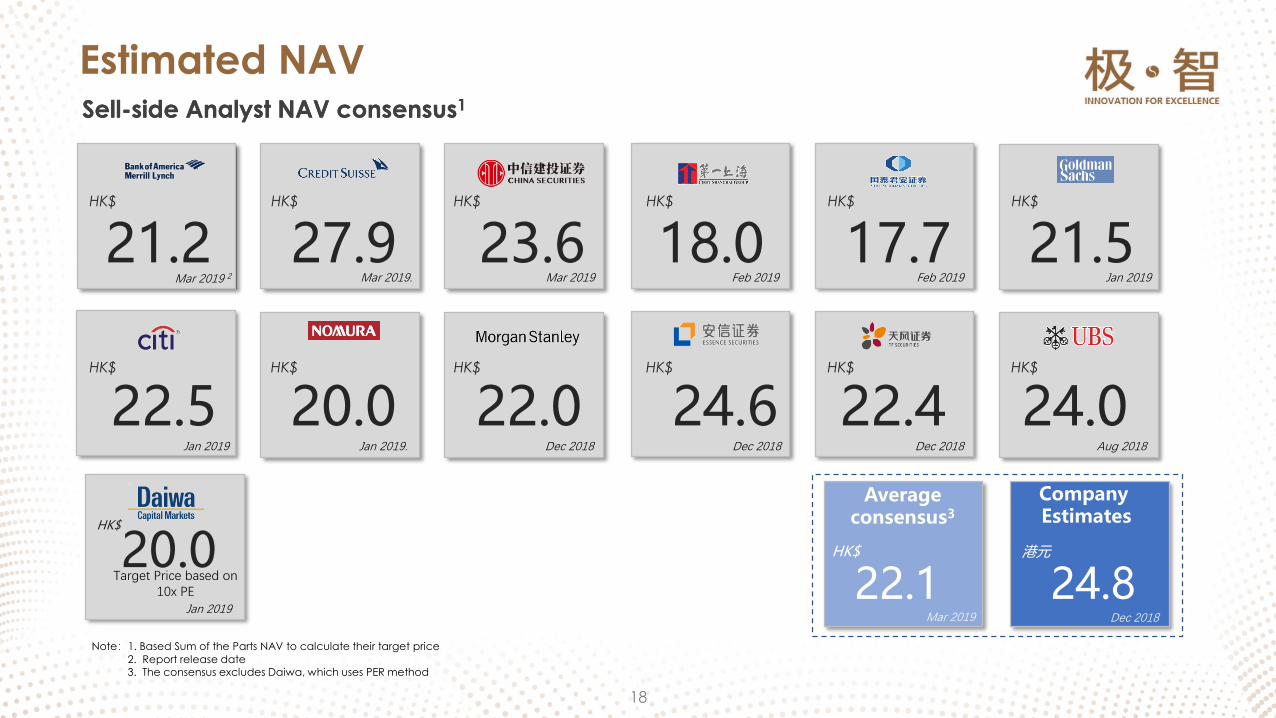
Note:1. Based Sum of the Parts NAV to calculate their target price
2. Report release date 3. The consensus excludes Daiwa, which uses PER method
Estimated NAVSell-side Analyst NAV consensus1
18
Sell-side Analyst NAV consensus1
22.5 24.6
21.5
20.0 22.0
27.921.2
24.0
17.718.0
22.4
23.6
Jan 2019 Jan 2019. Dec 2018
Mar 2019. Feb 2019
Aug 2018
Mar 2019 2
HK$
HK$ HK$
HK$ HK$
HK$ HK$
HK$
HK$
HK$
HK$
HK$
Mar 2019
Dec 2018 Dec 2018
Feb 2019 Jan 2019
22.1
Average consensus3
Company Estimates
Mar 2019
HK$
24.8港元20.0
HK$
Target Price based on 10x PE
Jan 2019Dec 2018

20Fosun Foundation, Shanghai
OUTLOOK4

1
2
Management Drive organizational evolution through strong corporate culture and
values
Create entrepreneurial platforms through global partners
Enhance communications by being a 24/7 global and agile
organization
Improve operational efficiency through smart mid-office management
3
Empowerment Facilitate industrial incubation and help portfolio companies to turn
around and grow their businesses
Vertically integrate across the industry chain to establish industry groups
Integrate horizontally to create new businesses
Build up intelligent mid-offices to support the creation of high-quality
products
Value realization Search globally for value investment opportunities
Seek and secure opportunities amidst uncertainties
Bring more industry groups to IPO
Stay focused on our strategy – regardless of time and complexity
OutlookHow can Fosun grow its global ecosystem?
20
Unicorns
1. Tourism & Leisure2. Fashion3. Consumer & Lifestyle
Insurance
1. Pharmaceutical
2. Medic of services & Health management3. Health Products
Wealth
Investment
HappinessHealth
Finance
复星集团2019PPT模版#ProductCompetitiveness #BrandStrength #IndustiralGroup
XXXXXXX部门2019.03.xx
HEALTH | HAPPINESS | WEALTH
APPENDIX A. Supporting Slides
B. Core Platforms
Notes:
Sinopharm
Health Ecosystem
Pharmaceutical Medical Services
& HealthManagement
HealthProducts
Happiness Ecosystem
Tourism & Leisure
Fashion
Wealth Ecosystem
WeDoctor
Luz Saúde3
99.36%
StarcastleSenior Living
100%
SanyuanFood5
20.45%
Silver Cross 87.23%
St Hubert6
98.12%
Fosun Tourism Group7
81.76%
Thomas
Cook8
13.89%
Caruso10
73.78%
Wolford58.45%
Lanvin65.60%
Fosun Insurance Portugal14
84.9884%
AmeriTrust100%
Peak Re86.90%
Pramerica
Fosun
50%
Investment
Cainiao6.73%
IDERA98%
MyBank25%
BCP 27.25%
H&A99.91%
Fosun Hani Securities
100%
28.89%
Gland Pharma
Sisram Med
Insurance
98.81%
Nanjing
Nangang
60%
Fosun Capital
100%
Fosun Pharma
37.55%
United Family
Fosun United Health
Insurance2
20%
Yong’an P&C Insurance
40.68%
8
St John11
70%
ROC15
100%
Hainan Mining
51.57%
Consumer & Lifestyle
YuYuan 68.58%
Tsingtao12
17.99%
AHAVA13
100%
Chancheng
Hospital
BesinoEnvironment
BaiheJiayuan
69.18%
Babytree4
21.75%
Tom Tailor9
BundFinance Center
50%
Finance
28 Liberty
100%
Koller
84.50%
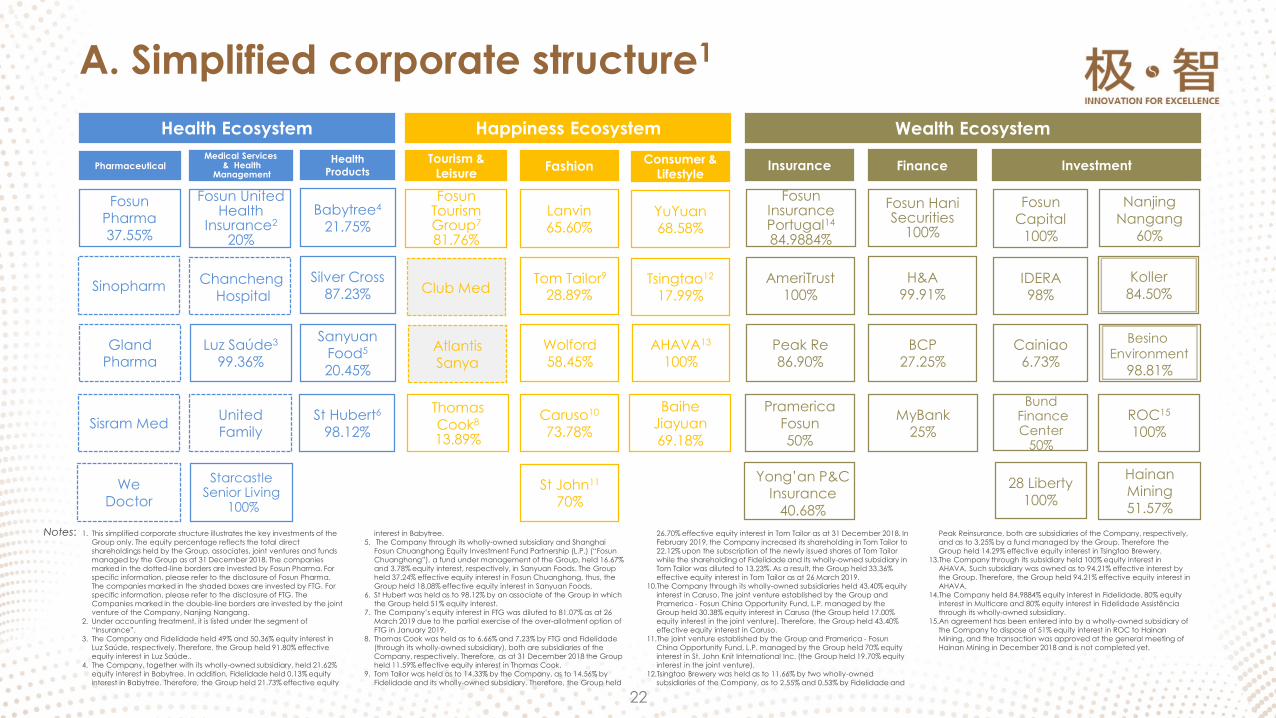
A. Simplified corporate structure1
22
Atlantis
Sanya
Club Med
1. This simplified corporate structure illustrates the key investments of the Group only. The equity percentage reflects the total direct shareholdings held by the Group, associates, joint ventures and funds
managed by the Group as at 31 December 2018. The companies marked in the dotted-line borders are invested by Fosun Pharma. For specific information, please refer to the disclosure of Fosun Pharma. The companies marked in the shaded boxes are invested by FTG. For specific information, please refer to the disclosure of FTG. The Companies marked in the double-line borders are invested by the joint venture of the Company, Nanjing Nangang.
2. Under accounting treatment, it is listed under the segment of “Insurance”.
3. The Company and Fidelidade held 49% and 50.36% equity interest in Luz Saúde, respectively. Therefore, the Group held 91.80% effective equity interest in Luz Saúde..
4. The Company, together with its wholly-owned subsidiary, held 21.62% equity interest in Babytree. In addition, Fidelidade held 0.13% equity interest in Babytree. Therefore, the Group held 21.73% effective equity
interest in Babytree. 5. The Company through its wholly-owned subsidiary and Shanghai
Fosun Chuanghong Equity Investment Fund Partnership (L.P.) (“Fosun
Chuanghong”), a fund under management of the Group, held 16.67% and 3.78% equity interest, respectively, in Sanyuan Foods. The Group held 37.24% effective equity interest in Fosun Chuanghong, thus, the Group held 18.08% effective equity interest in Sanyuan Foods.
6. St Hubert was held as to 98.12% by an associate of the Group in which the Group held 51% equity interest.
7. The Company’s equity interest in FTG was diluted to 81.07% as at 26 March 2019 due to the partial exercise of the over-allotment option of FTG in January 2019.
8. Thomas Cook was held as to 6.66% and 7.23% by FTG and Fidelidade(through its wholly-owned subsidiary), both are subsidiaries of the Company, respectively. Therefore, as at 31 December 2018 the Group held 11.59% effective equity interest in Thomas Cook.
9. Tom Tailor was held as to 14.33% by the Company, as to 14.56% by Fidelidade and its wholly-owned subsidiary. Therefore, the Group held
26.70% effective equity interest in Tom Tailor as at 31 December 2018. In February 2019, the Company increased its shareholding in Tom Tailor to 22.12% upon the subscription of the newly issued shares of Tom Tailor
while the shareholding of Fidelidade and its wholly-owned subsidiary in Tom Tailor was diluted to 13.23%. As a result, the Group held 33.36% effective equity interest in Tom Tailor as at 26 March 2019.
10.The Company through its wholly-owned subsidiaries held 43.40% equity interest in Caruso. The joint venture established by the Group and Pramerica - Fosun China Opportunity Fund, L.P. managed by the Group held 30.38% equity interest in Caruso (the Group held 17.00% equity interest in the joint venture). Therefore, the Group held 43.40% effective equity interest in Caruso.
11.The joint venture established by the Group and Pramerica - FosunChina Opportunity Fund, L.P. managed by the Group held 70% equity interest in St. John Knit International Inc. (the Group held 19.70% equity interest in the joint venture).
12.Tsingtao Brewery was held as to 11.66% by two wholly-owned subsidiaries of the Company, as to 2.55% and 0.53% by Fidelidade and
Peak Reinsurance, both are subsidiaries of the Company, respectively, and as to 3.25% by a fund managed by the Group. Therefore the Group held 14.29% effective equity interest in Tsingtao Brewery.
13.The Company through its subsidiary held 100% equity interest in AHAVA. Such subsidiary was owned as to 94.21% effective interest by the Group. Therefore, the Group held 94.21% effective equity interest in AHAVA.
14.The Company held 84.9884% equity interest in Fidelidade, 80% equity interest in Multicare and 80% equity interest in Fidelidade Assistênciathrough its wholly-owned subsidiary.
15.An agreement has been entered into by a wholly-owned subsidiary of the Company to dispose of 51% equity interest in ROC to Hainan Mining, and the transaction was approved at the general meeting of Hainan Mining in December 2018 and is not completed yet.
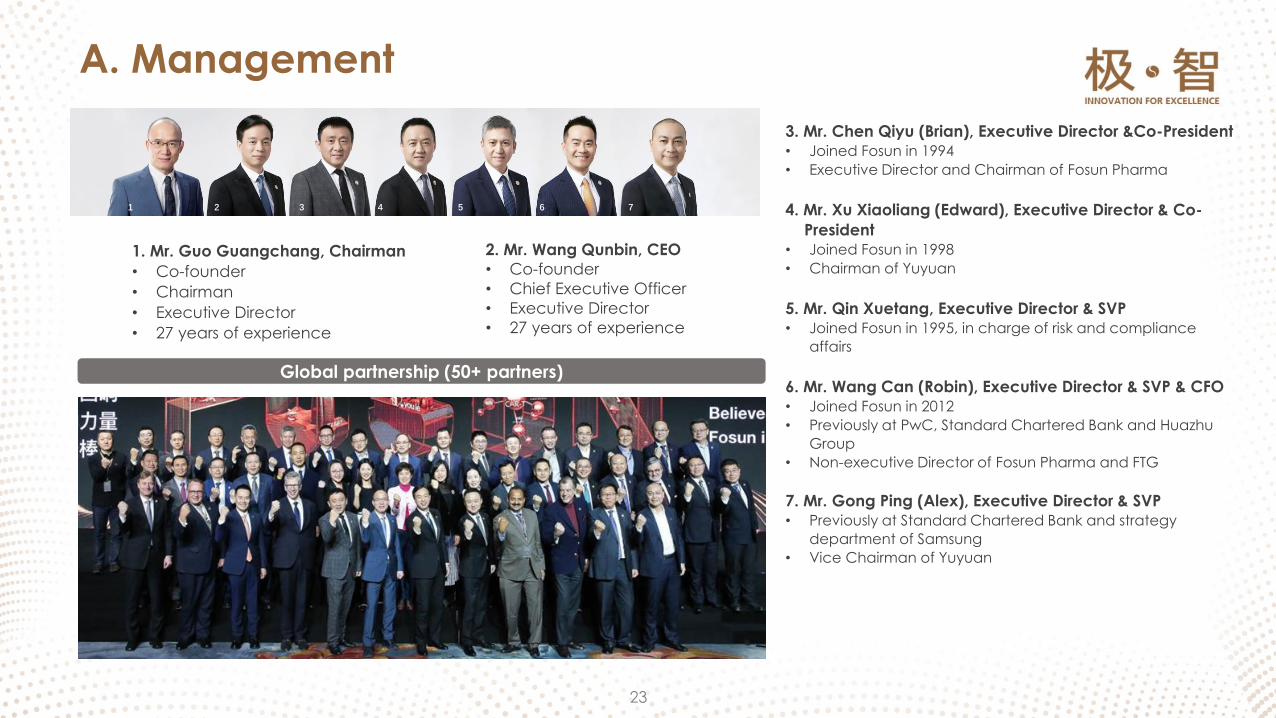
Global partnership (50+ partners)
1. Mr. Guo Guangchang, Chairman
• Co-founder
• Chairman
• Executive Director
• 27 years of experience
3. Mr. Chen Qiyu (Brian), Executive Director &Co-President
• Joined Fosun in 1994
• Executive Director and Chairman of Fosun Pharma
4. Mr. Xu Xiaoliang (Edward), Executive Director & Co-
President
• Joined Fosun in 1998
• Chairman of Yuyuan
5. Mr. Qin Xuetang, Executive Director & SVP
• Joined Fosun in 1995, in charge of risk and compliance
affairs
6. Mr. Wang Can (Robin), Executive Director & SVP & CFO
• Joined Fosun in 2012
• Previously at PwC, Standard Chartered Bank and Huazhu
Group
• Non-executive Director of Fosun Pharma and FTG
7. Mr. Gong Ping (Alex), Executive Director & SVP
• Previously at Standard Chartered Bank and strategy
department of Samsung
• Vice Chairman of Yuyuan
23
A. Management
2. Mr. Wang Qunbin, CEO
• Co-founder
• Chief Executive Officer
• Executive Director
• 27 years of experience
1 765432
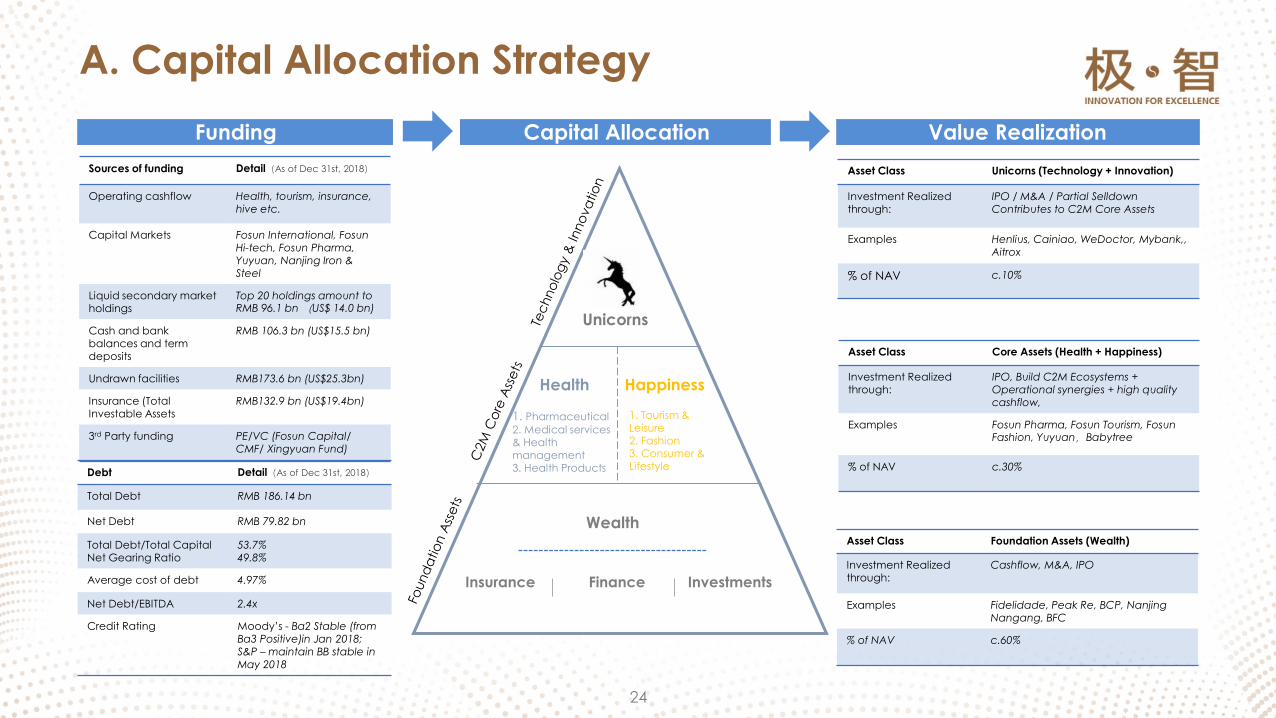
Funding
Unicorns
1. Tourism & Leisure2. Fashion3. Consumer & Lifestyle
Insurance
1. Pharmaceutical
2. Medical services & Health management3. Health Products
Sources of funding Detail(As of Dec 31st, 2018)
Operating cashflow Health, tourism, insurance, hive etc.
Capital Markets Fosun International, FosunHi-tech, Fosun Pharma, Yuyuan, Nanjing Iron & Steel
Liquid secondary market holdings
Top 20 holdings amount to RMB 96.1 bn (US$ 14.0 bn)
Cash and bank balances and term deposits
RMB 106.3 bn (US$15.5 bn)
Undrawn facilities RMB173.6 bn (US$25.3bn)
Insurance (Total Investable Assets
RMB132.9 bn (US$19.4bn)
3rd Party funding PE/VC (Fosun Capital/ CMF/ Xingyuan Fund)
Debt Detail(As of Dec 31st, 2018)
Total Debt RMB 186.14 bn
Net Debt RMB 79.82 bn
Total Debt/Total CapitalNet Gearing Ratio
53.7%49.8%
Average cost of debt 4.97%
Net Debt/EBITDA 2.4x
Credit Rating Moody’s - Ba2 Stable (from Ba3 Positive)in Jan 2018; S&P – maintain BB stable in May 2018
Asset Class Unicorns (Technology + Innovation)
Investment Realized through:
IPO / M&A / Partial SelldownContributes to C2M Core Assets
Examples Henlius, Cainiao, WeDoctor, Mybank,, Aitrox
% of NAV c.10%
Value RealizationCapital Allocation
Wealth
Asset Class Core Assets (Health + Happiness)
Investment Realized through:
IPO, Build C2M Ecosystems + Operational synergies + high quality cashflow,
Examples Fosun Pharma, Fosun Tourism, Fosun Fashion, Yuyuan,Babytree
% of NAV c.30%
Asset Class Foundation Assets (Wealth)
Investment Realized through:
Cashflow, M&A, IPO
Examples Fidelidade, Peak Re, BCP, Nanjing Nangang, BFC
% of NAV c.60%
Investments
HappinessHealth
Finance
A. Capital Allocation Strategy
24
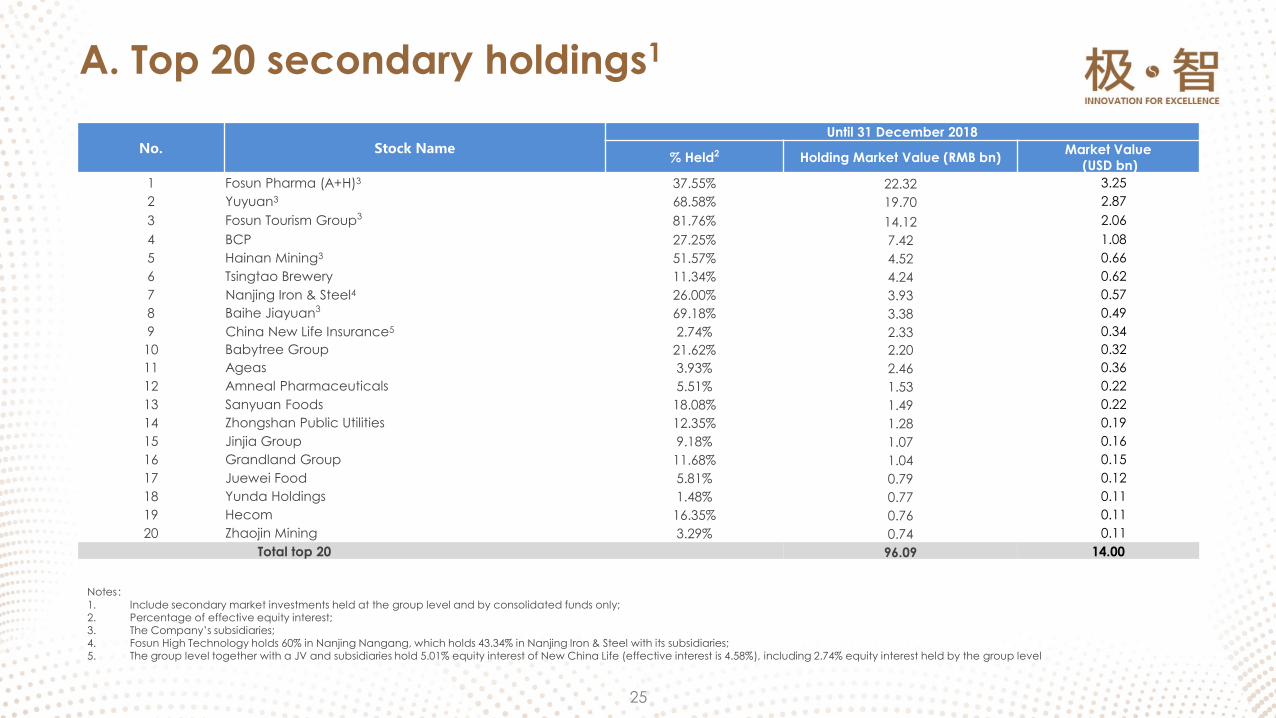
Notes:1. Include secondary market investments held at the group level and by consolidated funds only;2. Percentage of effective equity interest;3. The Company’s subsidiaries;4. Fosun High Technology holds 60% in Nanjing Nangang, which holds 43.34% in Nanjing Iron & Steel with its subsidiaries;5. The group level together with a JV and subsidiaries hold 5.01% equity interest of New China Life (effective interest is 4.58%), including 2.74% equity interest held by the group level
A. Top 20 secondary holdings1
25
No. Stock NameUntil 31 December 2018
% Held2 Holding Market Value (RMB bn)Market Value
(USD bn)
1 Fosun Pharma (A+H)3 37.55% 22.32 3.25
2 Yuyuan3 68.58% 19.70 2.87
3 Fosun Tourism Group3 81.76% 14.12 2.06
4 BCP 27.25% 7.42 1.08
5 Hainan Mining3 51.57% 4.52 0.66
6 Tsingtao Brewery 11.34% 4.24 0.62
7 Nanjing Iron & Steel4 26.00% 3.93 0.57
8 Baihe Jiayuan3 69.18% 3.38 0.49
9 China New Life Insurance5 2.74% 2.33 0.34
10 Babytree Group 21.62% 2.20 0.32
11 Ageas 3.93% 2.46 0.36
12 Amneal Pharmaceuticals 5.51% 1.53 0.22
13 Sanyuan Foods 18.08% 1.49 0.22
14 Zhongshan Public Utilities 12.35% 1.28 0.19
15 Jinjia Group 9.18% 1.07 0.16
16 Grandland Group 11.68% 1.04 0.15
17 Juewei Food 5.81% 0.79 0.12
18 Yunda Holdings 1.48% 0.77 0.11
19 Hecom 16.35% 0.76 0.11
20 Zhaojin Mining 3.29% 0.74 0.11
Total top 20 96.09 14.00
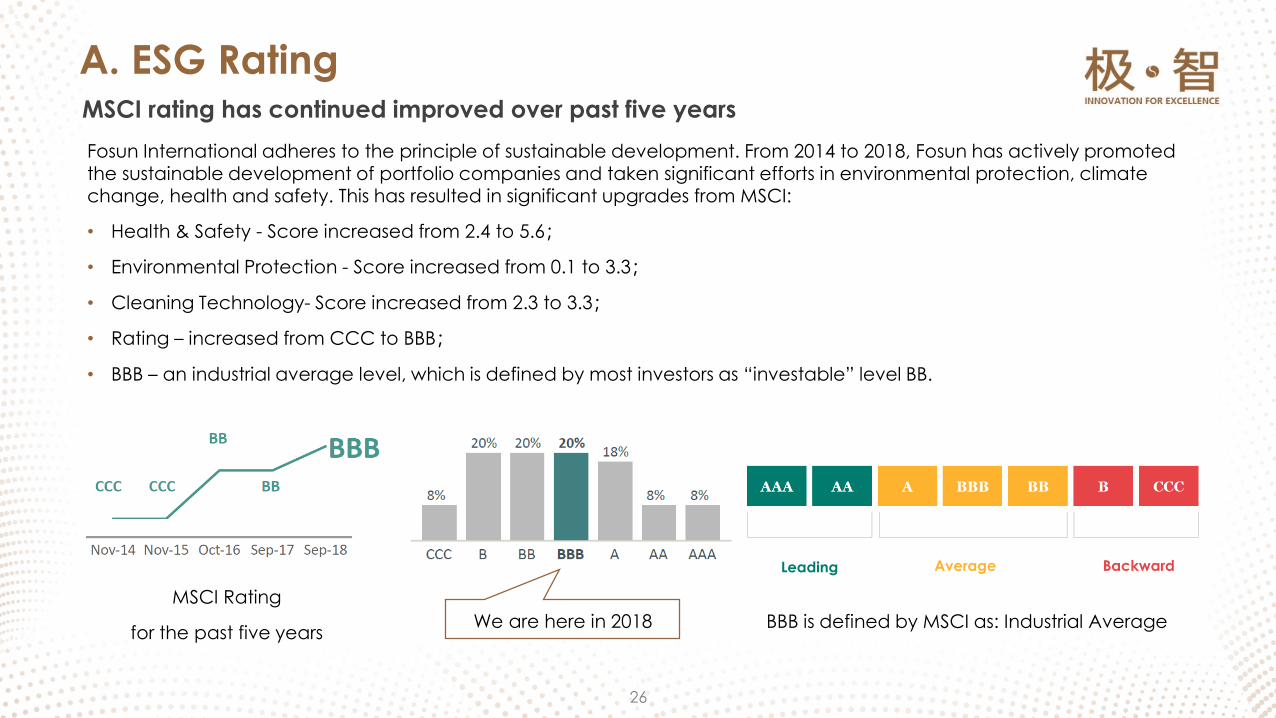
MSCI Rating
for the past five yearsWe are here in 2018
Fosun International adheres to the principle of sustainable development. From 2014 to 2018, Fosun has actively promoted the sustainable development of portfolio companies and taken significant efforts in environmental protection, climate change, health and safety. This has resulted in significant upgrades from MSCI:
• Health & Safety - Score increased from 2.4 to 5.6;
• Environmental Protection - Score increased from 0.1 to 3.3;
• Cleaning Technology- Score increased from 2.3 to 3.3;
• Rating – increased from CCC to BBB;
• BBB – an industrial average level, which is defined by most investors as “investable” level BB.
BBB is defined by MSCI as: Industrial Average
Leading Average Backward
A. ESG RatingMSCI rating has continued improved over past five years
26
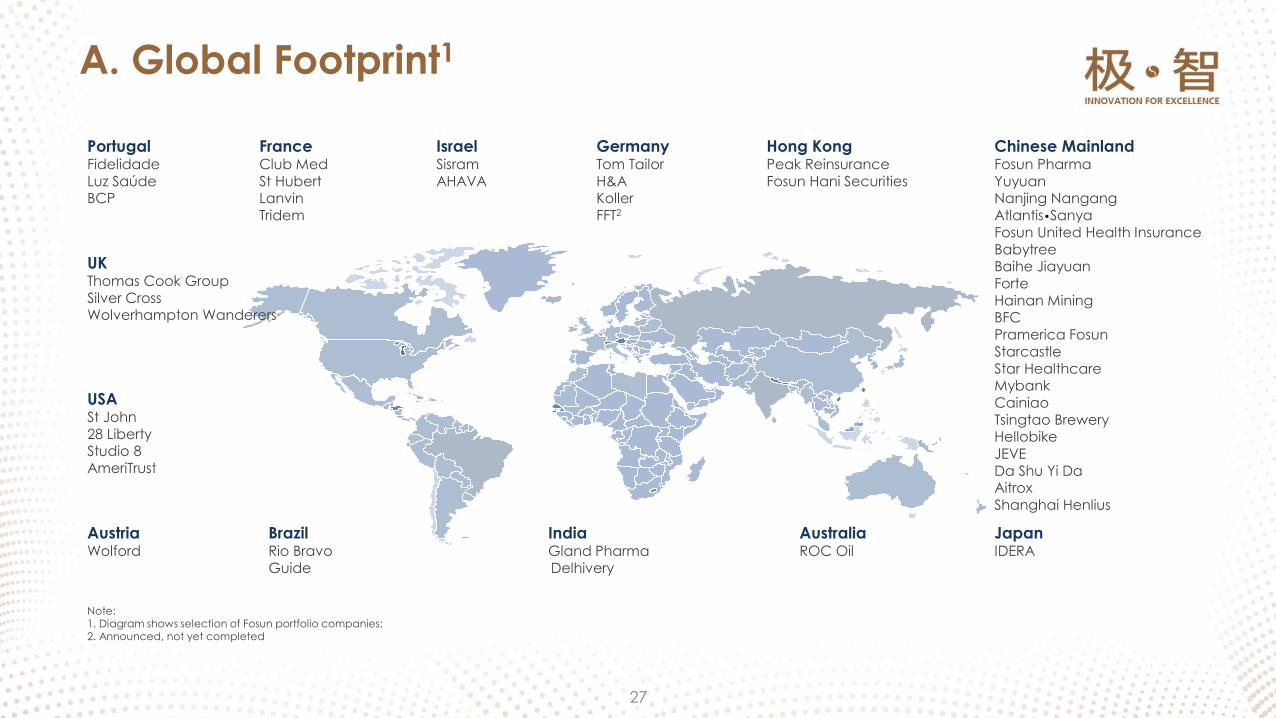
JapanIDERA
UKThomas Cook Group
Silver CrossWolverhampton Wanderers
GermanyTom Tailor
H&AKoller
FFT2
PortugalFidelidade
Luz SaúdeBCP
IndiaGland Pharma
Delhivery
BrazilRio Bravo
Guide
USASt John
28 LibertyStudio 8
AmeriTrust
AustraliaROC Oil
FranceClub Med
St HubertLanvin
Tridem
IsraelSisram
AHAVA
Note:1. Diagram shows selection of Fosun portfolio companies;2. Announced, not yet completed
Hong KongPeak Reinsurance
Fosun Hani Securities
Chinese Mainland Fosun Pharma
YuyuanNanjing Nangang
Atlantis•Sanya
Fosun United Health Insurance
BabytreeBaihe Jiayuan
Forte
Hainan MiningBFC
Pramerica Fosun
Starcastle
Star HealthcareMybank
Cainiao
Tsingtao BreweryHellobike
JEVE
Da Shu Yi DaAitrox
Shanghai Henlius
AustriaWolford
A. Global Footprint1
27
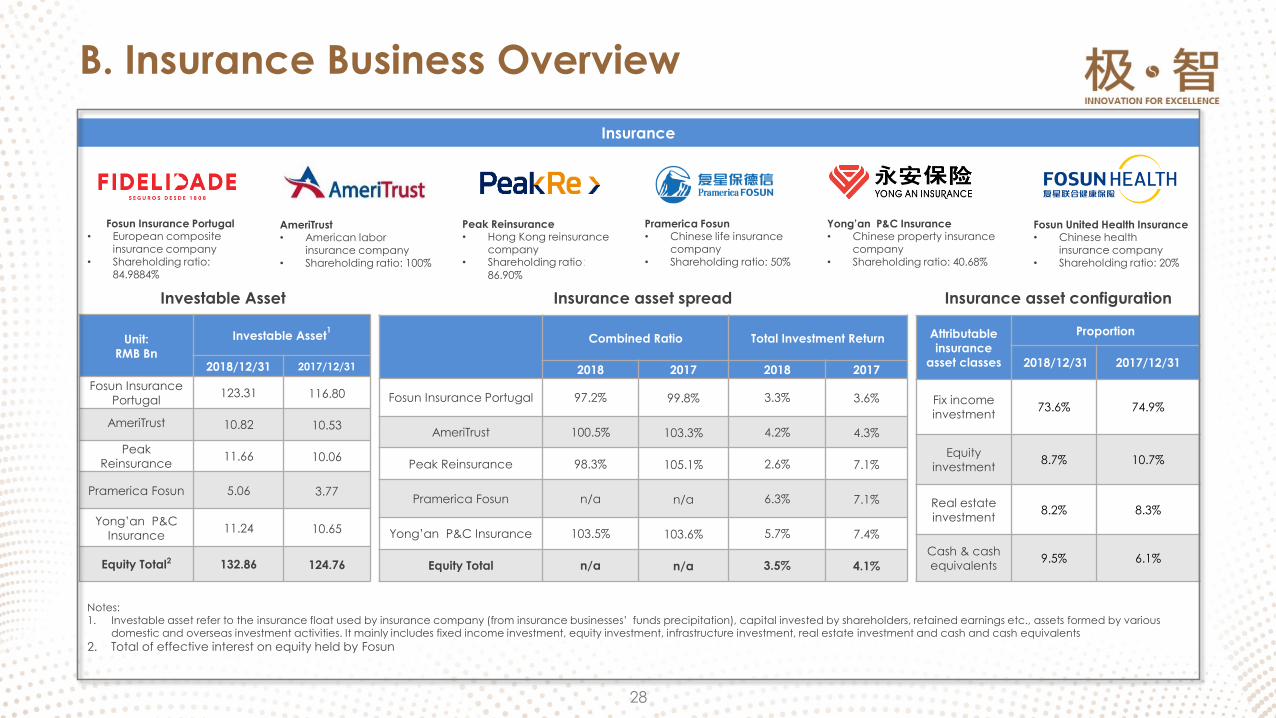
Attributable
insurance
asset classes
Proportion
2018/12/31 2017/12/31
Fix income
investment73.6% 74.9%
Equity
investment8.7% 10.7%
Real estate
investment8.2% 8.3%
Cash & cash
equivalents9.5% 6.1%
Insurance asset configuration
Unit:
RMB Bn
Investable Asset1
2018/12/31 2017/12/31
Fosun Insurance
Portugal123.31 116.80
AmeriTrust 10.82 10.53
Peak
Reinsurance11.66 10.06
Pramerica Fosun 5.06 3.77
Yong’an P&C
Insurance11.24 10.65
Equity Total2 132.86 124.76
Combined Ratio Total Investment Return
2018 2017 2018 2017
Fosun Insurance Portugal 97.2% 99.8% 3.3% 3.6%
AmeriTrust 100.5% 103.3% 4.2% 4.3%
Peak Reinsurance 98.3% 105.1% 2.6% 7.1%
Pramerica Fosun n/a n/a 6.3% 7.1%
Yong’an P&C Insurance 103.5% 103.6% 5.7% 7.4%
Equity Total n/a n/a 3.5% 4.1%
Insurance asset spreadInvestable Asset
Notes:1. Investable asset refer to the insurance float used by insurance company (from insurance businesses’ funds precipitation), capital invested by shareholders, retained earnings etc., assets formed by various
domestic and overseas investment activities. It mainly includes fixed income investment, equity investment, infrastructure investment, real estate investment and cash and cash equivalents
2. Total of effective interest on equity held by Fosun
Insurance
B. Insurance Business Overview
28
Fosun Insurance Portugal• European composite
insurance company• Shareholding ratio:
84.9884%
AmeriTrust• American labor
insurance company• Shareholding ratio: 100%
Fosun United Health Insurance• Chinese health
insurance company• Shareholding ratio: 20%
Yong’an P&C Insurance• Chinese property insurance
company• Shareholding ratio: 40.68%
Peak Reinsurance• Hong Kong reinsurance
company• Shareholding ratio:
86.90%
Pramerica Fosun• Chinese life insurance
company• Shareholding ratio: 50%
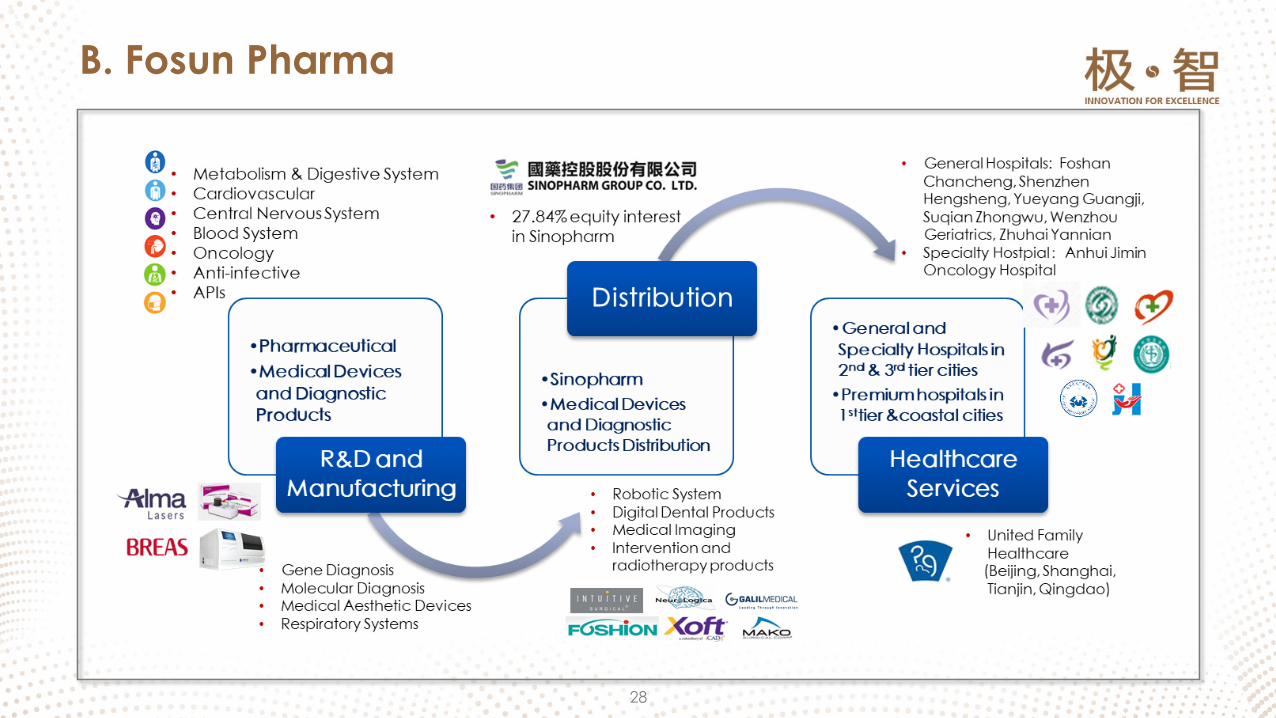
B. Fosun Pharma
28

B. Fosun Tourism
29
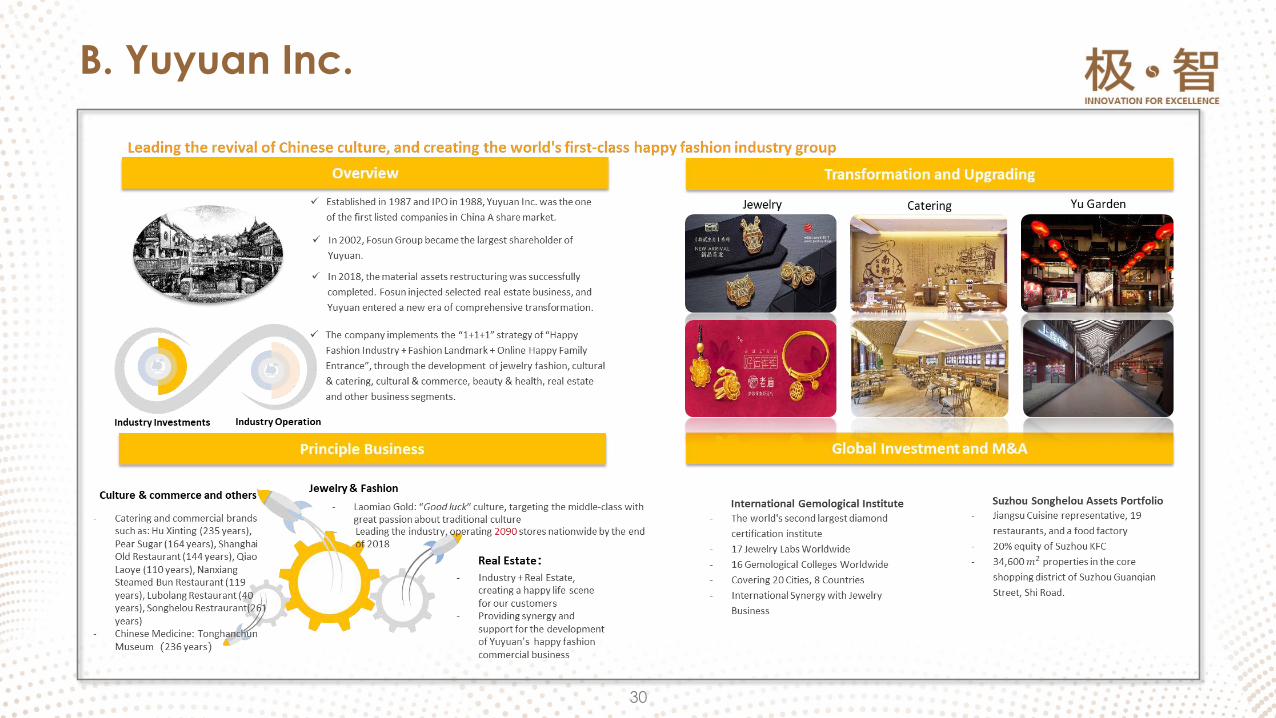
B. Yuyuan Inc.
30

B. Maternal Infant and Marriage
31
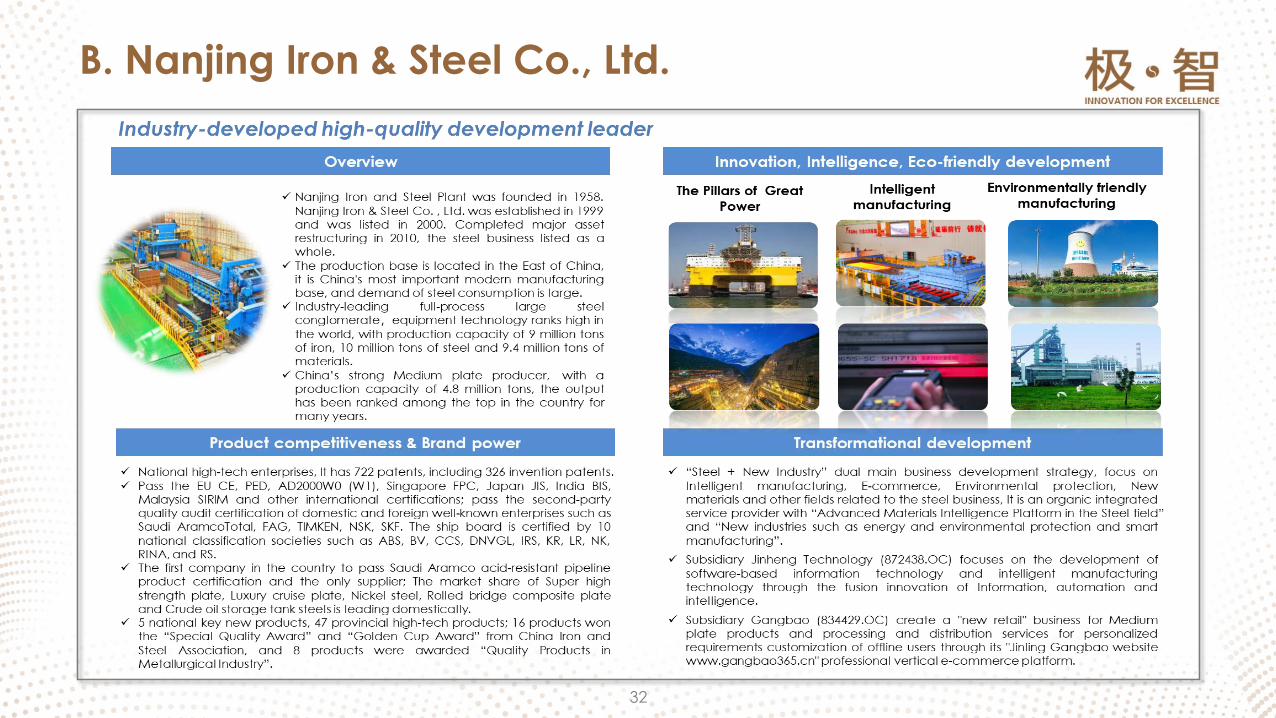
B. Nanjing Iron & Steel Co., Ltd.
32

B. Aitrox – Healthcare AI
35
36
B. Fosun Fashion Group
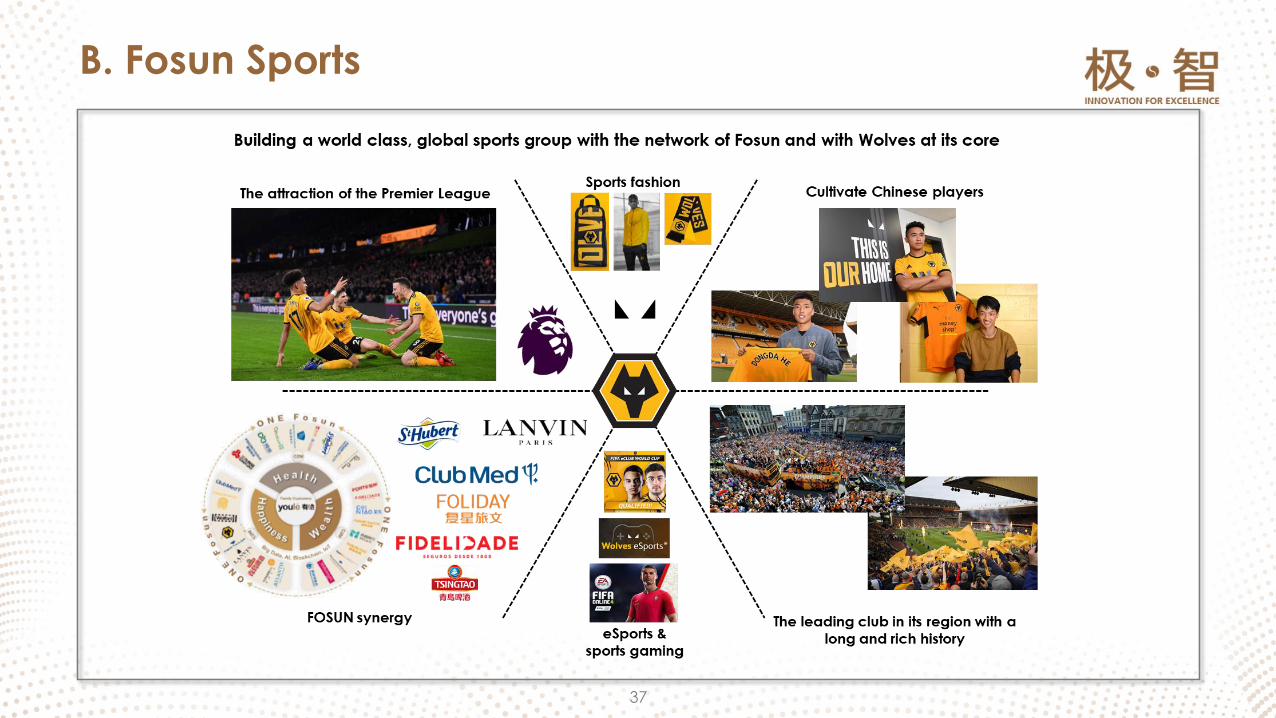
B. Fosun Sports
37