Health Consultation washington county Pennsylvania · 18/07/2018 · Pennsylvania Department of...
91
Health Consultation Public Health Evaluation of Long-Term Air Sampling Data Collected in the Vicinity of Natural Gas Operations WASHINGTON COUNTY, PENNSYLVANIA Prepared by: Pennsylvania Department of Health JULY 18, 2018 Prepared Under a Cooperative Agreement with the U.S. DEPARTMENT OF HEALTH AND HUMAN SERVICES Agency for Toxic Substances and Disease Registry Division of Community Health Investigations Atlanta, Georgia 30333
Transcript of Health Consultation washington county Pennsylvania · 18/07/2018 · Pennsylvania Department of...

Health Consultation
Public Health Evaluation of Long-Term Air Sampling Data
Collected in the Vicinity of Natural Gas Operations
WASHINGTON COUNTY, PENNSYLVANIA
Prepared by: Pennsylvania Department of Health
JULY 18, 2018
Prepared Under a Cooperative Agreement with the U.S. DEPARTMENT OF HEALTH AND HUMAN SERVICES
Agency for Toxic Substances and Disease Registry Division of Community Health Investigations
Atlanta, Georgia 30333

ii
Summary
Introduction As a follow-up to a 2010 short-term air sampling event near natural gas operations in Pennsylvania, in 2012-2013 the Pennsylvania Department of Environmental Protection (PADEP) conducted long-term ambient air monitoring near natural gas production and operations at four locations in Washington County, Pennsylvania. The air monitoring locations were selected due to the density of natural gas drilling operations including compressor plants, gas production wells, associated truck traffic, and other infrastructure associated with drilling operations. PADEP also collected background air samples from locations removed from natural gas production or operation facilities but within the southwestern Pennsylvania regional airshed. In 2015, the PADEP requested the Pennsylvania Department of Health (PADOH) and the Agency for Toxic Substances and Disease Registry (ATSDR) evaluate the PADEP’s air monitoring data and draft report titled "Long-Term Ambient Air Monitoring Project: Marcellus Shale Gas Facilities" (Long-Term Project) for public health implications.
The purpose of this health consultation is twofold: to evaluate whether the data collected by PADEP are sufficient to assess community-wide exposures to chemicals emitted by this industry and, to determine, based on the available data, if communities near these natural gas operations are being exposed to levels of chemicals in the air that could impact their health. PADOH and ATSDR determined the PADEP dataset was valid and sufficient to assess overall ambient air quality in the residential areas sampled. However, the data collected by PADEP were limited for assessing specific emissions impacts from the natural gas sources on ambient air quality in these communities. Except for continuous priority pollutant monitoring, sampling was conducted on a once-every-six-day regime. Based on site-specific meteorological data (i.e., wind direction and speed) collected during PADEP sampling, PADOH and ATSDR found this approach and the location of monitors did not capture air quality data with discreet sampling downwind of the targeted emissions sources on most of the days that samples were collected.
The primary goal of the PADOH Health Assessment Program is to evaluate whether a community is being exposed to levels of contaminants that may harm their health and make any necessary recommendations to prevent and mitigate exposures, as well as to ensure that the community has the best information possible to protect public health. PADOH worked under a cooperative agreement with the ATSDR to complete this public health evaluation.
Conclusions PADOH and ATSDR reached the following conclusions regarding outdoor air exposures in communities living in close proximity to natural gas infrastructure in southwestern Pennsylvania:
Conclusion 1 Based on the air sampling data collected from July 2012 to July 2013, exposure to the contaminant levels found in ambient air are not expected to harm healthy individuals. However, 24-hour or less exposures to intermittently high concentrations of hydrogen sulfide and ozone could irritate sensitive individuals, and intermittently high concentrations of particulate matter less than 2.5 microns in diameter (PM2.5) could

iii
irritate unusually sensitive individuals. Sensitive or unusually sensitive individuals might experience harmful respiratory effects such as breathing discomfort or asthma exacerbation. While the focus of the PADEP air monitoring was chronic (long-term or over a year or more in duration) exposures, PADOH and ATSDR also evaluated the potential for acute (short-term) exposures when feasible with the data collected. PADOH and ATSDR where generally not able to consider health impacts from acute exposures (less than 24 hours) to hazardous air pollutants other than criteria pollutants1 and hydrogen sulfide, due to data limitations.
Basis for Conclusion Seven chemicals (acetaldehyde, benzene, carbon tetrachloride, chloroform,
formaldehyde, hydrogen sulfide, and ozone) and PM2.5 exceeded health-based comparison levels in ambient air. However, except for ozone, hydrogen sulfide, and PM2.5, the detected concentrations for these chemicals are not expected to result in adverse health effects from short- or long-term exposures.
Healthy people are not expected to experience harmful effects from ozone, hydrogen sulfide or PM2.5 exposures at the levels found in the PADEP long term air data set. However, exposure to some of the higher levels of ozone (8 hour average), hydrogen sulfide (24 hour average), and PM2.5 (24 hour average and annual average) levels detected are considered unhealthy for sensitive (ozone and hydrogen sulfide) or unusually sensitive1 (PM2.5) populations. Sensitive individuals would have an increased likelihood of experiencing harmful respiratory effects (e.g., asthma exacerbation, breathing difficulty) from the maximum 8 hour average ozone and maximum 24 hour average hydrogen sulfide levels detected and unusually sensitive individuals (e.g., some individuals with heart, lung, cardiopulmonary disease) may experience harmful respiratory effects from short-term and long-term PM2.5 exposures. Hydrogen sulfide, ozone and PM2.5 are all respiratory irritants, so combined exposures to these chemicals might be of additional concern for some sensitive people. These exposures are primarily of health concern for active children and adults with respiratory diseases, such as asthma and chronic respiratory disease.
Estimated additional lifetime cancer risks from exposures to the carcinogenic chemicals (acetaldehyde, benzene, carbon tetrachloride, chloroform, and formaldehyde) detected were all very low. Average levels of the carcinogenic chemicals detected were generally similar to what is typically seen in ambient air in mixed urban, suburban, and rural areas across the U.S., but a few average levels (e.g., acetaldehyde, formaldehyde), exceeded levels typically seen in U.S rural areas. Maximum levels for some of the chemicals (e.g., benzene, carbon tetrachloride) exceeded levels typically seen in ambient air in mixed areas across the U.S.
1 EPA has established national ambient air quality standards (NAAQS) for six of the most common air pollutants— carbon monoxide, lead, ground-level ozone, particulate matter, nitrogen dioxide, and sulfur dioxide—known as “criteria” air pollutants (or simply “criteria pollutants”).

iv
Conclusion 2 An important limitation for this evaluation is that, based on (1) an analysis of the site-specific meteorology and (2) the expected variability in operations and emissions rates, we do not know if the monitoring results represent worst case, typical, or non-typical emissions from the identified natural gas production and operations sources.
Basis for Conclusion PADEP sampling was conducted in residential communities adjacent to the emissions
sources of interest. However, the topography in the project area, in concert with the locations of natural gas operations versus residential monitoring locations, limited options for assessing the specific targeted sources emissions. While the PADEP objective was to sample at community-based locations, the community locations identified that were amenable to staging sampling equipment were generally located at some distance from the natural gas activity sources of interest. Using a standard approach for designing a long-term monitoring project, PADEP used the available meteorological data to place fixed monitoring stations in expected predominantly downwind locations. Meteorological data from the Pittsburgh Airport, the nearest source with a sufficient historical set of valid meteorological data, was used to develop historic wind roses to determine dominant wind directions. This information was then used to identify project-specific monitoring locations.
Based on analyses of site-specific information collected during this effort, PADOH and ATSDR determined that the monitoring stations usually were not downwind of the sources targeted for monitoring during the days of discreet hazardous pollutant sampling (a one-in-six day sampling schedule for volatile organic compounds and aldehydes). For example, during valid volatile organic compound (VOC) sampling days, the monitoring sites were downwind of the Houston Gas Plant an estimated 6-15% of the hours that samples were being collected. The two monitoring sites for aldehydes/carbonyls were downwind from the identified natural gas activity sources an estimated 10-12% of the time. In addition to some of the monitoring locations not being downwind from the sources of interest for a majority of the sampling time, source emissions appear highly variable (e.g., unscheduled facility incidents, blowdowns or flaring events) and these events may not have been captured during scheduled monitoring days. A one-in-six day monitoring schedule is useful for assessing chronic exposures, but by design captures air quality data up to a maximum of 16.7% of time.
It is also important to note that the PADEP conducted continuous criteria pollutant monitoring throughout the entire sampling time frame at three “background” area monitoring locations and at one of the project-specific monitoring locations (Meddings Road). The Meddings Road location was downwind from an identified natural gas operations emissions source approximately 11% over the monitored time period. These continuously monitored data were also evaluated in this document. Exposure information for these pollutants were captured 100% of the time.

v
Conclusion 3 PADOH and ATSDR cannot evaluate the public implications of chemicals associated with natural gas production and operations that were not sampled for during this project. PADOH and ATSDR also cannot fully evaluate the public health implications of chemicals that were sampled for by PADEP using analytical method detection limits above ATSDR’s health based comparison values, or collection timeframes that did not permit analysis of short-term peak exposures. Also, due to established concerns about the reliability of acrolein data, PADOH and ATSDR did not conduct further assessment of the acrolein data collected.
Basis for Conclusion A number of chemicals are released to the air during natural gas production and
operations; some of these chemicals are very difficult to characterize in ambient air. PADEP sampled for criteria pollutants (ozone, nitrogen dioxide, carbon dioxide, particulate matter less than 2.5 microns), hydrogen sulfide, methane, and non-methane hydrocarbons and select toxic chemicals during this project using standard ambient air sampling and monitoring methods that can be analyzed at the state laboratory. However, some of the chemicals expected to be released to the air during natural gas production and operations cannot be assessed with the analytical methods currently available to the PADEP state laboratory program (e.g., glycols, glutaraldehyde). Furthermore, five chemicals (1,2-dibromoethane, 1,2-dichloroethane, hexachloro-1,3-butadiene, 1,3-butadiene, and 1,1,2-trichloroethane) were assessed at the laboratory, but had detection limits above the most conservative health-based comparison values.
Most of the sampling information from this project was limited to 24-hour collection timeframes, resulting in average daily concentrations. This approach works well for many chemicals. However, some chemicals emitted by this industry have the potential to cause health effects and/or symptoms from exposure durations that are less than 24 hours.
PADOH and ATSDR decided not to draw health conclusions based on the acrolein data collected due to sampling and analytical issues with this chemical.
Next Steps Individuals sensitive to airborne contaminants, including ozone, hydrogen sulfide, and PM2.5, should monitor air quality action days for their region (i.e., Florence, Charleroi and Washington COPAMS data) as well as their own local air quality conditions, and consider reducing activities that include prolonged or heavy exertion on days with poor air quality. The Air Quality Forecast and Alert system can be found at http://airnow.gov/.
Overall, PADOH and ATSDR recommend that PADEP continue air contaminant characterization efforts in areas of the Commonwealth with natural gas activities.
Given the limitations in monitor placement and the concern about representativeness of these data, PADOH and ATSDR believe additional community air monitoring activities, particularly with monitoring locations that are more regularly downwind of the target emissions sources, would further advance our understanding of community public health impacts from exposures to natural gas industry emissions. As feasible, analytical methods should be used with detection limits below the most conservative health-based

vi
comparison values. PADOH and ATSDR recommend PADEP consider using local meteorological data, including those data collected during the PADEP project (and analyzed by PADOH and ATSDR), to place or relocate (e.g., Meddings Road station) facility-specific monitoring stations in predominant downwind locations. Fenceline monitoring may also provide an indication of which analytes require offsite monitoring to assess human exposures to emissions. Gathering hourly methane and non-methane hydrocarbon measurements at priority locations is recommended, since these are the primary and chief components of most of the emissions from these natural gas industry sources. Having such measurements could help (1) in modeling offsite exposures to emitted chemicals; (2) in identifying potential trends in emissions; and (3) to more accurately identify potential emission source locations (e.g., through polar plotting techniques).
Further, PADOH and ATSDR strongly support PADEP’s proposed plan to expand ambient air monitoring network activities in Marcellus Shale regions, including establishing a new multi-pollutant monitoring location in Fayette County, expanding the PM2.5monitoring network to include monitors in Bradford, Clarion, Fayette, Greene, Indiana, Jefferson, Lycoming, McKean, Susquehanna and Wyoming Counties, and installing carbonyl samplers in Wyoming and Springville Counties.
PADEP should also continue to provide appropriate regulatory oversight to ensure implementation of best practices for emissions control at natural gas facilities and continue response, assessment and follow up actions to address community-based air quality complaints at these locations.
For more Information For further information about this health consultation, please call PADOH Bureau of
Epidemiology at (717) 787-3350 or ATSDR at 1-800-CDC-INFO. If you have concerns about your health, contact your health care provider.

vii
Table of Contents Purpose and Statement of Issues .................................................................................................................... 1
PADEP Short-Term Air Sampling Projects ................................................................................................... 2
Other Natural Gas Monitoring Projects and Potential Contaminants ........................................................ 2
Monitoring Location Descriptions and Sampling Methods ............................................................................. 3
Air Monitoring Data ........................................................................................................................................ 4
Meteorology, Spatial and Temporal Considerations .................................................................................. 4
Air Pollutant Data Evaluation ...................................................................................................................... 5
Screening of Air Sampling Results ........................................................................................................... 5
Air Sampling Results Data Evaluation ................................................................................................... 11
Health Implications ....................................................................................................................................... 11
Contaminants selected for further evaluation .......................................................................................... 11
Acetaldehyde ......................................................................................................................................... 12
Benzene ................................................................................................................................................. 12
Carbon Tetrachloride ............................................................................................................................ 13
Chloroform ............................................................................................................................................ 14
Formaldehyde ....................................................................................................................................... 14
Hydrogen Sulfide ................................................................................................................................... 15
Ozone .................................................................................................................................................... 16
Particulate Matter less than 2.5 microns in diameter (PM2.5) .............................................................. 17
Children’s Health Considerations .................................................................................................................. 18
Community Concerns .................................................................................................................................... 18
Limitations/Uncertainties ............................................................................................................................. 18
Conclusions ................................................................................................................................................... 19
Recommendations ........................................................................................................................................ 22
Public Health Action Plan .............................................................................................................................. 23
Report Preparation ........................................................................................................................................ 24
References ..................................................................................................................................................... 25
Appendix A Air Monitoring Locations and Site Demographics Information ................................................. 30
Appendix B Wind Rose Plot and Review of Meteorology and Downwind Sampling .................................... 42
Appendix C Chemical Concentrations over Time .......................................................................................... 47
Appendix D Overview of Pathway Analysis and Screening Values ............................................................... 50
Appendix E Health-based Screening Values and Field Sampling and Monitoring Results ............................ 54
Appendix F Chemical-Specific Health Effects and Exposure Evaluation Information ................................... 75

1
Purpose and Statement of Issues The Commonwealth of Pennsylvania has an extensive history of oil and natural gas development, particularly in its western region, dating back to the 1800s. Natural gas production from the Marcellus Shale in Pennsylvania started in 2008 [Governor’s Marcellus Shale Advisory Commission 2011].
In response to the increased amount of activities and community concerns over potential adverse impacts of unconventional Natural Gas Exploration and Production (NGE&P), PADEP conducted a short-term, screening level, air sampling project in Susquehanna County, Pennsylvania from August 2010 to October 2010. This was the second of three short-term, screening level air sampling projects completed by the PADEP in Pennsylvania (the other two studies were conducted in southwest and northcentral Pennsylvania) [PADEP 2012a]. Based on data limitations and uncertainties encountered in these previous short-term studies, in July 2012, PADEP began a long-term (i.e., one year) ambient air monitoring project to further assess the potential impacts of shale gas industry activities on air quality in Pennsylvania. Specifically, the Long-Term Project focused on natural gas industry air emissions sources in Washington County, located in southwestern Pennsylvania. The purpose of the long-term monitoring was to measure ambient contaminants to determine potential air quality impacts associated with the processing and transmission of natural gas. Washington County was selected because: 1) it was the first area in the Commonwealth to begin Marcellus Shale gas extraction; 2) a significant number of natural gas activity and related air emissions sources are present (compressor stations, extraction facilities, existing gas wells, and other associated infrastructure); and 3) several ambient air monitoring locations existed to provide infrastructure, background and historical data.
PADEP’s Long-term Project aimed to characterize United States Environmental Protection Agency- (U.S. EPA) designated criteria air pollutants (carbon monoxide, lead, nitrogen dioxide, ozone, particulate matter, and sulfur dioxide), hazardous air pollutants (HAPs), and possible chronic (long-term) risks to the public from exposure to these air contaminants. To do this, PADEP collected data on criteria contaminants, a subset of HAPs, hydrogen sulfide (H2S), and a partial list of methane/non-methane hydrocarbons from three background locations and four air monitoring stations offsite but near NGE&P activities.
In July 2015, PADEP requested PADOH and ATSDR review the long-term air monitoring data and draft document titled Long-Term Ambient Air Monitoring Project: Marcellus Shale Gas Facilities (“Long-Term
Purpose of this Document
This Health Consultation documents PADOH and ATSDR ’s evaluation of data included in PADEP’s Long-Term Ambient Air Monitoring Project: Marcellus Shale Gas Facilities.
When reading this document, it is important to note that PADOH and ATSDR ’s role in evaluating ambient air as public health agencies is different than agencies charged with addressing environmental issues including regulatory authority. In this document, PADOH and ATSDR evaluate the public health implications of the levels of air pollutants at the monitoring stations selected by the PADEP in Washington County, PA. These evaluations are not meant to assess facility compliance, or determine a source’s air emissions. State and federal environmental regulatory agencies are responsible for evaluating facility adherence to existing rules/regulations and source attribution.

2
Project”) and provide comments on the potential health implications. PADOH and ATSDR have completed this health consultation in response to the PADEP request.
The purpose of this health consultation is twofold:
• To evaluate whether the data collected by PADEP are sufficient to assess community-wideexposures to chemicals emitted by the natural gas exploration and production industry; and,
• To evaluate the available ambient air monitoring data collected by the PADEP during their Long-Term Project to determine if communities near natural gas drilling operations are beingexposed to levels of chemicals that could impact their health.
PADEP Short-Term Air Sampling Projects The PADEP 2010 short-term air sampling activities were performed in three regions of Pennsylvania (northcentral, northeast, and southwest) near natural gas operations. These sampling efforts provided information on the types of contaminants present but did not assess potential chronic or long-term inhalation exposures near natural gas operations. PADEP concluded from the three projects that the data “did not identify concentrations of any compound that would likely trigger air-related health issues.” However, the project in the southwest indicated that air contaminants (including methane, ethane, propane, and butane) were detected more frequently near compressor stations. These studies were of limited duration and, for some contaminants, used methods that had relatively high detection limits. This project prompted the PADEP to conduct the Long-Term Project in order to address potential chronic exposures near natural gas operations and to evaluate the impacts of the shale gas industry on air quality in Pennsylvania. Additional information and the PADEP reports for the short-term air sampling can be found on PADEP’s website2.
Other Natural Gas Monitoring Projects and Potential Contaminants PADOH and ATSDR reviewed the results from other ambient air monitoring projects to determine the typical air constituents found near natural gas operations to evaluate the comprehensiveness of the data gathered for the Long-Term Project. Emissions sources for the natural gas operation sites usually include compressor stations and associated fugitive sources. These are discussed in more detail below.
Natural gas from individual well sites is usually routed to compressor stations, where the gas is treated to remove water vapor, non-methane hydrocarbons, and other impurities (e.g. hydrogen sulfide, carbon dioxide, reduced sulfur compounds, acidic gases, and chemicals added during extraction process). The gas is compressed to facilitate further distribution via larger transmission lines. Compressor stations typically serve multiple well sites, and the energy needed to compress the gas is usually generated by natural gas-fired engines. Although many contaminant emission sources may be found at compressor sites, they generally fall into three categories: storage tanks, fugitive emission points, and compressor engines [ERG 2011]. According to EPA emission factors, combustion of natural gas, such as occurs when firing compressors, can generate a wide range of by-products, including criteria pollutants, hydrocarbons, and carbonyls. Overall, a common theme from previous air modeling studies is that carbonyls, especially formaldehyde, are the primary combustion by-products of concern for compressor stations. Data collected from multiple studies also confirm the presence of hydrocarbons in fugitive emissions from
2 PADEP website for monitoring toxic pollutants: http://www.dep.pa.gov/Business/Air/BAQ/MonitoringTopics/ToxicPollutants/Pages/default.aspx

3
compressor stations. Simple, short-chain hydrocarbon chemicals, known as alkanes, (e.g., methane, ethane, propane, butane) appear to account for the greatest portion of these emissions. Glycol dehydrators may also emit BTEX compounds (benzene, toluene, ethylbenzene, and xylenes), which is a concern that has been noted previously for fugitive emissions from these unit operations [U.S. EPA 1995]. A New York State Department of Environmental Conservation modeling study noted that fugitive air emissions of H2S could also be of concern in fugitive emissions. Further, particulate matter is known to be created through the incomplete combustion of compressor engines [ERG 2011].
Given what is known about compressor station releases, ATSDR suggested the following pollutants be measured in the PADEP Long-Term Project:
1. Aldehydes/Carbonyls, including formaldehyde 2. Volatile organic compounds, including alkanes and other components of petroleum products
(BTEX) 3. Hydrogen sulfide (H2S) 4. Particulate matter (PM) less than 2.5 microns in diameter (PM2.5)
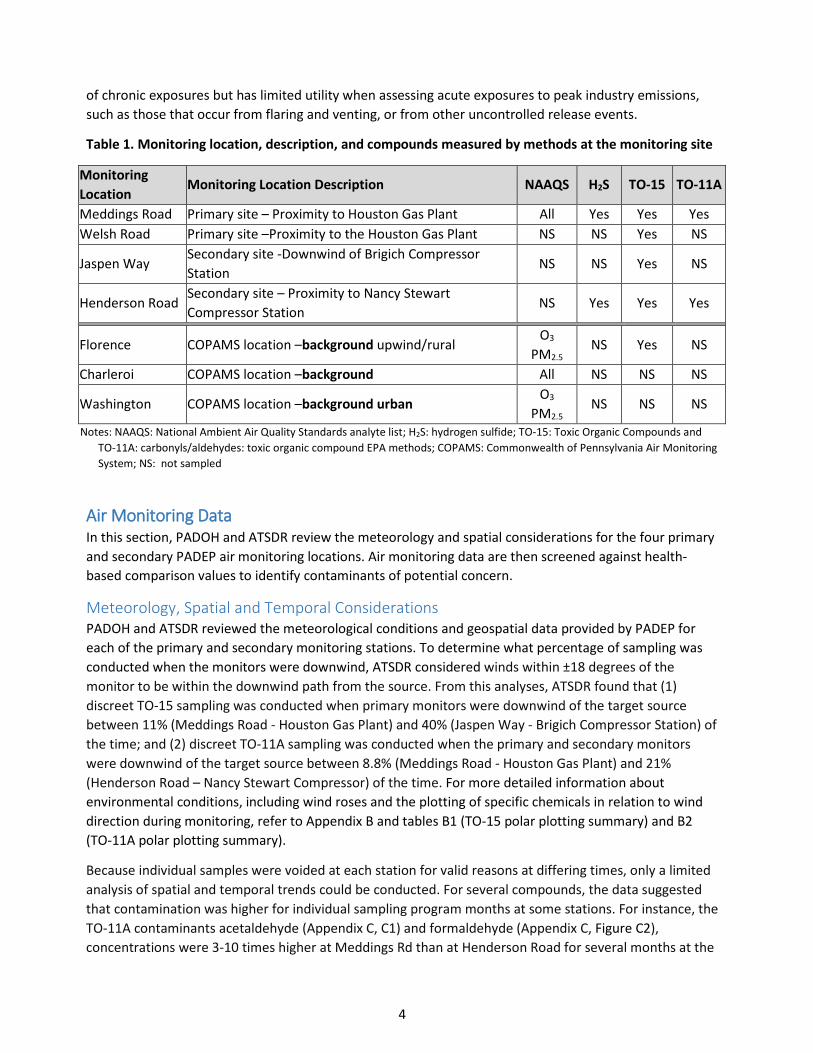
Monitoring Location Descriptions and Sampling Methods PADEP conducted sampling at seven monitoring stations in Washington County. Table 1 below identifies monitoring locations and the classes of compounds measured at each of these locations. All of the PADEP air monitoring locations are shown in relationship to each other in Appendix A, Figure A1.
PADEP primary and secondary sampling locations were selected in residential communities adjacent to the emissions sources of interest. Using a standard approach for designing a long-term monitoring project, PADEP used the available meteorological data to place fixed monitoring stations in expected predominantly downwind locations. Meteorological data from the Pittsburgh Airport, the nearest source with a sufficient historical set of valid meteorological data, was used to develop historic wind roses to determine dominant wind directions. This information was then used to identify project-specific monitoring locations. However, real world limitations (site access agreements; electricity supply for monitoring equipment; topography; geospatial arrangement of sources and residences; wind data history; material, laboratory, and personnel costs) affected the PADEP’s ability to place the sampling equipment in optimum locations. These limitations affect the PADEP’s ability to capture all potential emissions exposure scenarios (e.g., short-term peak emissions). While the PADEP objective was to conduct sampling at nearby community-based locations, the community locations identified that were amenable to staging sampling equipment were generally located at some distance from the natural gas activity sources of interest.
Note, field projects often pose challenges for achieving complete sample collection due to weather, site access, and a number of other environmental conditions. PADEP reported that, because of issues with calibration and data collection (including data logging problems, power outages, and span calibration check issues), some monitoring stations did not have a complete data set.
PADEP sampling was conducted continuously over the entire sampling period for criteria pollutants, including fine particulate matter (PM2.5), ozone, nitrogen compounds (NO2, NOx, NO), and carbon monoxide. Hazardous air pollutants (HAPs) were sampled on a one-in-six day schedule using toxic organic methods TO-11A for aldehydes and carbonyls and TO-15 for VOCs. A one-in-six day schedule can capture air quality data up to a maximum of 16.7% of time. This approach to HAPs sampling allows for an estimate
4
of chronic exposures but has limited utility when assessing acute exposures to peak industry emissions, such as those that occur from flaring and venting, or from other uncontrolled release events.
Table 1. Monitoring location, description, and compounds measured by methods at the monitoring site
Monitoring Location
Monitoring Location Description NAAQS H2S TO-15 TO-11A
Meddings Road Primary site – Proximity to Houston Gas Plant All Yes Yes Yes Welsh Road Primary site –Proximity to the Houston Gas Plant NS NS Yes NS
Jaspen Way Secondary site -Downwind of Brigich Compressor Station
NS NS Yes NS
Henderson Road Secondary site – Proximity to Nancy Stewart Compressor Station
NS Yes Yes Yes
Florence COPAMS location –background upwind/rural O3
PM2.5 NS Yes NS
Charleroi COPAMS location –background All NS NS NS
Washington COPAMS location –background urban O3
PM2.5 NS NS NS
Notes: NAAQS: National Ambient Air Quality Standards analyte list; H2S: hydrogen sulfide; TO-15: Toxic Organic Compounds and TO-11A: carbonyls/aldehydes: toxic organic compound EPA methods; COPAMS: Commonwealth of Pennsylvania Air Monitoring System; NS: not sampled
Air Monitoring Data In this section, PADOH and ATSDR review the meteorology and spatial considerations for the four primary and secondary PADEP air monitoring locations. Air monitoring data are then screened against health-based comparison values to identify contaminants of potential concern.
Meteorology, Spatial and Temporal Considerations PADOH and ATSDR reviewed the meteorological conditions and geospatial data provided by PADEP for each of the primary and secondary monitoring stations. To determine what percentage of sampling was conducted when the monitors were downwind, ATSDR considered winds within ±18 degrees of the monitor to be within the downwind path from the source. From this analyses, ATSDR found that (1) discreet TO-15 sampling was conducted when primary monitors were downwind of the target source between 11% (Meddings Road - Houston Gas Plant) and 40% (Jaspen Way - Brigich Compressor Station) of the time; and (2) discreet TO-11A sampling was conducted when the primary and secondary monitors were downwind of the target source between 8.8% (Meddings Road - Houston Gas Plant) and 21% (Henderson Road – Nancy Stewart Compressor) of the time. For more detailed information about environmental conditions, including wind roses and the plotting of specific chemicals in relation to wind direction during monitoring, refer to Appendix B and tables B1 (TO-15 polar plotting summary) and B2 (TO-11A polar plotting summary).
Because individual samples were voided at each station for valid reasons at differing times, only a limited analysis of spatial and temporal trends could be conducted. For several compounds, the data suggested that contamination was higher for individual sampling program months at some stations. For instance, the TO-11A contaminants acetaldehyde (Appendix C, C1) and formaldehyde (Appendix C, Figure C2), concentrations were 3-10 times higher at Meddings Rd than at Henderson Road for several months at the

5
beginning of the Long-Term Project. Contrasting these trends, there were no remarkable differences across sites for carbon tetrachloride (Appendix C, C3), which would be expected since carbon tetrachloride is a common background contaminant in the atmosphere [ATSDR 2005b]. A second example of these unexplained trends is provided with the hydrogen sulfide data from Meddings Road. Hydrogen sulfide levels measured at Meddings Road were consistently below the limits of detection for the Teledyne API from the start of the Long-Term Project through June 2013. After June 2013, detectable concentrations varied up to the maximum hourly measurement of 5.6 µg/m3 (Appendix C, Figure C4).
Air Pollutant Data Evaluation The following sections explain the PADOH and ATSDR process to evaluate health risks for the air sampling data collected by PADEP. Overviews of PADOH’s and ATSDR’s pathway analyses and screening values are provided in Appendix D and E, respectively.
Screening of Air Sampling Results Using standard procedures as outlined in the ATSDR Public Health Guidance Manual [ATSDR 2005a], PADOH and ATSDR evaluated whether the compounds analyzed and detected in the air samples could be present at levels that may affect people’s health. First, an exposure point concentration (EPC) that is believed to represent typical concentrations needed to be calculated. The most commonly used EPC is the 95% upper confidence limit of the arithmetic mean (95UCL). The 95UCL is a calculated value that equals or exceeds an exposure unit’s actual arithmetic mean of site concentrations 95 percent of the time. For a given number of discrete environmental samples in an exposure unit, the calculated arithmetic mean may be lower or higher than the actual arithmetic mean [U.S. EPA 1992, 2007]. However, it is highly unlikely (i.e., no more than 5 percent probability) that the 95UCL will be lower than the exposure unit’s actual arithmetic mean. As the number of environmental samples in an exposure unit increases, the difference between the 95UCL and the sample arithmetic mean decreases. The 95UCL should not be confused with the 95th percentile. For this data set, the EPC was calculated based on the 95UCL for acetaldehyde, benzene, carbon tetrachloride, chloroform, and formaldehyde. Measured 24 hour-average concentrations (not 95UCL values) were used as the EPC for hydrogen sulfide and PM2.5, since continuous monitoring data were available for these contaminants.
The PADEP long term air data set contained detected values and concentrations below the method detection limit (MDL). In order to calculate a mean and the 95UCL of the mean for this data set, PADOH and ATSDR used the formula of MDL divided by the square root of 2 to include non-detect or “censored” values. This is a common method for estimating censored values described by Hornung and Reed [Hornung and Reed 1990].
Next, the EPCs are screened against health based comparison values (CVs). The compounds with 95UCL EPCs that exceeded acute or chronic health-based CVs are found in Table 2 below. Table 2 also provides the health-based CV that was exceeded, the typical range of the compound found in ambient air in the U.S., and if available, compares the result from the primary (Medding Road and Welsh Road) and secondary (Jaspen Way and Henderson Road) monitoring stations to the rural background (Florence COPAMS) results obtained during the Long-Term Project. Selected compounds identified in Table 2 are evaluated further in the health implications section of this report. Five organic compounds (1,2-Dibromoethane, 1,2-Dichloroethane (1,2-DCA); Hexachloro-1,3-butadiene; 1,3-Butadiene; and

6
Table 2. Summary of air contaminants that exceeded health-based comparison values near natural gas drilling operation sites, Washington County, Pennsylvania (2012-2013) (all concentrations in µg/m3)
Air contaminants
Statistical Descriptors
Meddings Road
Sampling Location
Welsh Road
Sampling Location
Jaspen Way
Sampling Location
Henderson Road
Sampling Location
Florence COPAMS Sampling Location
(background-rural)
Comparison Value
Typical U.S. levels*
Acetaldehyde
Range 0.798-3.19
NA NA
0.20-1.46
NA 9 EPA chronic RfC;
0.45 ATSDR CREG
0.16 remote mean [McCarthy et al.
2006]
In 2013, 90% of 139 air toxics
monitoring sites <2.62; 10% of
sites <0.92 [U.S. EPA 2014a]
Mean 1.485 0.862
95UCL 1.60 0.95
# of detection >CV/# of sampling events
49/52 40/43
Benzene
Range 0.182-1.411
0.313-2.012
0.217-2.194
0.192-1.213 0.249-1.871
9.6/19/29 chronic/intermediate/acute
ATSDR MRL;
0.13 ATSDR CREG
0.06 - 108 ambient air
[ATSDR 2007]
0.5 and 1.50 remote and rural median [ATSDR
2007]
In 2013, 90% of 276 air toxics
monitoring sites <1.25; 10% of
sites <0.39 [U.S. EPA 2014a]
Mean 0.589 0.717 0.53 0.475 0.574
95UCL 0.67 0.81 0.61 0.53 0.65
# of detection >CV/# of sampling events
52/52 52/56 69/71 69/72 59/63

7
Air contaminants
Statistical Descriptors
Meddings Road
Sampling Location
Welsh Road
Sampling Location
Jaspen Way
Sampling Location
Henderson Road
Sampling Location
Florence COPAMS Sampling Location
(background-rural)
Comparison Value
Typical U.S. levels*
Carbon tetrachloride
Range 0.472-0.748
0.465-0.792
0.440-0.723
0.314-0.792 0.409-0.817
190 chronic ATSDR MRL; 0.17 ATSDR CREG
Typical levels in rural areas are about 1 μg/m3, with somewhat
higher values in urban areas and near
industrial sources [ATSDR 2005b]
In 2013, 90% of
225 air toxics monitoring sites <0.624; 10% of
sites <0.501 [U.S. EPA 2014a]
Mean 0.596 0.595 0.600 0.597 0.617
95UCL 0.61 0.612 0.615 0.614 0.633
# of detection >CV/# of sampling events
52/52 56/56 71/71 73/73 65/65
Particulate matter less than 2.5 micrometers (PM2.5) – annual data
Range 1.3-24.9 Not assessed
Not assessed
Not assessed 1.8-27.3
12 [U.S. EPA 2016c] 10 µg/m3 [WHO 2006] 10 -100
annual median concentration of
both rural and urban areas [WHO 2018]
Mean 8.59 Not assessed
Not assessed
Not assessed 8.69
PM2.5 – 24-hour data
# of detection >12.1 µg/m3 / # of sampling events
89/478 (19%)
Not assessed
Not assessed
Not assessed
100/514 (20%)
12.1 Adopted from EPA Air
Quality Index [U.S. EPA 2016c]

8
Air contaminants
Statistical Descriptors
Meddings Road
Sampling Location
Welsh Road
Sampling Location
Jaspen Way
Sampling Location
Henderson Road
Sampling Location
Florence COPAMS Sampling Location
(background-rural)
Comparison Value
Typical U.S. levels*
Chloroform
Range
0.093-0.181
0.093-0.161
0.093-0.244
0.088-0.146 0.088-0.098
98/240/490 chronic/intermediate/acute
ATSDR MRL;
0.043 ATSDR CREG
0.098-0.24 remote range [ATSDR 1997]
Mean 0.127 0.129 0.126 0.125 0.125
95UCL 0.13 0.13 0.13 0.13 0.13
# of detection >CV/# of sampling events
6/52 9/56 24/70 13/73 65/65
Formaldehyde
Range 0.694-14.24
NA NA
0.049-2.92
NA
9.8/37/49 chronic/intermediate/acute
ATSDR MRL;
0.077 ATSDR CREG
0.25-7.4 rural and suburban mean [ATSDR 2015]
In 2013, 90% of
135 air toxics monitoring sites
<4.5; 10% of sites <1.8
[U.S. EPA 2014a]
Mean 3.56 0.902
95UCL 4.40 1.11
# of detection >CV/# of sampling events
52/55
42/47

9
Air contaminants
Statistical Descriptors
Meddings Road
Sampling Location
Welsh Road
Sampling Location
Jaspen Way
Sampling Location
Henderson Road
Sampling Location
Florence COPAMS Sampling Location
(background-rural)
Comparison Value
Typical U.S. levels*
Hydrogen Sulfide 24-hour average
Range ND-4.3
NA NA
ND-47
NA
98/28 acute/ intermediate ATSDR MRL;
2 EPA chronic RfC
Ambient air concentrations
from natural sources range 0.15 to 0.46; urban areas
generally <1.39 [ATSDR 2014]; remote areas
range 0.03 – 0.1 [MDHHS 2006]
Mean 0.901 7
# of detection >CV/# of sampling events
115/498 258/317
Ozone 8-hour average
Range 4-153
NA NA NA
22-165
100 WHO AQG (8-hour mean)
137 NAAQS (Annual fourth-highest daily maximum 8-
hour concentration, averaged over 3 years)
39 – 78 rural range [NAP 1991]
# of detection >CV/# of sampling events
1/518 (NAAQS)
52/518 (WHO)
2/518 (NAAQS)
94/518 (WHO)
µg/m3= micrograms per cubic meter, COPAMS- Commonwealth of Pennsylvania Air Monitoring System; NA-Not Available; AQG- Air Quality Guideline; NAAQS-National Ambient Air Quality Standard; EPA - Environmental Protection Agency; RfC - Reference Concentration; ATSDR - Agency for Toxic Substances Disease Registry; MRL – Minimum Risk Level; CREG - Cancer Risk Evaluation Guide; CV - Comparison Value; 95UCL - 95th Upper Confidence Limit of the arithmetic mean air concentration; WHO - World Health Organization. *Note, “Typical U.S. levels” include a range of rural and urban locations. For example, the current network configuration for EPA national air toxics monitoring system configuration includes 27 sites (20 urban, 7 rural) across the United States; thirteen sites were established in 2003, ten sites in 2004, and two sites each in 2007 and 2008, as described at https://www3.epa.gov/ttnamti1/natts.html.

10
1,1,2-Trichloroethane) were identified that had MDLs above their respective health-based CVs. Additional information for these five compounds is provided in Appendix E, Table E13.
For more details on the sampling results please refer to Appendix E, Tables E1-E11, which provide summaries by monitoring location of the chemicals detected, the MDLs, the mean and 95UCLs, minimum and maximum detections, and number of samples greater than CVs.
For air contaminants that screened above the applicable chronic air CV, PADOH and ATSDR estimated the potential for cancer and non-cancer health effects for communities living near the air monitoring locations. For non-cancer health effects, PADOH and ATSDR calculated a Hazard Quotient (HQ) for contaminants above the health-based CV (e.g., EPA reference concentration). The HQ is the ratio of the 95UCL air concentration divided by the health-based comparison value. A summation of the HQs for all chemicals being evaluated is used to calculate the Hazard Index (HI). An HI is determined for each monitoring location. An HI value of less than 1.0 indicates that adverse human health effects (non-cancer) are not expected. A ratio greater than 1 suggests further evaluation is needed. PADOH and ATSDR used a conservative approach to assess the potential for non-cancer health effects. By combining the HQ for each chemical detected, regardless of health effect endpoint, a hazard index can be identified for each sampling location. The hazard index is the estimated cumulative non-cancer risk from ambient air exposures to the detected chemicals at a particular location. The formula for determining the hazard index is provided in the text box below. Hazard index scores for each monitoring location is provided in Appendix E, Table E11. Note that PM2.5 data were not included in this hazard index approach; however, daily PM2.5 levels did sometimes exceed the ATSDR 24-hour (i.e., short-term) exposure screening value of 12.1 µg/m3 (i.e., approximately 20% of days). These PM2.5 exceedances may be of health concern to unusually sensitive individuals. Unusually sensitive populations and their exposures to PM2.5 are discussed in the health implications section of this document.
Estimating Non-Cancer Hazard Index Hazard Index = ∑(hazard quotients) = (Chemical ‘A’ 95UCL/ Chemical ‘A’ CV) + (Chemical ‘B’ 95UCL/Chemical ‘B’ CV) +
(Chemical ‘C’ 95UCL/ Chemical ‘C’ CV) +…….. Where, ∑ = sum Hazard Quotient = 95UCL/ chronic minimum risk level (c.MRL) or EPA reference concentration (RfC) 95 UCL = 95th upper confidence limit exposure point concentration, CV = non-cancer comparison value (i.e. c.MRL or RfC) Determining location specific hazard indices allows PADOH and ATSDR to screen for chemicals that require further assessment due to their potential to cause non-cancer health effects. None of the chemicals alone or in combination exceeded a hazard index of 1, which indicates that non-cancer health effects are not expected at the concentrations detected during the Long-Term Project for chronic exposures. While the focus of the PADEP air monitoring was chronic or long-term exposures, PADOH and ATSDR also screened the air monitoring data against available acute or short-term health-based screening values when feasible with the data collected. The available acute CVs can be found in Appendix E, Table E1. Because exposure data were available for timeframes shorter than 24-hours, PM2.5, ozone and hydrogen sulfide exposure evaluations included additional assessments over shorter timeframes, including for

11
sensitive subpopulations. These discussions are provided in the health implications section below. For additional information about each of the chemicals that exceeded a health-based screening value (i.e., cancer risk guideline) but are not expected to result in non-cancer health effects following chronic or subchronic exposures, see Appendix F.
Air Sampling Results Data Evaluation As summarized in Table 2 above, acetaldehyde, benzene, carbon tetrachloride, chloroform, formaldehyde, hydrogen sulfide, ozone, and PM2.5 screened above CVs in PADEP’s long term air data set. Due to data quality concerns, acrolein data was not evaluated in this health consultation. For more details on the sampling results by monitoring location please refer to Tables C1-C11 in Appendix C. Acetaldehyde, benzene, formaldehyde, and hydrogen sulfide are all air contaminants plausibly related to the natural gas industry. Based on a recent study [Macey et al. 2014], benzene, formaldehyde and hydrogen sulfide were the most common compounds detected above CVs near oil and gas production sites nationwide; and, benzene and formaldehyde were most-commonly detected above CVs near oil and gas production sites specifically in Pennsylvania.
Health Implications Contaminants selected for further evaluation Based on this review, PADOH and ATSDR did not identify any contaminants of concern for healthy individuals for acute (short-term) exposures. However, PM2.5 and hydrogen sulfide levels sometimes exceeded levels for 24 hour time periods (and ozone over an 8 hour period) that may result in health effects for sensitive or unusually sensitive individuals, including some people with asthma, or other respiratory diseases. For longer term exposures, PADOH and ATSDR identified three contaminants (hydrogen sulfide, PM2.5 and ozone) for further evaluation of chronic non-cancer health effects, and five chemicals (acetaldehyde, benzene, carbon tetrachloride, chloroform, and formaldehyde) for further evaluation of lifetime cancer risk. A summary of the cancer and non-cancer risk calculations for each monitoring location’s data set (i.e., cumulative excess cancer risk and hazard indices) are presented in Appendix E, Tables E11-E12. Additional information about the chemical-specific non-cancer and cancer evaluation process is provided in Appendix F. The estimated lifetime cancer risk was calculated using the 95UCL concentration of the contaminant in air multiplied by the EPA’s Inhalation Unit Risk (IUR), based on a 78-year lifetime exposure. Estimated lifetime cancer risks for exposure to the pollutants evaluated fall within EPA’s target cancer risk range of 1 in 10,000 to 1 in 1,000,000. Table 3 provides a summary of the non-cancer (hazard index) and cancer risks (estimated additional lifetime cancer risk). As noted in the Screening of Air Sampling Results Section above, all of the chronic exposure hazard indices for non-cancer fall below 1, which indicates non-cancer health effects are not expected from exposures to the chemicals detected at any of the monitoring sites, based on the available data and associated data limitations.

12
Table 3. Summary of total cancer risk and non-cancer Hazard Index of airborne contaminants by air monitoring location
Monitoring Site Total Cancer Risk+ Non-Cancer Chronic Exposure Hazard Index (HI)
Meddings Rd 7.2 x 10⁻⁵ 0.7 Welsh Rd 1.3 x 10⁻⁵ 0.08 Jaspen Way 1.2 x 10⁻⁵ 0.06 Henderson Rd 2.6 x 10⁻⁵ 0.28 Notes: +cancer risk of all chemicals combined.
Acetaldehyde Acetaldehyde was sampled only at the Meddings and Henderson Road monitoring stations. The national average concentration of acetaldehyde reported in EPA’s 2010 National Monitoring Programs Annual Report is 1.91 μg/m3 [U.S. EPA 2012]. McCarthy et al. [2006] found an average acetaldehyde concentration of 0.16 µg/m3 in background remote locations and 1.62 µg/m3 median in 10 city urban pilot locations. The average concentration observed at Meddings and Henderson Road exceeded levels typically seen in U.S rural areas. Both the Meddings and Henderson Road sampling locations are characterized as rural. The levels at Meddings and Henderson Road were less than or consistent with levels seen in the U.S. EPA’s national air toxics monitoring network for this chemical [U.S. EPA 2014a].
Exposure Evaluation for Acetaldehyde
The 95UCL of acetaldehyde falls below non-cancer, health-based screening values; therefore non-cancer health effects from exposures to the detected concentrations are not expected. However, the 95UCL did exceed the CREG (0.45 μg/m3), so a cancer evaluation is below.
To estimate excess lifetime cancer risk from exposure to acetaldehyde at the 95UCL levels detected during this monitoring, the exposure concentration is multiplied by the EPA inhalation unit risk for acetaldehyde of 0.0000022 (μg/m3)-1 [U.S. EPA 1988]. PADOH and ATSDR calculated the cancer risks at the acetaldehyde levels detected at Meddings Road (95UCL of 1.6 µg/m3) and Henderson Road (95UCL of 0.95 µg/m3). The estimated cancer risk is very low at 3.5 x 10⁻⁶, or about 3 in 1,000,000, for Meddings Road, and 2.1 x 10⁻⁶, or about 2 in 1,000,000, for Henderson Road (Appendix E, Table E12).
The measured concentrations of acetaldehyde are substantially lower than those observed to have caused health effects in animals and humans based on scientific research studies. The levels exceeded those seen typically in rural areas, but are below or consistent with levels measured in U.S. EPA’s national air toxics monitoring network for this chemical. The calculated additional cancer risk for this chemical is very low. Therefore, long-term acetaldehyde inhalation exposures at the levels detected by PADEP in this project are not expected to harm people’s health.
Benzene Benzene was sampled at Meddings Road, Welsh Road, Jaspen Way, and Henderson Road air monitoring stations, as well as the COPAMS background station in Florence. The average benzene levels seen in the PADEP project were consistent with levels seen in the U.S. EPA’s national air toxics monitoring network for this chemical [U.S. EPA 2014a]. The maximum value (2.2 μg/m3) exceeded levels typically seen in this

13
nationwide network. ATSDR’s Toxicological Profile for benzene reports daily median benzene air concentrations from 1975-1985 in remote areas of the U.S. at 0.16 ppb (0.51 μg/m3), in rural areas at 0.47 ppb (1.5 μg/m3), and in suburban and urban areas at 1.8 ppb (5.75 μg/m3) across 300 cities in 42 states, while in six states in the Great Lakes region benzene was found in 99.7% of the 386 air samples taken with an average concentration of 7.5 μg/m3 [ATSDR 2007]. The 95UCL results for benzene from this project ranged from 0.53 - 0.81 μg/m3, and therefore were less than the reported median value for U.S. rural areas. Exposure Evaluation for Benzene
The 95UCLs for benzene fall below non-cancer, health-based screening values; therefore, non-cancer health effects from exposures to the detected concentrations are not expected. Although benzene concentrations exceed ATSDR’s cancer health based comparison values at times, they are hundreds of times below levels known to cause cancer in humans. Furthermore, average benzene concentrations found at Meddings Road, Welsh Road, Jaspen Way, and Henderson Road are not notably different than average benzene concentrations found at the background location in Florence. The average and 95UCL levels of benzene at all monitoring stations were below median levels (1.5 μg/m3) typically seen in rural U.S ambient air [ATSDR 2007]. The estimated excess cancer risks for benzene were very low at 5.2 x 10⁻⁶ (or 5 excess cancers in 1,000,000 exposed) for Meddings Road, 6.3 x 10⁻⁶ for Welsh Road, 4.8 x 10⁻⁶ for Jaspen Way, and 4.1 x 10⁻⁶ Henderson Road (Appendix E, Table E12). Additional information about this chemical-specific evaluation process is provided in Appendix F. The measured concentrations of benzene are substantially lower than those observed to have caused health effects in humans and animals based on scientific research studies, and are similar to background levels measured in this project and in rural areas of the United States. The calculated additional cancer risk for this chemical is very low. Therefore, long-term benzene inhalation exposures at the levels detected by PADEP in this project are not expected to harm people’s health.
Carbon Tetrachloride Carbon tetrachloride was sampled at Meddings Road, Welsh Road, Jaspen Way, and Henderson Road air monitoring stations, as well as the COPAMS background station in Florence. Typical levels of carbon tetrachloride in rural areas are about 1 μg/m3, with somewhat higher values in urban areas and near industrial sources. Based on analysis of 4,913 ambient air samples reported in the National Ambient Volatile Organic Compounds Database (including remote, rural, suburban, urban, and source dominated sites in the United States), the average concentration of carbon tetrachloride was 1.1 μg/m3 [ATSDR 2005b], which is greater than the 95UCL at all sites evaluated in this project. The background air monitoring location at Florence had similar levels of carbon tetrachloride to those measured in this PADEP long term air data set, with concentrations ranging from 0.41 μg/m3 to 0.82 μg/m3 and a mean 95UCL of 0.63 μg/m3. These average levels were consistent with levels seen in the EPA U.S. national air toxics monitoring network for this chemical and less than a national average cited by ATSDR in 2005 [U.S. EPA 2014a]. The maximum value exceeded levels typically seen in this nationwide network.

14
Exposure Evaluation for Carbon Tetrachloride
The maximum concentrations and 95UCLs for carbon tetrachloride fall below non-cancer, health-based screening values; therefore non-cancer health effects from exposures to the detected concentrations are not expected. The detected levels of carbon tetrachloride (95UCL and maximum values in Table 2) exceed the ATSDR CREG of 0.17 μg/m3. PADOH and ATSDR calculated the excess cancer risk from exposure to carbon tetrachloride at a concentration of 0.61 μg/m3 at all monitoring locations. The estimated lifetime cancer risk from exposure to carbon tetrachloride at the detected level is very low (3.7 x 10⁻⁶, or about 4 excess cancers in 1,000,000 exposed individuals) at all monitoring locations (Appendix E, Table E12). Additional information about this chemical-specific evaluation process is provided in Appendix F. The measured concentrations of carbon tetrachloride are substantially lower than those observed to have caused health effects in animals based on scientific research studies, and are similar to background levels measured in this project and in the United States. The calculated additional cancer risk is very low. Therefore, long-term carbon tetrachloride inhalation exposures at the levels detected by PADEP in this project are not expected to harm people’s health.
Chloroform Chloroform was sampled at Meddings Road, Welsh Road, Jaspen Way, and Henderson Road air monitoring stations, as well as the COPAMS background station in Florence. Typical levels of atmospheric exposure to chloroform in remote, urban, and source-dominated areas in the United States range from 0.098 to 0.24 μg/m3, 0.29 to 9.8 μg/m3, and 4 to 108 μg/m3, respectively [ATSDR 1997]. Exposure Evaluation for Chloroform
The maximum concentrations and 95UCLs for chloroform fall below non-cancer, health-based screening values; therefore non-cancer health effects from exposures to the detected concentrations are not expected. The detected concentrations of chloroform (95UCL and maximum values in Table 2) are greater than ATSDR’s CREG of 0.043 μg/m3. U.S. EPA’s inhalation unit risk for chloroform exposure and ATSDR’s CREG were derived in the 1990s based on liver cancer in female mice dosed orally with chloroform, and thus not from an inhalation exposure study [U.S. EPA 2001]. PADOH and ATSDR calculated the excess cancer risk from exposure to chloroform at a concentration of 0.13 μg/m3 at all monitoring locations. The estimated lifetime cancer risk was very low (3 x 10⁻⁶, or about 3 excess cancers in 1,000,000 exposed individuals) at all monitoring locations (Appendix E, Table E12). The measured concentrations of chloroform are substantially lower than those observed to have caused health effects in humans and animals based on scientific research studies, and are similar to background levels measured in this project and in remote areas of the United States. The estimated additional lifetime cancer risk is very low. Therefore, long-term chloroform inhalation exposures at the levels detected by PADEP in this project are not expected to harm people’s health.
Formaldehyde Formaldehyde was sampled only at Meddings and Henderson Road monitoring stations. A study of 184 single family homes in several different cities [RIOPA 2005] found a mean concentration of formaldehyde

15
in outdoor ambient air of 3.69 µg/m3 (3 ppb) and in housing of 20.91 µg/m3 (17 ppb). In a survey of outdoor measurements of hazardous air contaminants in the United States, a median formaldehyde concentration of 3.1 µg/m3 was found for a total of 1,358 samples collected at 58 different locations [ATSDR 1999]. In general, formaldehyde levels in outdoor air range from 0.25 to 7.4 µg/m3 in rural and suburban areas and 1.2 to 25 µg/m3 in urban areas [ATSDR 2015]. The average levels of formaldehyde in the PADEP long term air data set were consistent with levels cited by ATSDR in rural and suburban areas in 2015 and with levels typically seen in the U.S. national air toxics monitoring network for this chemical. The maximum value exceeded levels typically seen in the nationwide network. Exposure Evaluation for Formaldehyde
The 95UCLs for formaldehyde fall below non-cancer, health-based screening values; therefore, non-cancer health effects from exposures to the detected concentrations are not expected.
The 95UCL at Meddings Road and Henderson Road (4.40 and 1.11 µg/m3, respectively) exceeded the ATSDR CREG of 0.077 μg/m3 for cancer effects. PADOH and ATSDR calculated the excess cancer risk from exposure to formaldehyde at Meddings Road (95UCL of 4.4 µg/m3) and Henderson Road (95UCL of 1.1 µg/m3). The estimated lifetime cancer risks from exposure to formaldehyde at the detected levels were very low at 5.7 x 10⁻⁵ (about 6 extra cases of cancer in 100,000) for Meddings Road and 1.4 x 10⁻⁵ (about 1 extra case in 100,000) for Henderson Road (Appendix E, Table E12). Additional information about this chemical-specific evaluation process is provided in Appendix F. The measured concentrations of formaldehyde are substantially lower than those observed to have caused cancer health effects in humans based on scientific research studies, and are consistent with background levels measured in the United States. The estimated additional lifetime cancer risk is very low. Therefore, long-term formaldehyde inhalation exposures at the levels detected by PADEP in this project are not expected to harm people’s health.
Hydrogen Sulfide Hydrogen sulfide was measured at the Meddings (24-hour average values ranged from non-detect to 4.35 μg/m3) and Henderson Roads (24-hour average values ranged from non-detect to 47 μg/m3) monitoring stations. Hydrogen sulfide was not assessed at the other locations in the Long-Term Project. The maximum concentration detected in the PADEP data set is lower than ATSDR’s CV for non-cancer health effects over acute (98 μg/m3) exposure durations; however, some of the levels detected were greater than ATSDR intermediate-duration CV (28 μg/m3) and EPA’s chronic CV (2 μg/m3) for non-cancer effects over a longer duration. Ambient air concentrations of hydrogen sulfide from natural sources range between 0.15 and 0.46 μg/m3. Concentrations of hydrogen sulfide in urban areas are generally less than 1.39 μg/m3 [ATSDR 2014]. Concentrations in rural areas are reported as ranging from 0.03 – 0.1 μg/m3 [MDHHS 2006]. The average level of hydrogen sulfide measured at the Meddings Road location is lower than levels reported in urban areas but higher than levels observed in remote areas. The average level of hydrogen sulfide measured at the Henderson Road location is slightly higher than typical values seen in urban areas. The maximum 24-hour hydrogen sulfide concentration (47 μg/m3) measured at Henderson Road was complicated by an adjacent sewage treatment facility that may be a source of hydrogen sulfide emissions. Average levels at both locations that monitored for this chemical are higher than levels seen from natural sources of this chemical and observed in remote areas.

16
Exposure Evaluation for Hydrogen Sulfide
The concentration-response curve for low-level, long-term exposure to hydrogen sulfide is not well defined. Human studies are not sufficient to determine long-term effects, so the U.S. EPA relied on laboratory animal studies in rats to determine their chronic health-based inhalation guideline for hydrogen sulfide. The U.S. EPA derived their reference concentration (RfC) from a sub-chronic inhalation study of rats; the critical effect (most sensitive) in the study was the development of nasal lesions. The no observed adverse effect level (NOAEL) in rats (3,500 μg/m3) was converted to a human equivalent concentration of 640 μg/m3 (the conversion to a human equivalent concentration takes into account differences in anatomy and respiratory parameters). This value was then divided by an uncertainty factor warranted by 1) using a sub-chronic instead of chronic study; 2) extrapolating from animals to humans; and 3) unknown human variability. Dividing 640 μg/m3 by the uncertainty factor of 300 yields the chronic non-cancer RfC of 2 μg/m3 [U.S. EPA 2003b]. The animal to human converted NOAEL from scientific studies (640 μg/m3) is much higher than maximum 24-hour average hydrogen sulfide level (47 μg/m3) from the PADEP long-term project. Additional information about this chemical-specific evaluation process is provided in Appendix F. Average levels at both locations that monitored for hydrogen sulfide in this project are higher than levels seen from natural sources of this chemical and observed in remote areas, but lower than levels seen in urban areas. The measured concentrations of hydrogen sulfide are substantially lower than those observed to have caused health effects in animals based on research studies. However, at some of the higher levels of hydrogen sulfide detected, sensitive individuals would have an increased likelihood of experiencing harmful respiratory effects (e.g., asthma exacerbation, breathing difficulty). This is primarily true for active children and adults and people with respiratory diseases, such as asthma.
Ozone Ozone was sampled only at the Meddings Road air monitoring station, as well as at the COPAMS background station in Florence. Typical ozone levels in rural areas in the United States range from 39 to 78 μg/m3 [NAP 1991]. Exposure Evaluation for Ozone
The 8-hour maximum ozone concentration range at Meddings Road was 4 - 153 µg/m3, with one of the sampling days exceeding the CV (70 ppb or 137 µg/m3). The 8-hour ozone concentrations were similar at the Meddings Road location compared to the COPAMS locations. For example, at the Charleroi background location, 8-hour maximum ozone levels ranged from 126-161 µg/m3 (three days exceeding the CV), at the Florence background location ozone levels ranged from 22-165 µg/m3 (two days exceeding the CV), and at the Washington background location ozone levels ranged from 131 - 165 µg/m3 (three days exceeding the CV). The EPA NAAQS for 8-hour ozone (70 ppb or 137 µg/m3) is calculated from an annual fourth-highest daily maximum concentration, averaged over 3 years [U.S. EPA 2016c]. WHO has established a health guideline of 0.05 ppm (~100 µg/m3) for 8-hour average ozone concentrations [WHO 2006]. The PADEP long term air data set shows that the 8-hour ozone concentrations exceeded 137 µg/m3 as a single threshold value once at Meddings Road and twice at the Florence station, and exceeded the WHO guideline ~10% (52/518) and ~18% (94/528) of the time at the Meddings Road and Florence COPAMs locations, respectively. This is consistent with ozone having been identified as a regional issue in Washington County, PA. The Pittsburg-Beaver Valley, PA region that includes the Long-Term Project area, is (marginally) in non-attainment for 8-hour ozone as designated by PADEP in July 2012 [PADEP 2012b].

17
Emissions from industrial sources, mobile sources, and natural sources throughout the area contribute to this regional problem. Additional information about this chemical-specific evaluation process is provided in Appendix F. Ozone levels were similar at the Meddings Road location and the Florence background location. The maximum level at Meddings Road exceeded the range of typical U.S. levels in rural areas. The general population is not expected to experience harmful effects from ozone exposure at the levels found in the PADEP long term air data set. However, at some of the higher levels of ozone detected, sensitive individuals would have an increased likelihood of experiencing harmful respiratory effects (e.g., asthma exacerbation, breathing difficulty). This is primarily true for active children and adults and people with respiratory diseases, such as asthma.
Particulate Matter less than 2.5 microns in diameter (PM2.5) PM2.5 was monitored at the Meddings Road site location and three COPAMS monitoring stations (Charleroi, Florence and Washington) during the PADEP long-term project. Annual mean levels of PM2.5 in both rural and urban areas worldwide range from 10 to 100 µg/m3 [WHO 2018]. Exposure Evaluation for PM2.5
The Meddings Road site recorded the lowest average concentration and the fewest days when 24-hour average PM2.5 concentrations exceeded 12.1 µg/m3 (19% of days monitored). Only the Charleroi COPAMS monitor exceeded the World Health Organization’s annual PM2.5 standard of 10 µg/m3. The Charleroi COPAMS monitor also recorded the most days with PM2.5 exceeding the ATSDR short-term comparison value of 12.1 µg/m3 (34% of days monitored). The maximum 24-hour PM2.5 concentration of 29.6 µg/m3 was recorded at the Washington COPAMS station, located in an urban area of Washington, PA (see Table E-2 in appendix for data summary). Each of the stations where PM2.5 was monitored had similar annual average concentrations ranging from 8.6-10.7 µg/m3. Chronic exposure concentrations were below the EPA annual guideline of 12.1 μg/m3 at each of the monitoring stations included in the PADEP data set evaluated by ATSDR. However, the mean concentration at one station (Charleroi) exceeded the World Health Organization (WHO) annual air quality guideline of 10 μg/m3. PM2.5 concentrations above 10 but below 12.1 μg/m3 are not expected to be of concern for healthy or sensitive individuals; however, unusually sensitive individuals may experience harmful health effects from these exposures and should take precautions to address the potential for adverse effects in areas adjacent to the Charleroi COPAMS site. Additional information about this chemical-specific evaluation process is provided in Appendix F. The general population of healthy and sensitive individuals are not expected to experience harmful effects from PM2.5 exposure at the levels found in the PADEP long term air data set. However, unusually sensitive individuals may experience harmful health effects from these exposures and should take precautions to address the potential for adverse effects in areas adjacent to the Charleroi, Florence and Washington COPAMS sites.

18
Children’s Health Considerations ATSDR recognizes that developing fetuses, infants, and children have unique vulnerabilities. Children are not small adults; a child's exposure can differ from an adult's in many ways. A child drinks more liquid, eats more food, and breathes more air per unit of body weight than an adult, and has a larger skin surface area in proportion to body volume. A child's behavior and lifestyle also influence exposure levels. Children crawl on the floor, put things in their mouths, play closer to the ground, and spend more time outdoors. These behaviors can result in longer exposure durations and higher intake rates. Children are shorter than are adults; this means they breathe dust, soil, and vapors close to the ground. A child’s lower body weight and higher intake rate results in a greater dose of hazardous substance per unit of body weight. If toxic exposure levels are high enough during critical growth stages, the developing body systems of children can sustain permanent damage. Finally, children are dependent on adults for access to housing, for access to medical care, and for risk identification. Thus adults need as much information as possible to make informed decisions regarding their children’s health.
Community Concerns Since 2010, at sites and facilities across the Commonwealth, PADOH and ATSDR have received community concerns about air emissions and odors impacting health near natural gas extraction, processing and transportation facilities. Residents have complained of a number of health symptoms, including nausea, headache, lethargy, burning and irritation of upper respiratory tract, nose bleeds, stinging eyes, and metallic tastes on the tongue. A number of these symptoms are consistent with typical responses to noxious odors, which include headaches, nasal congestion, eye, nose, and throat irritation, hoarseness, sore throat, cough, chest tightness, shortness of breath, wheezing, heart palpitations and nausea [ATSDR 2016a]. Illnesses with plausible links to natural gas activity, such as pain syndromes and fatigue, are defined solely by symptoms, complicating health study work, but research in this area is ongoing. For example, a cross-sectional study of 7,785 adult Pennsylvania patients of the Geisinger Clinic found statistically significant associations with chronic rhinosinusitis, migraine headache and fatigue symptoms and a summary unconventional gas development activity metric [Tustin et al. 2017]. In responding to these community health concerns, PADOH and ATSDR identified an air quality data gap in Marcellus shale gas extraction regions, particularly in fence-line communities near natural gas industry infrastructure (e.g. compressors, well pads, impoundments, pig launchers, treatment plants, etc.). While the Long-Term Project provides additional information related to community exposures to air contaminants in areas impacted by natural gas activities, there remain important public health data gaps. See the limitation section, below.
Limitations/Uncertainties The PADEP long-term data set leaves a number of gaps in our attempt to adequately evaluate health impacts from shale gas activities. These include: 1. Limitations in numbers of monitoring stations and their locations. For the most part, the
monitoring stations were not sited in the predominate downwind direction from the identified natural gas activity sources and were generally located at some distance from identified sources. In addition, not all types of natural gas activities that might impact community air quality were included as potential sources (e.g., pig launching/receiving activities). The limitations in resources provided to PADEP for this effort, as well as the limited options for community-based monitoring in rural areas, impacted options for the number of monitoring stations and their siting.

19
Overall, the sampling may not have adequately captured uncommon but significant incidents of peak emissions (e.g. unscheduled facility incidents, blowdowns or flaring events) that may coincide with unfavorable meteorological conditions (e.g. air inversion), or all potential air quality sources of interest. Therefore, not enough information was generated to fully evaluate worst case exposures from the targeted source’s emissions in the Long-Term Project. We do not know if the monitoring results represent worst case, typical, or non-typical emissions from the identified natural gas production and operations sources.
2. Limitations in chemicals analyzed. PADEP’s long-term air monitoring focused on air contaminants
regulated by the state (HAPs and criteria or NAAQS pollutants). Additional chemicals that are not currently regulated by the state (and/or for which analytical methods are not available to the state) may be emitted as part of natural gas activities. These other chemicals may be of air quality and public health concern for exposed fenceline communities (e.g., aldehydes, such as glutaraldehyde). Not all monitoring stations assessed HAPs and NAAQS compounds during the PADEP long term project. For example, sampling data for H2S and aldehydes/ketones were not collected at the background/comparison monitoring locations. In addition, the evaluation of H2S monitoring at Henderson Road was complicated by an adjacent sewage treatment facility that has the potential to release low-level H2S.
3. Several contaminants had method detection limits above the ATSDR health-based comparison values (CV). Therefore, PADOH and ATSDR cannot determine whether exposures of public health significance are occurring above CVs but below method detection limits. PADEP also reported that because of issues with calibration and data collection including data logging problems, some monitoring stations did not have a complete data set. For example, methane and non-methane hydrocarbons at one location (Meddings Road) were inconclusive due to calibration issues.
4. Limitations in understanding public health implications of exposures to complex mixtures of low
concentrations air contaminants. Currently, methods are limited for assessing the health significance of exposures to complex mixtures of airborne toxic chemicals, including those chemicals detected in the PADEP long term air data set. However, for this assessment of the PADEP data set, non-cancerous hazard quotients were calculated by sampling location to address this limitation and cancer risks for each location were combined to determine a cumulative cancer risk. Both the non-cancer and cancer risk approaches address complex mixtures exposures to a limited extent.
Conclusions PADOH and ATSDR reached the following conclusions in this health consultation:
Conclusion 1: Based on the air sampling data collected from July 2012 to July 2013, exposure to the contaminant levels found in ambient air are not expected to harm healthy individuals. However, 24-hour or less exposures to intermittently high concentrations of hydrogen sulfide and ozone could irritate sensitive individuals, and intermittently high concentrations of particulate matter less than 2.5 microns in diameter (PM2.5) could irritate unusually sensitive individuals. Sensitive or unusually

20
sensitive individuals might experience harmful respiratory effects such as breathing discomfort or asthma exacerbation. While the focus of the PADEP air monitoring was chronic (long-term or over a year or more in duration) exposures, PADOH and ATSDR also evaluated the potential for acute (short-term) exposures when feasible with the data collected. PADOH and ATSDR where generally not able to consider health impacts from acute exposures (less than 24 hours) to hazardous air pollutants other than criteria pollutants and hydrogen sulfide, due to data limitations.
There were seven chemicals (acetaldehyde, benzene, carbon tetrachloride, chloroform, formaldehyde, hydrogen sulfide, and ozone) plus PM2.5 that exceeded health-based comparison levels in ambient air. However, except for ozone, hydrogen sulfide, and PM2.5, the detected concentrations for these chemicals are not expected to result in adverse health effects from short- or long-term exposures.
Healthy people are not expected to experience harmful effects from ozone, hydrogen sulfide, or PM2.5 exposures at the levels found in the PADEP long term air data set. However, exposure to some of the higher levels of ozone (8 hour average), hydrogen sulfide (24 hour average), and PM2.5 (24 hour average and annual average) levels detected are considered unhealthy for sensitive (ozone and hydrogen sulfide) or unusually sensitive (PM2.5) populations. Sensitive individuals would have an increased likelihood of experiencing harmful respiratory effects (e.g., asthma exacerbation, breathing difficulty) from the maximum 8 hour average ozone and maximum 24 hour average hydrogen sulfide levels detected, and unusually sensitive individuals (e.g., some individuals with heart, lung, cardiopulmonary disease) may experience harmful respiratory effects from short-term and long-term PM2.5 exposures. Hydrogen sulfide, ozone, and PM2.5 are all respiratory irritants, so combined exposures to these chemicals might be of additional concern for some sensitive people. These exposures are primarily of health concern for active children and adults and people with respiratory diseases, such as asthma and chronic respiratory disease. Estimated additional lifetime cancer risks from exposures to the carcinogenic chemicals (acetaldehyde, benzene, carbon tetrachloride, chloroform, and formaldehyde) detected were all very low. Average levels of the carcinogenic chemicals detected were generally similar to what is typically seen in ambient air in mixed urban, suburban, and rural areas across the U.S., but a few average levels (e.g., acetaldehyde, formaldehyde), exceeded levels typically seen in U.S rural areas. Maximum levels for some of the chemicals (e.g., benzene, carbon tetrachloride) exceeded levels typically seen in ambient air in mixed areas across the U.S.
Conclusion 2: An important limitation for this evaluation is that, based on both an analysis of (1) the site-specific meteorology and (2) the expected variability in operations and emissions rates, we do not know if the monitoring results represent worst case, typical, or non-typical emissions from the identified natural gas production and operations sources.
PADEP sampling was conducted in residential communities adjacent to the emissions sources of interest. However, the topography in the project area, in concert with the locations of natural gas operations versus residential monitoring locations, limited options for assessing the specific targeted sources emissions. While the PADEP objective was to sample at community-based locations, the community locations identified that were amenable to staging sampling equipment were generally located at some distance from the natural gas activity sources of interest. Using a standard approach for designing a long-term monitoring project, PADEP used the available meteorological data to place fixed monitoring stations in expected predominantly downwind locations. Meteorological data from the Pittsburgh Airport, the nearest source with a sufficient historical set of valid meteorological data, was used to develop historic
21
wind roses to determine dominant wind directions. This information was then used to identify project-specific monitoring locations.
Based on analyses of site-specific information collected during this effort, PADOH and ATSDR determined that the monitoring stations usually were not downwind of the sources targeted for monitoring during the days of discreet hazardous pollutant sampling (a one-in-six day sampling schedule for volatile organic compounds and aldehydes). For example, during valid VOC sampling days, the monitoring sites were downwind of the Houston Gas Plant an estimated 6-15% of the hours that samples were being collected. The two monitoring sites for aldehydes/carbonyls were downwind from the identified natural gas activity sources an estimated 10-12% of the sampling time. In addition to some of the monitoring locations not being downwind from the sources of interest for a majority of the sampling time, source emissions appear highly variable (e.g., unscheduled facility incidents, blowdowns or flaring events) and these events may not have been captured during scheduled monitoring days. A one-in-six day monitoring schedule is useful for assessing chronic exposures, but can capture air quality data up to a maximum of 16.7% of time.
It is also important to note that the PADEP conducted continuous criteria pollutant monitoring throughout the entire sampling time frame at three “background” area monitoring locations and at one of the project-specific monitoring locations (Meddings Road). The Meddings Road location was downwind from an identified natural gas operations emissions source approximately 11% over the monitored time period. These continuously monitored data were also evaluated in this document. Exposure information for these pollutants were captured 100% of the time.
Conclusion 3: PADOH and ATSDR cannot fully evaluate the public implications of chemicals associated with natural gas production and operations that were not sampled for during this project. PADOH and ATSDR also cannot fully evaluate the public health implications of chemicals that were sampled for by PADEP using analytical method detection limits above ATSDR’s health based comparison values, or collection timeframes that did not permit analysis of short-term peak exposures. Also, due to established concerns about the reliability of acrolein data, PADOH and ATSDR did not conduct further assessment of the acrolein data collected.
A number of chemicals are released to the air during natural gas production and operations; some of these chemicals are very difficult to characterize in ambient air. PADEP sampled for criteria contaminants (ozone, nitrogen dioxide, carbon dioxide, particulate matter less than 2.5 microns), hydrogen sulfide, methane, and non-methane hydrocarbons and select toxic chemicals during the Long-Term Project using standard ambient air sampling and monitoring methods that can be analyzed at the state laboratory. However, some of the chemicals expected to be released to the air during natural gas production and operations cannot be assessed with the analytical methods currently available to the PADEP state laboratory program (e.g., glycols, glutaraldehyde). Furthermore, five chemicals (1,2-dibromoethane, 1,2-dichloroethane, hexachloro-1,3-butadiene, 1,3-butadiene, and 1,1,2-trichloroethane) were assessed at the laboratory, but had detection limits above the most conservative health-based comparison values. Most of the sampling information from the Long-Term Project was limited to 24-hour collection timeframes, resulting in average daily concentrations. This approach works well for many chemicals. However, some chemicals emitted by this industry have the potential to cause health effects and/or symptoms from exposure durations that are less than 24 hours.

22
PADOH and ATSDR decided not to draw health conclusions based on the acrolein data collected due to sampling and analytical issues with this chemical, and thus did not include information for this chemical in this report.
Recommendations Individuals sensitive to airborne contaminants, including ozone, hydrogen sulfide, and PM2.5, should monitor air quality action days for their region (i.e., Florence, Charleroi and Washington COPAMS data) as well as their own local air quality conditions, and consider reducing activities that include prolonged or heavy exertion on days with poor air quality. The Air Quality Forecast and Alert system can be found at http://airnow.gov/. Overall, PADOH and ATSDR recommend that PADEP continue air characterization efforts in areas of the Commonwealth with natural gas activities. Given the limitations in monitor placement and the concern about representativeness of these data, PADOH and ATSDR believe additional community air monitoring activities, particularly with monitoring locations that are more regularly downwind of the target emissions sources, would further advance our understanding of community public health impacts from exposures to natural gas industry emissions. As feasible, analytical methods should be used with detection limits below the most conservative health-based comparison values. PADOH and ATSDR recommend PADEP consider using local meteorological data, including those data collected during the PADEP project (and analyzed by PADOH and ATSDR), to place or relocate (e.g., Meddings Road station) facility-specific monitoring stations in predominant downwind locations. Fenceline monitoring may also provide an indication of which analytes require offsite monitoring to assess human exposures to emissions. Gathering hourly methane and non-methane hydrocarbon measurements at priority locations is recommended, since these are the primary and chief components of most of the emissions from these natural gas industry sources. Having such measurements could help (1) in modeling offsite exposures to emitted chemicals; (2) in identifying potential trends in emissions; and (3) to more accurately identify potential emission source locations (e.g., through polar plotting techniques). Further, PADOH and ATSDR strongly support PADEP’s proposed plan to expand ambient air monitoring network activities in Marcellus Shale regions, including establishing a new multi-pollutant monitoring location in Fayette County, expanding the PM2.5 monitoring network to include monitors in Bradford, Clarion, Fayette, Greene, Indiana, Jefferson, Lycoming, McKean, Susquehanna and Wyoming Counties, and installing carbonyl samplers in Wyoming and Springville Counties. PADEP should also continue to provide appropriate regulatory oversight to ensure implementation of best practices for emissions control at natural gas facilities and continue response, assessment and follow up actions to address community-based air quality complaints at these locations.

23
Public Health Action Plan 1. PADOH and ATSDR will make this health consultation available on their agency websites and will
share it with interested community members, agencies, and others.
2. PADOH and ATSDR will remain available to discuss any public health questions or concerns related to the contents of this health consultation with community members and local, state, and federal authorities.
3. If requested, PADOH and ATSDR will evaluate the need for additional community-based air
sampling at this location, and consider reviewing any additional environmental sampling data or relevant public health information collected at the site.

24
Report Preparation PADOH Sasidevi Arunachalam, MSPH Epidemiology Program Specialist Environmental Health Epidemiology Division Farhad Ahmed, MBBS, MPH Principal Investigator Health Assessment Program Environmental Health Epidemiology Division ATSDR Lora Siegmann Werner, MPH Regional Director Region 3 Christine Lloyd, MPH/M.S. Regional Representative Region 3 Robert Helverson, M.S. Regional Representative Region 3 Eva McLanahan, Ph.D. Technical Project Officer Division of Community Health Investigations Robert Robinson, MBA Technical Project Officer Division of Community Health Investigations James Durant, MSPH, CIH Science Support Branch Division of Community Health Investigations David Sutton, PhD, PE Science Support Branch Division of Community Health Investigations

25
References [ATSDR] Agency for Toxic Substances and Disease Registry. 1997. Toxicological Profile for Chloroform. Department of Health and Human Services. Atlanta, GA. [Updated 1997; accessed 2016 February 26]. Available from: https://www.atsdr.cdc.gov/ToxProfiles/tp6.pdf
[ATSDR] Agency for Toxic Substances and Disease Registry. 1999. Formaldehyde Toxicological Profile. [Updated 1999; accessed 2016 February 26]. Available from: http://www.atsdr.cdc.gov/toxprofiles/tp111.pdf
[ATSDR] Agency for Toxic Substances and Disease Registry. 2005a. Public Health Assessment Guidance Manual. Atlanta, GA: Department of Health and Human Services; January 2005. Available from: http://www.atsdr.cdc.gov/HAC/PHAManual/toc.html
[ATSDR] Agency for Toxic Substances and Disease Registry. 2005b. Toxicological Profile for Carbon Tetrachloride. Department of Health and Human Services. Atlanta, GA. [Updated 2005; accessed 2016 February 26]. Available from: https://www.atsdr.cdc.gov/ToxProfiles/tp30.pdf
[ATSDR] Agency for Toxic Substances and Disease Registry. 2007. Toxicological Profile for Benzene. Department of Health and Human Services. Atlanta, GA. [Updated 2007; accessed 2016 February 26] Available from: https://www.atsdr.cdc.gov/ToxProfiles/tp3.pdf
[ATSDR] Agency for Toxic Substances and Disease Registry. 2010. Addendum to the Toxicological Profile for Formaldehyde. Department of Health and Human Services. Atlanta, GA. [Updated 2010; accessed 2018 January 24] Available at: https://www.atsdr.cdc.gov/toxprofiles/formaldehyde_addendum.pdf
[ATSDR] Agency for Toxic Substances and Disease Registry. 2014. Hydrogen Sulfide ToxFAQs. [Updated 2014 October; accessed 2016 February]. Available from: http://www.atsdr.cdc.gov/toxfaqs/tfacts114.pdf
[ATSDR] Agency for Toxic Substances and Disease Registry. 2015. Formaldehyde ToxFAQs. [Updated 2015 May; accessed 2016 February 27]. Available from: http://www.atsdr.cdc.gov/toxfaqs/tfacts111.pdf
[ATSDR] Agency for Toxic Substances and Disease Registry. 2016a. Environmental Odors. Updated 2016 February; accessed 2017 January 18]. Available from: https://www.atsdr.cdc.gov/odors/faqs.html
[ATSDR] Agency for Toxic Substances and Disease Registry. 2016b. Toxicological Profile for Hydrogen Sulfide and Carbonyl Sulfide. Department of Health and Human Services. Atlanta, GA. [accessed 2017 August 17] Available from: https://www.atsdr.cdc.gov/toxprofiles/tp114.pdf
Dockery DW, Pope AC, Xu X, Spengler JD, Ware JH, Fay ME, Ferris Jr. BG, and Speizer FE. 1993. An Association between Air Pollution and Mortality in Six U.S. Cities. N Engl J Med, 329:1753–59.
[ERG] Eastern Research Group. 2011. City of Fort Worth Natural Gas Air Quality Study: Final Report. [Updated 2011 July 13; accessed 2016 February 29]. Available from: http://fortworthtexas.gov/uploadedFiles/Gas_Wells/AirQualityStudy_final.pdf
Gilman, J.B., Lerner, B.M., Kuster, W.C., de Gouw, J.A. 2013. Source Signature of Volatile Organic Compounds from Oil and Natural Gas Operations in Northeastern Colorado. Environmental Science and Technology: 47, 1297-1305. Available from: http://pubs.acs.org/doi/pdf/10.1021/es304119a
26
Governor’s Marcellus Shale Advisory Commission. 2011. Final Report. Available from: http://files.dep.state.pa.us/PublicParticipation/MarcellusShaleAdvisoryCommission/MarcellusShaleAdvisoryPortalFiles/MSAC_Final_Report.pdf
[HEI] Health Effects Institute. 2000. A Reanalysis of the Harvard Six-Cities Study and the American Cancer Society Study of Particulate Air Pollution and Mortality. Cambridge, MA: A Special Report of the Institute’s Particle Epidemiology Reanalysis Project.
Hornung, R.W. and Reed, L.D. 1990. Estimation of Average Concentration in the Presence of Non-deductible Values. Applied Occupational and Environmental Hygiene. 5:1, 46-51.
[IARC] International Agency for Research on Cancer. 2004. IARC Classifies Formaldehyde as Carcinogenic to Humans. Available from: https://www.iarc.fr/en/media-centre/pr/2004/pr153.html
McCarthy, MC, Hafner HR, Montzka, SA. 2006. Background Concentration of 18 Air Toxics for North America. Journal of the Air & Waste Management Association. 56:1, 3-11.
Macey, GP, Breech, R, Chernaik, M, Cox C, Larson D, Thomas D, Carpenter DO. 2014. Air Concentrations of Volatile Compounds Near Oil and Gas Production: A Community-Based Exploratory Study. Environmental Health. 13:82.
[MDHHS] Maine Department of Health & Human Services. 2006. Ambient Air Guidelines for Hydrogen Sulfide. Available from: https://www1.maine.gov/dep/waste/publications/documents/ambientairguidelines.pdf
[NAP] National Academies Press. 1991. Rethinking the Ozone Problem in Urban and Regional Air Pollution. Available from: https://www.nap.edu/catalog/1889/rethinking-the-ozone-problem-in-urban-and-regional-air-pollution
[NLM] U.S National Library of Medicine. 1995. HSDB - Acetaldehyde. Available at: https://toxnet.nlm.nih.gov/cgi-bin/sis/search/a?dbs+hsdb:@term+@DOCNO+230
[NTP] National Toxicology Program. 2011. Report on Carcinogens, Twelfth Edition. Research Triangle Park, NC: U.S. Department of Health and Human Services, Public Health Service, National Toxicology Program.
[PADEP] Pennsylvania Department of Environmental Protection. 2012a. Monitoring Toxic Contaminants – Marcellus Monitoring. [Accessed 2015 December 14]. Available from: http://www.dep.pa.gov/Business/Air/BAQ/MonitoringTopics/ToxicContaminants/Pages/default.aspx#.Vm7ApaNOnvo
[PADEP] Pennsylvania Department of Environmental Protection. 2012b. Recommendations and Final Area Designations for Attainment Status. http://www.dep.pa.gov/Business/Air/BAQ/Regulations/Pages/Recommendations-and-Final-Area-Designations.aspx
Pope CA III, Burnett RT, Thun MJ, Calle EE, Krewski D, Ito K, and Thurston GD. 2002. Lung Cancer, Cardiopulmonary Mortality, and Long-Term Exposure to Fine Particulate Air Pollution. JAMA 287(9):1132–41.

27
Rothman N, Li G, Dosemeci M, Bechtold W, Marti G, Wang Y, and Hayes R. 1996. Hematotoxicity among Chinese workers heavily exposed to benzene. Am J Ind Med. 29: 236-246.
[RIOPA] Relationships of Indoor Outdoor and Personal Air. 2005. Part I. Collection methods and descriptive analyses. Research Report (Health Effects Institute). Weisel CP, Zhang J, Turpin BJ, Morandi MT, Colome S, Stock TH, et al. Nov; 130 Pt 1:1-107; 109-27.
[TCEQ] Texas Commission on Environmental Quality. 2010. Uses of Effects Screening Levels (ESLs) and Air Monitoring Comparison Values (AMCVs). [Updated 2010 May; accessed 2016 February 29]. Available from: https://www.tceq.texas.gov/assets/public/implementation/tox/monitoring/amcv/document.doc
[TCEQ] Texas Commission on Environmental Quality. 2015. About Effects Screening Levels (ESLs). [Updated 2016 February 22; accessed 2016 February 29]. Available from: https://www.tceq.texas.gov/toxicology/esl
Thomassen DG, WC Griffith, J Harkema, DN Stephens, JD Sun. 2005. Final Report: Does Ozone Cause PreCancerous Changes in Cells? EPA Grant Number R828112C050. [Accessed 2017 January 4]. Available from: https://cfpub.epa.gov/ncer_abstracts/index.cfm/fuseaction/display.abstractDetail/abstract/2314/report/F
Tustin, AW, Hirsch AG, Rasmussen SG, Casey JA, Bandeen-Roche K, and Schwartz BS. 2017. Associations between unconventional natural gas development and nasal and sinus, migraine headache, and fatigue symptoms in Pennsylvania. Environ Health Perspect. 125(2):189-197.
[U.S. EPA] U.S. Environmental Protection Agency. 1988. Integrated Risk Information System (IRIS): Chemical Assessment Summary for Acetaldehyde. [Updated 1988 June 30; accessed 2016]. Available from: https://cfpub.epa.gov/ncea/iris/iris_documents/documents/subst/0290_summary.pdf
[U.S. EPA.] U.S. Environmental Protection Agency. 1992. Supplemental Guidance to RAGS: Calculating the Concentration Term. Washington, DC. PB92963373. Available from: https://semspub.epa.gov/work/05/168975.pdf
[U.S. EPA] U.S. Environmental Protection Agency 1994. Office of Pollution Prevention and Toxics Chemical Fact Sheet. Chemicals in the Environment: Acetaldehyde (CAS No. 75-07-0). August. Available from: https://nepis.epa.gov/
[U.S. EPA] U.S. Environmental Protection Agency. 1995. Project Summary: Glycol Dehydrator BTEX and VOC Testing Results at Two Units in Texas and Louisiana. EPA/600/SR-95/046. [Updated 1995 May; accessed 2016 February 29]. Available from: http://infohouse.p2ric.org/ref/07/06261.pdf
[U.S. EPA] U.S. Environmental Protection Agency. 1999a. Compendium of Methods for the Determination of Toxic Organic Compounds in Ambient Air: Second Edition. Compendium Method TO-15. EPA/625/R-96/010b. Washington, DC. [Updated 1999 January; accessed 2016 February 29]. Available from: http://www3.epa.gov/ttnamti1/files/ambient/airtox/to-15r.pdf
[U.S. EPA] U.S. Environmental Protection Agency. 1999b. Compendium of Methods for the Determination of Toxic Organic Compounds in Ambient Air: Second Edition. EPA/625/R-96/010b. Washington, DC. [Updated 1999 January; accessed 2016 February 29]. Available from: http://www3.epa.gov/ttnamti1/files/ambient/airtox/to-11ar.pdf

28
[U.S. EPA] U.S. Environmental Protection Agency. 2001. Toxicological Review of Chloroform. EPA/635/R-01/001.Washington, DC. [Updated 2001 October; accessed 2016 February 15]. Available from: http://cfpub.epa.gov/ncea/iris/iris_documents/documents/toxreviews/0025tr.pdf
[U.S. EPA] U.S. Environmental Protection Agency. 2003a. Integrated Risk Information System (IRIS) Chemical Assessment Summary for Benzene Carcinogenicity Assessment. [Updated 2003 January; accessed 2016 August 12]. Available from: https://cfpub.epa.gov/ncea/iris/iris_documents/documents/subst/0276_summary.pdf
[U.S. EPA] U.S. Environmental Protection Agency. 2003b. Toxicological Review of Hydrogen Sulfide. EPA/635/R-03/005. Washington, DC. [Updated 2003 June; accessed 2016 February 29]. Available from: https://cfpub.epa.gov/ncea/iris/iris_documents/documents/toxreviews/0061tr.pdf
[U.S. EPA] U.S. Environmental Protection Agency. 2001. Toxicological Review of Chloroform. EPA/635/R-01/001.Washington, DC. [Updated 2001 October; accessed 2016 February 15]. Available from: http://cfpub.epa.gov/ncea/iris/iris_documents/documents/toxreviews/0025tr.pdf
[U.S. EPA]. United States Environmental Protection Agency. 2007. User’s Guide-ProUCL® Version 4.00.02. Washington, DC. EPA/600/R-07/038. Available from: https://www.epa.gov/sites/production/files/2015-03/documents/proucl_v4.00.02_user.pdf
[U.S. EPA]. United States Environmental Protection Agency. 2009. Integrated Science Assessment for Particulate Matter. Washington, DC. EPA/600/R-08/139F. December, 2009. Available from: http://cfpub.epa.gov/ncea/cfm/recordisplay.cfm?deid=216546
[U.S. EPA] U.S. Environmental Protection Agency. 2010. Toxicological Review of Carbon Tetrachloride. EPA/635/R-08/005F. Washington, DC. [Updated 2010 March; accessed 2016 February 26]. Available from: http://cfpub.epa.gov/ncea/iris/iris_documents/documents/toxreviews/0020tr.pdf
[U.S. EPA] U.S. Environmental Protection Agency. 2012. 2010 National Monitoring Programs Annual Report (UATMP and NATTS), Volume 1: Main Content. Prepared for the U.S. Environmental Protection Agency by Eastern Research Group, Inc. November.
[U.S. EPA] U.S. Environmental Protection Agency. 2014a. Report on the Environment (ROE). [Accessed 2016 December 21]. Available from: https://cfpub.epa.gov/roe/index.cfm
[U.S. EPA] U.S. Environmental Protection Agency. 2014b. Overview of EPA’s Proposal to Update the Air Quality Standards for Ground-Level Ozone. [Accessed 2017 January 4]. Available from: https://www.epa.gov/sites/production/files/2015-10/documents/overview_of_2015_rule.pdf
[U.S EPA] U.S. Environmental Protection Agency. 2015. EPA Fine Particulate Matter (PM2.5) Basics. Available from: https://www.epa.gov/pm-pollution/particulate-matter-pm-basics#effects.
[U.S. EPA] U.S. Environmental Protection Agency. 2016a. Risk-based Screening Levels. [Updated 2016 May; accessed 2016 February 29]. Available from: http://www2.epa.gov/risk/risk-based-screening-table-generic-tables
[U.S. EPA] U.S. Environmental Protection Agency. 2016b. Air Toxics Health Effects Glossary. [Updated 2016 February 23; accessed 2016 February 29]. Available from: https://www.epa.gov/haps/health-effects-notebook-glossary
29
[U.S. EPA] U.S. Environmental Protection Agency. 2016c. National Ambient Air Quality Standards. [Updated 2016 February 23; accessed 2016 February 29]. Available from: https://www.epa.gov/criteria-air-pollutants/naaqs-table
[U.S. EPA] U.S. Environmental Protection Agency. 2017. AirNow AQI Calculator. Accessed on April 13, 2017. Available from: https://airnow.gov/index.cfm?action=airnow.calculator
[U.S. DHHS] U.S. Department of Health and Human Services. 2014. Report on Carcinogens, Thirteenth edition. Available from: http://www.niehs.nih.gov/health/materials/report_on_carcinogens_13th_edition_the_508.pdf
[WHO] World Health Organization. 2000. Air Quality Guidelines for Europe. 2nd ed. WHO Regional Publications, European Series, No. 91. Copenhagen, Denmark. Available from: http://www.euro.who.int/__data/assets/pdf_file/0005/74732/E71922.pdf
[WHO] World Health Organization. 2004. Chloroform: Concise International Chemical Assessment Document 58. Geneva, Switzerland. [Updated 2004; accessed 2016 February 29]. Available from: http://www.who.int/ipcs/publications/cicad/en/cicad58.pdf
[WHO] World Health Organization. 2006. WHO Air Quality Guidelines for Particulate Matter, Ozone, Nitrogen Dioxide, and Sulfur Dioxide. Global Update: 2005. World Health Organization. 2006. [Accessed 2017 January 4]. Available from: http://apps.who.int/iris/bitstream/handle/10665/69477/WHO_SDE_PHE_OEH_06.02_eng.pdf
[WHO] World Health Organization. 2018. Global Health Observatory (GHO) data. Ambient air pollution. Available from: http://www.who.int/gho/phe/outdoor_air_pollution/exposure_text/en/
30
Appendix A Air Monitoring Locations and Site Demographics Information

31
Air Monitoring Location Selection and Descriptions
PADEP used the best-available meteorological data and standard approaches for determining locations for community-based monitors. The Pittsburgh Airport historical wind data set was used to determine the predominantly downwind directions for placing monitors with respect to the targeted emissions sources. See Appendix A, Figure A1 and related text in Appendix A for additional information about the monitoring locations selected for the PADEP Long-Term Project. Race, age, and gender demographics are also provided in Appendix A, Figure A2-A8.
Four of these locations were selected to be in residential communities close to specific natural gas emissions operations; these four locations are clustered in an area spanning an approximate 5-mile radius (see Table 1). The remaining three locations are Commonwealth of Pennsylvania Air Monitoring System (COPAMS) locations that were selected based on National Ambient Air Quality Standards (NAAQS) siting criteria, which includes the selection of locations to determine regional air quality where no dominant source of emissions is nearby (see Table 1). The background locations represent areas in Washington County that are assumed, due to distance from industry infrastructure, to be less impacted by natural gas operations than the targeted monitoring locations, and were selected for comparison purposes. When including these three background locations, the overall area evaluated spans an approximate 20-mile radius.
Two primary and two secondary monitoring locations were selected by the PADEP for their Long-Term Project. Three nearby COPAMS locations were also chosen as background sites for comparison to the data collected at primary and secondary sites. Each location is described in further detail below.
Primary and Secondary Site Locations
Meddings Road and Welsh Road sites were selected as the primary locations for this long term project, and the Jaspen Way and Henderson Road sites were selected as secondary sites for the Long-Term Project.
Meddings Road and Welsh Road (Primary Sites)
The Meddings Road site is located in a rural area approximately 2,000 feet in a northeast direction from the Mark West Liberty Midstream Resources, LLC Houston gas facility (Houston Gas Plant) and was used to monitor NAAQS, HAPs, H2S, and methane and non-methane hydrocarbons. (Note, at the conclusion of the Long-Term Project, methane and non-methane hydrocarbons at Meddings Road were determined to be inconclusive due to calibration issues with the equipment in the field.)
Several residential properties are within 1,000 feet of the monitoring stations, with the closest home at the Meddings Road location approximately 300 feet to the southeast. The Meddings Road monitoring location was in closest proximity to residences in the vicinity of the Houston Gas Plant that PADEP could identify for the Long-Term Project. Data from the 2010 U.S. Census data (Appendix A, Figure A2) show there were 171 people living within one mile of the Meddings Road monitoring station. PADEP expected this location to be largely in a downwind direction from the Houston facility.
The Welsh Road site is located over 1 mile in a southwest direction from the Houston Gas Plant and only the TO-15 method for HAPs was used at this site. Data collected from the 2010 U.S. Census data

32
(Appendix A, Figure A3) show there were 269 people living within one mile of this monitoring station. PADEP expected this location to be largely in an upwind direction from the Houston facility.
Jaspen Way and Henderson Road (Secondary Sites)
PADEP selected the Jaspen Way site to collect ambient concentrations of toxic organic chemicals downwind of the Brigich natural gas compressor station. The Jaspen Way monitor was located within a half mile to the east and slightly north of the Brigich Compressor station. This compressor station, owned by MarkWest, is located approximately 2.2 miles NNW of the Houston fractionation plant and moves natural gas and associated natural gas liquids from nearby well pads to the plant for processing. The Jaspen Way site collected samples for HAPs that might be emitted from the Brigich compressor station using method TO-15. Data from the 2010 U.S. Census data (Appendix A, Figure A4) show there were 309 people living within one mile of this monitoring station.
PADEP selected the Henderson Road site to collect data on ambient concentrations of hazardous air pollutants in an area expected to be in the general downwind direction from two closely co-located permanent shale gas facilities (the Stewart Gas plant, also known as the Stewart Compressor Station, owned by Laurel Mountain Midstream; and the Nancy Stewart Booster/Compressor station owned by MarkWest). However, during the planning and deployment phase of the Long-Term Project, the Stewart Gas plant facility ceased operations. Therefore, the closest shale gas activity source to this monitoring location was only the Nancy Stewart Compressor Station, approximately 1 mile away to the west from the monitor. The Henderson monitor location is situated 6.2 miles west of the Houston fractionation plant. At the start of PADEP’s Long-Term Project, there were approximately 10 producing Marcellus Shale gas wells and associated on site sources within an overall 0.5 mile radius of the Nancy Stewart Compressor station and within an overall 1-2 mile radius of the Henderson monitor. In addition, PADEP noted that the air quality at the Henderson location included influences of other sources of pollution not directly linked to shale gas activities (e.g. on-road traffic and school bus idling at nearby bus garage). The Henderson monitor collected data on HAPs and H2S. As of the 2010 U.S. Census data (Appendix A, Figure A5) there were 298 people living within one mile of the Henderson Road monitoring station.
Background Sites Descriptions
The PADEP has an existing statewide air monitoring network called the Commonwealth of Pennsylvania Air Monitoring System (COPAMS). The state uses this system to determine compliance with NAAQS in the Commonwealth. For the Long-Term Project, three PADEP COPAMS stations were used as “background” locations to compare to the information collected at the four primary and secondary locations:
Florence COPAMS: The Florence COPAMS is situated in a rural portion of Washington County, upwind of natural gas activities (Appendix A, Figure A6). This site was used as the primary background comparison location.
Charleroi COPAMS: The Charleroi COPAMS station is in the eastern part of Washington County, along the Monongahela River (Appendix A, Figure A7). This site is situated in a more urban landscape on the west side of the river.

33
Washington COPAMS: The Washington COPAMS site is the closest location to the primary Meddings Road monitoring location, also located in an urban area (the city of Washington) (Appendix A, Figure A8).
Sample Analyses
PADEP conducted monitoring for NAAQS criteria contaminants, hydrogen sulfide, and hazardous air pollutants, or HAPs, by Toxic Organic Compounds (TO) TO-11A and TO-15 methods. EPA Method TO-15, collected via summa canisters, includes a target list of VOCs, specifically the HAPs listed under Title III of the Clean Air Act Amendments of 1990 [U.S. EPA 1999a]. The Method TO-11, collected via adsorbent cartridges, is used to collect aldehydes and carbonyls in ambient air for laboratory extraction and analyses [EPA 1999b].
Monitoring for criteria pollutants, including ozone, nitrogen oxides, and particulate matter (PM) less than 2.5 micrometers (PM2.5) occurred continuously and was then aggregated into five minute and hourly averages. Hydrogen sulfide was measured using two types of instruments. At the Meddings Road station, continuous H2S monitoring was conducted using an Arizona Instruments Jerome 631x hydrogen sulfide analyzer with a detection range of 3 parts per billion (ppb) to 50,000 ppb (4.2 µg/m3 to 69,700 µg/m3). At the Henderson Road site, H2S was collecting at the fenceline using a Teledyne API hydrogen sulfide semi-continuous monitor with a detection limit of 0.4 ppb (0.56 µg/m3). Air samples for HAPs were collected over 24-hours on every 6th day, consistent with NAAQS network schedule. Meteorological data, including wind direction, wind speed, and temperature were also collected.
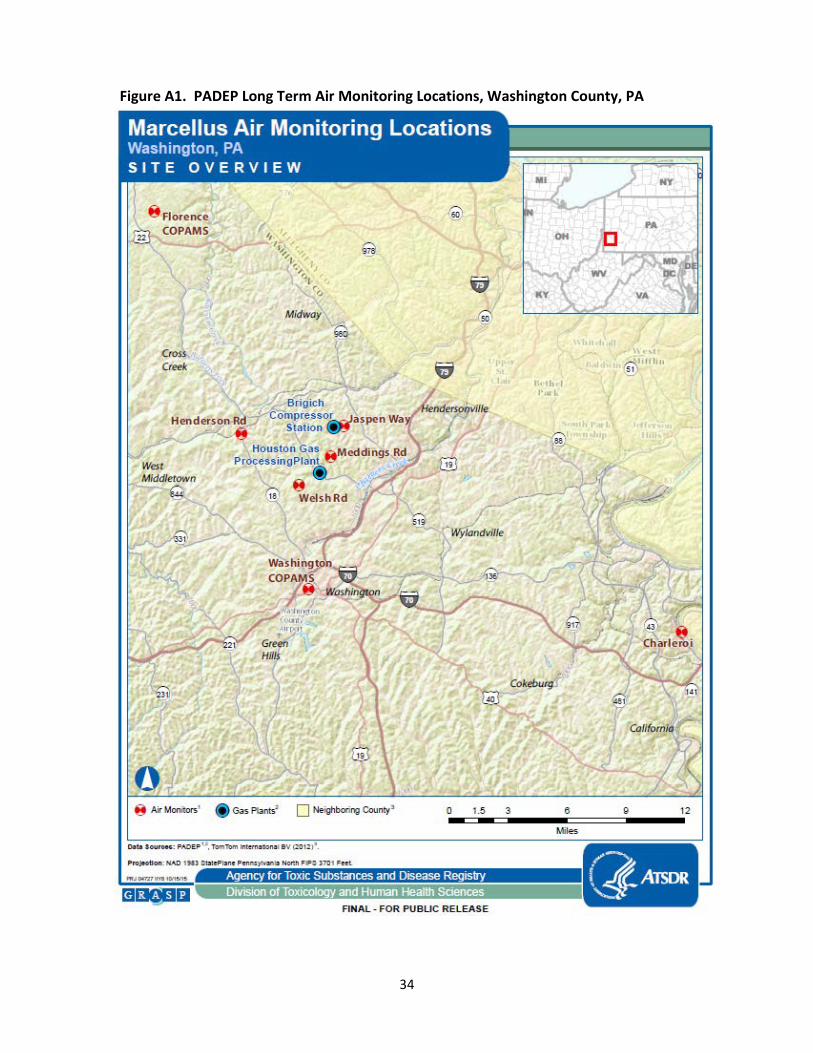
34
Figure A1. PADEP Long Term Air Monitoring Locations, Washington County, PA
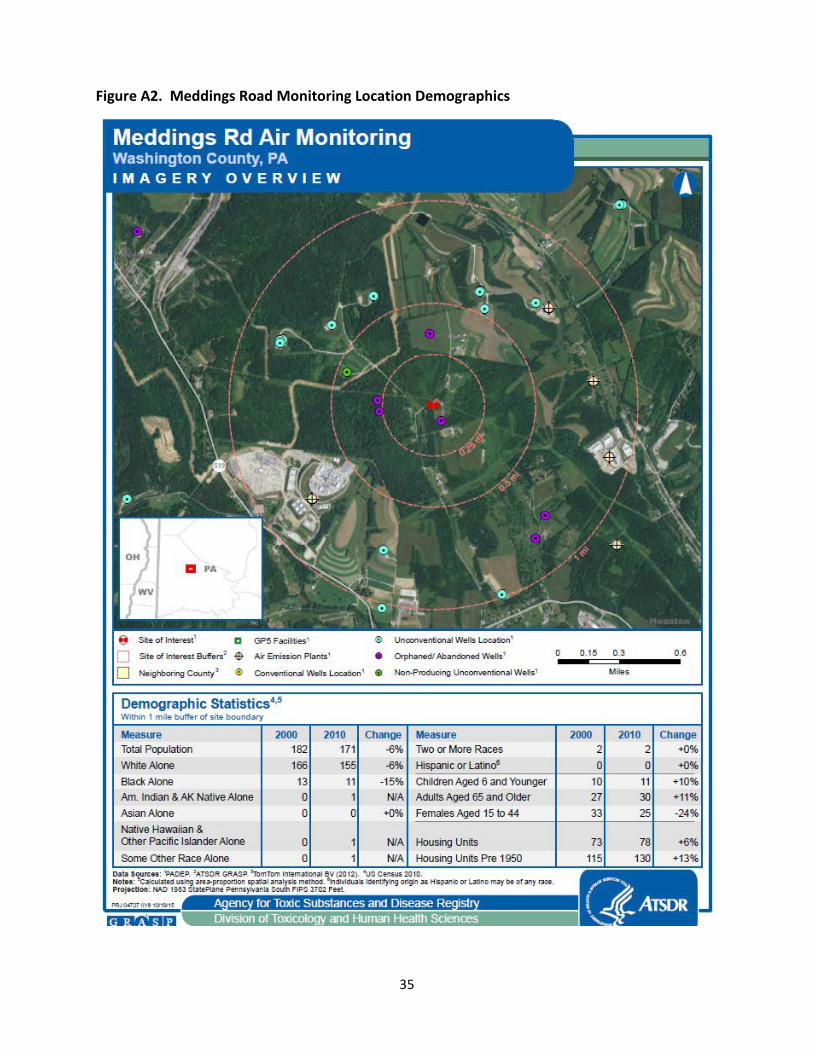
35
Figure A2. Meddings Road Monitoring Location Demographics

36
Figure A3. Welsh Road Monitoring Location Demographics

37
Figure A4. Jaspen Way Monitoring Location Demographics

38
Figure A5. Henderson Road Monitoring Location Demographics

39
Figure A6. Florence COPAMS Monitoring Location Demographics

40
Figure A7. Charleroi COPAMS Monitoring Location Demographics

41
Figure A8. Washington COPAMS Monitoring Location Demographics

42
Appendix B Wind Rose Plot and Review of Meteorology and Downwind Sampling

43
Meteorological weather patterns and topography can affect how chemical emissions move from their source through the air. PADOH and ATSDR used site-specific meteorological information collected during the PADEP Long-Term Project to help understand what percentage of the overall sampling time the air monitors were downwind of the identified natural gas activity emissions sources and therefore capable of measuring contaminant emissions from those sources.
For volatile organic compound assessment by method TO-15, monitors collected ambient air samples between 6 and 40% of the total time that TO-15 sampling occurred at each of the monitoring stations (see Table B1 for more information). For carbonyls/aldehyde by Method TO-11A, monitors collected ambient air samples between 6 and 18% of the total time that TO-11A sampling occurred at the location (see Table B2 for more information).
Figure B1. Primary and Secondary Station Wind Roses
Figure B1 Explanation: Wind rose plots are commonly used to describe meteorological conditions using Open Air’s wind rose function. Wind rose plots (Figure B1) are organized on a polar coordinate system to illustrate both wind speed and the proportion of time that the wind is from a certain direction (i.e., north, east, south, west). The compass directions are divided into wedge-shaped bins, or paddles, in 30 degree increments, with the length of the paddle indicating the proportion of time the wind is blowing from that particular direction. Within each paddle (wind direction), the proportion of wind speed is indicated by different colors.

44
Additional Information about Meteorology during Ambient Air Monitoring
Predominant wind directions varied by monitoring station location (see Figure B1 above).
At the Henderson Road site, similar to the Jaspen Way site, the wind direction appeared predominately from the west and southwest. The Henderson road monitor was located over 0.5 mile away to the west of the Nancy Stewart Compressor Station, therefore the majority of the time this monitor would not be expected to be in the direction of emissions from the Nancy Stewart Compressor station.
At the Jaspen Way site, the wind direction appeared predominately from the west and southwest. The Jaspen Way monitor was located within a half mile to the east and slightly north of the Brigich Compressor station, therefore the majority of the time this monitor would be expected to be in the direction of emissions from the Brigich Compressor station.
At the Meddings Road primary site, the wind direction appeared predominantly from the south and southeast. The Meddings Road monitor was located to the northeast of the Houston plant, therefore the majority of the time this monitor would not be expected to be in the direction of emissions from the Houston plant. Air movement at the Meddings site was influenced by differences in terrain, with elevational differences of 150 to 200 feet within a half mile radius of the site in all directions. PADEP’s data suggest extensive channeling of winds through valley areas when winds were from either the northwest or the southeast at this location.
At the Welsh Road site, winds were mainly from both the northeast and southwest. The Welsh Road site was located over 1 mile in a southwest direction from the Houston plant, therefore for some portions of the monitoring period this monitor would be expected to be in the direction of emissions from the Houston plant.
A seasonal average wind speed difference was detected at each site between the summer and winter months, with summer months averaging 2-3 mph less than in the winter. Wind speeds were lower on average at the Henderson Road and Welsh Road sites due to the sensors being placed lower to the ground. Average wind speeds at Jaspen Way were higher due to the fact the prevailing wind was from the west, and elevations just to the west of the site are some 100 feet less. At the Henderson Road site, west to northwest winds tended to funnel between two areas of higher terrain. Slightly higher terrain both to the west and east of the Welsh Road site tended to result in more winds either from the south-southwest or the north-northeast.
ATSDR conducted analyses of how frequently monitors were downwind of the targeted sources when valid samples were collected. For TO-15 VOC compounds, the percent of hours when monitoring station was within ±18 degrees of downwind direction are shown in Table B1.
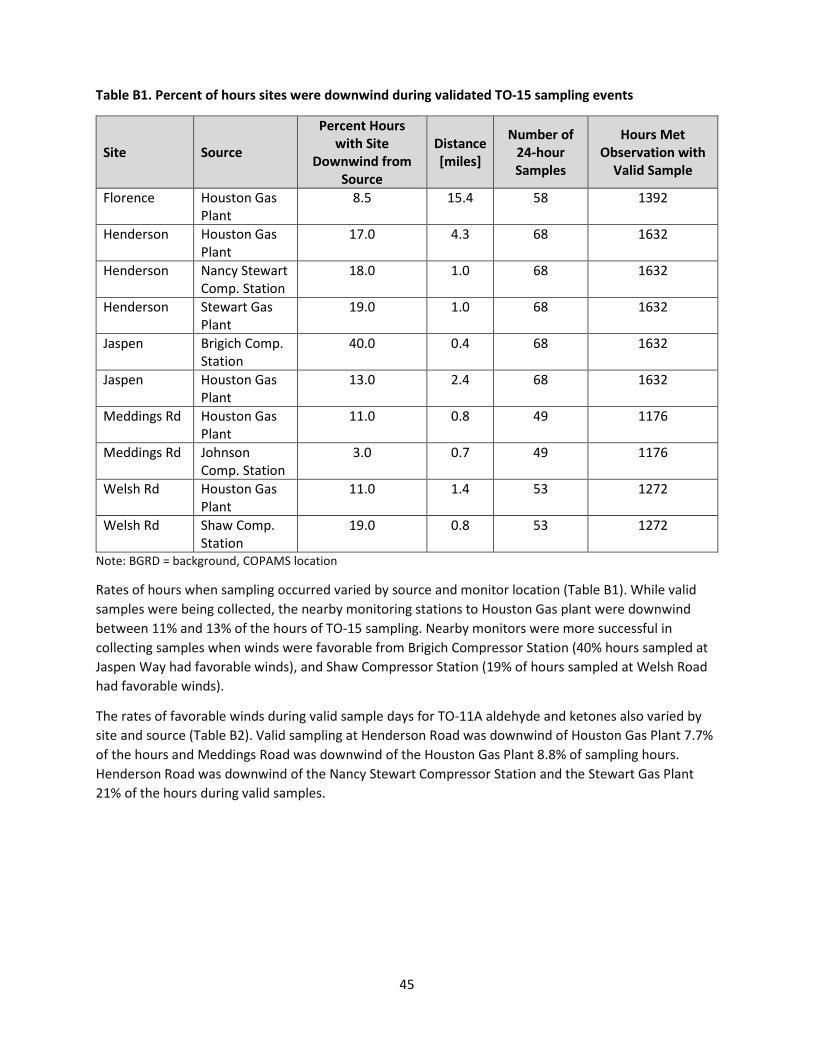
45
Table B1. Percent of hours sites were downwind during validated TO-15 sampling events
Site Source
Percent Hours with Site
Downwind from Source
Distance [miles]
Number of 24-hour Samples
Hours Met Observation with
Valid Sample
Florence Houston Gas 8.5 15.4 58 1392 Plant
Henderson Houston Gas 17.0 4.3 68 1632 Plant
Henderson Nancy Stewart Comp. Station
18.0 1.0 68 1632
Henderson Stewart Gas 19.0 1.0 68 1632 Plant
Jaspen Brigich Comp. Station
40.0 0.4 68 1632
Jaspen Houston Gas Plant
13.0 2.4 68 1632
Meddings Rd Houston Gas Plant
11.0 0.8 49 1176
Meddings Rd Johnson Comp. Station
3.0 0.7 49 1176
Welsh Rd Houston Gas 11.0 1.4 53 1272 Plant
Welsh Rd Shaw Comp. Station
19.0 0.8 53 1272
Note: BGRD = background, COPAMS location
Rates of hours when sampling occurred varied by source and monitor location (Table B1). While valid samples were being collected, the nearby monitoring stations to Houston Gas plant were downwind between 11% and 13% of the hours of TO-15 sampling. Nearby monitors were more successful in collecting samples when winds were favorable from Brigich Compressor Station (40% hours sampled at Jaspen Way had favorable winds), and Shaw Compressor Station (19% of hours sampled at Welsh Road had favorable winds).
The rates of favorable winds during valid sample days for TO-11A aldehyde and ketones also varied by site and source (Table B2). Valid sampling at Henderson Road was downwind of Houston Gas Plant 7.7% of the hours and Meddings Road was downwind of the Houston Gas Plant 8.8% of sampling hours. Henderson Road was downwind of the Nancy Stewart Compressor Station and the Stewart Gas Plant 21% of the hours during valid samples.

46
Table B2. Percent of hours sites were downwind during validated TO-11A sampling
Site Source Percent Hours with
Site Downwind from Source
Distance [miles]
Number of 24-hour
Samples
Hours Met Observation with Valid
Sample Henderson Houston Gas Plant 7.7 4.3 43 1032 Henderson Nancy Stewart
Comp. Station 21.0 1.0 43 1032
Henderson Stewart Gas Plant 22.0 1.0 43 1032 Meddings Rd Houston Gas Plant 8.8 0.8 52 1248 Meddings Rd Johnson Comp.
Station 2.9 0.7 52 1248

47
Appendix C Chemical Concentrations over Time

48
Figure C1. Acetaldehyde Concentrations at Henderson and Meddings Roads
Figure C2. Formaldehyde Concentrations at Henderson and Meddings Road

49
Figure C3. Carbon Tetrachloride Across Four Monitoring Sites
Figure C4. H2S Concentrations at Meddings Road

50
Appendix D Overview of Pathway Analysis and Screening Values
51
Determining Exposure Pathways
PADOH and ATSDR evaluate whether people may have come into contact with chemicals from a site by examining exposure pathways. A completed exposure pathway consists of five considerations:
1. A source of contamination (a chemical release, landfill, etc.) 2. A method of environmental transport (air, water, soil, sediment, etc.), which allows the
chemicals to move from the source area and bring it into contact with people, 3. A point of exposure where people come into physical contact with the chemical, 4. A route of exposure (ingestion, inhalation, or dermal), which is how the chemical gets into a
person’s body, and 5. A population at risk, i.e., a group of people likely to come into contact with the chemical.
A completed exposure pathway is when all five considerations are present. A completed exposure pathway does not necessarily mean that harmful health effects will occur. A chemical’s ability to harm health depends on many factors, including how much of the chemical is present, how long and how often a person is exposed to the chemical, and how toxic the chemical is. Further evaluation of the specific exposure occurring is needed to determine whether the exposure could cause harmful effects.
If one or more considerations is missing or has been stopped (for example, by preventing transport of the chemical from the source to the exposure point), the pathway is incomplete. Exposure cannot occur for incomplete exposure pathways. A potential exposure pathway is identified when exposure appears possible, but one or more of the parts is not clearly defined.
For this evaluation, we conclude the air exposure pathway from natural gas infrastructure to nearby residents is a completed exposure pathway.
Overview for identifying contaminants of concern and evaluating risk
Before discussing health risks from exposure to air contaminants, it is important to understand:
1. Which contaminants are present; 2. The magnitude (the range) of concentrations of those contaminants; 3. How often (the frequency) the contaminants were detected; and 4. How long (the duration) the contaminants were present at the detected levels.
The data are compared to the most conservative (lowest) health-based screening levels from ATSDR, U.S. EPA, or other agencies to identify contaminants for further evaluation that are present at levels of potential concern. These screening levels are referred to as comparison values, or CVs. CVs are concentrations of chemicals in air below which no harmful health effects are expected to occur, even with continual exposure. If a chemical is present at a level higher than the corresponding CV, it does not mean that health effects will occur, just that more evaluation is needed.
For chemicals in air that exceed CVs, PADOH and ATSDR compare the air concentrations with known health effect levels identified in ATSDR’s toxicological profiles, U.S. EPA’s Integrated Risk Information System, or other scientific literature.

52
Screening Data
To select the contaminants requiring the most detailed evaluation, PADOH and ATSDR considered ATSDR health-based comparison values (CVs), as well as those published by other agencies. Comparison values were identified for both short-term (acute) and long-term (chronic) exposure durations, and also considered both cancer and non-cancer health effects. In our evaluation, the air sampling results were compared to ATSDR Cancer Risk Evaluation Guides (CREGs), environmental media evaluation guides (EMEGs), and minimum risk levels (MRLs); U.S.EPA Regional Screening Levels (RSLs), Reference Concentrations (RfCs), and National Ambient Air Quality Standards (NAAQS). When ATSDR and U.S. EPA values were not available, we used comparison values from other states who have derived comparison values (e.g., Air Monitoring Comparison Values (AMCVs) from Texas Commission on Environmental Quality (TCEQ)). These CVs are defined below and shown in Appendix C, Table 1:
1. ATSDR CREGs are concentrations of a carcinogen at which there is an elevated risk for one case of cancer in one million people exposed over a lifetime [ATSDR 2005a].
2. ATSDR EMEGs are estimates of the concentrations of contaminants calculated that anyone could be exposed to without experiencing health effects (similar to U.S. EPA RfCs). EMEGs are calculated for chronic, intermediate, and acute exposures those occurring longer than 365 days, from between 15-365 days, and 14 days of exposure or less, respectively [ATSDR 2005a].
3. ATSDR MRLs are estimates of the daily human exposure to a substance that is likely to be without appreciable risk of adverse health effects during a specified duration of exposure. MRLs are based only on effects other than cancer [ATSDR 2005a].
4. U.S. EPA RSLs are risk-based numbers that are available for multiple exposure pathways and for chemicals that cause cancer or other health effects. The RSLs used in this analysis correspond to either a one excess risk of cancer per million exposed people (10-6) for carcinogens or a Hazard Quotient (HQ) of 1 for non-carcinogens [U.S. EPA 2016a].
5. U.S. EPA RfCs are estimates of the concentrations of contaminants calculated that anyone could be exposed to for a lifetime without experiencing deleterious health effects. RfCs are for inhalational exposures and based on non-cancer health effects depending on the pollutant [U.S. EPA 2016b].
6. U.S. EPA National Ambient Air Quality Standards (NAAQS) are standards established by EPA under the Clean Air Act 40 CFR part 50 for contaminants considered harmful to public health and the environment. Primary standards protect the public including sensitive populations such as asthmatics, children, and the elderly. Secondary standards provide public welfare protection, including protection against decreased visibility and damage to animals, crops, vegetation, and buildings (Appendix C, Table 2) [U.S. EPA 2016c].
7. TCEQ AMCVs are chemical-specific air concentrations set to protect human health and welfare. Exposure to an air concentration at or below the AMCV is not likely to cause health effects in the general public, including sensitive subgroups such as children, the elderly, pregnant women, and people with preexisting health conditions [TCEQ 2010].
8. TCEQ Effects Screening Levels (ESLs) are used to evaluate the potential for effects to occur as a result of exposure to concentrations of constituents in the air. They are based on data
53
concerning health effects, the potential for odors to be a nuisance, and effects on vegetation. They are not ambient air standards. ATSDR has not fully evaluated the toxicological basis for TCEQ effect screening levels. ESLs are chemical concentrations in the air that TCEQ consider to be safe. Per TCEQ: ESLs protect human health in the general public, including children, the elderly, pregnant women, and people with pre-existing health conditions. ESLs also protect against welfare effects, such as strong odors and harmful effects in plants. ESLs are used in the air permit application process to evaluate the protectiveness of emissions for specific chemicals. Long-term ESLs protect against long-term health effects and plant damage. For air permit applications, long-term ESLs are used to evaluate predicted 1-year average air concentrations. If the predicted maximum air concentrations are below short-term and long-term ESLs, then adverse [human] health effects, nuisance odors, and harmful effects in plants would not be expected [TCEQ 2015]. If a TCEQ AMCV was not available, PADOH screened the data against TCEQ ESLs.

54
Appendix E Health-based Screening Values and Field Sampling and Monitoring Results
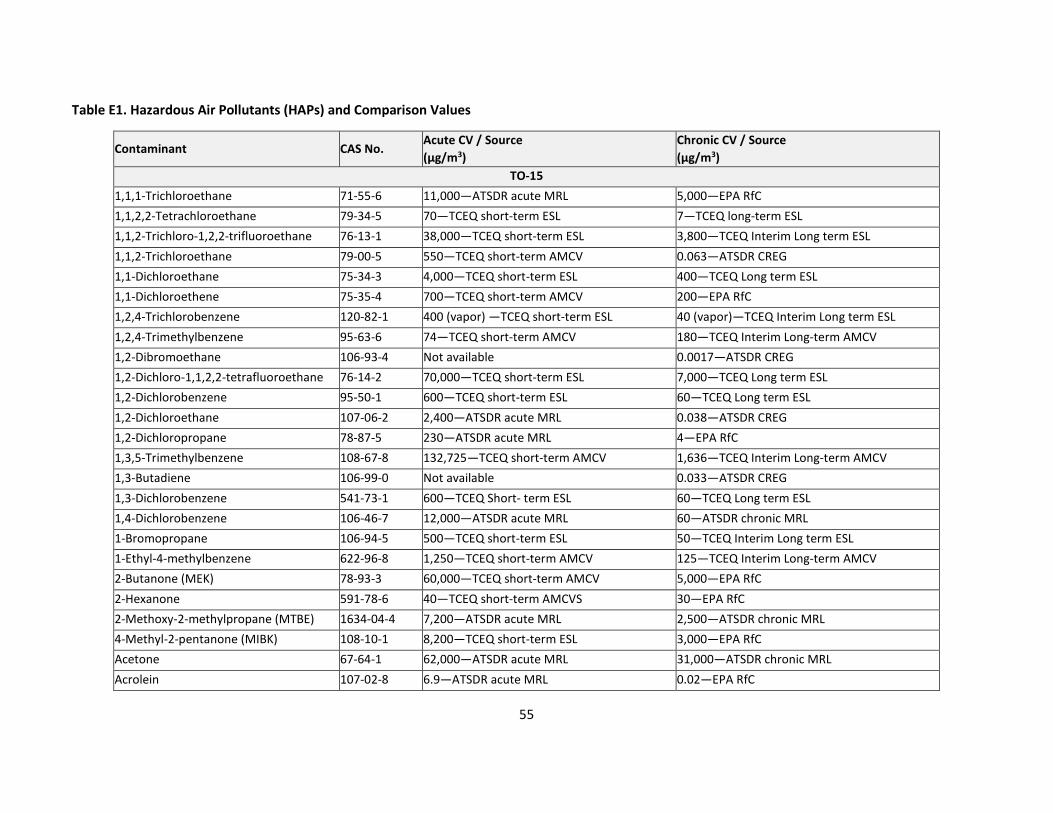
55
Table E1. Hazardous Air Pollutants (HAPs) and Comparison Values
Contaminant CAS No. Acute CV / Source (µg/m3)
Chronic CV / Source (µg/m3)
TO-15 1,1,1-Trichloroethane 71-55-6 11,000—ATSDR acute MRL 5,000—EPA RfC 1,1,2,2-Tetrachloroethane 79-34-5 70—TCEQ short-term ESL 7—TCEQ long-term ESL 1,1,2-Trichloro-1,2,2-trifluoroethane 76-13-1 38,000—TCEQ short-term ESL 3,800—TCEQ Interim Long term ESL 1,1,2-Trichloroethane 79-00-5 550—TCEQ short-term AMCV 0.063—ATSDR CREG 1,1-Dichloroethane 75-34-3 4,000—TCEQ short-term ESL 400—TCEQ Long term ESL 1,1-Dichloroethene 75-35-4 700—TCEQ short-term AMCV 200—EPA RfC 1,2,4-Trichlorobenzene 120-82-1 400 (vapor) —TCEQ short-term ESL 40 (vapor)—TCEQ Interim Long term ESL 1,2,4-Trimethylbenzene 95-63-6 74—TCEQ short-term AMCV 180—TCEQ Interim Long-term AMCV 1,2-Dibromoethane 106-93-4 Not available 0.0017—ATSDR CREG 1,2-Dichloro-1,1,2,2-tetrafluoroethane 76-14-2 70,000—TCEQ short-term ESL 7,000—TCEQ Long term ESL 1,2-Dichlorobenzene 95-50-1 600—TCEQ short-term ESL 60—TCEQ Long term ESL 1,2-Dichloroethane 107-06-2 2,400—ATSDR acute MRL 0.038—ATSDR CREG 1,2-Dichloropropane 78-87-5 230—ATSDR acute MRL 4—EPA RfC 1,3,5-Trimethylbenzene 108-67-8 132,725—TCEQ short-term AMCV 1,636—TCEQ Interim Long-term AMCV 1,3-Butadiene 106-99-0 Not available 0.033—ATSDR CREG 1,3-Dichlorobenzene 541-73-1 600—TCEQ Short- term ESL 60—TCEQ Long term ESL 1,4-Dichlorobenzene 106-46-7 12,000—ATSDR acute MRL 60—ATSDR chronic MRL 1-Bromopropane 106-94-5 500—TCEQ short-term ESL 50—TCEQ Interim Long term ESL 1-Ethyl-4-methylbenzene 622-96-8 1,250—TCEQ short-term AMCV 125—TCEQ Interim Long-term AMCV 2-Butanone (MEK) 78-93-3 60,000—TCEQ short-term AMCV 5,000—EPA RfC 2-Hexanone 591-78-6 40—TCEQ short-term AMCVS 30—EPA RfC 2-Methoxy-2-methylpropane (MTBE) 1634-04-4 7,200—ATSDR acute MRL 2,500—ATSDR chronic MRL 4-Methyl-2-pentanone (MIBK) 108-10-1 8,200—TCEQ short-term ESL 3,000—EPA RfC Acetone 67-64-1 62,000—ATSDR acute MRL 31,000—ATSDR chronic MRL Acrolein 107-02-8 6.9—ATSDR acute MRL 0.02—EPA RfC

56
Contaminant CAS No. Acute CV / Source (µg/m3)
Chronic CV / Source (µg/m3)
Benzene 71-43-2 29—ATSDR acute MRL 0.13—ATSDR CREG Bromodichloromethane 75-27-4 700—TCEQ short-term ESL 70—TCEQ Interim Long term ESL Bromoform 75-25-2 50—TCEQ short-term ESL 0.91—ATSDR CREG Bromomethane 74-83-9 190—ATSDR acute MRL 19—ATSDR chronic MRL Carbon disulfide 75-15-0 7,500—TCEQ short-term ESL 930—ATSDR chronic MRL Carbon tetrachloride 56-23-5 126—AMCV 0.17—ATSDR CREG Chlorobenzene 108-90-7 460—TCEQ short-term ESL 46—TCEQ Long term ESL (odors) Chloroethane 75-00-3 40,000 - ATSDR acute MRL 10,000—EPA RfC Chloroethene 75-01-4 8,700—ATSDR acute MRL 0.11—ATSDR CREG Chloroform 67-66-3 490—ATSDR acute MRL 0.043—ATSDR CREG Chloromethane 74-87-3 1,000—ATSDR acute MRL 100—ATSDR chronic MRL cis-1,2-Dichloroethene 156-59-2 2,000—TCEQ Short- term ESL Not available cis-1,3-Dichloro-1-propene 10061-01-5 45—TCEQ Interim short-term AMCV 4.5—TCEQ Interim Long-term AMCV Cyclohexane 110-82-7 3,400—TCEQ short-term AMCV 3,100—Cal EPA RfC Dibromochloromethane 124-48-1 20—TCEQ short-term ESL 2—TCEQ Long term ESL Dichlorodifluoromethane 75-71-8 42,000—TCEQ short-term AMCV 5,000—TCEQ Interim Long term ESL Ethylbenzene 100-41-4 22,000—ATSDR acute MRL 260—ATSDR chronic MRL Hexachloro-1,3-butadiene 87-68-3 2—TCEQ short-term ESL 0.045—ATSDR CREG m&p-Xylene 108-38-3 2,200—TCEQ short-term 180—TCEQ Long term ESL (odors) Methylene chloride 75-09-2 2,100—ATSDR acute MRL 100—ATSDR CREG n-Heptane 142-82-5 3,500—TCEQ short-term AMCV 350—TCEQ Interim Long-term AMCV n-Hexane 110-54-3 6,200—TCEQ short-term AMCV 2,100—ATSDR chronic MRL o-Xylene 95-47-6 1,400—TCEQ short-term AMCV 140—TCEQ Interim Long-term AMCV Propene 115-07-1 Not available 3,000—Cal EPA PPRTV Styrene 100-42-5 21,000—ATSDR acute MRL 850—ATSDR chronic MRL Tetrachloroethene (PERC or PCE) 127-18-4 41—ATSDR acute MRL 3.8—ATSDR CREG Tetrahydrofuran (THF) 109-99-9 1,500—TCEQ short-term ESL 2,000—EPA RfC Toluene 108-88-3 3,800—ATSDR acute MRL 300—ATSDR chronic MRL trans-1,2-Dichloroethene 156-60-5 790—ATSDR acute/interm. MRL 793—TCEQ Long term ESL
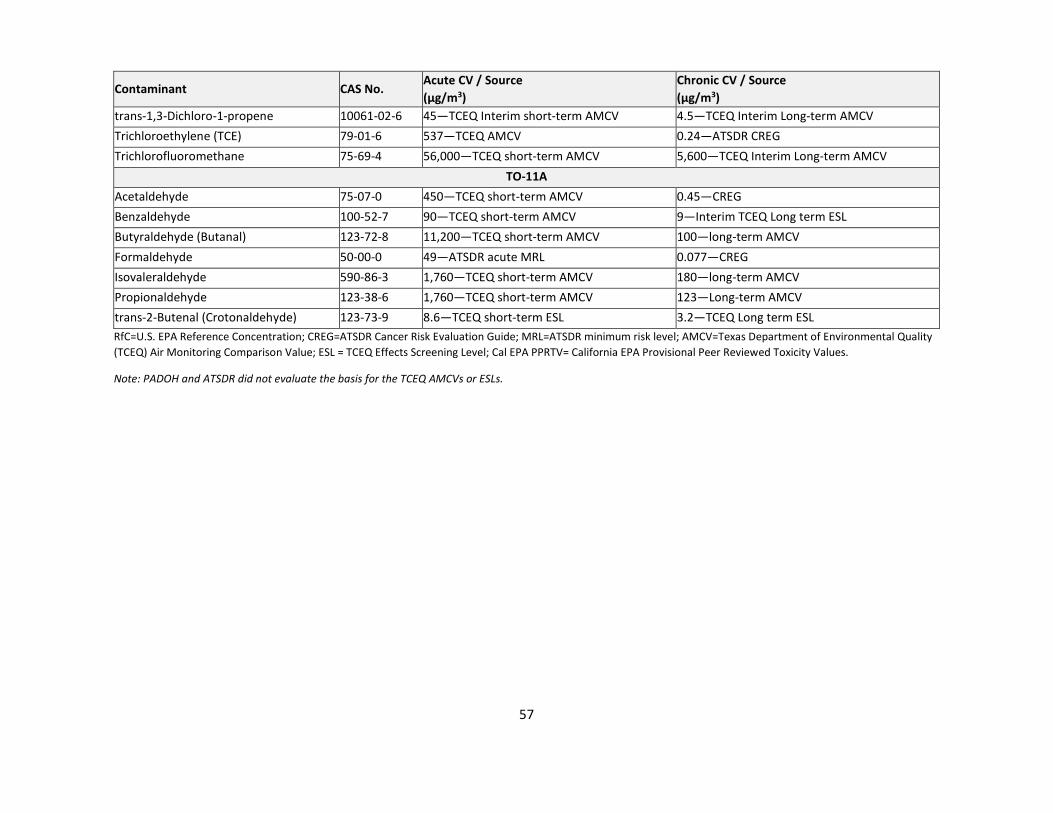
57
Contaminant CAS No. Acute CV / Source (µg/m3)
Chronic CV / Source (µg/m3)
trans-1,3-Dichloro-1-propene 10061-02-6 45—TCEQ Interim short-term AMCV 4.5—TCEQ Interim Long-term AMCV Trichloroethylene (TCE) 79-01-6 537—TCEQ AMCV 0.24—ATSDR CREG Trichlorofluoromethane 75-69-4 56,000—TCEQ short-term AMCV 5,600—TCEQ Interim Long-term AMCV
TO-11A Acetaldehyde 75-07-0 450—TCEQ short-term AMCV 0.45—CREG Benzaldehyde 100-52-7 90—TCEQ short-term AMCV 9—Interim TCEQ Long term ESL Butyraldehyde (Butanal) 123-72-8 11,200—TCEQ short-term AMCV 100—long-term AMCV Formaldehyde 50-00-0 49—ATSDR acute MRL 0.077—CREG Isovaleraldehyde 590-86-3 1,760—TCEQ short-term AMCV 180—long-term AMCV Propionaldehyde 123-38-6 1,760—TCEQ short-term AMCV 123—Long-term AMCV trans-2-Butenal (Crotonaldehyde) 123-73-9 8.6—TCEQ short-term ESL 3.2—TCEQ Long term ESL RfC=U.S. EPA Reference Concentration; CREG=ATSDR Cancer Risk Evaluation Guide; MRL=ATSDR minimum risk level; AMCV=Texas Department of Environmental Quality (TCEQ) Air Monitoring Comparison Value; ESL = TCEQ Effects Screening Level; Cal EPA PPRTV= California EPA Provisional Peer Reviewed Toxicity Values.
Note: PADOH and ATSDR did not evaluate the basis for the TCEQ AMCVs or ESLs.
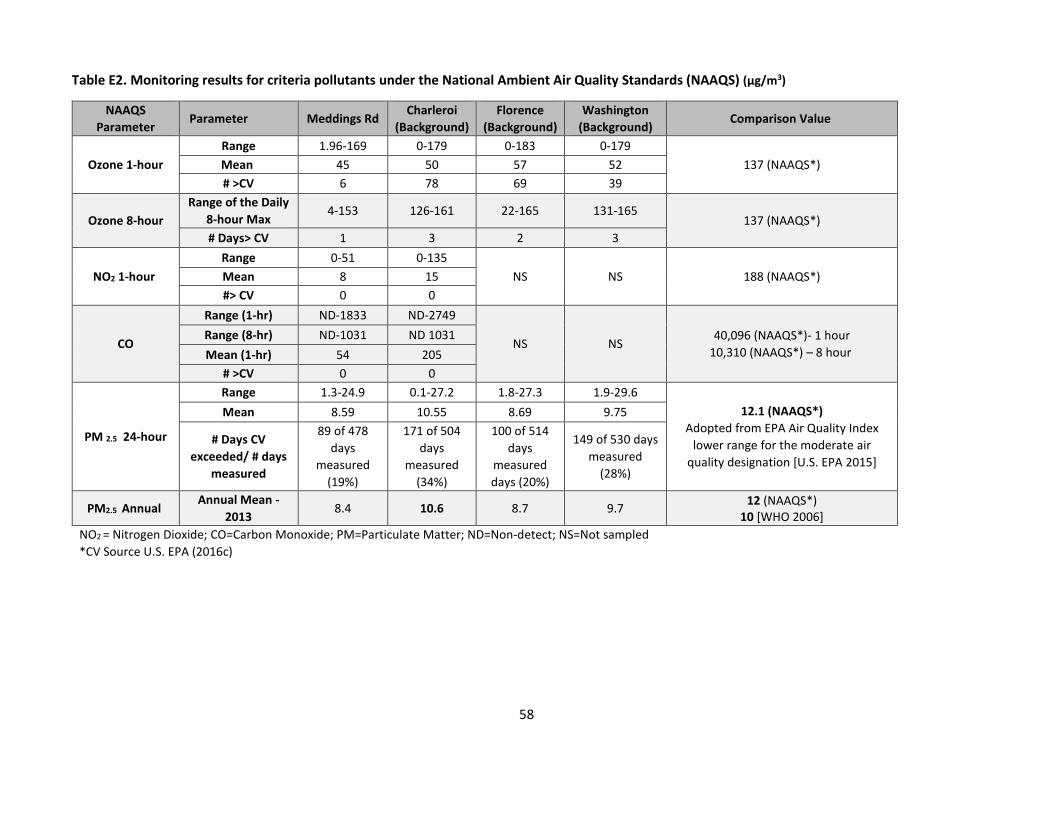
58
Table E2. Monitoring results for criteria pollutants under the National Ambient Air Quality Standards (NAAQS) (µg/m3)
NAAQS Parameter
Parameter Meddings Rd Charleroi
(Background) Florence
(Background) Washington
(Background) Comparison Value
Ozone 1-hour Range 1.96-169 0-179 0-183 0-179
137 (NAAQS*) Mean 45 50 57 52 # >CV 6 78 69 39
Ozone 8-hour Range of the Daily
8-hour Max 4-153 126-161 22-165 131-165
137 (NAAQS*) # Days> CV 1 3 2 3
NO2 1-hour Range 0-51 0-135
NS NS 188 (NAAQS*) Mean 8 15 #> CV 0 0
CO
Range (1-hr) ND-1833 ND-2749
NS NS 40,096 (NAAQS*)- 1 hour
10,310 (NAAQS*) – 8 hour Range (8-hr) ND-1031 ND 1031 Mean (1-hr) 54 205
# >CV 0 0
PM 2.5 24-hour
Range 1.3-24.9 0.1-27.2 1.8-27.3 1.9-29.6 12.1 (NAAQS*)
Adopted from EPA Air Quality Index lower range for the moderate air
quality designation [U.S. EPA 2015]
Mean 8.59 10.55 8.69 9.75
# Days CV exceeded/ # days
measured
89 of 478 days
measured (19%)
171 of 504 days
measured (34%)
100 of 514 days
measured days (20%)
149 of 530 days measured
(28%)
PM2.5 Annual Annual Mean -
2013 8.4 10.6 8.7 9.7 12 (NAAQS*)
10 [WHO 2006] NO2 = Nitrogen Dioxide; CO=Carbon Monoxide; PM=Particulate Matter; ND=Non-detect; NS=Not sampled *CV Source U.S. EPA (2016c)

59
Table E3. Hydrogen sulfide (H2S) 24-hour sampling results in µg/m3
Meddings Road Henderson Road CVs
(µg/m3) Range ND-4.35 ND-48 98 – acute MRL
28 – intermediate MRL 2 – EPA chronic RfC
Mean 0.901 7 # >CV 115/498 258/317 RfC=EPA Reference Concentration; MRL=ATSDR Minimum Risk Level; ND=non-detect
Table E4. Meddings Road hazardous air contaminants (TO-15) sampling results
Chemical Name
Method Detection Limit (µg/m3)
Mean* (µg/m3)
95UCL* (µg/m3)
Min (µg/m3)
Max (µg/m3)
Chronic CV (µg/m3)/ Source # samples > CV COPC
Ethylbenzene 0.172 0.130 0.138 0.178 0.286 260 – ATSDR chronic MRL 0 No Styrene 0.179 0.142 0.166 0.187 0.754 850 – ATSDR chronic MRL 0 No cis-1,3-Dichloro-1-propene 0.217 0.153 0.153 ND ND 4.5 – TCEQ Interim Long-term AMCV 0 No trans-1,3-Dichloro-1-propene 0.166 0.118 0.118 ND ND 4.5 – TCEQ Interim Long-term AMCV 0 No 1,4-Dichlorobenzene 0.307 0.224 0.233 0.186 0.379 60 – ATSDR chronic MRL 0 No 1,2-Dibromoethane 0.308 0.218** 0.218** ND ND 0.0017 – ATSDR CREG Insufficient data - 1-Bromopropane 0.188 0.135 0.138 0.221 0.221 50 – TCEQ Interim Long term ESL 0 No 1,3-Butadiene 0.203 0.143** 0.143** ND ND 0.033 – ATSDR CREG Insufficient data - 1,2-Dichloroethane 0.145 0.102** 0.102** ND ND 0.038 – ATSDR CREG Insufficient data - 4-Methyl-2-pentanone (MIBK) 0.257 0.180 0.182 0.127 0.164 3,000 – EPA RfC 0 No m&p-Xylene 0.299 0.256 0.291 0.399 0.738 180 – TCEQ Long term ESL (odors) 0 No
1,3,5-Trimethylbenzene 0.244 0.173 0.173 ND ND 1,636 – TCEQ Interim Long-term AMCV
0 No
Toluene 0.147 0.948 1.067 0.343 2.641 300 – ATSDR chronic MRL 0 No Chlorobenzene 0.182 0.130 0.132 0.184 0.184 46 – TCEQ Long term ESL (odors) 0 No Tetrahydrofuran (THF) 0.157 0.131 0.153 0.118 0.640 2,000 – EPA RfC 0 No n-Hexane 0.181 1.227 1.452 0.221 4.957 2,100 – ATSDR chronic MRL 0 No
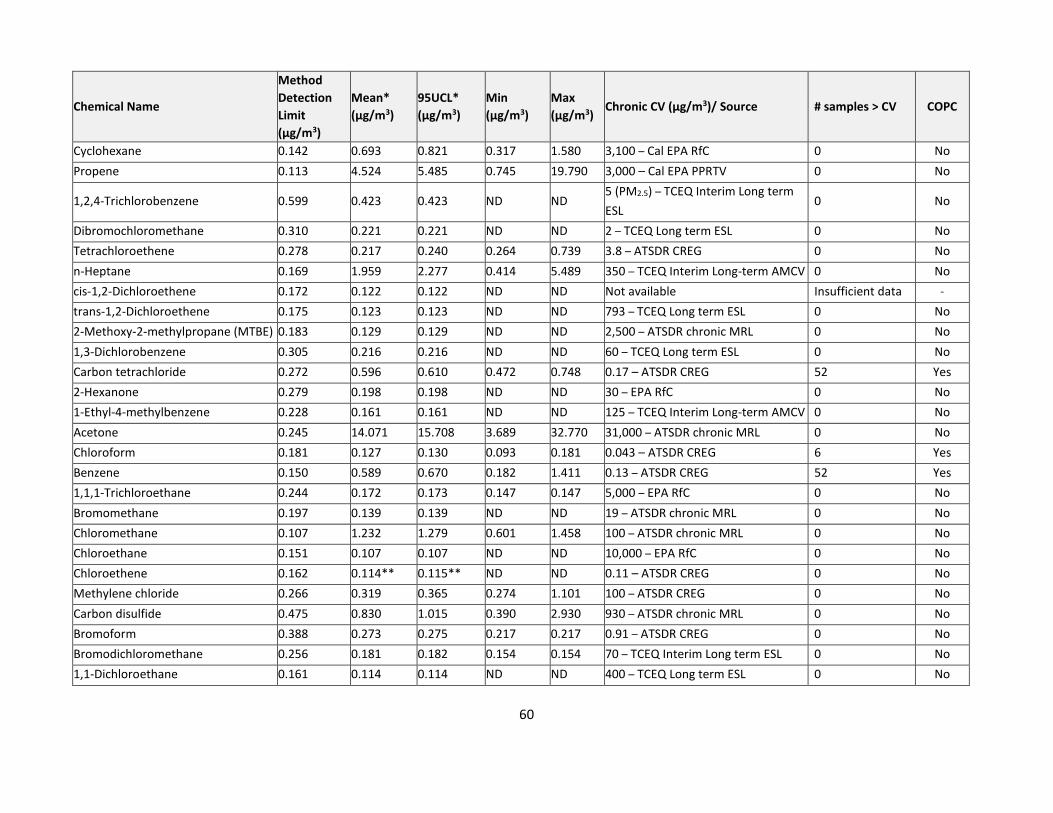
60
Chemical Name
Method Detection Limit (µg/m3)
Mean* (µg/m3)
95UCL* (µg/m3)
Min (µg/m3)
Max (µg/m3)
Chronic CV (µg/m3)/ Source # samples > CV COPC
Cyclohexane 0.142 0.693 0.821 0.317 1.580 3,100 – Cal EPA RfC 0 No Propene 0.113 4.524 5.485 0.745 19.790 3,000 – Cal EPA PPRTV 0 No
1,2,4-Trichlorobenzene 0.599 0.423 0.423 ND ND 5 (PM2.5) – TCEQ Interim Long term ESL
0 No
Dibromochloromethane 0.310 0.221 0.221 ND ND 2 – TCEQ Long term ESL 0 No Tetrachloroethene 0.278 0.217 0.240 0.264 0.739 3.8 – ATSDR CREG 0 No n-Heptane 0.169 1.959 2.277 0.414 5.489 350 – TCEQ Interim Long-term AMCV 0 No cis-1,2-Dichloroethene 0.172 0.122 0.122 ND ND Not available Insufficient data - trans-1,2-Dichloroethene 0.175 0.123 0.123 ND ND 793 – TCEQ Long term ESL 0 No 2-Methoxy-2-methylpropane (MTBE) 0.183 0.129 0.129 ND ND 2,500 – ATSDR chronic MRL 0 No 1,3-Dichlorobenzene 0.305 0.216 0.216 ND ND 60 – TCEQ Long term ESL 0 No Carbon tetrachloride 0.272 0.596 0.610 0.472 0.748 0.17 – ATSDR CREG 52 Yes 2-Hexanone 0.279 0.198 0.198 ND ND 30 – EPA RfC 0 No 1-Ethyl-4-methylbenzene 0.228 0.161 0.161 ND ND 125 – TCEQ Interim Long-term AMCV 0 No Acetone 0.245 14.071 15.708 3.689 32.770 31,000 – ATSDR chronic MRL 0 No Chloroform 0.181 0.127 0.130 0.093 0.181 0.043 – ATSDR CREG 6 Yes Benzene 0.150 0.589 0.670 0.182 1.411 0.13 – ATSDR CREG 52 Yes 1,1,1-Trichloroethane 0.244 0.172 0.173 0.147 0.147 5,000 – EPA RfC 0 No Bromomethane 0.197 0.139 0.139 ND ND 19 – ATSDR chronic MRL 0 No Chloromethane 0.107 1.232 1.279 0.601 1.458 100 – ATSDR chronic MRL 0 No Chloroethane 0.151 0.107 0.107 ND ND 10,000 – EPA RfC 0 No Chloroethene 0.162 0.114** 0.115** ND ND 0.11 – ATSDR CREG 0 No Methylene chloride 0.266 0.319 0.365 0.274 1.101 100 – ATSDR CREG 0 No Carbon disulfide 0.475 0.830 1.015 0.390 2.930 930 – ATSDR chronic MRL 0 No Bromoform 0.388 0.273 0.275 0.217 0.217 0.91 – ATSDR CREG 0 No Bromodichloromethane 0.256 0.181 0.182 0.154 0.154 70 – TCEQ Interim Long term ESL 0 No 1,1-Dichloroethane 0.161 0.114 0.114 ND ND 400 – TCEQ Long term ESL 0 No

61
Chemical Name
Method Detection Limit (µg/m3)
Mean* (µg/m3)
95UCL* (µg/m3)
Min (µg/m3)
Max (µg/m3)
Chronic CV (µg/m3)/ Source # samples > CV COPC
1,1-Dichloroethene 0.189 0.133 0.133 ND ND 200 – EPA RfC 0 No
Trichlorofluoromethane 0.307 1.436 1.485 0.730 1.763 5,600 – TCEQ Interim Long-term AMCV
0 No
Dichlorodifluoromethane 0.217 2.783 2.906 0.964 3.173 5,000 – TCEQ Interim Long term ESL 0 No 1,1,2-Trichloro-1,2,2-trifluoroethane 0.418 0.675 0.709 0.582 0.896 3,800 – TCEQ Interim Long term ESL 0 No 1,2-Dichloro-1,1,2,2-tetrafluoroethane
0.336 0.238 0.240 0.272 0.272 7,000 – TCEQ Long term ESL 0 No
1,2-Dichloropropane 0.181 0.128 0.128 0.134 0.134 4 – EPA RfC 0 No 2-Butanone (MEK) 0.266 1.766 2.151 0.345 9.126 5,000 – EPA RfC 0 No 1,1,2-Trichloroethane 0.213 0.151** 0.151** ND ND 0.063 – ATSDR CREG Insufficient data - Trichloroethylene (TCE) 0.237 0.168 0.169 0.150 0.193 0.24 – ATSDR CREG Insufficient data - 1,1,2,2-Tetrachloroethane 0.296 0.210 0.210 ND ND 7 – TCEQ long-term ESL 0 No Hexachloro-1,3-butadiene 0.498 ‡ ‡ ND ND 0.045 – ATSDR CREG Insufficient data - o-Xylene 0.178 0.137 0.149 0.182 0.378 140 – TCEQ Interim Long-term AMCV 0 No 1,2-Dichlorobenzene 0.332 0.235 0.235 ND ND 60 – TCEQ Long term ESL 0 No 1,2,4-Trimethylbenzene 0.222 0.160 0.163 0.211 0.226 180 – TCEQ Interim Long-term AMCV 0 No RfC=U.S. EPA Reference Concentration; CREG=ATSDR Cancer Risk Evaluation Guide; MRL=ATSDR minimum risk level; AMCV=Texas Department of Environmental Quality (TCEQ) Air Monitoring Comparison Value (AMCV); ESL = TCEQ Effects Screening Level; PPRTV= Cal EPA Provisional Peer Reviewed Toxicity Values. Note: PADOH and ATSDR did not evaluate the basis for the TCEQ AMCVs or ESLs. *PADOH and ATSDR calculated averages for contaminants with non-detects by substituting non-detect values using = Method Detection Limit/square root of 2. ** Average exceeds health-based CV. This occurred because the formula used to calculate averages with non-detect values was = method detection limit /sq. rt. 2. + Indicates contaminants with method detection limits that are higher than the ATSDR CVs. ‡ Too few detections to calculate an average value - PADOH and ATSDR cannot evaluate the public health significance of the sampling data either due to low detections, lack of CVs or method detection limits exceeding available CVs.

62
Table E5. Meddings Road hazardous air contaminants (TO-11A) sampling results
Chemical Name
Method Detection
Limit (µg/m3)
Mean* (µg/m3)
95% UCL of the Mean
(µg/m3)*
Min (µg/m3)
Max (µg/m3)
Chronic CV µg/m3)/ Source # samples > CV COPC
Acetaldehyde 0.017 1.485 1.597 0.798 3.19 0.45 – ATSDR CREG 49 Yes Acetone 0.020 4.672 5.297 0.382 9.72 31,000 – ATSDR chronic MRL 0 No Benzaldehyde 0.006 0.773 1.024 0.208 1.25 9 – TCEQ Interim Long term ESL 0 No Butyraldehyde (Butanal) 0.018 0.941 1.095 0.347 2.29 100 – TCEQ Long term AMCV 0 No Formaldehyde 0.014 3.085 4.397 0.694 11.11 0.077 – ATSDR CREG 52 Yes Isovaleraldehyde** 0.008 ND ND ND ND 180 – TCEQ Long term AMCV 0 No Propionaldehyde 0.010 0.584 0.266 0.122 0.56 123 – TCEQ Long-term AMCV 0 No trans-2-Butenal (Crotonaldehyde)**
0.012 ND ND ND ND
3.2 – TCEQ Long term ESL 0 No
CREG=ATSDR Cancer Risk Evaluation Guide; MRL=ATSDR minimum risk level; AMCV=Texas Department of Environmental Quality (TCEQ) Air Monitoring Comparison Value; ESL = TCEQ Effects Screening Level *PADOH and ATSDR calculated averages for contaminants with non-detects by substituting non-detect values using = Method Detection Limit/square root of 2. ** All values were non-detect

63
Table E6. Welsh Road hazardous air contaminants (TO-15) sampling results
Chemical Name
Method Detection
Limit (µg/m3)
Mean* (µg/m3)
95UCL (µg/m3)
Min (µg/m3)
Max (µg/m3) Chronic CV (µg/m3)/ Source # samples > CV COPC
Ethylbenzene 0.172 0.1291 0.1356 0.19098 0.217 260 – ATSDR chronic MRL 0 No Styrene 0.179 0.2183 0.2743 0.17458 1.294 850 – ATSDR chronic MRL 0 No cis-1,3-Dichloro-1-propene 0.217 0.1534 0.1534 ND ND 4.5 – TCEQ Interim Long-term AMCV 0 No trans-1,3-Dichloro-1-propene 0.166 0.1176 0.1176 ND ND 4.5 – TCEQ Interim Long-term AMCV 0 No 1,4-Dichlorobenzene 0.307 0.2165 0.2175 0.1863 0.186 60 – ATSDR chronic MRL 0 No 1,2-Dibromoethane + 0.308 0.2179** 0.2179** ND ND 0.0017 – ATSDR CREG Insufficient data - 1-Bromopropane 0.188 0.1329 0.1329 ND ND 50 – TCEQ Interim Long term ESL 0 No 1,3-Butadiene 0.203 0.1443** 0.1460** 0.19242 0.192 0.033 – ATSDR CREG Insufficient data 1,2-Dichloroethane 0.145 0.1024** 0.1024** ND ND 0.038 – ATSDR CREG Insufficient data - 4-Methyl-2-pentanone (MIBK) 0.257 0.1819 0.1819 ND ND 3,000 – EPA RfC 0 No m&p-Xylene 0.299 0.2855 0.3211 0.3951 0.634 180 – TCEQ Long term ESL (odors) 0 No 1,3,5-Trimethylbenzene 0.244 0.1725 0.1725 ND ND 1,636 – TCEQ Interim Long-term AMCV 0 No Toluene 0.147 6.3307 8.7525 0.30512 36.977 300 – ATSDR chronic MRL 0 No Chlorobenzene 0.182 0.1287 0.1287 ND ND 46 – TCEQ Long term ESL (odors) 0 No Tetrahydrofuran (THF) 0.157 0.1113 0.1113 ND ND 2,000 – EPA RfC 0 No n-Hexane 0.156 0.5865 0.6643 0.18674 1.733 2,100 – ATSDR chronic MRL 0 No Cyclohexane 0.142 0.1556 0.1874 0.10327 0.775 3,100 – Cal EPA RfC 0 No Propene 0.113 2.8883 3.2434 0.39587 6.136 3,000 – Cal EPA PPRTV 0 No 1,2,4-Trichlorobenzene 0.599 0.4235 0.4235 ND ND 5 (PM2.5) – TCEQ Interim Long term ESL 0 No Dibromochloromethane 0.310 0.2194 0.2194 ND ND 2 – TCEQ Long term ESL 0 No Tetrachloroethene 0.278 0.1964 0.1964 ND ND 3.8 – ATSDR CREG 0 No n-Heptane 0.169 0.2351 0.2650 0.16386 0.586 350 – TCEQ Interim Long-term AMCV 0 No cis-1,2-Dichloroethene 0.172 0.1217 0.1217 ND ND Not available Insufficient data - trans-1,2-Dichloroethene 0.175 0.1234 0.1234 ND ND 793 – TCEQ Long term ESL 0 No 2-Methoxy-2-methylpropane (MTBE) 0.183 0.1292 0.1292 ND ND 2,500 – ATSDR chronic MRL 0 No 1,3-Dichlorobenzene 0.305 0.2157 0.2157 ND ND 60 – TCEQ Long term ESL 0 No Carbon tetrachloride 0.272 0.5953 0.6120 0.4653 0.792 0.17 – ATSDR CREG 56 Yes+ 2-Hexanone 0.279 0.1975 0.1975 ND ND 30 – EPA RfC 0 No 1-Ethyl-4-methylbenzene 0.228 0.1610 0.1610 ND ND 125 – TCEQ Interim Long-term AMCV 0 No Acetone 0.245 10.1821 11.8379 2.10452 28.722 31,000 – ATSDR chronic MRL 0 No Chloroform 0.181 0.1261 0.1286 0.09273 0.161 0.043 – ATSDR CREG 9 Yes+
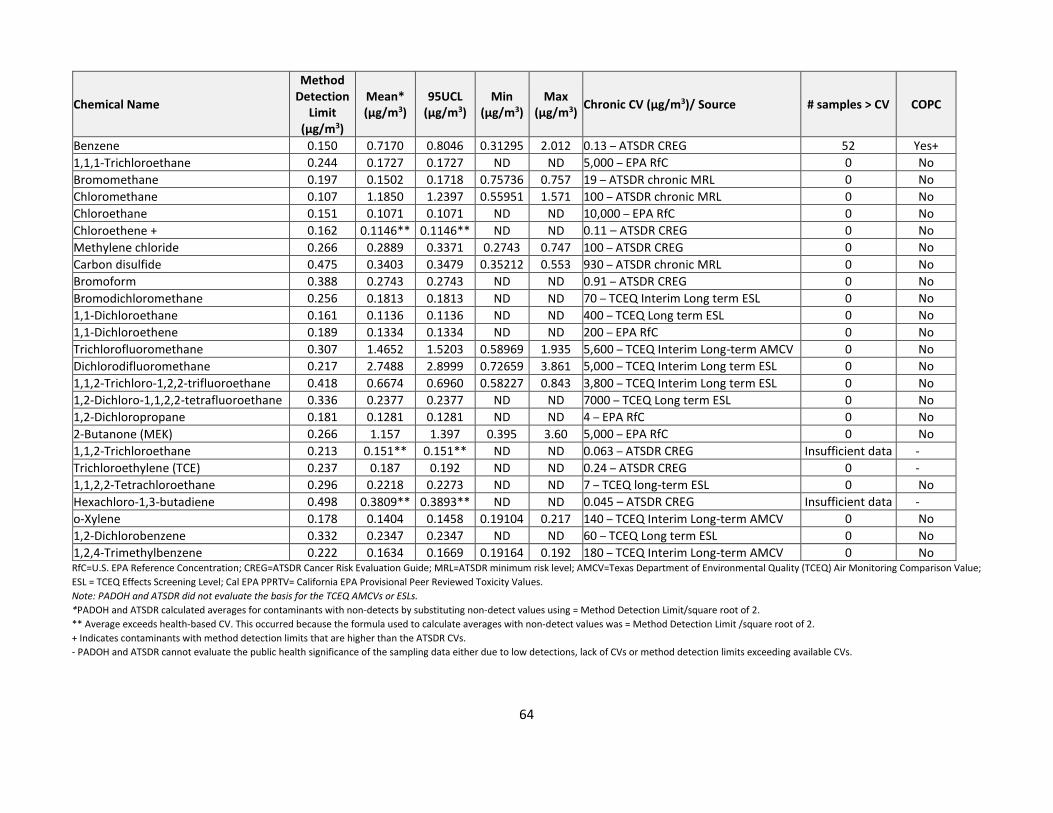
64
Chemical Name
Method Detection
Limit (µg/m3)
Mean* (µg/m3)
95UCL (µg/m3)
Min (µg/m3)
Max (µg/m3) Chronic CV (µg/m3)/ Source # samples > CV COPC
Benzene 0.150 0.7170 0.8046 0.31295 2.012 0.13 – ATSDR CREG 52 Yes+ 1,1,1-Trichloroethane 0.244 0.1727 0.1727 ND ND 5,000 – EPA RfC 0 No Bromomethane 0.197 0.1502 0.1718 0.75736 0.757 19 – ATSDR chronic MRL 0 No Chloromethane 0.107 1.1850 1.2397 0.55951 1.571 100 – ATSDR chronic MRL 0 No Chloroethane 0.151 0.1071 0.1071 ND ND 10,000 – EPA RfC 0 No Chloroethene + 0.162 0.1146** 0.1146** ND ND 0.11 – ATSDR CREG 0 No Methylene chloride 0.266 0.2889 0.3371 0.2743 0.747 100 – ATSDR CREG 0 No Carbon disulfide 0.475 0.3403 0.3479 0.35212 0.553 930 – ATSDR chronic MRL 0 No Bromoform 0.388 0.2743 0.2743 ND ND 0.91 – ATSDR CREG 0 No Bromodichloromethane 0.256 0.1813 0.1813 ND ND 70 – TCEQ Interim Long term ESL 0 No 1,1-Dichloroethane 0.161 0.1136 0.1136 ND ND 400 – TCEQ Long term ESL 0 No 1,1-Dichloroethene 0.189 0.1334 0.1334 ND ND 200 – EPA RfC 0 No Trichlorofluoromethane 0.307 1.4652 1.5203 0.58969 1.935 5,600 – TCEQ Interim Long-term AMCV 0 No Dichlorodifluoromethane 0.217 2.7488 2.8999 0.72659 3.861 5,000 – TCEQ Interim Long term ESL 0 No 1,1,2-Trichloro-1,2,2-trifluoroethane 0.418 0.6674 0.6960 0.58227 0.843 3,800 – TCEQ Interim Long term ESL 0 No 1,2-Dichloro-1,1,2,2-tetrafluoroethane 0.336 0.2377 0.2377 ND ND 7000 – TCEQ Long term ESL 0 No 1,2-Dichloropropane 0.181 0.1281 0.1281 ND ND 4 – EPA RfC 0 No 2-Butanone (MEK) 0.266 1.157 1.397 0.395 3.60 5,000 – EPA RfC 0 No 1,1,2-Trichloroethane 0.213 0.151** 0.151** ND ND 0.063 – ATSDR CREG Insufficient data - Trichloroethylene (TCE) 0.237 0.187 0.192 ND ND 0.24 – ATSDR CREG 0 - 1,1,2,2-Tetrachloroethane 0.296 0.2218 0.2273 ND ND 7 – TCEQ long-term ESL 0 No Hexachloro-1,3-butadiene 0.498 0.3809** 0.3893** ND ND 0.045 – ATSDR CREG Insufficient data - o-Xylene 0.178 0.1404 0.1458 0.19104 0.217 140 – TCEQ Interim Long-term AMCV 0 No 1,2-Dichlorobenzene 0.332 0.2347 0.2347 ND ND 60 – TCEQ Long term ESL 0 No 1,2,4-Trimethylbenzene 0.222 0.1634 0.1669 0.19164 0.192 180 – TCEQ Interim Long-term AMCV 0 No RfC=U.S. EPA Reference Concentration; CREG=ATSDR Cancer Risk Evaluation Guide; MRL=ATSDR minimum risk level; AMCV=Texas Department of Environmental Quality (TCEQ) Air Monitoring Comparison Value; ESL = TCEQ Effects Screening Level; Cal EPA PPRTV= California EPA Provisional Peer Reviewed Toxicity Values. Note: PADOH and ATSDR did not evaluate the basis for the TCEQ AMCVs or ESLs. *PADOH and ATSDR calculated averages for contaminants with non-detects by substituting non-detect values using = Method Detection Limit/square root of 2. ** Average exceeds health-based CV. This occurred because the formula used to calculate averages with non-detect values was = Method Detection Limit /square root of 2. + Indicates contaminants with method detection limits that are higher than the ATSDR CVs. - PADOH and ATSDR cannot evaluate the public health significance of the sampling data either due to low detections, lack of CVs or method detection limits exceeding available CVs.

65
Table E7. Jaspen Road HAPs (TO-15) results
Chemical Name
Method Detection
Limit (µg/m3)
Mean* (µg/m3)
95UCL (µg/m3)
Min (µg/m3)
Max (µg/m3) Chronic CV (µg/m3)/ Source # samples > CV COPC
Ethylbenzene 0.172 0.175 0.200 0.109 0.812 260 – ATSDR chronic MRL 0 No Styrene 0.179 0.831 1.028 0.136 5.041 850 – ATSDR chronic MRL 0 No cis-1,3-Dichloro-1-propene 0.217 0.153 0.153 ND ND 4.5 – TCEQ Interim Long-term AMCV 0 No trans-1,3-Dichloro-1-propene 0.166 0.118 0.118 ND ND 4.5 – TCEQ Interim Long-term AMCV 0 No 1,4-Dichlorobenzene 0.307 0.217 0.217 ND ND 60 – ATSDR chronic MRL 0 No 1,2-Dibromoethane 0.308 0.218** 0.218** ND ND 0.0017 – ATSDR CREG Insufficient data - 1-Bromopropane 0.188 0.133 0.133 ND ND 50 – TCEQ Interim Long term ESL 0 No 1,3-Butadiene 0.203 0.143** 0.144** 0.146 0.146 0.033 – ATSDR CREG Insufficient data - 1,2-Dichloroethane 0.145 0.102** 0.103** 0.085 0.085 0.038 – ATSDR CREG Insufficient data - 4-Methyl-2-pentanone (MIBK) 0.257 0.182 0.182 0.152 0.152 3,000 – EPA RfC 0 No m&p-Xylene 0.299 0.604 0.734 0.300 3.777 180 – TCEQ Long term ESL (odors) 0 No 1,3,5-Trimethylbenzene 0.244 0.177 0.184 0.123 0.359 1,636 – TCEQ Interim Long-term AMCV 0 No Toluene 0.147 0.677 0.770 0.181 2.712 300 – ATSDR chronic MRL 0 No Chlorobenzene 0.182 0.129 0.129 ND ND 46 – TCEQ Long term ESL (odors) 0 No Tetrahydrofuran (THF) 0.157 0.132 0.134 0.097 0.136 2,000 – EPA RfC 0 No n-Hexane 0.181 0.795 0.911 0.201 2.892 2,100 – ATSDR chronic MRL 0 No Cyclohexane 0.142 0.167 0.191 0.103 0.565 3,100 – Cal EPA RfC 0 No Propene 0.113 3.293 3.729 0.757 8.764 3,000 – Cal EPA PPRTV 0 No 1,2,4-Trichlorobenzene 0.599 0.423 0.423 ND ND 5 (PM2.5) – TCEQ Interim Long term ESL 0 No Dibromochloromethane 0.310 0.219 0.219 ND ND 2 – TCEQ Long term ESL 0 No Tetrachloroethene (PERC) 0.278 0.196 0.196 0.203 0.203 3.8 – ATSDR CREG 0 No n-Heptane 0.169 0.280 0.317 0.164 1.004 350 – TCEQ Interim Long-term AMCV 0 No cis-1,2-Dichloroethene 0.172 0.122 0.122 ND ND Not available Insufficient data - trans-1,2-Dichloroethene 0.175 0.123 0.123 ND ND 793 – TCEQ Long term ESL 0 No 2-Methoxy-2-methylpropane (MTBE) 0.183 0.129 0.129 ND ND 2,500 – ATSDR chronic MRL 0 No 1,3-Dichlorobenzene 0.305 0.216 0.216 ND ND 60 – TCEQ Long term ESL 0 No Carbon tetrachloride 0.272 0.600 0.615 0.440 0.723 0.17 – ATSDR CREG 71 Yes+ 2-Hexanone 0.279 0.205 0.214 0.283 0.524 30 – EPA RfC 0 No 1-Ethyl-4-methylbenzene 0.228 0.247 0.275 0.172 0.811 125 – TCEQ Interim Long-term AMCV 0 No Acetone 0.245 22.612 28.374 2.475 119.426 31,000 – ATSDR chronic MRL 0 No Chloroform 0.181 0.126 0.131 0.093 0.244 0.043 – ATSDR CREG 24 Yes+

66
Chemical Name
Method Detection
Limit (µg/m3)
Mean* (µg/m3)
95UCL (µg/m3)
Min (µg/m3)
Max (µg/m3) Chronic CV (µg/m3)/ Source # samples > CV COPC
Benzene 0.150 0.530 0.608 0.217 2.194 0.13 – ATSDR CREG 69 Yes+ 1,1,1-Trichloroethane 0.244 0.239 0.373 5.007 5.007 5,000 – EPA RfC 0 No Bromomethane 0.197 0.139 0.139 ND ND 19 – ATSDR chronic MRL 0 No Chloromethane 0.107 1.226 1.271 0.617 1.645 100 – ATSDR chronic MRL 0 No Chloroethane 0.151 0.108 0.109 ND ND 10,000 – EPA RfC 0 No Chloroethene 0.162 0.115** 0.115** ND ND 0.11 – ATSDR CREG Insufficient data - Methylene chloride 0.266 0.304 0.341 0.274 1.076 100 – ATSDR CREG 0 No Carbon disulfide 0.475 0.348 0.364 0.352 0.679 930 – ATSDR chronic MRL 0 No Bromoform 0.388 0.274 0.274 ND ND 0.91 – ATSDR CREG 0 No Bromodichloromethane 0.256 0.180 0.182 ND ND 70 – TCEQ Interim Long term ESL 0 No 1,1-Dichloroethane 0.161 0.215 0.218 ND ND 400 – TCEQ Long term ESL 0 No 1,1-Dichloroethene 0.189 0.106 0.107 ND ND 200 – EPA RfC 0 No Trichlorofluoromethane 0.307 1.460 1.504 0.887 1.825 5,600 – TCEQ Interim Long-term AMCV 0 No Dichlorodifluoromethane 0.217 2.777 2.898 0.776 3.430 5,000 – TCEQ Interim Long term ESL 0 No 1,1,2-Trichloro-1,2,2-trifluoroethane 0.418 0.701 0.723 0.536 0.919 3,800 – TCEQ Interim Long term ESL 0 No 1,2-Dichloro-1,1,2,2-tetrafluoroethane 0.336 0.238 0.238 ND ND 7,000 – TCEQ Long term ESL 0 No
1,2-Dichloropropane 0.181 0.128 0.129 0.111 0.111 4 – EPA RfC 0 No 2-Butanone (MEK) 0.266 1.855 2.232 0.398 7.237 5,000 – EPA RfC 0 No 1,1,2-Trichloroethane 0.213 0.151** 0.151** ND ND 0.063 – ATSDR CREG Insufficient data -
Trichloroethylene (TCE) 0.237 0.168 0.168 ND ND 0.24 – ATSDR CREG 0 -
1,1,2,2-Tetrachloroethane 0.296 0.210 0.210 ND ND 7 – TCEQ long-term ESL 0 No Hexachloro-1,3-butadiene 0.498 0.352** 0.352** ND ND 0.045 – ATSDR CREG Insufficient data - o-Xylene 0.178 0.191 0.218 0.091 0.855 140 – TCEQ Interim Long-term AMCV 0 No 1,2-Dichlorobenzene 0.332 0.235 0.235 ND ND 60 – TCEQ Long term ESL 0 No 1,2,4-Trimethylbenzene 0.222 0.400 0.468 0.074 1.282 180 – TCEQ Interim Long-term AMCV 0 No RfC=U.S. EPA Reference Concentration; CREG=ATSDR Cancer Risk Evaluation Guide; MRL=ATSDR minimum risk level; AMCV=Texas Department of Environmental Quality (TCEQ) Air Monitoring Comparison Value; ESL = TCEQ Effects Screening Level; Cal EPA PPRTV= California EPA Provisional Peer Reviewed Toxicity Values. Note: PADOH and ATSDR did not evaluate the basis for the TCEQ AMCVs or ESLs. *PADOH and ATSDR calculated averages for contaminants with non-detects by substituting non-detect values using = Method Detection Limit/square root of 2. ** Average exceeds health-based CV. This occurred because the formula used to calculate averages with non-detect values was = Method Detection Limit /square root of 2. + Indicates contaminants with method detection limits that are higher than the ATSDR CVs. - PADOH and ATSDR cannot evaluate the public health significance of the sampling data either due to low detections, lack of CVs or method detection limits exceeding available CVs.
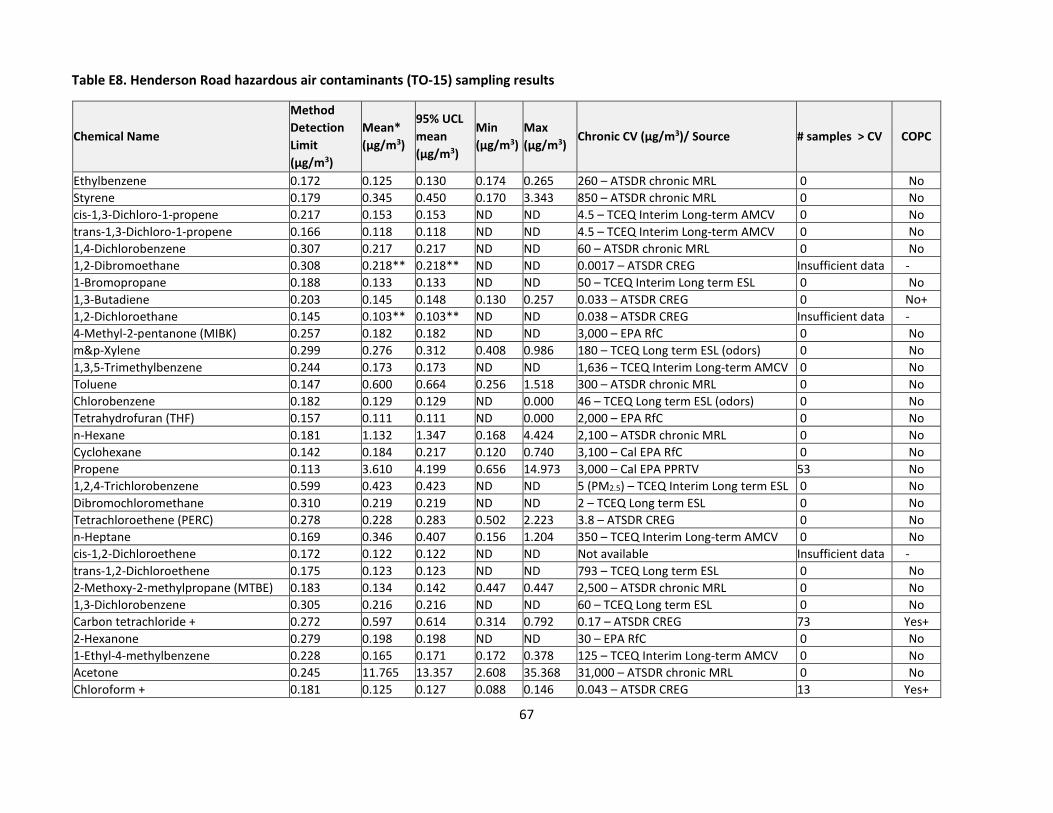
67
Table E8. Henderson Road hazardous air contaminants (TO-15) sampling results
Chemical Name
Method Detection Limit (µg/m3)
Mean* (µg/m3)
95% UCL mean (µg/m3)
Min (µg/m3)
Max (µg/m3)
Chronic CV (µg/m3)/ Source # samples > CV COPC
Ethylbenzene 0.172 0.125 0.130 0.174 0.265 260 – ATSDR chronic MRL 0 No Styrene 0.179 0.345 0.450 0.170 3.343 850 – ATSDR chronic MRL 0 No cis-1,3-Dichloro-1-propene 0.217 0.153 0.153 ND ND 4.5 – TCEQ Interim Long-term AMCV 0 No trans-1,3-Dichloro-1-propene 0.166 0.118 0.118 ND ND 4.5 – TCEQ Interim Long-term AMCV 0 No 1,4-Dichlorobenzene 0.307 0.217 0.217 ND ND 60 – ATSDR chronic MRL 0 No 1,2-Dibromoethane 0.308 0.218** 0.218** ND ND 0.0017 – ATSDR CREG Insufficient data - 1-Bromopropane 0.188 0.133 0.133 ND ND 50 – TCEQ Interim Long term ESL 0 No 1,3-Butadiene 0.203 0.145 0.148 0.130 0.257 0.033 – ATSDR CREG 0 No+ 1,2-Dichloroethane 0.145 0.103** 0.103** ND ND 0.038 – ATSDR CREG Insufficient data - 4-Methyl-2-pentanone (MIBK) 0.257 0.182 0.182 ND ND 3,000 – EPA RfC 0 No m&p-Xylene 0.299 0.276 0.312 0.408 0.986 180 – TCEQ Long term ESL (odors) 0 No 1,3,5-Trimethylbenzene 0.244 0.173 0.173 ND ND 1,636 – TCEQ Interim Long-term AMCV 0 No Toluene 0.147 0.600 0.664 0.256 1.518 300 – ATSDR chronic MRL 0 No Chlorobenzene 0.182 0.129 0.129 ND 0.000 46 – TCEQ Long term ESL (odors) 0 No Tetrahydrofuran (THF) 0.157 0.111 0.111 ND 0.000 2,000 – EPA RfC 0 No n-Hexane 0.181 1.132 1.347 0.168 4.424 2,100 – ATSDR chronic MRL 0 No Cyclohexane 0.142 0.184 0.217 0.120 0.740 3,100 – Cal EPA RfC 0 No Propene 0.113 3.610 4.199 0.656 14.973 3,000 – Cal EPA PPRTV 53 No 1,2,4-Trichlorobenzene 0.599 0.423 0.423 ND ND 5 (PM2.5) – TCEQ Interim Long term ESL 0 No Dibromochloromethane 0.310 0.219 0.219 ND ND 2 – TCEQ Long term ESL 0 No Tetrachloroethene (PERC) 0.278 0.228 0.283 0.502 2.223 3.8 – ATSDR CREG 0 No n-Heptane 0.169 0.346 0.407 0.156 1.204 350 – TCEQ Interim Long-term AMCV 0 No cis-1,2-Dichloroethene 0.172 0.122 0.122 ND ND Not available Insufficient data - trans-1,2-Dichloroethene 0.175 0.123 0.123 ND ND 793 – TCEQ Long term ESL 0 No 2-Methoxy-2-methylpropane (MTBE) 0.183 0.134 0.142 0.447 0.447 2,500 – ATSDR chronic MRL 0 No 1,3-Dichlorobenzene 0.305 0.216 0.216 ND ND 60 – TCEQ Long term ESL 0 No Carbon tetrachloride + 0.272 0.597 0.614 0.314 0.792 0.17 – ATSDR CREG 73 Yes+ 2-Hexanone 0.279 0.198 0.198 ND ND 30 – EPA RfC 0 No 1-Ethyl-4-methylbenzene 0.228 0.165 0.171 0.172 0.378 125 – TCEQ Interim Long-term AMCV 0 No Acetone 0.245 11.765 13.357 2.608 35.368 31,000 – ATSDR chronic MRL 0 No Chloroform + 0.181 0.125 0.127 0.088 0.146 0.043 – ATSDR CREG 13 Yes+

68
Chemical Name
Method Detection Limit (µg/m3)
Mean* (µg/m3)
95% UCL mean (µg/m3)
Min (µg/m3)
Max (µg/m3)
Chronic CV (µg/m3)/ Source # samples > CV COPC
Benzene + 0.150 0.475 0.528 0.192 1.213 0.13 – ATSDR CREG 69 Yes+ 1,1,1-Trichloroethane 0.244 0.173 0.173 ND ND 5,000 – EPA RfC 0 No Bromomethane 0.197 0.139 0.139 ND ND 19 – ATSDR chronic MRL 0 No Chloromethane 0.107 1.203 1.255 0.465 1.691 100 – ATSDR chronic MRL 0 No Chloroethane 0.151 0.107 0.107 ND ND 10,000 – EPA RfC 0 No Chloroethene 0.162 0.115 0.115 ND ND 0.11 – ATSDR CREG Insufficient data - Methylene chloride 0.266 0.380 0.520 0.274 3.931 100 – ATSDR CREG 0 No Carbon disulfide 0.475 0.360 0.397 0.748 1.673 930 – ATSDR chronic MRL 0 No Bromoform 0.388 0.274 0.274 ND ND 0.91 – ATSDR CREG 0 No Bromodichloromethane 0.256 0.181 0.181 ND ND 70 – TCEQ Interim Long term ESL 0 No 1,1-Dichloroethane 0.161 0.114 0.114 ND ND 400 – TCEQ Long term ESL 0 No 1,1-Dichloroethene 0.189 0.133 0.133 ND ND 200 – EPA RfC 0 No Trichlorofluoromethane 0.307 1.419 1.494 0.674 2.041 5,600 – TCEQ Interim Long-term AMCV 0 No Dichlorodifluoromethane 0.217 2.774 2.903 0.707 3.945 5,000 – TCEQ Interim Long term ESL 0 No 1,1,2-Trichloro-1,2,2-trifluoroethane 0.418 0.703 0.728 0.498 0.942 3,800 – TCEQ Interim Long term ESL 0 No 1,2-Dichloro-1,1,2,2-tetrafluoroethane 0.336 0.238 0.238 ND ND 7,000 – TCEQ Long term ESL 0 No 1,2-Dichloropropane 0.181 0.128 0.128 ND ND 4 – EPA RfC 0 No 2-Butanone (MEK) 0.266 1.100 1.262 0.147 3.263 5,000 – EPA RfC 0 No 1,1,2-Trichloroethane 0.213 0.151** 0.151** ND ND 0.063 – ATSDR CREG Insufficient data - Trichloroethylene (TCE) 0.237 0.168 0.168 ND ND 0.24 – ATSDR CREG 0 No 1,1,2,2-Tetrachloroethane 0.296 0.210 0.210 ND ND 7 – TCEQ long-term ESL 0 No Hexachloro-1,3-butadiene 0.498 0.352** 0.352** ND ND 0.045 – ATSDR CREG Insufficient data - o-Xylene 0.178 0.134 0.141 0.195 0.330 140 – TCEQ Interim Long-term AMCV 0 No 1,2-Dichlorobenzene 0.332 0.235 0.235 ND ND 60 – TCEQ Long term ESL 0 No 1,2,4-Trimethylbenzene 0.222 0.183 0.203 0.074 0.767 180 – TCEQ Interim Long-term AMCV 0 No RfC=U.S. EPA Reference Concentration; CREG=ATSDR Cancer Risk Evaluation Guide; MRL=ATSDR minimum risk level; AMCV=Texas Department of Environmental Quality (TCEQ) Air Monitoring Comparison Value; ESL = TCEQ Effects Screening Level; Cal EPA PPRTV= California EPA Provisional Peer Reviewed Toxicity Values. Note: PADOH and ATSDR did not evaluate the basis for the TCEQ AMCVs or ESLs. *PADOH and ATSDR calculated averages for contaminants with non-detects by substituting non-detect values using = Method Detection Limit/square root of 2. ** Average exceeds health-based CV. This occurred because the formula used to calculate averages with non-detect values was = Method Detection Limit /square root of 2. + Indicates contaminants with method detection limits that are higher than the ATSDR CVs. - PADOH and ATSDR cannot evaluate the public health significance of the sampling data either due to low detections, lack of CVs or method detection limits exceeding available CVs.
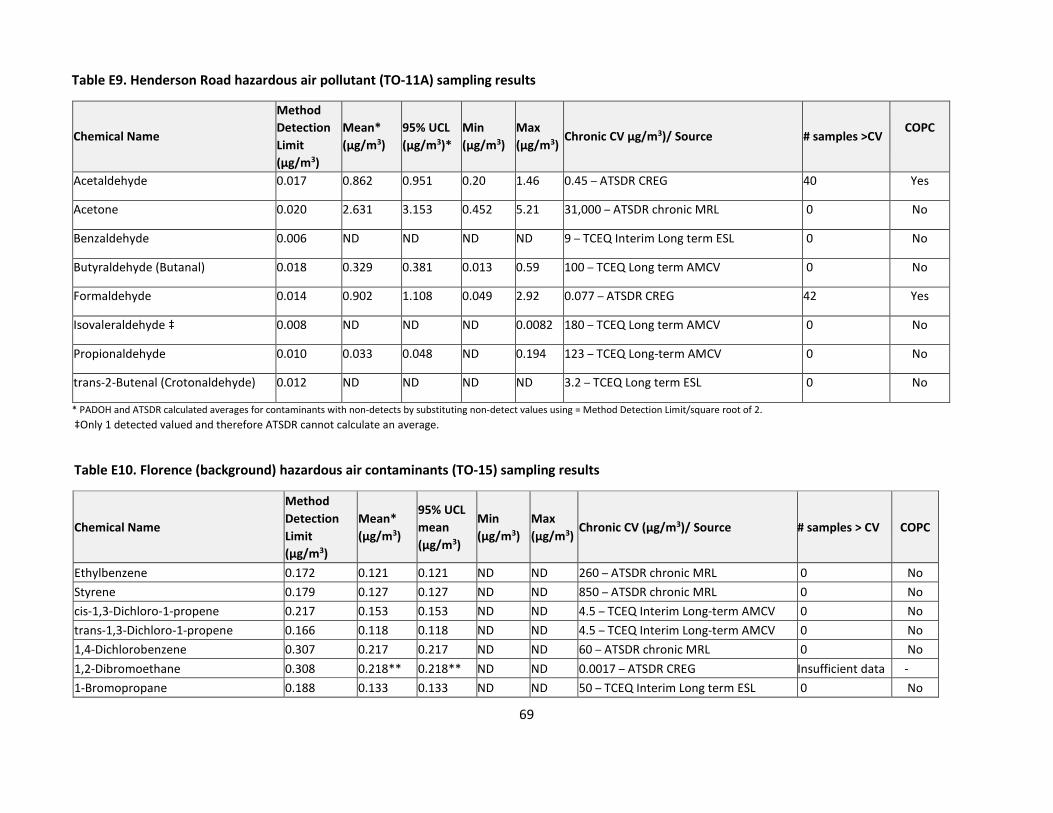
69
Table E9. Henderson Road hazardous air pollutant (TO-11A) sampling results
Chemical Name
Method Detection Limit (µg/m3)
Mean* (µg/m3)
95% UCL (µg/m3)*
Min (µg/m3)
Max (µg/m3)
Chronic CV µg/m3)/ Source # samples >CV COPC
Acetaldehyde 0.017 0.862 0.951 0.20 1.46 0.45 – ATSDR CREG 40 Yes
Acetone 0.020 2.631 3.153 0.452 5.21 31,000 – ATSDR chronic MRL 0 No
Benzaldehyde 0.006 ND ND ND ND 9 – TCEQ Interim Long term ESL 0 No
Butyraldehyde (Butanal) 0.018 0.329 0.381 0.013 0.59 100 – TCEQ Long term AMCV 0 No
Formaldehyde 0.014 0.902 1.108 0.049 2.92 0.077 – ATSDR CREG 42 Yes
Isovaleraldehyde ‡ 0.008 ND ND ND 0.0082 180 – TCEQ Long term AMCV 0 No
Propionaldehyde 0.010 0.033 0.048 ND 0.194 123 – TCEQ Long-term AMCV 0 No
trans-2-Butenal (Crotonaldehyde) 0.012 ND ND ND ND 3.2 – TCEQ Long term ESL 0 No
* PADOH and ATSDR calculated averages for contaminants with non-detects by substituting non-detect values using = Method Detection Limit/square root of 2. ‡Only 1 detected valued and therefore ATSDR cannot calculate an average.
Table E10. Florence (background) hazardous air contaminants (TO-15) sampling results
Chemical Name
Method Detection Limit (µg/m3)
Mean* (µg/m3)
95% UCL mean (µg/m3)
Min (µg/m3)
Max (µg/m3)
Chronic CV (µg/m3)/ Source # samples > CV COPC
Ethylbenzene 0.172 0.121 0.121 ND ND 260 – ATSDR chronic MRL 0 No Styrene 0.179 0.127 0.127 ND ND 850 – ATSDR chronic MRL 0 No cis-1,3-Dichloro-1-propene 0.217 0.153 0.153 ND ND 4.5 – TCEQ Interim Long-term AMCV 0 No trans-1,3-Dichloro-1-propene 0.166 0.118 0.118 ND ND 4.5 – TCEQ Interim Long-term AMCV 0 No 1,4-Dichlorobenzene 0.307 0.217 0.217 ND ND 60 – ATSDR chronic MRL 0 No 1,2-Dibromoethane 0.308 0.218** 0.218** ND ND 0.0017 – ATSDR CREG Insufficient data - 1-Bromopropane 0.188 0.133 0.133 ND ND 50 – TCEQ Interim Long term ESL 0 No
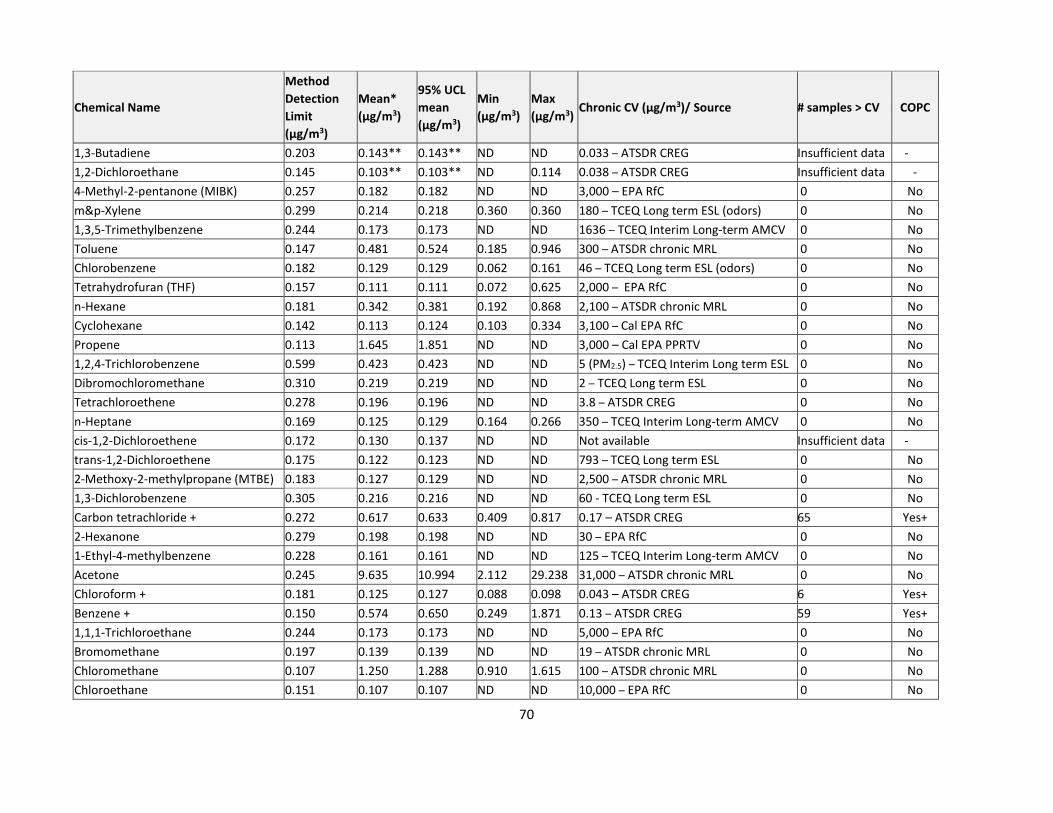
70
Chemical Name
Method Detection Limit (µg/m3)
Mean* (µg/m3)
95% UCL mean (µg/m3)
Min (µg/m3)
Max (µg/m3)
Chronic CV (µg/m3)/ Source # samples > CV COPC
1,3-Butadiene 0.203 0.143** 0.143** ND ND 0.033 – ATSDR CREG Insufficient data - 1,2-Dichloroethane 0.145 0.103** 0.103** ND 0.114 0.038 – ATSDR CREG Insufficient data - 4-Methyl-2-pentanone (MIBK) 0.257 0.182 0.182 ND ND 3,000 – EPA RfC 0 No m&p-Xylene 0.299 0.214 0.218 0.360 0.360 180 – TCEQ Long term ESL (odors) 0 No 1,3,5-Trimethylbenzene 0.244 0.173 0.173 ND ND 1636 – TCEQ Interim Long-term AMCV 0 No Toluene 0.147 0.481 0.524 0.185 0.946 300 – ATSDR chronic MRL 0 No Chlorobenzene 0.182 0.129 0.129 0.062 0.161 46 – TCEQ Long term ESL (odors) 0 No Tetrahydrofuran (THF) 0.157 0.111 0.111 0.072 0.625 2,000 – EPA RfC 0 No n-Hexane 0.181 0.342 0.381 0.192 0.868 2,100 – ATSDR chronic MRL 0 No Cyclohexane 0.142 0.113 0.124 0.103 0.334 3,100 – Cal EPA RfC 0 No Propene 0.113 1.645 1.851 ND ND 3,000 – Cal EPA PPRTV 0 No 1,2,4-Trichlorobenzene 0.599 0.423 0.423 ND ND 5 (PM2.5) – TCEQ Interim Long term ESL 0 No Dibromochloromethane 0.310 0.219 0.219 ND ND 2 – TCEQ Long term ESL 0 No Tetrachloroethene 0.278 0.196 0.196 ND ND 3.8 – ATSDR CREG 0 No n-Heptane 0.169 0.125 0.129 0.164 0.266 350 – TCEQ Interim Long-term AMCV 0 No cis-1,2-Dichloroethene 0.172 0.130 0.137 ND ND Not available Insufficient data - trans-1,2-Dichloroethene 0.175 0.122 0.123 ND ND 793 – TCEQ Long term ESL 0 No 2-Methoxy-2-methylpropane (MTBE) 0.183 0.127 0.129 ND ND 2,500 – ATSDR chronic MRL 0 No 1,3-Dichlorobenzene 0.305 0.216 0.216 ND ND 60 - TCEQ Long term ESL 0 No Carbon tetrachloride + 0.272 0.617 0.633 0.409 0.817 0.17 – ATSDR CREG 65 Yes+ 2-Hexanone 0.279 0.198 0.198 ND ND 30 – EPA RfC 0 No 1-Ethyl-4-methylbenzene 0.228 0.161 0.161 ND ND 125 – TCEQ Interim Long-term AMCV 0 No Acetone 0.245 9.635 10.994 2.112 29.238 31,000 – ATSDR chronic MRL 0 No Chloroform + 0.181 0.125 0.127 0.088 0.098 0.043 – ATSDR CREG 6 Yes+ Benzene + 0.150 0.574 0.650 0.249 1.871 0.13 – ATSDR CREG 59 Yes+ 1,1,1-Trichloroethane 0.244 0.173 0.173 ND ND 5,000 – EPA RfC 0 No Bromomethane 0.197 0.139 0.139 ND ND 19 – ATSDR chronic MRL 0 No Chloromethane 0.107 1.250 1.288 0.910 1.615 100 – ATSDR chronic MRL 0 No Chloroethane 0.151 0.107 0.107 ND ND 10,000 – EPA RfC 0 No

71
Chemical Name
Method Detection Limit (µg/m3)
Mean* (µg/m3)
95% UCL mean (µg/m3)
Min (µg/m3)
Max (µg/m3)
Chronic CV (µg/m3)/ Source # samples > CV COPC
Chloroethene 0.162 0.115** 0.115** ND ND 0.11 – ATSDR CREG Insufficient data - Methylene chloride 0.266 0.503 0.837 0.274 8.458 100 – ATSDR CREG 0 No Carbon disulfide 0.475 0.348 0.372 0.352 1.119 930 – ATSDR chronic MRL 0 No Bromoform 0.388 0.274 0.274 ND ND 0.91 – ATSDR CREG 0 Yes Bromodichloromethane 0.256 0.181 0.181 ND ND 70 – TCEQ Interim Long term ESL 0 No 1,1-Dichloroethane 0.161 0.114 0.114 ND ND 400 – TCEQ Long term ESL 0 No 1,1-Dichloroethene 0.189 0.133 0.133 ND ND 200 – EPA RfC 0 No Trichlorofluoromethane 0.307 1.501 1.538 0.960 1.836 5,600 – TCEQ Interim Long-term AMCV 0 No Dichlorodifluoromethane 0.217 2.896 2.990 0.900 3.529 5,000 – TCEQ Interim Long term ESL 0 No 1,1,2-Trichloro-1,2,2-trifluoroethane 0.418 0.706 0.723 0.575 0.843 3,800 – TCEQ Interim Long term ESL 0 No 1,2-Dichloro-1,1,2,2-tetrafluoroethane 0.336 0.238 0.238 ND ND 7,000 – TCEQ Long term ESL 0 No 1,2-Dichloropropane 0.181 0.128 0.128 ND ND 4 – EPA RfC 0 No 2-Butanone (MEK) 0.266 1.146 1.279 0.280 3.148 5,000 – EPA RfC 0 No 1,1,2-Trichloroethane 0.213 0.151** 0.151** ND ND 0.063 – ATSDR CREG Insufficient data - Trichloroethylene (TCE) 0.237 0.168 0.168 ND ND 0.24 – ATSDR CREG 0 No 1,1,2,2-Tetrachloroethane 0.296 0.210 0.210 ND ND 7 – TCEQ long-term ESL 0 No Hexachloro-1,3-butadiene 0.498 0.352 0.352 ND ND 0.045 – ATSDR CREG Insufficient data - o-Xylene 0.178 0.126 0.126 ND ND 140 – TCEQ Interim Long-term AMCV 0 No 1,2-Dichlorobenzene 0.332 0.235 0.235 ND ND 60 – TCEQ Long term ESL 0 No 1,2,4-Trimethylbenzene 0.222 0.157 0.157 ND ND 180 – TCEQ Interim Long-term AMCV 0 No RfC=U.S. EPA Reference Concentration; CREG=ATSDR Cancer Risk Evaluation Guide; MRL=ATSDR minimum risk level; AMCV=Texas Department of Environmental Quality (TCEQ) Air Monitoring Comparison Value; ESL = TCEQ Effects Screening Level; Cal EPA PPRTV= California EPA Provisional Peer Reviewed Toxicity Values. Note: PADOH and ATSDR did not evaluate the basis for the TCEQ AMCVs or ESLs. *PADOH and ATSDR calculated averages for contaminants with non-detects by substituting non-detect values using = Method Detection Limit/square root of 2. ** Average exceeds health-based CV. This occurred because the formula used to calculate averages with non-detect values was = Method Detection Limit /square root of 2. + Indicates contaminants with method detection limits that are higher than the ATSDR CVs. ‡ Too few detections to calculate an average value
- PADOH and ATSDR cannot evaluate the public health significance of the sampling data either due to low detections, lack of CVs or method detection limits exceeding available CVs.

72
Table E11. Hazard Index for non-cancer evaluation
Chemical RfC
Benzene 9 µg/m3
Formaldehyde 9.6 µg/m3
Carbon Tetrachloride 190 µg/m3
Chloroform 98 µg/m3
Acetaldehyde 9.8 µg/m3
Hazard Index** Location 95 UCL
(µg/m3) HQ* 95UCL
(µg/m3) HQ* 95UCL
(µg/m3) HQ* 95UCL
(µg/m3) HQ* 95UCL
(µg/m3) HQ*
Henderson Road 0.53 0.06 1.11 0.12 0.61 0.003 0.13 0.001 0.95 0.10 0.284 Jaspen Way 0.61 0.06 No data NA 0.61 0.003 0.13 0.001 No data NA 0.064 Meddings Road 0.67 0.07 4.39 0.45 0.61 0.003 0.13 0.001 1.59 0.18 0.704 Welsh Road 0.81 0.08 No data NA 0.61 0.003 0.13 0.001 No data NA 0.084 *HQ = Hazard Quotient = 95% Upper Confidence Limit (UCL)/ EPA Reference Concentration (RfC) ** Hazard index = sum of hazard quotients for each air monitoring location; RfC = EPA reference concentration; NA = Not Available Hazard index (HI) example using Henderson Road data: HI = (Benzene 95UCL/ RfC) + (formaldehyde 95UCL/ RfC) + (carbon tetrachloride 95UCL/ RfC) + (chloroform 95UCL/ RfC) + (acetaldehyde 95UCL/ RfC) HI = (0.53/9) + (1.11/9.6) + (0.61/190) + (0.13/98) + (0.95/9.8) HI = 0.06 + 0.12 + 0.003 + 0.001 + 0.10 HI = 0.284

73
Table E12. Calculation table for cancer risk evaluation
Chemicals ATSDR CREG (µg/m3) Locations EPA IUR
(µg/m3)-1 95UCL
(µg/m3) Lifetime Excess Cancer Risk*
Acetaldehyde 0.45 Henderson Rd. Meddings Rd. 2.2x10⁻⁶ 0.95
1.59 2.1 x10⁻⁶ 3.5 x10⁻⁶
Benzene 0.13
Henderson Rd. Jaspen Way Meddings Rd. Welsh Rd.
7.8x10⁻⁶
0.53 0.61 0.67 0.81
4.1x10⁻⁶
4.8x10⁻⁶ 5.2x10⁻⁶ 6.3x10⁻⁶
Carbon tetrachloride 0.17 All monitoring locations 6x10⁻⁶ 0.61 3.7x10⁻⁶
Chloroform 0.043 All monitoring locations 2.3x10⁻⁵ 0.13 3x10⁻⁶
Formaldehyde 0.077 Henderson Rd. Meddings Rd. 1.3x10⁻⁵ 1.11
4.39 1.4x10⁻⁵ 5.7x10⁻⁵
EPA IUR= Inhalation Unit Risk; MRL= ATSDR cancer risk evaluation guideline set at an excess cancer risk of one in a million (10-6); 95UCL = 95th percentile upper confidence limit of the arithmetic mean air concentration *Cancer Risk = EPA Inhalation Unit Risk (IUR) * 95UCL Example of cancer risk calculation for formaldehyde at Henderson Road: Cancer risk = 0.000023 (µg/m3)-1 x 0.13 µg/m3 = 0.0000029 or 3x10⁻⁶

74
Table E13. Summary of air contaminants that were not detected but have method detection limits (MDL) above health-based comparison values in Washington County, Pennsylvania (2012-2013) (µg/m3)
Air contaminants Method Detection
Limit (MDL) U.S. Ambient Air Concentration Chronic Comparison Value
1,2-Dibromoethane 0.308 0.00012-0.0028261
(range) 0.0017 – ATSDR CREG
1,2-Dichloroethane (1,2-DCA) 0.145 0.0492 (median) 0.038 – ATSDR CREG Hexachloro-1,3-butadiene 0.498 0.38393 (mean) 0.045 – ATSDR CREG 1,3-Butadiene 0.203 0.644 (mean) 0.033 – ATSDR CREG 1,1,2-Trichloroethane 0.213 05 0.063 – ATSDR CREG
µg/m3= micrograms per cubic meter; ATSDR CREG=Agency for Toxic Substances Disease Registry Cancer Risk Evaluation Guide 1 https://ntp.niehs.nih.gov/ntp/roc/content/profiles/dibromoethane.pdf; https://www.atsdr.cdc.gov/toxprofiles/tp37-c5.pdf 2 https://www.atsdr.cdc.gov/toxprofiles/tp38-c6.pdf 3 https://toxnet.nlm.nih.gov/cgi-bin/sis/search/a?dbs+hsdb:@term+@DOCNO+2870 4 https://www.atsdr.cdc.gov/toxprofiles/tp28-c6.pdf 5 https://www.atsdr.cdc.gov/toxprofiles/tp148.pdf

75
Appendix F Chemical-Specific Health Effects and Exposure Evaluation Information
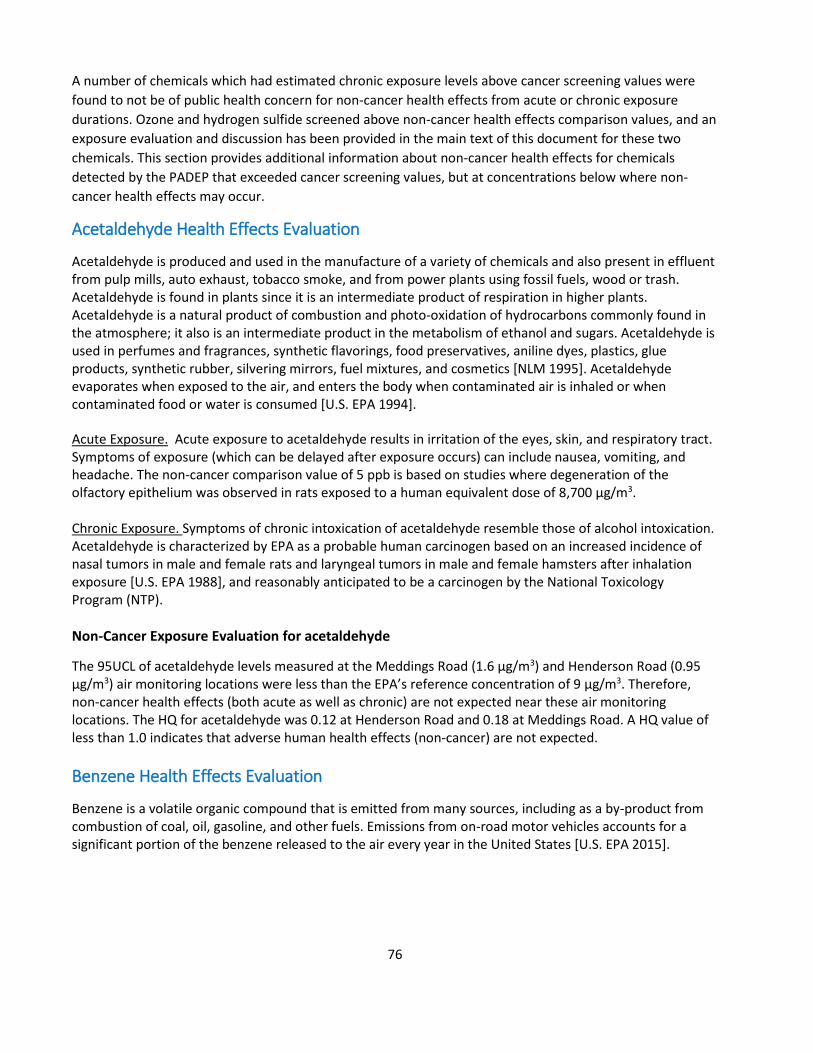
76
A number of chemicals which had estimated chronic exposure levels above cancer screening values were found to not be of public health concern for non-cancer health effects from acute or chronic exposure durations. Ozone and hydrogen sulfide screened above non-cancer health effects comparison values, and an exposure evaluation and discussion has been provided in the main text of this document for these two chemicals. This section provides additional information about non-cancer health effects for chemicals detected by the PADEP that exceeded cancer screening values, but at concentrations below where non-cancer health effects may occur.
Acetaldehyde Health Effects Evaluation
Acetaldehyde is produced and used in the manufacture of a variety of chemicals and also present in effluent from pulp mills, auto exhaust, tobacco smoke, and from power plants using fossil fuels, wood or trash. Acetaldehyde is found in plants since it is an intermediate product of respiration in higher plants. Acetaldehyde is a natural product of combustion and photo-oxidation of hydrocarbons commonly found in the atmosphere; it also is an intermediate product in the metabolism of ethanol and sugars. Acetaldehyde is used in perfumes and fragrances, synthetic flavorings, food preservatives, aniline dyes, plastics, glue products, synthetic rubber, silvering mirrors, fuel mixtures, and cosmetics [NLM 1995]. Acetaldehyde evaporates when exposed to the air, and enters the body when contaminated air is inhaled or when contaminated food or water is consumed [U.S. EPA 1994]. Acute Exposure. Acute exposure to acetaldehyde results in irritation of the eyes, skin, and respiratory tract. Symptoms of exposure (which can be delayed after exposure occurs) can include nausea, vomiting, and headache. The non-cancer comparison value of 5 ppb is based on studies where degeneration of the olfactory epithelium was observed in rats exposed to a human equivalent dose of 8,700 μg/m3. Chronic Exposure. Symptoms of chronic intoxication of acetaldehyde resemble those of alcohol intoxication. Acetaldehyde is characterized by EPA as a probable human carcinogen based on an increased incidence of nasal tumors in male and female rats and laryngeal tumors in male and female hamsters after inhalation exposure [U.S. EPA 1988], and reasonably anticipated to be a carcinogen by the National Toxicology Program (NTP). Non-Cancer Exposure Evaluation for acetaldehyde
The 95UCL of acetaldehyde levels measured at the Meddings Road (1.6 µg/m3) and Henderson Road (0.95 µg/m3) air monitoring locations were less than the EPA’s reference concentration of 9 μg/m3. Therefore, non-cancer health effects (both acute as well as chronic) are not expected near these air monitoring locations. The HQ for acetaldehyde was 0.12 at Henderson Road and 0.18 at Meddings Road. A HQ value of less than 1.0 indicates that adverse human health effects (non-cancer) are not expected. Benzene Health Effects Evaluation
Benzene is a volatile organic compound that is emitted from many sources, including as a by-product from combustion of coal, oil, gasoline, and other fuels. Emissions from on-road motor vehicles accounts for a significant portion of the benzene released to the air every year in the United States [U.S. EPA 2015].
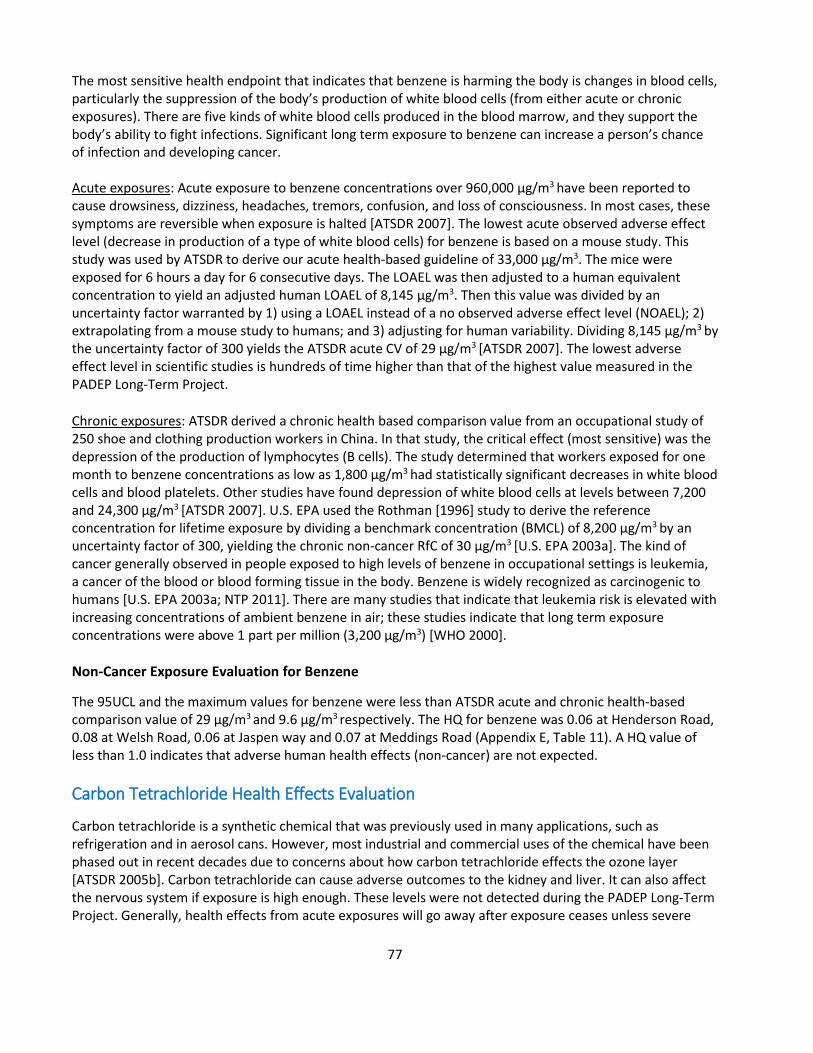
77
The most sensitive health endpoint that indicates that benzene is harming the body is changes in blood cells, particularly the suppression of the body’s production of white blood cells (from either acute or chronic exposures). There are five kinds of white blood cells produced in the blood marrow, and they support the body’s ability to fight infections. Significant long term exposure to benzene can increase a person’s chance of infection and developing cancer. Acute exposures: Acute exposure to benzene concentrations over 960,000 μg/m3 have been reported to cause drowsiness, dizziness, headaches, tremors, confusion, and loss of consciousness. In most cases, these symptoms are reversible when exposure is halted [ATSDR 2007]. The lowest acute observed adverse effect level (decrease in production of a type of white blood cells) for benzene is based on a mouse study. This study was used by ATSDR to derive our acute health-based guideline of 33,000 μg/m3. The mice were exposed for 6 hours a day for 6 consecutive days. The LOAEL was then adjusted to a human equivalent concentration to yield an adjusted human LOAEL of 8,145 μg/m3. Then this value was divided by an uncertainty factor warranted by 1) using a LOAEL instead of a no observed adverse effect level (NOAEL); 2) extrapolating from a mouse study to humans; and 3) adjusting for human variability. Dividing 8,145 μg/m3 by the uncertainty factor of 300 yields the ATSDR acute CV of 29 μg/m3 [ATSDR 2007]. The lowest adverse effect level in scientific studies is hundreds of time higher than that of the highest value measured in the PADEP Long-Term Project. Chronic exposures: ATSDR derived a chronic health based comparison value from an occupational study of 250 shoe and clothing production workers in China. In that study, the critical effect (most sensitive) was the depression of the production of lymphocytes (B cells). The study determined that workers exposed for one month to benzene concentrations as low as 1,800 μg/m3 had statistically significant decreases in white blood cells and blood platelets. Other studies have found depression of white blood cells at levels between 7,200 and 24,300 μg/m3 [ATSDR 2007]. U.S. EPA used the Rothman [1996] study to derive the reference concentration for lifetime exposure by dividing a benchmark concentration (BMCL) of 8,200 μg/m3 by an uncertainty factor of 300, yielding the chronic non-cancer RfC of 30 μg/m3 [U.S. EPA 2003a]. The kind of cancer generally observed in people exposed to high levels of benzene in occupational settings is leukemia, a cancer of the blood or blood forming tissue in the body. Benzene is widely recognized as carcinogenic to humans [U.S. EPA 2003a; NTP 2011]. There are many studies that indicate that leukemia risk is elevated with increasing concentrations of ambient benzene in air; these studies indicate that long term exposure concentrations were above 1 part per million (3,200 μg/m3) [WHO 2000]. Non-Cancer Exposure Evaluation for Benzene
The 95UCL and the maximum values for benzene were less than ATSDR acute and chronic health-based comparison value of 29 μg/m3 and 9.6 μg/m3 respectively. The HQ for benzene was 0.06 at Henderson Road, 0.08 at Welsh Road, 0.06 at Jaspen way and 0.07 at Meddings Road (Appendix E, Table 11). A HQ value of less than 1.0 indicates that adverse human health effects (non-cancer) are not expected. Carbon Tetrachloride Health Effects Evaluation
Carbon tetrachloride is a synthetic chemical that was previously used in many applications, such as refrigeration and in aerosol cans. However, most industrial and commercial uses of the chemical have been phased out in recent decades due to concerns about how carbon tetrachloride effects the ozone layer [ATSDR 2005b]. Carbon tetrachloride can cause adverse outcomes to the kidney and liver. It can also affect the nervous system if exposure is high enough. These levels were not detected during the PADEP Long-Term Project. Generally, health effects from acute exposures will go away after exposure ceases unless severe

78
damage has been done to the organs. Liver damage caused by exposure to carbon tetrachloride has been observed to be worse in people who consume alcohol. Studies in humans have not been able to determine whether or not carbon tetrachloride can cause cancer in humans because usually there has been exposure to other chemicals at the same time. Swallowing or breathing carbon tetrachloride for years caused liver tumors in animals. Mice that breathed carbon tetrachloride also developed tumors of the adrenal gland. Carbon tetrachloride is classified as a probable human carcinogen. Acute exposure: Acute inhalation exposures to carbon tetrachloride have been found to primarily damage the liver (swollen, tender liver, changes in enzyme levels, and jaundice) and kidneys (nephritis, nephrosis, and proteinurea) of humans at levels of exposure greater than 63,000 μg/m3 [U.S. EPA 2010], which is the NOAEL for humans and the LOAEL for rats. Depression of the central nervous system has also been reported. Symptoms of acute exposure in humans may include headache, weakness, lethargy, nausea, and vomiting [U.S. EPA 2010]. No symptoms have been reported at levels as low as those in the PADEP long term air data set; the highest concentration detected (0.80 μg/m3) by PADEP is thousands of times lower than the human acute NOAEL of 63,000 μg/m3, noted above. Chronic exposure: The liver and kidney are the most prominent targets of carbon tetrachloride in sub chronic and chronic inhalation studies of laboratory animals. Liver effects were observed in animals exposed to carbon tetrachloride concentrations as low as 12,600 μg/m3. Kidney damage was reported less frequently at higher concentrations than those causing liver damage. Cancer in humans has not been directly linked to carbon tetrachloride exposures, mostly because occupational exposures are complicated by the presence of significant quantities of other air contaminants [U.S. EPA 2010]. Liver cancer has been reported in laboratory animals exposed chronically to carbon tetrachloride at air concentrations of 157,500 μg/m3 [ATSDR 2005b]. This concentration was used to derive the U.S. EPA cancer slope factor for this chemical. Non-Cancer Exposure Evaluation for Carbon Tetrachloride
The maximum and 95UCL carbon tetrachloride levels are less than the acute TCEQ AMCV screening value of 126 μg/m3. These maximum concentrations were also considerably lower than ATSDR’s intermediate and chronic (190 μg/m3) CV for non-cancer effects. The HQ for carbon tetrachloride at all the air monitoring locations, based on the 95UCL, was 0.003 (Appendix E, Table 11). A HQ value of less than 1.0 indicates that adverse human health effects (non-cancer) are not expected. Chloroform Health Effects Evaluation
Chlorinated water supplies are an important exposure pathway to chloroform for many people. Chloroform is the most common trihalomethane in treated water, and trihalomethanes are a byproduct of water disinfection [U.S. EPA 2001]. People can also be exposed to chloroform in the air. Chloroform can affect the nervous system if exposure is high enough. These levels were not detected during the PADEP Long-Term Project. Generally, health effects from acute exposures will dissipate after exposure ceases unless severe damage has been done to the organs from exposure. Chloroform is an organic chemical that is used to produce other products. Chloroform is emitted to the air by industrial facilities that produce and use the chemical, and also by facilities that manage wastes that contain the chemical. Chloroform may also be released to the air from a large number of sources related to its manufacture and use; it is also formed in the chlorination of drinking water, wastewater, and swimming pools. Pulp and paper mills, hazardous waste sites, and sanitary landfills are also sources of air emissions [ATSDR 1997]. Rats and mice
79
that ate food or drank water with chloroform developed cancer of the liver and kidneys. Chloroform is reasonably anticipated to be a human carcinogen by the National Toxicology Program, Department of Health and Human Services [NTP 2011]. Chloroform was sampled at Meddings Road, Welsh Road, Jaspen Way, and Henderson Road monitoring stations, as well as the COPAMS background station in Florence. At the air monitoring stations, chloroform was detected at the Meddings Road (range of 0.093 to 0.18 μg/m3 and 95UCL of 0.13 μg/m3) Welsh Road, (range of 0.093 to 0.16 μg/m3 and 95UCL of 0.13 μg/m3), Jaspen Way (range of 0.093 to 0.24 μg/m3 and 95UCL of 0.126 μg/m3), and Henderson Road (range of 0.09 to 0.15 μg/m3 and 95UCL of 0.13 μg/m3) air monitoring stations. The background air monitoring location at Florence had similar levels of chloroform with concentrations ranging from 0.09 μg/m3 to 0.10 μg/m3 and a 95UCL of 0.13 μg/m3. Acute exposure: The most recent summary of toxicological research on chloroform is from the World Health Organization [WHO 2004]. The lowest concentration reported to result in measureable adverse health effects is 9,800 μg/m3 in certain strains of rodents. The health effect observed was changes in nasal cavity cell growth. The concentration this health effect was observed at is thousands of times higher than the highest concentration of chloroform measured by PADEP Long-Term monitors. Chloroform generally causes similar health effects in humans and laboratory animals. Chloroform was used in the past as a medical anesthetic, and people were commonly exposed to extremely high doses (12–73 g/m3-or 12,000,000-73,000,000 μg/m3 chloroform). Using chloroform as an anesthetic was discontinued because it was associated with deaths due to heart and breathing failures. Many people who came through the anesthesia experienced a number of neurological and liver symptoms including nausea, vomiting, prostration, jaundice, and coma due to liver dysfunction. WHO [2004] also reports that 1-hour exposure at less than 250,000 μg/m3 has been reported to cause discomfort. Chloroform levels measured by PADEP Long-Term air monitors are substantially lower than those that have been observed to cause acute health effects in scientific studies and are not expected to harm people’s health. Chronic exposure: Chronic studies of laboratory animals show evidence of liver and kidney damage with long term inhalation exposures to high levels of chloroform. The toxicity to the animal varies significantly with the type and sex of the animal. Regardless, no effects were identified in animals with less exposure than 142,000 μg/m3 in these studies [WHO 2004]. There are few chronic studies of human exposures where health outcomes can be attributable only to chloroform, and no reliable human studies evaluating cancer outcomes have been identified. One study reported jaundice in workers exposed for four months after exposure to 80,000–160,000 μg/m3 for less than 4 months while another study reported elevated rates of hepatitis in workers exposed to 10,000–1,000,000 μg/m3 for 1-4 years [WHO 2004]. Non-Cancer Exposure Evaluation for Chloroform
The maximum chloroform concentration was considerably lower than ATSDR’s acute (490 μg/m3) and chronic (98 μg/m3) CVs for non-cancer effects. The HQ for chloroform was 0.001 at all monitoring locations (Appendix C, Table C11). A HQ value of less than 1.0 indicates that adverse human health effects (non-cancer) are not expected.
80
Formaldehyde Health Effects Evaluation
Formaldehyde is an organic compound that emitted from many sources, and small amounts of formaldehyde are naturally produced by plants, animals, and humans. Formaldehyde is also used in the production of fertilizer, paper, plywood, and as a preservative in some foods and many house-hold products. Releases of formaldehyde into the air occur from industries using or manufacturing formaldehyde, wood products (such as particle-board, plywood, and furniture), automobile exhaust, cigarette smoke, paints and varnishes, and carpets and permanent press fabrics. Indoor air typically contains higher levels of formaldehyde than outdoor air [ATSDR 2015]. Formaldehyde was sampled at Meddings (range of 0.69 µg/m3 to 14.2 µg/m3; 95UCL 4.4 µg/m3) and Henderson Road (range of 0.05 to 2.9 µg/m3; 95UCL 1.11 µg/m3) monitoring stations. The TO-11A method was not used at any of the background locations and therefore formaldehyde concentrations are not available for the background air monitoring locations. Acute Exposure. There are numerous human studies of acute inhalation toxicity from formaldehyde (controlled exposure and occupational exposure studies). Several published studies of respiratory function and/or irritation of the nose, eyes, and throat are available involving acute controlled exposure of volunteers, generally at formaldehyde concentrations ≤3 ppm. Controlled exposure human studies have found that short-term inhalation exposures to concentrations ranging from 0.4 to 3 ppm can produce symptoms of mild to moderate irritation of the eyes, nose, and throat. Inconsistent effects have been found in numerous assessments of pulmonary function variables in formaldehyde-exposed workers during workday shifts. Studies of formaldehyde-exposed humans with repeated exposure under occupational, or residential conditions provide confirmatory evidence that formaldehyde can be irritating to the upper respiratory tract [ATSDR 2010]. Chronic Exposure. Results from intermediate-duration inhalation studies with animals indicate that the nasal epithelium is the most sensitive target of inhaled formaldehyde [ATSDR 2010]. Some studies of humans exposed repeatedly to formaldehyde in workplace air found more cases of nose and throat cancer than expected. Animal studies of laboratory rats exposed for life to formaldehyde in air found that some rats developed nose cancer. DHHS and IARC have characterized formaldehyde as a human carcinogen based on studies of inhalation exposure in humans and laboratory animals [U.S. DHHS 2014, IARC 2004]. Non-Cancer Exposure Evaluation for Formaldehyde
Acute and chronic inhalation exposure to formaldehyde in humans can result in respiratory symptoms, and eye, nose, and throat irritation. The 95UCL mean formaldehyde concentrations at Meddings Road and Henderson Road were less than the ATSDR acute and chronic health-based comparison values of 49 μg/m3
and 9.8 μg/m3 respectively. Therefore, non-cancer health effects (acute and chronic) are not expected for communities living near the Meddings Road and Henderson Road air monitoring locations. The HQ for formaldehyde was 0.12 at Henderson Road and 0.45 at Meddings Road (Appendix E, Table 11). A HQ value of less than 1.0 indicates that adverse human health effects (non-cancer) are not expected.
Hydrogen Sulfide Health Effects Evaluation
Hydrogen sulfide occurs naturally (e.g., in crude petroleum, natural gas, volcanic gas, and hot springs) and results from bacterial breakdown of organic matter, including human and animal wastes. Some industrial activities can also produce hydrogen sulfide. Humans are exposed through breathing contaminated air or

81
drinking contaminated water. Hydrogen sulfide smells like rotten eggs. People can usually smell hydrogen sulfide at low concentrations in air ranging from 0.70 to 41.80 μg/m3; however, the detection of the odor does not necessary mean that hydrogen sulfide is present at a level that would affect a person’s health [ATSDR 2014]. Children, the elderly, and people with asthma or other breathing problems may be more sensitive to the effects of hydrogen sulfide. Acute Exposure. Short-term exposure to hydrogen sulfide at concentrations over 697,000 μg/m3 have been reported to cause loss of consciousness and can be life threatening. Exposure to lower concentrations of hydrogen sulfide can result in less severe neurological and respiratory effects. Reported neurological effects include loss of coordination, poor memory, hallucinations, personality changes, and anosmia (loss of sense of smell); the respiratory effects include nasal symptoms, sore throat, cough, and dyspnea. Impaired lung function has also been observed in asthmatics acutely exposed to 2,788 μg/m3 (2 ppm) hydrogen sulfide [ATSDR 2016b]. The lowest acute observed adverse effect level for hydrogen sulfide in a human study used by ATSDR to derive our draft acute health-based guideline was 2,788 μg/m3, and was based on decreases in respiratory function in asthmatics exposed to hydrogen sulfide for 30 minutes. This value was then divided by a cumulative uncertainty factor of 27, including 1) a factor of 3 for using a LOAEL instead of a no observed adverse effect level (NOAEL); 2) a factor of 3 for human variability of 3; and 3) a factor of 3 for database deficiencies. Dividing 2,788 μg/m3 by the uncertainty factor of 27 yields the ATSDR acute CV of 98 μg/m3 (70 ppb) [ATSDR 2016b]. Chronic Exposures. Hydrogen sulfide has not been shown to cause cancer in humans, and its possible ability to cause cancer in animals has not been studied thoroughly. It is not classified as a carcinogen. Human data suggest that the respiratory tract and nervous system are most commonly affected by exposure to hydrogen sulfide. Non-Cancer Exposure Evaluation for Hydrogen Sulfide
Acute and chronic inhalation exposure to hydrogen sulfide in humans can result in respiratory symptoms, and eye, nose, and throat irritation. The animal to human converted NOAEL from scientific studies (640 μg/m3) for hydrogen sulfide is much higher than maximum 24-hour average hydrogen sulfide level (47 μg/m3) from the PADEP long-term project. However, at some of the higher levels of hydrogen sulfide detected over the short term, sensitive individuals would have an increased likelihood of experiencing harmful respiratory effects (e.g., asthma exacerbation, breathing difficulty). This is primarily true for active children and adults and people with respiratory diseases, such as asthma. Ozone Health Effects Evaluation
Ozone is commonly found in urban air pollution. Ozone levels are typically highest during the afternoon of the summer months. Ozone forms in air when emissions of nitrogen oxides and volatile organic compounds mix together and react with sunlight. Natural gas operations, mobile sources and numerous other industrial sources contribute to local ozone air quality issues [Gilman et al. 2013]. Ozone can cause the muscles in the airways to constrict, trapping air in the alveoli. This leads to wheezing and shortness of breath. Even at relatively low levels, ozone can cause health effects. Current science on what levels constitute a harmful exposure to ozone is evolving. Scientists advising EPA have concluded that scientific evidence supports a standard within the range of 60-70 ppb (118 to 137 µg/m3) which supported EPA revising the NAAQS ozone standard in 2015 to 70 ppb. New clinical studies published since 2008 provide information clearly showing that ozone at 72 ppb (141 µg/m3) and above can be harmful to healthy exercising adults [U.S. EPA 2014b]. Ozone is not presently classified as a carcinogen. Researchers have

82
questioned whether ozone has the potential to produce changes in airway cells that could result in cancer. However, negative results for cells exposed in rats and the variable findings for cells exposed in culture do not allow firm conclusions to be drawn regarding the carcinogenic effects of ozone [Thomassen DG et al. 2005]. Acute Exposure. Ozone exposure is associated with increased susceptibility to respiratory infections, medication use by persons with asthma, doctor’s visits, and emergency department and hospital admissions for individuals with respiratory disease. Persons with asthma might experience greater and more serious responses to ozone that last longer than responses among people without asthma. Chronic Exposure. Long-term exposure to ozone is likely to be one of many causes of asthma development. In addition, studies show that ozone exposure is likely to cause premature death, especially in people with heart and lung disease. School absenteeism and cardiac-related effects may occur. Repeated exposures over time are important, because the more times people are exposed to ozone, the more likely they will experience serious health effects [U.S. EPA 2014b]. Non-Cancer Exposure Evaluation for Ozone
Scientific studies indicate that breathing air containing ozone at concentrations of 141 µg/m3 or higher (>72 ppb) can reduce lung function and increase respiratory symptoms, thereby aggravating asthma or other respiratory conditions. PADEP monitoring documented ozone concentrations in excess of 141 µg/m3 at each of the monitoring stations (primary, secondary and background). The highest ozone concentration of 165 µg/m3 was detected at both the Florence and the Washington background monitoring locations. As previously noted, these maximum values are consistent with the southwestern Pennsylvania non-attainment designation for 8-hour ozone concentrations. The maximum value of 165 µg/m3 equates to an air quality index (AQI) of 147, which is categorized as “unhealthy for sensitive groups” [U.S. EPA 2017]. An “unhealthy for sensitive groups” designation for ozone indicates that sensitive subpopulations, including children and people with asthma, are at greater risk for adverse health effects. Health effects may include respiratory symptoms and breathing difficulty in active children and adults and people with respiratory disease, such as asthma and chronic obstructive pulmonary disease (COPD). On days when the AQI exceeds 101 (141 µg/m3 or 72 ppb for ozone), sensitive individuals should take precautions, such as limiting prolonged outdoor exertion and other activities which increase exposure to ozone. Fine Particulate Matter Health Effects Evaluation
Particulate matter, or PM, is the term for particles found in the air, including dust, dirt, soot, smoke, and liquid droplets. These solid and liquid particles come in a wide range of sizes [U.S. EPA 2015]. PM2.5 is a fraction of total PM, and refers to particulate matter with an aerodynamic diameter of 2.5 microns or less. Some of these small particles can be suspended in the air for long periods of time. Some particles are large or dark enough to be seen as soot or smoke. Others are so small that individually they can only be detected with an electron microscope [U.S. EPA 2015]. There are natural and manmade sources of particulate matter. Particulate matter is a mixture with physical and chemical qualities that vary by source and location. Common chemical constituents of particulate matter can include sulfates, nitrates, inorganic ions, elemental carbon, metals and polycyclic aromatic hydrocarbons (PAHs). “Primary” emissions sources, or sources that release PM2.5 directly into the air, are responsible for some airborne PM2.5. In addition to primary emission sources, “secondary” particles form in the air from chemical reactions involving precursor gaseous emissions, such as sulfur dioxide, nitrogen oxides, and VOCs. Note that these secondary particles can form at locations far from those emissions sources that released the precursors [U.S. EPA 2009].

83
Mortality, and cardiovascular and respiratory morbidity have been associated with both short- and long-term exposure to PM2.5 [U.S. EPA 2009]. PM2.5 health effect thresholds have not been identified. Therefore, there does not appear to be a safe level of exposure below which no health effects occur. Given that there is a substantial interpersonal variability in PM2.5 exposure and subsequent harmful effects, it is unlikely that any standard or guideline value will lead to complete protection for everyone against all possible adverse health effects [WHO 2006]. Sensitive population subgroups include infants; older adults (65+ years); individuals with asthma, chronic obstructive pulmonary disorder (COPD) or cardiovascular disease; diabetics; individuals with lower socioeconomic status; and, those with certain genetic polymorphisms [U.S. EPA 2009]. The U.S. EPA does not have a formal definition of an unusually sensitive person. However, we know from scientific studies that there is inter-individual variability in responses to exposure to air pollution. Therefore, two people could respond completely different to the same air pollution level. For example, one person with asthma may experience some respiratory discomfort and maybe an asthma attack; whereas, another asthmatic exposed to the same level may not react at all. ATSDR has evaluated the PADEP data set for short-term exposures and the potential for moderate air quality (12.1 to 35.4 μg/m3) to affect all individuals, including unusually sensitive individuals. The intent of this short-term exposure assessment is to advise sensitive persons that they should always be cognizant of how they are feeling outdoors on days in the Moderate AQI Category.
Acute Exposure. Recently-evaluated epidemiologic studies report consistent positive associations between short-term exposure to PM2.5 and respiratory emergency department (ED) visits and hospital admissions for chronic obstructive pulmonary disease (COPD) and respiratory infections. Epidemiologic studies that examined the effect of PM2.5 on cardiovascular ED visits and hospital admissions reported these consistent positive associations (predominantly for ischemic heart disease and congestive heart failure), with the majority of studies reporting increases ranging from 0.5 to 3.4% per 10 μg/m3 increase in PM2.5. These effects were observed in study locations with average 24-hour PM2.5 concentrations ranging from 7-18 μg/m3. Positive associations were also observed for asthma ED visits and hospital admissions for adults and children combined, but effect estimates are imprecise and not consistently positive for children alone. Most studies reported effects in the range of ~1% to 4% increase in respiratory hospital admissions and ED visits and were observed in study locations with mean 24-hour PM2.5 concentrations ranging from 6.1-22 μg/m3. An evaluation of the epidemiologic literature indicates consistent positive associations between short-term exposure to PM2.5 and all-cause, cardiovascular-, and respiratory-related mortality. The evaluation of multicity studies found that consistent and precise risk estimates for all-cause (non-accidental) mortality ranged from 0.29 to 1.21% per 10 μg/m3 increase in PM2.5 at lags of 1 and 0-1 days [U.S. EPA 2009].
Approximately 20% of the days of PM2.5 monitoring in the PADEP project recorded daily averages in the “moderate” range of air quality per the EPA Air Quality Index (AQI) (the moderate category ranges from (12.1 μg/m3 to 35.4 μg/m3). These concentrations of PM2.5 are of concern for unusually sensitive individuals, but are not expected to cause adverse effects for healthy individuals. On days of moderate PM2.5 air quality, respiratory symptoms are possible in unusually sensitive individuals, including possible aggravation of heart or lung disease in some people with cardiopulmonary disease and older adults.
Chronic Exposure. Several health studies have investigated potential health effects resulting from long-term exposure to particulate matter. The WHO reviewed many of these studies such as the American Cancer Society study [Pope et al. 2002] and the Harvard Six-Cities Study [Dockery et al. 1993, HEI 2000], and currently recommends an annual PM2.5 concentration of 10 μg/m3. However, WHO acknowledges this guideline,

84
“represents the lower end of the range over which significant effects on survival were observed in the American Cancer Society’s (ACS) study [Pope et al. 2002]” [WHO 2006]. The guideline also “places significant weight on the long-term exposure studies that use the ACS and the Harvard Six-Cities data” [WHO 2006]. Thresholds (exposure levels where health effects are first seen) are not apparent in these studies [WHO 2006]. The historical average PM2.5 concentration was 18 μg/m3 (range 11.0 - 29.6 μg/m3) in the Six-Cities Study and 20 μg/m3 (range 9.0 – 33.5 μg/m3) in the American Cancer Society (ACS) study [WHO 2006], both of which are above the annual averages evaluated by the PADEP long-term project. In the ACS study, statistical uncertainty in the risk estimates becomes apparent at concentrations of about 13 μg/m3, below which the confidence bounds significantly widen because of the variability in the exposure concentrations. According to the results of the Dockery et al. [1993] study, the risks are similar in the cities with the lowest long-term PM2.5 concentrations (i.e., 11 and 12.5 μg/m3). Increases in risk are apparent in the city with the next lowest long-term PM2.5 average concentration (i.e., 14.9 μg/m3), indicating that when annual mean concentrations are in the range of 11–15 μg/m3, health effects can be expected [WHO 2006].