Health Care Systems - Sri Lanka
42
Migration and Human Resources for Health: Migration and Human Resources for Health: From Awareness to Action From Awareness to Action Health Care Systems Health Care Systems SRI LANKA SRI LANKA 23-24 March 2006, Geneva ILO/IOM/WHO Dr. Sarath Samarage M.B.,B.S.,M.P.H.(USA), M.Sc., M.D.(Com.Med) Director-Organisation Development, Ministry of Health, SRI LANKA.
Transcript of Health Care Systems - Sri Lanka
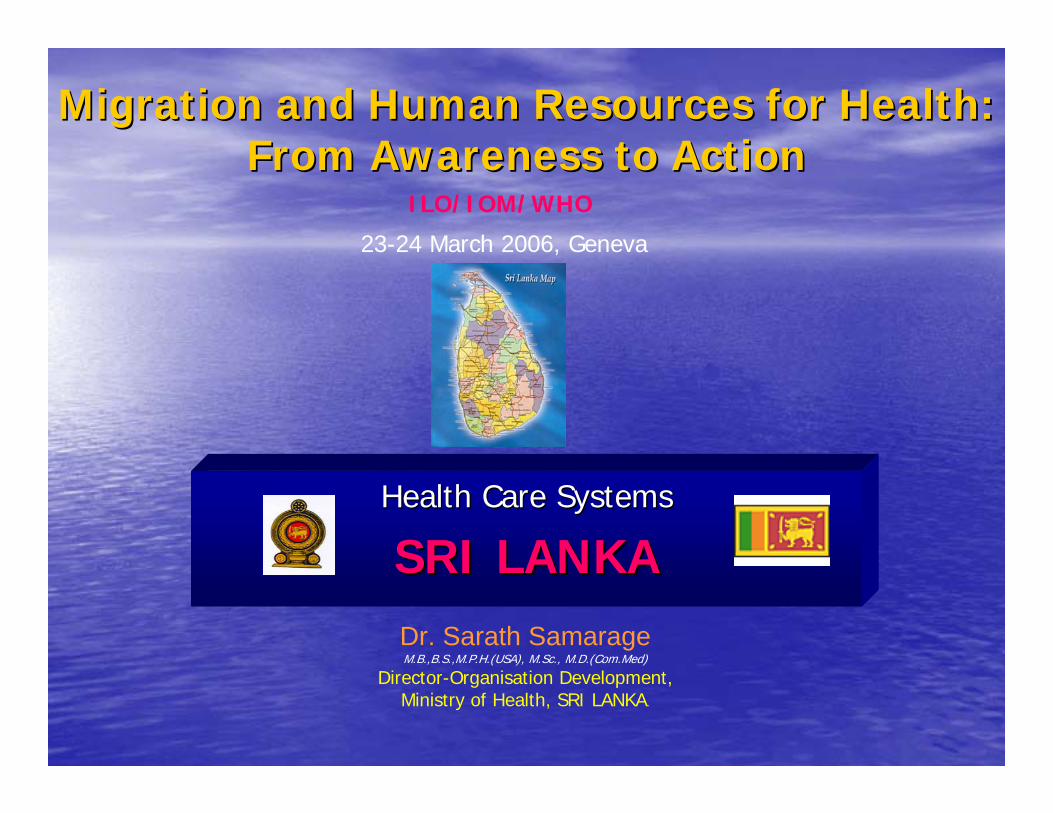
Migration and Human Resources for Health:Migration and Human Resources for Health:From Awareness to ActionFrom Awareness to Action
Health Care SystemsHealth Care Systems
SRI LANKASRI LANKA
23-24 March 2006, Geneva
ILO/IOM/WHO
Dr. Sarath SamarageM.B.,B.S.,M.P.H.(USA), M.Sc., M.D.(Com.Med)
Director-Organisation Development, Ministry of Health, SRI LANKA.
OverviewOverview
• The current situation,
• The challenges and effects on the Sri Lankan health system and
• How the migration of health care workers is currently managed.
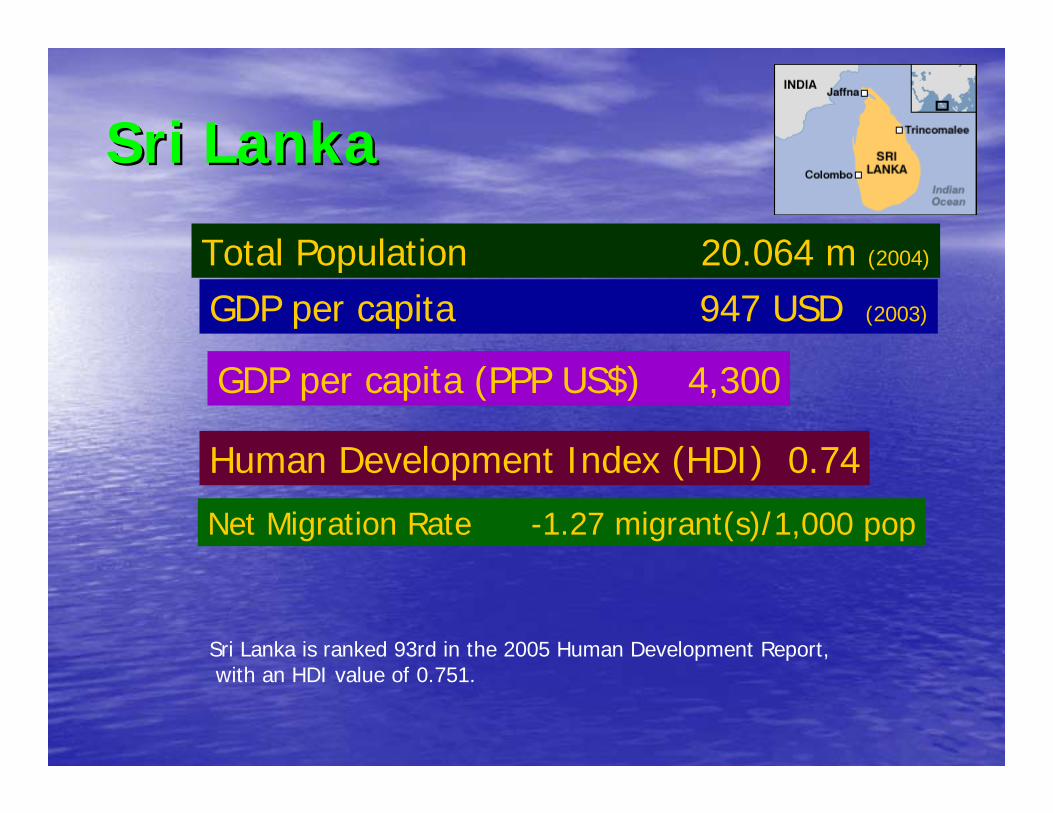
Sri LankaSri Lanka
Total Population 20.064 m (2004)
GDP per capita 947 USD (2003)
GDP per capita (PPP US$) 4,300
Human Development Index (HDI) 0.74
Sri Lanka is ranked 93rd in the 2005 Human Development Report,with an HDI value of 0.751.
Net Migration Rate -1.27 migrant(s)/1,000 pop

•• Life expectancy at birth (years) Life expectancy at birth (years) 7373•• Adult literacy rate Adult literacy rate 92.392.3•• Infant Mortality Rate 14.35 / 1000 LBInfant Mortality Rate 14.35 / 1000 LB• Hospital beds: 3.6 per 1,000 persons• Doctors: 2,300 persons per doctor• Nurses: 12.1 per 10,000 persons
Sri LankaSri Lanka
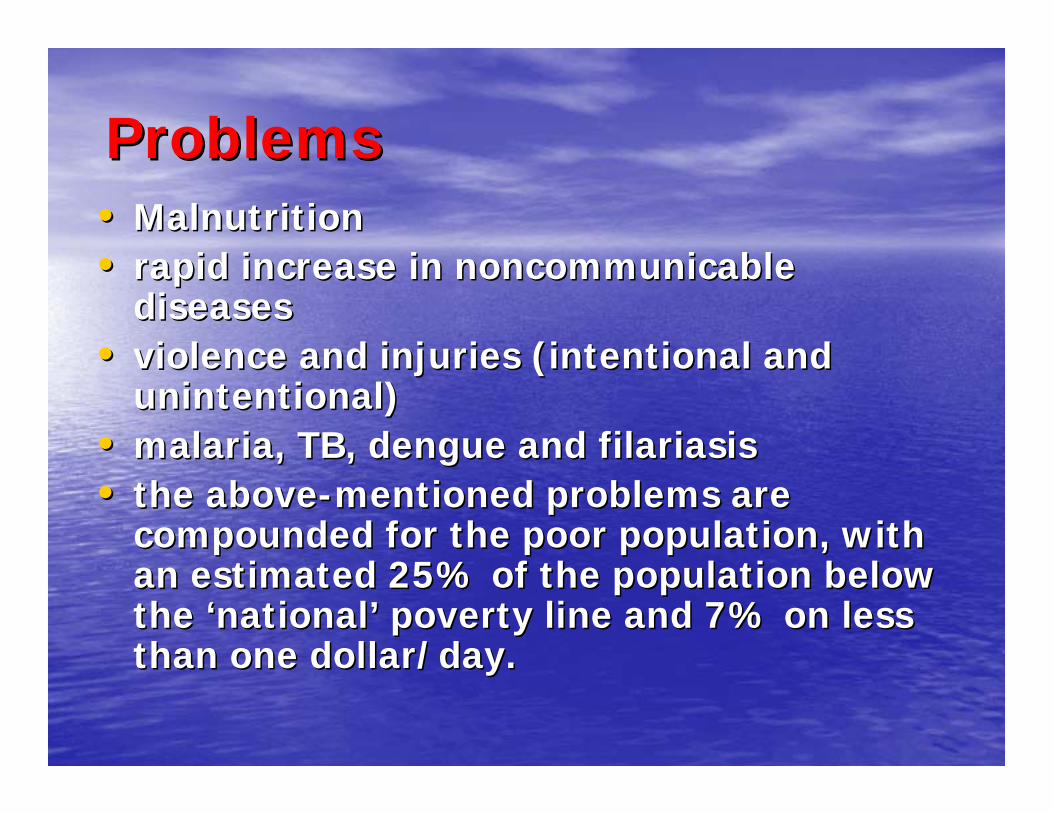
ProblemsProblems•• MalnutritionMalnutrition•• rapid increase in rapid increase in noncommunicablenoncommunicable
diseasesdiseases•• violence and injuries (intentional and violence and injuries (intentional and
unintentional)unintentional)•• malaria, TB, dengue and malaria, TB, dengue and filariasisfilariasis•• the abovethe above--mentioned problems are mentioned problems are
compounded for the poor population, with compounded for the poor population, with an estimated 25% of the population below an estimated 25% of the population below the the ‘‘nationalnational’’ poverty line and 7% on less poverty line and 7% on less than one dollar/day.than one dollar/day.
8.0 6.0 4.0 2.0 0.0 2.0 4.0 6.0 8.0
0-4
5-9
10-14
15-19
20-24
25-29
30-34
35-39
40-44
45-49
50-54
55-59
60-64
65-69
70-74
Over 75
Age
grou
p (y
ears
)
Percentage of population
Male Female
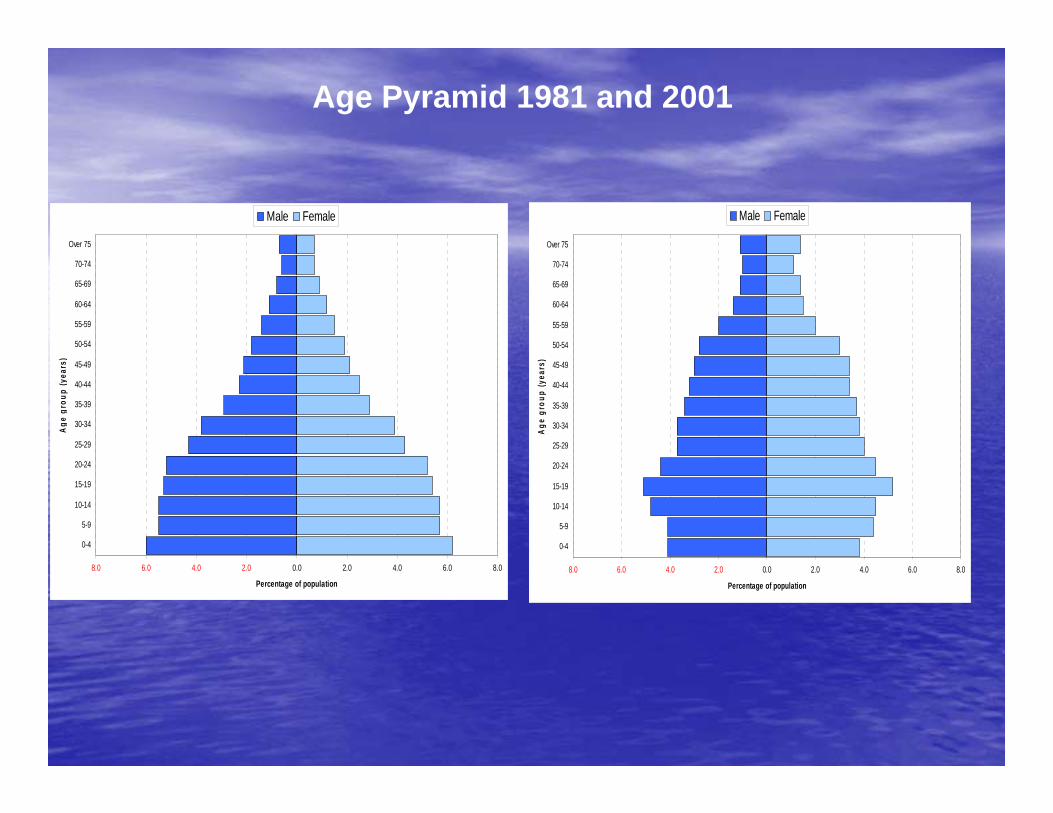
Age Pyramid 1981 and 2001
8.0 6.0 4.0 2.0 0.0 2.0 4.0 6.0 8.0
0-4
5-9
10-14
15-19
20-24
25-29
30-34
35-39
40-44
45-49
50-54
55-59
60-64
65-69
70-74
Over 75
Age
gro
up (y
ears
)
Percentage of population
Male Female
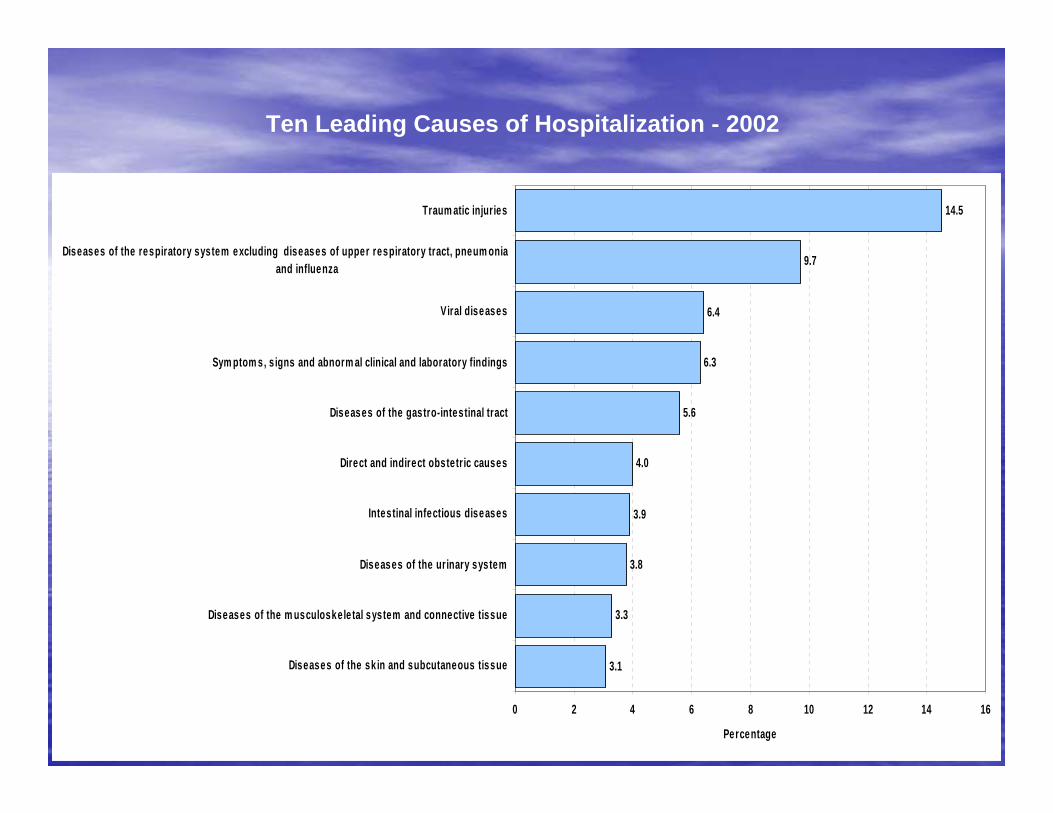
3.1
3.3
3.8
3.9
4.0
5.6
6.3
6.4
9.7
14.5
0 2 4 6 8 10 12 14 16
Diseases of the sk in and subcutaneous tissue
Diseases of the m usculoskele tal system and connective tissue
Diseases of the urinary system
Intestinal infectious diseases
Direct and indirect obstetric causes
Diseases of the gastro-intestinal tract
Sym ptom s, s igns and abnorm al clinical and laboratory findings
Viral diseases
Diseases of the respiratory system excluding diseases of upper respiratory tract, pneum onia and influenza
Traum atic injuries
Percentage
Ten Leading Causes of Hospitalization - 2002

0
1,000
2,000
3,000
4,000
5,000
6,000
7,000
8,000
9,000
10,000
1965 1970 1975 1980 1985 1990 1995 1998 1999 2000 2001 2002
Year
New
Cas
es o
f TB
0
10
20
30
40
50
60
70
Rat
e pe
r 100
,000
pop
ulat
ion
New Cases Rate
New Cases of Tuberculosis 1965 - 2002TB Cases per 100,000 Population
0 - 20
20 - 40
40 - 60
60 - 80
80 - 100
Legend
Ampara
Anuradhapura
Moneragala
Kurunegala
Badulla
Puttalam
Ratnapura
Matale
Galle
Kandy
Polonnaruwa
Mullaitivu
Mannar
Batticaloa
Kegalle
Hambantota
Trincomalee
Kalutara
Matara
GampahaNuwara
Eliya
Kilinochchi
Jaffna
Colombo
37.6
26.6
47.6
50.7
48.1
52.3
21.5
27.8
36.5
30.0
22.1
36.3
44.4
43.0
14.8
20.9
64.2
43.3
39.2
38.4
28.4
25.4
70.5
19.0
84.6Vavuniya
New Cases of Tuberculosis by District - 2002
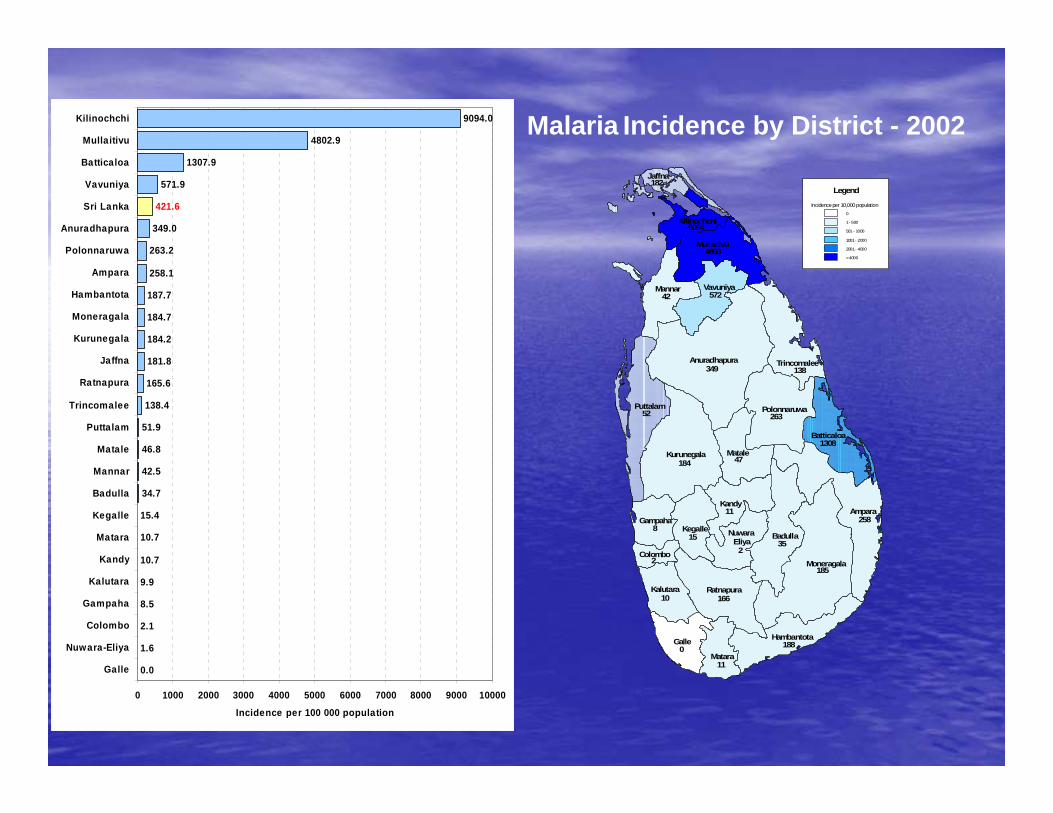
0.0
1.6
2.1
8.5
9.9
10.7
10.7
15.4
34.7
42.5
46.8
51.9
138.4
165.6
181.8
184.2
184.7
187.7
258.1
263.2
349.0
571.9
1307.9
4802.9
9094.0
421.6
0 1000 2000 3000 4000 5000 6000 7000 8000 9000 10000
Galle
Nuwara-Eliya
Colombo
Gampaha
Kalutara
Kandy
Matara
Kegalle
Badulla
Mannar
Matale
Puttalam
Trincomalee
Ratnapura
Jaffna
Kurunegala
Moneragala
Hambantota
Ampara
Polonnaruwa
Anuradhapura
Sri Lanka
Vavuniya
Batticaloa
Mullaitivu
Kilinochchi
Incidence per 100 000 population
Ampara
Anuradhapura
Moneragala
Kurunegala
Badulla
Puttalam
Galle
Ratnapura
Matale
Kandy
Mullaitivu
Polonnaruwa
Mannar
Batticaloa
Kegalle
Hambantota
Vavuniya
Trincomalee
Kalutara
Matara
GampahaNuwara
Eliya
Kilinochchi
Jaffna
Colombo
349
185
184
258
52 263
35
166
188
138
4803
47
1308
10
42
2
11
572
158
11
9094
2
182
0
Incidence per 10,000 population0
1 - 500
501 - 1000
1001 - 2000
2001 - 4000
> 4000
Legend
Malaria Incidence by District - 2002

Sri Lanka Disaster Prone Areas
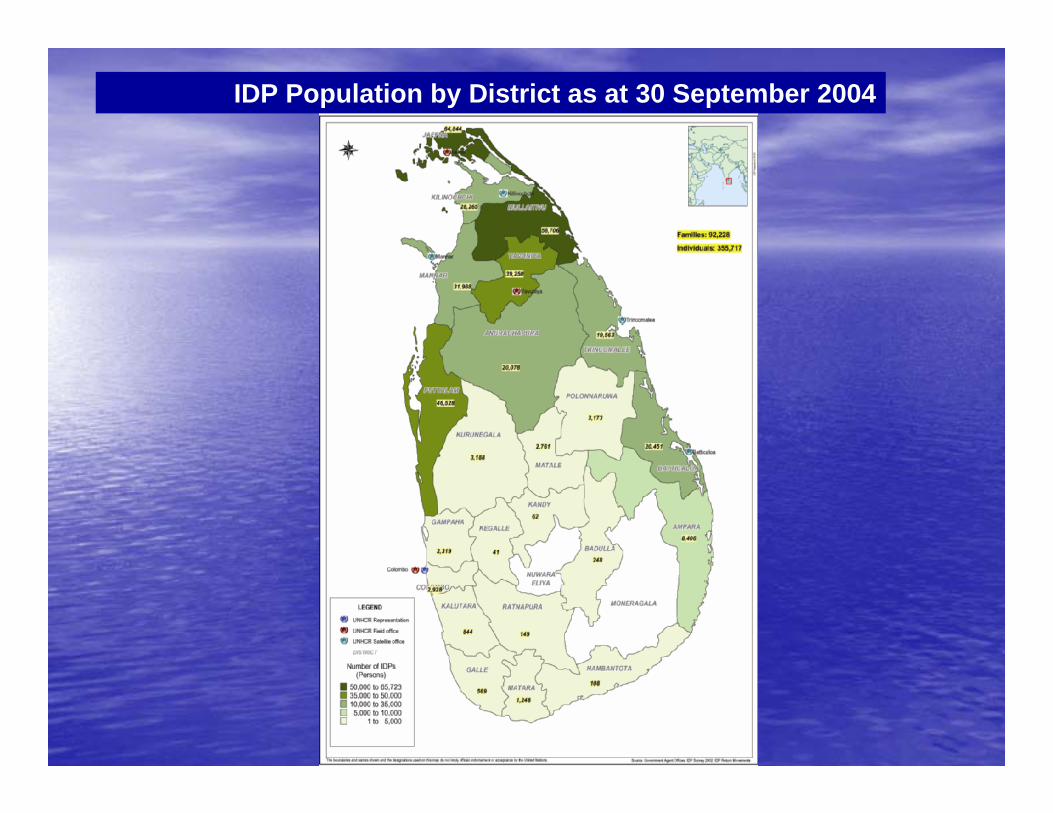
IDP Population by District as at 30 September 2004
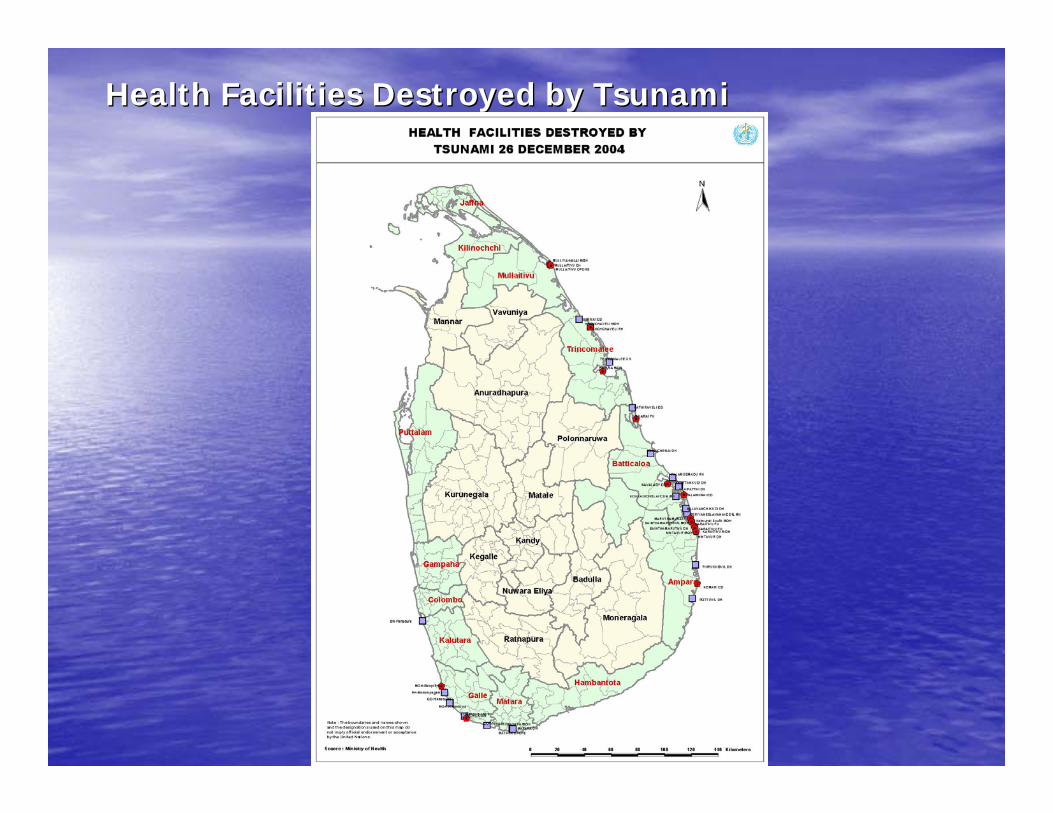
Health Facilities Destroyed by TsunamiHealth Facilities Destroyed by Tsunami

SECTORSSECTORS
++OthersOthers
++++IndigenousIndigenous
++++WesternWestern
PrivatePrivateGovernmentGovernment
0
0.5
1
1.5
2
2.5
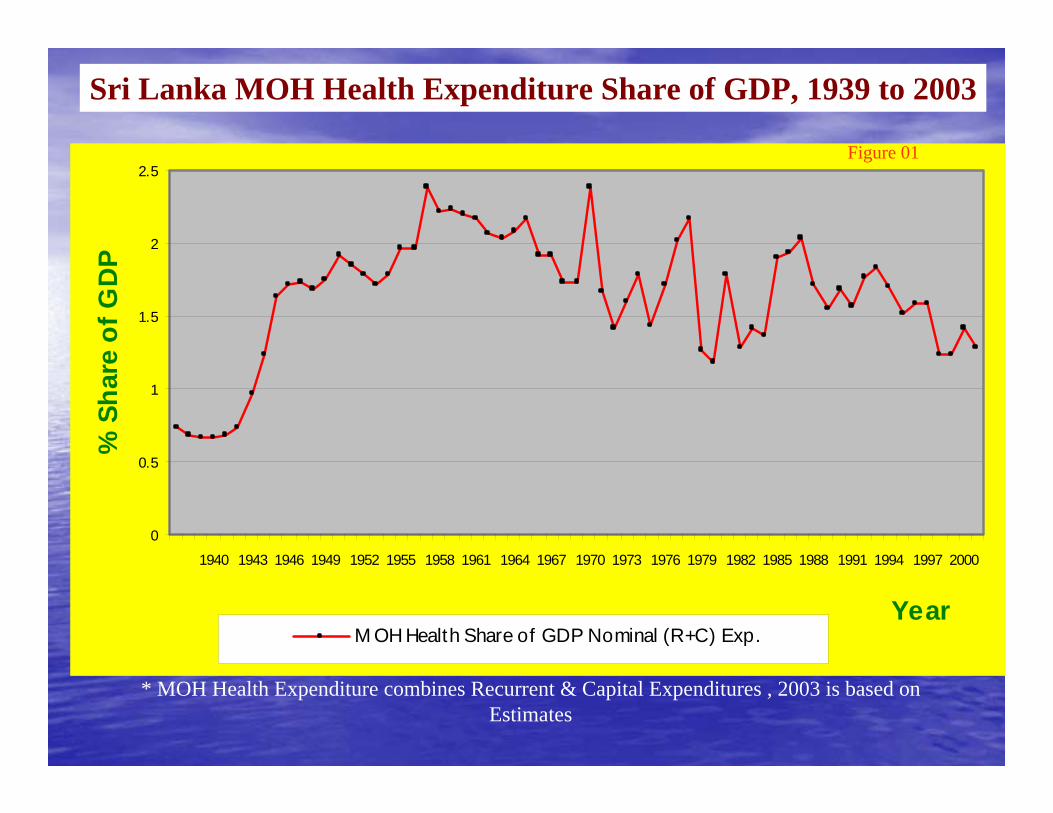
1940 1943 1946 1949 1952 1955 1958 1961 1964 1967 1970 1973 1976 1979 1982 1985 1988 1991 1994 1997 2000
Year
% S
hare
of G
DP
M OH Health Share of GDP Nominal (R+C) Exp.
* MOH Health Expenditure combines Recurrent & Capital Expenditures , 2003 is based on Estimates
Figure 01
Sri Lanka MOH Health Expenditure Share of GDP, 1939 to 2003

0.00
1.00
2.00
3.00
4.00
5.00
6.0019
73
1975
1977
1979
1981
1983
1985
1987
1989
1991
1993
1995
1997
1999
2001
2003
Y earHealth Share of Nominal GDP Educat ion Share of Nominal GDPDefense Share of Nominal GDP
Trends in Sri Lanka Public Expenditure Shares of GDPfor Health, Education and Defence, 1972-2003
Figure 02
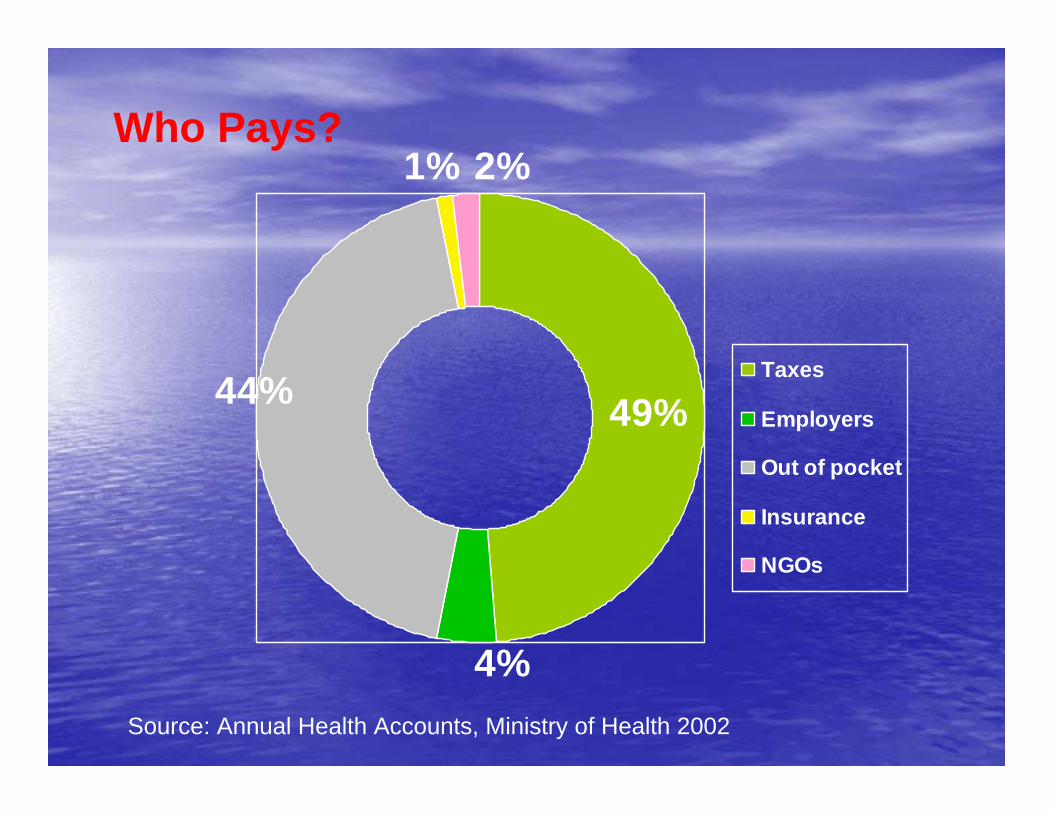
49%44%
4%
1% 2%
Taxes
Employers
Out of pocket
Insurance
NGOs
Who Pays?
Source: Annual Health Accounts, Ministry of Health 2002
Human ResourcesHuman Resources
•• Policy & PlanningPolicy & Planning
Human Resource StrategyHuman Resource Strategy•• There have been several initiatives to develop There have been several initiatives to develop
human resources for health. human resources for health.
•• In the 60s, a task force set up by the Ministry In the 60s, a task force set up by the Ministry of Health designed a national health plan. of Health designed a national health plan.
•• In 1975, a health manpower study was In 1975, a health manpower study was undertaken. undertaken.
•• In the late 1970s and early 1980s, two In the late 1970s and early 1980s, two studies, one on cadre determination of all studies, one on cadre determination of all medical, nursing and paramedical personnel medical, nursing and paramedical personnel (Report of staffing study 1981) and the other (Report of staffing study 1981) and the other on nursing (1977), were undertaken. on nursing (1977), were undertaken.
•• In 1992, a National Health Policy was In 1992, a National Health Policy was initiated. initiated.
•• In 1993, a study was undertaken by the Human In 1993, a study was undertaken by the Human Resource Development Council on Human Resource Development Council on Human Resource Development in the Health Sector.Resource Development in the Health Sector.
•• In 1994, a Perspective Plan for Health In 1994, a Perspective Plan for Health Development in Sri Lanka (1995Development in Sri Lanka (1995--2004) was 2004) was formulated. Their impacts on policy and the formulated. Their impacts on policy and the implemented plan on Human Resource implemented plan on Human Resource Development are not known. Development are not known.
•• The 1993 study found that health manpower The 1993 study found that health manpower planning in Sri Lanka has been episodic and, to a planning in Sri Lanka has been episodic and, to a large extent, limited in scope; health manpower large extent, limited in scope; health manpower development in the private sector has not been development in the private sector has not been given due consideration and the demand pattern given due consideration and the demand pattern for services and the technological changes have for services and the technological changes have not been taken into account.not been taken into account.
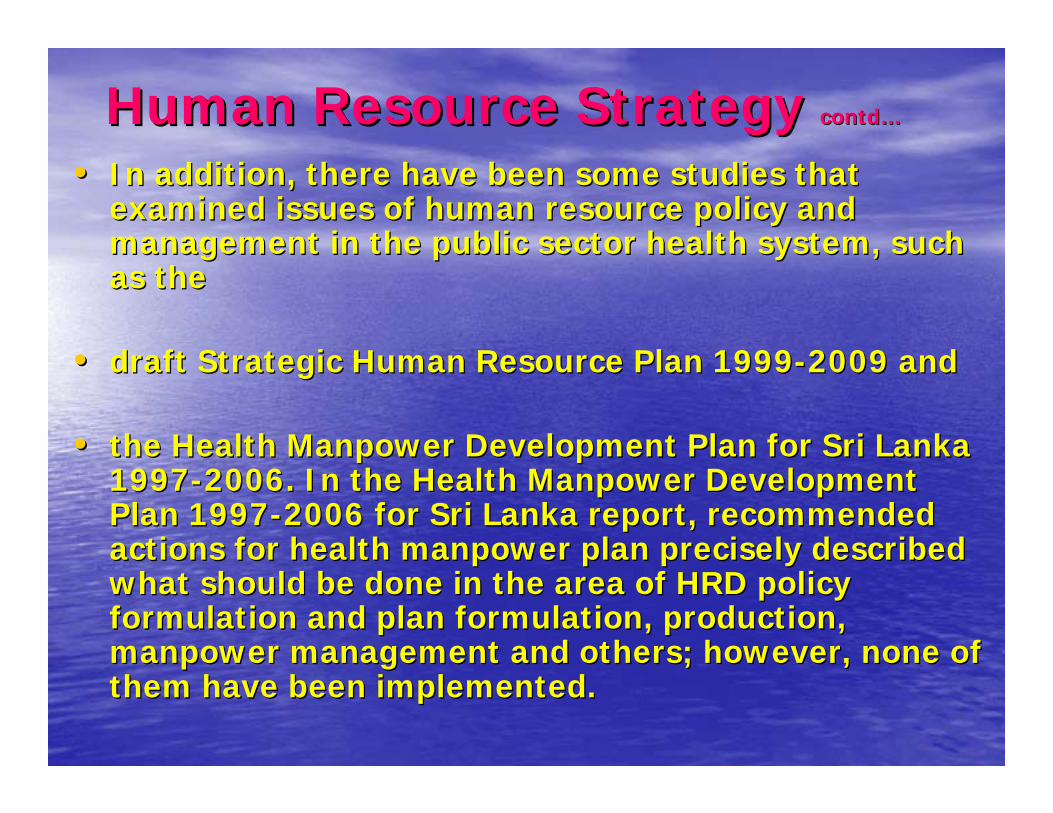
•• In addition, there have been some studies that In addition, there have been some studies that examined issues of human resource policy and examined issues of human resource policy and management in the public sector health system, such management in the public sector health system, such as the as the
•• draft Strategic Human Resource Plan 1999draft Strategic Human Resource Plan 1999--2009 and 2009 and
•• the Health Manpower Development Plan for Sri Lanka the Health Manpower Development Plan for Sri Lanka 19971997--2006. In the Health Manpower Development 2006. In the Health Manpower Development Plan 1997Plan 1997--2006 for Sri Lanka report, recommended 2006 for Sri Lanka report, recommended actions for health manpower plan precisely described actions for health manpower plan precisely described what should be done in the area of HRD policy what should be done in the area of HRD policy formulation and plan formulation, production, formulation and plan formulation, production, manpower management and others; however, none of manpower management and others; however, none of them have been implemented.them have been implemented.
Human Resource Strategy Human Resource Strategy contdcontd……
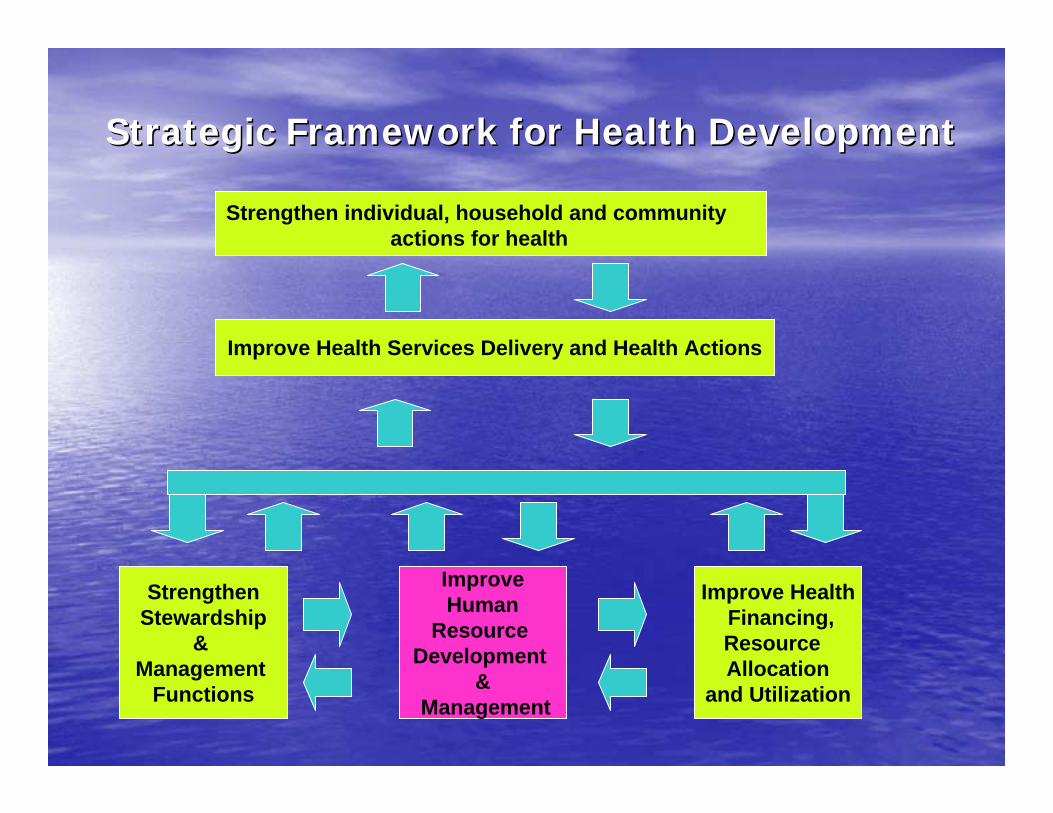
Strategic Framework for Health DevelopmentStrategic Framework for Health Development
Improve Health Services Delivery and Health Actions
StrengthenStewardship
& Management
Functions
ImproveHuman
Resource Development
&Management
Improve HealthFinancing,Resource Allocation
and Utilization
Strengthen individual, household and community actions for health

Health WorkforceHealth Workforce
•• 276 categories of health personnel in 276 categories of health personnel in public sector in Sri Lanka. public sector in Sri Lanka.
•• 21 categories within paramedical 21 categories within paramedical
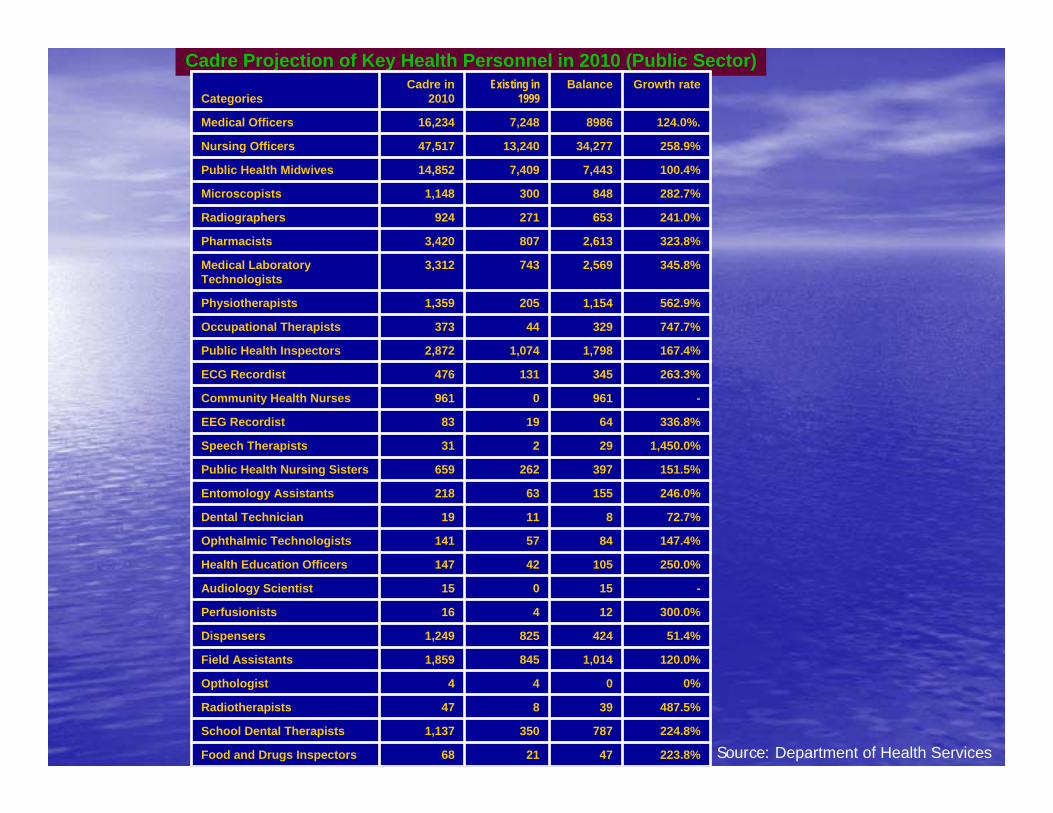
Cadre Projection of Key Health Personnel in 2010 (Public Sector)
223.8%472168Food and Drugs Inspectors
224.8%7873501,137School Dental Therapists
487.5%39847Radiotherapists
0%044Opthologist
120.0%1,0148451,859Field Assistants
51.4%4248251,249Dispensers
300.0%12416Perfusionists
-15015Audiology Scientist
250.0%10542147Health Education Officers
147.4%8457141Ophthalmic Technologists
72.7%81119Dental Technician
246.0%15563218Entomology Assistants
151.5%397262659Public Health Nursing Sisters
1,450.0%29231Speech Therapists
336.8%641983EEG Recordist
-9610961Community Health Nurses
263.3%345131476ECG Recordist
167.4%1,7981,0742,872Public Health Inspectors
747.7%32944373Occupational Therapists
562.9%1,1542051,359Physiotherapists
345.8%2,5697433,312Medical Laboratory Technologists
323.8%2,6138073,420Pharmacists
241.0%653271924Radiographers
282.7%8483001,148Microscopists
100.4%7,4437,40914,852Public Health Midwives
258.9%34,27713,24047,517Nursing Officers
124.0%.89867,24816,234Medical Officers
Growth rateBalanceExisting in 1999
Cadre in 2010Categories
Source: Department of Health Services
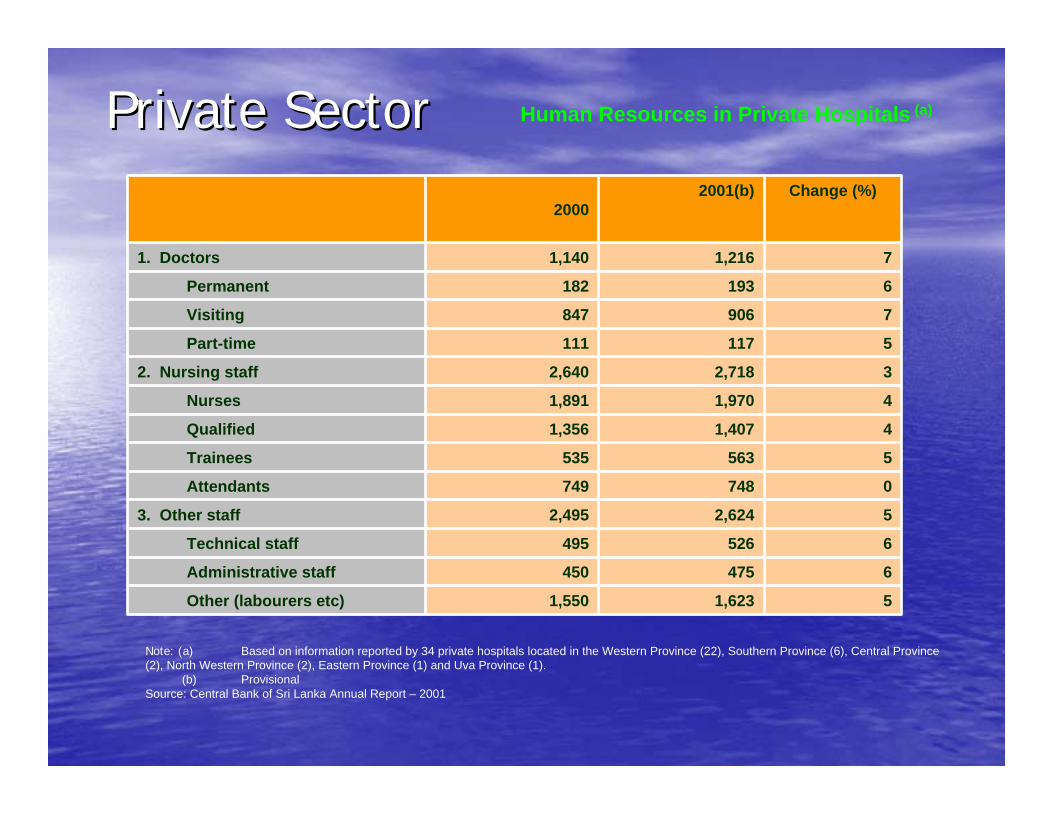
Private SectorPrivate Sector Human Resources in Private Hospitals (a)
51,6231,550Other (labourers etc)
6475450Administrative staff
6526495Technical staff
52,6242,4953. Other staff
0748749Attendants
5563535Trainees
41,4071,356Qualified
41,9701,891Nurses
32,7182,6402. Nursing staff
5117111Part-time
7906847Visiting
6193182Permanent
71,2161,1401. Doctors
Change (%)2001(b)2000
Note: (a) Based on information reported by 34 private hospitals located in the Western Province (22), Southern Province (6), Central Province (2), North Western Province (2), Eastern Province (1) and Uva Province (1).
(b) ProvisionalSource: Central Bank of Sri Lanka Annual Report – 2001
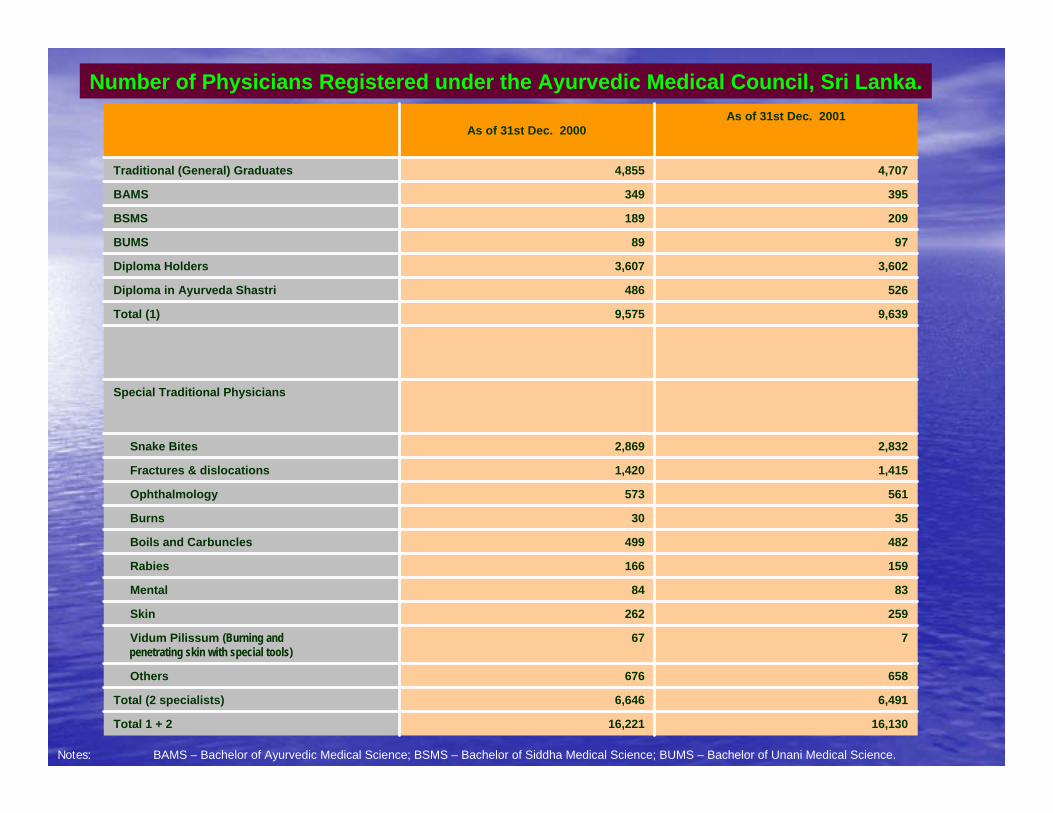
Number of Physicians Registered under the Ayurvedic Medical Council, Sri Lanka.
16,13016,221Total 1 + 2
6,4916,646Total (2 specialists)
658676Others
767Vidum Pilissum (Burning andpenetrating skin with special tools)
259262Skin
8384Mental
159166Rabies
482499Boils and Carbuncles
3530Burns
561573Ophthalmology
1,4151,420Fractures & dislocations
2,8322,869Snake Bites
Special Traditional Physicians
9,6399,575Total (1)
526486Diploma in Ayurveda Shastri
3,6023,607Diploma Holders
9789BUMS
209189BSMS
395349BAMS
4,7074,855Traditional (General) Graduates
As of 31st Dec. 2001As of 31st Dec. 2000
Notes: BAMS – Bachelor of Ayurvedic Medical Science; BSMS – Bachelor of Siddha Medical Science; BUMS – Bachelor of Unani Medical Science.
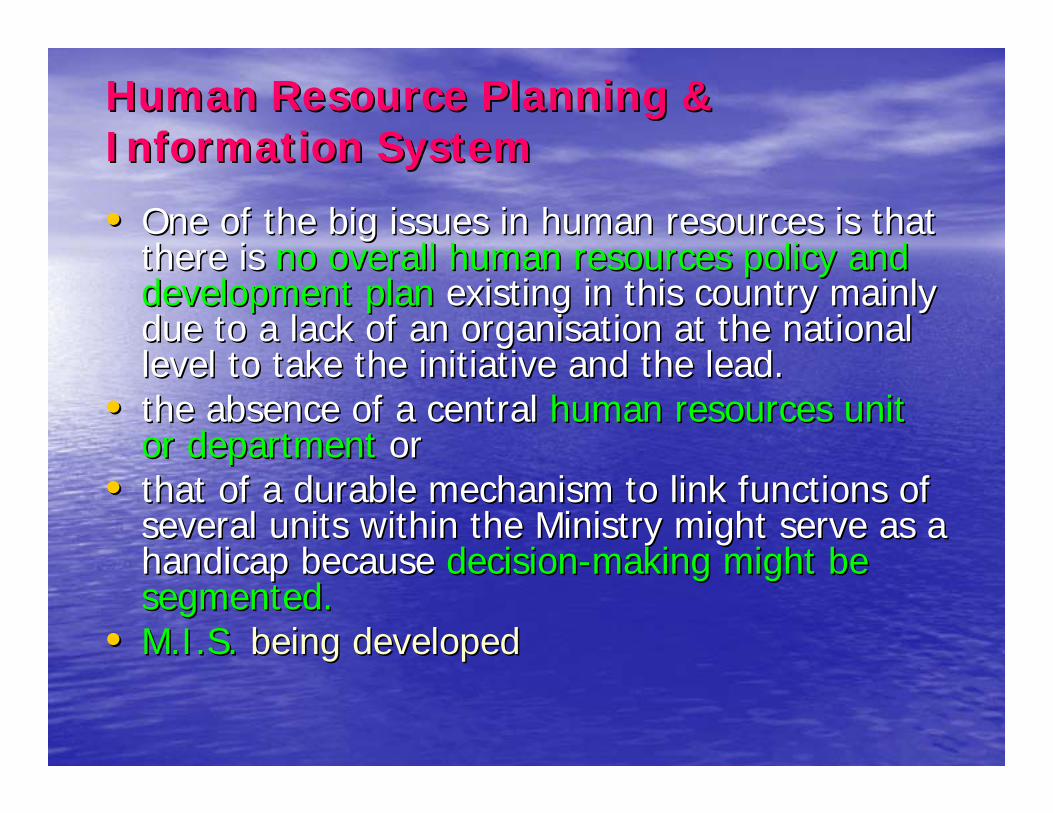
Human Resource Planning & Human Resource Planning & Information SystemInformation System
•• One of the big issues in human resources is that One of the big issues in human resources is that there is there is no overall human resources policy and no overall human resources policy and development plandevelopment plan existing in this country mainly existing in this country mainly due to a lack of an due to a lack of an organisationorganisation at the national at the national level to take the initiative and the lead. level to take the initiative and the lead.
•• the absence of a central the absence of a central human resources unit human resources unit or departmentor department or or
•• that of a durable mechanism to link functions of that of a durable mechanism to link functions of several units within the Ministry might serve as a several units within the Ministry might serve as a handicap because handicap because decisiondecision--making might be making might be segmented. segmented.
•• M.I.S. M.I.S. being developedbeing developed
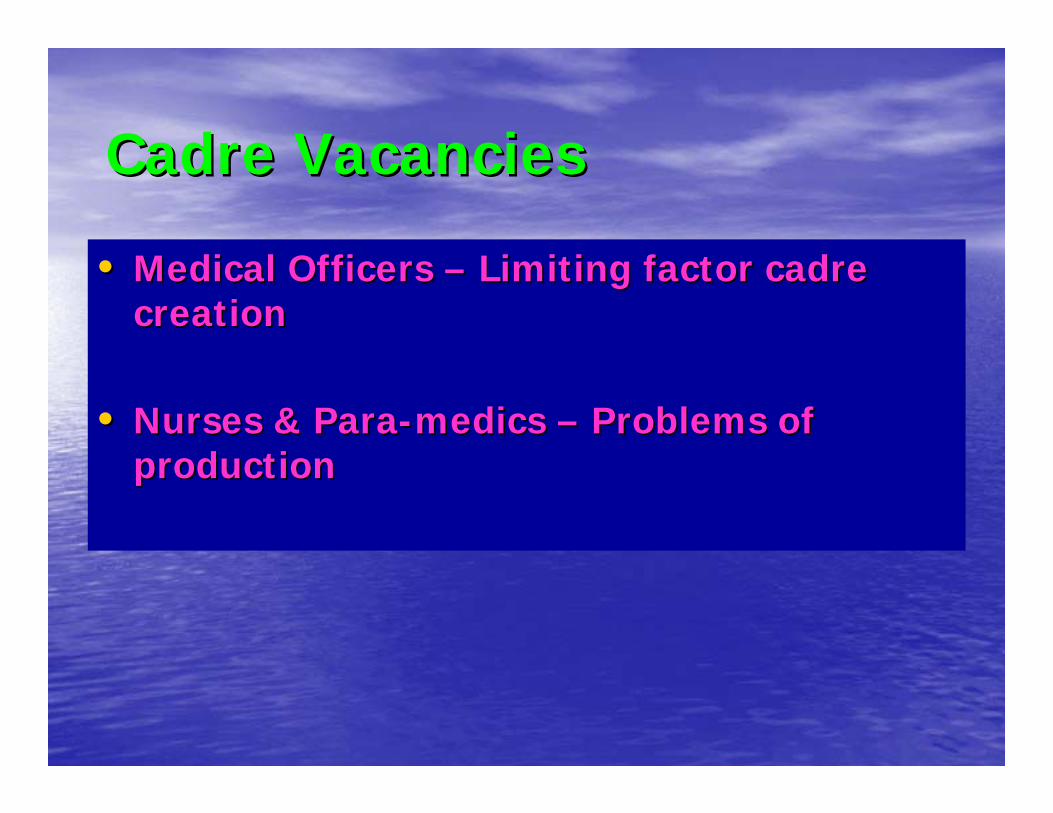
Cadre VacanciesCadre Vacancies
•• Medical Officers Medical Officers –– Limiting factor cadre Limiting factor cadre creationcreation
•• Nurses & ParaNurses & Para--medics medics –– Problems of Problems of productionproduction
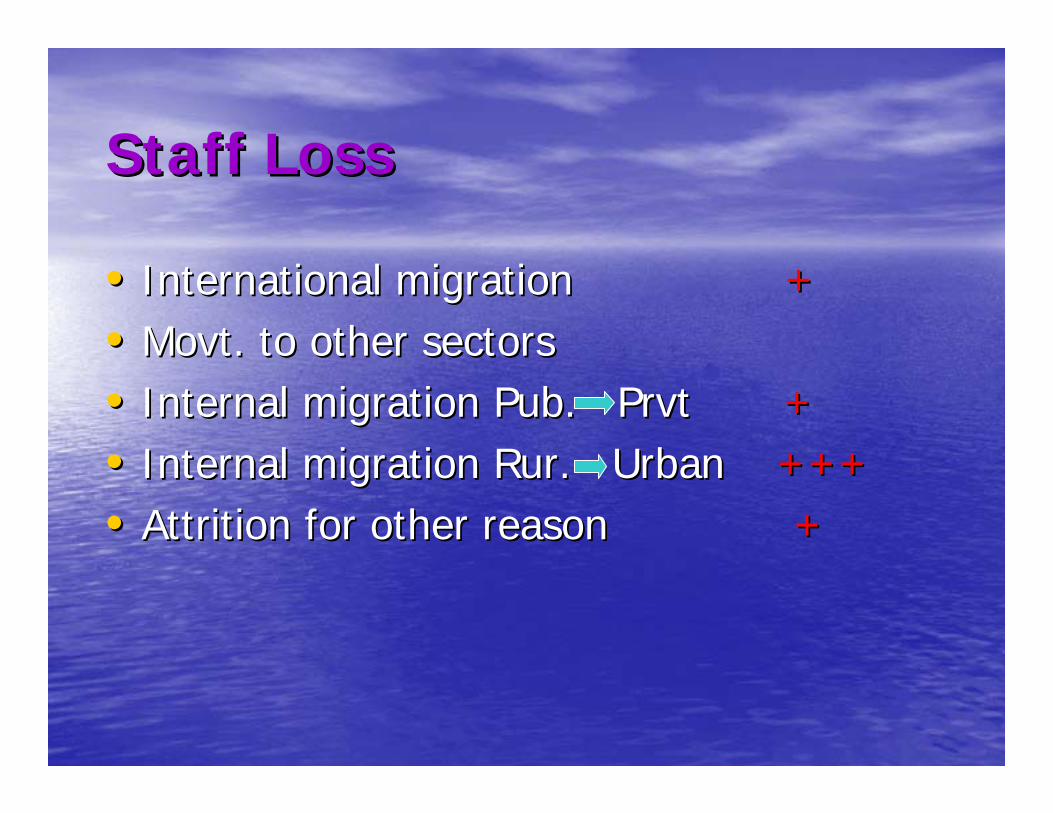
Staff LossStaff Loss
•• International migration International migration ++•• MovtMovt. to other sectors . to other sectors •• Internal migration Pub. Internal migration Pub. PrvtPrvt ++•• Internal migration Internal migration RurRur. Urban . Urban ++++++•• Attrition for other reason Attrition for other reason ++

Ampara
Anuradhapura
Moneragala
Kurunegala
Badulla
Puttalam
Ratnapura
Matale
Galle
Kandy
Polonnaruwa
Mullaitivu
Mannar
Batticaloa
Kegalle
Vavuniya
Hambantota
Trincomalee
Kalutara
Matara
GampahaNuwara
Eliya
Kilinochchi
Jaffna
Colombo
53.2
26.9
30.1
19.0
53.7
32.9
30.6
38.0
26.3
23.6
21.3
45.8
25.3
95.1
13.3
17.7
30.9
38.5
57.1
33.8
35.5
2.2
113.1
23.5
Medical Offcers0
1 - 25
25 - 35
35 - 55
55 - 115
Legend
Distribution of Medical Officers - 2002
Note : The boundaries and names shown and the designations used on this map do not imply official endorsement or acceptanceby the United Nations.
Source : Annual Health Bulletin 2002 Department of Health Services - Sri Lanka
Ampara
Anuradhapura
Moneragala
Kurunegala
Badulla
Puttalam
Ratnapura
Galle
Matale
Kandy
Mullaitivu
Polonnaruwa
Mannar
Batticaloa
Kegalle
Vavuniya
Hambantota
Trincomalee
Kalutara
Matara
GampahaNuwara
Eliya
Kilinochchi
Jaffna
Colombo
128.4
47.9
81.5
34.2
55.1
68.0
45.0
80.6
38.8
44.4
65.9
66.1
49.337.8
28.4
151.8
66.7
55.5
109.4
54.2
68.6
8.2
172.1
60.7
Distribution of Nurses - 2002
Nurses per 100,000 population0
1 - 50
50 - 100
100 - 150
150 - 200
Legend
Source : Annual Health Bulletin 2002 Department of Health Services - Sri Lanka
Note : The boundaries and names shown and the designations used on this map do not imply official endorsement or acceptanceby the United Nations.

StudiesStudies
0.0
10.0
20.0
30.0
40.0
50.0
60.0
70.0
80.0
90.0
100.0
ColomboGampaha
Kalutara
Kandy
Matale
Nuw ara Eliy a
Galle
Matara
Hambantota
Jaffna
Kiliinochchi
MannarVav unijaMullaitiv u
Batticaloa
Ampara
Trincomalee
Kurunegala
Puttalam
Anuradhapura
Polonnaruw a
Badulla
Moneragala
RatnapuraKegalle
Nurses
Medical Off icers
Midw ives
Other Paramedics
Distribution of Health Personnel by District (per 100,000 population)Source: Department of Health Services (2001) Annual Health Bulletin 2000

Distribution of Health Personnel by District Distribution of Health Personnel by District (per 100,000 population)(per 100,000 population)
•• Source: Department of Health Services (2001) Annual Health BulleSource: Department of Health Services (2001) Annual Health Bulletin 2000tin 2000
0.0 50.0 100.0 150.0 200.0 250.0 300.0 350.0
Jaffna
Kiliinochchi
Mannar
Vavunija
Mullaitivu
Batticaloa
Ampara
Trincomalee
Kurunegala
Puttalam
Anuradhapura
Polonnaruw a
Badulla
Moneragala
Ratnapura
Kegalle
Galle
Matara
Hambantota
Kandy
Matale
Nuw ara Eliya
Colombo
Gampaha
Kalutara
(Per 100,000 persons)
Medical Officer Nurse Midwife Specialist
North & East Province
North Western Province
North Central Province
Uva Province
Sabaragamuwa Province
Southern Province
Central Province
Western Province
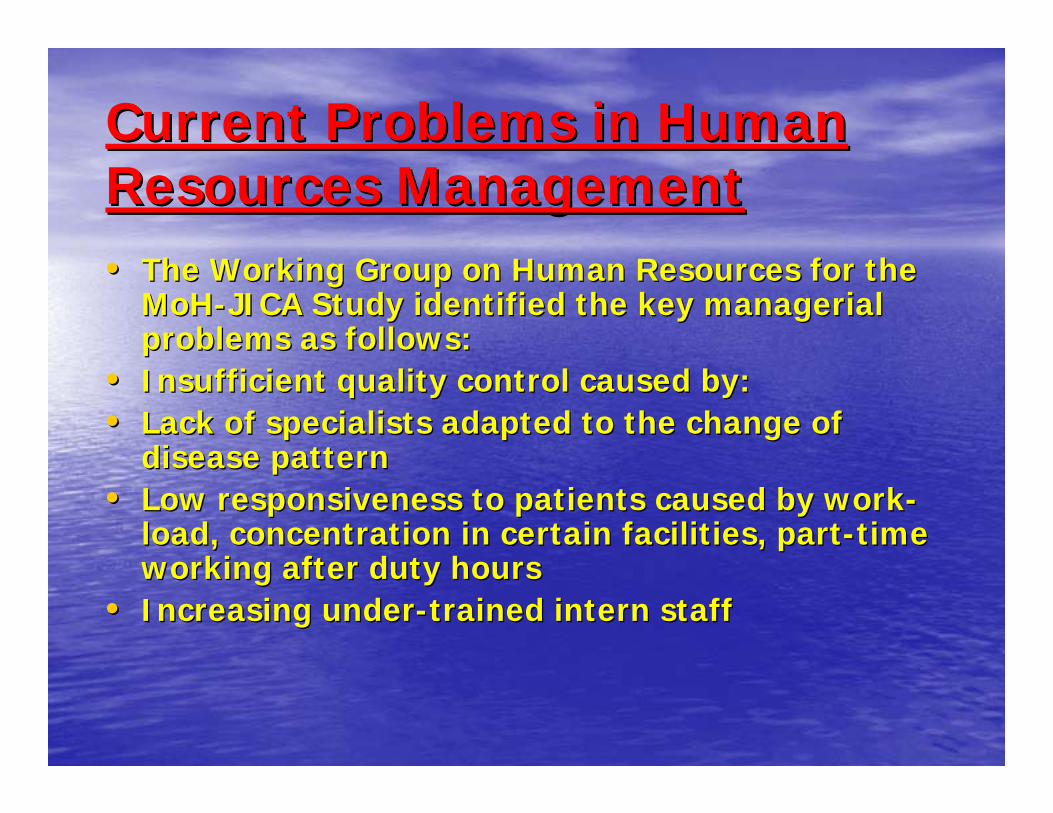
Current Problems in Human Current Problems in Human Resources ManagementResources Management•• The Working Group on Human Resources for the The Working Group on Human Resources for the
MoHMoH--JICA Study identified the key managerial JICA Study identified the key managerial problems as follows:problems as follows:
•• Insufficient quality control caused by:Insufficient quality control caused by:•• Lack of specialists adapted to the change of Lack of specialists adapted to the change of
disease patterndisease pattern•• Low responsiveness to patients caused by workLow responsiveness to patients caused by work--
load, concentration in certain facilities, partload, concentration in certain facilities, part--time time working after duty hoursworking after duty hours
•• Increasing underIncreasing under--trained intern stafftrained intern staff
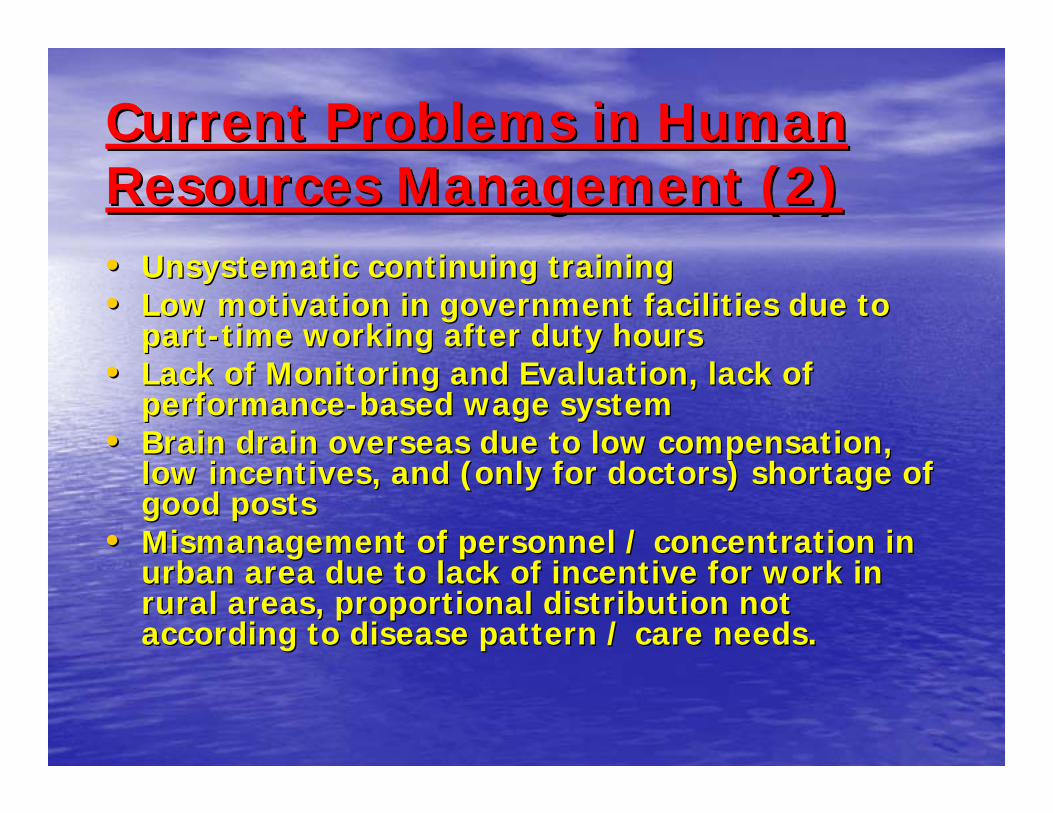
•• Unsystematic continuing trainingUnsystematic continuing training•• Low motivation in government facilities due to Low motivation in government facilities due to
partpart--time working after duty hourstime working after duty hours•• Lack of Monitoring and Evaluation, lack of Lack of Monitoring and Evaluation, lack of
performanceperformance--based wage systembased wage system•• Brain drain overseas due to low compensation, Brain drain overseas due to low compensation,
low incentives, and (only for doctors) shortage of low incentives, and (only for doctors) shortage of good postsgood posts
•• Mismanagement of personnel / concentration in Mismanagement of personnel / concentration in urban area due to lack of incentive for work in urban area due to lack of incentive for work in rural areas, proportional distribution not rural areas, proportional distribution not according to disease pattern / care needs.according to disease pattern / care needs.
Current Problems in Human Current Problems in Human Resources Management (2)Resources Management (2)
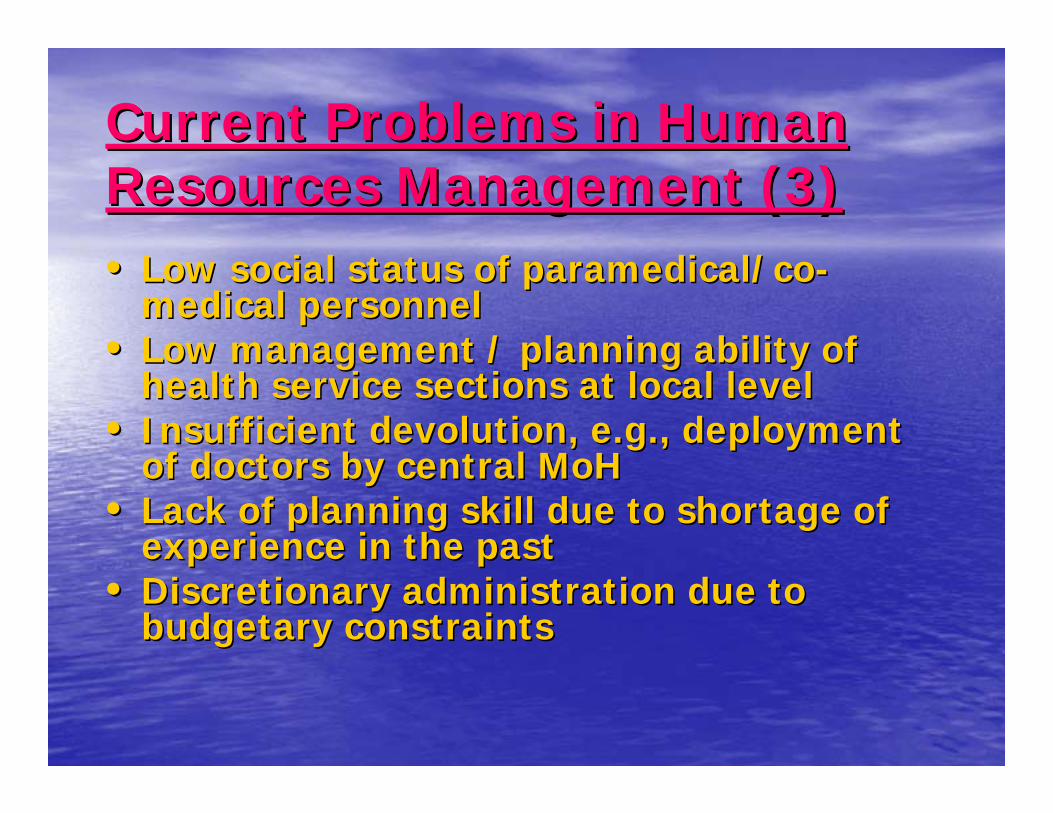
•• Low social status of paramedical/coLow social status of paramedical/co--medical personnelmedical personnel
•• Low management / planning ability of Low management / planning ability of health service sections at local levelhealth service sections at local level
•• Insufficient devolution, e.g., deployment Insufficient devolution, e.g., deployment of doctors by central of doctors by central MoHMoH
•• Lack of planning skill due to shortage of Lack of planning skill due to shortage of experience in the pastexperience in the past
•• Discretionary administration due to Discretionary administration due to budgetary constraintsbudgetary constraints
Current Problems in Human Current Problems in Human Resources Management (3)Resources Management (3)
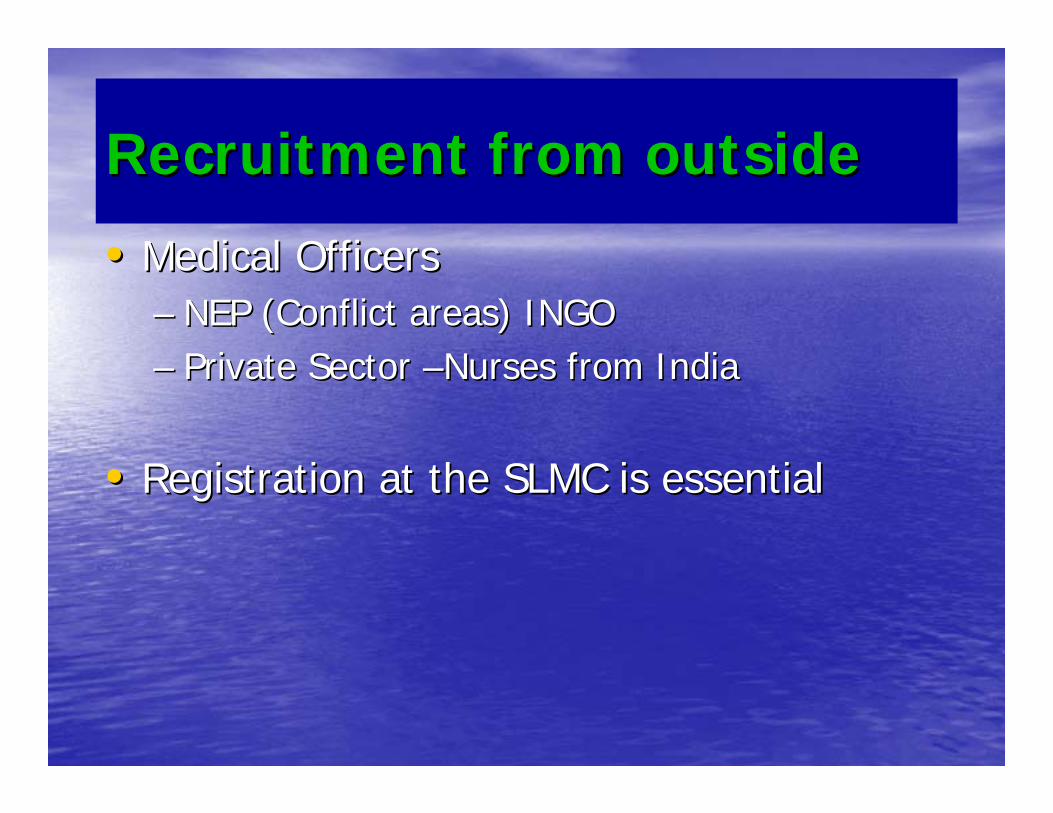
Recruitment from outsideRecruitment from outside
•• Medical OfficersMedical Officers–– NEP (Conflict areas) INGONEP (Conflict areas) INGO–– Private Sector Private Sector ––Nurses from IndiaNurses from India
•• Registration at the SLMC is essential Registration at the SLMC is essential

MIGRATIONMIGRATION
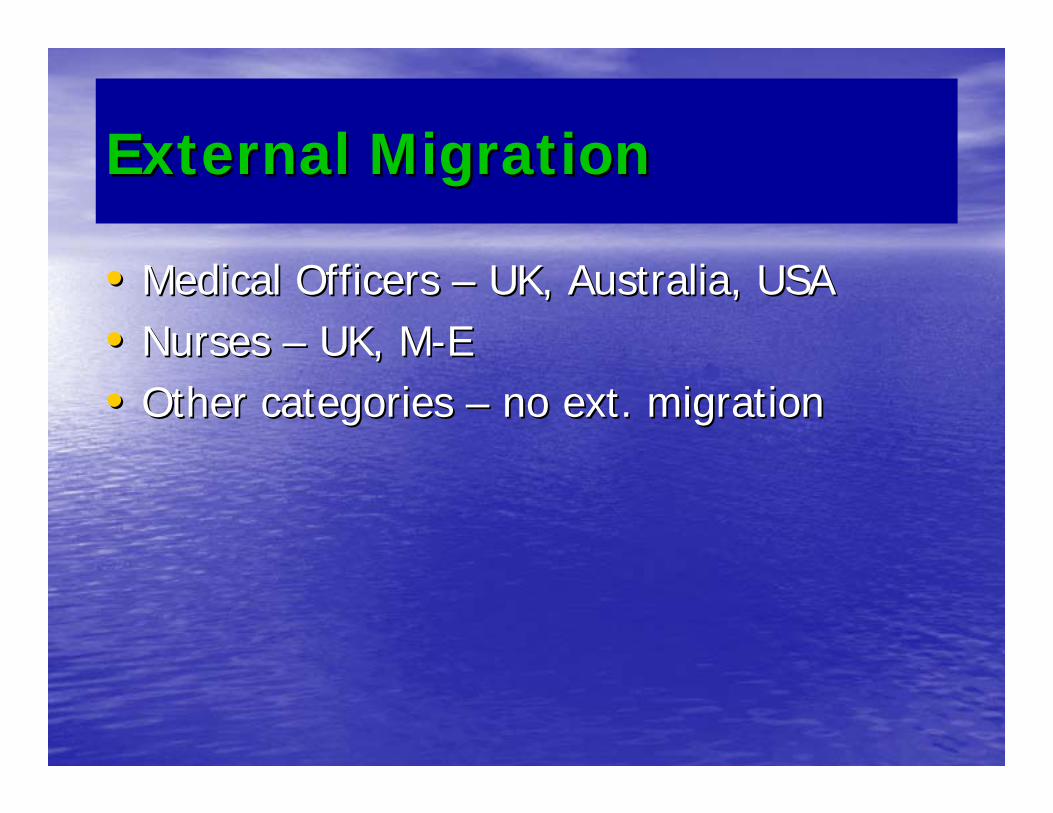
External MigrationExternal Migration
•• Medical Officers Medical Officers –– UK, Australia, USAUK, Australia, USA•• Nurses Nurses –– UK, MUK, M--EE•• Other categories Other categories –– no ext. migrationno ext. migration
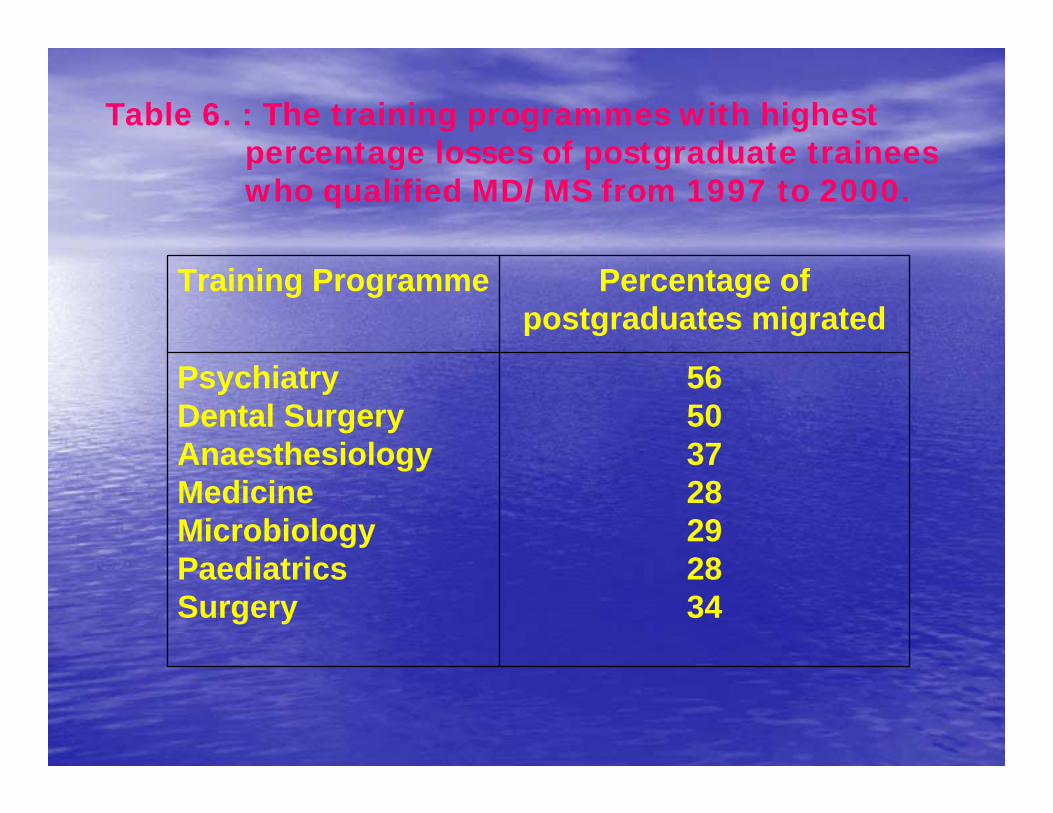
Table 6. : The training programmes with highest percentage losses of postgraduate trainees who qualified MD/MS from 1997 to 2000.
56503728292834
PsychiatryDental SurgeryAnaesthesiologyMedicineMicrobiologyPaediatricsSurgery
Percentage of postgraduates migrated
Training Programme

14816%
78384%
Left the country after boardcertificationServing in Sri Lanka
Fig. 4 percentage of board certified specialists migrated during 1993-2004
Rationalization of human Rationalization of human resource developmentresource development

The issue of migration of health care The issue of migration of health care workers has been a very relevant issue workers has been a very relevant issue for Sri Lankafor Sri Lanka
•• The Hon. Minister of Health of Sri Lanka in The Hon. Minister of Health of Sri Lanka in his address to the World Health Assembly his address to the World Health Assembly in May 2005 raised this issue.in May 2005 raised this issue.
“ Sri Lanka is a country that has seen the adverse effects of the health sector” brain drain”, and we still witness many of our exceedingly talented, best qualified doctors and nurses taking wing to the developed world. I would like to propose to this august Assembly that we collectively develop a set of guiding principles for management of migration of health personnel, and to obtain some compensatory payment for developing countries. Mr. Director General, I would recommend this for your kind consideration as a useful and practical project under next year’s WHO theme of Human Resource Development”Hon.Nimal Siripala De Silva, WHA 2004