HEALTH CARE SEEKING BEHAVIOUR IN WEBUYE,...
92
HEALTH CARE S Prom Co-pro Thesis submitted in t FACU AND H Academic Year: 2009 – 2010 SEEKING BEHAVIOUR IN KENYA Aurelie MINNE moter: Prof. Dr. Jan DE MAESENEER omoter: Dr. Maaike FLINKENFLÖGEL the 2 nd Master as partial fulfillment of the requirem MASTER IN MEDICINE ULTY of MEDICINE HEALTHSCIENCES WEBUYE, ments for
Transcript of HEALTH CARE SEEKING BEHAVIOUR IN WEBUYE,...

HEALTH CARE SEEKING BEHAVIOUR IN WEBUYE,
Promot
Co-promot
Thesis submitted in the
FACULTY of MEDICINE
AND HEALTHSCIENCES
Academic Year: 2009 – 2010
HEALTH CARE SEEKING BEHAVIOUR IN WEBUYE,
KENYA
Aurelie MINNE
Promoter: Prof. Dr. Jan DE MAESENEER
promoter: Dr. Maaike FLINKENFLÖGEL
the 2nd Master as partial fulfillment of the requirements for
MASTER IN MEDICINE
FACULTY of MEDICINE
AND HEALTHSCIENCES
HEALTH CARE SEEKING BEHAVIOUR IN WEBUYE,
partial fulfillment of the requirements for
“The author(s) and the promoter give the authorisation to make this thesis available for
consultation and to copy parts of it for personal use. Any other use is subject to the limitations
of copyright, in particular with regard to the obligation to explicitly mention the source when
quoting results from this thesis.”
Date
Aurelie MINNE Prof. Dr. Jan DE MAESENEER

ACRONYMS
(H)DSS (Health and) Demographic Surveillance System
MOH Ministry Of Health
NGO Non-Governmental Organization
FBO Faith Based Organization
PHMT Provincial Health Management Team
DHMT District Health Management Team
DHMB District Health Management Board
CBO Community Based Organization
KRMA Kenya Registered Midwives Association
VCT Voluntary Counseling and Testing
MDG Millennium Development Goals
INDEPTH International Network of field sites with continuous Demographic Evaluation of
Populations and Their Health
VLIR Flemish Inter University Council
- VLIR-IUC: Institutional University Cooperation - VLIR-UOS: University Development Cooperation
WHO World Health Organization
GOK Government Of Kenya
NHA National Health Account
KCPE Kenya Certificate of Primary Education
KCSE Kenya Certificate of Secondary Education
IREC Institutional Research and Ethics Committee
SPSS Statistical Package for the Social Science
Ksh Kenyan Shilling
PHC Primary Health Care
COPC Community Oriented Primary Care

TABLE OF CONTENTS
ABSTRACT ............................................................................................................................................ - 1 -
ABSTRACT ............................................................................................................................................ - 2 -
INTRODUCTION ................................................................................................................................... - 4 -
1 Health system in Kenya ............................................................................................................... - 4 -
1.1 Organization of the Health Care System ............................................................................. - 4 -
1.1.1 The Health Care System .............................................................................................. - 4 -
1.1.2 Kenya Health Service ................................................................................................... - 5 -
1.2 Health Facilities ................................................................................................................... - 6 -
1.2.1 Teaching and Referral Hospitals .................................................................................. - 6 -
1.2.2 Provincial Hospitals ..................................................................................................... - 7 -
1.2.3 District Hospitals .......................................................................................................... - 8 -
1.2.4 Health Centers ............................................................................................................. - 9 -
1.2.5 Dispensaries ................................................................................................................. - 9 -
1.2.6 Private Maternity and Nursing Homes ........................................................................ - 9 -
1.2.7 Private Clinics .............................................................................................................. - 9 -
1.2.8 Voluntary Counseling and Testing (VCT) facilities ....................................................... - 9 -
2 Demographic Surveillance System (DSS) ................................................................................... - 10 -
2.1 Need for accurate registration .......................................................................................... - 10 -
2.2 Methodology: demographic surveillance .......................................................................... - 10 -
2.3 HDSS .................................................................................................................................. - 10 -
2.4 The INDEPTH network ....................................................................................................... - 11 -
2.5 Webuye, Kenya .................................................................................................................. - 13 -
2.6 Quality of data ................................................................................................................... - 13 -
2.7 Conclusion ......................................................................................................................... - 13 -
3 Health care seeking behavior .................................................................................................... - 14 -
3.1 Need for research on health care seeking behavior ......................................................... - 14 -
3.2 What is health care seeking behavior? ............................................................................. - 14 -
3.3 Characteristics of the subject ............................................................................................ - 17 -
3.3.1 Socio-economic status ............................................................................................... - 17 -
3.3.2 Age ............................................................................................................................. - 18 -
3.3.3 Marital status ............................................................................................................ - 18 -
3.3.4 Ethnicity and religion, traditional beliefs .................................................................. - 19 -

3.3.5 Education ................................................................................................................... - 19 -
3.3.6 Gender ....................................................................................................................... - 19 -
3.4 Characteristics of the perceived illness ............................................................................. - 20 -
3.5 Characteristics of the health facility .................................................................................. - 21 -
3.5.1 Accessibility ............................................................................................................... - 21 -
3.5.2 Bypassing ................................................................................................................... - 22 -
3.5.3 Quality of care ........................................................................................................... - 23 -
3.5.4 Cost of care ................................................................................................................ - 24 -
METHODOLOGY ................................................................................................................................. - 26 -
1 Study site and population.......................................................................................................... - 26 -
2 Questionnaire development ..................................................................................................... - 27 -
3 Participant recruitment and study design ................................................................................. - 28 -
4 Ethical review ............................................................................................................................ - 28 -
5 Data analysis .............................................................................................................................. - 29 -
RESULTS ............................................................................................................................................. - 30 -
1 Background data........................................................................................................................ - 30 -
2 Health service attendance ......................................................................................................... - 31 -
3 What are the reasons for not going to particular health facilities? .......................................... - 32 -
4 Characteristics of the subject .................................................................................................... - 33 -
4.1 Which characteristics of the subject affect the choice of health facility? ........................ - 33 -
5 Characteristics of the facility ..................................................................................................... - 35 -
5.1 How do people experience the health facilities that they frequent? ............................... - 35 -
5.2 Do the characteristics of the facility affect the choice of health facility? ......................... - 36 -
6 Vignettes .................................................................................................................................... - 37 -
6.1 Vignette 1 .......................................................................................................................... - 37 -
6.2 Vignette 2 .......................................................................................................................... - 38 -
6.3 Vignette 3 .......................................................................................................................... - 39 -
DISCUSSION ....................................................................................................................................... - 40 -
1 Limitations ................................................................................................................................. - 40 -
2 Conclusions ................................................................................................................................ - 40 -
2.1 Health service attendance ................................................................................................. - 40 -
2.2 Characteristics of subject/facility ...................................................................................... - 41 -
2.3 Vignette study ................................................................................................................... - 42 -

3 Interventions ............................................................................................................................. - 43 -
3.1 Primary Health Care: now more than ever! ...................................................................... - 43 -
3.2 Implementation ................................................................................................................. - 44 -
3.2.1 Cost of care ................................................................................................................ - 44 -
3.2.2 Quality of care ........................................................................................................... - 45 -
3.2.3 Accessibility ............................................................................................................... - 45 -
3.3 Primary Health care ........................................................................................................... - 46 -
3.3.1 Primafamed ............................................................................................................... - 47 -
3.4 Benefit of the study ........................................................................................................... - 47 -
ACKNOWLEDGMENTS ....................................................................................................................... - 48 -
REFERENCES ...................................................................................................................................... - 49 -
ATTACHMENTS .................................................................................................................................... - 1 -
1 Questionnaire .............................................................................................................................. - 1 -
2 Results: Tables ........................................................................................................................... - 11 -

Health care seeking behavior in Webuye, Kenya 2010
- 1 -
ABSTRACT
Research questions: Where do the residents of Webuye, Kenya go in seek for health care
when they are ill? What are the reasons behind this behavior? What are the facilitating and
constraining factors of the utilization of the public health care services? How can we influence their
behavior in order to create an effective and efficient health care system?
Methods: In the Misikhu-sublocation of Webuye, Kenya we put up a pilot study of 102
participants who were semi-structurally recruited. With the help of a native Bukusu-speaking
translator the individuals were interviewed using (semi)-structured questionnaires.
Results: The pharmacy was by far the most frequented facility of all with 40% of participants
having visited a pharmacy five times or more the past year.
Private facilities, such as the private clinics and the missionary hospital, were least frequented with the
major reason being the high cost of care. Therefore, households with a high wealth-index are the
biggest frequenters of private facilities. Nevertheless, the majority of all participants believe that a
higher quality of care could be found in these facilities.
On the contrary the governmental facilities, such as the local health centers and the district hospital,
scored very badly on quality of care. Participants still often look for medical help there because of the
cheap services.
The use of traditional medicine was low (55.9% had never utilized traditional health services). We
saw that the less-educated respondents visit the traditional healer more frequently than their higher-
educated counterparts.
Common, well-known diseases (ed. malaria) are more likely to be self-treated than other less-known
diseases. When not self-treated, the pharmacy is often the first facility that the respondents visit when
having a medical problem. When not visiting the pharmacy or the received medication did not help we
could see that in some cases households bypass cheap first-line health facilities and seek better quality
services in second-line hospitals.
Conclusion: When evaluating the needs of the health system in Webuye we saw that a quality
Primary Health Care, affordable, accessible and equitable could be a major contribution.

Health care seeking behavior in Webuye, Kenya
- 2 -
ABSTRACT
Onderzoeksvraag: Waar gaan de inwoners van Webuye (Kenya) op zoek naar
gezondheidszorg wanneer ze ziek zijn? Wat zijn hiertoe de redenen? Wat zijn de faciliterende en de
limiterende factoren die het opzoeken van publieke gezondheidszorgvoorzieningen bepalen? Hoe
kunnen we dit ‘health care seeking behavior’ beïnvloeden om zo een effectief en efficiënt
gezondheidszorgsysteem te creëren?
Methodes: In de Misikhu-sublocatie van Webuye werd een pilotstudy opgezet waarbij 102
individuen semigestructureerd gerekruteerd werden. Met de hulp van een tolk, die de lokale taal
“Bukusu” machtig was, werden de individuen geïnterviewd. Hierbij werd gebruik gemaakt van een
(semi)-gestructureerde vraaglijst.
Resultaten: De apotheek was absoluut de meest bezochte gezondheidszorgvoorziening. Zowat
40% van de ondervraagden verklaarde daar reeds 5 maal of meer te zijn geweest gedurende het
afgelopen jaar.
Privévoorzieningen, zoals de private ziekenhuizen en het missionarisziekenhuis, werden minst
bezocht. De hoofdreden hiervoor was het hoge kostenplaatje die deze faciliteiten met zich meedragen.
Daarom zagen we dan ook dat de huishoudens die zich in een hogere welvaartsklasse bevonden, de
frequentste bezoekers waren van deze privéfaciliteiten. Wel hadden alle ondervraagden de idee dat een
betere kwaliteit van zorg in de private gezondheidssector kan gevonden worden.
Daarentegen zagen we dat de voorzieningen aangeboden door de overheid, zoals de lokale
gezondheidszorgcentra en het district ziekenhuis, heel slecht scoorden op het aspect van kwaliteit van
zorg. Deelnemers zochten hier toch frequent medische hulp op door de goedkope diensten die men
hier kan vinden.
Het gebruik van traditionele geneeskunde was laag (55.9% maakte daar nog nooit gebruik van). We
zagen ook dat de lageropgeleide deelnemers vaker een traditionele geneesheer consulteerden dan de
hoger-opgeleiden.
Beter gekende ziektes zoals malaria hadden een hogere kans om behandeld te worden met eigen
materialen ten aanzien van de minder gekende aandoeningen. Wanneer men voor een bepaalde
aandoening geen zelfbehandeling koos, dan was de apotheek vaak de eerste gezondheidsvoorziening
die de ondervraagden zouden bezoeken. Wanneer men niet voor de apotheek koos dan zagen we dat
in bepaalde huishoudens de goedkopere eerstelijnsgezondheidscentra werden overgeslaan en men een
betere kwaliteit van zorg in tweedelijnsgezondheidscentra opzocht.

Health care seeking behavior in Webuye, Kenya
- 3 -
Conclusie: Wanneer we de noden voor een effectief gezondheidssysteem in Webuye hadden
geëvalueerd, konden we vaststellen dat een kwalitatieve eerstelijnsgezondheidszorg die betaalbaar,
toegankelijk en rechtvaardig is, een zeer grote stap voorwaarts kan betekenen.

Health care seeking behavior in Webuye, Kenya
- 4 -
INTRODUCTION
In Webuye, Kenya investigators are setting up a demographic surveillance system (DSS), but the
concept of health care seeking behavior hasn't been thoroughly investigated in the DSS although it is
an important part of the health care process. We want to focus on the subject of health care seeking
behavior and the reasons behind this: the accessibility and utilization of the public health services. By
interviewing the people in Webuye we wish to explore the possible reactions of the Webuye
population to certain medical events that can occur in their lives and which factors determine their
decision-making.
By determining the reasons behind, the facilitating and constraining factors that influence the
utilization of public health care services, health care policy-makers will gain insight as they seek to
improve accessibility and utilization of health services.
1 HEALTH SYSTEM IN KENYA This chapter provides an overview of the health system in Kenya as a context in which to view the
findings of the survey. It presents information on the background of the Kenya Health Policy
Framework and the general organization of the healthcare system.
1.1 ORGANIZATION OF THE HEALTH CARE SYSTEM
1.1.1 THE HEALTH CARE SYSTEM The health sector comprises the public system, with as major players the MOH and parastatal
organizations, and the private sector, which includes private for-profit, NGO, and FBO facilities.
Health services are provided through a network of over 4,700 health facilities countrywide, with the
public sector system accounting for about 51 percent of these facilities.
The public health system consists of the following levels of health facilities: national referral hospitals,
provincial general hospitals, district hospitals, health centers, and dispensaries.
National referral hospitals are at the apex of the health care system, providing sophisticated
diagnostic, therapeutic, and rehabilitative services. The two national referral hospitals are Kenyatta
National Hospital in Nairobi and Moi Referral and Teaching Hospital in Eldoret. The equivalent
private referral hospitals are Nairobi Hospital and Aga Khan Hospital in Nairobi.
Provincial hospitals act as referral hospitals to their district hospitals. They also provide very
specialized care. The provincial level acts as an intermediary between the national central level and the
districts. They oversee the implementation of health policy at the district level, maintain quality

Health care seeking behavior in Webuye, Kenya
- 5 -
standards, and coordinate and control all district health activities. Similar private hospitals at the
provincial level include Aga Khan Hospitals in Kisumu and Mombasa.
District hospitals concentrate on the delivery of health care services and generate their own
expenditure plans and budget requirements based on guidelines from headquarters through the
provinces.
The network of health centers provides many of the ambulatory health services. Health centers
generally offer preventive and curative services, mostly adapted to local needs.
Dispensaries are meant to be the system’s first line of contact with patients, but in some areas, health
centers or even hospitals are effectively the first points of contact. Dispensaries provide wider
coverage for preventive health measures, which is a primary goal of the health policy.
The government health service is supplemented by privately owned and operated hospitals and clinics
and faith-based organizations’ hospitals and clinics, which together provide between 30 and 40 percent
of the hospital beds in Kenya.
1.1.2 KENYA HEALTH SERVICE Services at the provincial and district level. As a result of health sector reforms that have decentralized
health services, services are integrated as one goes down the health structure hierarchy from the
national level to the provincial and district levels. Under decentralization, the district handles
supervisory responsibilities. Unfortunately, supervision has not been very effective, as one technical
person may supervise several technical areas of service delivery at lower levels.
Structure of service delivery. The Provincial Health Management Team (PHMT) provides supervision
and management support to the districts and sub-districts within the province.
At the district level, curative services are provided by district hospitals and mission hospitals. Public
health services are managed by the District Health Management Team (DHMT) and Public Health
Unit of the district hospitals. The DHMT and District Health Management Board (DHMB) provide
management and supervision support to rural health facilities (sub-district hospitals, health centers,
and dispensaries).
At the sub-district level, both preventive and curative services are provided by the health centers as
well as dispensaries and outreach services to the communities within the catchment areas. Basic
preventive and curative services for minor ailments are being addressed at the community and
household level with the introduction of the community package.
Non-governmental organizations, faith-based organizations and the private sector. Although several
health-oriented NGOs operate throughout the country, the population covered by these NGO health

Health care seeking behavior in Webuye, Kenya
- 6 -
services cannot be easily determined. The MOH and external donors support the health services
offered by NGOs and the private sector in several ways. Depending on their comparative advantage,
NGOs, FBOs, and community-based organizations (CBOs) undertake specific health services. The
MOH provides support to mission health facilities by training their staff as well as seconding staff to
these facilities and offering drugs and vaccines.
Currently, the private sector (both for-profit and not-for-profit) contributes over 40 percent of health
services in the country, providing mainly curative health services and very few preventive services.
Modalities exist for MOH supervision and monitoring of NGO, FBO and other private-sector
facilities. The NGOs and private facilities work with communities in collaboration with the DHMT.
The community programs report to the DHMBs, which report to the headquarters through the
Provincial Health Management Boards. Their activities are guided by MOH standards and protocols.
1.2 HEALTH FACILITIES
Table 1 shows the distribution of health facilities, hospital beds and cots by province. We can see that
the overall number of health facilities increased between 2001 and 2002. Although there was a decline
in the number of hospital beds/cots per 100,000 people between 2003 and 2004, there has been an
increase from the numbers for 2001 and 2002.
2001 2002 2003 2004
Institutions
Hospitals 500 514 526 562
Health centers 611 634 649 691
Dispensaries 3 310 3 351 3 382 3 514
Total 4 421 4 499 4 557 4 767
Hospital beds & cots
Number of beds & cots 58 080 60 657 65 851 65 971
Number per 100.000 population 18.9 19.2 19.5 18.1
Table 1. Number of health facilities in Kenya, and number of hospital beds and cots available.
Source: Health Management Information System, MOH (2005)
1.2.1 TEACHING AND REFERRAL HOSPITALS
Moi Referral and Teaching Hospital and Kenyatta Hospital are the referral and teaching hospitals in
Kenya. They are centers of excellence and provide complex health care requiring more complex
technology and highly skilled personnel. They have a high concentration of resources and are
relatively expensive to run. They also support the training of health workers at both pre-service and in-
service levels.

Health care seeking behavior in Webuye, Kenya
- 7 -
Teaching and referral hospitals have the following functions:
- Health care. Referral hospitals provide complex curative tertiary care. They also provide preventive
care and participate in public health programs for the local community and the total primary health
care system. Referrals from the districts and provinces are ultimately received and managed at the
referral hospitals. The referral hospitals have a specific role in providing information on various health
problems and diseases. They provide extra-mural treatment alternatives to hospitalization, such as day
surgery, home care, home hospitalization and outreach services.
- Quality of care. Teaching hospitals should provide leadership in setting high clinical standards and
treatment protocols. The best quality of care in the country should be found at teaching and referral
hospitals.
- Access to care. Patients may only have access to tertiary care through a well-developed referral
system.
- Research. With their concentration of resources and personnel, teaching and referral hospitals
contribute in providing solutions to local and national health problems through research, as well as
contributing to policy formulation.
- Teaching and training. Teaching is one of the primary functions of these hospitals. They provide
both basic and post-graduate training for health professionals.
1.2.2 PROVINCIAL HOSPITALS
Provincial hospitals form a secondary level of health care for their location. They provide services to a
geographically well-defined area. Provincial hospitals are an integral part of the provincial health
system.
They provide specialized care, involving skills and competence not available at district hospitals,
which makes them the next level of referral after district hospitals. Their personnel include medical
professionals, such as general surgeons, general medical physicians, pediatricians, general and
specialized nurses, midwives, and public health staff.
Provincial hospitals should provide clinical services in the following disciplines:
• Medicine;
• General surgery and anesthesia;
• Pediatrics;
• Obstetrics and gynecology;
• Dental services;

Health care seeking behavior in Webuye, Kenya
- 8 -
• Psychiatry;
• Accident and emergency services;
• Ear, nose and throat;
• Ophthalmology;
• Dermatology;
• ICU (intensive care unit) and HDU (high dependency unit) services.
They should also provide the following services:
• Laboratory and diagnostic techniques for referrals from the lower levels of the health care system;
• Teaching and training for health care personnel such as nurses and medical officer interns;
• Supervision and monitoring of district hospital activities;
• Technical support to district hospitals such as specific outreach services.
1.2.3 DISTRICT HOSPITALS
District hospitals are the facilities for clinical care at the district level. They are the first referral
hospital and form an integral part of the district health system.
A district hospital should provide the following:
• Curative and preventive care and promotion of health of the people in the district;
• Quality clinical care by a more skilled and competent staff than those of the health centers and dispensaries;
• Treatment techniques such as surgery not available at health centers;
• Laboratory and other diagnostic techniques appropriate to the medical, surgical, and outpatient activities of the district hospital;
• Inpatient care until the patient can go home or back to the health centre;
• Training and technical supervision to health centers, as well as resource centre for health centers at each district hospital;
• Twenty-four hour services;
• The following clinical services:
o Obstetrics and gynecology; o Child health; o Medicine; o Surgery, including anesthesia;
• Accident and emergency services;
• Non-clinical support services;
• Referral services;

Health care seeking behavior in Webuye, Kenya
- 9 -
• Contribution to the district-wide information generation, collection planning, implementation
and evaluation of health service programs.
1.2.4 HEALTH CENTERS
Health centers are staffed by midwives or nurses, clinical officers, and occasionally by doctors. They
provide a wider range of services, such as basic curative and preventive services for adults and
children, as well as reproductive health services. They also provide minor surgical services such as
incision and drainage.
They augment their service coverage with outreach services, and refer severe and complicated
conditions to the appropriate level, such as the district hospital.
1.2.5 DISPENSARIES
The dispensaries are at the lowest level of the public health system and are the first point of contact
with patients. They are staffed by enrolled nurses, public health technicians, and dressers (medical
assistants). The enrolled nurses provide antenatal care and treatment for simple medical problems
during pregnancy such as anemia, and occasionally conduct normal deliveries. Enrolled nurses also
provide basic outpatient curative care.
1.2.6 PRIVATE MATERNITY AND NURSING HOMES
Private maternity homes fall under the governance of the Kenya Registered Midwives Association
(KRMA). Some maternity and nursing homes are run by other health care professionals, such as
doctors and clinical officers. Working in close collaboration with the Reproductive Health and Child
Health Divisions of the Ministry of Health, they offer reproductive and family planning services. In
addition, some child welfare activities are carried out on their premises by health staff of public health
facilities.
1.2.7 PRIVATE CLINICS
These provide mostly curative services and are operated by FBOs, NGOs, nurses/midwives, clinical
officers and doctors.
1.2.8 VOLUNTARY COUNSELING AND TESTING (VCT) FACILITIES
VCT facilities provide HIV/AIDS counseling and testing services. They may be managed by the
government, NGOs, FBOs, or private for-profit enterprises.

Health care seeking behavior in Webuye, Kenya
2 DEMOGRAPHIC SURVEILLANCE
2.1 NEED FOR ACCURATE REG
The Millennium Development Goals (MDGs) require empirical data in order to assess the extent to
which the MDGs have been achieved in the critical areas
generally lacking in infrastructural
pressing. Information is therefore often most scant in the poorest settings where
poses a particular challenge to the allocation of resources and the development of effective health
policies and programs.
National and even provincial data are regularly presented as
of various areas. (Kahn et al., 2007)
of interventions or setting priorities for r
data or cross-sectional surveys: the former may be biased through differential attendance and the latter
may lack an adequate population sampling frame. Neither health facility nor cross
permit evaluation of longitudinal trends in morbidity or mortality related to sex, age, geographic
distribution or socioeconomic status. (Adazu et al., 2005)
Health and demographic surveillance is therefore a response to the lack of a valid inf
that can provide high-quality longitudinal data on population dynamics, health, and social change to
inform policy and practice.
2.2 METHODOLOGY: DEMOGRAPH
Demographic surveillance is the process of defining risk and corresponding dynamics in demographic
rates of birth, death and migration in a population over time. In such a system, a baseline or initial
census defines the target population. The surveillance
migrations – the only events that can
change the initial population. These core
demographic data are often complemented
with various other data collection efforts to
gather information on important social and
economic correlates of population and
health dynamics. (Ngom et al., 2001)
2.3 HDSS
A Health and Demographic Surveillance System (HDSS) is a
and vital event registration system that monitors demographic (births, deaths, mig
Health care seeking behavior in Webuye, Kenya
URVEILLANCE SYSTEM (DSS)
EED FOR ACCURATE REGISTRATION
Millennium Development Goals (MDGs) require empirical data in order to assess the extent to
which the MDGs have been achieved in the critical areas. Vital event and health registration is
infrastructural weak areas where health and development problems are most
Information is therefore often most scant in the poorest settings where it is needed most.
poses a particular challenge to the allocation of resources and the development of effective health
National and even provincial data are regularly presented as averages; this masks
(Kahn et al., 2007) Data for evaluating program effectiveness, measuring the efficacy
of interventions or setting priorities for resource allocation are frequently obtained using health facility
sectional surveys: the former may be biased through differential attendance and the latter
may lack an adequate population sampling frame. Neither health facility nor cross
permit evaluation of longitudinal trends in morbidity or mortality related to sex, age, geographic
bution or socioeconomic status. (Adazu et al., 2005)
Health and demographic surveillance is therefore a response to the lack of a valid inf
quality longitudinal data on population dynamics, health, and social change to
DEMOGRAPHIC SURVEILLANCE
Demographic surveillance is the process of defining risk and corresponding dynamics in demographic
rates of birth, death and migration in a population over time. In such a system, a baseline or initial
census defines the target population. The surveillance machinery then monitors births, deaths, and
the only events that can
change the initial population. These core
demographic data are often complemented
with various other data collection efforts to
gather information on important social and
onomic correlates of population and
(Ngom et al., 2001)
A Health and Demographic Surveillance System (HDSS) is a longitudinal, population
and vital event registration system that monitors demographic (births, deaths, mig
Fig 1. Demographic surveillanceSource: INDEPTH network
- 10 -
Millennium Development Goals (MDGs) require empirical data in order to assess the extent to
Vital event and health registration is
development problems are most
it is needed most. This
poses a particular challenge to the allocation of resources and the development of effective health
s the particular needs
Data for evaluating program effectiveness, measuring the efficacy
esource allocation are frequently obtained using health facility
sectional surveys: the former may be biased through differential attendance and the latter
may lack an adequate population sampling frame. Neither health facility nor cross-sectional data
permit evaluation of longitudinal trends in morbidity or mortality related to sex, age, geographic
Health and demographic surveillance is therefore a response to the lack of a valid information base
quality longitudinal data on population dynamics, health, and social change to
Demographic surveillance is the process of defining risk and corresponding dynamics in demographic
rates of birth, death and migration in a population over time. In such a system, a baseline or initial
machinery then monitors births, deaths, and
, population-based health
and vital event registration system that monitors demographic (births, deaths, migrations) and health
Fig 1. Demographic surveillance network

Health care seeking behavior in Webuye, Kenya
- 11 -
events in a geographically defined population with timely production of data. Additional information
may be collected on verbal autopsies, morbidity & disability, pregnancies, economic/social activity,
lifestyle etc. The periodicity varies from as frequent as every two weeks to annual rounds.
HDSS sites are platforms for a wide range of research activities. The continuous surveillance makes it
possible to easily and clearly define risks of demographic and health events for individuals over time.
HDSS can provide a cause-specific mortality and morbidity profile that is demographically or
geographically stratified, permitting rational resource allocation to priority diseases in defined target
groups. Up-to-date sampling frames can be generated from HDSS data at multiple levels (individual,
house, village) and by several strata (age, sex, geographic location) to permit unbiased, population-
based sampling for appraisal, intervention and monitoring. The longitudinal morbidity, mortality, and
fertility data generated from the HDSS can help generate hypotheses on the causes of disease and
death in the population and evaluate the impact of public health interventions. Finally, significant
efficiencies may be achieved when multiple research or program evaluation activities operate from the
same infrastructure and population base. (Adazu et al., 2005)
2.4 THE INDEPTH NETWORK
Established in November 1998 with funding from the Rockefeller Foundation, INDEPTH is the
International Network of field sites with continuous Demographic Evaluation of Populations and Their
Health in developing countries. (INDEPTH, 2001)
The mission of INDEPTH is to harness the collective potential of the world’s community-based
longitudinal demographic surveillance initiatives in resource constrained countries to provide a better,
empirical understanding of health and social issues and to apply this understanding to alleviate the
most severe health and social challenges.
The network aims to increase interaction between its member sites through multi-site research projects
and methodological and technical workshops, while building the capacity of research institutions in
resource-poor setting and strengthening the interface between research and policy to implement this
agenda; six working groups have been created and are now fully functional:
(1) Data analysis and capacity strengthening
(2) Technical support to field sites
(3) Comparative mortality studies
(4) Reproductive Health
(5) Malaria
(6) Applications to policy and practice
Health care seeking behavior in Webuye, Kenya
- 12 -
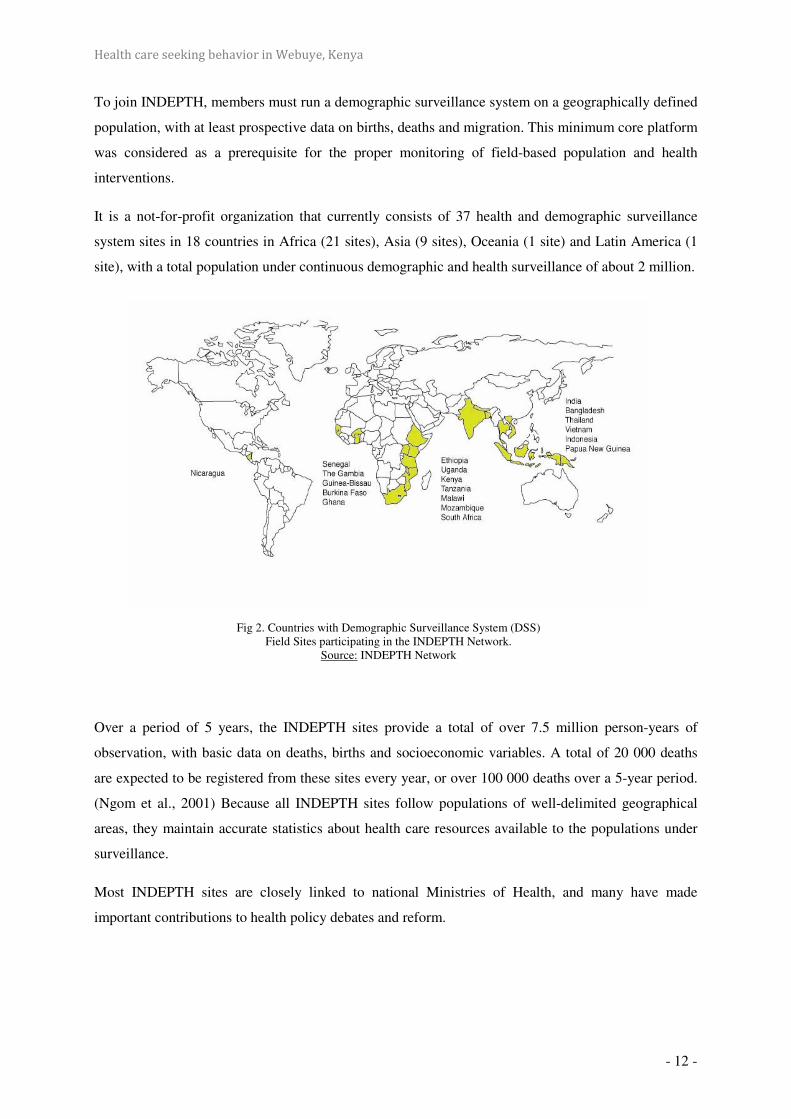
To join INDEPTH, members must run a demographic surveillance system on a geographically defined
population, with at least prospective data on births, deaths and migration. This minimum core platform
was considered as a prerequisite for the proper monitoring of field-based population and health
interventions.
It is a not-for-profit organization that currently consists of 37 health and demographic surveillance
system sites in 18 countries in Africa (21 sites), Asia (9 sites), Oceania (1 site) and Latin America (1
site), with a total population under continuous demographic and health surveillance of about 2 million.
Over a period of 5 years, the INDEPTH sites provide a total of over 7.5 million person-years of
observation, with basic data on deaths, births and socioeconomic variables. A total of 20 000 deaths
are expected to be registered from these sites every year, or over 100 000 deaths over a 5-year period.
(Ngom et al., 2001) Because all INDEPTH sites follow populations of well-delimited geographical
areas, they maintain accurate statistics about health care resources available to the populations under
surveillance.
Most INDEPTH sites are closely linked to national Ministries of Health, and many have made
important contributions to health policy debates and reform.
Fig 2. Countries with Demographic Surveillance System (DSS) Field Sites participating in the INDEPTH Network.
Source: INDEPTH Network

Health care seeking behavior in Webuye, Kenya
- 13 -
2.5 WEBUYE, KENYA
In September 2007, Moi University, Eldoret Kenya, proposed, in the framework of the VLIR-IUC, to
set up a DSS in Webuye, Western Kenya, starting in May 2008. This research project is funded by the
Flemish Inter University Council (VLIR) 1 of the Belgian Government.
The main objectives:
- Developmental: to collect relevant data in the community, that may contribute to a
“community diagnosis” of important problems. This should be the basis for a strategy to be
developed in permanent interaction with the local population and stakeholders, leading to
improvement of the general status of the community, including living conditions and health.
The results should guide decision makers leading to policy changes.
- Scientific: to develop and improve relevant data collection tools in the community, to analyze
data in order to identify important problems in the community, to develop and monitor
interventions, and to assess evolution overtime.
2.6 QUALITY OF DATA
Despite rigorous training and through fieldwork operations and quality control measures, it is difficult
to comprehensively evaluate the completeness and accuracy of HDSS data given the absence of a gold
standard against which to measure findings. Useful insights can be derived, however, from comparing
key findings with national data sources. (Kahn et al., 2007)
2.7 CONCLUSION
Investment in Demographic Surveillance Systems in developing countries is justifiable on scientific
grounds. Appropriate demographic registration is generally lacking in critical areas where health and
development problems are a major concern. Health outcomes require precise information on the events
of interest and the population at risk. Demographic Surveillance Systems provide the unique
opportunity for a longitudinal follow-up of households, an approach that is crucial to the measurement
of the possible correlations between social and economic status and health outcomes and monitoring
of interventions.
1 As part of the Flemish Interuniversity Council (VLIR), VLIR-UOS is the responsible actor, for the Belgian
government, for all university cooperation for development between the universities and university colleges in
Flanders, Belgium, and their partner universities in the South.
Health care seeking behavior in Webuye, Kenya
- 14 -
3 HEALTH CARE SEEKING BEHAVIOR
3.1 NEED FOR RESEARCH ON HEALTH CARE SEEKING BEHAVIOR
Research on health-seeking behavior in developing countries is of both theoretical and practical
relevance. It analyzes concepts of origin and management of illness, provides insights into utilization
of available traditional and/or modern health services and finally it allows a deeper understanding of
community perceptions regarding health care in particular settings. (Kroeger, 1983)
Better characterization of the components of access and utilization of health services is important to
focus efforts to achieve equity of health care in the developing countries (Makinen et al., 2000). This
equity of health care is an essential component in achieving the Millennium Development Goals by
2015.
The practice of appropriate health seeking has a tremendous potential to reduce the occurrence of
severe and life-threatening illnesses. (Taffa et al., 2005) Insight into factors that make people decide
why, when, and where to seek care can improve the programs that focus on health improvement.
(Voeten HA et al. 2004)
3.2 WHAT IS HEALTH CARE SEEKING BEHAVIOR?
Health care seeking behavior is the seeking and acceptance by patients of health services. Access and
utilization of health services is multi-faceted, influenced by cultural, behavioral and financial factors.
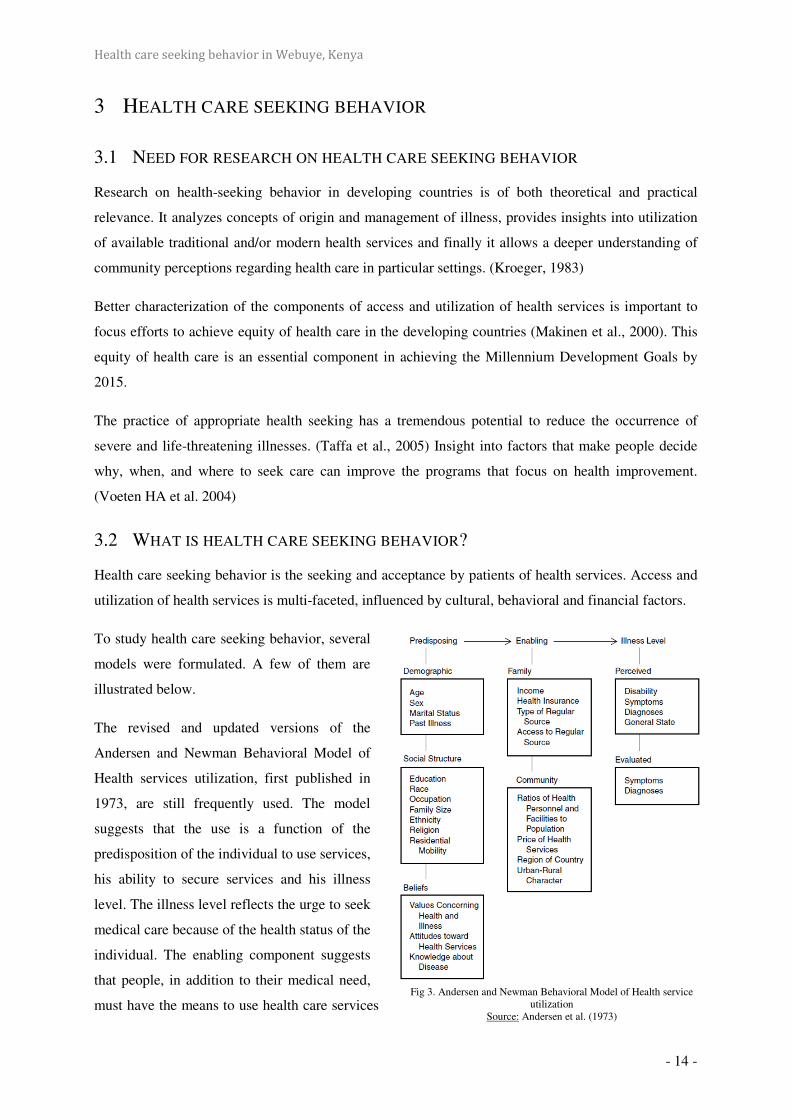
To study health care seeking behavior, several
models were formulated. A few of them are
illustrated below.
The revised and updated versions of the
Andersen and Newman Behavioral Model of
Health services utilization, first published in
1973, are still frequently used. The model
suggests that the use is a function of the
predisposition of the individual to use services,
his ability to secure services and his illness
level. The illness level reflects the urge to seek
medical care because of the health status of the
individual. The enabling component suggests
that people, in addition to their medical need,
must have the means to use health care services Fig 3. Andersen and Newman Behavioral Model of Health service
utilization Source: Andersen et al. (1973)

Health care seeking behavior in Webuye, Kenya
- 15 -
(e.g. family income, transportation). Finally, the predisposing component involves characteristics
determining an individual’s inclination to use medical care (e.g. age, education, values about health
and illness, psychosocial factors).
Tanahashi (1978) worked out the
characteristics of the health system in a
model, to gain insight into factors that
play a role in the process of service
provision (Fig. 2). He identified five
separate levels of coverage. The final
level, with the lowest percentage, is the
effectiveness coverage. Only if services
are available, accessible and acceptable,
and the patient has actually visited the
health service institution, can the service be effective. Service can be valued as effective if the
patients’ needs are met; if the patients are satisfied. It has been observed that when the effectiveness
coverage of a facility is high, users will be willing to travel long distances to seek care.
Kroeger (1983) has developed a
model of various possible
explanatory variables of this
behavior. The existence or
presence of traditional healers,
modern health institutions
and/or private drug-sellers are
all mentioned as dependent
variables which, together with
the so-called independent
variables, determine an
individual’s choice of care or
healer. Independent variables
can be divided into
characteristics of the subject (such as gender, age, education, and motivation), characteristics of the
perceived illness (such as type of complaint, severity, acute or chronic), and characteristics of the
health service (such as accessibility, costs, quality of care, and waiting times) (Fig. 3). This is the
model that has been used for the set-up of our study.
Fig 4. Coverage diagram Source: Stekelenburg et al. (2005)
Fig 5. The choice of healer in realtion to various explanatory variables Source: Kroeger (1983)
Health care seeking behavior in Webuye, Kenya
- 16 -
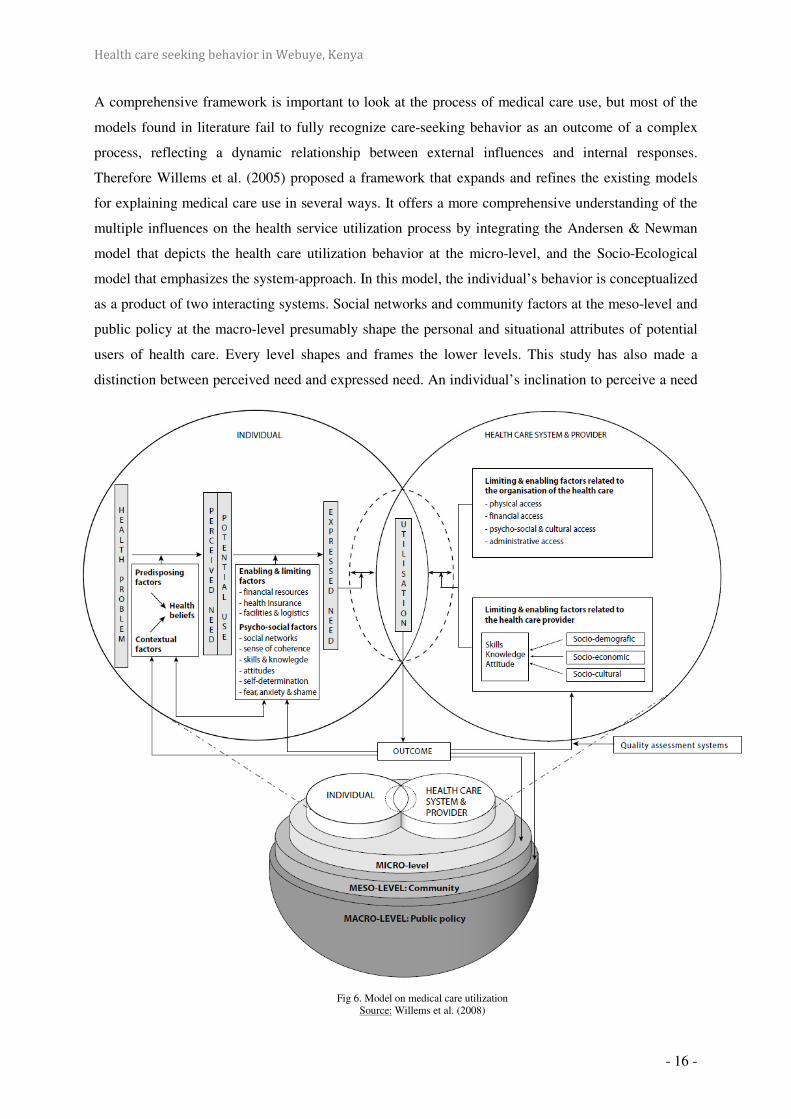
A comprehensive framework is important to look at the process of medical care use, but most of the
models found in literature fail to fully recognize care-seeking behavior as an outcome of a complex
process, reflecting a dynamic relationship between external influences and internal responses.
Therefore Willems et al. (2005) proposed a framework that expands and refines the existing models
for explaining medical care use in several ways. It offers a more comprehensive understanding of the
multiple influences on the health service utilization process by integrating the Andersen & Newman
model that depicts the health care utilization behavior at the micro-level, and the Socio-Ecological
model that emphasizes the system-approach. In this model, the individual’s behavior is conceptualized
as a product of two interacting systems. Social networks and community factors at the meso-level and
public policy at the macro-level presumably shape the personal and situational attributes of potential
users of health care. Every level shapes and frames the lower levels. This study has also made a
distinction between perceived need and expressed need. An individual’s inclination to perceive a need
Fig 6. Model on medical care utilization Source: Willems et al. (2008)

Health care seeking behavior in Webuye, Kenya
- 17 -
for health care is determined by predisposing factors, contextual factors and health beliefs and
knowledge. Psychosocial factors and limiting and enabling factors related to the individual will predict
whether the perceived need will lead to an expressed need for professional healthcare. In addition,
limiting and enabling factors related to the healthcare services and the providers will influence the
individual’s actual health services utilization. The actual use of health care will not only have an
impact on various outcomes such as the patient’s health, but also on his/her inclination to use medical
care in the future.
3.3 CHARACTERISTICS OF THE SUBJECT
3.3.1 SOCIO-ECONOMIC STATUS
Makinen et al. reviewed the studies that measure inequality in the use of and spending on health
services of eight developing countries. Richer groups are found to have a higher probability of
obtaining care when sick, to be more likely to be seen by a doctor, and to have a higher probability of
receiving medicines when they are ill, than the poorer groups. Richer population groups spend more
on health care, measured in absolute terms, than do poorer groups, but do not devote a consistently
higher percentage of their consumption expenditures to health care. On contrary, the poor can have
particular difficulties accessing health care, and when they seek care, they spend a greater proportion
of their income on treatment than richer households. (Chuma et al., 2007)
The equity ratios in the research of Chuma et al. (2007) indicate that the poorer the households, the
more likely they were to use shops, government dispensaries and herbs. The least poor households
were more likely to use private clinics. The number of people failing to seek treatment due to cash
shortages is particularly high in the rural area. About half of chronic illnesses reported in the rural and
urban area did not receive any regular treatment. This suggests that households may choose not to seek
health care rather than cope with further impoverishment.
N. Taffa et al. (2005) studied the predictors of health care seeking behavior in the Nairobi slums and
observed that of the predictors assessed by the study, lack of money was the most important factor for
not seeking health care. Related to this variable is the low level of household expenditure, and hence
low income, which considerably limited health care seeking, irrespective of illness severity. Compared
with residents in other parts of Nairobi, slum residents often pay even more than what similar services
would normally cost elsewhere in the city and receive worse quality of care from private health care
providers. For this reason, they will usually wait and observe for quite some time before they visit
these facilities, while they would mostly raise funds. Owing to the doubtful efficacy of the treatment
they receive from private clinics or drug shops, they keep on visiting a number of them until they see
improvement, their funds are exhausted, or the illness gets so complicated that the person dies.
Referrals to public health facilities normally take place once the illness is complicated.
Health care seeking behavior in Webuye, Kenya
- 18 -
We can find another reason for greater use of services of the richer population in the review of
Gabrysch & Campbell (2009): "households with higher living standard are more modern and therefore
more receptive towards modern health care services". On a larger scale, communities with less
economic development are likely to be more traditional, give women less autonomy and have less
positive attitudes towards service use. In addition, the characteristics of health facilities serving the
poor may discourage appropriate utilization. This may stem from inferior quality of care or the
unavailability of services in poor areas, requiring users to travel long distances. Cost and distance
often go hand in hand, as longer distances entail higher transportation costs.
3.3.2 AGE
Age is often presented as a proxy for accumulated experience, including the use of health services. It is
associated with marital status, socioeconomic status and decision-making power. Older persons are
possibly more confident and influential in household decision-making than younger ones and
adolescents in particular. (Gabrysch et al., 2009) On the other hand, older individuals may belong to
more traditional cohorts and thus be less likely to use modern facilities than young people. N. Taffa et
al. (2005) observed that maternal age acted as a strong predictor of health care seeking after 35 years
of age, as these older mothers were less likely to seek health care for their children.
3.3.3 MARITAL STATUS
There is strong empirical evidence that marriage and other social relationships are associated with
lower morbidity and mortality. However, studies on the effect of marital status on health care seeking
behavior are not cohesive.
In a nationwide survey, women were found to attempt to control the health behaviors of their spouses
(Norcross et al., 1996). Other studies, however, have reported either a negative association or no
association between marital status and health services utilization, either because of increased
utilization of home health care by married adults or because marital status is associated with improved
health care for both men and women.
Single women can be more autonomous and therefore frequent health facilities more often than
their married counterparts. But on the other hand, singles may be poorer with a lower budget for health
care. One study (Stephenson et al., 2005) looked separately at monogamously married, polygamously
married, never-married and formerly-married mothers in six African countries. Results vary from
showing no association (Tanzania, Ghana, Burkina Faso), to showing monogamous women seeking
care more often than the other groups (Ivory Coast and Kenya), and showing formerly-married and
polygamous women seeking more care (Malawi).

Health care seeking behavior in Webuye, Kenya
- 19 -
3.3.4 ETHNICITY AND RELIGION, TRADITIONAL BELIEFS
Ethnicity and religion are often considered as markers of cultural background and are thought to
influence beliefs, norms and values in relation to health service use. Glei et al. (2000) observed
different ethnic groups in Guatemala and found that the more traditional the group of indigenous
women, the more likely the women are to rely on a midwife and the less likely they are to use modern
medical care. A woman’s ethnicity appeared to be among the strongest predictors of whether she
receives biomedical care during pregnancy. Moreover, certain ethnic or religious groups may be discriminated against by medical staff, making
them less likely to use services. In many societies, ethnicity and religion are closely linked to
socioeconomic position and place of residence; minority ethnic or religious groups may live in remote
areas with inferior health infrastructure and transport. (Gabrysch et al., 2009).
3.3.5 EDUCATION
There are multiple potential pathways that could explain why education is consistently and strongly
associated with all types of health behavior. (Gabrysch et al., 2009) These include increased
knowledge of the benefits of preventive health care and awareness of health services, higher
receptivity to new health-related information, socialization to interact with formal services outside the
home environment and familiarity with modern medical culture. In addition access to financial
resources and health insurance, more control over resources within the household and wiser spending
are possible explanatory factors. Furthermore better communication, more decision-making power,
increased self-worth and self-confidence, better coping abilities and negotiating skills as well as
reduced power differential towards health care providers and thus better communication and ability to
demand adequate services have a share in this multiple-pathway clarification. Education also reflects a
person’s childhood background, including familiarity with health services and certain beliefs and
norms.
It has also been suggested that there may be community effects of education, with more highly
educated communities organizing themselves and demanding better public services and a higher
position for health on the political agenda (Grosse et al., 1989). By contrast, better awareness of poor
quality in many facilities and higher confidence in self-care may delay care-seeking among educated
individuals. Furthermore where strong public health programs reach out to disadvantaged sectors of
the population, the education gradient in health service use may be small.
3.3.6 GENDER
Several studies (Norcross et al., 1996) demonstrate that women are more likely than men to seek and
utilize health care, possess greater knowledge about health, be compliant with a therapeutic regimen,
and monitor the health and safety of others as well as their own health. Women are more likely than

Health care seeking behavior in Webuye, Kenya
- 20 -
men to be the principal brokers or arrangers of health care for their spouses as well as for their
children.
However, this gender-difference can vary with the type of disease. The population-based study of
Voeten et al. (2004) on health care-seeking behavior for STD-related complaints has shown major
gender differences in the proportion seeking care and patient delay. They highlight that over one third
of women in comparison to 20% of men with STD complaints do not seek care at all and that those
who seek care on average wait six weeks (vs. 16 days for men).
3.4 CHARACTERISTICS OF THE PERCEIVED ILLNESS
Health care seeking is strongly related to particular illness symptoms and their perceived severity.
Related to perceived illness severity, maternal recognition of certain signs and symptoms of child
illness has been cited as a critical factor determining health care-seeking behavior. (Taffa et al., 2005)
Although maternal perceived illness severity was widely believed to influence decisions to seek health
care, other research findings cast doubt on the reliability of its recognition and interpretation. In a
study from Egypt, mothers were read brief descriptions of hypothetical cases and asked how they
would recommend treating the children in each situation. Results were compared with repeated care-
seeking practices during acute respiratory illness episodes that occur in their own children. Although
mothers generally recognized the danger signs in child illness, they did not use their recognition to
take appropriate action.
Hill et al. (2003) argue that health beliefs are important barriers to care seeking in addition to the
maternal ability to recognize symptoms. In their study in rural Ghana, only half of the illness episodes
recognized as ‘severe’ were taken to a health facility. Additionally, past experience with similar
illnesses can motivate mothers to have a “wait and see attitude” to see if the illness recedes on its own,
particularly in situations where the cost of care is inhibitory (D’ Souza, 1999). Such health beliefs are
predicted by household size and the age and education of the mother.

Health care seeking behavior in Webuye, Kenya
- 21 -
3.5 CHARACTERISTICS OF THE HEALTH FACILITY
The outcome of any disease is influenced by delay in decisions to seek care, timely arrival at
appropriate diagnostic and treatment services and the receipt of adequate care from service providers.
(Noor et al., 2003) Lack of access to and the high cost of health care are perhaps the most common
deterrents to optimal health care seeking in both rural and urban communities. (Taffa et al., 2005)
3.5.1 ACCESSIBILITY
3.5.1.1 TRANSPORTATION INFRASTRUCTURE IN KENYA
At independence, Kenya had a road network comprising 41,800 km classified roads and 108,800 km
of unclassified roads. Of the classified network, only 1,800 km was paved while a large proportion of
the unpaved network was not all weather condition. The unclassified network ranged from roads to
tracks.
In the 1960s and early 1970s, the Government focused on the expansion and upgrading of the major
highways. Thereafter in the mid 1970s up to the 1980s, the focus shifted to construction of rural feeder
and minor roads under the Rural Access Roads Program in order to link economically productive rural
areas to market centers. A total of 8,700 km of rural roads were achieved.
However, in the early 90s, Kenya’s economy shrunk dramatically and this affected the Government’s
ability to provide road infrastructure. During this period, there was very little construction and
maintenance work which resulted in a drastic deterioration of the road network. A dedicated road fund
(fuel levy fund) was established in 1993 and this partly helped to arrest the rapid deterioration of the
network.
The poor state of the road infrastructure has been identified as a major constraint to economic and
social development. A road condition survey carried out in December 2002 by the Material Branch of
the Ministry of Roads and Public Works on the classified road network estimated that 17% of the
network is in good condition, 39% in fair condition (due for periodic maintenance), 27% in poor
condition (requires rehabilitation) and the remaining 16% is failed and requires reconstruction.
Of the unpaved classified network, it is estimated that 60% is in maintainable condition while the rest
requires heavy maintenance (re-graveling and rehabilitation). However, it should be noted that the
condition of the unpaved roads, particularly earth roads, can change quickly over time. (Kenya Roads
Board, 2004)
3.5.1.2 DISTANCE
One critical variable that has consistently been shown to affect access to care in developing countries
is the distance of the patient’s household from a clinic. The phenomenon of decreasing health care

Health care seeking behavior in Webuye, Kenya
- 22 -
utilization with increasing distance lived from a facility is often called the distance-decay effect.
(Feikin et al., 2009)
First documented in the 1920s in America, in recent years the distance-decay effect is mostly
described in developing countries. It has been demonstrated in Kenya, other African countries and
Asian countries, indicating that it is a robust finding in developing country settings.
Previous studies demonstrate a pronounced decline in clinic attendance with increasing distance of
residence. The rate of clinic attendance was found to halve by 2 to 3.5 km. In rural western Kenya the
declines in clinic attendance with distance are steeper; the reasons for this are unclear. In rural Asembo
in 2003–2004 (Feikin et al., 2009), few transport options existed except for walking. As such, the
gradient of time expended in visiting the clinic would increase steeply as distance from the clinic
increased. In other African settings where other forms of public transport exist, physical distance
might be less of a factor in clinic visitation than the cost of transport. In central Kenya, the building of
a new tarmac road resulted in little decrease in the distance-decay effect, probably because most
patients travelled by public transport and the cost of such transport did not fall with the new road.
Also the distance-decay effect was more marked in some clinics than others, suggesting that factors
intrinsic to the clinic also play a role in health care utilization. These variations in the distance-decay
effect based on sex, age and severity of illness, and particular clinic characteristics, show that other
important factors influence a decision to go to a certain clinic in addition to distance lived. (Feikin et
al., 2009)
3.5.2 BYPASSING
Since the Alma-Ata declaration (World Health Organization 1978), developing countries have focused
on expanding the coverage of curative health services. Despite the fact that some parts of Africa are
still remote from health facilities, much progress has been made in improving physical access to health
care. However, gains in health care outcomes have not followed health infrastructure investments.
(Klemick et al., 2009) This can be explained by the concept of ‘bypassing’.
Rural households in developing countries face considerably greater obstacles to obtain health care than
urban households because they live further from health facilities and because rural facilities are of
lower quality. For these households, access to health care is a matter of both distance and quality. In
the rural areas of developing countries, distance and quality both matter because households do not
seek care at the average facility nor at the closest facility, but rather they frequently choose to bypass
low quality health facilities in search of higher quality care. Thus, access is not simply a function of
the distance to the nearest facility, or of the quality of care at the nearest or average facility, but of the
distances and qualities of all facilities within a household’s health facility portfolio.

Health care seeking behavior in Webuye, Kenya
- 23 -
Bypassing, in which households pass closer facilities in order to seek care at facilities that are further
away, has been documented in a number of developing country settings. There is empirical evidence
that households know the quality of both visited and bypassed facilities; households bypass low
quality facilities in search of high quality facilities when they suffer from illnesses that are responsive
to high levels of quality.
Bypassing clearly increases the potential for overcrowding, and in many cases, it may be undesirable
because patients who need primary care bypass the appropriate facilities causing inefficient use of
higher order facilities. However, bypassing is an empirical reality, not a policy intervention. It has
been pointed out that many patients who bypass “appropriate” facilities to seek care at higher levels do
so because of inadequate care at these same “appropriate” facilities. (Klemick et al., 2009)
3.5.3 QUALITY OF CARE
If care is to be effective it should be of good quality. Quality of care, though, is a complex term.
Donabedian (1988) developed a framework for defining quality of care. She differentiated between
observed quality of care and perceived quality of care. The observed quality of care focuses merely on
the structure, the process and the outcome. Structure refers to facilities, personnel and organisation.
Process refers to interaction between provider and consumer. Outcome measures the extent to which
the service interaction meets the consumers’ expectations. The observed quality of care relates to
professionally defined standards of care and the perceived quality of care reflects the views of the
patients. For example, patients can be satisfied even after receiving treatment in a health system
which does not offer quality of care according to professional standards. The opposite is true if a
doctor offers good quality of care but communication with the patient does not satisfy the patient.
3.5.3.1 OBSERVED QUALITY OF CARE
Das, Hammer and Leonard (2008) point out that the quality of care provided at the average health
facility in developing countries is low, and much research points to the fact that the quality of care
provided to poor and rural populations is lower still. Klemick et al. (2009) highlights the low levels of
competence and lower levels of performance of the health care practitioners posted to these facilities.
While residents may live reasonably close to facilities, they have limited access to acceptable care
because competent providers are overwhelmingly concentrated in urban and peri-urban areas.
The health system fails to provide adequate services to rural communities on multiple counts:
- almost a quarter of health personnel are absent from their posts,
- almost no facilities are staffed up to nationally mandated standards,
- the personnel on duty in these facilities often exhibit poor diagnostic skills, and
- they also frequently fail to perform up to their skill level.
Health care seeking behavior in Webuye, Kenya
- 24 -
Indeed, while the rural population does seek modern medical care regularly, the failure of clinicians to
appropriately diagnose and treat easily curable illnesses leads to avoidable deaths. Clearly, the average
rural household has poor access to adequate care once competence is considered.
Absenteeism and vacancies have also received attention as factors contributing to poor health care
access in developing countries. In Bangladesh, high absentee and vacancy rates among medical staff
(35% and 26% nationwide, respectively) are widespread (Chaudhury et al., 2004). While absenteeism
in Bangladesh did not vary significantly with the income level of the region, the vacancy rate does,
leaving poorer areas with lower access to medical personnel. Even when clinicians are present, many
of them are unqualified to do their jobs and do not perform up to their skill level. (Klemick et al.,
2009)
3.5.3.2 PERCEIVED QUALITY OF CARE
Perceived quality of care, which only partly overlaps with medical quality of care, is thought to be an
important influence on health care-seeking (Gabrysch et al., 2009). Assessment of quality of services
largely depends on people's own experiences with the health system and those of people they know.
Although some elements such as waiting times can be measured objectively, the perception of whether
these are a problem and affect quality is more subjective. Elements of satisfaction cover satisfaction
with the outcome, the interventions and the service received – including staff friendliness, availability
of supplies and waiting times. In many cases, the medical 'culture' may clash with the patient’s and
this may lead to perceptions of poor quality.
3.5.4 COST OF CARE
Ill-health causes financial hardship for many households directly through spending on treatment and
indirectly by limiting labor participation and undermining people’s income generating activities. The
costs of seeking treatment and the coping strategies employed to either avoid or meet these costs are
potentially catastrophic. The World Health Organization (WHO) estimates that households that spend
40% or more of their non-food expenditure on treatment are likely to be impoverished (WHO 2000).
Equity in health care requires that all people benefit equally from health care services, regardless of
their socioeconomic status and place of residence, and that payment is based on the ability to pay.
The cost of care-seeking may include costs of transportation, medications and supplies, official and
unofficial provider fees as well as the opportunity costs of travel time and waiting time lost from
productive activities (Gabrysch et al., 2009)
3.5.4.1 KENYA
The Kenyan government has long prioritized equitable access to health care services for all Kenyans
(GOK 1999a, b). However, existing evidence suggests that the country’s health care financing
strategies have had negative implications for equity. A NHA-survey reported that households provide

Health care seeking behavior in Webuye, Kenya
- 25 -
51% of total health care expenditure through out-of-pocket payments (MOH 2003). This survey was
conducted at a time when 56.8% of Kenyans were living on less than US $1 per day. Such data
suggest that a majority of Kenyans face difficulties in raising money to pay for treatment.
In Kenya, shops are the cheapest source of treatment, while a visit to a private clinic is the most
expensive. Government health services are relatively cheap, but people often prefer private providers
because of perceived higher quality of services and a lack of trust in government services. (Chuma et
al., 2007). Poor households can bypass even free government services where these are perceived to be
of poor quality and seek services from private clinics. In doing so, they incur costs that could have
been avoided. This indicates the potential the public health system has to protect poor households from
high cost burdens. Current charging systems at government facilities, perceived weaknesses in quality
of care, and the relatively ‘high’ costs of private providers apparently deter many people from seeking
any formal care, particularly for chronic conditions.

Health care seeking behavior in Webuye, Kenya
- 26 -
METHODOLOGY
1 STUDY SITE AND POPULATION
Webuye is an industrial town in Bungoma District in the Western Province of Kenya. Located on the
main road to Uganda, the town is home to the Pan African Paper Mills, the largest paper factory in the
region. With the current economic crisis this factory has been closed since 2009 and will remain
closed for an undetermined time. This has had a major impact on the employment-rate in the area;
many of the employees have had to find other sources of income, primarily by farming.
It has a tropical climate, and the land around it is used mainly for subsistence agriculture. It has an
average altitude of 1532 meters. The town has an urban population of 19,600 individuals (1999
census). The area around Webuye is home to the Bukusu, one of the seventeen Kenyan sub-tribes of
the Luhya-tribe.
Study participants were recruited from the Misikhu sublocation. There are several small hospitals
around the study site including Webuye District Hospital, Lugulu Missionary Hospital and Bungoma
District Hospital.
Fig 7. Map of Misikhu Disease Surveillance Site Source: DSS Webuye

Health care seeking behavior in Webuye, Kenya
- 27 -
2 QUESTIONNAIRE DEVELOPMENT
After literature research, where a list with determinants of health care seeking behavior was
formulated, a draft questionnaire on health care seeking behavior was created.
We decided to use a semi-quantitative questionnaire. The initial questionnaire was formulated with the
help of the local coordinator of the DSS in Webuye. This was then pilot tested on 10 randomly
selected households in the Mahanga sublocation, next to the study-site, to validate questionnaire
reliability. After piloting the questionnaire, a few minor details were modified. The pilot study and the
main study were administered together with a trained DSS-administrator, a native Bukusu speaker.
The study was conducted in the language of preference of the participant, Bukusu, Kiswahili or
English. Literacy was not a requirement for participation.
Inclusion criteria were described as: 1. Individuals living in Misikhu-sublocation for at least 5 years
2. Individuals who are 18 years or above
The determinants of health care seeking behavior can be organized into independent and dependent
variables. Only the independent variables were explored in this questionnaire.
Independent variables include: - characteristics of the subject
- characteristics of the health service
- characteristics of the perceived illness
Questions on characteristics of the subject included location, sex, age, tribe, marital status, level of
education, economic status, household size, occupation and perception of health.
Level of education was subdivided into no formal education, primary education uncompleted or
completed, secondary education uncompleted and completed and postsecondary education. “Primary
education completed” was defined as obtaining the Kenya Certificate of Primary Education (KCPE).
KCPE is a certificate awarded to students after completing the approved eight-year course in primary
education in Kenya. “Secondary education completed” was analogically defined as obtaining the
Kenya Certificate of Secondary Education (KCSE).
Economic status was measured by assigning each individual a wealth index as well as asking their
monthly income. The wealth index (Sumba et al., 2008) was calculated as a composite number:
Wealth index = [(number of cows × 2) + number of sheep + number of goats + (number of acres of
land owned × 2)]
The number of cows and the number of acres of land owned were weighted more heavily than other
forms of property because cattle and land are the primary indicators of wealth in this community.
Individuals were then ranked according to quartiles of wealth index. The monthly income was
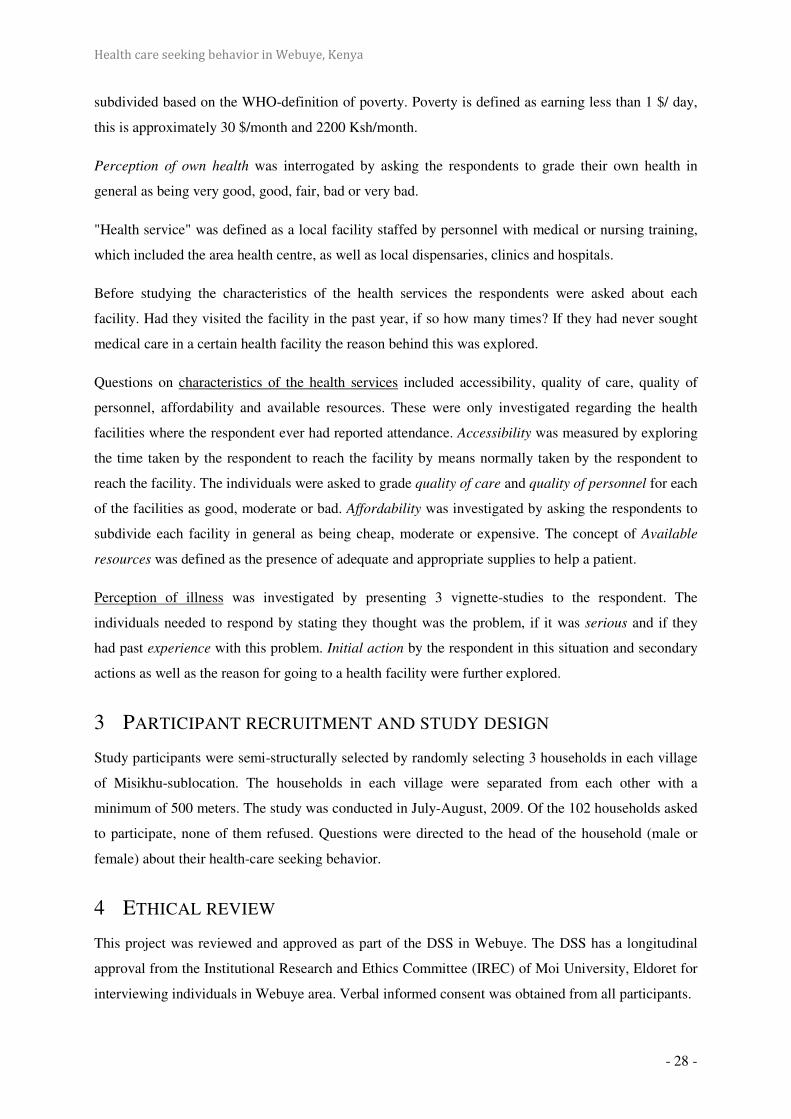
Health care seeking behavior in Webuye, Kenya
- 28 -
subdivided based on the WHO-definition of poverty. Poverty is defined as earning less than 1 $/ day,
this is approximately 30 $/month and 2200 Ksh/month.
Perception of own health was interrogated by asking the respondents to grade their own health in
general as being very good, good, fair, bad or very bad.
"Health service" was defined as a local facility staffed by personnel with medical or nursing training,
which included the area health centre, as well as local dispensaries, clinics and hospitals.
Before studying the characteristics of the health services the respondents were asked about each
facility. Had they visited the facility in the past year, if so how many times? If they had never sought
medical care in a certain health facility the reason behind this was explored.
Questions on characteristics of the health services included accessibility, quality of care, quality of
personnel, affordability and available resources. These were only investigated regarding the health
facilities where the respondent ever had reported attendance. Accessibility was measured by exploring
the time taken by the respondent to reach the facility by means normally taken by the respondent to
reach the facility. The individuals were asked to grade quality of care and quality of personnel for each
of the facilities as good, moderate or bad. Affordability was investigated by asking the respondents to
subdivide each facility in general as being cheap, moderate or expensive. The concept of Available
resources was defined as the presence of adequate and appropriate supplies to help a patient.
Perception of illness was investigated by presenting 3 vignette-studies to the respondent. The
individuals needed to respond by stating they thought was the problem, if it was serious and if they
had past experience with this problem. Initial action by the respondent in this situation and secondary
actions as well as the reason for going to a health facility were further explored.
3 PARTICIPANT RECRUITMENT AND STUDY DESIGN
Study participants were semi-structurally selected by randomly selecting 3 households in each village
of Misikhu-sublocation. The households in each village were separated from each other with a
minimum of 500 meters. The study was conducted in July-August, 2009. Of the 102 households asked
to participate, none of them refused. Questions were directed to the head of the household (male or
female) about their health-care seeking behavior.
4 ETHICAL REVIEW
This project was reviewed and approved as part of the DSS in Webuye. The DSS has a longitudinal
approval from the Institutional Research and Ethics Committee (IREC) of Moi University, Eldoret for
interviewing individuals in Webuye area. Verbal informed consent was obtained from all participants.

Health care seeking behavior in Webuye, Kenya
- 29 -
5 DATA ANALYSIS
The database was developed with the help of MS Access. The statistical program SPSS (Statistical
Package for the Social Science) was used for data analysis. Frequencies and proportions were used for
descriptive analysis. The Chi-square test was used to explore statistically significant findings.

Health care seeking behavior in Webuye, Kenya
- 30 -
RESULTS
1 BACKGROUND DATA
A total of 102 people were interviewed, 34 men and 68 women. The demographic characteristics of
the respondents were recorded. The majority of the respondents (54%) were between 31 and 50 years
of age, 25% were between 18 and 30, and 22% were over 50 years of age. Almost all (92 %) of the
interviewees were Bukusu. Only 13 of the 102 respondents (13%) were single, separated or widowed
at the time of the study, the majority (87%) were married. The mean household size consists of
approximately 4 adults and 5 children. The household size has been divided into quartiles to make
analysis more convenient. Level of education was subdivided into no or primary education (58%),
secondary education (36%), and postsecondary education, i.e. college or university level (6%).
(Tables A 1.1-1.6)
To evaluate the socio-economic status of the respondents, the monthly income, occupation and wealth
index were explored. Almost half of the interviewees (44%) earned less than 2200 Ksh a month (i.e.
less than 1 dollar a day), 56% had a monthly income that exceeded 2200 Ksh. The mean wealth index
was approximately 12; the index has been subdivided into quartiles for analytic convenience. The
majority (77%) of the respondents had farming as their major income and 12% were currently
unemployed. (Tables A 1.7-1.9)
The respondents were asked to rate their own health as very good, good, fair, bad or very bad. The
lesser half (47%) rated their health as being very good or good. 42% perceived their health as being
fair and 11% had a bad or very bad perception of their own health. (Table A 1.10)

Health care seeking behavior in Webuye, Kenya
- 31 -
2 HEALTH SERVICE ATTENDANCE
The respondents were asked if they had visited the particular health facilities and if so asked them how
many times they visited this facility in the past year.
By plotting the data in a cross-table (Table 2) it can be noted how the health care seeking behavior of
our respondents is distributed throughout the different health facilities.
The health facility most frequented was the pharmacy with 39.2% respondents who had visited the
pharmacy more than 5 times the past year. Second most frequented was the local health center with
4.9% of participants who visited this facility more than 5 times in the past year and 36.3% 2-5 times in
the past year.
The least frequented health facilities are the missionary hospital (59.8% never visited), the traditional
healer (55.9% never visited) and the private clinic/hospital (47.1% never visited).
never not this year once 2-5 times > 5 times
Count N % Count N % Count N % Count N % Count N %
Pharmacy 2 2,0% 11 10,8% 10 9,8% 39 38,2% 40 39,2%
Traditional healer 57 55,9% 21 20,6% 6 5,9% 13 12,7% 5 4,9%
Local health center 11 10,8% 31 30,4% 18 17,6% 37 36,3% 5 4,9%
Private clinic/hospital 48 47,1% 25 24,5% 8 7,8% 17 16,7% 4 3,9%
Missionary hospital 61 59,8% 29 28,4% 8 7,8% 1 1,0% 3 2,9%
District Hospital 24 23,5% 48 47,1% 14 13,7% 14 13,7% 2 2,0%
Table 2. Health service attendance

Health care seeking behavior in Webuye, Kenya
- 32 -
3 WHAT ARE THE REASONS FOR NOT GOING TO PARTICULAR
HEALTH FACILITIES?
If the respondents had never frequented a particular health facility they were asked the reason for non-
utilization. The answers were divided into 6 categories:
- The health facility is too far away.
- The health facility is too expensive.
- The health facility lacks medical expertise.
- I do not trust these people.
- I do not believe in this type (traditional/modern) of care.
- I haven’t been sick but I would consider going there.
- Other
In table 3 we can see the reasons for never seeking medical care in the facilities that were least visited:
Traditional medicine, private facilities and missionary hospitals.
The reason for not using traditional medicine was mainly that the respondents did not believe in this
type of medical care (49.1%). The lack of medical expertise was the second most common reason
(17.5%) for not using traditional medicine. Fourteen percent of respondents would consider
attendance but had not been sick.
Private facilities are perceived as being too expensive (71.4%). A minority (14.3%) believe that
private facilities are lacking medical expertise.
Missionary hospitals were cited as being too expensive, 82% of the respondents who had never visited
the missionary hospital were deterred by the cost of care.
Traditional Medicine Private Clinic/Hospital Missionary Hospital
Count N % Count N % Count N %
too far away 0 ,0% 3 6,1% 2 3,3%
too expensive 1 1,8% 35 71,4% 50 82,0%
lack of medical expertise 10 17,5% 7 14,3% 1 1,6%
no trust 7 12,3% 1 2,0% 0 ,0%
no believe 28 49,1% 0 ,0% 0 ,0%
haven’t been sick 6 10,5% 3 6,1% 7 11,5%
Other 4 7% 0 ,0% 1 1,6%
Table 3. Reasons of never going to a particular health facility.
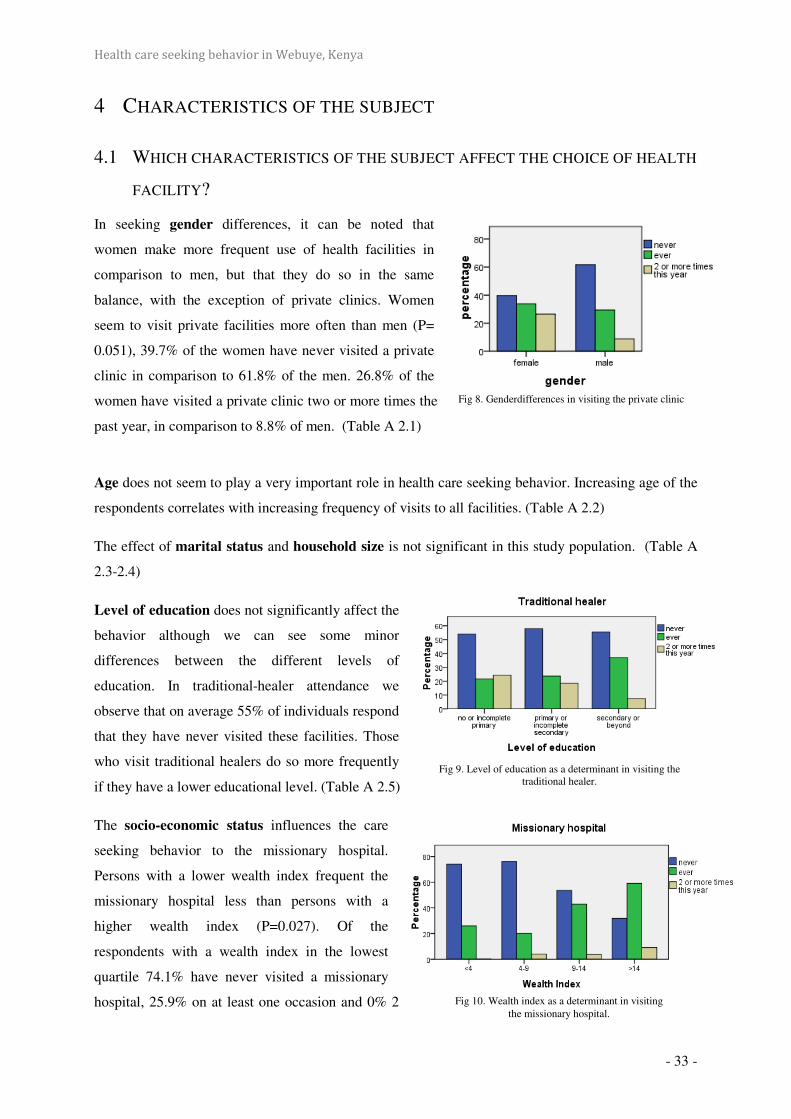
Health care seeking behavior in Webuye, Kenya
- 33 -
4 CHARACTERISTICS OF THE SUBJECT
4.1 WHICH CHARACTERISTICS OF THE SUBJECT AFFECT THE CHOICE OF HEALTH
FACILITY?
In seeking gender differences, it can be noted that
women make more frequent use of health facilities in
comparison to men, but that they do so in the same
balance, with the exception of private clinics. Women
seem to visit private facilities more often than men (P=
0.051), 39.7% of the women have never visited a private
clinic in comparison to 61.8% of the men. 26.8% of the
women have visited a private clinic two or more times the
past year, in comparison to 8.8% of men. (Table A 2.1)
Age does not seem to play a very important role in health care seeking behavior. Increasing age of the
respondents correlates with increasing frequency of visits to all facilities. (Table A 2.2)
The effect of marital status and household size is not significant in this study population. (Table A
2.3-2.4)
Level of education does not significantly affect the
behavior although we can see some minor
differences between the different levels of
education. In traditional-healer attendance we
observe that on average 55% of individuals respond
that they have never visited these facilities. Those
who visit traditional healers do so more frequently
if they have a lower educational level. (Table A 2.5)
The socio-economic status influences the care
seeking behavior to the missionary hospital.
Persons with a lower wealth index frequent the
missionary hospital less than persons with a
higher wealth index (P=0.027). Of the
respondents with a wealth index in the lowest
quartile 74.1% have never visited a missionary
hospital, 25.9% on at least one occasion and 0% 2
Fig 8. Genderdifferences in visiting the private clinic
Fig 9. Level of education as a determinant in visiting the traditional healer.
Fig 10. Wealth index as a determinant in visiting the missionary hospital.
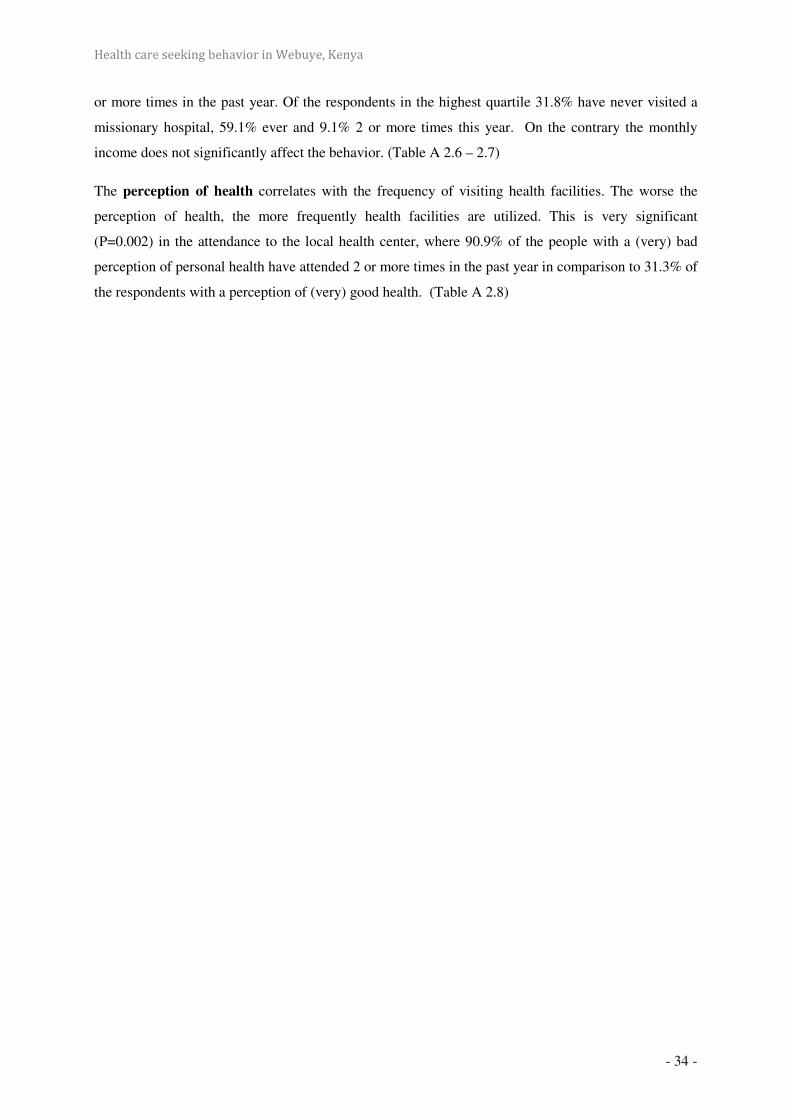
Health care seeking behavior in Webuye, Kenya
- 34 -
or more times in the past year. Of the respondents in the highest quartile 31.8% have never visited a
missionary hospital, 59.1% ever and 9.1% 2 or more times this year. On the contrary the monthly
income does not significantly affect the behavior. (Table A 2.6 – 2.7)
The perception of health correlates with the frequency of visiting health facilities. The worse the
perception of health, the more frequently health facilities are utilized. This is very significant
(P=0.002) in the attendance to the local health center, where 90.9% of the people with a (very) bad
perception of personal health have attended 2 or more times in the past year in comparison to 31.3% of
the respondents with a perception of (very) good health. (Table A 2.8)

Health care seeking behavior in Webuye, Kenya
- 35 -
5 CHARACTERISTICS OF THE FACILITY
5.1 HOW DO PEOPLE EXPERIENCE THE HEALTH FACILITIES THAT THEY
FREQUENT?
Accessibility was explored by recording the time that the respondents needed to reach a health facility
while using the means of transportation typically available to them. The pharmacy and the traditional
healer were the closest health-facilities. 73.7% of the respondents required less than 30 minutes to
reach a pharmacy or traditional healer. 83.6% needed less than one hour to reach a local health center,
while only 71.2% could reach a private clinic in this time. The district hospital was the farthest
facility, with 64.6% that needed more than one hour of travel time in comparison to the missionary
hospital where only 31% need more than one hour. (Table A 3.1)
A mean of 64% of the respondents rated the quality of care
in the facilities as being good, 28.7% moderate and 7.3% as
being bad. We observed that the worst quality of care was to
be found in the governmental health facilities with 13.2%
(local health center) and 15.2% (district hospital) of the
respondents with a perception of (very) bad quality. The
private clinic had the best quality of care with 75.5% of the
respondents that ranked this facility as of (very) good
quality of care and only 1.9% as (very) bad. The pharmacy
and the missionary hospital had similar rankings as the private
clinic. (Table A 3.2)
We observed the same distribution in the quality of personnel as in the quality of care. With a
descending percentage of respondents with an opinion of (very) good quality of personnel: the private
clinic (88.7%), missionary hospital (81.0%), pharmacy (79.8%), traditional healer (78.4%), district
hospital (59.5%) and local health center (59.3%). 15.2% perceived the personnel at the district hospital
as (very) bad. (Table A 3.3)
When looking at the affordability of the facilities we could see
that, with a convincing 95.2% of the respondents, the
missionary hospital was rated as an expensive facility. No one
rated this facility as being cheap. In comparison 13.9%, a clear
minority, described the district hospital as expensive. The
lowest cost of care was found in the local health center (60.4%:
cheap), comparing to the private clinic with the majority
Fig 11. Quality of care in the private clinic
Fig 12. Affordability of the missionary hospital.

Health care seeking behavior in Webuye, Kenya
- 36 -
(56.6%) evaluating the facility as expensive. The costs of visiting a traditional healer were mainly
viewed as being low (57.9%). The ideas about the pharmacy were divided. (Table A 3.4)
Availability of resources at the various facilities was explored. The ranking of descending availability
is as follows: the missionary hospital (86.0%), district hospital (76.3%), private clinic (41.5%), local
health center (34.1%). Resources were absent in the pharmacy (4.0%) and traditional healer (5.3%).
(Table A 3.5)
5.2 DO THE CHARACTERISTICS OF THE FACILITY AFFECT THE CHOICE OF
HEALTH FACILITY?
The characteristics of the pharmacy did not influence the number of visits substantially. We observed
that the better the perception of quality the more they frequent the pharmacy but this was not
significant (P=0.109). The quality of the personnel affected the number of visits to the private clinic,
with the better the respondents evaluate the personnel the more they had visited the clinic (P=0.083).
Individuals frequent the missionary hospital more when they value the quality of care better
(P=0.079). For the traditional healer, the local health center and the district hospital we could not find
any significant influence of the individual characteristics of these facilities on the health care seeking
behavior.
On the other hand we observed some significant findings when cross relating the characteristics of one
facility with the visitation frequency of another facility. We could see that the better the respondents
evaluate quality of personnel in the district hospital the less they frequent a traditional healer
(P=0.007). As well as, the less time needed to visit a private clinic (P=0.005) or the better the
perception of the personnel in the local health center (P=0.084) the less they attend the district
hospital. The respondents visit the private clinic less often, depending on how close they live to a
local health center (P=0.109) or perceive the quality of the personnel at the pharmacy (P= 0.062) or at
the district hospital (P=0.004) as being good. The shorter time (P=0.011) individuals need to attend a
private clinic or the better they evaluate the quality of care (P=0.022) in this facility, the less
frequently they visit a missionary hospital. Respondents that evaluated the quality of care (P=0.026)
or the quality of personnel (P=0.068) in the district hospital as being good frequent the missionary
hospital less. When the affordability of the local health center was viewed as being cheap (P=0.011)
the missionary hospital was utilized less frequently.
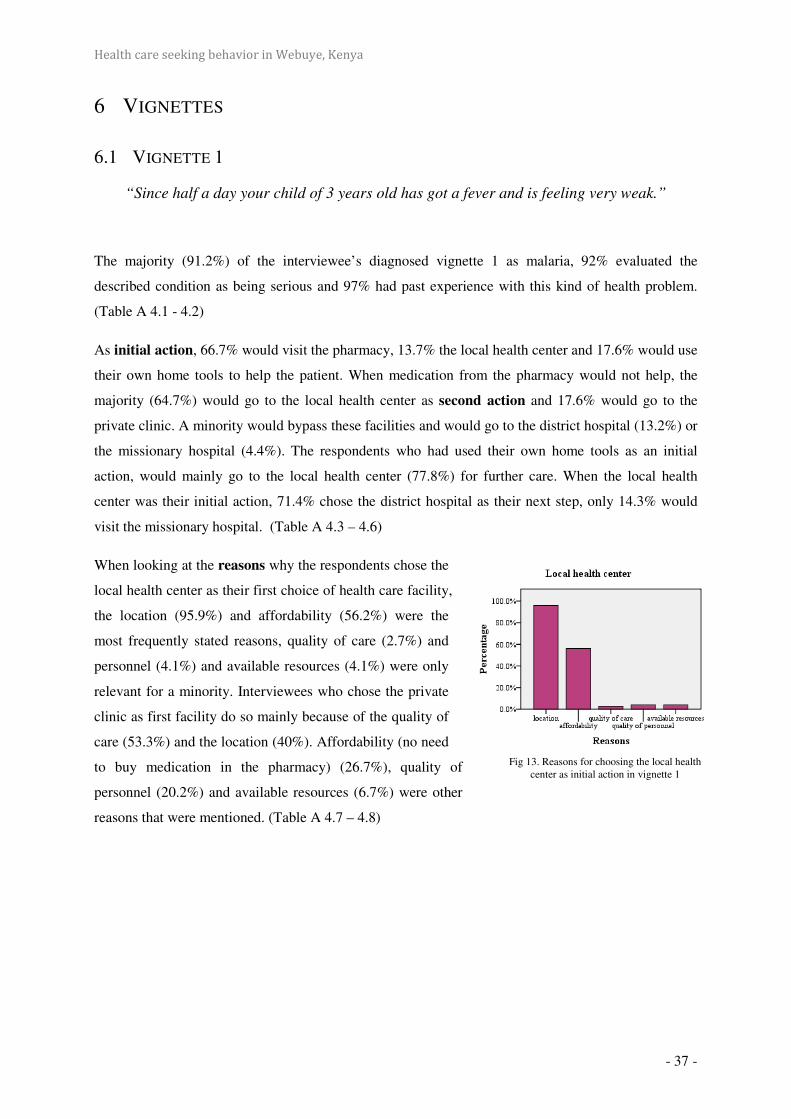
Health care seeking behavior in Webuye, Kenya
- 37 -
6 VIGNETTES
6.1 VIGNETTE 1
“Since half a day your child of 3 years old has got a fever and is feeling very weak.”
The majority (91.2%) of the interviewee’s diagnosed vignette 1 as malaria, 92% evaluated the
described condition as being serious and 97% had past experience with this kind of health problem.
(Table A 4.1 - 4.2)
As initial action, 66.7% would visit the pharmacy, 13.7% the local health center and 17.6% would use
their own home tools to help the patient. When medication from the pharmacy would not help, the
majority (64.7%) would go to the local health center as second action and 17.6% would go to the
private clinic. A minority would bypass these facilities and would go to the district hospital (13.2%) or
the missionary hospital (4.4%). The respondents who had used their own home tools as an initial
action, would mainly go to the local health center (77.8%) for further care. When the local health
center was their initial action, 71.4% chose the district hospital as their next step, only 14.3% would
visit the missionary hospital. (Table A 4.3 – 4.6)
When looking at the reasons why the respondents chose the
local health center as their first choice of health care facility,
the location (95.9%) and affordability (56.2%) were the
most frequently stated reasons, quality of care (2.7%) and
personnel (4.1%) and available resources (4.1%) were only
relevant for a minority. Interviewees who chose the private
clinic as first facility do so mainly because of the quality of
care (53.3%) and the location (40%). Affordability (no need
to buy medication in the pharmacy) (26.7%), quality of
personnel (20.2%) and available resources (6.7%) were other
reasons that were mentioned. (Table A 4.7 – 4.8)
Fig 13. Reasons for choosing the local health center as initial action in vignette 1
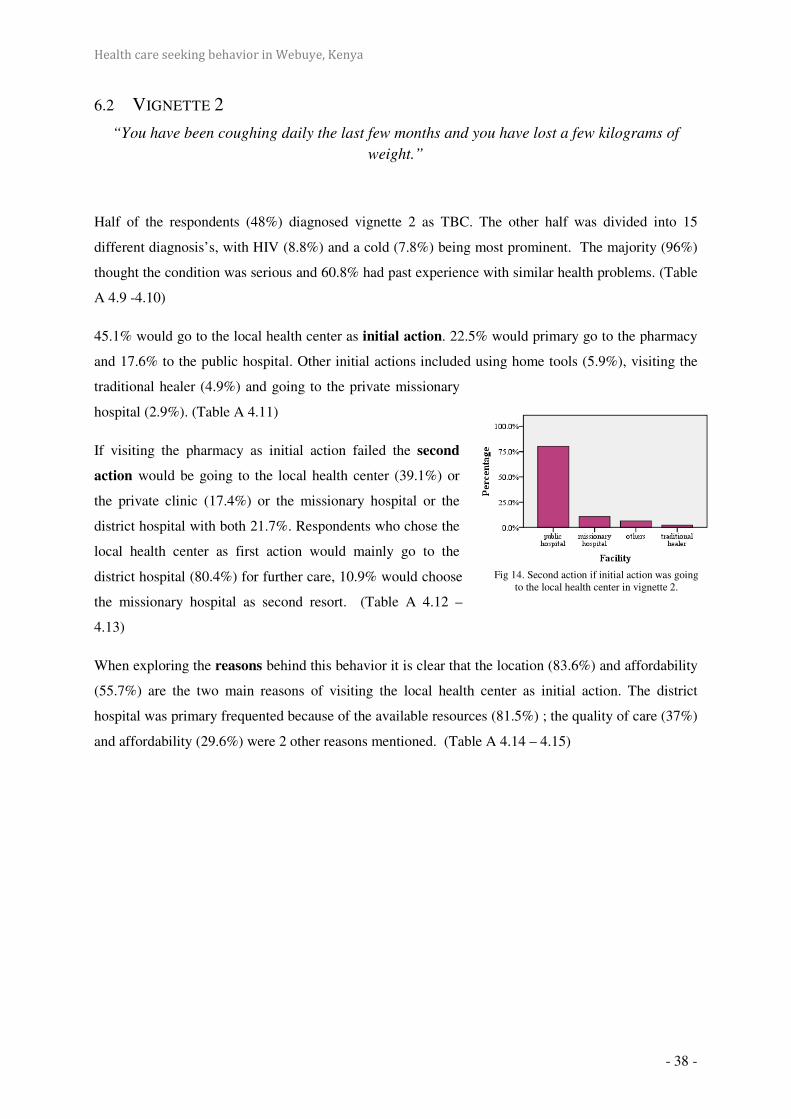
Health care seeking behavior in Webuye, Kenya
- 38 -
6.2 VIGNETTE 2
“You have been coughing daily the last few months and you have lost a few kilograms of
weight.”
Half of the respondents (48%) diagnosed vignette 2 as TBC. The other half was divided into 15
different diagnosis’s, with HIV (8.8%) and a cold (7.8%) being most prominent. The majority (96%)
thought the condition was serious and 60.8% had past experience with similar health problems. (Table
A 4.9 -4.10)
45.1% would go to the local health center as initial action. 22.5% would primary go to the pharmacy
and 17.6% to the public hospital. Other initial actions included using home tools (5.9%), visiting the
traditional healer (4.9%) and going to the private missionary
hospital (2.9%). (Table A 4.11)
If visiting the pharmacy as initial action failed the second
action would be going to the local health center (39.1%) or
the private clinic (17.4%) or the missionary hospital or the
district hospital with both 21.7%. Respondents who chose the
local health center as first action would mainly go to the
district hospital (80.4%) for further care, 10.9% would choose
the missionary hospital as second resort. (Table A 4.12 –
4.13)
When exploring the reasons behind this behavior it is clear that the location (83.6%) and affordability
(55.7%) are the two main reasons of visiting the local health center as initial action. The district
hospital was primary frequented because of the available resources (81.5%) ; the quality of care (37%)
and affordability (29.6%) were 2 other reasons mentioned. (Table A 4.14 – 4.15)
Fig 14. Second action if initial action was going to the local health center in vignette 2.
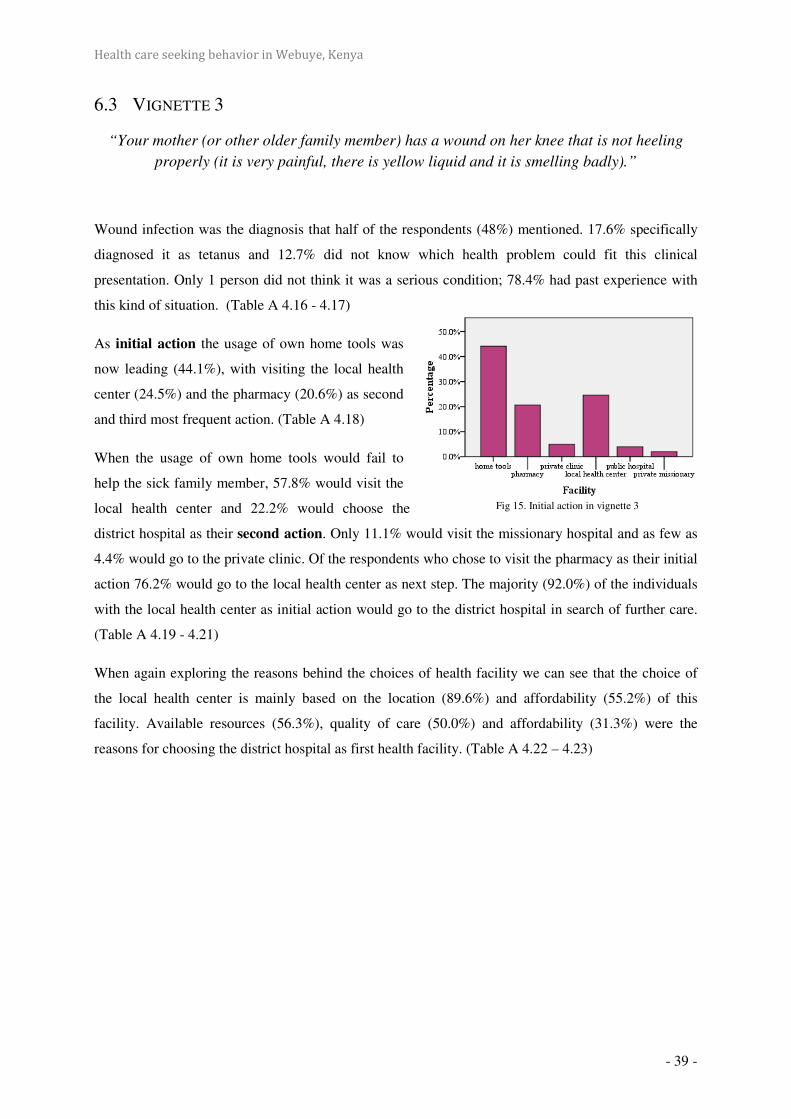
Health care seeking behavior in Webuye, Kenya
- 39 -
6.3 VIGNETTE 3
“Your mother (or other older family member) has a wound on her knee that is not heeling
properly (it is very painful, there is yellow liquid and it is smelling badly).”
Wound infection was the diagnosis that half of the respondents (48%) mentioned. 17.6% specifically
diagnosed it as tetanus and 12.7% did not know which health problem could fit this clinical
presentation. Only 1 person did not think it was a serious condition; 78.4% had past experience with
this kind of situation. (Table A 4.16 - 4.17)
As initial action the usage of own home tools was
now leading (44.1%), with visiting the local health
center (24.5%) and the pharmacy (20.6%) as second
and third most frequent action. (Table A 4.18)
When the usage of own home tools would fail to
help the sick family member, 57.8% would visit the
local health center and 22.2% would choose the
district hospital as their second action. Only 11.1% would visit the missionary hospital and as few as
4.4% would go to the private clinic. Of the respondents who chose to visit the pharmacy as their initial
action 76.2% would go to the local health center as next step. The majority (92.0%) of the individuals
with the local health center as initial action would go to the district hospital in search of further care.
(Table A 4.19 - 4.21)
When again exploring the reasons behind the choices of health facility we can see that the choice of
the local health center is mainly based on the location (89.6%) and affordability (55.2%) of this
facility. Available resources (56.3%), quality of care (50.0%) and affordability (31.3%) were the
reasons for choosing the district hospital as first health facility. (Table A 4.22 – 4.23)
Fig 15. Initial action in vignette 3

Health care seeking behavior in Webuye, Kenya
- 40 -
DISCUSSION
1 LIMITATIONS This study tries to identify factors which play a role in people’s decisions with regard to where to seek
help if they are ill. The limitations of the study mainly concern the small number of respondents in
some of the sub-groups. For example, only six respondents could be included in the group of people
with higher education. This is, of course, illustrative of the general level of education of the people in
more remote areas of Webuye-district, but it complicates the analysis and interpretation of the results.
Some attempt was made to secure statistically significant samples, although this was seldom possible.
The quality of the data has not been evaluated.
No further statistical programs were run on the data, because of lack of statistical power. For that
reason, the study should be viewed as a preliminary study that will help future researchers to
determine the levels of variation within a population, in order to determine statistically significant
sample sizes and selection criteria. Nevertheless, the data is an important illustration of the economical
and sociological patterns in the use of health services.
The model of Kroeger has been used in this paper to describe which variables can play a role in
people’s decisions with regard to where to go for treatment. Not all variables mentioned in the models
were included in this study. Many authors have criticized them and even Kroeger himself has created
modifications of his own model, paying attention to the viewpoints of his critics. For example the
classification of the explanatory variables in ‘independent’ variables which are clearly not
independent of each other, e.g. the characteristics of the subject will undoubtedly influence the
characteristics of the perceived illness. Also the model omits the ‘need factors’ which are central
for understanding health-seeking behavior (Weller et al., 1997).
2 CONCLUSIONS
2.1 HEALTH SERVICE ATTENDANCE
When looking at health service attendance over the last year we can see that the pharmacy was the
most frequented facility of all; 40% have been there more than five times in the past year. This can
mean that many people go to the pharmacy directly to purchase medicines without first visiting a
competent health worker for correct diagnosing. In the pharmacy there are no trained health workers to
diagnose and treat patients; therefore a lot of patients are given wrong/unsafe medication with the
result being a delay in going to a health facility while the disease is getting more complicated. More
research on this topic is needed to explore this behavior and its consequences.
Health care seeking behavior in Webuye, Kenya
- 41 -
The second most frequented facility was the local health center and this can be viewed as a good
result, because this is an example of appropriate first-line-based health care.
The least frequented facilities were the private facilities (the private clinic and missionary hospital)
and the traditional healer. Still we need to consider the possible bias that may have influenced the
results of using traditional medicine. In the questionnaire we interrogated the respondents about the
use of traditional herbs but we experienced some confusion with visiting traditional healers
(witchdoctors) with whom they may not want to be linked. This could cause a false-low number of
users of traditional herbs, which are actually thought to be very frequent in this area. The major reason
for not using traditional medicine was the disbelieve in traditional medicine. For the private facilities,
affordability was the determinant factor in not visiting these facilities. This was the reason cited by
82% of the respondents who had never utilized missionary hospital services. This significantly limits
availability of good quality health care services to poorer individuals.. This is obvious when
comparing the bed-occupancy in a private with a governmental facility, with a (too) high occupancy in
governmental facilities while private facilities have a (too) low occupancy
2.2 CHARACTERISTICS OF SUBJECT/FACILITY
Of the ‘characteristics of the subject’ only a few had some influence on the person’s behavior. The
importance of gender as a determinant in the choice of health care options was not clear in this study.
Women visit private facilities more often than men (P=0.051). But more research is needed to find out
how spouses (and their financial strength) influence the health care seeking behavior of the patient.
Increasing age of the respondents correlates with increasing frequency of visits to all facilities.
Clearly, the number, frequency and severity of diseases in older people lead to increasing health care
utilization.
Observations in Webuye showed that on average 55% of the individuals respond that they have never
visited a traditional healer. Those who visit traditional healers do so more frequently if they have
lower educational level. It makes sense to assume that people with a higher level of education have
more knowledge about modern medicine, and thus make less use of traditional medicine.
Socio-economic status affected the person’s choice of facility when regarding their wealth index as
determinant of their SES. Persons with a lower wealth index frequent the missionary hospital less than
persons with a higher wealth index (P=0.027). The higher costs of missionary hospitals deter socio-
economically weak individuals from attendance for medical treatment.
The perception of personal health correlates with the frequency of attendance at health facilities.
Obviously, those with a poor perception of personal health attend health facilities more frequently for
medical care.

Health care seeking behavior in Webuye, Kenya
- 42 -
Characteristics of the facility were evaluated by determining accessibility, quality of care, quality of
personnel, affordability and availability of resources of each facility. The accessibility of services was
measured by asking respondents how long they take to reach the facility using transportation normally
available to them. Pharmacy and traditional healer were the closest facilities and the district hospital
the furthest.
When observing the quality of care and personnel, the private facilities score much higher than the
governmental facilities such as the local health center and the district hospital. Still conclusions can
not be drawn about technical quality in these facilities with certainty. Technical quality can be poor,
even when consumers express satisfaction with the services, and the opposite is also true. In addition,
respondents are reluctant to express complaints about their health services, and tend to give ‘socially
desirable’ answers. Interviewers can easily be identified as representatives of the health service. By
asking the respondents about their perceptions of the received care and the quality of the personnel
separately could partly prevent this bias. The most common frustrations in the governmental facilities
were the long waiting-times and the indolence of the personnel.
Affordability of the treatment is another important component in the decision-making. Here we can
see again the difference between governmental and private facilities. Private facilities are mostly rated
as being very expensive, however governmental facilities are not always found to be cheap because
medication needed for treatment has to be purchased in the pharmacy. It is evident that all these
characteristics have a combined effect on the health care seeking behavior of persons. This could be
analyzed with the use of a multiple regression test but our study lacks the statistical power to carry out
this level of testing.
2.3 VIGNETTE STUDY
In the vignette-study it was apparent that visiting the pharmacy was the initial action for a lot of
people, but this varied in the different vignettes. In vignette 1 where malaria was the inferred diagnosis
67% would visit the pharmacy as initial action, in comparison to vignette 2 (TBC) where only 22.5%
would go to the pharmacy first and 20.6% in vignette 3 (wound infection). In vignette 2 and 3
respondents were much more likely to go to the local health center as first facility. This shows the
effect of the characteristics of the perceived illness on the behavior. Diseases that are common and
known (such as malaria) would be more likely to be self-treated than other, uncommon diseases. The
local health center is a popular facility to seek medical care mainly because of the location but also
because of the affordability. When choosing the private clinic as the preferred facility most were
seeking the quality of care available in these facilities.
15 to 20% of the respondents would by-pass first-line facilities and would go directly to the district or
missionary hospital. The reason for this was mainly the perceived severity of the situation and
therefore the need for better and more medical resources that could be found in these facilities.

Health care seeking behavior in Webuye, Kenya
- 43 -
3 INTERVENTIONS
3.1 PRIMARY HEALTH CARE: NOW MORE THAN EVER!
In the WHO-report 2008 (Primary Health Care: Now more than ever!) five common shortcomings of
health-care delivery are explored.
- Inverse care. People with the most means – whose needs for health care are often less –
consume the most care, whereas those with the least means and greatest health problems
consume the least. Public spending on health services most often benefits the rich more than
the poor in high- and low income countries alike.
- Impoverishing care. Wherever people lack social protection and payment for care is largely
out-of-pocket at the point of service, they can be confronted with catastrophic expenses. Over
100 million people annually fall into poverty because they have to pay for health care.
- Fragmented and fragmenting care. The excessive specialization of health-care providers and
the narrow focus of many disease control programs discourage a holistic approach to the
individuals and the families they deal with and do not appreciate the need for continuity in
care. Health services for poor and marginalized groups are often highly fragmented and
severely under-resourced, while development aid often adds to the fragmentation.
- Unsafe care. Poor system design that is unable to ensure safety and hygiene standards leads to
high rates of hospital-acquired infections, along with medication errors and other avoidable
adverse effects that are an underestimated cause of death and ill-health.
- Misdirected care. Resource allocation clusters around curative services at great cost,
neglecting the potential of primary prevention and health promotion to prevent up to 70% of
the disease burden. At the same time, the health sector lacks the expertise to mitigate the
adverse effects on health from other sectors and make the most of what these other sectors can
contribute to health.
To address these shortcomings they suggest four sets of reforms that reflect a convergence between the
values of primary health care, the expectations of citizens and the common health performance
challenges that cut across all contexts.
They include:
- universal coverage reforms that ensure that health systems contribute to health equity, social
justice and the end of exclusion, primarily by moving towards universal access and social
health protection;

Health care seeking behavior in Webuye, Kenya
- 44 -
- service delivery reforms that re-organize health
services around people’s needs and expectations, so as
to make them more socially relevant and more
responsive to the changing world, while producing
better outcomes;
- public policy reforms that secure healthier
communities, by integrating public health actions with
primary care, by pursuing healthy public policies
across sectors and by strengthening national and
transnational public health interventions; and
- leadership reforms that replace disproportionate reliance on command and control on one
hand, and laissez-faire disengagement of the state on the other, by the inclusive, participatory,
negotiation-based leadership indicated by the complexity of contemporary health systems.
3.2 IMPLEMENTATION
3.2.1 COST OF CARE Barriers to access are important factors of inequity: user fees, in particular, are important sources of
exclusion from needed care. Moreover, when people have to purchase health care at a price that is
beyond their means, a health problem can quickly precipitate their fall into poverty or bankruptcy.
That is why extension of the supply of services has to go hand-in-hand with social health protection,
through pooling and pre-payment instead of out-of-pocket payment of user fees. The reforms to bring
about universal coverage – i.e. universal access combined with social health protection – constitute a
necessary condition to improved health equity.
The Kenyan government is considering ways of protecting poor households from catastrophic health
care costs. For example, user fees in dispensaries and health centers were reduced in 2004, and debates
on a social health insurance program are ongoing. Eliminating all user fees in government facilities
(including hospitals) would be a positive move towards protecting households from high costs of
illness. Such an approach, however, requires additional resources to meet the expected rise in demand
and to ensure that quality of care is maintained (Chuma et al. 2006).
Other alternatives might be to promote community prepayment schemes and to strengthen the public
health system in order to attract people and prevent them from incurring higher costs at private
providers, or failing to seek treatment altogether. Russell (2004) argues that even if health services are
improved, they cannot protect households from all illness costs. He recommends that health policy
research and debates should be broadened to include interventions beyond the health sector;
interventions that protect the poor and increase their incomes. The challenge with interventions within
Health care seeking behavior in Webuye, Kenya
- 45 -
and beyond the health sector remains as to how to ensure that these pro-poor policies actually benefit
the poor. Evidence shows that the rich tend to benefit from policies at the expense of the poor. There is
need for further research on why this is the case. Such studies should demonstrate the various factors
that act as barriers for the poor, including non-financial factors, and identify measures that could be
put in place when designing policies and interventions that target the poor.
3.2.2 QUALITY OF CARE
Eliminating absenteeism, eliminating vacancies, upgrading the level of staff training, and reducing the
gap between competence (ability to properly care for patients) and performance (actual quality
provided to the average patient) found in government-run facilities are other points that need to be
addressed.
The data on health seeking behavior clearly demonstrate that households do not always visit the
nearest health facility, but rather bypass that facility and travel to facilities with higher quality. This
behavior changes expected benefits of health interventions. In particular, interventions that focus on
improving quality in all health facilities (such as eliminating vacancies or upgrading staffing levels)
are less beneficial when patients bypass because their behavior had already improved the quality of
care received. Klemick (2008) suggest that policies improving the quality of care provided at a few
facilities have greater benefits when taking into account the fact that patients will respond by seeking
out these improved facilities. They indicate that aggressive policies of staff training and hiring— such
as filling vacant posts and upgrading the average qualifications at rural facilities— are required to
achieve significant improvements in access to competent health care. While reducing absenteeism
alone has a minor impact, coupling absenteeism reductions with stronger incentives for clinicians at
public facilities to perform up to the level of their non-public sector counterparts does improve the
quality of care.
Regularization of the pharmacy-industry is a necessary restructuring not to be forgotten. There is a
need for qualified personnel who know what medication to give in minor illnesses, and above all
where to send the patient when a doctor needs to be consulted. The available over-the-counter
medication should be limited.
3.2.3 ACCESSIBILITY Improving rural roads offers an alternative approach to increasing patient access without new
investments in clinician quality, leading to considerable reductions in patient travel times. When
taking bypassing into account, policies that reduce travel times (such as improving the road network)
lead to significant reductions in costs—even if there is no improvement in quality at any particular
facility—because patients spend less to access acceptable care. The benefits of improved
transportation infrastructure have received little attention in the literature on road-building and
development.

Health care seeking behavior in Webuye, Kenya
- 46 -
3.3 PRIMARY HEALTH CARE
The Commission on Social Determinants of Health of WHO launched the report Closing the Gap in a
Generation: Health Equity Through Action on the Social Determinants of Health in November 2008.
The executive summary of the report states clearly in the chapter ‘Universal Health Care’:
‘Healthcare systems have better health outcomes when built on primary health care PHC —
that is, both the PHC-model that emphasises locally appropriate action across the range of
social determinants, where prevention and promotion are in balance with investment in
curative interventions, and an emphasis on the primary level of care with adequate referral to
higher levels of care.’
The hypothesis of De Maeseneer et al. is that primary health care can be a strategy for promoting
health equity and intersectoral action. The first prerequisite is a high level of accessibility of the
primary healthcare team. The second is that the team should deliver high-quality care. Moreover, the
team should interact with different networks (such as, education, work, economy, and housing) that
are related to important sectors. Apart from an approach to individuals and families, the primary
healthcare team should also address the community, utilising the COPC (Community Oriented
Primary Care) strategy. COPC, the direct action of the primary healthcare team, and intersectoral
networking will enhance the social cohesion in the community. The actions of the primary healthcare
team, curative and preventive, and the increased social cohesion in the community will lead to
empowerment of the people. This empowerment is situated at different levels: physical, psychological,
social, and cultural. The empowerment of the population will decrease the vulnerability to factors that
may contribute to health inequity. Moreover, as the COPC action will address the living conditions of
the local population, the exposure of the people to factors that may be a threat to their health will
diminish and the differential vulnerability will decrease. Finally, a better education, better working
conditions and decreased unemployment, better housing conditions, and access to safe food and water,
will improve the structural determinants that influence the social stratification. Many research findings
support this hypothesis.
The family medicine training in the framework of the primary healthcare teams in Africa puts the
focus on the contribution primary health care makes to improvement of the welfare of the poor by
addressing the social determinants of health in the community. Linking education to practice, has
been, and is still, a key feature of a socially accountable medical faculty.
Also in Africa, which suffers more than any continent from a focus on specialty care in central
hospitals in big cities, we have to bring the students to those areas and people that are most in need.
So that every citizen has access to a person-oriented, comprehensive, and community-embedded
quality primary health care, which is a fundamental right.

Health care seeking behavior in Webuye, Kenya
- 47 -
3.3.1 PRIMAFAMED The importance of quality PHC, affordable, accessible and equitable is clear. Well trained physicians
and other PHC-providers are needed in PHC, therefore family medicine training in the African context
is very important. The Primafamed projects work together with universities in Sub Saharan Africa on
the development of family medicine training where doctors are trained to specialize in PHC. The
family medicine training is important to create a bigger pool of well-trained human resources in
primary health care.
A long relationship between Ghent University Department of family medicine and PHC and
departments of family medicine in South and Eastern Africa the Primafamed project started in 2008.
Originally, it was a two-year project funded by the European Union in the framework of the Edulink
ACP EU program. With ten partner universities from eight countries the PHC and family medicine
network had as its goal to develop and improve family medicine training in Sub Saharan Africa.
The project – Primafamed network – focuses on development and strengthening family medicine
training in the partner universities, creating networks between these universities, the associate
universities in South Africa and other universities with family medicine training. South – South
cooperation is important to enable sharing and learning from each other. Development and upgrading
family medicine training, curricula and tools, accreditation and quality assurance is important in the
project.
3.4 BENEFIT OF THE STUDY
Any study of health care that ignores health-seeking behavior (by looking, for example, at averages
across all facilities) makes the same mistake as policies that for example assume patients do not travel
beyond their nearest facility. Governments with limited resources should focus on policies that take
advantage of health seeking behavior, rather than ignoring it.
The study provides increasing insight for policy makers into how people in Webuye choose where to
go for treatment. Most probably the findings can be valuable for health care policy-makers in similar
rural districts, with comparable health problems and socio-demographic features, in sub-Saharan
Africa.
Health care seeking behavior in Webuye, Kenya
- 48 -
ACKNOWLEDGMENTS
I thank the Moi University, Eldoret and the District Hospital, Webuye for their warm welcome in
Eldoret and Webuye. The members of the DSS-Webuye and many other health workers were very
helpful during the research period. More special thanks for Prof. Dr. Otsyula, Prof. Dr. Opata, Dr.
Chege, Dr. Obala, and David Odhiambo for all the help and support, for Prof. Dr. De Maeseneer and
Dr. Flinkenflögel for the assistance from Belgium, for Ben Kwobe for the translation, for Dr. Victor
Buckwalter and Christina Buckwalter for their hospitality and for Jane and Masemche for the good
times together.

Health care seeking behavior in Webuye, Kenya
- 49 -
REFERENCES
Adazu K, Lindblade KA, Rosen DH, Odhiambo F, Ofware P, Kwach J, Van Eijk AM, Decock KM,
Amornkul P, Karanja D, Vulule JM, Slutsker L. Health and demographic surveillance in rural
Western Kenya: A platform for evaluating interventions to reduce morbidity and mortality
from infectious diseases. Am J Trop Med Hyg. 2005 Dec;73(6):1151-8.
Andersen R, Newman J. Societal and Individual Determinants of Medical Care Utilisation in the
United States. Milbank Q. 1973; 51(1):95-124
Chaudhury, Nazmul and Jeffrey S. Hammer. Ghost doctors: absenteeism in Bangladeshi health
facilities. World Bank Economic Review, 2004, 18 (3), 423-441.
Chuma J, Gilson L, Molyneux C. Treatment-seeking behaviour, cost burdens and coping strategies
among rural and urban households in Coastal Kenya: an equity analysis. Trop Med Int
Health. 2007 May;12(5):673-86.
Commission on Social Determinants of Health. Closing the gap in a generation: health equity through
action on the social determinants of health. Geneva:World Health Organization, 2008.
Das J, Hammer J, Leonard K. The Quality of Medical Advice in Low Income Countries. J Econ
Perspect. 2008 Spring;22(2):93-114.
De Maeseneer J, Flinkenflögel M. Primary health care in Africa: do family physicians fit in? Br J Gen
Pract. 2010 Apr;60(573):286-92.
Donabedian A. Quality of care: How can it be assessed. JAMA. 1988 Sep 23-30;260(12):1743-8.
D'Souza RM. Care Seeking Behavior. Clin Infect Dis. 1999 Feb;28(2):234.
Feikin DR, Nguyen LM, Adazu K, Ombok M, Audi A, Slutsker L, Lindblade KA. The impact of
distance of residence from a peripheral health facility on pediatric health utilisation in rural
western Kenya. Trop Med Int Health. 2009 Jan;14(1):54-61. Epub 2008 Nov 14.
Gabrysch S, Campbell OM. Still too far to walk: literature review of the determinants of delivery
service use. BMC Pregnancy Childbirth. 2009 Aug 11;9:34.
Glei, D. A., & Goldman, N. (2000). Understanding ethnic variation in pregnancy-related health care
in rural Guatemala. Ethnicity and Health, 5(1), 5–22.
Grosse RN, Auffrey C. Literacy and health status in developing countries. Annu Rev Public Health
1989, 10:281-297.
Heather Klemick, Kenneth Leonard, Melkiory C. Masatu. Defining Access to Health Care: Evidence
on the Importance of Quality and Distance in Rural Tanzania. American Journal of
Agricultural Economics, 2009, vol. 91, issue 2, pages 347-358
Hill Z, Kendall C, Arthur P, Kirkwood B, Adjei E. Recognizing childhood illness and their traditional
explanations: exploring options for care-seeking interventions in the context of the IMCI
strategy in rural Ghana. Trop Med Int Health. 2003 Jul;8(7):668-76.

Health care seeking behavior in Webuye, Kenya
- 50 -
INDEPTH, 2001. Population and Health in Developing Countries. Volume 1. Population, Health, and
Survival at INDEPTH Sites. Ottawa, Ontario, Canada: International Development Research
Centre.
Kahn K, Tollman SM, Collinson MA, Clark SJ, Twine R, Clark BD, Shabangu M, Gómez-Olivé FX,
Mokoena O, Garenne ML. Research into health, population and social transitions in rural
South Africa: Data and methods of the Agincourt Health and Demographic Surveillance
System. Scand J Public Health Suppl. 2007 Aug;69:8-20.
Klemick H., Leonard K.L., Masatu M.C. Defining Access to Health Care: Evidence on the Importance
of Quality and Distance in Rural Tanzania
Kroeger A. Anthropological and socio-medical health care research in developing countries. Social
Science and Medicine 1983;17:147–61.
Makinen M, Waters H, Rauch M, Almagambetova N, Bitran R, Gilson L, McIntyre D, Pannarunothai
S, Prieto AL, Ubilla G, Ram S. Inequalities in health care use and expenditures: empirical
data from eight developing countries and countries in transition. Bull World Health Organ.
2000;78(1):55-65.
Muller I, Smith T, Mellor S, Rare L & Genton B. The effect of distance from home on attendance at a
small rural health centre in Papua New Guinea. Int J Epidemiol. 1998 Oct;27(5):878-84
National Coordinating Agency for Population and Development (NCAPD) [Kenya], Ministry of
Health (MOH), Central Bureau of Statistics (CBS), ORC Macro. 2005. Kenya Service
Provision Assessment Survey 2004. Nairobi, Kenya: National Coordinating Agency for
Population and Development, Ministry of Health, Central Bureau of Statistics, and ORC
Macro.
Ngom P, Binka FN, Phillips JF, Pence B, Macleod B. Demographic surveillance and health equity in
Sub-Saharan Africa. Health Policy Plan. 2001 Dec;16(4):337-44.
Noor AM, Zurovac D, Hay SI, Ochola SA, Snow RW. Defining equity in physical access to clinical
services using geographical information systems as part of malaria planning and monitoring
in Kenya. Trop Med Int Health. 2003 Oct;8(10):917-26.
Norcross WA, Ramirez C, Palinkas LA. The influence of women on the health care seeking behavior
of men. J Fam Pract. 1996 Nov;43(5):475-80.
Russell S The economic burden of illness for households in developing countries: a review of studies
focusing on malaria, tuberculosis and human immunodeficiency virus/acquired
immunodeficiency syndrome. American Journal of Tropical Medicine and Hygiene. 2004;
7(2), 147–155.
Stephenson R, Baschieri A, Clements S, Hennink M, Madise N. Contextual influences on the use of
health facilities for childbirth in Africa. Am J Public Health. 2006 Jan;96(1):84-93. Epub 2005
Nov 29.

Health care seeking behavior in Webuye, Kenya
- 51 -
Stekelenburg J, Jager BE, Kolk PR, Westen EH, van der Kwaak A, Wolffers IN. Health care seeking
behaviour and utilisation of traditional healers in Kalabo, Zambia. Health Policy. 2005
Jan;71(1):67-81.
Sumba PO, Wong SL, Kanzaria HK, Johnson KA, John CC. Malaria treatment-seeking behaviour and
recovery from malaria in a highland area of Kenya. Malar J. 2008 Nov 26;7:245.
Taffa N, Chepngeno G. Determinants of health care seeking for childhood illnesses in Nairobi slums.
Trop Med Int Health. 2005 Mar;10(3):240-5.
Tanahashi T. Health service coverage and its evaluation. Bull World Health Organ. 1978; 56(2): 295-
303
Voeten HA, O'hara HB, Kusimba J, Otido JM, Ndinya-Achola JO, Bwayo JJ, Varkevisser CM,
Habbema JD. Gender differences in health care-seeking behavior for sexually transmitted
diseases: a population-based study in Nairobi, Kenya. Sex Transm Dis. 2004 May;31(5):265-
72.
WHO Health Report 2008, pp. Available from URL: http://www.who.int/whr/2008/whr08_en.pdf
Willems S, De Roo L, De Maeseneer J. Towards a comprehensive model for understanding the
complexity of medical care utilization patterns by the poor and underserved. Health Policy.

Health care seeking behavior in Webuye, Kenya 2010
- 1 -
ATTACHMENTS
1 QUESTIONNAIRE
SECTION A: Identification information
1. Subject identification-number (001-100): __________________
2. Compound Name: ______________________________________
Village Name: __________________________________________
Sub-location Name: _____________________________________
3. Sex (tick off appropriately): a. Male
b. Female
4. Age of respondent: a. 18-20 years
(tick off appropriately) b. 21-30 years
c. 31-40 years
d. 41-50 years
e. > 50 years
5. Tribe of respondent: a. Bukusu
(tick off appropriately) b. Tachoni
c. Others, specify: ______________
6. Marital status: a. married
(tick off appropriately) b. single
c. separated/ divorced
d. widowed
7. Level of education: a. no formal education
(tick off appropriately) b. primary education incomplete
c. primary education completed
d. secondary education incomplete
e. secondary education completed
f. postsecondary education
g. others: ______________________
Health care seeking behavior in Webuye, Kenya
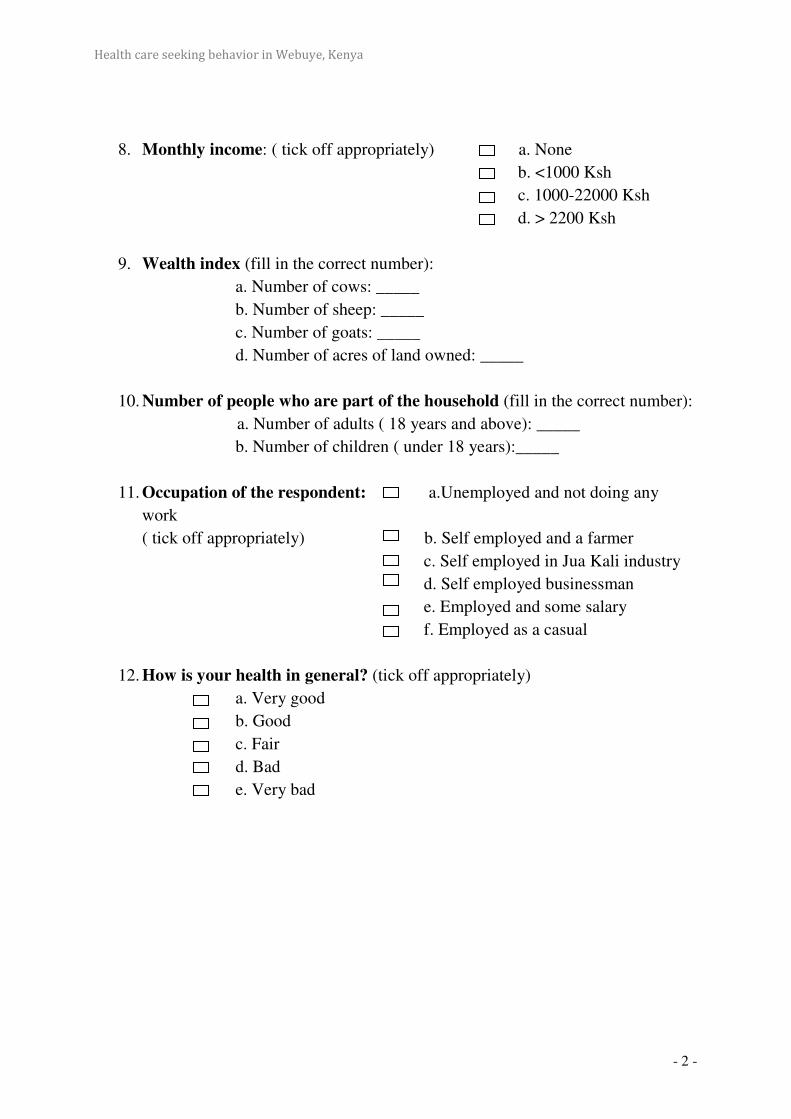
Health care seeking behavior in Webuye, Kenya
- 2 -
8. Monthly income: ( tick off appropriately) a. None
b. <1000 Ksh
c. 1000-22000 Ksh
d. > 2200 Ksh
9. Wealth index (fill in the correct number):
a. Number of cows: _____
b. Number of sheep: _____
c. Number of goats: _____
d. Number of acres of land owned: _____
10. Number of people who are part of the household (fill in the correct number):
a. Number of adults ( 18 years and above): _____
b. Number of children ( under 18 years):_____
11. Occupation of the respondent: a.Unemployed and not doing any
work
( tick off appropriately) b. Self employed and a farmer
c. Self employed in Jua Kali industry
d. Self employed businessman
e. Employed and some salary
f. Employed as a casual
12. How is your health in general? (tick off appropriately)
a. Very good
b. Good
c. Fair
d. Bad
e. Very bad

Health care seeking behavior in Webuye, Kenya
- 3 -
SECTION B: Health services
13. How many times have you visited the following health facilities in the past
year to help yourselves? (tick off appropriately)
Never Not this year Once 2-5times
>5times
A. Drug shop/Pharmacy
B. Traditional healer
C. Local health center
D. Private hospital
E. Missionary hospital
F. District hopital
14. If you have never sought medical care in one of the following health
facilities: Respond why you haven’t gone there. (tick off appropriately,
multiple choice possible)
A. Drug shop/Pharmacy
a. Health facility is too far away
b. Health facility is too expensive
c. Health facility lacks of medical expertise
d. I do not trust these people
e. I don’t believe in modern medical care
f. I haven’t been sick but I would consider going there
g. Others, specify: ________________________________
B. Traditional healer
a. Health facility is too far away
b. Health facility is too expensive
c. Health facility lacks of medical expertise
d. I do not trust these people
e. I don’t believe in traditional medical care
f. I haven’t been sick but I would consider going there
g. Others, specify: ________________________________

Health care seeking behavior in Webuye, Kenya
- 4 -
C. Local health center
a. Health facility is too far away
b. Health facility is too expensive
c. Health facility lacks of medical expertise
d. I do not trust these people
e. I don’t believe in modern medical care
f. I haven’t been sick but I would consider going there
g. Others, specify: ________________________________
D. Private hospital
a. Health facility is too far away
b. Health facility is too expensive
c. Health facility lacks of medical expertise
d. I do not trust these people
e. I don’t believe in modern medical care
f. I haven’t been sick but I would consider going there
g. Others, specify: ________________________________
E. Missionary hospital
a. Health facility is too far away
b. Health facility is too expensive
c. Health facility lacks of medical expertise
d. I do not trust these people
e. I don’t believe in modern medical care
f. I haven’t been sick but I would consider going there
g. Others, specify: ________________________________
F. District hopital
a. Health facility is too far away
b. Health facility is too expensive
c. Health facility lacks of medical expertise
d. I do not trust these people
e. I don’t believe in modern medical care
f. I haven’t been sick but I would consider going there
g. Others, specify: ________________________________

Health care seeking behavior in Webuye, Kenya
- 5 -
15. Accesibility/Location: How long do you take to reach the following
facilities? (tick off appropriately)
< ½ hour ½- <1 hour 1-<2hours > 2
hours
A. Drug shop/Pharmacy
B. Traditional healer
C. Local health center
D. Private clinic/ hospital
E. Missionary hospital
F. District hospital
16. Quality of care: How are the health services that you receive in following
facilities? (tick off appropriately)
Good Moderate Bad
A. Drug shop/Pharmacy
B. Traditional healer
C. Local health center
D. Private clinic/ hospital
E. Missionary hospital
F. District hospital
17. Quality of personnel: What do you think about the personnel? (tick off
appropriately)
Good Moderate Bad
A. Drug shop/Pharmacy
B. Traditional healer
C. Local health center
D. Private clinic/ hospital
E. Missionary hospital
F. District hospital
18. Affordability: Is it cheap/moderate/expensive for you in following health
facilities? (tick off appropriately)
Cheap Moderate Expensive
A. Drug shop/Pharmacy
B. Traditional healer
C. Local health center
D. Private clinic/ hospital
E. Missionary hospital
F. District hospital

Health care seeking behavior in Webuye, Kenya
- 6 -
19. Available resources: Do you think there are enough medical equipment in
following health facilities? (tick off appropriately)
Yes No
A. Drug shop/Pharmacy
B. Traditional healer
C. Local health center
D. Private clinic/ hospital
E. Missionary hospital
F. District hospital
SECTION C: VIGNETTE-STUDY
VIGNETTE 1: Since half a day your child of 3 years old has got a fever and is
feeling very weak.
20. What do you think is the health problem?
_____________________________________________________________
21. Do you think it is serious? (tick off appropriately)
a. Yes
b. No
c. I don’t know
22. Do you have past experience with this problem? (tick off appropriately)
a. Yes
b. No
c. I don’t know
23. What would you initially do to help the sick child? (tick off appropriately)
a. I use my own home tools/ local herbs to take care of my child
b. I ask family members for advice or help
c. I will go to a local drug shop/chemist and buy medication
d. I will go to a traditional healer
e. I will go to a private clinic to see a doctor
f. I will go to the local health centre to see a nurse or a doctor
g. I will go to a local public hospital to see a doctor
h. I will go to a private missionary hospital to see a doctor
i. No treatment
j. Others, specify: ___________________________________
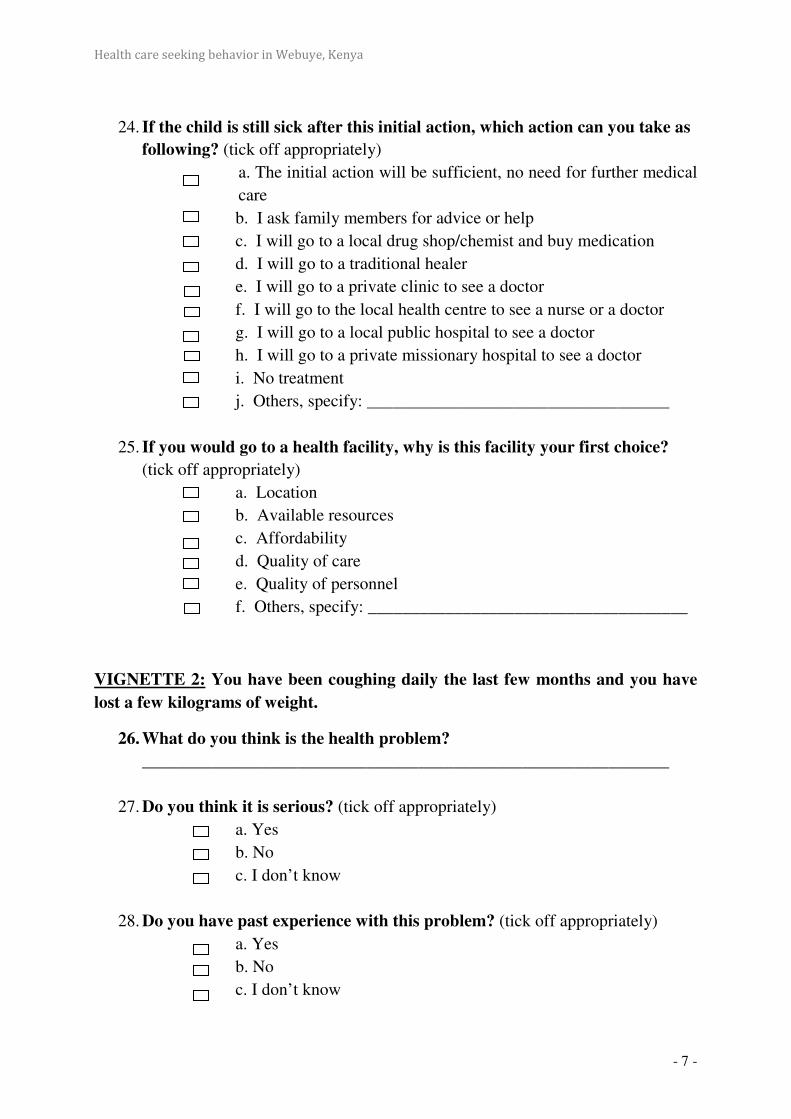
Health care seeking behavior in Webuye, Kenya
- 7 -
24. If the child is still sick after this initial action, which action can you take as
following? (tick off appropriately)
a. The initial action will be sufficient, no need for further medical
care
b. I ask family members for advice or help
c. I will go to a local drug shop/chemist and buy medication
d. I will go to a traditional healer
e. I will go to a private clinic to see a doctor
f. I will go to the local health centre to see a nurse or a doctor
g. I will go to a local public hospital to see a doctor
h. I will go to a private missionary hospital to see a doctor
i. No treatment
j. Others, specify: ___________________________________
25. If you would go to a health facility, why is this facility your first choice? (tick off appropriately)
a. Location
b. Available resources
c. Affordability
d. Quality of care
e. Quality of personnel
f. Others, specify: _____________________________________
VIGNETTE 2: You have been coughing daily the last few months and you have
lost a few kilograms of weight.
26. What do you think is the health problem?
_____________________________________________________________
27. Do you think it is serious? (tick off appropriately)
a. Yes
b. No
c. I don’t know
28. Do you have past experience with this problem? (tick off appropriately)
a. Yes
b. No
c. I don’t know

Health care seeking behavior in Webuye, Kenya
- 8 -
29. What would you initially do to help the sick child? (tick off appropriately)
a. I use my own home tools/ local herbs to take care of my child
b. I ask family members for advice or help
c. I will go to a local drug shop/chemist and buy medication
d. I will go to a traditional healer
e. I will go to a private clinic to see a doctor
f. I will go to the local health centre to see a nurse or a doctor
g. I will go to a local public hospital to see a doctor
h. I will go to a private missionary hospital to see a doctor
i. No treatment
j. Others, specify: ___________________________________
30. If the child is still sick after this initial action, which action can you take as
following? (tick off appropriately)
a. The initial action will be sufficient, no need for further medical
care
b. I ask family members for advice or help
c. I will go to a local drug shop/chemist and buy medication
d. I will go to a traditional healer
e. I will go to a private clinic to see a doctor
f. I will go to the local health centre to see a nurse or a doctor
g. I will go to a local public hospital to see a doctor
h. I will go to a private missionary hospital to see a doctor
i. No treatment
j. Others, specify: ___________________________________
31. If you would go to a health facility, why is this facility your first choice? (tick off appropriately)
a. Location
b. Available resources
c. Affordability
d. Quality of care
e. Quality of personnel
f. Others, specify: _____________________________________

Health care seeking behavior in Webuye, Kenya
- 9 -
VIGNETTE 3: Your mother (or other older family member) has a wound on her
knee that is not heeling properly (it is very painful, there is yellow liquid and it is
smelling badly).
32. What do you think is the health problem?
_____________________________________________________________
33. Do you think it is serious? (tick off appropriately)
a. Yes
b. No
c. I don’t know
34. Do you have past experience with this problem? (tick off appropriately)
a. Yes
b. No
c. I don’t know
35. What would you initially do to help the sick child? (tick off appropriately)
a. I use my own home tools/ local herbs to take care of my child
b. I ask family members for advice or help
c. I will go to a local drug shop/chemist and buy medication
d. I will go to a traditional healer
e. I will go to a private clinic to see a doctor
f. I will go to the local health centre to see a nurse or a doctor
g. I will go to a local public hospital to see a doctor
h. I will go to a private missionary hospital to see a doctor
i. No treatment
j. Others, specify: ___________________________________
36. If the child is still sick after this initial action, which action can you take as
following? (tick off appropriately)
a. The initial action will be sufficient, no need for further medical
care
b. I ask family members for advice or help
c. I will go to a local drug shop/chemist and buy medication
d. I will go to a traditional healer
e. I will go to a private clinic to see a doctor
f. I will go to the local health centre to see a nurse or a doctor
g. I will go to a local public hospital to see a doctor
h. I will go to a private missionary hospital to see a doctor
i. No treatment

Health care seeking behavior in Webuye, Kenya
- 10 -
j. Others, specify: ___________________________________
37. If you would go to a health facility, why is this facility your first choice? (tick off appropriately)
a. Location
b. Available resources
c. Affordability
d. Quality of care
e. Quality of personnel
f. Others, specify: _____________________________________
Thank you very much for your cooperation throughout this interview session.

Health care seeking behavior in Webuye, Kenya
- 11 -
2 RESULTS: TABLES
2.1 BACKGROUND DATA
2.1.1 DEMOGRAPHIC CHARACTERISTICS
2.1.1.1 GENDER
Count %
Sex female 68 66,7%
male 34 33,3%
Table A 1.1. Gender
2.1.1.2 AGE
Count %
Age Subtot. 18-30 years 25 24,5%
18-20 years 4 3,9%
21-30 years 21 20,6%
Subtot. 31-50 years 55 53,9%
31-40 years 32 31,4%
41-50 years 23 22,5%
over 50 years 22 21,6%
Table A 1.2. Age
2.1.1.3 TRIBE
Count %
Tribe bukusu 94 92,2%
others 8 7,8%
Table A 1.3. Tribe
2.1.1.4 MARITAL STATUS
Count %
Marital status Married 89 87,3%
Subtotal. Not married 13 12,7%
single 5 4,9%
separated/divorced 3 2,9%
widowed 5 4,9%
Table A 1.4. Marital status
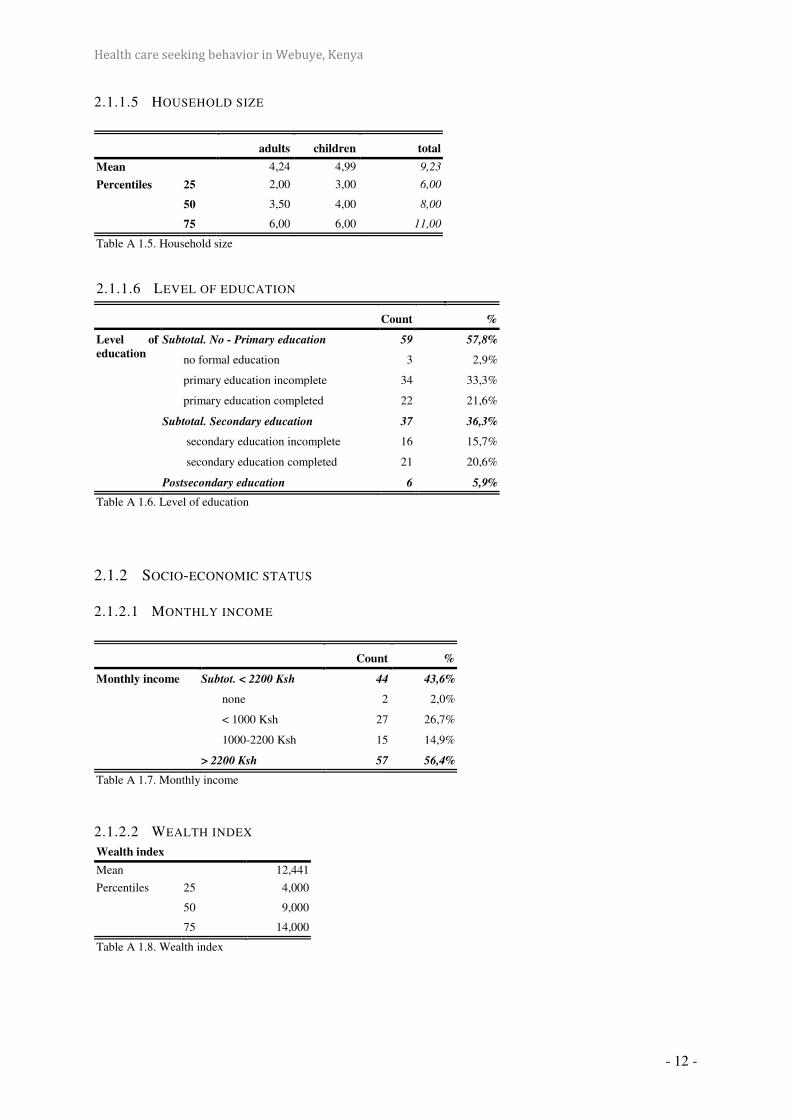
Health care seeking behavior in Webuye, Kenya
- 12 -
2.1.1.5 HOUSEHOLD SIZE
adults children total
Mean 4,24 4,99 9,23
Percentiles 25 2,00 3,00 6,00
50 3,50 4,00 8,00
75 6,00 6,00 11,00
Table A 1.5. Household size
2.1.1.6 LEVEL OF EDUCATION
Count %
Level of
education
Subtotal. No - Primary education 59 57,8%
no formal education 3 2,9%
primary education incomplete 34 33,3%
primary education completed 22 21,6%
Subtotal. Secondary education 37 36,3%
secondary education incomplete 16 15,7%
secondary education completed 21 20,6%
Postsecondary education 6 5,9%
Table A 1.6. Level of education
2.1.2 SOCIO-ECONOMIC STATUS
2.1.2.1 MONTHLY INCOME
Count %
Monthly income Subtot. < 2200 Ksh 44 43,6%
none 2 2,0%
< 1000 Ksh 27 26,7%
1000-2200 Ksh 15 14,9%
> 2200 Ksh 57 56,4%
Table A 1.7. Monthly income
2.1.2.2 WEALTH INDEX
Wealth index
Mean 12,441
Percentiles 25 4,000
50 9,000
75 14,000
Table A 1.8. Wealth index
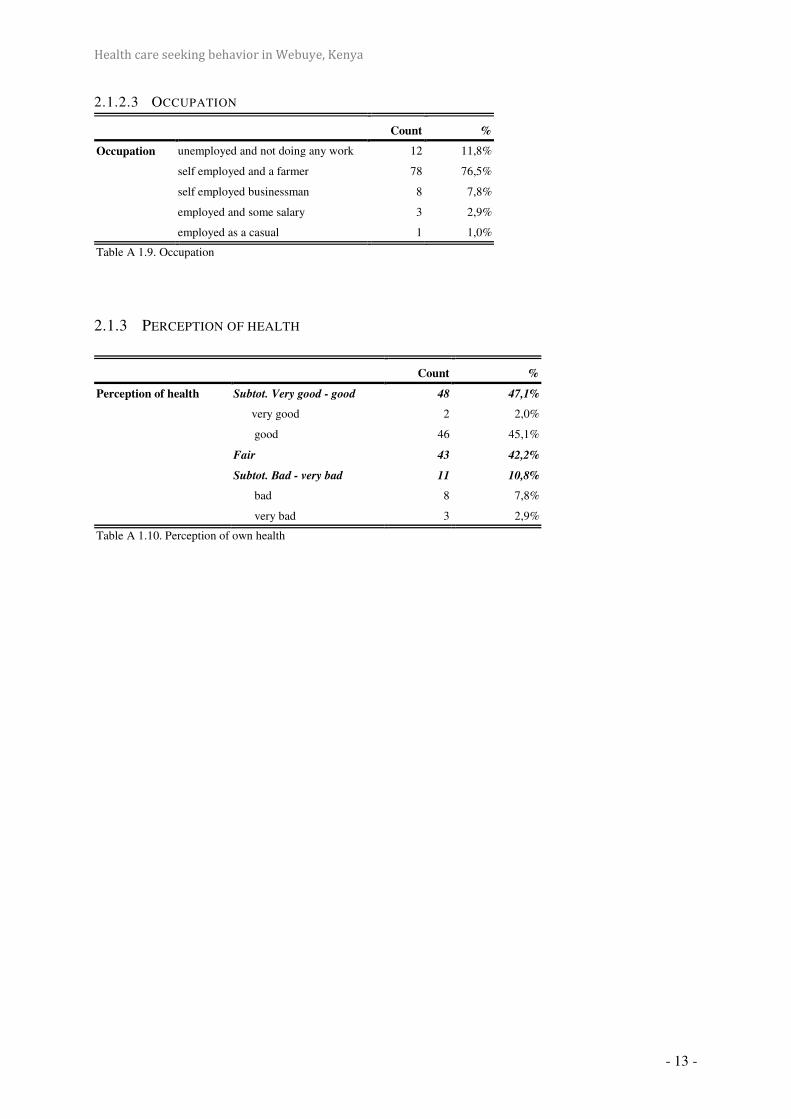
Health care seeking behavior in Webuye, Kenya
- 13 -
2.1.2.3 OCCUPATION
Count %
Occupation unemployed and not doing any work 12 11,8%
self employed and a farmer 78 76,5%
self employed businessman 8 7,8%
employed and some salary 3 2,9%
employed as a casual 1 1,0%
Table A 1.9. Occupation
2.1.3 PERCEPTION OF HEALTH
Count %
Perception of health Subtot. Very good - good 48 47,1%
very good 2 2,0%
good 46 45,1%
Fair 43 42,2%
Subtot. Bad - very bad 11 10,8%
bad 8 7,8%
very bad 3 2,9%
Table A 1.10. Perception of own health
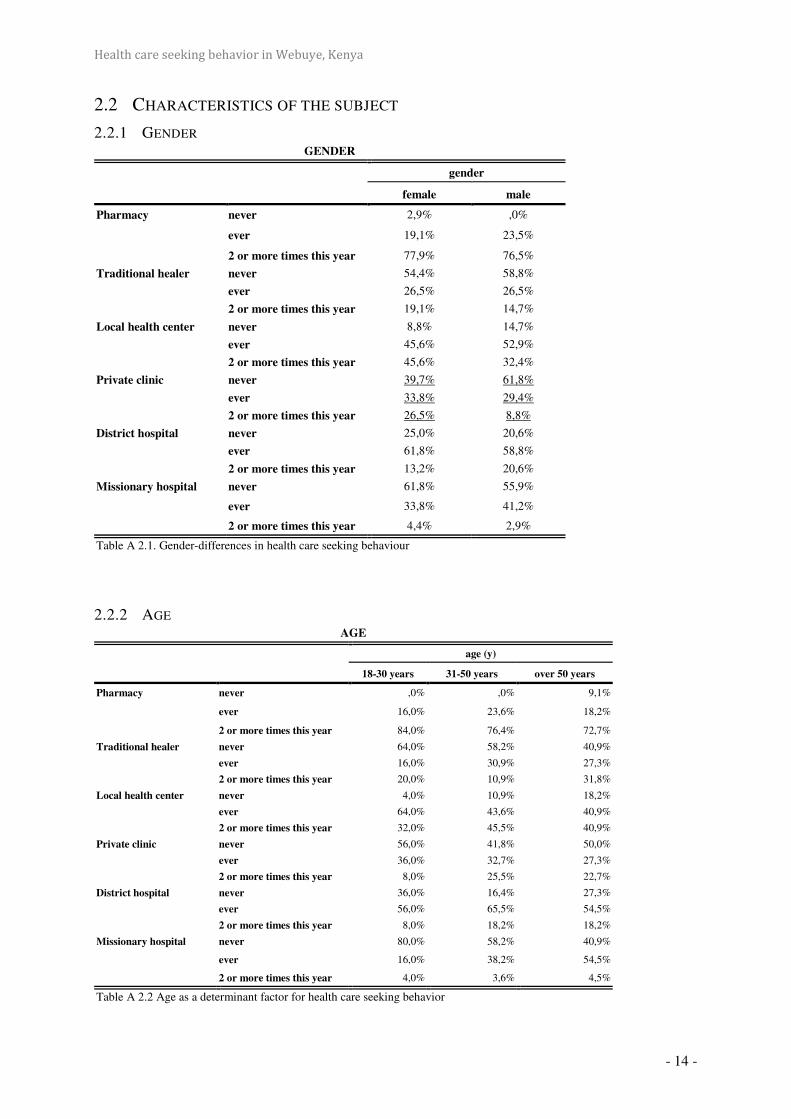
Health care seeking behavior in Webuye, Kenya
- 14 -
2.2 CHARACTERISTICS OF THE SUBJECT
2.2.1 GENDER GENDER
gender
female male
Pharmacy never 2,9% ,0%
ever 19,1% 23,5%
2 or more times this year 77,9% 76,5%
Traditional healer never 54,4% 58,8%
ever 26,5% 26,5%
2 or more times this year 19,1% 14,7%
Local health center never 8,8% 14,7%
ever 45,6% 52,9%
2 or more times this year 45,6% 32,4%
Private clinic never 39,7% 61,8%
ever 33,8% 29,4%
2 or more times this year 26,5% 8,8%
District hospital never 25,0% 20,6%
ever 61,8% 58,8%
2 or more times this year 13,2% 20,6%
Missionary hospital never 61,8% 55,9%
ever 33,8% 41,2%
2 or more times this year 4,4% 2,9%
Table A 2.1. Gender-differences in health care seeking behaviour
2.2.2 AGE AGE
age (y)
18-30 years 31-50 years over 50 years
Pharmacy never ,0% ,0% 9,1%
ever 16,0% 23,6% 18,2%
2 or more times this year 84,0% 76,4% 72,7%
Traditional healer never 64,0% 58,2% 40,9%
ever 16,0% 30,9% 27,3%
2 or more times this year 20,0% 10,9% 31,8%
Local health center never 4,0% 10,9% 18,2%
ever 64,0% 43,6% 40,9%
2 or more times this year 32,0% 45,5% 40,9%
Private clinic never 56,0% 41,8% 50,0%
ever 36,0% 32,7% 27,3%
2 or more times this year 8,0% 25,5% 22,7%
District hospital never 36,0% 16,4% 27,3%
ever 56,0% 65,5% 54,5%
2 or more times this year 8,0% 18,2% 18,2%
Missionary hospital never 80,0% 58,2% 40,9%
ever 16,0% 38,2% 54,5%
2 or more times this year 4,0% 3,6% 4,5%
Table A 2.2 Age as a determinant factor for health care seeking behavior

Health care seeking behavior in Webuye, Kenya
- 15 -
2.2.3 MARITAL STATUS
marital status
married not married
% %
Pharmacy never 1,1% 7,7%
ever 20,2% 23,1%
2 or more times this year 78,7% 69,2%
Traditional healer never 52,8% 76,9%
ever 29,2% 7,7%
2 or more times this year 18,0% 15,4%
Local health center never 9,0% 23,1%
ever 47,2% 53,8%
2 or more times this year 43,8% 23,1%
Private clinic never 46,1% 53,8%
ever 31,5% 38,5%
2 or more times this year 22,5% 7,7%
District hospital never 21,3% 38,5%
ever 62,9% 46,2%
2 or more times this year 15,7% 15,4%
Missionary hospital never 59,6% 61,5%
ever 37,1% 30,8%
2 or more times this year 3,4% 7,7%
Table. A 2.3 Marital status as a determinant for health care seeking behavior
2.2.4 HOUSEHOLD SIZE
houshold-size
< 7 persons 8-10 persons 11 or more persons
% % %
Pharmacy never 3,4% 2,2% ,0%
ever 20,7% 19,6% 22,2%
2 or more times this year 75,9% 78,3% 77,8%
Traditional healer never 58,6% 54,3% 55,6%
ever 27,6% 26,1% 25,9%
2 or more times this year 13,8% 19,6% 18,5%
Local health center never 10,3% 10,9% 11,1%
ever 37,9% 56,5% 44,4%
2 or more times this year 51,7% 32,6% 44,4%
District hospital never 27,6% 21,7% 22,2%
ever 62,1% 60,9% 59,3%
2 or more times this year 10,3% 17,4% 18,5%
Private clinic never 55,2% 43,5% 44,4%
ever 27,6% 37,0% 29,6%
2 or more times this year 17,2% 19,6% 25,9%
Missionary hospital never 72,4% 58,7% 48,1%
ever 27,6% 34,8% 48,1%
2 or more times this year ,0% 6,5% 3,7%
Table A 2.4. Household size as a determinant for health care seeking behavior
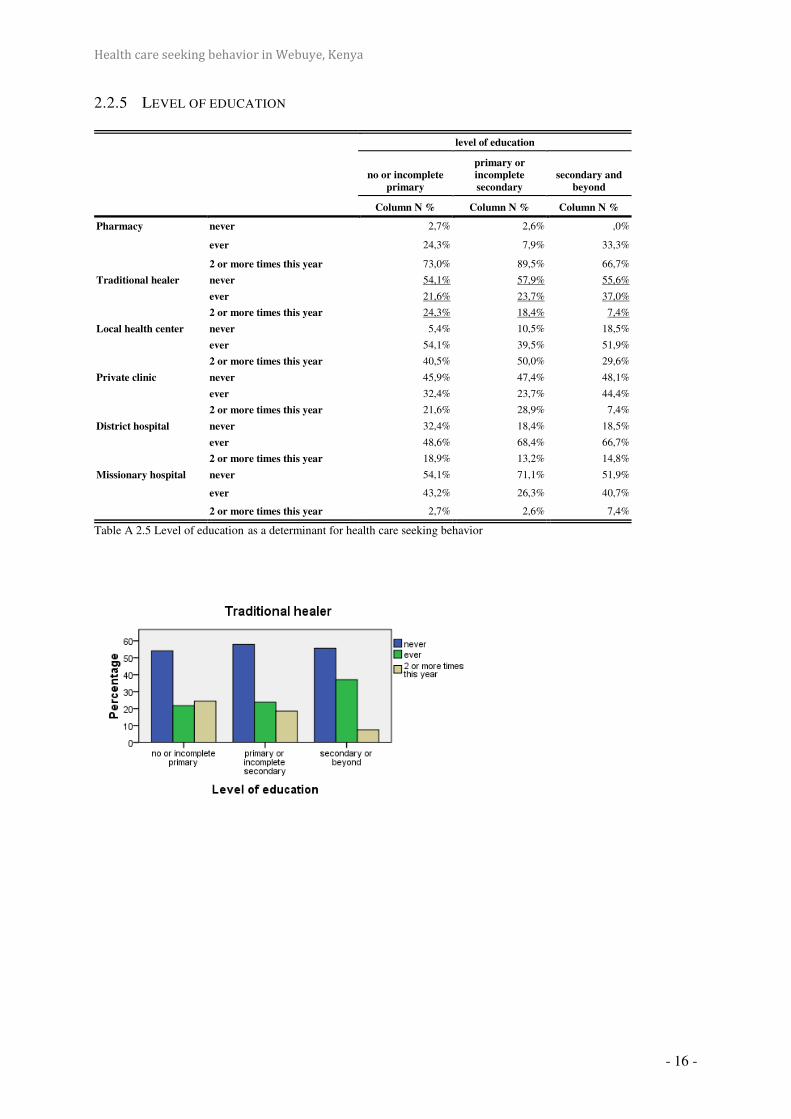
Health care seeking behavior in Webuye, Kenya
- 16 -
2.2.5 LEVEL OF EDUCATION
level of education
no or incomplete
primary
primary or
incomplete
secondary
secondary and
beyond
Column N % Column N % Column N %
Pharmacy never 2,7% 2,6% ,0%
ever 24,3% 7,9% 33,3%
2 or more times this year 73,0% 89,5% 66,7%
Traditional healer never 54,1% 57,9% 55,6%
ever 21,6% 23,7% 37,0%
2 or more times this year 24,3% 18,4% 7,4%
Local health center never 5,4% 10,5% 18,5%
ever 54,1% 39,5% 51,9%
2 or more times this year 40,5% 50,0% 29,6%
Private clinic never 45,9% 47,4% 48,1%
ever 32,4% 23,7% 44,4%
2 or more times this year 21,6% 28,9% 7,4%
District hospital never 32,4% 18,4% 18,5%
ever 48,6% 68,4% 66,7%
2 or more times this year 18,9% 13,2% 14,8%
Missionary hospital never 54,1% 71,1% 51,9%
ever 43,2% 26,3% 40,7%
2 or more times this year 2,7% 2,6% 7,4%
Table A 2.5 Level of education as a determinant for health care seeking behavior

Health care seeking behavior in Webuye, Kenya
- 17 -
2.2.6 MONTHLY INCOME
Monthly income
monthly income
< 2200 Ksh > 2200 Ksh
Column N % Column N %
Pharmacy never ,0% 3,5%
ever 27,3% 15,8%
2 or more times this year 72,7% 80,7%
Traditional healer never 59,1% 52,6%
ever 25,0% 28,1%
2 or more times this year 15,9% 19,3%
Local health center never 11,4% 10,5%
ever 45,5% 50,9%
2 or more times this year 43,2% 38,6%
Private clinic never 54,5% 42,1%
ever 29,5% 33,3%
2 or more times this year 15,9% 24,6%
District hospital never 25,0% 21,1%
ever 52,3% 68,4%
2 or more times this year 22,7% 10,5%
Missionary hospital never 54,5% 63,2%
ever 38,6% 35,1%
2 or more times this year 6,8% 1,8%
Table A 2.6 Monthly income as a determinant for health care seeking behavior
2.2.7 WEALTH INDEX
Missionary hospital
wealth index
Total 1 2 3 4
never Count 20 19 15 7 61
% within wealth index 74,1% 76,0% 53,6% 31,8% 59,8%
ever Count 7 5 12 13 37
% within wealth index 25,9% 20,0% 42,9% 59,1% 36,3%
2 or more times this
year
Count 0 1 1 2 4
% within wealth index ,0% 4,0% 3,6% 9,1% 3,9%
Total Count 27 25 28 22 102
% within wealth index 100,0% 100,0% 100,0% 100,0% 100,0%
Table A 2.7 The wealth index as a determinant for health care seeking behavior to the missionary hospital .

Health care seeking behavior in Webuye, Kenya
- 18 -
Chi-Square Tests
Value df
Asymp. Sig.
(2-sided)
Exact Sig.
(2-sided)
Exact Sig.
(1-sided)
Point
Probability
Pearson Chi-Square 13,760a 6 ,032 ,027 Likelihood Ratio 14,780 6 ,022 ,024 Fisher's Exact Test 13,557 ,014 Linear-by-Linear
Association
11,065b 1 ,001 ,001 ,000 ,000
N of Valid Cases 102 a. 4 cells (33,3%) have expected count less than 5. The minimum expected count is ,86.
b. The standardized statistic is 3,326.
2.2.8 PERCEPTION OF HEALTH
perception of health
(very) good moderate (very) bad
Column % Column % Column %
Pharmacy never 2,1% ,0% 9,1%
ever 35,4% 4,7% 18,2%
2 or more times this year 62,5% 95,3% 72,7%
Traditional healer never 62,5% 46,5% 63,6%
ever 22,9% 32,6% 18,2%
2 or more times this year 14,6% 20,9% 18,2%
Local health center never 16,7% 4,7% 9,1%
ever 52,1% 55,8% ,0%
2 or more times this year 31,3% 39,5% 90,9%
District hospital never 31,3% 16,3% 18,2%
ever 56,3% 65,1% 63,6%
2 or more times this year 12,5% 18,6% 18,2%
Private clinic never 47,9% 46,5% 45,5%
ever 39,6% 23,3% 36,4%
2 or more times this year 12,5% 30,2% 18,2%
Missionary hospital never 68,8% 51,2% 54,5%
ever 27,1% 46,5% 36,4%
2 or more times this year 4,2% 2,3% 9,1%
Table A 2.8 Perception of health as a determinant for health care seeking behavior

Health care seeking behavior in Webuye, Kenya
- 19 -
2.3 CHARACTERISTICS OF THE FACILITY
2.3.1 ACCESSIBILITY
< ½ hour ½ - < 1 hour 1 - < 2 hours > 2 hours
N % N % N % N %
Pharmacy 73,7 % 22,2 % 3,0 % 1,0 %
Traditional healer 73,7 % 10,5 % 7,9 % 7,9 %
Local health center 42,9 % 40,7 % 13,2 % 3,3 %
Private clinic 40,4 % 30,8 % 21,2 % 7,7 %
Missionary hospital 16,7 % 52,4 % 26,2 % 4,8 %
District hospital 2,5 % 32,9 % 45,6 % 19,0 %
Tabel A 3.1 Accessibility
2.3.2 QUALITY OF CARE
good moderate bad
N % N % N %
Pharmacy 72,7% 26,3% 1,0%
Traditional healer 60,5% 31,6% 7,9%
Local health center 49,5% 37,4% 13,2%
Private clinic 75,5% 22,6% 1,9%
Missionary hospital 71,4% 23,8% 4,8%
District hospital 54,4% 30,4% 15,2%
Table A 3.2 Quality of care
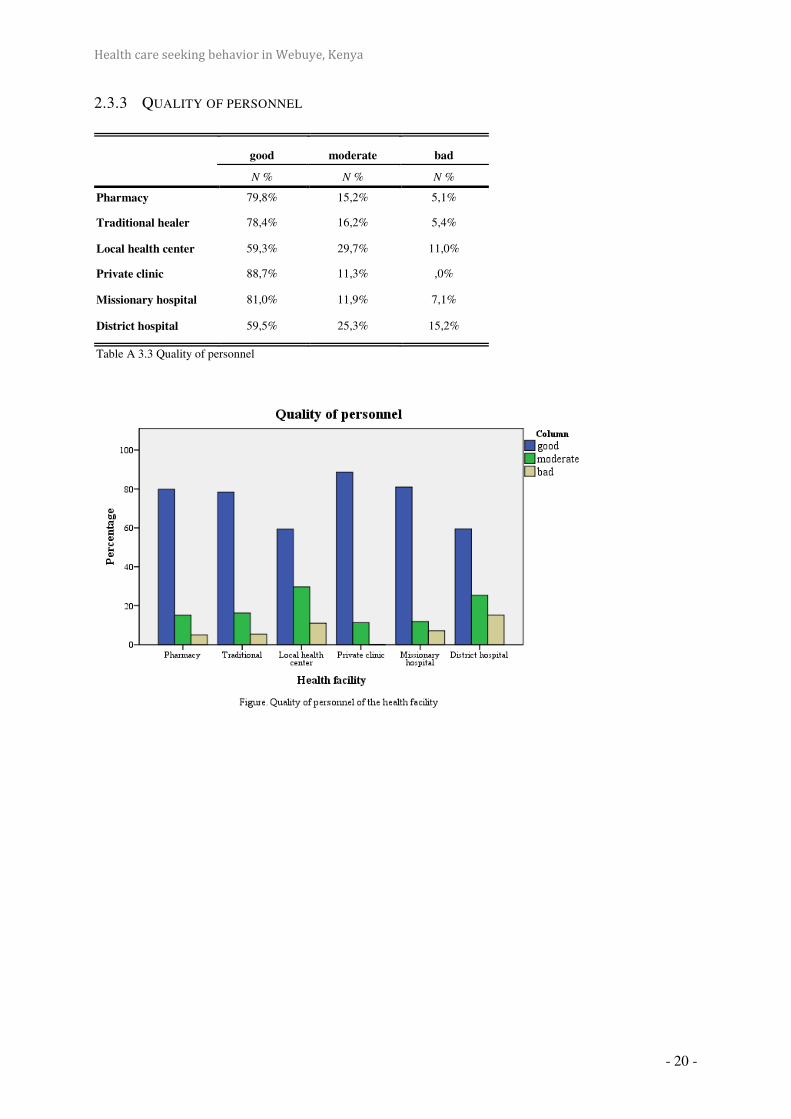
Health care seeking behavior in Webuye, Kenya
- 20 -
2.3.3 QUALITY OF PERSONNEL
good moderate bad
N % N % N %
Pharmacy 79,8% 15,2% 5,1%
Traditional healer 78,4% 16,2% 5,4%
Local health center 59,3% 29,7% 11,0%
Private clinic 88,7% 11,3% ,0%
Missionary hospital 81,0% 11,9% 7,1%
District hospital 59,5% 25,3% 15,2%
Table A 3.3 Quality of personnel

Health care seeking behavior in Webuye, Kenya
- 21 -
2.3.4 AFFORDABILITY
cheap moderate expensive
N % N % N %
Pharmacy 23,2% 39,4% 37,4%
Traditional healer 57,9% 26,3% 15,8%
Local health center 60,4% 33,0% 6,6%
Private clinic 17,0% 26,4% 56,6%
Missionary hospital ,0% 4,8% 95,2%
District hospital 41,8% 44,3% 13,9%
Table A 3.4 Affordability

Health care seeking behavior in Webuye, Kenya
- 22 -
2.3.5 AVAILABLE RESOURCES
No Yes
N % N %
Pharmacy 96,0% 4,0%
Traditional healer 94,7% 5,3%
Local health center 65,9% 34,1%
Private clinic 58,5% 41,5%
Missionary hospital 14,0% 86,0%
District hospital 23,8% 76,3%
Table A 3.5 Available resources
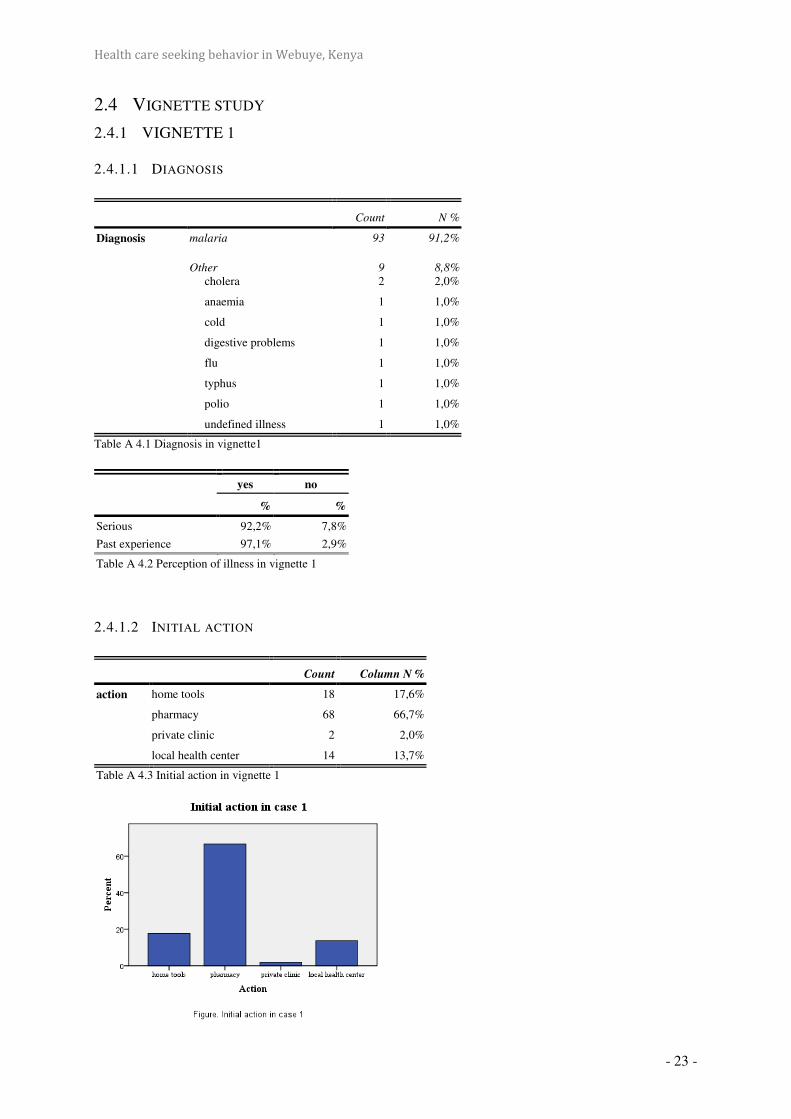
Health care seeking behavior in Webuye, Kenya
- 23 -
2.4 VIGNETTE STUDY
2.4.1 VIGNETTE 1
2.4.1.1 DIAGNOSIS
Table A 4.1 Diagnosis in vignette1
yes no
% %
Serious 92,2% 7,8%
Past experience 97,1% 2,9%
Table A 4.2 Perception of illness in vignette 1
2.4.1.2 INITIAL ACTION
Count Column N %
action home tools 18 17,6%
pharmacy 68 66,7%
private clinic 2 2,0%
local health center 14 13,7%
Table A 4.3 Initial action in vignette 1
Count N %
Diagnosis malaria 93 91,2%
Other
cholera
9
2 8,8%
2,0%
anaemia 1 1,0%
cold 1 1,0%
digestive problems 1 1,0%
flu 1 1,0%
typhus 1 1,0%
polio 1 1,0%
undefined illness 1 1,0%

Health care seeking behavior in Webuye, Kenya
- 24 -
2.4.1.3 SECOND ACTION
2.4.1.3.1.1 INITIAL ACTION: ‘PHARMACY’
Count Column N %
private clinic 12 17,6%
local health center 44 64,7%
public hospital 9 13,2%
private missionary 3 4,4%
Table A 4.4 Second action if initial action: pharmacy in vignette 1
2.4.1.3.1.2 INITIAL: ‘HOME TOOLS’
Count Column N %
pharmacy 2 11,1%
private clinic 1 5,6%
local health center 14 77,8%
private missionary 1 5,6%
others 0 ,0%
Table A 4.5. Second action if initial action: ‘home tools’ in vignette 1

Health care seeking behavior in Webuye, Kenya
- 25 -
2.4.1.3.1.3 INITIAL: LOCAL HEALTH CENTER
Column N % Count
pharmacy 7,1% 1
public hospital 71,4% 10
private missionary 14,3% 2
others 7,1% 1
Table A 4.6. Second action if initial action: ‘local health center’ in vignette 1.
2.4.1.4 REASONS
2.4.1.4.1.1 LOCAL HEALTH CENTER
Table A 4.7. Reasons for choosing ‘local health center’ in vignette 1.
Count %
location 70 95,9%
affordability 41 56,2%
quality of care 2 2,7%
quality of personnel 3 4,1%
available resources 3 4.1%
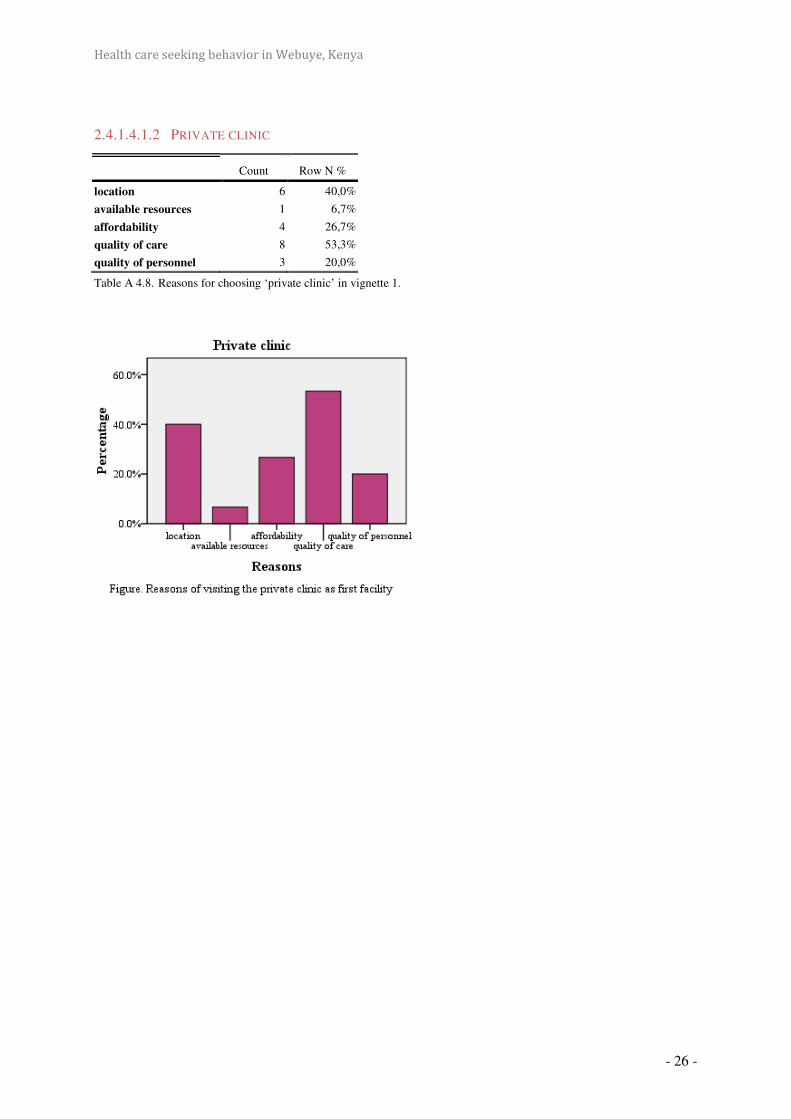
Health care seeking behavior in Webuye, Kenya
- 26 -
2.4.1.4.1.2 PRIVATE CLINIC
Table A 4.8. Reasons for choosing ‘private clinic’ in vignette 1.
Count Row N %
location 6 40,0%
available resources 1 6,7%
affordability 4 26,7%
quality of care 8 53,3%
quality of personnel 3 20,0%
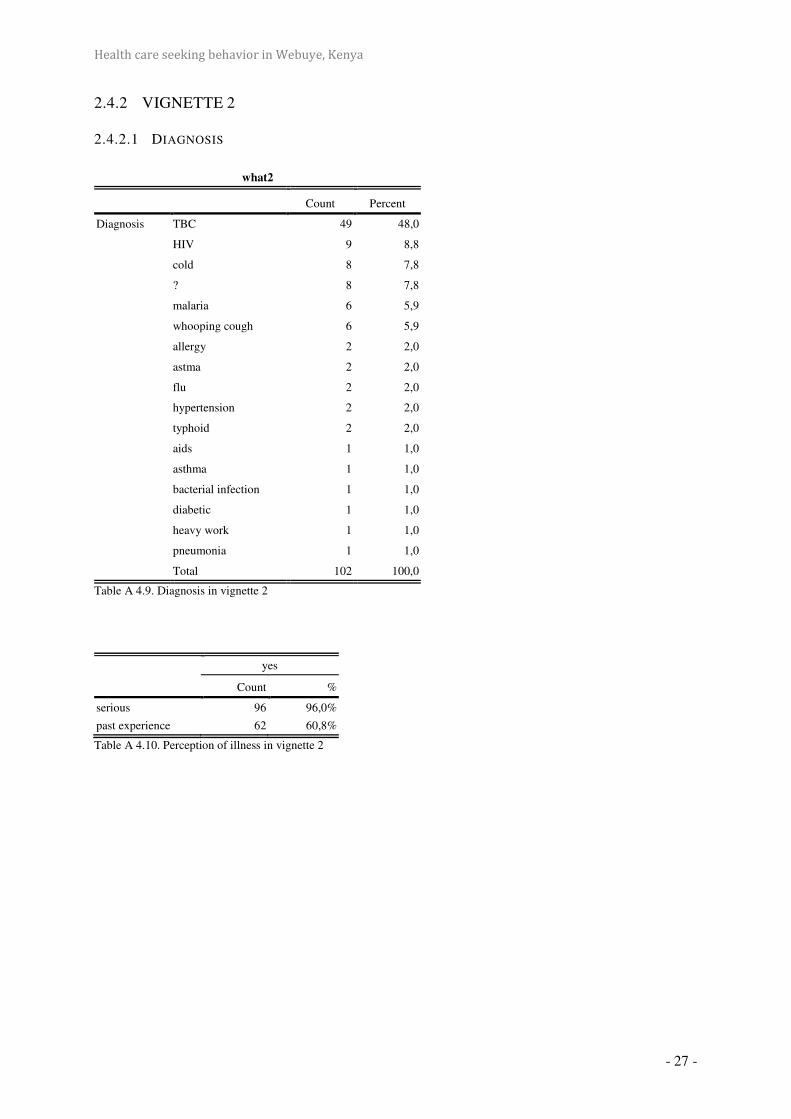
Health care seeking behavior in Webuye, Kenya
- 27 -
2.4.2 VIGNETTE 2
2.4.2.1 DIAGNOSIS
what2
Count Percent
Diagnosis TBC 49 48,0
HIV 9 8,8
cold 8 7,8
? 8 7,8
malaria 6 5,9
whooping cough 6 5,9
allergy 2 2,0
astma 2 2,0
flu 2 2,0
hypertension 2 2,0
typhoid 2 2,0
aids 1 1,0
asthma 1 1,0
bacterial infection 1 1,0
diabetic 1 1,0
heavy work 1 1,0
pneumonia 1 1,0
Total 102 100,0
Table A 4.9. Diagnosis in vignette 2
yes
Count %
serious 96 96,0%
past experience 62 60,8%
Table A 4.10. Perception of illness in vignette 2

Health care seeking behavior in Webuye, Kenya
- 28 -
2.4.2.2 INITIAL ACTION
Count %
Initial action local health center 46 45,1%
pharmacy 23 22,5%
public hospital 18 17,6%
home tools 6 5,9%
traditional healer 5 4,9%
private missionary 3 2,9%
family 1 1,0%
Table A 4.11.Initial action in vignette 2

Health care seeking behavior in Webuye, Kenya
- 29 -
2.4.2.3 SECOND ACTION
2.4.2.3.1.1 INITIAL ACTION=PHARMACY
Count Column N %
local health center 9 39,1%
private missionary 5 21,7%
public hospital 5 21,7%
private clinic 4 17,4%
Table A 4.12 Second action if initial action: ‘pharmacy’ in vignette 2
2.4.2.3.1.2 INITIAL ACTION=LOCAL HEALTH CENTER
Count Column N %
second initial local public hospital 37 80,4%
private missionary 5 10,9%
others 3 6,5%
traditional healer 1 2,2%
Table A 4.13. Second action if initial action: ‘local health center’ in vignette 2

Health care seeking behavior in Webuye, Kenya
- 30 -
2.4.2.4 REASONS
2.4.2.4.1.1 LOCAL HEALTH CENTER
yes
Count Row N %
location 51 83,6%
affordability 34 55,7%
available resources 6 9,8%
quality of care 4 6,6%
quality of personnel 2 3,3%
others 1 1,6%
Table A 4.14. Reasons for choosing ‘local health center’ in vignette 2

Health care seeking behavior in Webuye, Kenya
- 31 -
2.4.2.4.1.2 DISTRICT HOSPITAL
yes
Count Row N %
location 51 83,6%
affordability 34 55,7%
available resources 6 9,8%
quality of care 4 6,6%
quality of personnel 2 3,3%
others 1 1,6%
Table A 4.15. Reasons for choosing ‘the district hospital’ in vignette 2
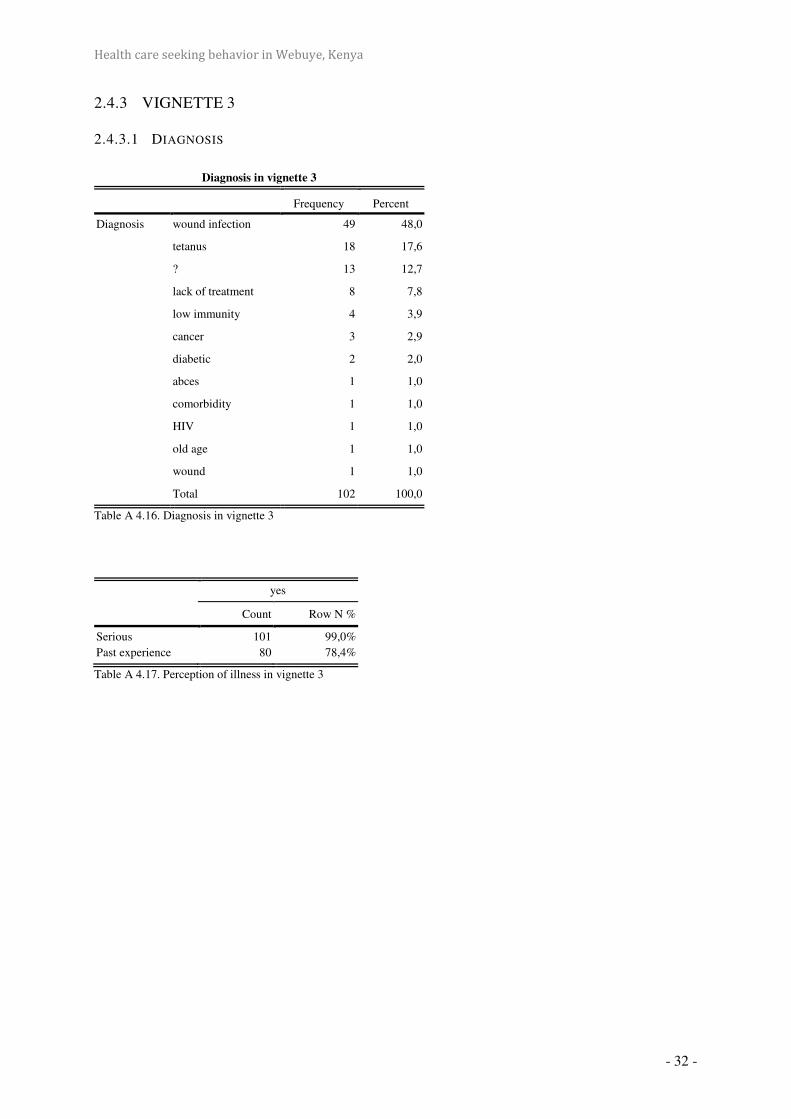
Health care seeking behavior in Webuye, Kenya
- 32 -
2.4.3 VIGNETTE 3
2.4.3.1 DIAGNOSIS
Table A 4.16. Diagnosis in vignette 3
yes
Count Row N %
Serious
Past experience
101
80
99,0%
78,4%
Table A 4.17. Perception of illness in vignette 3
Diagnosis in vignette 3
Frequency Percent
Diagnosis wound infection 49 48,0
tetanus 18 17,6
? 13 12,7
lack of treatment 8 7,8
low immunity 4 3,9
cancer 3 2,9
diabetic 2 2,0
abces 1 1,0
comorbidity 1 1,0
HIV 1 1,0
old age 1 1,0
wound 1 1,0
Total 102 100,0

Health care seeking behavior in Webuye, Kenya
- 33 -
2.4.3.2 INITIAL ACTION
Count Column N %
initial home tools 45 44,1%
pharmacy 21 20,6%
private clinic 5 4,9%
local health center 25 24,5%
public hospital 4 3,9%
private missionary 2 2,0%
Table A 4.18. Initial action in vignette 3
2.4.3.3 SECOND ACTION
2.4.3.3.1.1 INITIAL: HOME TOOLS
Count Column N %
action pharmacy 2 4,4%
private clinic 2 4,4%
local health center 26 57,8%
public hospital 10 22,2%
private missionary 5 11,1%
Table A 4.19. Second action if initial action: ‘home tools’ in vignette 3

Health care seeking behavior in Webuye, Kenya
- 34 -
2.4.3.3.1.2 INITIAL: PHARMACY
Count Column N %
action traditional healer 1 4,8%
private clinic 1 4,8%
local health center 16 76,2%
public hospital 2 9,5%
private missionary 1 4,8%
Table A 4.20. Second action if initial action: ‘pharmacy’ in vignette 3
2.4.3.3.1.3 INITIAL: LOCAL HEALTH CENTER
Count Column N %
action no need 1 4,0%
public hospital 23 92,0%
private missionary 1 4,0%
Table A 4.21. Second action if initial action: ‘local health center’ in vignette 3

Health care seeking behavior in Webuye, Kenya
- 35 -
2.4.3.4 REASONS
2.4.3.4.1.1 LOCAL HEALTH CENTER
yes
Count Row N %
location 60 89,6%
available resources 2 3,0%
affordability 37 55,2%
quality of care 3 4,5%
quality of personnel 3 4,5%
Table A 4.22. Reasons for choosing ‘local health center’ in vignette 3
2.4.3.4.1.2 DISTRICT HOSPITAL
yes
Count Row N %
location 1 6,3%
available resources 9 56,3%
affordability 5 31,3%
quality of care 8 50,0%
quality of personnel 0 ,0%
Table A 4.23. Reasons for choosing ‘district hospital’ in vignette 3