Health Behaviors and Conditions of Adult New Mexicans
58
Health Behaviors and Conditions of Adult New Mexicans Results from the New Mexico Behavioral Risk Factor Surveillance System (BRFSS) 2019 Annual Report III
Transcript of Health Behaviors and Conditions of Adult New Mexicans

i
Health Behaviors and Conditions
of Adult New Mexicans
Results from the New Mexico Behavioral Risk Factor Surveillance System
(BRFSS) 2019 Annual Report
III

ii

Health Behaviors and Conditions of
Adult New Mexicans 2019
Results from the New Mexico Behavioral Risk Factor Surveillance System
(BRFSS)
Presented by the New Mexico Department of Health
Tracie Collins, MD, Secretary Designate
Epidemiology and Response Division Christine Ross, MD, MPH, Director, State Epidemiologist
Toby Rosenblatt, MPA, Chief, Injury & Behavioral Epidemiology Dan Green, MPH, Survey Epidemiology Section Manager
Christopher Whiteside, MPH, BRFSS Epidemiologist Melissa Herrera, MS, Survey Unit Manager & BRFSS Coordinator
Erma Romero, Data Collection Supervisor Veronica Ulibarri, Data Collection Supervisor
Report prepared by:
Christopher Whiteside, MPH

iv
The New Mexico Department of Health and the Epidemiology & Response Division would like to thank the residents of New
Mexico who participated in the 2019 survey of the Behavioral Risk Factor Surveillance System (BRFSS). These participants gave
their time and described their health status and related behaviors to help improve the health of all New Mexicans. This report
would also not be possible without the tremendous work of the team of interviewers who conducted the interviews.
The 2019 BRFSS survey was funded by a cooperative agreement with the Centers for Disease Control and Prevention (Grant
number 6 NU58DP006050-04-03), and through support from the Albuquerque Area Southwest Tribal Epidemiology Center; the
Alzheimer’s Association, the Behavioral Health Services Division of the Human Services Department; and the following programs
or bureaus of the New Mexico Department of Health: The Chronic Disease programs of the Chronic Disease Prevention and Con-
trol Bureau of the Public Health Division; the Injury & Behavioral Health Epidemiology, Environmental Epidemiology, and the
Infectious Disease Epidemiology bureaus of the Epidemiology & Response Division.
BRFSS data and supporting documentation are available at:
www.cdc.gov/brfss
Or
https://nmhealth.org/about/erd/ibeb/brfss/
Additionally, BRFSS data and copies of this report and the 2019 questionnaire can be obtained by contacting:
Christopher Whiteside at (505) 476-3595 or [email protected].

v
v vi vii ix x xi 1 3 5 7 9 11 13 15 17 19 21 23 25 27 29 31 33 35 37 I III IV V
Overview
What is the BRFSS?.........................................................................................
2019 New Mexico BRFSS Survey Topics…………………………………………………...
Limitations and Strengths…………………………………………………………………………….
Data Presentation………………………………………………………………………………………...
Summary…………………………………………………………………………………………………………..
Demographics of the 2019 New Mexico Sample………………………………………….…..
Health Status Indicators
General Health Status………………………………………………………………………………….
Quality of Life……………………………………………………………………………………………..
Disability……………………………………………………………………………………………………..
Weight Status……………………………………………………………………………………………...
Health Care Access……………………………………………………………………………………..
Chronic Disease and Health Conditions
Arthritis……………………………………………………………………………………………………….
Asthma………………………………………………………………………………………………………..
Cancer…………………………………………………………………………………………………………
Cardiovascular Disease………………………………………………………………………………..
COPD………………………………………………………………………………………………………...
Depression…………………………………………………………………………………………………..
Diabetes……………………………………………………………………………………………………...
Risk and Health Behavior Indicators
Adverse Childhood Experiences…………...…………………………………………………...
Alcohol Consumption………………………………………………………………………………….
Immunization ……………………………………………………………………………………………..
Leisure Time Physical Activity ...………………………………….…………………………….
Current Cigarette Smoking………………………………………………………………………….
Suicidal Ideation………………………………..………………………………………………………..
Firearms……..……...……………………………………………………………………………………...
Appendices
Methods………………………………………………………………………………………………………
New Mexico Health Region Map………………………………………………………………..
New Mexico Urban/Rural County Map.………………………………………………………
References ………………………………………………………………………………………………………..

vi
What is the BRFSS?
Chronic disease, injury, substance abuse, and infectious disease are the leading causes of morbidity and mortality in the U.S. The
Behavioral Risk Factor Surveillance System (BRFSS) is an ongoing, nationwide surveillance system that collects data on the preva-
lence of health conditions in the population and behaviors that affect risk for disease and injury. The surveillance system uses tele-
phone survey methods to collect data in all 50 states, the District of Columbia, Guam, and Puerto Rico. Individuals who are 18
years of age and older, use a cell phone or live in a private residential household with landline telephone service, are eligible for
the survey. Adults who do not have a cell phone for personal use and do not have access to a landline telephone are not eligible
for the survey. Additionally, adults who live in college dormitories, nursing homes, or group homes and do not have a cell phone
for personal use or live in institutions, such as prisons, are not eligible for the survey.
The BRFSS was initiated in the early 1980s after significant evidence had accumulated that behaviors play a major role in the risk
for premature morbidity and mortality. Prior to that time, periodic national surveys were conducted to evaluate health behaviors
for the entire United States, but data were not available at the state level. Because states were ultimately responsible for efforts to
reduce health risk behaviors, state level data were deemed critical.
At about the same time, telephone surveys were emerging as an acceptable means of collecting prevalence data. Telephone sur-
veys were relatively easy for states and local agencies to administer. As a result of these concurrent developments, telephone sur-
veys were developed by the Centers for Disease Control and Prevention (CDC) to monitor state-level prevalence of the major be-
havioral risk factors associated with premature morbidity and mortality. Feasibility studies were conducted in the early 1980's, and
the CDC established the BRFSS in 1984 with 15 states participating. New Mexico began participating in the BRFSS in 1986.
The CDC has developed a core set of questions that is included in the questionnaire of every state. Optional modules of questions
on a variety of topics have been developed by the CDC and made available to the states. Additionally, states are free to include
other questions that have been borrowed from other surveys or developed by the state, provided that space is available in the
questionnaire and the state provides funding to cover the additional cost. Such questions are referred to as ‘state-added’ ques-
tions.
Participation in the survey is voluntary, and all data collected are confidential. The identity of the respondent is never known to the
interviewer, and the last two digits of the phone number are never sent to the CDC. The CDC removes the remaining eight digits of
the phone number from the data file after completing a quality assurance protocol.
The BRFSS is supported and coordinated by the Division of Population Health, Population Health Surveillance Branch, of the CDC.
The CDC has a web site dedicated to the BRFSS:
http://www.cdc.gov/brfss
This 2019 NM BRFSS report is available in .pdf format at the NM Department of Health website:
https://nmhealth.org/about/erd/ibeb/brfss/data/
vii
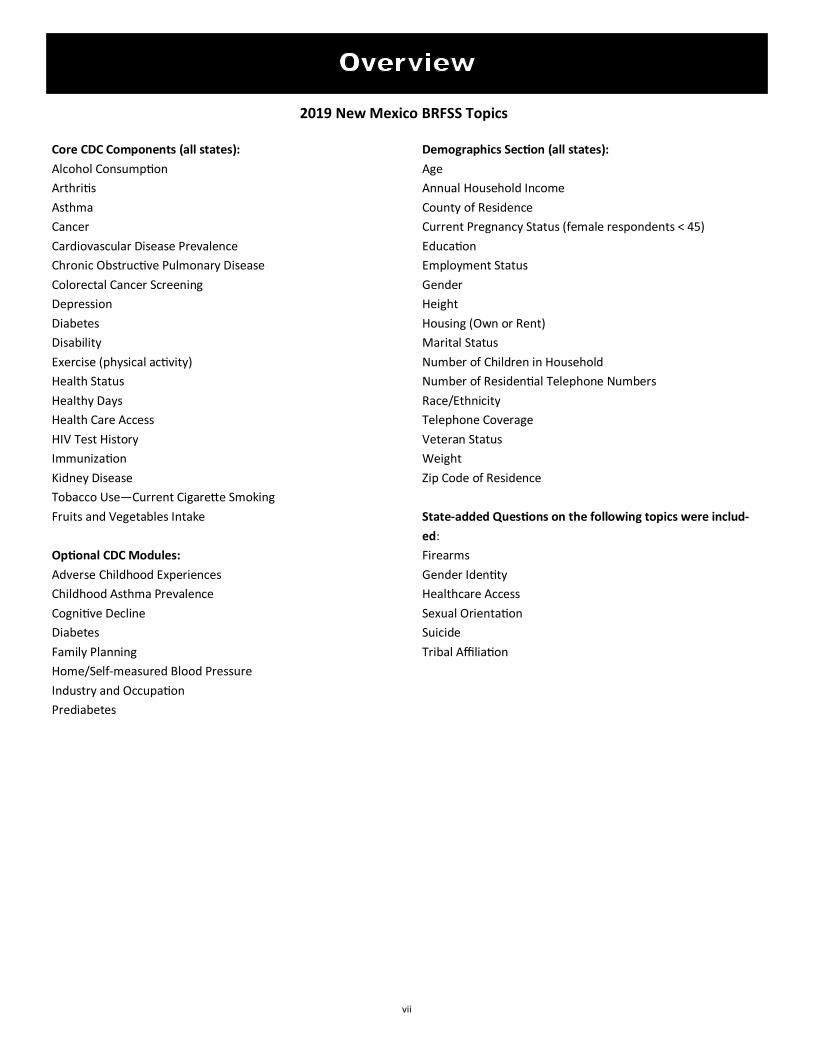
2019 New Mexico BRFSS Topics
Core CDC Components (all states):
Alcohol Consumption
Arthritis
Asthma
Cancer
Cardiovascular Disease Prevalence
Chronic Obstructive Pulmonary Disease
Colorectal Cancer Screening
Depression
Diabetes
Disability
Exercise (physical activity)
Health Status
Healthy Days
Health Care Access
HIV Test History
Immunization
Kidney Disease
Tobacco Use—Current Cigarette Smoking
Fruits and Vegetables Intake
Optional CDC Modules:
Adverse Childhood Experiences
Childhood Asthma Prevalence
Cognitive Decline
Diabetes
Family Planning
Home/Self-measured Blood Pressure
Industry and Occupation
Prediabetes
Demographics Section (all states):
Age
Annual Household Income
County of Residence
Current Pregnancy Status (female respondents < 45)
Education
Employment Status
Gender
Height
Housing (Own or Rent)
Marital Status
Number of Children in Household
Number of Residential Telephone Numbers
Race/Ethnicity
Telephone Coverage
Veteran Status
Weight
Zip Code of Residence
State-added Questions on the following topics were includ-
ed:
Firearms
Gender Identity
Healthcare Access
Sexual Orientation
Suicide
Tribal Affiliation

viii
Limitations and Strengths
Individuals without cellular telephones for personal use and who do not belong to a household with a landline tele-
phone are not eligible to participate in the BRFSS survey. Data collected by the Bureau of the Census under contract
with the Federal Communications Commission (FCC) indicate that unemployed persons and lower income households
are less likely than other residents to have telephones. Consequently, the BRFSS sample is likely to include a greater
proportion of higher income households and employed persons than the population of the state as a whole.
The BRFSS relies on adults to provide information on their own health behaviors and conditions. Respondents may be
reluctant to report behaviors that are considered undesirable such as drinking and driving. Respondents may also have
trouble remembering details about past behaviors or may remember them incorrectly. Consequently, the prevalence
of these behaviors may be underestimated by the survey.
Telephone interviews have a number of advantages over other sampling methods such as face-to-face interviews and
self-administered questionnaires. The lower cost of telephone interviews makes it possible to include a larger number
of adults in the survey than would be possible if a face-to-face survey were conducted. Telephone surveys are also eas-
ier to monitor for quality assurance purposes than are face-to-face surveys. Telephone interviews are administered by
a trained interviewer while self-administered mail-out surveys may be affected by the literacy of the selected respond-
ents and could be completed by family members other than the one selected, which may affect the accuracy of the
information collected.

ix
Limitations and Strengths
Response Rates, New Mexico and U.S., 2019
Landline Cellular Combined Landline & Cellular
Rate NM US NM US NM US
Response Rate 53.5% 53.3% 50.4% 45.9% 52.2% 49.4%
Cooperation 60.3% 62.8% 82.2% 84.5% 69.4% 73.3%
Refusal 23.9% 18.7% 10.9% 6.9% * *
*Unavailable in 2019.
Response Rates
The measures of response presented here were designed to summarize the quality of the 2019 BRFSS survey data.
The Response Rate, Cooperation Rate, and Refusal Rate for the 2019 BRFSS were calculated using standards set by the
American Association of Public Opinion Research (AAPOR). The Cooperation Rate presents the percentage of com-
plete and partially completed interviews among contacted and eligible respondents. The Refusal Rate presents the
percentage of refusals among all eligible and likely eligible phone numbers in the sample. Separate cooperation and
refusal rates were calculated for landline and cellular telephone samples. The Response Rate is a measure meant to
provide an overall summary of survey administration and response. Separate response rates are calculated for land-
line and cellular telephone samples, after which a combined summary Response Rate is calculated by combining the
individual rates, weighted to the respective size of the two samples.

x
Data Presentation
The data in this report are presented in either tables or graphs, and are the estimated population percent-
ages of adults with a particular condition, risk factor, or behavior. Like any estimate produced from popula-
tion surveys, the estimates produced from the BRFSS are subject to error. Two related measures of error are
the standard error (SE) and the 95% confidence interval. Stata/MP 16.1 was used to estimate SE and to pro-
duce the corresponding 95% confidence interval estimates presented in this report. Stata/MP 16.1 is statisti-
cal analysis software that considers the complex sample design of the BRFSS to calculate appropriate SE and
95% confidence intervals.
Statistical significance for the difference between prevalence was determined by comparing the 95% confi-
dence intervals. Throughout this report, we consider the difference between two estimates to be statistically
significant when the 95% CI’s do not overlap. When 95% CI’s overlap, it is considered that there is no statisti-
cally significant difference between two estimates. Throughout this report, lack of statistical significance is
often stated by saying there was no measurable difference between two estimates.
In the tables presented throughout this report, the weighted population estimates along with the 95% confi-
dence intervals are shown. By BRFSS convention and the NMDOH Small Numbers Rule, when a particular es-
timate is based on less than 50 respondents, the weighted percentage, and associated 95% confidence inter-
vals are not presented because estimates based on small sample sizes are considered unreliable. Bar graphs
included in this report include the 95% confidence interval corresponding to the relevant point estimate.
Five race/ethnicity categories are presented. American Indian (presented as AIAN), Asian or Native Hawaiian
or Other Pacific Islander (presented as Asian/NHOPI), Black or African American (presented as Black/AA), His-
panic, and White (which refers to non-Hispanic White). Asian and Native Hawaiian or Other Pacific Islander
are grouped together, which is a common convention when the sample size of Asian and/or NHOPI respond-
ents is too small to present as a distinct group. Respondents reporting Hispanic ethnicity were coded to His-
panic regardless of self-reported race.

xi
Data Presentation cont.
In general, population estimates with smaller standard errors (SE) are more precise and reliable than popula-
tion estimates with larger SE. Sample size influences the magnitude of an estimate’s probability of error and
so affects the likely precision of the estimate. This issue is particularly relevant to some estimates presented
by race/ethnicity where the number of Black/AAs, and Asian/NHOPI sampled was small, resulting in large SE
and estimates that were unreliable. Discerning possible differences between rates of conditions or risk fac-
tors in these smaller populations and the larger White, non-Hispanic, Hispanic, and AIAN populations was
often difficult. This issue is relevant to estimates for any small population group, such as a narrowly defined
age group, a small number of respondents with a particular health condition, or a small demographic group
such as adults who were retired.
With respect to certain conditions and risk factors, particularly those addressed by core BRFSS questions that
were asked of respondents in every state, estimates for New Mexico (NM) were compared to estimates for
the U.S. as a whole (U.S. = all 50 states, plus the District of Columbia). These data are presented in the form
of a trend chart.
Trend charts are presented with a break in the trend lines between data years 2010 and 2011. Beginning in
2011, cellular telephones were included in the sample and over 66% of 2019 interviews were conducted with
adults on cellular telephones. Additionally, significant changes were made to the process of weighting BRFSS
data beginning with the 2011 data set. These two very important and significant changes to the BRFSS pre-
clude the comparison of 2011 and later estimates to those of earlier years, hence the break presented in
trend lines in this report.
Healthy People 2020 goals and objectives are mentioned when applicable. Healthy People 2020 provides sci-
ence-based, national objectives for improving health developed to provide measurable goals and objectives
that can be applied to New Mexico.5
xii
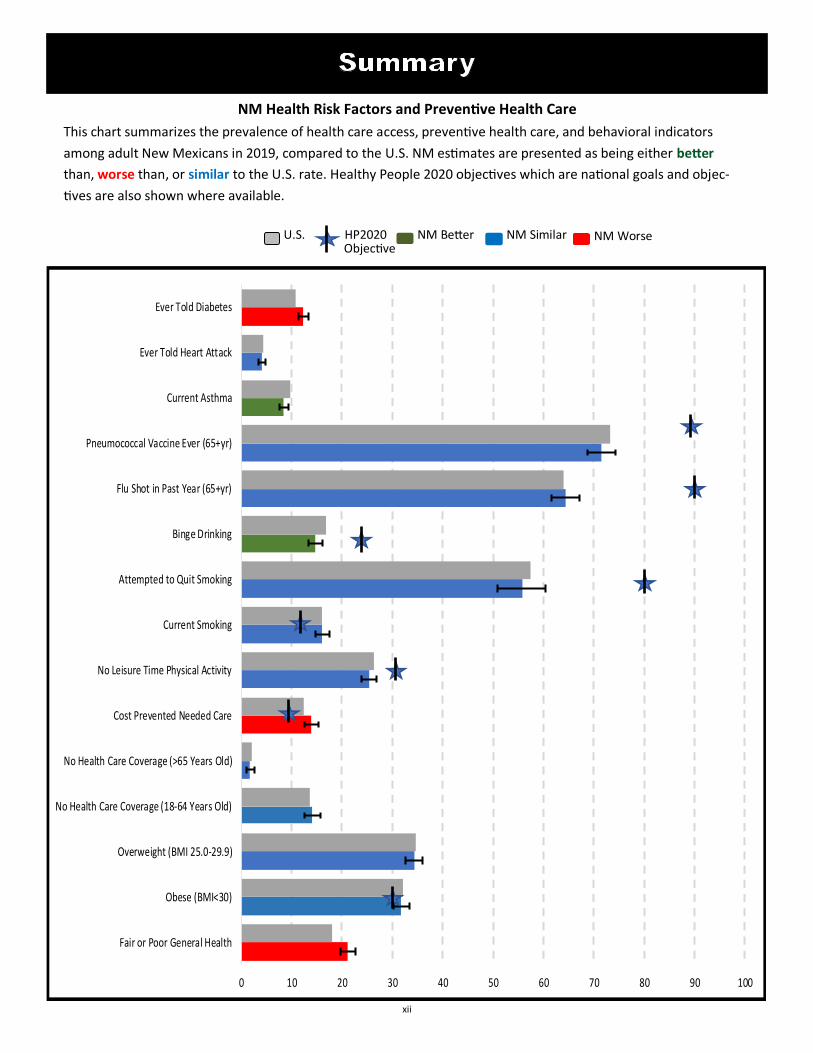
NM Health Risk Factors and Preventive Health Care
This chart summarizes the prevalence of health care access, preventive health care, and behavioral indicators
among adult New Mexicans in 2019, compared to the U.S. NM estimates are presented as being either better
than, worse than, or similar to the U.S. rate. Healthy People 2020 objectives which are national goals and objec-
tives are also shown where available.
Objective U.S. HP2020 NM Better NM Similar NM Worse
0 10 20 30 40 50 60 70 80 90 100
Fair or Poor General Health
Obese (BMI<30)
Overweight (BMI 25.0-29.9)
No Health Care Coverage (18-64 Years Old)
No Health Care Coverage (>65 Years Old)
Cost Prevented Needed Care
No Leisure Time Physical Activity
Current Smoking
Attempted to Quit Smoking
Binge Drinking
Flu Shot in Past Year (65+yr)
Pneumococcal Vaccine Ever (65+yr)
Current Asthma
Ever Told Heart Attack
Ever Told Diabetes

xiii
*Respondents who answered “don’t know not sure” or who refused to answer were excluded. Consequently, the sample sizes across categories for some variables may not add to
the total.
¥ ACS: ¥ Population Estimates: University of New Mexico, Geospatial and Population Studies (GPS) Program, http://gps.unm.edu/ . The Bureau of Business and Economic Research
(BBER) and the Geospatial and Population Studies (GPS) Program are both housed within the UNM Institute for Applied Research Services (IARS).
Number in
Sample*
Unweighted
Percent (%)
Weighted
Percent(%)
2019 Pop.
Estimates¥
Total 5,975 100.0 100.0
Age
18-44 1,604 27.1 45.6 45.3
45-64 2,041 34.5 31.1 31.4
65+ 2,278 38.4 23.3 23.3
Gender
Male 2,767 46.3 49.1 49.1
Female 3,208 53.7 50.9 50.9
Race/Ethnicity
AIAN 546 9.4 9.1 8.6
Asian or NHOPI 48 0.8 1.0 1.9
Black/AA 83 1.4 2.1 2.2
Hispanic 1,928 33.2 47.7 46.0
White 3,211 55.2 40.1 41.3
Sexual Orientation
Straight 5,245 96.4 94.9 NA
LGB/Other 198 3.6 5.1 NA
Household Income
< $15,000 638 12.6 12.7 NA
$15,000-$24,999 1,054 20.9 22.4 NA
$25,000-$49,999 1,274 25.2 26.0 NA
$50,000-$74,999 682 13.5 12.4 NA
> $75,000 1,405 27.8 26.5 NA
Geographic Region
Northwest 1,387 23.2 10.1 10.1
Northeast 1,070 17.9 14.8 14.7
Metropolitan 1,487 24.9 44.4 44.2
Southeast 1,015 17.0 13.2 13.3
Southwest 1,016 17.0 17.5 17.7
Education Level
<HS 661 11.1 15.7 NA
HS Grad/GED 1,549 26.0 27.2 NA
Some College 1,634 27.4 33.3 NA
College Grad. 2,117 35.5 23.8 NA
Employment Status
Employed 2,730 46.2 54.8 NA
Unemployed/Unable to work 728 12.3 13.0 NA
Homemaker/Student 544 9.2 12.3 NA
Retired 1,905 32.3 19.9 NA
Urban/Rural Designation
Metro 1,425 24.8 44.1 44.2
Small/Metro 1,740 30.3 22.8 23.5
Mixed Urban/Rural 2,141 37.3 27.3 27.7
Rural 434 7.6 5.7 4.6
2019 BRFSS Data
Demographic Characteristics

1
Self-reported health status is how a person perceives
their own health, is a very important indicator of health
among different populations, and allows for broad com-
parisons across various health conditions.1
• In 2019, 21.1% of New Mexico adults reported that
their general health was either fair or poor.
• Fair or poor general health increased with age and
decreased with increasing household income.
• The prevalence of fair or poor general health status
was similar among geographic regions.
• White adults (17.2%) reported a significantly lower
prevalence of fair or poor health than AIAN (25.9%)
and Hispanic(23.8%) adults.
• In 2019, the prevalence of fair or poor general health
among NM adults (21.1%) was higher than that of
the U.S. median prevalence (18.0%).
a Among all adults, the proportion reporting that their health, in general was either fair or
poor. ** Suppressed due to a denominator <50.
Question:
“Would you say that in general, your health is:
Excellent, Very good, Good, Fair, or Poor?
%
(95% Confidence
Interval)
Total 21.1 (19.7-22.6)
Age
18-44 13.0 (11.1-15.2)
45-64 26.1 (23.5-28.8)
65+ 30.9 (28.1-33.8)
Gender
Male 19.5 (17.6-21.6)
Female 22.7 (20.7-24.8)
Race/Ethnicity
AIAN 25.9 (21.1-31.4)
Asian or NHOPI ** **
Black/AA 25.9 (15.2-40.6)
Hispanic 23.8 (21.5-26.2)
White 17.2 (15.3-19.2)
Sexual Orientation
Straight 21.2 (19.7-22.8)
LGB/Other 23.7 (16.8-32.4)
Household Income
< $15,000 40.7 (35.6-45.9)
$15,000-$24,999 28.3 (24.8-32.1)
$25,000-$49,999 17.7 (14.9-20.9)
$50,000-$74,999 16.2 (12.5-20.6)
> $75,000 6.8 (5.3-8.8)
Geographic Region
Northwest 22.7 (19.5-26.2)
Northeast 18.0 (15.3-21.0)
Metropolitan 19.9 (17.4-22.5)
Southeast 23.8 (21.0-26.9)
Southwest 24.1 (20.9-27.6)
General Health, Fair or
Poora
Demographic
Characteristics
0
25
50
75
100
2007 2008 2009 2010 2011 2012 2013 2014 2015 2016 2017 2018 2019
%
General Health, Fair or Poor, NM vs. U.S., 2007-2019
NM US

2
%
%
0
25
50
75
100
<High School HS Grad/GED Some College College Grad
Fair or Poor General Health Status by Education Level, 2019
%
• NM adults with less than a high school
education (42.6%) reported a significantly
higher prevalence of fair or poor general
health than adults with a high school
diploma/GED, some college, and college
graduates.
• Adults who reported they were unable to
work/unemployed (46.6%) reported a
significantly higher prevalence of fair or
poor health than employed adults
(13.4%).
• The prevalence of fair or poor general
health was similar among counties desig-
nated as metropolitan, small metro,
mixed urban/rural, and rural.
45.0%
Percent with Fair/Poor Health with at least one disability
0
25
50
75
100
Employed Unemployed/Unableto work
Homemaker/Student Retired
Fair or Poor General Health Status by Employment Status,
2019
Percent with Fair/Poor Health with no disabilities
0
25
50
75
100
Metro Small/Metro Mixed Urban Rural
Fair or Poor General Health Status by Urban/Rural Designation,
2019
%
%
3
Question:
“Now thinking about your physical/
mental health...for how many days
during the past 30 days was your
physical/mental health not good?
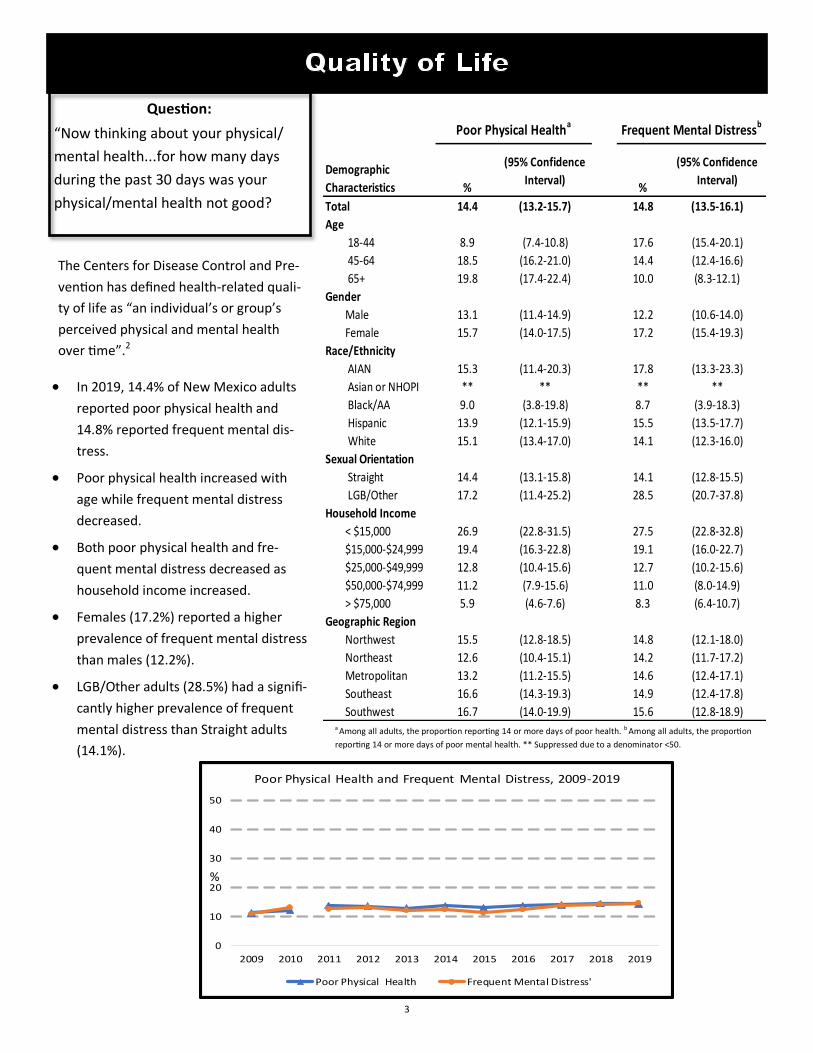
• In 2019, 14.4% of New Mexico adults
reported poor physical health and
14.8% reported frequent mental dis-
tress.
• Poor physical health increased with
age while frequent mental distress
decreased.
• Both poor physical health and fre-
quent mental distress decreased as
household income increased.
• Females (17.2%) reported a higher
prevalence of frequent mental distress
than males (12.2%).
• LGB/Other adults (28.5%) had a signifi-
cantly higher prevalence of frequent
mental distress than Straight adults
(14.1%).
a Among all adults, the proportion reporting 14 or more days of poor health. b Among all adults, the proportion
reporting 14 or more days of poor mental health. ** Suppressed due to a denominator <50.
The Centers for Disease Control and Pre-
vention has defined health-related quali-
ty of life as “an individual’s or group’s
perceived physical and mental health
over time”.2
%
(95% Confidence
Interval)%
(95% Confidence
Interval)
Total 14.4 (13.2-15.7) 14.8 (13.5-16.1)
Age
18-44 8.9 (7.4-10.8) 17.6 (15.4-20.1)
45-64 18.5 (16.2-21.0) 14.4 (12.4-16.6)
65+ 19.8 (17.4-22.4) 10.0 (8.3-12.1)
Gender
Male 13.1 (11.4-14.9) 12.2 (10.6-14.0)
Female 15.7 (14.0-17.5) 17.2 (15.4-19.3)
Race/Ethnicity
AIAN 15.3 (11.4-20.3) 17.8 (13.3-23.3)
Asian or NHOPI ** ** ** **
Black/AA 9.0 (3.8-19.8) 8.7 (3.9-18.3)
Hispanic 13.9 (12.1-15.9) 15.5 (13.5-17.7)
White 15.1 (13.4-17.0) 14.1 (12.3-16.0)
Sexual Orientation
Straight 14.4 (13.1-15.8) 14.1 (12.8-15.5)
LGB/Other 17.2 (11.4-25.2) 28.5 (20.7-37.8)
Household Income
< $15,000 26.9 (22.8-31.5) 27.5 (22.8-32.8)
$15,000-$24,999 19.4 (16.3-22.8) 19.1 (16.0-22.7)
$25,000-$49,999 12.8 (10.4-15.6) 12.7 (10.2-15.6)
$50,000-$74,999 11.2 (7.9-15.6) 11.0 (8.0-14.9)
> $75,000 5.9 (4.6-7.6) 8.3 (6.4-10.7)
Geographic Region
Northwest 15.5 (12.8-18.5) 14.8 (12.1-18.0)
Northeast 12.6 (10.4-15.1) 14.2 (11.7-17.2)
Metropolitan 13.2 (11.2-15.5) 14.6 (12.4-17.1)
Southeast 16.6 (14.3-19.3) 14.9 (12.4-17.8)
Southwest 16.7 (14.0-19.9) 15.6 (12.8-18.9)
Frequent Mental Distressb
Demographic
Characteristics
Poor Physical Healtha
0
10
20
30
40
50
2009 2010 2011 2012 2013 2014 2015 2016 2017 2018 2019
Poor Physical Health and Frequent Mental Distress, 2009-2019
Poor Physical Health Frequent Mental Distress'
%

4
0
10
20
30
40
50
Employed Unemployed/Unableto work
Homemaker/Student Retired
Quality of Life by Employment Status, 2019
Poor Physical Health Frequent Mental Distress
%
0
10
20
30
40
50
<High School HSGrad/GED Some College College Grad
Quality of Life by Education Level, 2019
Poor Physical Health Frequent Mental Distress
%
%
• Among NM adults, the prevalence of both
poor physical health and frequent mental dis-
tress decreased with higher education level.
• Both poor physical health and frequent mental
distress were reported significantly higher
among NM adults who were unemployed or
unable to work.
• The prevalence of poor physical health and
frequent mental distress was similar across
Urban/Rural county designation.
• Adults with disabilities (34.2% and 30.5%)
were more likely to have both poor physical
health and frequent mental distress than
adults without disabilities (6.5% and 8.6%, re-
spectively).
0
10
20
30
40
50
Metro Small/Metro Mixed/Urban Rural
Quality of Life by Urban/Rural Designation, 2019
Poor Physical Health Frequent Mental Distress
%

5
In the Americans with Disabilities Act, an individual with a
disability is defined as a person who is substantially limited
in one or more major life activities by a physical or mental
impairment, a person who has a history of such an impair-
ment, or a person who is perceived by others as having
such an impairment.3
0
5
10
15
20
25
Vision Hearing Mobility Cognition Self-Care IndependentLiving
Prevalence of Disability by Reported Type of Disability, 2019
%
• In 2019, an estimated 29.0% of New Mexico adults
reported at least one disability.
• The prevalence of at least one disability increased
with age.
• The prevalence of having at least one disability de-
creased with increasing household income.
• LGB/Other adults (36.8%) were more likely to have at
least one disability than straight adults (28.6%). This
was not statistically significant.
• The most prevalent disability was difficulty walking
(14.0%). The highest prevalence of difficulty walking
was among adults over 65 years of age (27.9%).
Question:
“The following questions are about health prob-
lems and impairments you may have, such as diffi-
culty seeing, hearing, walking, and independent
living?”
%
(95% Confidence
Interval)
Total 29.0 (27.4-30.7)
Age
18-44 20.1 (17.7-22.8)
45-64 31.6 (28.9-34.4)
65+ 43.3 (40.3-46.3)
Gender
Male 28.4 (26.1-30.8)
Female 29.6 (27.4-32.0)
Race/Ethnicity
AIAN 26.9 (22.1-32.3)
Asian or NHOPI ** **
Black/AA 31.5 (19.4-46.7)
Hispanic 30.6 (28.0-33.3)
White 27.7 (25.5-30.0)
Sexual Orientation
Straight 28.6 (26.9-30.4)
LGB/Other 36.8 (28.2-46.3)
Household Income
< $15,000 51.2 (45.8-56.7)
$15,000-$24,999 37.5 (33.5-41.7)
$25,000-$49,999 28.5 (25.1-32.1)
$50,000-$74,999 20.6 (16.5-25.3)
> $75,000 11.9 (9.7-14.5)
Geographic Region
Northwest 29.9 (26.2-34.0)
Northeast 30.0 (26.5-33.8)
Metropolitan 26.3 (23.6-29.3)
Southeast 34.2 (30.8-37.7)
Southwest 30.7 (27.1-34.5)
Total Disabilitya
Demographic
Characteristics
aAmong all adults, those who said yes to at least one disability; difficulty seeing, hearing,
walking, remembering, dressing/bathing and mobility to run errands. ** Suppressed due to a
denominator <50.

6
0
25
50
75
100
18-44 45-64 65-74 75+
Total Disability by Age Group, 2019
%
0
25
50
75
100
<High School HSGrad/GED Some College College Grad
Total Disability by Education, 2019
%
0
25
50
75
100
Metro Small/Metro Mixed Urban/Rural Rural
Total Disability by Urban/Rural Designation, 2019
%
0
25
50
75
100
Employed Unemployed/Unableto work
Homemaker/Student Retired
Total Disability by Employment Status, 2019
%
• Among NM adults, the prevalence of at least
one disability decreased with increasing edu-
cation level. NM adults with less than a high
school diploma/GED had a significantly high-
er prevalence of at least one disability
(45.7%) than adults with a college degree
(14.9%).
• NM adults who were either unemployed
and/or unable to work had a significantly
higher prevalence of having at least one disa-
bility (64.7%) than employed adults (17.7%).
• Adults in counties designated as rural
(40.1%) had a significantly higher prevalence
of at least one disability compared to adults
in the metropolitan counties (26.7%)
• The prevalence of disability increased with
age as over 50 percent of adults over 75
years of age had at least one disability.

7
Overweight and obesity have been proven to increase
the risk of diseases and health conditions such as high
blood pressure, diabetes, coronary heart disease,
stroke, gallbladder disease, high cholesterol, and some
forms of cancer.4 Overweight is defined as having a
body mass index (BMI) between 25.0 and 29.9, and
obesity is defined as a BMI greater than or equal to
30.0.
• In 2019, 31.7% of New Mexico adults were obese.
The prevalence of obesity in New Mexico was low-
er than the U.S. median prevalence (32.1%).
• Adults in the middle age range had a higher preva-
lence of obesity (36.5%) than adults aged 65 and
older (24.8%) and adults 18-44 (32.0%).
• There was no measurable difference in obesity by
gender.
• AIAN adults had a significantly higher prevalence
of obesity (45.8%) than all other races/ethnicities.
• Adults in the lowest household income category
had a significantly higher prevalence of obesity
(37.1%) compared to adults in the highest catego-
ry (29.9%).
• Adults in the Northwest region had the highest
prevalence of obesity (42.1%) while those in the
Northeast region had the lowest (27.1%).
0
10
20
30
40
50
2007 2008 2009 2010 2011 2012 2013 2014 2015 2016 2017 2018 2019
Obesity, NM vs. US, 2007-2019
NM US
%
aAmong all adults, the proportion of respondents whose BMI was greater than or equal to 30.0.
Note: BMI, body mass index, is defined as weight (in kg) divided by height (in meters) squared.
Weight and height are self-reported. Pregnant women were excluded. ** Suppressed due to a
denominator <50.
Questions:
“About how much do you weigh without
shoes? About how tall are you?” %
(95% Confidence
Interval)
Total 31.7 (30.0-33.5)
Age
18-44 32.0 (29.1-35.0)
45-64 36.5 (33.6-39.5)
65+ 24.8 (22.3-27.6)
Gender
Male 31.0 (28.6-33.5)
Female 32.5 (30.0-35.1)
Race/Ethnicity
AIAN 45.8 (39.5-52.2)
Asian or NHOPI ** **
Black/AA 37.4 (24.2-52.8)
Hispanic 34.6 (31.8-37.6)
White 25.4 (23.3-27.7)
Sexual Orientation
Straight 31.9 (30.1-33.8)
LGB/Other 28.5 (20.6-37.9)
Household Income
< $15,000 37.1 (31.9-42.6)
$15,000-$24,999 36.6 (32.5-40.9)
$25,000-$49,999 29.5 (25.8-33.4)
$50,000-$74,999 31.0 (26.1-36.3)
> $75,000 29.9 (26.6-33.3)
Geographic Region
Northwest 42.1 (37.6-46.7)
Northeast 27.1 (23.7-30.7)
Metropolitan 29.9 (26.9-33.1)
Southeast 36.0 (32.4-39.7)
Southwest 31.4 (27.6-35.5)
Obesea
Demographic
Characteristics

8
%
Obesity by Education Level, 2016
%
0
10
20
30
40
50
<High School HSGrad/GED Some College College Grad
Obesity by Education Level, 2019
%
• The Healthy People (HP) 2020 goal for obe-
sity among adults is 30.5%. The prevalence
of obesity among NM adults in 2019 was
31.7%, 1.2 percentage points higher than
the HP2020 goal.5
• College graduates had a significantly lower
prevalence of obesity that those with less
than a high school education.
• NM adults who were unemployed/unable
to work reported a higher prevalence of
obesity (38.8%) compared to retired adults
(27.3%).
• The prevalence of obesity was similar by
Urban/Rural county designation.
• Adults who reported exercising (leisure-
time physical activity) had significantly less
obesity than adults who reported no exer-
cise.
39.0% 0
10
20
30
40
50
Employed Unemployed/Unableto work
Homemaker/Student Retired
Obesity by Employment Status, 2019
NM adults who report no Leisure-
Time Physical activity who are Obese
%
29.4%
NM adults who report Leisure-Time Physical
activity who are Obese
0
10
20
30
40
50
Metro Small/Metro Mixed Urban/Rural Rural
Obesity by Urban/Rural Designation, 2019
%
9
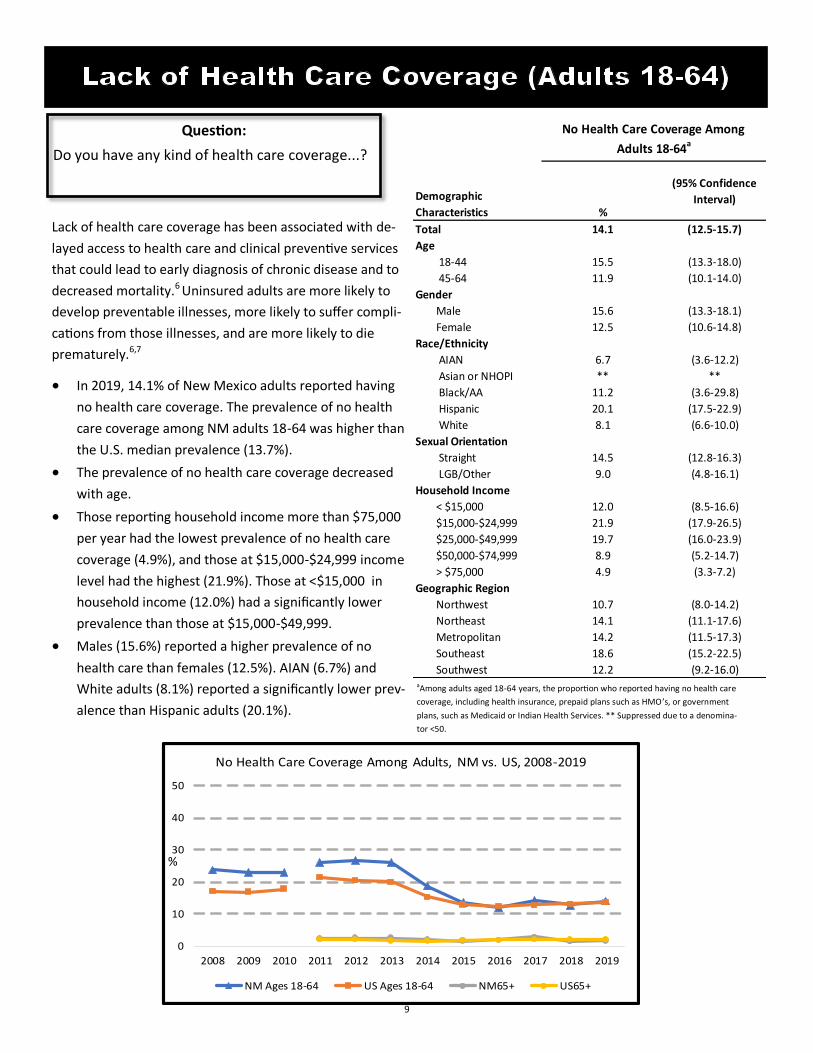
Lack of health care coverage has been associated with de-
layed access to health care and clinical preventive services
that could lead to early diagnosis of chronic disease and to
decreased mortality.6 Uninsured adults are more likely to
develop preventable illnesses, more likely to suffer compli-
cations from those illnesses, and are more likely to die
prematurely.6,7
• In 2019, 14.1% of New Mexico adults reported having
no health care coverage. The prevalence of no health
care coverage among NM adults 18-64 was higher than
the U.S. median prevalence (13.7%).
• The prevalence of no health care coverage decreased
with age.
• Those reporting household income more than $75,000
per year had the lowest prevalence of no health care
coverage (4.9%), and those at $15,000-$24,999 income
level had the highest (21.9%). Those at <$15,000 in
household income (12.0%) had a significantly lower
prevalence than those at $15,000-$49,999.
• Males (15.6%) reported a higher prevalence of no
health care than females (12.5%). AIAN (6.7%) and
White adults (8.1%) reported a significantly lower prev-
alence than Hispanic adults (20.1%).
aAmong adults aged 18-64 years, the proportion who reported having no health care
coverage, including health insurance, prepaid plans such as HMO ’s, or government
plans, such as Medicaid or Indian Health Services. ** Suppressed due to a denomina-
tor <50.
0
10
20
30
40
50
2008 2009 2010 2011 2012 2013 2014 2015 2016 2017 2018 2019
No Health Care Coverage Among Adults, NM vs. US, 2008-2019
NM Ages 18-64 US Ages 18-64 NM65+ US65+
%
Question:
Do you have any kind of health care coverage...?
%
(95% Confidence
Interval)
Total 14.1 (12.5-15.7)
Age
18-44 15.5 (13.3-18.0)
45-64 11.9 (10.1-14.0)
Gender
Male 15.6 (13.3-18.1)
Female 12.5 (10.6-14.8)
Race/Ethnicity
AIAN 6.7 (3.6-12.2)
Asian or NHOPI ** **
Black/AA 11.2 (3.6-29.8)
Hispanic 20.1 (17.5-22.9)
White 8.1 (6.6-10.0)
Sexual Orientation
Straight 14.5 (12.8-16.3)
LGB/Other 9.0 (4.8-16.1)
Household Income
< $15,000 12.0 (8.5-16.6)
$15,000-$24,999 21.9 (17.9-26.5)
$25,000-$49,999 19.7 (16.0-23.9)
$50,000-$74,999 8.9 (5.2-14.7)
> $75,000 4.9 (3.3-7.2)
Geographic Region
Northwest 10.7 (8.0-14.2)
Northeast 14.1 (11.1-17.6)
Metropolitan 14.2 (11.5-17.3)
Southeast 18.6 (15.2-22.5)
Southwest 12.2 (9.2-16.0)
No Health Care Coverage Among
Adults 18-64a
Demographic
Characteristics

10
• The HP 2020 target is to have 100% of adults
insured by 2020. Since the prevalence of no
health care coverage among New Mexico
adults is currently 14.1%, this prevalence
would have to decrease by 14.1 percentage
points in 2020 to meet this goal.
• The prevalence of no health care coverage
decreased with increasing education level.
• Homemakers/students reported a higher
prevalence of no health care coverage com-
pared to retired adults.
• The prevalence of no health care coverage
was similar across geographic regions.
• Adults without health care coverage were
significantly less likely to receive any of five
preventative health care services than were
adults with coverage.
0
10
20
30
40
50
<High School HSGrad/GED Some College College Grad
Lack of Health care Coverage by Education Level, 2019
%
0.0
10.0
20.0
30.0
40.0
50.0
Employed Unemployed/Unableto work
Homemaker/Student Retired
Lack of Health Care Coverage by Employment Status, 2019
%
0
10
20
30
40
50
Metro Small/Metro Mixed Urban/Rural Rural
Lack of Health Care Coverage by Urban/Rural Designation,
2019
%
0 10 20 30 40 50 60 70 80 90 100
Age 65+ with Pneumonia Vaccination
Cholesterol Check w/in past5 yrs
Colorectal Cancer Screen Among Adults Age50+
Mammogram within Past 2 Years, 40+
Oral Health Visit w/in Past Year
Percentage of NM adults with preventive services with coverage
vs. adults with no coverage, 2018-2019
%

11
aAmong all adults , the proportion who reporting ever been told by a doctor that they
had some form of arthritis, rheumatoid arthritis, gout, lupus, or fibromyalgia.
**Suppressed due to a denominator <50.
• In 2019, 25.9% of New Mexico adults had been diag-
nosed with some form of arthritis. The prevalence of ar-
thritis among NM adults was similar to the U.S. median
prevalence (26.0%).
• The percentage of women with diagnosed arthritis
(30.1%) was higher than that of adult men (21.5%). This
association between arthritis and gender has been con-
sistent over time.
• Arthritis is strongly associated with age, the prevalence
among adults over 65 years was 46.9%.
• The percentage of adults with diagnosed arthritis was
higher among White adults than among AIAN and His-
panic adults.
• Among adults living in households with an annual in-
come of $75,000 or more, the prevalence of diagnosed
arthritis was lower than among those of income catego-
ries of less than $15,000.
There are over 100 forms of rheumatic disease commonly
referred to as arthritis, including osteoarthritis, rheumatoid
arthritis, fibromyalgia, and gout. Arthritis is the most com-
mon cause of disability in the U.S.8
0
10
20
30
40
50
2011 2012 2013 2014 2015 2016 2017 2018 2019
Ever Told Arthritis, NM vs US, 2011-2019
NM US Median
%
Question:
“Have you ever been told by a doctor or other
health professional that you have some form of
arthritis, rheumatoid arthritis, gout, lupus, or
fibromyalgia?”
%
(95% Confidence
Interval)
Total 25.9 (24.4-27.3)
Age
18-44 9.3 (7.8-11.0)
45-64 34.4 (31.7-37.2)
65+ 46.9 (44.0-49.9)
Gender
Male 21.5 (19.6-23.4)
Female 30.1 (28.0-32.3)
Race/Ethnicity
AIAN 21.3 (16.9-26.5)
Asian or NHOPI ** **
Black/AA 24.9 (14.7-39.1)
Hispanic 20.9 (18.9-23.1)
White 32.9 (30.7-35.2)
Sexual Orientation
Straight 25.7 (24.2-27.3)
LGB/Other 23.8 (17.4-31.7)
Household Income
< $15,000 32.4 (28.0-37.3)
$15,000-$24,999 27.2 (23.8-30.8)
$25,000-$49,999 22.7 (19.9-25.8)
$50,000-$74,999 26.7 (22.6-31.2)
> $75,000 23.7 (21.0-26.7)
Geographic Region
Northwest 25.4 (22.3-28.9)
Northeast 29.3 (26.2-32.7)
Metropolitan 24.3 (21.8-26.9)
Southeast 28.3 (25.4-31.5)
Southwest 25.4 (22.4-28.6)
Ever Told Arthritisa
Demographic
Characteristics

12
• The prevalence of diagnosed arthritis did not vary by
sexual orientation or education level.
• Among NM adults with an employment status of
retired or unemployed/unable to work, the preva-
lence of diagnosed arthritis was significantly higher
than employed or homemaker/student adults.
• There was no measurable difference by Urban/Rural
county designation.
• Adults with diagnosed arthritis were more likely to
have fair or poor health (35.3% and 16.1%), to have
diabetes(19.8% and 9.5%), cardiovascular disease
(15.6% and 4.7%), or have a disability (52.0% and
20.8%).
• 43.9% of adults with arthritis reported that arthritis
limited their usual activities while 37.1% said that
arthritis affected whether they worked.
%
%
0
25
50
75
100
<High School HSGrad/GED Some College College Grad
Ever Told Arthritis by Education Level, 2019
%
43.9%
Limited Usual Activities
0
25
50
75
100
Employed Unemployed/Unableto work
Homemaker/Student Retired
Ever Told Arthritis by Employment Status, 2019
%
%
37.1%
Affected Whether you Work
0.0
25.0
50.0
75.0
100.0
Metro Small/Metro Mixed Urban/Rural Rural
Ever Told Arthritis by Urban/Rural Designation, 2019
%

13
a Among all adults, the proportion reporting that they were ever told by a doctor, nurse,
or other health care professional that had asthma and report that they still have asth-
ma. **Suppressed due to a denominator <50.
• In 2019, 8.4% of New Mexico adults had asthma at the
time of the interview. The prevalence of current asth-
ma among NM adults was lower than the U.S. Median
prevalence (9.7%).
• The percentage of women who currently had asthma
(10.2%) was significantly higher than that of men
(6.6%).
• The prevalence of current asthma among LGB/other
was higher than among straight adults, 16.2% and
8.0%, respectively. This was statistically significant.
• Low income adults (<$15,000) were more likely to re-
port asthma than other income categories.
• The prevalence of current asthma did not vary signifi-
cantly by age.
Asthma is a chronic respiratory disease characterized by
episodes or attacks of inflammation and narrowing of small
airways. Asthma attacks can vary from mild to life threaten-
ing. Symptoms can include shortness of breath, cough,
wheezing, and chest pain or tightness.9
0
10
20
30
40
50
2008 2009 2010 2011 2012 2013 2014 2015 2016 2017 2018 2019
Current Asthma Among Adults, NM vs. US, 2008-2019
NM US Median
%
Questions:
“(Ever told) you had asthma?
Do you still have asthma?” %
(95% Confidence
Interval)
Total 8.4 (7.5-9.4)
Age
18-44 8.2 (6.8-10.0)
45-64 8.4 (7.0-10.0)
65+ 8.9 (7.2-10.8)
Gender
Male 6.6 (5.4-8.0)
Female 10.2 (8.9-11.7)
Race/Ethnicity
AIAN 5.8 (3.8-8.8)
Asian or NHOPI ** **
Black/AA 11.6 (5.4-23.1)
Hispanic 7.8 (6.4-9.4)
White 9.7 (8.3-11.2)
Sexual Orientation
Straight 8.0 (7.1-9.1)
LGB/Other 16.2 (10.4-24.2)
Household Income
< $15,000 13.2 (10.0-17.4)
$15,000-$24,999 9.2 (7.1-11.8)
$25,000-$49,999 7.5 (5.7-9.7)
$50,000-$74,999 7.3 (5.1-10.3)
> $75,000 6.9 (5.3-8.9)
Geographic Region
Northwest 7.6 (5.8-10.0)
Northeast 7.4 (5.7-9.6)
Metropolitan 8.8 (7.2-10.7)
Southeast 9.8 (7.7-12.2)
Southwest 7.8 (6.1-9.9)
Current Asthmaa
Demographic
Characteristics

14
• The prevalence of current asthma did not
vary significantly by education level.
• Adults who were unemployed/unable to
work were more likely to report current
asthma, (13.9%) than those who were re-
tired (8.1%), employed (7.4%), or a home-
maker or student (7.5%).
• The prevalence of current diagnosed asth-
ma did not vary significantly by Urban/
Rural county designation.
• Adults with current asthma were more like-
ly to report disability/activity limitation
(28.1%) compared to those without current
asthma (12.8%).
%
%
0
10
20
30
40
50
<High School HSGrad/GED Some College College Grad
Current Asthma by Education Level, 2019
%
%
36.5%
Fair/Poor Health with Asthma, 2019
0
10
20
30
40
50
Employed Unemployed/Unableto work
Homemaker/Student Retired
Current Asthma by Education, 2019
19.9%
Fair/Poor Health without Asthma, 2019
0
10
20
30
40
50
Metro Small/Metro Mixed Urban/Rural Rural
Current Asthma by Urban/Rural Designation, 2019
%
%

15
Among all adults, the proportion ever told by a doctor that: athey had skin cancer, bthey had a form of cancer other
than skin cancer, or cthey had skin cancer or any other type of cancer. **Suppressed due to a denominator <50.
Cancer is a term used for diseases in
which abnormal cells divide without con-
trol and are able to invade other tissues.
There are over 100 different types of can-
cer.10
• In 2019, an estimated 12.0% of adults
had a history of any type of cancer,
7.0% had a history of cancer other
than skin cancer, and 6.3% had a his-
tory of skin cancer. There was no sig-
nificant difference between NM and
the U.S.
• There was a strong association with
age, older adults being much more
likely to have a history of cancer.
• For history of any other type of can-
cer, the prevalence was higher among
women (8.4% ) than men (5.6%).
• History of any cancer was higher
among White adults (20.7%) than all
other racial/ethnic groups and history
of non-skin cancer was higher among
White adults (13.2%) than among all
other racial/ethnic groups.
0
10
20
30
40
50
2011 2012 2013 2014 2015 2016 2017 2018 2019
Other Cancer, NM vs. US, 2011-2019
NM US Median
%
0
10
20
30
40
50
2011 2012 2013 2014 2015 2016 2017 2018 2019
Skin Cancer, NM vs. US, 2011-2019
NM US Median
%
Question:
“(Ever told) you had skin cancer, any
other types of cancer?”
%
(95% Confidence
Interval)%
(95% Confidence
Interval)%
(95% Confidence
Interval)
Total 6.3 (5.7-7.1) 7.0 (6.3-7.9) 12.0 (11.0-13.0)
Age
18-44 0.5 (0.3-1.1) 1.5 (0.9-2.4) 2.0 (1.4-3.0)
45-64 6.0 (4.9-7.4) 7.3 (5.9-8.9) 12.6 (10.9-14.6)
65+ 18.0 (15.9-20.4) 17.4 (15.2-19.7) 30.6 (27.9-33.4)
Gender
Male 6.6 (5.7-7.7) 5.6 (4.6-6.7) 11.0 (9.7-12.5)
Female 6.1 (5.1-7.1) 8.4 (7.3-9.7) 12.9 (11.5-14.5)
Race/Ethnicity
AIAN 0.8 (0.3-2.0) 4.5 (2.9-7.0) 5.2 (3.4-7.7)
Asian or NHOPI ** ** ** ** ** **
Black/AA 2.3 (0.5-9.0) 0.9 (0.3-2.9) 3.2 (1.1-9.0)
Hispanic 1.7 (1.2-2.4) 4.5 (3.6-5.7) 5.9 (4.9-7.2)
White 13.2 (11.7-14.8) 10.5 (9.1-12.0) 20.7 (18.9-22.6)
Sexual Orientation
Straight 6.5 (5.8-7.3) 7.1 (6.3-8.1) 12.4 (11.3-13.5)
LGB/Other 1.6 (0.6-4.1) 4.6 (2.0-9.9) 6.1 (3.2-11.4)
Household Income
< $15,000 2.3 (1.4-3.8) 6.5 (4.5-9.2) 8.6 (6.3-11.5)
$15,000-$24,999 4.8 (3.5-6.5) 6.5 (4.8-8.7) 9.6 (7.6-12.0)
$25,000-$49,999 6.1 (4.7-7.8) 7.5 (5.9-9.5) 12.4 (10.3-14.8)
$50,000-$74,999 8.8 (6.7-11.5) 8.1 (5.7-11.2) 14.4 (11.4-18.1)
> $75,000 8.4 (6.9-10.2) 5.5 (4.3-7.0) 12.9 (11.0-15.0)
Geographic Region
Northwest 3.9 (2.9-5.2) 5.4 (4.1-6.9) 8.9 (7.2-10.8)
Northeast 6.3 (5.0-7.8) 7.9 (6.2-9.9) 12.7 (10.6-15.0)
Metropolitan 7.2 (5.9-8.7) 7.3 (6.0-8.9) 13.1 (11.3-15.0)
Southeast 5.8 (4.6-7.3) 6.2 (4.9-7.8) 10.7 (9.0-12.8)
Southwest 5.9 (4.8-7.4) 7.2 (5.7-9.0) 11.5 (9.7-13.6)
Ever Told Skin Cancera
Demographic
Characteristics
Ever Told Any Other
Types of Cancerb
Ever Told Cancerc

16
• History of skin cancer was higher among
adults with higher education levels.
• Adults who were retired or unable to work
were more likely to have a history of skin or
other type of cancer. Adjustment for age
eliminated the difference between retired
and categories other than unable to work.
• There was no statistically significant differ-
ence in the prevalence of any type of can-
cer or any cancer except skin cancer by ge-
ographic region or urban/rural county des-
ignation.
• Adults with history of cancer were more
likely to currently have fair or poor general
%
%
0
10
20
30
40
50
<High School HSGrad/GED Some College College Grad
Ever told Cancer by Education, 2019
%
30.3%
19.6%
19.7
Fair/Poor Health among NM Adults without a History of
Cancer, 2019
33.4
Fair/Poor Health among NM Adults with a history of cancer,
2019
0
10
20
30
40
50
Employed Unemployed/Unableto work
Homemaker/Student Retired
Ever told Cancer by Employment Status, 2019
0
10
20
30
40
50
Metro Small/Metro Mixed Urban/Rural Rural
Ever Told Cancer by Urban/Rural Designation, 2019
%
%

17
• In 2019, 3.0% of New Mexico adults
had ever been told they had angina
or coronary heart disease, 2.8% had
ever been told they had a stroke, and
4.1% they had a heart attack.
• When combining all three measures
into one indicator, an estimated 7.5%
of New Mexico adults had ever been
told by a doctor that they had some
form of cardiovascular disease.
• The prevalence of all three diseases
increased with age and decreased
with increasing household income
level.
Among all adults, the proportion ever told by a doctor that: a they had angina or coronary heart disease, bthey had a
stroke, or cthey had a heart attack or myocardial infarction. ** Suppressed due to a denominator <50.
Heart disease is the leading cause of
death for both men and women in the
U.S.11 It is also one of the leading causes
of disability in the U.S. Stroke is the third
leading cause of death in the US.11
0
5
10
15
20
25
Heart Attack Angina or CoronaryHeart Disease
Stroke CHD or MI
Cardiovascular Disease, NM vs US, 2019
NM US Median
%
Question:
“(Ever told) you had angina or coro-
nary heart disease, stroke, or heart
attack?” %
(95% Confidence
Interval)%
(95% Confidence
Interval)%
(95% Confidence
Interval)
Total 3.0 (2.5-3.5) 2.8 (2.3-3.3) 4.1 (3.5-4.8)
Age
18-44 0.2 (0.1-0.5) 0.6 (0.3-1.2) 0.6 (0.3-1.2)
45-64 3.1 (2.3-4.1) 2.3 (1.6-3.1) 4.6 (3.6-6.0)
65+ 8.3 (6.7-10.3) 7.9 (6.4-9.7) 10.3 (8.5-12.3)
Gender
Male 3.2 (2.6-4.1) 2.6 (2.0-3.3) 4.5 (3.7-5.5)
Female 2.7 (2.1-3.6) 3.0 (2.4-3.9) 3.7 (2.9-4.7)
Race/Ethnicity
AIAN 1.8 (0.9-3.5) 2.2 (1.2-3.9) 2.9 (1.7-5.0)
Asian or NHOPI ** ** ** ** ** **
Black/AA 0.0 (.-.) 4.6 (1.3-15.0) 4.1 (1.2-12.8)
Hispanic 2.0 (1.4-2.8) 2.1 (1.6-2.9) 3.7 (2.9-4.8)
White 4.7 (3.8-5.7) 3.6 (2.8-4.6) 4.7 (3.9-5.8)
Sexual Orientation
Straight 3.0 (2.5-3.6) 2.9 (2.4-3.6) 4.0 (3.4-4.7)
LGB/Other 1.7 (0.5-6.1) 0.8 (0.2-3.3) 2.7 (1.0-7.4)
Household Income
< $15,000 4.3 (2.7-6.8) 4.2 (2.7-6.6) 5.8 (3.9-8.6)
$15,000-$24,999 2.8 (2.0-3.9) 3.6 (2.6-5.0) 4.2 (3.1-5.8)
$25,000-$49,999 2.0 (1.4-3.0) 2.9 (2.0-4.3) 3.3 (2.2-4.7)
$50,000-$74,999 3.9 (2.2-6.6) 1.6 (0.9-2.8) 4.0 (2.6-6.2)
> $75,000 2.6 (1.7-3.9) 1.4 (0.8-2.2) 2.4 (1.6-3.7)
Geographic Region
Northwest 2.5 (1.7-3.5) 2.4 (1.5-3.8) 3.3 (2.3-4.6)
Northeast 2.7 (1.9-3.8) 2.1 (1.3-3.4) 3.7 (2.7-5.1)
Metropolitan 2.7 (1.9-3.8) 2.4 (1.7-3.3) 3.2 (2.3-4.5)
Southeast 4.2 (3.2-5.6) 4.4 (3.3-5.9) 6.8 (5.4-8.7)
Southwest 3.3 (2.4-4.6) 3.5 (2.4-5.1) 5.0 (3.6-6.7)
Ever Told Heart Attackc
Demographic
Characteristics
Ever Told Strokeb
Ever Told Angina or
Coronary Heart Diseasea
18
%
0
5
10
15
20
25
Employed Unemployed/Unableto work
Homemaker/Student Retired
Ever Told Any CVD by Employmnet Status, 2019
%
0
5
10
15
20
25
<HS HS Grad Some College College Grad
Ever Told Any CVD by Education, 2019
%
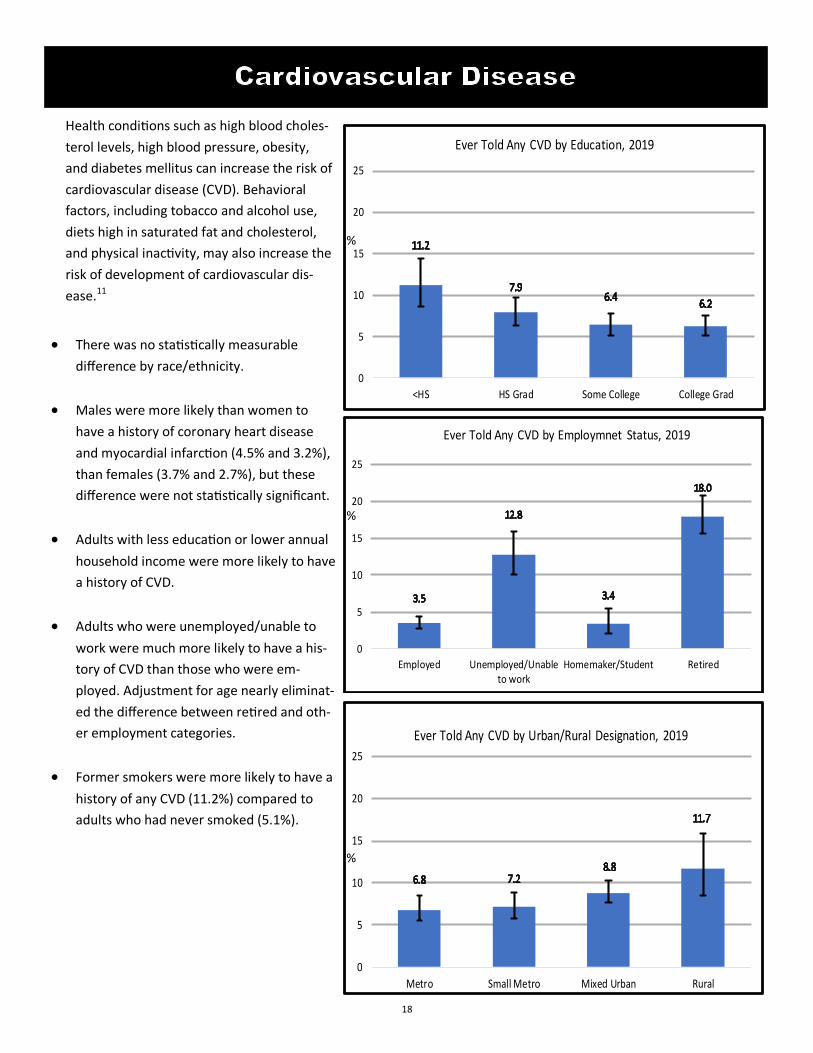
Health conditions such as high blood choles-
terol levels, high blood pressure, obesity,
and diabetes mellitus can increase the risk of
cardiovascular disease (CVD). Behavioral
factors, including tobacco and alcohol use,
diets high in saturated fat and cholesterol,
and physical inactivity, may also increase the
risk of development of cardiovascular dis-
ease.11
• There was no statistically measurable
difference by race/ethnicity.
• Males were more likely than women to
have a history of coronary heart disease
and myocardial infarction (4.5% and 3.2%),
than females (3.7% and 2.7%), but these
difference were not statistically significant.
• Adults with less education or lower annual
household income were more likely to have
a history of CVD.
• Adults who were unemployed/unable to
work were much more likely to have a his-
tory of CVD than those who were em-
ployed. Adjustment for age nearly eliminat-
ed the difference between retired and oth-
er employment categories.
• Former smokers were more likely to have a
history of any CVD (11.2%) compared to
adults who had never smoked (5.1%).
0
5
10
15
20
25
Metro Small Metro Mixed Urban Rural
Ever Told Any CVD by Urban/Rural Designation, 2019
%

19
Chronic obstructive pulmonary disease, or COPD, is a seri-
ous lung disease that makes it hard to breathe and gets
worse over time. COPD includes two main conditions, em-
physema and chronic bronchitis.12 Other causes include
exposure to smoke caused by burning wood and worksite
dusts and chemicals.13
• In 2019, 5.6% of New Mexico adults had been diag-
nosed with some form of COPD. This was lower than
the U.S. median COPD prevalence, 6.5%.
• The was no measurable difference by gender.
• The difference in the prevalence of COPD by sexual
orientation was not statistically significant.
• White adults (8.3%) were more likely to have COPD
than AIAN (2.4%) and Hispanic adults (3.7%).
• There was a gradient in COPD prevalence by level of
household income. Those living in households with
income more than $75,000 per year had a lower prev-
alence of COPD (2.9%), and those at the lowest in-
come level of less than $15,000 a year had higher
COPD prevalence (9.2%).
0
5
10
15
20
25
2012 2013 2014 2015 2016 2017 2018 2019
Ever Told COPD, NM vs US, 2012-2019
NM US Median
%
Question:
“Have you ever been told by a doctor, nurse or oth-
er health professional that you have COPD (chronic
obstructive pulmonary disease), emphysema or
chronic bronchitis?”
%
(95% Confidence
Interval)
Total 5.6 (4.9-6.3)
Age
18-44 2.2 (1.5-3.2)
45-64 5.7 (4.6-7.0)
65+ 12.1 (10.2-14.3)
Gender
Male 5.5 (4.6-6.7)
Female 5.6 (4.7-6.7)
Race/Ethnicity
AIAN 2.4 (1.4-4.0)
Asian or NHOPI ** **
Black/AA 9.1 (3.7-20.6)
Hispanic 3.7 (2.9-4.9)
White 8.3 (7.2-9.7)
Sexual Orientation
Straight 5.6 (4.9-6.4)
LGB/Other 6.3 (3.5-11.1)
Household Income
< $15,000 9.2 (6.7-12.5)
$15,000-$24,999 6.5 (4.9-8.7)
$25,000-$49,999 5.3 (4.0-6.9)
$50,000-$74,999 4.0 (2.6-6.2)
> $75,000 2.9 (2.1-4.0)
Geographic Region
Northwest 4.4 (3.3-5.9)
Northeast 5.8 (4.3-7.9)
Metropolitan 4.9 (3.8-6.3)
Southeast 7.6 (6.1-9.6)
Southwest 6.0 (4.6-7.8)
Ever Told COPDa
Demographic
Characteristics
aAmong all adults , the proportion reporting ever being told by a doctor that they had chronic
obstructive pulmonary disease (COPD), emphysema or chronic bronchitis. **Suppressed due
to a denominator <50.

20
• The prevalence of history of COPD was
highest in the Southeast region (7.6%) and
lowest in the Northwest region (4.4%).
• The prevalence of COPD was lower among
adults with a college degree or more edu-
cation among all education levels.
• The prevalence of a history of COPD was
more than 3 times higher among adults
who were unemployed/unable to work or
retired, than employed or homemaker/
student.
• The prevalence was not statistically signifi-
cant different by Urban/Rural county desig-
nation.
• History of COPD was higher among current
(13.2%) and former smokers (11.1%) than
never smokers (2.5%).
• 52.6% of adults with COPD had fair or poor
general health status, versus 19.2% of
adults with no history of COPD. 66.6% of
those with COPD had at least one disability,
versus 26.6% of adults without COPD.
0
5
10
15
20
25
Metro Small Metro Mixed Urban Rural
Ever Told COPD by Urban/Rural Designation, 2019
%
0
5
10
15
20
25
Employed Unemployed/Unableto work
Homemaker/Student Retired
Ever Told COPD by Employment Status, 2019
%
0
5
10
15
20
25
<HS HS Grad Some College College Grad
Ever Told COPD by Education, 2019
%
76.1%

21
Depression is characterized by depressed or sad
mood, diminished interest in activities that used to
be pleasurable, weight gain or loss, psychomotor
agitation or retardation, fatigue, inappropriate
guilt, difficulties concentrating, as well as recurrent
thoughts of death.15
• In 2019, 17.3% had a history of depression,
meaning they had ever been told they had de-
pression. The prevalence is lower than the U.S.
median (19.9%).
• Adults aged 45-64 had a higher prevalence of
history of depression (19.2%) than adults over
the age of 65 (16.0%). This was not statistically
significant.
• Females had a higher prevalence of history of
depression (20.6%) than males (13.9%).
• There were no measurable difference by race/
ethnicity.
• History of depression was higher among LGB/
Other (37.0%), compared to Straight adults
(16.2%).
aThe proportion reporting ever being told that they had depression by a healthcare professional.
** Suppressed due to a denominator <50.
0
10
20
30
40
50
2011 2012 2013 2014 2015 2016 2017 2018 2019
Ever Diagnosed Depression, NM vs US, 2011-2019
NM US Median
%
Questions:
“Have you ever been told you have a depres-
sive disorder (including depression, major de-
pression, dysthymia, or minor depression)?” %
(95% Confidence
Interval)
Total 17.3 (16.0-18.8)
Age
18-44 16.9 (14.8-19.3)
45-64 19.2 (17.1-21.6)
65+ 16.0 (13.8-18.4)
Gender
Male 13.9 (12.2-15.8)
Female 20.6 (18.7-22.7)
Race/Ethnicity
AIAN 12.3 (8.8-16.8)
Asian or NHOPI ** **
Black/AA 19.4 (11.0-32.0)
Hispanic 17.8 (15.7-20.1)
White 17.8 (15.9-19.8)
Sexual Orientation
Straight 16.2 (14.8-17.6)
LGB/Other 37.0 (28.4-46.6)
Household Income
< $15,000 29.5 (25.0-34.5)
$15,000-$24,999 22.2 (18.8-25.9)
$25,000-$49,999 17.5 (14.7-20.7)
$50,000-$74,999 13.3 (10.1-17.1)
> $75,000 10.8 (8.7-13.4)
Geographic Region
Northwest 16.2 (13.3-19.4)
Northeast 18.9 (16.0-22.1)
Metropolitan 17.0 (14.7-19.5)
Southeast 16.6 (14.0-19.6)
Southwest 18.2 (15.2-21.6)
Demographic
Characteristics
Ever Told Depressiona

22
• There was a gradient in the prevalence of
history of depression by level of household
income. Of lower income adults, over one
fourth (29.5%) had ever been diagnosed
with a depressive disorder, decreasing to
10.1% among adults in the highest house-
hold income level.
• There was no measurable difference in cur-
rent depression or history of depression by
geographic region or urban/rural county
designation.
• Over one-third (37.3%) of adults who were
unable to work or unemployed had a histo-
ry of diagnosed depression.
%
%
%
0
10
20
30
40
50
<High School HSGrad/GED Some College College Grad
Ever Told Depression by Education, 2019
0
10
20
30
40
50
Employed Unemployed/Unableto work
Homemaker/Student Retired
Ever Told Depression by Employment Status, 2019
0
10
20
30
40
50
Metro Small/Metro Mixed Urban/Rural Rural
Ever Told Depression by Urban/Rural Designation, 2019
%
%
%

23
• In 2019, the percentage of adults in New Mexico with
diagnosed diabetes was 12.3%. The NM rate was higher
than the U.S. rate (10.8%). The prevalence of diagnosed
diabetes has increased in recent years, both in NM and
nationally.
• Diagnosed diabetes was higher among AIAN (16.5%)
than among White adults (9.4%).
• There was no statistically significant difference in diabe-
tes prevalence by gender.
• Adults with lower incomes were more likely to have
been diagnosed with diabetes, 19.0% for adults with
the lowest income category and 8.0% for adults with
the highest income category.
• Adults in the Northwest region (15.4%) were more like-
ly to have been diagnosed with diabetes while adults in
the Metropolitan region had the lowest (10.4%).
Diabetes Mellitus (DM) is a group of diseases characterized
by high levels of blood glucose resulting from insufficient
insulin production, insulin action, or both. Diabetes can be
associated with serious complications including cardiovas-
cular disease, end-stage renal disease, blindness, amputa-
tion, and premature death, but people with diabetes can
take steps to control the disease and lower the risk of com-
plications.16
aAmong all adults, the proportion reporting that they were ever told by a doctor that
they had diabetes. ** Suppressed due to a denominator <50.
Question:
“Have you ever been told by a doctor that you
have diabetes?” %
(95% Confidence
Interval)
Total 12.3 (11.2-13.4)
Age
18-44 4.3 (3.2-5.7)
45-64 16.0 (14.1-18.2)
65+ 23.0 (20.5-25.6)
Gender
Male 12.1 (10.6-13.6)
Female 12.4 (11.0-14.1)
Race/Ethnicity
AIAN 16.5 (12.9-20.9)
Asian or NHOPI ** **
Black/AA 10.8 (5.3-20.7)
Hispanic 13.9 (12.2-15.8)
White 9.4 (8.1-10.8)
Sexual Orientation
Straight 12.1 (11.0-13.3)
LGB/Other 9.5 (5.1-16.8)
Household Income
< $15,000 19.0 (15.4-23.1)
$15,000-$24,999 15.0 (12.4-18.1)
$25,000-$49,999 10.2 (8.3-12.4)
$50,000-$74,999 10.7 (8.1-14.0)
> $75,000 8.0 (6.3-10.0)
Geographic Region
Northwest 15.4 (12.6-18.7)
Northeast 11.5 (9.5-13.9)
Metropolitan 10.4 (8.7-12.4)
Southeast 13.4 (11.3-15.8)
Southwest 14.8 (12.3-17.7)
Ever Told Diabetesa
Demographic
Characteristics
0
10
20
30
40
50
2008 2009 2010 2011 2012 2013 2014 2015 2016 2017 2018 2019
Ever Told Diabetes, NM vs. US, 2008-2019
NM US Median
%

24
• New Mexico adults with less education
were more likely to be diagnosed with
diabetes; adults with less than a high
school education (19.1%) had a higher
prevalence than adults with a college
graduate education (8.3%).
• In 2019, the prevalence of diagnosed dia-
betes was much higher among adults who
were unemployed/unable to work
(23.0%) and among retired adults (22.2%)
compared to employed adults (7.1%) and
homemaker/student adults (8.5%).
• The was no measurable difference by Ur-
ban/Rural designation.
• Adults who were obese had the highest
prevalence of diagnosed diabetes (18.9%)
followed by overweight individuals
(11.6%) and adults within the healthy
weight range (7.0%).
• Over half of adults (52.4%) with diag-
nosed diabetes had fair or poor general
health status, compared to 17.7% of
adults with diagnosed diabetes.
• Over half (52.9%) of adults with diag-
nosed diabetes had a disability, compared
to 16.7% of those without diagnosed dia-
betes.
0.0
10.0
20.0
30.0
40.0
50.0
Metro Small/Metro Mixed Urban/Rural Rural
Ever Told Diabetes by Urban/Rural Designation, 2019
%
0.0
10.0
20.0
30.0
40.0
50.0
Employed Unemployed/Unableto work
Homemaker/Student Retired
Ever Told Diabetes by Employment Status, 2019
%
0
10
20
30
40
50
<High School HSGrad/GED Some College College Grad
Ever Told Diabetes by Education, 2019
%

25
• In 2019, the percentage of adults in New Mexico with
four or more ACEs was 24.4%. A national estimate is
not available.
• ACEs were more prevalent among adults 18-44 years of
age.
• The prevalence of ACEs was higher in females (26.6%)
than males (22.2%). This difference was not statistically
significant.
• AIAN had a significantly higher prevalence than other
White adults.
• The prevalence of ACEs decreased with increasing
household income.
• There was no measurable difference by geographic re-
gion.
Adverse experiences in childhood is associated with adult
morbidity and mortality.17 The BRFSS Adverse Childhood
Experiences (ACE) module consists of 11 questions that fit
into 8 categories: emotional abuse, physical abuse, sexual
abuse, parental separation/divorce, household substance
use, household domestic violence, household member in-
carcerated, and household mental illness.
aAmong all adults, the proportion that experienced four or more adverse childhood
experiences during their childhood. ** Suppressed due to a denominator <50.
Question:
“We’d like to ask you questions about events that
happened during your childhood. Now, looking back
before you were 18 years of age- -. Did you experi-
ence any of the following...? ”
0
25
50
75
100
1+ ACES 2+ ACES 4+ ACES 6+ ACES 8+ ACES
ACES Count, NM, 2019
%
%
(95% Confidence
Interval)
Total 24.4 (22.7-26.2)
Age
18-44 31.9 (28.8-35.2)
45-64 24.1 (21.5-26.9)
65+ 11.9 (9.9-14.3)
Gender
Male 22.2 (19.8-24.7)
Female 26.6 (24.2-29.1)
Race/Ethnicity
AIAN 33.1 (27.0-39.8)
Asian or NHOPI ** **
Black/AA 37.1 (22.5-54.5)
Hispanic 24.3 (21.6-27.2)
White 22.7 (20.5-25.1)
Sexual Orientation
Straight 23.6 (21.8-25.4)
LGB/Other 43.8 (34.4-53.7)
Household Income
< $15,000 29.1 (24.2-34.6)
$15,000-$24,999 28.9 (24.7-33.4)
$25,000-$49,999 24.5 (20.9-28.5)
$50,000-$74,999 21.3 (16.9-26.6)
> $75,000 21.7 (18.6-25.3)
Geographic Region
Northwest 28.1 (24.1-32.5)
Northeast 22.6 (19.4-26.1)
Metropolitan 25.0 (22.0-28.2)
Southeast 21.8 (18.5-25.4)
Southwest 24.4 (20.7-28.6)
Adverse Childhood
Eventsa
Demographic
Characteristics

26
• New Mexico adults with less education
were more likely to have experienced four
or more ACE. Adults with less than a high
school education (26.9%) had a higher
prevalence than adults with a college grad-
uate education (18.4%).
• The prevalence of four or more ACE was
much higher among adults who were un-
employed/unable to work (39.0%) com-
pared to all other employment categories.
• The was no measurable difference by Ur-
ban/Rural designation.
• Adults with four or more ACE were more
likely to report fair/poor health (25.7%)
compared to adults with less than four
ACE or no ACE (19.6%).
• Adults with four or more ACE (28.1%) had
a higher prevalence of frequent mental
distress than adults with less than four
ACE or no ACE (10.4%).
0
20
40
60
80
100
Metro Small/Metro Mixed Urban/Rural Rural
Adverse Childhood Experiences by Urban/Rural, 2019
%
0
20
40
60
80
100
Employed Unemployed/Unableto work
Homemaker/Student Retired
Adverse Childood Experiences by Employment Status, 2019
%
0
20
40
60
80
100
<High School HSGrad/GED Some College College Grad
Adverse Childhood Experiences by Education Level, 2019
%

27
• In 2019, the prevalence of binge drinking was
14.7%, lower than the U.S. median of 16.8%.
6.0% of New Mexico adults were heavy
drinkers. Although the rates of binge drinking
were lower in NM than the U.S., over the
past 20 years, New Mexico has consistently
had among the highest alcohol-related death
rates in the U.S.18
• Binge drinking was more prevalent among
the younger age groups, but was relatively
uncommon in the older age groups, ranging
from a high of 22.6% in those 18-44 years of
age to 3.4% in those 65+.
Heavy drinking was more
evenly distributed across
age groups.
Excessive alcohol consumption is a contributing
factor to morbidity and mortality from many
causes.18 Acute binge drinking (defined as 5 or
more drinks for males and 4 or more drinks for
females on at least one occasion during the past
month) is strongly associated with injuries and
death from motor vehicle crashes, homicide, sui-
cide, falls and drug overdose. Chronic ‘heavy’
drinking (defined as > 2 drinks per day for men
and > 1 drink per day for women on average dur-
ing the past month) is strongly associated with
numerous alcohol-related diseases, most notably
alcohol-related chronic liver disease.18
aAmong all adults, the proportion reporting consuming five or more drinks per occasion (males) or four or
more drinks (females) at least once in the past month or breporting consuming seven or more drinks per
week.
Question:
“Considering all types of alcoholic beverages,
how many times during the past 30 days did
you have 5 or more (men) or 4 or more
(women) drinks on a single occasion?”
%
%
(95% Confidence
Interval)%
(95% Confidence
Interval)
Total 14.7 (13.4-16.2) 6.0 (5.1-7.0)
Age
18-44 22.6 (20.0-25.3) 7.2 (5.6-9.1)
45-64 12.2 (10.3-14.4) 5.8 (4.5-7.3)
65+ 3.4 (2.5-4.6) 4.1 (3.1-5.4)
Gender
Male 20.0 (17.8-22.3) 7.6 (6.2-9.1)
Female 9.8 (8.2-11.6) 4.5 (3.5-5.8)
Race/Ethnicity
AIAN 13.9 (10.0-18.9) 5.4 (3.1-9.4)
Asian or NHOPI ** ** ** **
Black/AA 18.8 (8.9-35.2) 8.0 (2.5-22.6)
Hispanic 17.2 (15.0-19.7) 6.1 (4.8-7.9)
White 12.2 (10.5-14.1) 5.9 (4.8-7.1)
Sexual Orientation
Straight 14.9 (13.5-16.5) 6.2 (5.2-7.2)
LGB/Other 23.3 (15.9-32.8) 7.2 (3.5-14.0)
Household Income
< $15,000 13.2 (9.8-17.6) 5.7 (3.6-9.2)
$15,000-$24,999 13.2 (10.5-16.5) 4.8 (3.3-6.9)
$25,000-$49,999 16.7 (13.6-20.4) 7.9 (5.8-10.7)
$50,000-$74,999 11.8 (8.5-16.0) 5.2 (3.3-8.1)
> $75,000 18.2 (15.3-21.4) 7.3 (5.5-9.7)
Geographic Region
Northwest 13.6 (10.8-17.0) 4.1 (2.6-6.3)
Northeast 12.0 (9.6-14.9) 5.9 (4.4-8.0)
Metropolitan 15.1 (12.8-17.8) 6.8 (5.3-8.7)
Southeast 16.7 (13.9-20.0) 6.3 (4.6-8.4)
Southwest 15.3 (12.3-18.8) 4.8 (3.3-7.0)
Binge Drinkinga
Demographic
Characteristics
Heavy Drinkingb
0
10
20
30
40
50
2008 2009 2010 2011 2012 2013 2014 2015 2016 2017 2018 2019
Binge Drinking NM vs US, 2008-2019
NM US Median
%
28
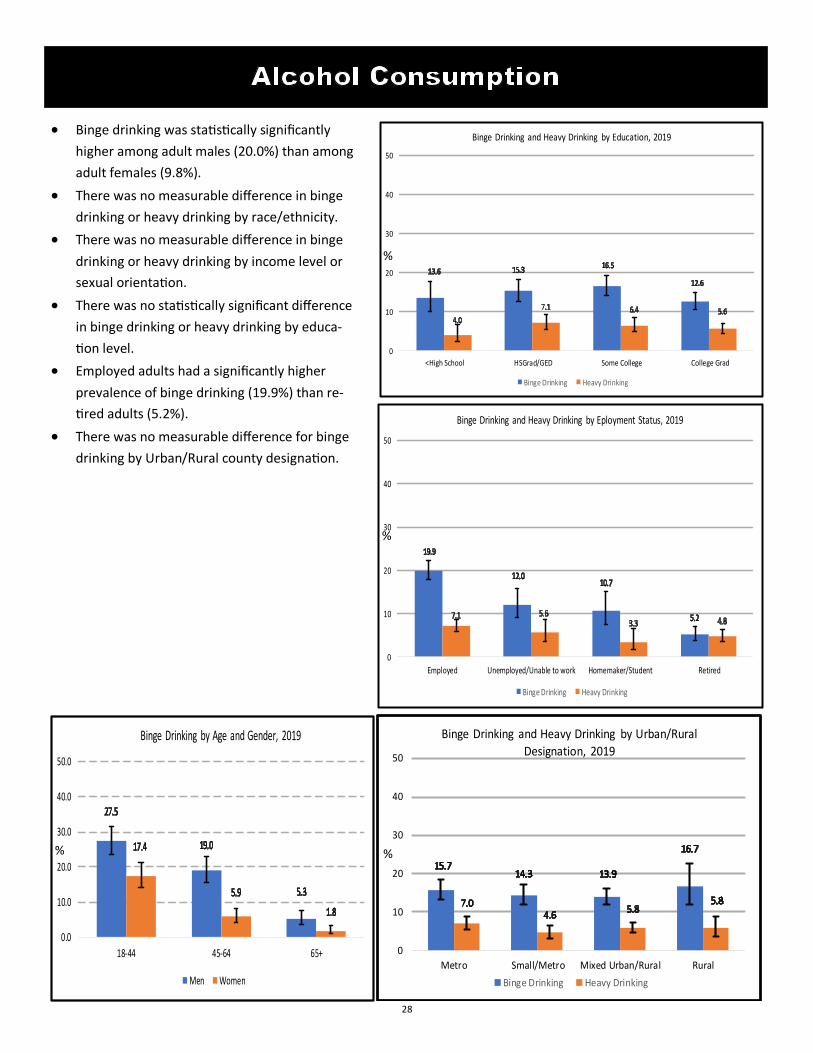
• Binge drinking was statistically significantly
higher among adult males (20.0%) than among
adult females (9.8%).
• There was no measurable difference in binge
drinking or heavy drinking by race/ethnicity.
• There was no measurable difference in binge
drinking or heavy drinking by income level or
sexual orientation.
• There was no statistically significant difference
in binge drinking or heavy drinking by educa-
tion level.
• Employed adults had a significantly higher
prevalence of binge drinking (19.9%) than re-
tired adults (5.2%).
• There was no measurable difference for binge
drinking by Urban/Rural county designation.
0
10
20
30
40
50
Metro Small/Metro Mixed Urban/Rural Rural
Binge Drinking and Heavy Drinking by Urban/Rural
Designation, 2019
Binge Drinking Heavy Drinking
%
0
10
20
30
40
50
Employed Unemployed/Unable to work Homemaker/Student Retired
Binge Drinking and Heavy Drinking by Eployment Status, 2019
Binge Drinking Heavy Drinking
%
0
10
20
30
40
50
<High School HSGrad/GED Some College College Grad
Binge Drinking and Heavy Drinking by Education, 2019
Binge Drinking Heavy Drinking
%
%
0.0
10.0
20.0
30.0
40.0
50.0
18-44 45-64 65+
Binge Drinking by Age and Gender, 2019
Men Women
%

29
People 65 years and older are at a greater risk of seri-
ous complications from the flu and from pneumonia.
The CDC recommends the use of both the annual flu
vaccine and a pneumonia shot to adults over 65 to re-
duce the morbidity and mortality associated with both
of these diseases.19
• In New Mexico in 2019, 64.4% of New Mexico
adults 65 and older received a flu vaccine and
71.6% have ever had a pneumonia shot.
• A greater percentage of White adults had a pneu-
monia shot compared to all other race/ethnicities,
this was not statistically significant. There was no
measurable difference by race for flu shot.
• The prevalence of both having a flu vaccine in the
past year and ever having a pneumonia vaccine
was similar by gender.
• Adults in the Metropolitan region (71.8% and 78.5)
were more likely to have had a flu vaccine the past
year and ever having a pneumonia vaccine com-
pared to adults in the Northwest Region (59.3%
and 66.3%).
0
25
50
75
100
2011 2012 2013 2014 2015 2016 2017 2018 2019
Pneumococcal Vaccination, NM vs US, 2011-2019
NM US Median
%
aAmong adults aged 65 years and older, the proportion reporting that they had a flu vaccine,
either by injection or sprayed in the nose in the past 12 months. bAmong adults 65 years and
older, the proportion reporting that they ever had pneumococcal vaccine. ** Suppressed due
to a denominator <50.
Question:
“During the past 12 months have you had either
a flu shot or flu vaccine?
Have you ever had a pneumonia shot?”
%
(95% Confidence
Interval) %
(95% Confidence
Interval)
Total 64.4 (61.5-67.2) 71.6 (68.8-74.3)
Age
65-74 60.8 (56.9-64.5) 69.0 (65.3-72.5)
75+ 70.2 (65.9-74.1) 75.9 (71.5-79.8)
Gender
Male 62.8 (58.4-67.1) 68.5 (64.1-72.6)
Female 65.7 (61.8-69.4) 74.3 (70.6-77.6)
Race/Ethnicity
AIAN 69.3 (57.6-79.0) 60.2 (46.9-72.1)
Asian or NHOPI ** ** ** **
Black/AA ** ** ** **
Hispanic 63.3 (57.4-68.8) 69.7 (63.9-74.9)
White 65.7 (62.3-69.0) 74.1 (70.9-77.1)
Sexual Orientation
Straight 64.4 (61.2-67.4) 72.5 (69.5-75.2)
LGB/Other ** ** ** **
Household Income
< $15,000 55.1 (44.6-65.2) 65.1 (54.5-74.5)
$15,000-$24,999 59.7 (52.6-66.5) 69.3 (62.5-75.5)
$25,000-$49,999 59.9 (53.6-65.8) 71.8 (65.9-76.9)
$50,000-$74,999 71.3 (63.0-78.4) 79.5 (71.5-85.8)
> $75,000 71.1 (64.9-76.7) 75.5 (69.3-80.8)
Geographic Region
Northwest 59.3 (52.5-65.7) 66.3 (59.3-72.7)
Northeast 62.3 (56.9-67.3) 67.9 (62.6-72.8)
Metropolitan 71.8 (66.2-76.8) 78.5 (73.1-83.0)
Southeast 54.4 (47.9-60.7) 62.4 (55.9-68.6)
Southwest 58.2 (52.1-64.0) 67.9 (61.9-73.4)
Flu Vaccinea Pneumonia Vaccineb
Demographic
Characteristics

30
• There was no measurable difference in the
prevalence of either having a flu vaccine the
past year or ever having the pneumonia vac-
cine by education.
• Adults over 65 years of age who were retired
had a significantly higher prevalence of ever
having the pneumonia vaccine than employed
adults over 65 years of age. There was no
measurable difference in flu vaccination in the
past year by employment status.
• Adults over 65 years of age residing in rural
counties have a much lower prevalence of
both having the flu vaccine in the past year
(48.4%) and ever having the pneumonia vac-
cine (65.0%) compared to adults over 65 years
of age who reside in metropolitan counties
(71.5% and 78.7%, respectively).
0
25
50
75
100
Metro Small/Metro Mixed Urban/Rural Rural
Flu and Pneumococcal Vaccination among NM Adults 65+ by
Urban/Rural Designation, 2019
Flu Pnumococcal
%
0
25
50
75
100
Employed Unemployed/Unableto work
Homemaker/Student Retired
Flu and Pneumococcal Vaccination among NM Adults 65+ by
Employment Status, 2019
Flu Pnumococcal
%
0
25
50
75
100
<High School HSGrad/GED Some College College Grad
Flu and Pneumococcal Vaccination among NM Adults 65+ by
Education, 2019
Flu Pnumococcal
%

31
• In New Mexico, 74.6% of adults reported participating in
any form of leisure-time physical activity. This percent-
age was slightly higher than the U.S. median (73.7%).
• Adults 18-44 were significantly more likely to participate
in any form of leisure-time physical activity (78.3%) than
adults over 65 years of age (70.2%).
• Adults males (76.3%) were more likely to have some
form of leisure-time physical activity than were females
(73.0%). This difference was not statistically significant.
• White adults (78.7%) were more likely to have some
form of leisure time physical activity than Hispanic
adults (70.2%).
Among the health benefits of regular physical activity are
reduced risk of coronary heart disease, lower heart rate and
blood pressure, reduced weight, lower serum triglyceride
levels, increased “good” cholesterol, reduced risk of osteo-
porosis, boosting of immune function, beneficial effect on
clotting mechanisms and improved psychological well-being
and quality of life. 20
aAmong all adults , the proportion reporting they had participated in leisure-time physi-
cal activities or exercises such as running, calisthenics, golf, gardening, or walking for
exercise in the past month. ** Suppressed due to a denominator <50.
Question:
“During the past month, other than your regular job,
did you participate in any physical activities or exer-
cises such as running, calisthenics, golf, gardening, or
walking for exercise?”
%
(95% Confidence
Interval)
Total 74.6 (73.0-76.2)
Age
18-44 78.3 (75.6-80.8)
45-64 72.8 (70.0-75.5)
65+ 70.2 (67.3-72.9)
Gender
Male 76.3 (74.0-78.6)
Female 73.0 (70.7-75.2)
Race/Ethnicity
AIAN 76.7 (70.6-81.8)
Asian or NHOPI ** **
Black/AA 76.8 (59.9-88.0)
Hispanic 70.2 (67.4-72.7)
White 78.7 (76.6-80.6)
Sexual Orientation
Straight 74.2 (72.5-75.9)
LGB/Other 81.7 (73.1-88.0)
Household Income
< $15,000 62.6 (57.3-67.7)
$15,000-$24,999 67.2 (63.1-71.1)
$25,000-$49,999 74.6 (71.0-77.8)
$50,000-$74,999 77.9 (72.7-82.3)
> $75,000 87.5 (84.9-89.7)
Geographic Region
Northwest 73.3 (69.1-77.1)
Northeast 75.4 (71.9-78.6)
Metropolitan 77.1 (74.2-79.8)
Southeast 65.8 (62.2-69.3)
Southwest 74.9 (71.3-78.3)
Leisure-Time Physical
Activitya
Demographic
Characteristics
0
25
50
75
100
2008 2009 2010 2011 2012 2013 2014 2015 2016 2017 2018
Physical Activity, NM vs US, 2008-2019
NM US Median
%

32
• There was not a statistically significant
difference in leisure-time physical activity
between LGB/Other adults (81.4%) and
straight adults (74.9%).
• There was a gradient in leisure-time physi-
cal activity by level of education and by an-
nual household income. 56.8% of adults
with less than a high school education en-
gaged in leisure-time physical activity, com-
pared to 87.2% of those with a college edu-
cation. Similarly, 62.6% of adults living in
households with annual income of less than
$15,000 engaged in leisure-time physical
activity, compared to 87.5% of those living
in households with annual income of
$75,000 or more.
• By employment status, leisure-time physi-
cal activity was lowest among those unem-
ployed/unable to work (64.4%). Employed
adults had the highest rate of leisure-time
physical activity at 73.6%.
• Adults residing in the Southeast region
(65.8%) were less likely to have engaged in
leisure-time physical activity than those
residing in the Metropolitan area (77.1%).
• Adults who engaged in leisure-time physi-
cal activity were less likely to have fair or
poor general health status (16.6% vs.
34.5%), diabetes (10.7% vs. 17.1%), any
cardiovascular disease (6.4% vs. 10.7%), or
to be obese (29.4% vs. 39.0%).
0
25
50
75
100
Metro Small/Metro Mixed Urban/Rural Rural
Physical Acitivity by Urban/Rural Designation, 2098
%
0
25
50
75
100
Employed Unemployed/Unableto work
Homemaker/Student Retired
Physical Activity by Employment Status, 2019
%
0.0
25.0
50.0
75.0
100.0
<High School HSGrad/GED Some College College Grad
Physical Activity by Education, 2019
%

33
• In 2019, 16.0% of New Mexico adults were current
smokers. This was equal to the U.S. median preva-
lence (16.0%).
• The prevalence of current smoking decreases signifi-
cantly with age. Adults 18-44 were the most likely to
be current smokers (18.9%) and adults 65+ were least
likely (9.0%).
• Males (18.3%) reported a significantly higher preva-
lence of current smoking than females (13.8%).
• There were no measurable differences by race/
ethnicity
• LGB/Other adults had significantly higher prevalence
of current smoking (27.4%) than Straight adults
(15.9%).
• The prevalence of tobac-
co use was highest
among New Mexico
adults with the lowest
level of household in-
come (21.9%) and lowest
among adults with the
highest level of house-
hold income (9.8%).
Smoking cigarettes harms nearly every organ of the body.
It causes about 85% of deaths from lung cancer and
chronic obstructive pulmonary disease. Smokers are 2 to 4
times more likely to have coronary heart disease and
stroke.21 An estimated 42,000 New Mexicans suffer from
chronic smoking-related illnesses and about 2,100 die eve-
ry year.22 Exposure to second-hand smoke can cause seri-
ous health effects, including sudden infant death syn-
drome, asthma in children, heart attacks, and lung can-
cer.23
aAmong all adults , the proportion who reported that they had ever smoked at least
100 cigarettes (5 packs) in their life and that they smoke cigarettes now, either every
day or some days.** Suppressed due to a denominator <50.
Question:
“Have you smoked at least 100 cigarettes in your
entire life?”
“Do you now smoke cigarettes every day, some days,
or not at all?”
%
(95% Confidence
Interval)
Total 16.0 (14.7-17.5)
Age
18-44 18.9 (16.5-21.5)
45-64 17.3 (15.2-19.7)
65+ 9.0 (7.4-10.9)
Gender
Male 18.3 (16.3-20.6)
Female 13.8 (12.1-15.7)
Race/Ethnicity
AIAN 12.2 (8.6-17.0)
Asian or NHOPI ** **
Black/AA 25.8 (15.1-40.4)
Hispanic 17.0 (14.8-19.4)
White 15.2 (13.4-17.2)
Sexual Orientation
Straight 15.9 (14.5-17.5)
LGB/Other 27.4 (19.7-36.7)
Household Income
< $15,000 21.9 (17.9-26.6)
$15,000-$24,999 20.4 (17.2-24.2)
$25,000-$49,999 18.6 (15.5-22.1)
$50,000-$74,999 11.3 (8.2-15.4)
> $75,000 9.8 (7.7-12.4)
Geographic Region
Northwest 15.4 (12.5-18.8)
Northeast 15.1 (12.4-18.2)
Metropolitan 15.7 (13.3-18.3)
Southeast 18.6 (15.8-21.9)
Southwest 16.2 (13.4-19.6)
Current Smokinga
Demographic
Characteristics
0
10
20
30
40
50
2011 2012 2013 2014 2015 2016 2017 2018 2019
Current Cigarette Smoking, NM vs US, 2011-2019
NM US Median
%

34
• The HP 2020 target for current smoking among
adults is 12.0%. In order to meet this target
the current smoking prevalence among New
Mexico adults will need to decrease by 4.0
percentage points over the next year.5
• There were no measurable differences by geo-
graphic region or urban/rural designation.
• The prevalence of current cigarette smoking
was highest among adults with less than a high
school education (25.7%) and lowest among
college graduates (6.1%).
• The prevalence of current smoking was higher
among unemployed/unable to work adults
(27.1%) than all other categories of employ-
ment status, most notably retired adults
(8.9%).
• 55.8% of adult current smokers tried to quit at
least once in the past year.
• 24.6% of adults are former smokers, and
59.4% of adults have never smoked cigarettes.
• Current smokers were more likely to have a
disability (42.8% vs 26.5%); to describe their
general health as Fair or Poor (28.0% vs
19.8%); to have been diagnosed with COPD,
emphysema, or chronic bronchitis(9.8% vs
4.8%), or to be unable to work (14.4% vs
6.5%).
0.0
10.0
20.0
30.0
40.0
50.0
Metro Small/Metro Mixed Urban/Rural Rural
Current Smoking by Urban/Rural Designation, 2019
%
0.0
10.0
20.0
30.0
40.0
50.0
Employed Unemployed/Unableto work
Homemaker/Student Retired
Current Smoking by Employment Status, 2019
%
0
10
20
30
40
50
<High School HSGrad/GED Some College College Grad
Current Smoking by Education, 2019
%

35
• In 2019, an estimated 7.0% of New Mexi-
co adults thought about committing sui-
cide in the past year.
• For adults 18-44, the prevalence of sui-
cidal ideation in the past year was 9.3%
and 4.5% among adults aged 65+.
• There was no measurable difference by
gender for suicidal ideation or ever
attempted suicide.
• There was no measurable difference
among racial categories with current sui-
cidal ideation.
Suicidal behaviors are a serious public
health problem and a major cause of mor-
bidity and mortality in New Mexico. Suicide
deaths have been increasing in both New
Mexico and the United States, with suicide
death rates in NM at least 50% higher than
U.S. rates over the past 20 years. Mental
disorders, particularly clinical depression,
increase the risk for both attempted suicide
and suicide.24
aAmong all adults , the proportion who reported having thoughts about suicide in the past year. ** Sup-
pressed due to a denominator <50.
Question:
“In the past year, have you felt so low at
times that you thought about committing
suicide? Have you ever attempted suicide?” %
(95% Confidence
Interval)
Total 7.0 (6.1-8.0)
Age
18-44 9.3 (7.6-11.3)
45-64 5.9 (4.6-7.5)
65+ 4.5 (3.3-6.1)
Gender
Male 6.9 (5.6-8.4)
Female 7.1 (5.8-8.7)
Race/Ethnicity
AIAN 6.4 (3.9-10.2)
Asian or NHOPI ** **
Black/AA 11.4 (4.2-27.5)
Hispanic 6.8 (5.4-8.5)
White 7.5 (6.2-9.1)
Sexual Orientation
Straight 6.4 (5.5-7.4)
LGB/Other 19.1 (12.8-27.6)
Household Income
< $15,000 10.8 (7.8-14.7)
$15,000-$24,999 7.7 (5.8-10.1)
$25,000-$49,999 7.4 (5.4-10.2)
$50,000-$74,999 6.9 (4.5-10.5)
> $75,000 3.2 (2.2-4.6)
Geographic Region
Northwest 8.3 (6.1-11.2)
Northeast 7.7 (5.8-10.2)
Metropolitan 6.0 (4.6-7.9)
Southeast 6.6 (4.9-8.9)
Southwest 8.3 (6.1-11.3)
Current Suicidal Ideationa
Demographic
Characteristics
0.0
5.0
10.0
15.0
20.0
25.0
18-24 25-34 35-44 45-54 55-64 65-74 75+
Current Suicidal Ideation by 10 yr. Age Groups, 2019
%

36
%
%
%
0.0
5.0
10.0
15.0
20.0
25.0
<High School HSGrad/GED Some College College Grad
Current Suicidal Ideation by Education, 2019
0.0
5.0
10.0
15.0
20.0
25.0
Employed Unemployed/Unableto work
Homemaker/Student Retired
Current Suicidial Ideation by Employment Status, 2019
0.0
5.0
10.0
15.0
20.0
25.0
Metro Small/Metro Mixed Urban/Rural Rural
Current Suicidal Ideation by Urban/Rural Designation, 2019
%
%
%
• Nearly one in five (19.1) LGB/other adults said
they thought about committing suicide in the
past year compared to 6.4% of Straight adults.
• There was a gradient in the prevalence of sui-
cidal ideation by income with adults in the
lowest household income category, (less than
$15,000 per year) reporting a prevalence of
10.8% compare to adults in the highest in-
come category (3.2%).
• New Mexico adults who were Unemployed/
Unable to work were more likely to have
thought about suicide in the past year (15.8%)
compared to employed adults (5.8%).
• There was no measurable difference in suicid-
al behaviors by Urban/Rural designation.
• Adults with at least one disability and adults
with fair or poor health were more likely to
have thought about suicide in the past year
(14.4% and 12.4% respectively) compared to
adults with no disabilities and adults with ex-
cellent, very good, or good health (3.9% and
5.6%, respectively).

37
0.0
5.0
10.0
15.0
20.0
25.0
Metro Small/Metro Mixed Urban/Rural Rural NM
Unlocked and Loaded Firearms by Region, 2019
%
Question:
“Are any firearms now kept in or around
your home? Are any of these firearms
now unlocked and loaded?”
In the United States firearm violence is a leading
cause of death and injuries. It is important to im-
prove confounder selection and control in public
health for Identifying characteristics associated
with unintentional firearm violence .24
• In New Mexico, an estimated 39.% of all adults
kept a firearm in or around their home and
7.7% of all adults had an unlocked and loaded
firearm. Among New Mexico adults that have a
loaded gun, 56.5% said the guns are also un-
locked.
• A greater percentage of White adults (52.3%)
said they have firearms kept in or around their
homes compared to AIAN (28.5%). Among all
White adults 12.2% had an unlocked and load-
ed firearm around the house.
• LGB/Other adults had a significantly lower prev-
alence of unlocked and loaded firearms in or
around their home.
• There was a gradient in firearms kept in the
home and unlocked and loaded firearms in the
home by household income level. 3.6% of
adults living in households with annual income
less than $15,000 had an unlocked and loaded
firearm in or around their home, compared to
14.4% of adults with annual income of $75,000
or more.
aAmong all adults, the proportion who say they have any firearms kept in or around their home. bAmong all adults, the proportion who say have a loaded and unlocked firearm in or around their
home. ** Suppressed due to a denominator <50.
%
(95% Confidence
Interval) %
(95% Confidence
Interval)
Total 39.1 (37.2-41.0) 7.7 (6.8-8.8)
Age
18-44 37.7 (34.3-41.1) 6.4 (4.8-8.3
45-64 38.3 (35.2-41.4) 7.8 (6.4-9.5)
65+ 42.6 (39.4-45.8) 10.2 (8.5-12.2)
Gender
Male 46.8 (43.9-49.7) 10.4 (8.8-12.2)
Female 31.6 (29.2-34.2) 5.1 (4.1-6.3)
Race/Ethnicity
AIAN 28.5 (22.8-35.1) 1.7 (0.9-3.3)
Asian or NHOPI ** ** * **
Black/AA 33.6 (20.0-50.5) 5.2 (1.2-20.1)
Hispanic 30.2 (27.3-33.3) 5.3 (4.0-7.1)
White 52.3 (49.6-55.1) 12.2 (10.7-14.0)
Sexual Orientation
Straight 40.2 (38.2-42.2) 8.2 (7.2-9.4)
LGB/Other 24.7 (17.4-33.7) 1.1 (0.4-3.0)
Household Income
< $15,000 16.2 (12.7-20.6) 3.6 (2.3-5.6)
$15,000-$24,999 26.9 (23.1-31.2) 3.4 (2.4-4.8)
$25,000-$49,999 38.9 (34.7-43.3) 6.7 (5.1-8.8)
$50,000-$74,999 51.1 (45.2-57.0) 11.3 (7.8-16.2)
> $75,000 60.5 (56.7-64.2) 14.4 (11.8-17.4)
Geographic Region
Northwest 37.1 (32.8-41.7) 6.7 (4.9-9.1)
Northeast 39.8 (35.8-43.8) 6.2 (4.7-8.1)
Metropolitan 37.1 (33.8-40.6) 7.5 (5.8-9.5)
Southeast 46.2 (42.1-50.4) 11.7 (9.5-14.4)
Southwest 39.3 (34.9-43.8) 7.3 (5.6-9.5)
Firearms in Homea
Demographic
Characteristics
Unlocked and Loaded
Firearmsb

38
0
25
50
75
100
Metro Small/Metro Mixed Urban/Rural Rural
Firearms in Home by Urban/Rural Designation, 2019
%
0
25
50
75
100
Employed Unemployed/Unableto work
Homemaker/Student Retired
Fiearms in Homee by Employment Status, 2019
%
0
25
50
75
100
<High School HSGrad/GED Some College College Grad
Firearms in Home by Education, 2019
%
• Adults residing in the Northwest region were
least likely to have a firearm in the home
(37.1%) while adults in the Northeast were
least likely to have an unlocked and loaded
firearm (6.2%). Adults residing in the South-
east region had the highest prevalence of un-
locked and load firearms in the home (11.7%).
• Adults with some college or a college degree
had the highest prevalence of firearms in or
around the home (46.4% and 46.2%, respec-
tively) compared to adults with less than a
high school diploma (17.8%).
• Retired and employed adults had the highest
prevalence of firearms in or around the home
and the highest prevalence of unlocked and
loaded firearms in or around the home, com-
pared to adults who were unemployed/unable
to work and students.
• In New Mexico, adults living in counties desig-
nated as rural had a higher prevalence of hav-
ing a firearm in or around the home and hav-
ing an unlocked and loaded firearm in the
home.

I
The New Mexico Behavioral Risk Factor Survey (BRFSS) is an annual, statewide telephone survey of New Mexico adults aged 18 years and older that is conducted through a collaborative effort between the Population Health Surveillance Branch (PHSB) of the Centers for Disease Control and Prevention (CDC) and the New Mexico Department of Health (NMDOH). New Mexico’s Behavioral Risk Factor Surveillance System (BRFSS) data contribute to the CDC Behavioral Risk Factor Surveillance System (BRFSS) that is conducted within every state, the District of Columbia, and several U.S. territories. In 2019, the New Mexico BRFSS col-lected data from both landline and cell phone respondents. The sample of landline telephone numbers was se-lected using a list-assisted, random-digit-dialed methodology with a disproportionate stratification based on phone bank density, and whether or not the phone numbers were directory listed. The sample of cell phone numbers was randomly selected from dedicated cellular telephone banks sorted on the basis of area code and exchange.

II
Implications of Sampling Design for Estimates Presented in this Report
The estimates presented in this report are weighted percentages. Records of the sample were adjusted by a weighting factor to produce the prevalence estimates representative of the adult population as a whole. There are several
components to the weight used to adjust the sample percentage.
➢ The Sampling Weight adjusts for the fact that adults within the population had different probabilities of being included in the sample, because:
• Households with landline telephone numbers in the low-density stratum had a lower probability of being
selected than households with phone numbers in the high-density stratum.
• Households with more than one landline telephone line had a greater chance of being selected.
• In landline households housing many adults, each adult had a proportionally smaller chance of being
randomly selected than an adult who was the sole adult of the selected household.
• Each cellular telephone number had a probability of selection based on the total number of cell phone
numbers in the cell phone sample.
➢ A weighting procedure known as iterative proportional fitting (known commonly as “raking”) was used to
adjust for differences between the distribution of the sample and that of the adult population, by gender, age,
Region of residence, Race/Ethnicity, Phone Type (Cell or Landline), Home Ownership (Rent or Own),
Education, Marital Status, Gender by Race/Ethnicity, Age by Gender, and Age by Race/Ethnicity, as determined by the Bureau of the Census. This component of the weighting process attempts to adjust the estimates so that
they better reflect the adult population of the state. This weighting system, new in 2011, along with inclusion of
cell phone interviews, results in some important changes in estimates over those of previous years. Studies have demonstrated that there is every reason to believe these improvements to the BRFSS, inclusion of cellular
telephones and weighting by iterative proportional fitting result in improved, more representative, estimates over
those of previous years.
Stata 16.1 MP software was used for all analyses in this report. Stata 16.1 MP includes a suite of data analysis
commands which are specifically designed for the analysis of complex sample survey data, such as that of the BRFSS.
Quality assurance
While error in survey estimates cannot be avoided entirely, the Survey Section goes to great lengths to reduce non-sampling error. Some examples of measures taken to reduce error include:
➢ Training the interviewers at hire, at the beginning of each new survey year, and at the beginning of each new month of the survey.
➢ Prompt and frequent feedback to interviewers
➢ Review of keyed data for extreme or invalid values by a software program at the end of the each month, prior to
submission of the data to the CDC.
➢ Monitoring interviewers at least once a month, new interviewers are monitored closely until the CDC BRFSS
protocol is followed consistently.

III

IV
Source: https://ibis.health.state.nm.us/view/docs/CHA/UrbanRuralCounties.pdf

V
1. Centers for Disease Control and Prevention. 2018. 2018 Summary Data Quality Report.
https://www.cdc.gov/brfss/annual_data/2018/pdf/2018-sdqr-508.pdf.
2. CDC. Measuring Healthy Days. Atlanta, Georgia: CDC, November 2000. https://www.cdc.gov/hrqol/pdfs/mhd.pdf
3. U.S. Department of Justice, Civil Rights Division. 2015. A Guide to Disability Rights Laws.
https://www.ada.gov/regs2010/titleII_2010/title_ii_primer.html
4. National Institutes of Health, NHLBI Obesity Education Initiative. 1998. Clinical Guidelines on the Identification,
Evaluation, and Treatment of Overweight and Obesity in Adults.
https://www.nhlbi.nih.gov/files/docs/guidelines/ob_gdlns.pdf.
5. U.S. Department of Health and Human Services. 2015. Healthy People 2020 Topics and Objectives.
https://www.healthypeople.gov/2020/topics-objectives.
6. Ayanian JZ, Weissman JS, Schneider EC, Ginsburg JA, Zaslavsky AM. Unmet health needs of uninsured adults in the
Unit-ed States. JAMA. 2000;284:2061-9. [PMID: 11042754
7. McWilliams JM, Meara E, Zaslavsky AM, Ayanian JZ. Use of health services by previously uninsured Medicare
beneficiaries. N Engl J Med. 2007;357:143-53.
8. Centers for Disease Control & Prevention, Arthritis Program (http://www.cdc.gov/arthritis/#spotlight).
9. CDC National Asthma Control Program, http://www.cdc.gov/asthma/impacts_nation/AsthmaFactSheet.pdf.
10. National Institutes of Health, National Cancer Institute, http://www.cancer.gov/cancertopics/cancerlibrary/what-is-
cancer.
11. CDC. Heart Disease Risk Factors (http://www.cdc.gov/heartdisease/risk_factors.htm).
12. Centers for Disease Control and Prevention, NCCDPHP, http://www.cdc.gov/copd/index.htm.
13. Boschetto P, Quintavalle S, Miotto D, Lo Cascio N, Zeni E, Mapp C. COPD and occupational exposures. JOMT, 2006,
1:11. http://www.ncbi.nlm.nih.gov/pmc/articles/PMC1513231/pdf/1745-6673-1-11.pdf.
14. Department of Health & Human Services, Centers for Disease Control & Prevention, Stroke, June 21, 2007,
http://www.cdc.gov/stroke/.
15. Depression, Centers for Disease Control and Prevention, http://www.cdc.gov/mentalhealth/basics/mental-
illness/depression.htm
16. CDC/NCCDPHP. National Diabetes Fact Sheet (www.cdc.gov/diabetes/pubs/general.htm)
17. Metzler M, Merrick MT, Klevens J, Ports KA, Ford DC. Adverse childhood experiences and life opportunities: shifting
the narrative. Child Youth Serv Rev. 2017;72:141-149. doi:10.1016/j.childyouth.2016.10.021.
18. What’s to know about alcoholic liver disease?, Medical News Today. 2018,
https://www.medicalnewstoday.com/articles/215638.php
19. Centers for Disease Control and Prevention. 2017. Recommended Adult Immunization Schedule, by Vaccine and Age
Group - United States, 2017. https://www.cdc.gov/vaccines/schedules/hcp/imz/adult.html. (May 2017).
20. Francis K. The burden of physical inactivity & cardiovascular heart disease. Comprehensive Therapy 24:87-92 (1998).
21. The Health Consequences of Smoking: A Report of the Surgeon General. Atlanta: U.S. DHHS/CDC/NCCDPHP/Office of
Smoking and Health, 2004.
22. State-Specific Smoking-Attributable Mortality and Years of Potential Life Lost—U.S., 2000-2004. MMWR, Vol. 58/No2.
23. Cigarette Smoking-Attributable Morbidity. United State, 2000, MMWR, 2003/52(35); 842-844.
24. Suicide Deaths, 2016 New Mexico Department of Health, Indicator-Based Information System for Public Health
website: https://ibis.health.state.nm.us/indicator/view/SuicDeath.Year.NM_US.html
25. Predictors of firearm violence in urban communities: A machine-learning approach Dana E. Goin a, Kara E. Rudolph a,
b, Jennifer Ahern Division of Epidemiology, School of Public Health, University of California, Berkeley, CA, USA
Department of Emergency Medicine, School of Medicine, University of California, Davis, Sacramento, CA, USA
Received 18 August 2017, Revised 25 February 2018, Accepted 28 February 2018

VI

VII
New Mexico Department of Health
1190 S. Saint Francis Drive
P.O. Box 26110
Santa Fe, NM 87502
Telephone: (505) 476-3595