
Health and wellness in the present day day GP practice · Health and wellness in the present day...
37
Health and wellness in the present day day GP practice SAMA Conference: September 2015 Sandton Convention Centre © 2015 Towers Watson. All rights reserved.
Transcript of Health and wellness in the present day day GP practice · Health and wellness in the present day...

Health and wellness in the present
day day GP practice
SAMA Conference: September 2015
Sandton Convention Centre
© 2015 Towers Watson. All rights reserved.

Health and Wellness are generic terms
Health is defined as the overall mental and physical state of a person;
the absence of disease
Wellness refers to the state of being in optimal mental and physical
health:
About living a life full of personal responsibility and therefore taking
proactive steps for one's entire well-being
A person living life very well controls risk factors that can harm them
© 2015 Towers Watson. All rights reserved. Proprietary and Confidential. For Towers Watson and Towers Watson client use only.
2
towerswatson.com

Types of wellness
Physical wellness The physically well person gets an adequate amount of sleep, eats a balanced
and nutritious diet, engages in exercise for 150 minutes per week, attends regular medical check-ups, and practices safe and healthy sexual relations
Emotional wellness The emotionally well person can identify, express, and manage the entire range
of feelings and would consider seeking assistance to address areas of concern
Career wellness The professionally well person engages in work to gain personal satisfaction and
enrichment, consistent with values, goals, and lifestyle
Social wellness The socially well person has a network of support based on interdependence,
mutual trust, respect and has developed a sensitivity and awareness towards the feelings of others
Spiritual wellness The spiritually well person seeks harmony and balance by openly exploring the
depth of human purpose, meaning, and connection through dialogue and self-reflection
towerswatson.com © 2015 Towers Watson. All rights reserved. Proprietary and Confidential. For Towers Watson and Towers Watson client use only.
3

Types of wellness
Financial wellness
The financially well person is fully aware of financial state and budgets, saves,
and manages finances in order to achieve realistic goals
Intellectual wellness
The intellectually well person values lifelong learning and seeks to foster critical
thinking, develop moral reasoning, expand worldviews, and engage in education
for the pursuit of knowledge
Creative wellness
The creatively well person values and actively participates in a diverse range of
arts and cultural experiences as a means to understand and appreciate the
surrounding world
Environmental wellness
The environmentally well person recognizes the responsibility to preserve,
protect, and improve the environment and appreciates the interconnectedness
of nature and the individual
towerswatson.com © 2015 Towers Watson. All rights reserved. Proprietary and Confidential. For Towers Watson and Towers Watson client use only.
4

Why is health and wellness important?
Personal perspective
Healthy and well people are happier
Society is increasingly becoming health conscious
Employer perspective
Unlocking of full potential
Productivity
Absenteeism
Healthcare financing perspective
Overall sense of wellness prevents illness
Chronic diseases account for ± 75% of healthcare costs
Healthcare inflation is consistently outstripping consumer price inflation and
salaries
Many chronic diseases are preventable
towerswatson.com © 2015 Towers Watson. All rights reserved. Proprietary and Confidential. For Towers Watson and Towers Watson client use only.
5

Employer perspective2015/2016 Staying@Work
© 2015 Towers Watson. All rights reserved. Proprietary and Confidential. For Towers Watson and Towers Watson client use only.
6
towerswatson.com
Global Survey
Employers completed the survey between May and July 2015
in North America, Latin America,
Europe and Asia
Countries/
markets
surveyed
34Employer respondents have
more than >10,000 full-time
workers
34%
APAC Participants
582
of the respondents have
their workforces located in
multiple countries and
respondents operate in all
major industry sectors73%
North AmericaParticipants598
1,669
Including
• China
• India
• Philippines
• Singapore
• And 9 others
• Canada • U.S.
242• Argentina
• Brazil
• Chile
• Colombia
• Mexico EMEAParticipants
247
• Germany
• Italy
• Netherlands
• Spain
• U.K.
• And 9 others
LATAM
Participants

51%
70%
40%34%
10%
50% 47%42%
64%
3%
Focus primarily on plandesign
Focus primarily ondirect financial
incentives
Rely primarily onproviders, medicalprofessionals andemerging delivery
system models
Focus primarily onstrategies to build the
health and well-being ofthe workplace and
culture
No strategy toencourage healthy
behaviors
Today
In 2018
Majority of organisations will increase their focus on building
the health and well-being of the workplace
© 2015 Towers Watson. All rights reserved. Proprietary and Confidential. For Towers Watson and Towers Watson client use only.
7
towerswatson.com
Source: 2015/2016 Global Staying@Work Survey
How would you characterize your organization’s primary strategy to encourage healthy behaviors, and what do you expect it will be in 2018?
Almost 2/3 of employers expect that building a culture of health will be the primary
strategy to promote healthy behaviour by 2018
Almost 1/2 of employers will be relying on providers and medical professionals

© 2015 Towers Watson. All rights reserved. Proprietary and Confidential. For Towers Watson and Towers Watson client use only.
Growth in gross contributions pabpa since 2000
Growth in gross claims pabpa since 2000
Of GDP spent on health
Of health expenditure is in the private sector
55.6%
51.8%
8.9%
55.9%
8
towerswatson.com
Cost and affordability of healthcare is an issue

towerswatson.com
9
© 2015 Towers Watson. All rights reserved. Proprietary and Confidential. For Towers Watson and Towers Watson client use only.
0
5
10
15
20
Health spending, % of GDP
Our healthcare expenditure compares to peers

Global Medical Trend 2012 – 2014
© 2014 Towers Watson. All rights reserved. Proprietary and Confidential. For Towers Watson and Towers Watson client use only.
10
towerswatson.com
GROSS 2012 medical trend 2013 medical trend 2014* medical trend
All Firms 7.7 7.9 8.3
Americas (ex US) 9.1 9.1 9.7
Asia-Pacific 8.4 8.8 9.3
Europe 5.3 5.2 5.4
Middle East/Africa 8.8 9.8 10.0
7.7%
9.1%8.4%
5.3%
8.8%
7.9%
9.1%8.8%
5.2%
9.8%
8.3%
9.7%9.3%
5.4%
10.0%
0.0%
2.0%
4.0%
6.0%
8.0%
10.0%
All Participants Americas Asia-Pacific Europe Middle East /Africa
2012
2013
2014*
*projected
Source: 2013 /2014 Global Health Trends Survey

A substantial proportion of the expected inflationary trends
can be ascribed to chronic conditions
What are the top three conditions that cause the highest prevalence of claims?
33%
24%
5%
14%
19%
76%
29%
90%
4%
11%
20%
62%
29%
36%
60%
69%
21%
24%
9%
53%
41%
29%
35%
76%
4%
7%
2%
24%
15%
65%
51%
62%
69%
0% 10% 20% 30% 40% 50% 60% 70% 80% 90% 100%
Substance abuse
Other
Mental health
Accident
Musculoskeletal/Back
Gastrointestinal
Respiratory
Cancer
Cardiovascular
Asia-Pacific
Americas
Europe
Middle East/Africa
Source: 2015/2016 Global Staying@Work Survey

South Africa is no exception
towerswatson.com
12
© 2015 Towers Watson. All rights reserved. Proprietary and Confidential. For Towers Watson and Towers Watson client use only.
0%
5%
10%
15%
20%
25%
30%
35%
31.4
31.6
31.8
32.0
32.2
32.4
32.6
2010 2011 2012 2013 2014
YE
AR
SChronic Disease Prevalence 2010 - 14
Average Age % ChronicSource: 2015 HQA Annual Report
Almost 1/3 of the population are registered for one or more chronic diseases
The population has aged by 1/3 of a year over a five year period
Chronic disease prevalence has increased by 6.82%

We are also experiencing increasing complexities
towerswatson.com
13
© 2015 Towers Watson. All rights reserved. Proprietary and Confidential. For Towers Watson and Towers Watson client use only.
0.0% 0.5% 1.0% 1.5% 2.0% 2.5% 3.0% 3.5% 4.0% 4.5% 5.0%
Schizophrenia
COPD
Rheumatoid Arthritis
Bipolar
Cardiac Failure
Hypothyroidism
Ischaemic Heart Disease
HIV
Depression
Asthma
Diabetes
Hypertension
Chronic Disease Trends 2012-14
Additional Chronic Disease Prevalence
Source: 2015 HQA Annual Report

15%11% 10% 9%
19% 17%12%
22%
12%
20%
7%
25%
15%9% 7%
17%
49%
46%
30% 30%
63%
42%
38%
26% 46%
40%
33%
25% 47%
34%
31%
17%
0%
10%
20%
30%
40%
50%
60%
70%
80%
90%
Basic medical/Outpatient Hospital/Inpatient Pharmacy Maternity
The bulk of medical expense increase is expected to come
from hospital/inpatient services
How do you expect the expenses related to the following service categories to change over the next five years?
Asia Pacific Americas Europe Middle East and Africa
Significant Increase Significant Increase Significant Increase Significant Increase
Moderate Increase Moderate Increase Moderate Increase Moderate Increase
Source: 2013 /2014 Global Health Trends Survey

South Africa is no exception
towerswatson.com
15
© 2015 Towers Watson. All rights reserved. Proprietary and Confidential. For Towers Watson and Towers Watson client use only.
29
30
31
32
33
34
35
36
37
132
134
136
138
140
142
144
146
148
2010 2011 2012 2013 2014
LIV
ES
PE
R 1
000C
OV
ER
ED
LIV
ES
LIV
ES
PE
R 1
000 C
OV
ER
ED
LIV
ES
Admission Trends 2010-14
# Lives Hospitalised # Hospitalised more than once
Source: 2015 HQA Annual Report

The response…
towerswatson.com
16
© 2015 Towers Watson. All rights reserved. Proprietary and Confidential. For Towers Watson and Towers Watson client use only.
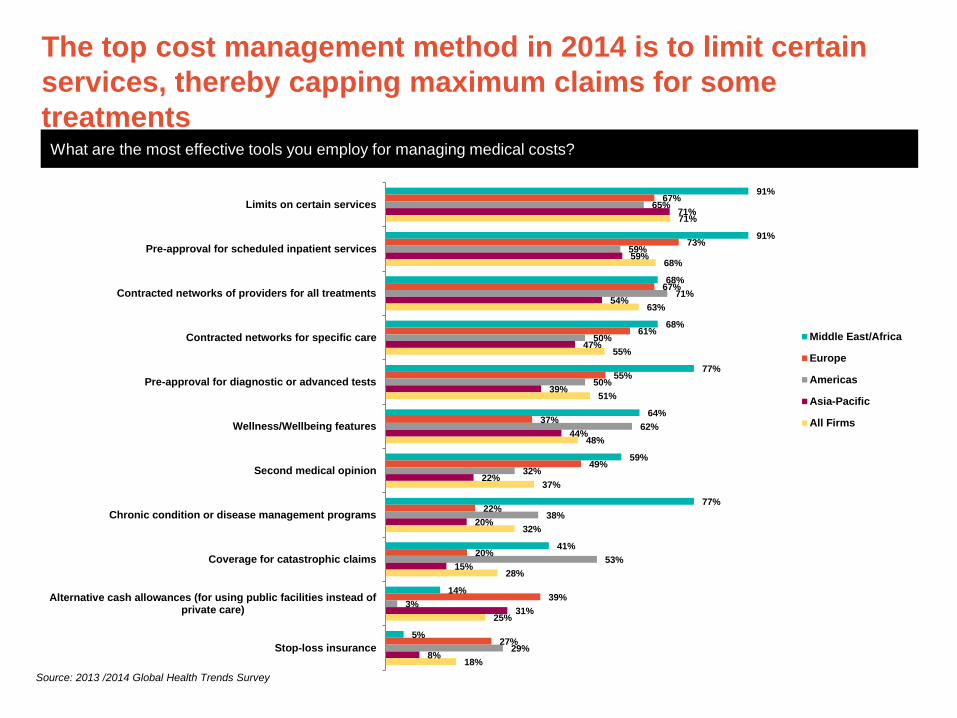
The top cost management method in 2014 is to limit certain
services, thereby capping maximum claims for some
treatmentsWhat are the most effective tools you employ for managing medical costs?
91%
91%
68%
68%
77%
64%
59%
77%
41%
14%
5%
67%
73%
67%
61%
55%
37%
49%
22%
20%
39%
27%
65%
59%
71%
50%
50%
62%
32%
38%
53%
3%
29%
71%
59%
54%
47%
39%
44%
22%
20%
15%
31%
8%
71%
68%
63%
55%
51%
48%
37%
32%
28%
25%
18%
Limits on certain services
Pre-approval for scheduled inpatient services
Contracted networks of providers for all treatments
Contracted networks for specific care
Pre-approval for diagnostic or advanced tests
Wellness/Wellbeing features
Second medical opinion
Chronic condition or disease management programs
Coverage for catastrophic claims
Alternative cash allowances (for using public facilities instead ofprivate care)
Stop-loss insurance
Middle East/Africa
Europe
Americas
Asia-Pacific
All Firms
Source: 2013 /2014 Global Health Trends Survey

As in prior surveys, respondents identified member
coinsurance as the most typical cost-sharing approach in all
regions but EuropeHow typical are the following cost-sharing approaches for the medical products you offer?
16%
54%
13%
27%
5%
47%
17%
7%
35%
21%
9%
5%
9%
4%
14%
22%
26%
17%
27%
16%
26%
35%
48%
8%
26%
21%
36%
14%
60%
21%
23%
52%
14%
42%
14%
43%
15%
33%
14%
44%
15%
19%
36%
70%
31%
42%
41%
10%
6%
29%
32%
36%
12%
15%
38%
41%
24%
38%
18%
11%
33%
23%
0% 10% 20% 30% 40% 50% 60% 70% 80% 90% 100%
Member coinsurance
Annual deductible
Annual limit on out-of-pocket expense
Premium cost sharing with employees
Asia Pacific Americas Europe Middle East and Africa
Very Typical Very Typical Very Typical Very Typical
Typical Typical Typical Typical
Occasionally Occasionally Occasionally Occasionally
Never Never Never Never
Source: 2013 /2014 Global Health Trends Survey

30%
18%
39%
36%
15%
34%
41%
18%
18%
22%
27%
31%
12%
18%
21%
20%
19%
12%
9%
11%
14%
15%
23%
19%
34%
48%
25%
21%
59%
33%
14%
43%
0% 10% 20% 30% 40% 50% 60% 70% 80% 90% 100%
Personal Health Risk Assessment/Appraisal (HRAQuestionnaire)
Employee Assistance Plan (EAP)
Biometric Screenings (and/or Annual Physical/Check-up)
Second medical opinion
Tobacco Cessation Assistance
Chronic condition or disease management program
Lifestyle and Health Education
Fitness programs/challenges (including pedometer)
Offered through our insurance services
Offered by a partner
Not offered, but plan to offer in next 12 months
Not offered, and no plans to offer in next 12 months
The percentage of respondents that say they offer health
promotion features (either directly or through a partner)
continues to growDo you currently offer any of the following wellness features?
Source: 2013 /2014 Global Health Trends Survey

A look at some South African experience
towerswatson.com
20
© 2015 Towers Watson. All rights reserved. Proprietary and Confidential. For Towers Watson and Towers Watson client use only.

Approaches to Heath Promotion
Primary prevention
Risk reduction by altering behaviours
Vaccination
Secondary prevention
Screening
Tertiary prevention
Modification of risk factors that are already in existence
towerswatson.com © 2015 Towers Watson. All rights reserved. Proprietary and Confidential. For Towers Watson and Towers Watson client use only.
21

© 2015 Towers Watson. All rights reserved. Proprietary and Confidential. For Towers Watson and Towers Watson client use only.
-2.00
-1.50
-1.00
-0.50
0.00
0.50
1.00
2010 2011 2012 2013 2014
Primary Care Maternity HIV Chronic Diseases
The trends pertaining to health promotion are encouraging
Source: 2015 HQA Annual Report

In elderly people influenza is a major cause of hospitalisation and
mortality during winter months
Vaccination is highly effective at reducing mortality and morbidity from
influenza
Vaccination can produce a 50% reduction in cases of respiratory
illness, pneumonia, hospitalization and mortality
Immunisation of older people against influenza is likely to be one of the
most cost-effective primary healthcare interventions available
British Journal of General Practice
towerswatson.com © 2015 Towers Watson. All rights reserved. Proprietary and Confidential. For Towers Watson and Towers Watson client use only.
23
Primary Prevention: Flu Vaccinations

towerswatson.com
24
© 2015 Towers Watson. All rights reserved. Proprietary and Confidential. For Towers Watson and Towers Watson client use only.
0.0%
2.0%
4.0%
6.0%
8.0%
10.0%
12.0%
14.0%
16.0%
18.0%
2010 2011 2012 2013 2014
Flu vaccine coverage >= 65years(%)
Primary Prevention: Flu Vaccinations
Source: 2015 HQA Annual Report

The USPSTF recommends screening for colorectal cancer using fecal
occult blood testing, sigmoidoscopy, or colonoscopy in adults, beginning
at age 50 years and continuing until age 75 years.
towerswatson.com © 2015 Towers Watson. All rights reserved. Proprietary and Confidential. For Towers Watson and Towers Watson client use only.
25
Secondary Prevention: Colorectal cancer screening

towerswatson.com © 2015 Towers Watson. All rights reserved. Proprietary and Confidential. For Towers Watson and Towers Watson client use only.
26
0.0%
0.5%
1.0%
1.5%
2.0%
2.5%
3.0%
3.5%
4.0%
4.5%
2010 2011 2012 2013 2014
Colorectal cancer screening ≥ 50 yrs in previous year (%)
Secondary Prevention: Colorectal cancer screening
Source: 2015 HQA Annual Report

towerswatson.com © 2015 Towers Watson. All rights reserved. Proprietary and Confidential. For Towers Watson and Towers Watson client use only.
27
Source: Screening for Cervical cancer: Clinical Summary of USPSTF recommendation. AHRQ Publication No. 11-05156-EF-3, March 2012
Secondary Prevention: Cervical Cytology

towerswatson.com
28
© 2015 Towers Watson. All rights reserved. Proprietary and Confidential. For Towers Watson and Towers Watson client use only.
0.0%
5.0%
10.0%
15.0%
20.0%
25.0%
30.0%
35.0%
40.0%
2010 2011 2012 2013 2014
Cervical Cytology coverage (previous 3 years)(%)
Secondary Prevention: Cervical Cytology
Source: 2015 HQA Annual Report
towerswatson.com
29
© 2015 Towers Watson. All rights reserved. Proprietary and Confidential. For Towers Watson and Towers Watson client use only.
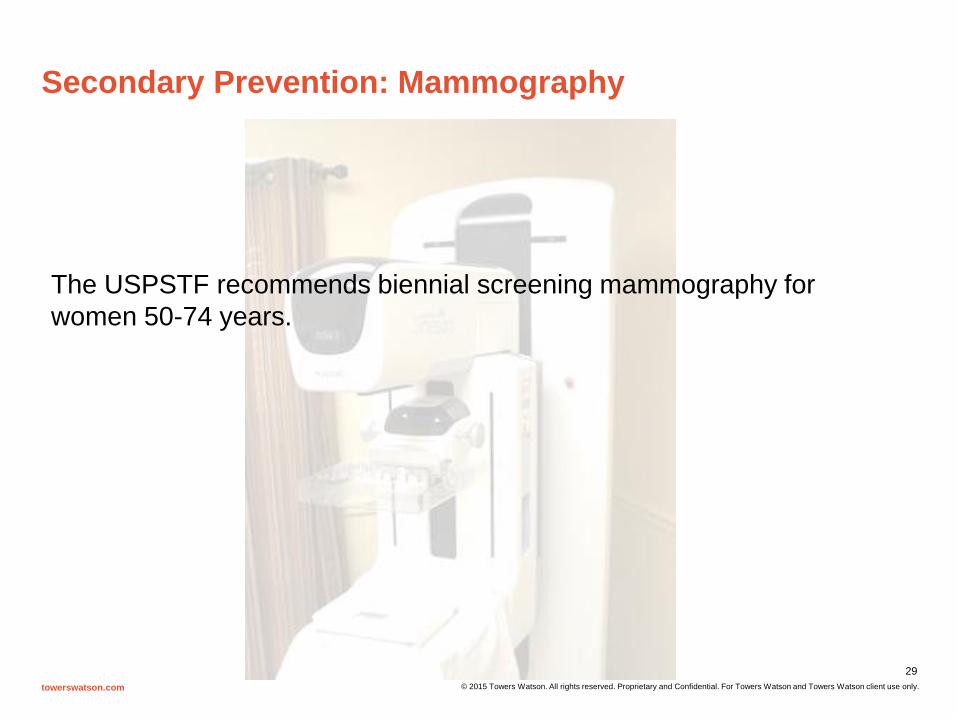
The USPSTF recommends biennial screening mammography for
women 50-74 years.
Secondary Prevention: Mammography

towerswatson.com
30
© 2015 Towers Watson. All rights reserved. Proprietary and Confidential. For Towers Watson and Towers Watson client use only.
0.0%
10.0%
20.0%
30.0%
40.0%
50.0%
2010 2011 2012 2013 2014
Mammogram coverage ( ages 50-74 years in previous 2 years)(%)
Secondary Prevention: Mammography
Source: 2015 HQA Annual Report

towerswatson.com
31
© 2015 Towers Watson. All rights reserved. Proprietary and Confidential. For Towers Watson and Towers Watson client use only.
0.0%
2.0%
4.0%
6.0%
8.0%
10.0%
12.0%
14.0%
16.0%
18.0%
2010 2011 2012 2013 2014
COPD IHD Asthma HIV Cardiac failure
Chronic Disease Management: Flu Vaccinations
Source: 2015 HQA Annual Report

towerswatson.com
32
© 2015 Towers Watson. All rights reserved. Proprietary and Confidential. For Towers Watson and Towers Watson client use only.
0.0%
5.0%
10.0%
15.0%
20.0%
25.0%
30.0%
35.0%
2010 2011 2012 2013 2014
COPD IHD Asthma HIV Cardiac Failure
Chronic Conditions: Condition-specific Admissions
Source: 2015 HQA Annual Report

towerswatson.com
33
© 2015 Towers Watson. All rights reserved. Proprietary and Confidential. For Towers Watson and Towers Watson client use only.
40.0%
42.0%
44.0%
46.0%
48.0%
50.0%
52.0%
54.0%
2010 2011 2012 2013 2014
HbA1c coverage for Diabetic patients (%)
Chronic Disease Management: Diabetes
Source: 2015 HQA Annual Report

towerswatson.com
34
© 2015 Towers Watson. All rights reserved. Proprietary and Confidential. For Towers Watson and Towers Watson client use only.
0.00%
2.00%
4.00%
6.00%
8.00%
10.00%
12.00%
2010 2011 2012 2013 2014
Diabetes - Once Diabetes - More than once
Diabetes: Condition-specific Admissions
Source: 2015 HQA Annual Report
towerswatson.com
35
© 2015 Towers Watson. All rights reserved. Proprietary and Confidential. For Towers Watson and Towers Watson client use only.
0.00%
5.00%
10.00%
15.00%
20.00%
25.00%
30.00%
2010 2011 2012 2013 2014
Diabetes - Once Diabetes - More than once
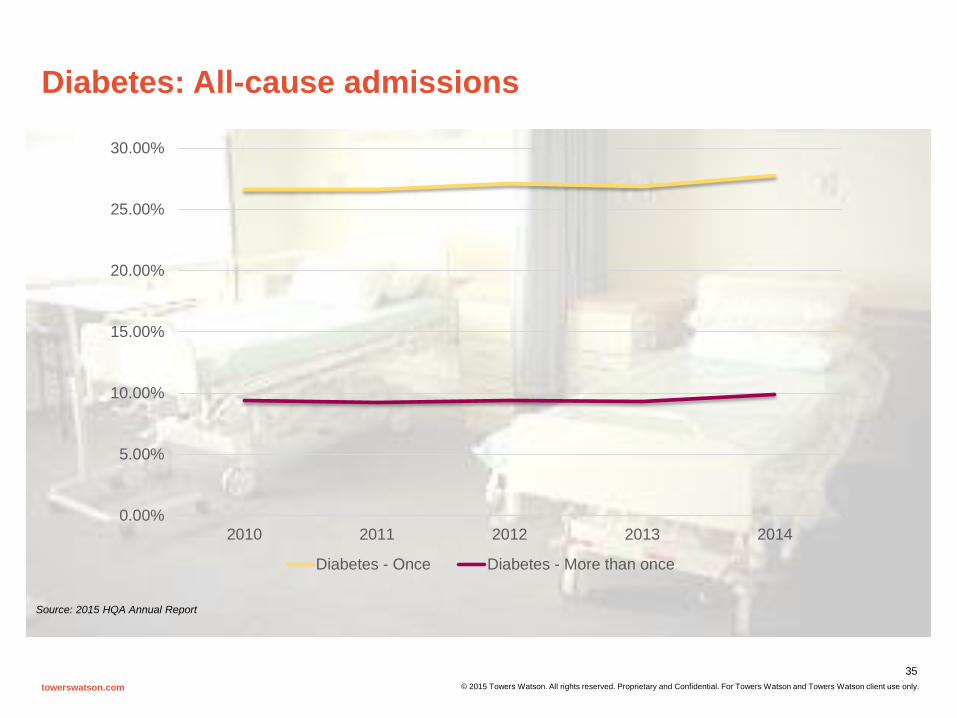
Diabetes: All-cause admissions
Source: 2015 HQA Annual Report

towerswatson.com
36
© 2015 Towers Watson. All rights reserved. Proprietary and Confidential. For Towers Watson and Towers Watson client use only.
Delivery mechanisms and systems
Patient related issues
Funding and reimbursement
models
Some food for thought…

towerswatson.com © 2015 Towers Watson. All rights reserved. Proprietary and Confidential. For Towers Watson and Towers Watson client use only.
37