Health Aid and Infant Mortality - imf.org · This paper examines the relationship between health...
42
WP/07/100 Health Aid and Infant Mortality Prachi Mishra and David Newhouse
Transcript of Health Aid and Infant Mortality - imf.org · This paper examines the relationship between health...

WP/07/100
Health Aid and Infant Mortality
Prachi Mishra and David Newhouse


© 2007 International Monetary Fund WP/07/100 IMF Working Paper Fiscal Affairs and Research Departments
Health Aid and Infant Mortality
Prepared by Prachi Mishra and David Newhouse
Authorized for distribution by Gerd Schwartz and Arvind Subramanian
April 2007
This Working Paper should not be reported as representing the views of the IMF. The views expressed in this Working Paper are those of the author(s) and do not necessarily represent those of the IMF or IMF policy. Working Papers describe research in progress by the author(s) and are published to elicit comments and to further debate.
Abstract
This paper examines the relationship between health aid and infant mortality, using data from 118 countries between 1973 and 2004. Health aid has a statistically significant effect on infant mortality: doubling per capita health aid is associated with a 2 percent reduction in the infant mortality rate. For the average country, this implies that increasing per capita health aid by US$1.60 per year is associated with 1.5 fewer infant deaths per thousand births. The estimated effect is small, relative to the targets envisioned by the Millennium Development Goals. JEL Classification Numbers: JEL F35, 110, 118 Keywords: Foreign aid, health, infant mortality Authors’ E-Mail Addresses: [email protected] and [email protected] We thank Chris Papageorgio, Antonio Spilimbergo, and Arvind Subramanian for many helpful discussions. We also thank Richard Blundell, Steve Bond, David Coady, Robert Gillingham, Joe Newhouse, Rodney Ramcharan, Gerd Schwartz and colleagues at the Fund for comments and suggestions. The views expressed here are personal and do not implicate the International Monetary Fund, its management, or Executive Board.
2
Contents Page
I. Introduction ............................................................................................................................4
II. Empirical Framework............................................................................................................7 A. Ordinary Least Squares.........................................................................................................7 B. Dynamic Panel Data Models with Fixed Effects ..................................................................7
III. Data ......................................................................................................................................8
IV. Health Aid and Health Outcomes ......................................................................................13
V. Health Aid and Health—Regions, Institutions, Periods, Types of Aid ..............................22
VI. Overall Aid and Health Outcomes.....................................................................................25
VII. Aid and Government Spending ........................................................................................27
VIII. Caveats and Conclusions ................................................................................................29 References................................................................................................................................38 Tables 1. Estimated Effect of Health Aid on Infant Mortality, 1975–2004 ........................................14 2. Estimated Effect of Health Aid on Infant Mortality, GMM, Robustness Checks ...............16 3. Estimated Effect of Health Aid on Infant Mortality, Levels, 1975–2004 ...........................16 4. Estimated Effect of Health Aid on Infant Mortality, Health aid to GDP, 1975–2004 ........17 5. Estimated Effect of Health Aid on Infant Mortality: OLS with Additional Controls .........18 6. Estimated Effect of Health Aid on Infant Mortality: Current and Medium-Run Effect......19 7. Estimated Effect of Health Aid on Life Expectancy, 1975–2004 .......................................20 8. MDG Scenario for an Average Country ..............................................................................22 9. Estimated Effect of Health Aid on Infant Mortality, Interactions .......................................23 10. Estimated Effect of Types of Health Aid on Infant Mortality, 1975–2004 .......................25 11. Estimated Effect of Overall Aid on Infant Mortality, 1965–2004.....................................26 12. Effect of Aid on Health Spending 1985–2004...................................................................28 Figures 1. Health Aid and Overall Aid Trends .....................................................................................10 2. Overall Aid and Health Aid Per Capita Trends ...................................................................10 3. Components of Health Aid, 2000–04 ..................................................................................11 4. Components of Health Aid—Share of Bilateral in Total.....................................................12 5: Scatter Plot between Infant Mortality and Health Aid, 1975–79 to 2000–04 .....................12

3
Appendix Tables A1. The List of CRS Purpose Codes .......................................................................................30 A2. Description of Major CRS Purposes.................................................................................31 A3. List of Variables and Data Sources...................................................................................31 A4. Countries in Sample ..........................................................................................................32 A5. Summary Statistics............................................................................................................33 A6. Estimated Effect of Health Aid on Infant Mortality, Alternative Truncation...................33 A7. Estimated Effect of Health Aid on Infant Mortality Without Lagged Controls ...............34 A8. Estimated Effect of Overall Aid on Infant Mortality, GMM, Robustness Check ............35 A9. Estimated Effect of Overall Aid on Infant Mortality, 1965–2004: Short-Run vs. Long-Run Effect ...............................................................................................................35 A10. Estimated Effect of Overall Aid on Life Expectancy, 1965–2004 .................................36 A11. Millennium Development Goals and Targets .................................................................37

4
I. INTRODUCTION
“And whatever the impact on economic growth rates, aid definitely does something far more important: it saves lives. Let's not shy away from a conversation about the effectiveness of aid. The problems are real, but so are the millions of people alive today who wouldn't be if not for aid.” (Kristof, 2006) Foreign aid is widely believed to improve health outcomes in developing countries. Although a large literature has failed to provide robust evidence that aid promotes economic growth (Rajan and Subramanian, 2005a, Roodman, 2004), foreign aid is often credited with saving lives by providing vaccines, eradicating deadly diseases, and improving medical services. This belief stems in part from successful large scale health interventions funded with international assistance.1 The belief that aid improves health despite having little or no effect on growth is consistent with evidence that economic growth plays a limited role in explaining health outcomes. Many countries have shown remarkable improvements in health with little or no economic growth and vice versa (Cutler, et. al., 2006). Existing estimates suggest that economic growth explains less than half of the overall improvements in health in the past 50 years in developing countries (Bloom, et. al., 2004, Fogel 1994, WHO, 1999). Hence, although previous studies fail to find an effect of aid on growth, there remains hope that aid improves health outcomes directly. Aid’s effect on health outcomes also relates to the long-standing debate about the effectiveness of aid in general. Skeptics argue that aid can adversely affect a country’s competitiveness (Rajan and Subramanian, 2005b, Younger, 1992), encourage dependency and reduce incentives to adopt good policies (Bauer, 1982), overwhelm the management capacity of governments (Kanbur, et. al., 1999) or be used inefficiently to benefit the political elite (Bauer, 1971, Friedman, 1958). On the other hand, advocates continue to argue that aid leads to improved outcomes in poor countries by relaxing resource constraints and directly improving health service delivery (Levine, et. al., 2004). For example, Sachs (2005) advocates a massive scaling up of aid to help countries achieve the Millennium Development Goals (MDGs). In addition, some studies contend that particular types of aid, such as short-term aid or multilateral aid, can promote economic growth (Clemens, et. al., 2004, Reddy and Minoiu, 2006). Given the micro-level evidence on the success of selected public health intervention programs, the limited role of economic growth in explaining health improvements, and the ongoing debate over aid effectiveness, it is important to understand the relationship between foreign aid and health outcomes. Despite the vast empirical literature considering the effect of foreign aid on growth, there is little systematic empirical evidence on how overall aid affects health, and
1 One of several examples is the national diarrheal control program in Egypt. At a cost of US $43 mn (60 percent of which was funded by international donors), this program increased the use of life-saving oral rehydration therapy, which reduced infant diarrheal deaths by 82 percent between 1982 and 1987. See Levine et. al., 2004 for 17 proven success stories of public health programs.

5
none (to our knowledge) on how health aid affects health.2 This is surprising, given the recent attention devoted to promoting health in developing countries. The adoption of the MDGs signaled a clear shift in the orientation of donors to prioritize aid towards poverty-reducing objectives, including improved health outcomes (Table A11), and many multilateral and bilateral donors have already made explicit commitments to scale up aid significantly over the medium term.3 The main contribution of this paper is to present new, systematic and comprehensive cross-country evidence on the effect of health aid on infant mortality. To the best of our knowledge, this paper presents the first study of the effect of health aid on health outcomes. Infant mortality is our primary health indicator for four reasons. First, data on infant mortality are available for a large set of countries and are more reliable than life expectancy.4 Second, infant mortality is more sensitive than life expectancy to changes in economic conditions, and is considered to be a flash indicator of improvement in conditions of the poor (Boone, 1996). Third, reductions in infant and child mortality largely explain the substantial improvements in life expectancy over the last half decade in poor countries (Cutler et. al., 2006). Finally, past studies indicate that in developing countries, infant mortality depends on access to medicines and health facilities, water and sanitation, fertility patterns, maternal health, maternal and infant nutrition, maternal and infant disease exposure, and female literacy in addition to per capita GDP and economic inequality.5 Therefore, infant mortality is a proxy for a broad set of human development outcomes. Two main identification strategies are employed to estimate the effect of aid on health outcomes. The first is OLS with a rich set of control variables, on a sample that pools all country-year observations. The second strategy is based on a dynamic panel data model with country fixed effects, and is estimated using the Generalized Method of Moments (GMM). In this model, all predetermined and endogenous variables are instrumented by their appropriate lags, to avoid introducing a spurious correlation between these variables and the error term. GMM estimation requires a sufficiently large number of observations to provide robust
2 Only two existing papers (Boone, 1996 and Masud and Yontcheva, 2005) have examined the impact of overall foreign aid on infant mortality or life expectancy. In addition to looking at the impact of health aid, our paper differs from these existing papers in (i) employing additional identification strategies (ii) testing for effects of aid conditional on regions, periods, policies and institutions (iii) using a significantly larger sample, and finally (iv) exploring health spending as a possible channel through which foreign aid could affect health outcomes. 3 The G5 at its 2005 summit at Gleneagles, Scotland committed to an increase in total aid for an amount of US $50 billion, half of which would be devoted to doubling aid to Sub-Saharan Africa by 2010 (Bourguignon and Leipziger, 2006). 4 The estimates of life expectancy are not reliable because they are based on predictive equations since most developing countries lack complete vital registration systems. Moreover, mortality reductions reflected in changes in life expectancy took place among different age groups in different countries, hence it is not a suitable measure for comparing health changes between countries (Deaton, 2006, Cutler, et. al., 2006). 5 See among others, Filmer and Pritchett, 1999, Wagstaff, 2000, Wolpin, 1997, Cutler et. al., 2006, Pritchett and Summers, 1996, Easterly, 1999.

6
estimates. We rely on a substantially larger dataset than previous studies on aid, covering 118 countries between 1973 to 2004.6 The main finding in the paper is that health aid has a discernible effect on infant mortality. On average, a doubling of per capita health aid is associated with a 2 percent reduction in infant mortality. For the average country in our sample, this implies that increasing per capita health aid from US$1.60 to $3.20 will lead to roughly 1.5 fewer infant deaths per thousand births, which is small relative to the MDGs targets.7 In addition, there is some evidence that health aid has become more effective in reducing infant mortality since 1990, and that it is more effective in countries with higher quality policies and institutions. Health aid, when it is not granted in kind and directed towards specific projects, may be fungible. If both health aid and overall aid primarily relax government budget constraints, they should have similar effects on health outcomes. Therefore, in order to assess whether there is indeed something specific about health aid which explains its relationship with health outcomes, we also examine the effect of overall aid on health outcomes. In our preferred specification, the estimated effect of overall aid is half that of health aid and not statistically significant, which suggests that health aid may not be entirely fungible. Finally, we examine the effect of aid on health spending, which is one channel through which aid may reduce infant mortality. Data on health spending are limited, but suggestive evidence indicates that doubling health aid is associated with a 7 percent increase in health spending per capita (which is statistically significant). For a typical country, this implies that a one dollar increase in health aid per capita is associated with a more than US$1.50 increase in health spending per capita. On the other hand, the estimated effect of overall aid on health spending is smaller and statistically insignificant. The results are consistent with increased health spending being one channel through which health aid reduces infant mortality. In summary, the results suggest that the well-known “micro-macro paradox”—where aid is demonstrably effective in specific cases but has little effect in the aggregate—does not apply to the case of health aid. The numerous success stories of international assistance from bilateral and multilateral donors appear to be borne out, to some extent, in the aggregate data. Health aid constitutes only 6 percent of overall aid and the findings indicate that increased allocation of aid towards health purposes in the future could be associated with better health outcomes. The outline of the paper is as follows. Section II presents the empirical specifications, Section III discusses the data and shows simple descriptive statistics, Section IV presents results on the relationship between health aid on health outcomes, Section V discusses the impact of health aid in different environments, Section VI examines the relationship between overall aid on 6 The overall development aid sample covers 1960-2004. The maximum coverage of data in previous studies is in Rajan and Subramanian (2005a), who include 61–81 countries from 1960–2000. 7 The MDGs target is that under 5 child mortality will be reduced by two-thirds of its 1990 level by 2015. We assume the same target for the reduction in (under one year) infant mortality from 81 to 27 deaths per 1000 births for the average country.

7
health outcomes, and Section VII presents preliminary evidence on aid and health spending. Section VIII concludes.
II. EMPIRICAL FRAMEWORK
A. Ordinary Least Squares
We follow the bulk of the previous literature and average our annual data across five-year periods, to average annual fluctuations and reduce measurement error. Our most basic OLS regression equation specifies infant mortality as a function of previous period’s aid, as follows:
rttwrtrtrtrtrt vDHIVXAH εγβα +++++= −− 11loglog (1)
Where rtH is the health outcome - infant mortality or life expectancy in aid recipient country r in period t , 1rtA − is the aid per capita in country r during the previous period, 1−rtX is a vector of control variables which capture the country’s initial economic and health status (including 1rtH − ), rtHIV is the incidence of HIV/AIDS, and w
rtD indicates the presence of a
war in country r at time t . tv is a vector of period dummies, which captures universal time trends. The parameterα gives the percent change in infant mortality due to a one percent increase in the previous period’s aid per capita. α is identified by using both across- and within-country variation. 8
B. Dynamic Panel Data Models with Fixed Effects
The OLS results are biased if lagged aid is correlated with the unobserved component of health outcomes. Therefore, we introduce country fixed effects to control for unobserved country-specific and time invariant factors determinants of infant mortality. The fixed effects regression is specified as:
rttrwrtrtrtrtrt vsDHIVXAH εγβα ++++++= −− 11loglog (2)
Where rs is a vector of country fixed effects which control for time-invariant differences in infant mortality across countries, implying that α is identified by within-country changes in aid over time. Three main concerns remain after controlling for country-specific heterogeneity. First, the residual may contain time-varying and country specific factors that affect infant mortality, such as access to health clinics, clean water, and fertility rate in poor households. If these time varying, country specific factors are correlated with aid, then the estimated coefficient of 8 The results in the paper are identical we use the ratio of aid to GDP (in logs) as the explanatory variable (Table 1, discussed below).

8
interest,α , would be biased. For example, if countries tend to receive more aid as the quality of their health facilities is declining, then α would be biased upwards. Second, in panel data models with a lagged dependent variable, predetermined variables, and fixed effects, the within-estimators of the lagged dependent and predetermined variables are inconsistent. This inconsistency derives from the presence of the lagged error term in the residual, after subtracting within-country means. Finally, the presence of classical measurement error in health aid would bias the OLS coefficient towards zero. One standard method used to address these three sources of bias is to estimate a system of moment equations using the Generalized Method of Moments (GMM). The following regression equations are estimated using a system GMM specification (Blundell and Bond, 2000, Bond, 2002):
rttrrtrtrtrt vsXHAH εϕχα +++++= −−− 111 logloglog (3)
+Δ=Δ − )log(log 1rtrt AH α rttrtrt vXH εϕχ Δ+Δ+Δ+Δ −− )()log( 11 (4) Lagged differences e.g., )(),log(log 3232 −−−− −− rtrtrtrt XXHH are used as instruments in the level equation (3). Lagged levels of the variables, e.g., 2,2 −− rtrt XH are used as instruments in the first differenced equation, (4). The system GMM obtains estimated coefficients by solving the appropriately weighted set of the moment conditions defined by equations (3) and (4). We use system GMM rather than first difference GMM (Arellano-Bond, 1991), which estimates only equation (4), because system GMM gives more plausible results when the dependent variable is persistent (Blundell and Bond, 2000). This is the case with infant mortality as the coefficient on lagged infant mortality is close to one.9 The system GMM specification is estimated using the xtabond2 command in Stata (Roodman, 2005).10
III. DATA
The data on health and overall aid are both taken from the OECD, but are derived from two different sources. The data on net Official Development Assistance (ODA) are taken from the Development Assistance Committee (DAC). The OECD database also provides data on ODA commitments by purpose, taken from the Creditor Reporting System (CRS). According to the OECD, the term “purpose of aid” signifies the sector of the recipient’s economy that the aid activity is designed to assist, such as health, energy, agriculture. Aid activities are classified into 26 broad three-digit sector/purpose categories, each of which is further classified into
9 Since we have a large cross-section of countries (118 countries) and relatively small number of time periods (seven periods), the asymptotic properties of the estimators are based on the cross-sectional dimension becoming large. However, when the series are near unit root processes, the instruments used in the first-difference equation are weak, which can lead to serious finite sample bias. Hence, the system GMM utilizes additional moment conditions from the levels equation. 10 The robust two-step GMM procedure is used, which includes Windmeijer’s correction for finite sample bias.

9
5-digit purpose codes. The three and five digit codes corresponding to the health sector are shown in Table A1. The CRS data suffer from two limitations. First, the CRS collects data on donor commitments rather than disbursements, although the two are strongly correlated.11 Second, aid totals in CRS are significantly less than those in the DAC, reflecting underreporting of aid in the CRS data. The extent of underreporting in the CRS varies by sector, donor and time period. (Development Assistance Committee, 2002). Therefore, we not assume that the absence of health aid data for a donor-recipient pair reflects zero health aid, and instead omit these pairs from the analysis.12 Aid is defined as the sum of grants and concessionary loans (loans with grant element of at least 25 percent based on a 10 percent reference rate of interest). Net ODA to a recipient is the difference between the value of aid disbursed by all donors and the return of unspent balances and principal repayments of earlier loans. Aid flows are converted into constant 2003 US dollars using the DAC deflator. We confine the sample of aid recipient countries to developing countries based on 2005 GNI per capita, as classified by the World Bank.13 Outliers were trimmed manually and also according to the Hadi (1992) procedure.14 After dropping observations for which no health aid was reported, and using lagged values of the explanatory variables, the final sample consists of 465 country-period observations. Data on infant mortality come from the United Nations (UN, 2004). The infant mortality rate represents the number of infants who die before reaching the age of one year, per 1000 live births in a given year. The HIV/AIDS prevalence rate, as measured by the number of reported AIDS cases per 100,000 people, is taken from Papageorgiou and Stoytcheva (2006). All the variables and the data sources are described in detail in Table A3. The list of countries in the sample is shown in Table A4, and Table A5 shows the summary statistics for all the variables used in the paper. Figure 1 shows trends in the amount of reported health aid (right scale) and overall aid (left scale) between 1960 and 2004. Health aid is only available beginning in the 1970–1975 period. Reported health aid constitutes a very small fraction of overall aid, with the share ranging between 0.5 and 7 percent. Figure 1 shows that health aid increased during 1973-2004. Overall aid also increased for most of the period, though the increase was at a much slower 11 Data on health aid disbursements are available from 1990 to 2004, and the correlation coefficient between disbursements and commitments over this period is 0.66. 12 As a result, 95 of the 560 country-period observations were dropped, leaving 465 observations. 13 Countries with GNI per capita below US $10,725 in 2005 are categorized as developing countries, according to the World Bank’s income classification (World Bank, 2006). 14 The Hadi procedure dropped outliers based on within-country infant mortality and within-country life expectancy, at the 5 percent level of significance. In addition, the top and bottom one percent of within-country values of log health aid were omitted from the analysis.

10
rate after 1980–84. Figure 2 shows that both health aid and overall aid have been decreasing in per capita terms, at least since 1975.
Figure 1. Health Aid and Overall Aid Trends (2003 US$ billion)
0
50
100
150
200
250
300
65-69 70-74 75-79 80-84 85-89 90-94 95-99 00-040
2
4
6
8
10
12
14
16
Overall aid ($ bn)Health Aid ($bn )
Left scale Right scale
Figure 2. Overall Aid and Health Aid Per Capita Trends (2003 US$)
0
10
20
30
40
50
60
70
65-69 70-74 75-79 80-84 85-89 90-94 95-99 00-040.0
0.5
1.0
1.5
2.0
2.5
3.0
Overall aid ($)Health Aid ($)
Left scale
Right scale
Figure 3 looks at the various components (or “purposes”) of health aid for 2000–04. Health policy and administrative management is the largest component, constituting about 30 percent of total aid, followed by basic health care (25 percent), infectious diseases control (15 percent), medical services (9 percent) and basic health infrastructure (6 percent). Over time, the health aid allocated towards health policy and administrative management has decreased whereas medical services and basic health care have become more important (not shown).

11
Figure 3. Components of Health Aid, 2000–04 (In percent of total health aid)
0.0
5.0
10.0
15.0
20.0
25.0
30.0
35.0
Hea
lth p
olic
y an
dad
min
istra
tive
man
agem
ent
Med
ical
edu
catio
n/tra
inin
g
Med
ical
rese
arch
Med
ical
serv
ices
Bas
ic h
ealth
car
e
Bas
ic h
ealth
infr
astru
ctur
e
Bas
ic n
utrit
ion
Infe
ctio
us d
isea
se c
ontro
l
Hea
lth e
duca
tion
Hea
lth p
erso
nnel
dev
elop
men
t
Table A2 examines the three largest CRS purposes for 2000–04 in greater detail. The CRS data contains a variable called “short description” which can be used to better understand the broad purposes described in Figure 3. Table A2 lists the ten most important descriptions in the three largest CRS purposes shown in Figure 3.15 Some of the largest categories under “health policy and administrative management” include health aid by the World Bank to three large states in India—Uttar Pradesh, Rajasthan and Tamil Nadu-targeted towards health systems development. Under “basic health care”, major projects include health aid given for “young child health” and “child survival”. Finally, health aid given for “infectious diseases control” is targeted largely to immunization programs devoted to polio eradication, and immunization programs for specific countries like India. Although the short descriptions of health aid contain limited information, the table suggests that a significant portion of health aid is directed to specific projects in particular regions, which makes it less likely to be fungible. Bilateral aid constitutes about 70–90 percent of health aid (Figure 4), and the fraction is relatively stable over time. Health aid is comprised predominantly of grants, as the loan component varies between 3 and 10 percent (not shown).
15 Some of the short descriptions in the data are identical to the broader purpose and do not convey additional information.

12
Figure 4. Components of Health Aid—Share of Bilateral in Total (In percent)
50
55
60
65
70
75
80
85
75-79 80-84 85-89 90-94 95-99 00-04
Before proceeding to the regression analysis, it is instructive to document bivariate relationships between key variables using simple scatter plots. Figure 5 shows a weak positive correlation between health aid and infant mortality, after controlling for country and year fixed effects. This positive association likely reflects the endogeneity of aid, as more aid flows to countries when health indicators are worsening. Of course, the scatter plot is only suggestive, and the next section presents results from regression analysis that includes additional control variables.
Figure 5: Scatter Plot of Infant Mortality and Health Aid, 1975–79 to 2000–04 (In deviations from country-specific means)
-1-.5
0.5
1W
ithin
-Cou
ntry
Infa
nt M
orta
lity
-3 -2 -1 0 1 2 3Within-Country Lag Log Health Aid Per Capita
Within-country Log Infant MortalityFitted values

13
IV. HEALTH AID AND HEALTH OUTCOMES
This section examines the effect of per capita health aid on health outcomes. Our main focus is on infant mortality, for to reasons discussed above. In the basic specifications, we analyze the effect of increasing per capita health aid during a given five-year period on health outcomes in the following period. Infant mortality The regression results for the impact of health aid on infant mortality are shown in Table 1. The dependent variable is the log of the average number of infant deaths (per thousand births) during a five-year period. The key explanatory variable is the log of the average amount of health aid per capita received during the previous period.16 All the regressions include period dummies, the war dummy, and additional controls—lagged infant mortality, lagged population, lagged per capita income, lagged fertility rate, and the prevalence of HIV/AIDS. Since we are controlling for the prevalence of AIDS in the current period, the estimates do not capture the effect of health aid on health outcomes through any contemporaneous effect on AIDS prevalence rates. Ordinary least squares Specification I shows the OLS regression results without country fixed effects. The estimated coefficient on lagged aid per capita is negative and statistically significant (at the 5 percent level) in the OLS specification. Doubling aid reduces infant mortality in the next 5-year period by approximately 1 percent. Generalized method of moments Specification II shows the results from the system GMM estimation. In this case, identification is based on the lags of health aid (in addition to the lags of other predetermined variables). Two and three period lagged levels of health aid and the other predetermined variables, when available, are used as instruments in the difference equation whereas lagged differences are used in the level equations.17 The GMM results suggest a statistically significant effect of health aid in reducing infant mortality. Doubling health aid within a country reduces infant mortality in the next 5-year period by about 2 percent. The coefficient is precisely estimated with the 95 percent confidence interval ranging between 0.5 and 3.6 percent. The Hansen’s test for over-
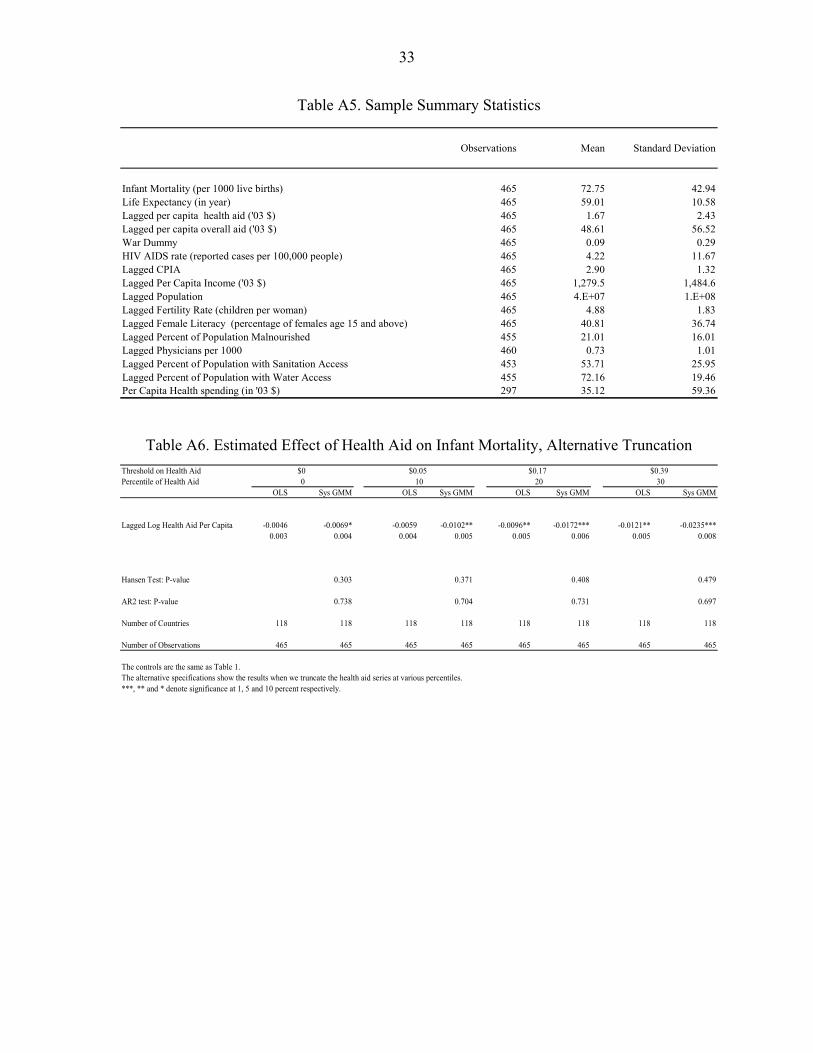
16 We truncate the log per capita health aid variable at 25 cents, which is approximately the 25th percentile, to reduce the influence of negative outliers and reduce the measurement error. The estimated coefficients are attenuated towards zero and weakly significant when the variable is not truncated. Table A6 shows the estimated coefficients for truncation at various percentiles, and demonstrates how the measurement error gets reduced as we truncate observations at the lower tail. 17 The lags are included as “GMM-style instruments” (Roodman, 2005).

14
Table 1. Estimated Effect of Health Aid on Infant Mortality, 1975–2004
Dependent variable :
OLS System GMM-Lags
Lagged Log Health Aid Per Capita -0.0110** -0.0206***[0.005] [0.008]
Lagged Log Infant Mortality 1.0408*** 1.0004***[0.019] [0.054]
Lagged Log Per Capita Income -0.0169*** -0.0986***[0.006] [0.025]
Lagged Log Population -0.0094*** -0.0175[0.003] [0.013]
Lagged Log Fertility Rate 0.028 -0.0191[0.029] [0.063]
War Dummy 0.0053 -0.0325[0.013] [0.023]
HIV AIDS rate 0.0021*** 0.0012[0.000] [0.001]
Hansen Test: P-value 0.467 AR1 Test: P-value 0.009 AR2 test: P-value 0.765 Number of Countries 118 118 Number of Observations 465 465
Standard errors are denoted in parentheses. The regressions include country and period fixed effects. All variables are averages over five year periods (except for war dummies).***, ** and * denote significance at 1, 5 and 10 percent respectively.In the GMM specifications, one period lags of aid per capita, infant mortality, population, fertility,and per capita GDP are treated as endogenous; two lags are used as instruments.
Log Infant mortality rate (per 1000)
identifying restrictions passes at the 1 percent significance level. In addition, the null hypothesis of no two-period serial correlation in the residuals cannot be rejected. The magnitude of the estimated effect of health aid in reducing infant mortality is higher in the GMM specification than in the OLS, which is consistent with a positive correlation between

15
the unobserved components of infant mortality and health aid.18 This implies that increased health aid is allocated to countries when health outcomes are worsening. Turning to the coefficients on the other explanatory variables in Table 1, infant mortality is highly persistent, as the coefficient on lagged infant mortality is close to one. The coefficient on lagged per capita income is negative and significant at the 1 percent level. This is consistent with higher levels of income leading to improved public health infrastructure, e.g., water and sanitation, and better nutrition, better housing and the ability to pay for health care (Cutler, et. al., 2006, Pritchett and Summers, 1996). The coefficient on HIV/AIDS is positive (and statistically significant at the l percent level in the OLS regression), suggesting that a greater prevalence of AIDS is associated with a higher infant mortality.19, 20 Robustness checks Alternative lag structures One common criticism of GMM estimation is that it confers on the researcher considerable degrees of freedom in determining how many lags of the endogenous and predetermined variables are used as instruments. Table 2 shows that the estimated effect of health aid on infant mortality is robust to using different lag structures as instruments. The Hansen’s test for over identifying restrictions and the AR2 test for no second order serial correlation pass in all the specifications. Levels Specification Table 3 shows the regressions when we use the levels of aid rather than the log of aid in the regression. The estimated coefficient from the GMM specification is -0.01, implying that a one dollar increase in per capita health aid lowers infant mortality by 1 percent, and is statistically significant. The magnitude of the estimated effect is consistent with Table 1.21
18 The increased magnitude of the GMM estimate relative to the OLS estimate may also be attributable to noise in the per capita health aid variable, which would attenuate the OLS estimates towards zero. 19 The sign on lagged fertility is negative (but insignificant) in the GMM specification, where higher fertility is associated with lower infant mortality. The effect of changes in fertility on infant mortality has been a subject of debate in the health literature. In fact, there is little evidence that declines in fertility have a net positive impact on infant and child survival (LeGrand and Phillips, 1996). For example, Bongaarts (1987) using cross-country evidence finds that the percentage of birth intervals of less than 24 months that are associated with high infant-health risks rises as fertility falls. 20 We also included lagged female literacy as additional control in the two key specifications. The estimated coefficient was negative, but statistically insignificant, and the coefficient on aid was unchanged. Women’s education is considered an important determinant of infant mortality (Cutler et. al., 2006). However, female literacy may be highly correlated with other control variables, such as lagged infant mortality. 21 As discussed below, Table 1 implies that for the average country, a US $1.60 increase in per capita health aid is associated with a 2 percent reduction in infant mortality. In comparison, the estimates in Table 3 imply that a US $1.60 increase in health aid is associated with a 1.6 percent reduction in infant mortality.

16
Table 2. Estimated Effect of Health Aid on Infant Mortality, GMM Robustness Checks
Number of lags 1 2 3 4 All Dependent variable :
Lagged Log Health Aid Per Capita -0.0207*** -0.0206*** -0.0179*** -0.0199** -0.0196**(0.008) (0.008) (0.007) (0.008) (0.008)
Hansen Test: P-value 0.237 0.467 0.571 0.483 0.785AR2 test: P-value 0.817 0.765 0.802 0.925 0.9Number of Instruments 59 79 94 104 109Number of Countries 118 118 118 118 118Number of Observations 465 465 465 465 465
See notes to Table 1. ***, ** and * denote significance at 1, 5 and 10 percent respectively.
Log Infant Mortality (per 1000)
Table 3. Estimated Effect of Health Aid on Infant Mortality Levels, 1975–2004
OLS System GMM
Lagged Health Aid Per Capita (2003 US$) -0.0049** -0.0084*** -0.002 -0.003 Hansen Test: P-value 0.493 AR2 test: P-value 0.827 Number of Instruments 79 Number of Countries 118 Number of Observations 465 465
The controls are the same as in Table 1. See notes to Table 1. ***, ** and * denote significance at 1, 5 and 10 percent respectively.
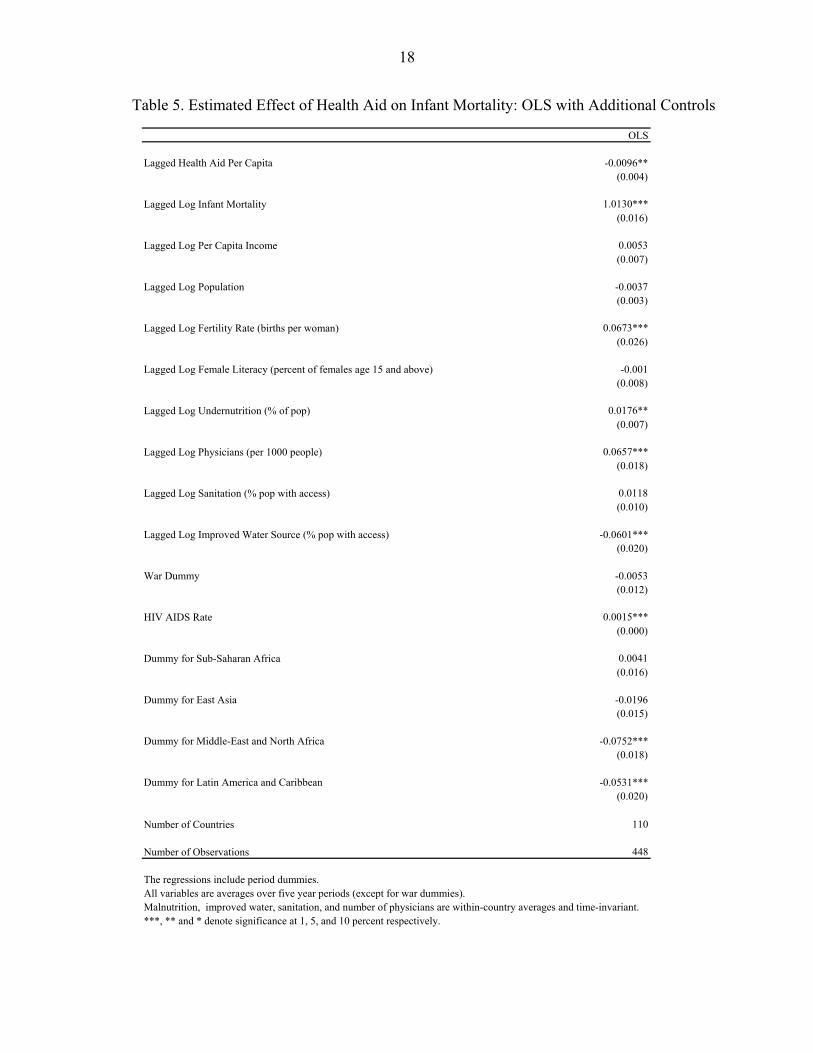
Health Aid to GDP Often, aid is measured as a percentage of GDP rather in per capita terms. Table 4 presents results using health aid to GDP as the main independent variable. The estimated effect of health aid on infant mortality is similar to the basic estimates in Table 1. OLS with Additional Controls Finally, to reduce the possibility that omitted variables are biasing the OLS estimates, we add additional controls to the estimating equation. Table 5 displays the results. The additional controls include determinants of infant mortality, such as the prevalence of undernutrition,

17
number of physicians, the percentage of the population with access to water and sanitation, and female literacy, as well as regional dummies.22 The goal is to estimate the partial effect of increasing health aid, controlling for as many variables as possible. The estimated effect of health aid on infant mortality is similar to that in Table 1. 23
Table 4. Estimated Effect of Health Aid on Infant Mortality, Health Aid to GDP, 1975–2004
OLS GMM Lagged Log Health Aid to GDP -0.0103** -0.0142*** (0.005) (0.005) Hansen Test: P-value 0.45 AR2 test: P-value 0.605 Number of Instruments 79 Number of Countries 118 118 Number of Observations 465 465 The controls are the same as in Table 1. See notes to Table 1. ***, ** and * denote significance at 1, 5, and 10 percent respectively.
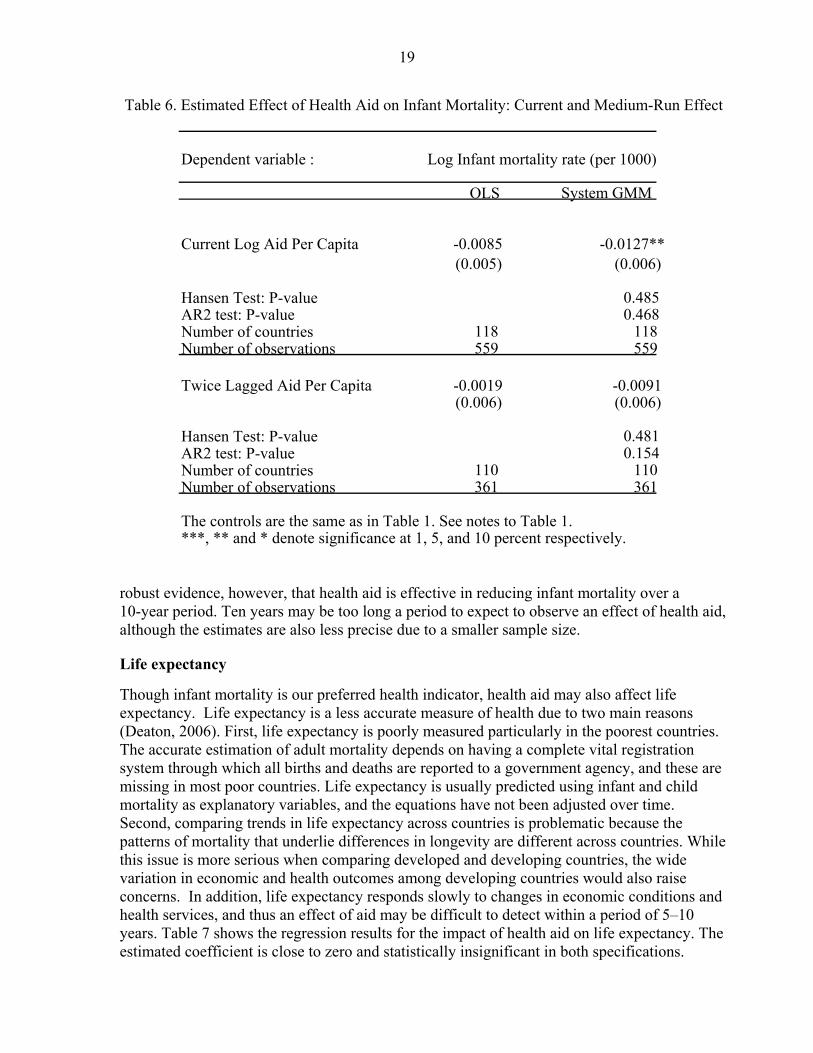
Ten-year lagged and contemporaneous effect of health aid Table 1 examines the short-term effect of health aid on health outcomes, defined as the effect of aid in a given period on health outcomes in the following five-year period. We also examine two alternative specifications where (i) health aid is assumed to have a contemporaneous effect on outcomes and (ii) aid is assumed to have an effect on outcomes over 10-year periods. The regression results are shown in Table 6. We find that health aid also has a significant contemporaneous effect on infant mortality (at least in the GMM specification), though the magnitude of the estimated effect is slightly smaller compared to Table 1. Doubling health aid during a given period reduces infant mortality in that period by about 1 percent. There is no
22 The data on these variables is obtained from the World Bank (2006). The additional variables, except female literacy, are available for only 2 or 3 years between 1970 and 2004. Hence, the averages of these variables over the period are introduced as country-specific time invariant controls in the OLS specification. 23 We also estimated the OLS regressions using data on health aid disbursements rather than commitments. The data is available only for 3 periods, and since we use lags, there are only 2 periods with about 100 available observations. For comparison, we also restricted the data on health aid commitments to the same period. The estimated effect of health aid on infant mortality is not statistically different whether we use disbursements or commitments. However, in this small sample, the estimated effect is statistically insignificant in both cases.
18
Table 5. Estimated Effect of Health Aid on Infant Mortality: OLS with Additional Controls
OLS Lagged Health Aid Per Capita -0.0096**
(0.004)
Lagged Log Infant Mortality 1.0130***(0.016)
Lagged Log Per Capita Income 0.0053(0.007)
Lagged Log Population -0.0037 (0.003)
Lagged Log Fertility Rate (births per woman) 0.0673***(0.026)
Lagged Log Female Literacy (percent of females age 15 and above) -0.001 (0.008)
Lagged Log Undernutrition (% of pop) 0.0176** (0.007)
Lagged Log Physicians (per 1000 people) 0.0657***(0.018)
Lagged Log Sanitation (% pop with access) 0.0118(0.010)
Lagged Log Improved Water Source (% pop with access) -0.0601***(0.020)
War Dummy -0.0053 (0.012)
HIV AIDS Rate 0.0015***(0.000)
Dummy for Sub-Saharan Africa 0.0041(0.016)
Dummy for East Asia -0.0196 (0.015)
Dummy for Middle-East and North Africa -0.0752***(0.018)
Dummy for Latin America and Caribbean -0.0531***(0.020)
Number of Countries 110 Number of Observations 448
The regressions include period dummies. All variables are averages over five year periods (except for war dummies). Malnutrition, improved water, sanitation, and number of physicians are within-country averages and time-invariant. ***, ** and * denote significance at 1, 5, and 10 percent respectively.
19
Table 6. Estimated Effect of Health Aid on Infant Mortality: Current and Medium-Run Effect
robust evidence, however, that health aid is effective in reducing infant mortality over a 10-year period. Ten years may be too long a period to expect to observe an effect of health aid, although the estimates are also less precise due to a smaller sample size.
Life expectancy Though infant mortality is our preferred health indicator, health aid may also affect life expectancy. Life expectancy is a less accurate measure of health due to two main reasons (Deaton, 2006). First, life expectancy is poorly measured particularly in the poorest countries. The accurate estimation of adult mortality depends on having a complete vital registration system through which all births and deaths are reported to a government agency, and these are missing in most poor countries. Life expectancy is usually predicted using infant and child mortality as explanatory variables, and the equations have not been adjusted over time. Second, comparing trends in life expectancy across countries is problematic because the patterns of mortality that underlie differences in longevity are different across countries. While this issue is more serious when comparing developed and developing countries, the wide variation in economic and health outcomes among developing countries would also raise concerns. In addition, life expectancy responds slowly to changes in economic conditions and health services, and thus an effect of aid may be difficult to detect within a period of 5–10 years. Table 7 shows the regression results for the impact of health aid on life expectancy. The estimated coefficient is close to zero and statistically insignificant in both specifications.
Dependent variable :
OLS System GMM
Current Log Aid Per Capita -0.0085 -0.0127**(0.005) (0.006)
Hansen Test: P-value 0.485AR2 test: P-value 0.468Number of countries 118 118Number of observations 559 559
Twice Lagged Aid Per Capita -0.0019 -0.0091(0.006) (0.006)
Hansen Test: P-value 0.481AR2 test: P-value 0.154Number of countries 110 110Number of observations 361 361
The controls are the same as in Table 1. See notes to Table 1. ***, ** and * denote significance at 1, 5, and 10 percent respectively.
Log Infant mortality rate (per 1000)

20
Table 7. Estimated Effect of Health Aid on Life Expectancy, 1975-2004
Dependent variable : Log Life Expectancy (in years). OLS System GMM
Lagged Log Health Aid Per Capita -0.0023 0.0012 (0.003) (0.003)
Lagged Log Infant Mortality 0.9744*** 1.2418*** (0.057) (0.076)
Lagged Log Per Capita Income -0.0008 -0.0391*** (0.006) (0.014)
Lagged Log Population 0.0001 -0.008 (0.001) (0.009)
War Dummy -0.0119** -0.0121* (0.006) (0.007)
HIV AIDS rate -0.0018*** -0.0018*** (0.000) (0.000)
Hansen Test: P-value 0.368
AR1 Test: P-value 0.233
AR2 test: P-value 0.948
Number of Instruments 65
Number of Countries 118 118
Number of Observations 465 465 Robust standard errors denoted in parentheses. The regressions include country and period fixed effects. All variables are averages over five year periods (except for war dummies). ***, ** and * denote significance at 1 percent, 5 percent, and 10 percent respectively. In GMM specifications, lagged values of: aid per capita, life expectancy, population, fertility, and per capita GDP are treated as endogenous.
Discussion of the results As there are no previous studies on the effect of health aid on health outcomes, it is difficult to place these results in context. However, the estimated percentage impact of health aid on infant mortality reported above can be recast as the number of infants saved for a given increase in health aid, for the average country in the sample. The average infant mortality rate in the health aid sample is about 73 per 1,000 live births. The GMM coefficient estimate in Table 1

21
implies that doubling health aid reduces infant mortality by approximately 2 percent. The average amount of per capita health aid is US$1.60. In other words, for an average country, increasing per capita health aid from US$1.60 to $3.20 is associated with about 1.5 fewer infant deaths per 1,000 live births. The average number of live births per year is 1 million. The estimated effect translates to approximately 1,560 fewer infants per year for a typical country. For the world as a whole, the estimates imply that doubling health aid would save approximately 170,000 infants per year. The estimates also suggest that the effect of doubling health aid on reducing infant mortality, controlling for other factors, is small relative to the goals envisioned by the MDGs. The MDGs call for the under-five child mortality rate to fall by two-thirds by 2015, relative to its level in 1990. Assuming the same target for infant mortality, the calculations suggest that a massive increase in health aid would be needed to achieve the MDG target by 2015. Table 8 shows the step-by-step calculations. Specifically, the estimates imply that an annual flow of US$5.8 billion of health aid would be needed per country by 2015 in order to achieve the target. This would imply raising the current annual flow of health aid to an average country by a factor of 15. These calculations should be interpreted with caution, however, since the underlying estimates used to derive these figures approximate the effect of marginal rather than large changes in aid.24
The estimates of the effect of health aid are based on OLS and the GMM regressions. If donor’s health aid decisions reflect expectations of recipient’s future economic conditions that are correlated with future infant mortality, then the estimates would be biased. It is difficult to know the direction of this bias. However, to the extent that health aid is motivated by altruism, donors may provide more health aid to countries whose unobserved health outcomes are worsening.25 In this case, health aid may be positively correlated with the unobserved component of infant mortality. This would bias the estimated coefficient on health aid upwards, implying that the magnitude of the true beneficial effect of health aid on infant mortality would be larger than the estimated effect.
24 These estimates are not comparable to MDG costing studies that exist for several African countries (e.g., see the MDGs Needs Assessment Synthesis Report for Ethiopia at www.et.undp.org/rcs/Doc/MDG%20synthesis 20January%203 202006.pdf ). The primary difference is that while the costing exercises assume parameter estimates and simulate the cost of attaining the MDGs, we estimate elasticities from the data and use it to derive the amount of aid required to achieve a given reduction in infant mortality. On the other hand, while these costing exercises are country-specific, our estimates represent an average across countries. 25 Table A7 shows that when we drop the additional determinants of infant mortality from the estimations in Table 2, the estimated coefficient on health aid is biased upwards, implying a positive correlation between health aid and the observed determinants of infant mortality. To the extent that the unobserved determinants are positively correlated with observables, the estimates underestimate the beneficial effect of health aid on infant mortality.

22
Table 8. MDG Scenario for an Average Country
Average IM, 2005, per 1000 53 Average IM, 1990, per 1000 81 MDG target, 2015, per 1000 27 Percent decrease in IM required b/w 2005-2015 to achieve the MDG target 49 Required percent decrease in IM each 5 year period b/w 2005-15 29 Regression coefficient (log-log regression of average annual IM per 1000 on aid per capita) -0.0206 Required percent increase in health aid to reduce IM by 2.1 percent 100 Required percent increase in health aid during a five-year period to achieve MDG target 1395 Health aid, current, annual, mn US$ 26 Targeted annual health aid, 2006-2010, mn US$ 392 Targeted annual health aid, 2011-2015, mn US$ 5854
V. HEALTH AID AND HEALTH—REGIONS, INSTITUTIONS, PERIODS, TYPES OF AID
Until now, we have estimated the average impact of health aid across all countries and periods in the sample. One prevalent view in the aid literature is that aid promotes growth in particular environments. In the sections that follow, we estimate how the effect of health aid depends on the region and institutional quality of the recipient, and when it is received. The results are shown in Table 9.26 Regions First we examine how the effect of health aid on health outcomes varies by region. Table 9, panel A, reveals no robust evidence that the effectiveness of health aid varies by region.
26 Because including interactions adds endogenous variables, the GMM estimation used to obtain table 10 uses one rather than two lags of the endogenous and predetermined variables. This reduces the number of instruments in the estimating equation and helps reduce finite-sample bias associated with overfitting the endogenous variables.

23
Table 9. Estimated Effect of Health Aid on Infant Mortality, Interactions
Dependent Variable.
OLS System GMM
Panel A: Regions
Aid per capita (excluded Sub-Saharan Africa) -0.0183*** -0.0142*(0.005) (0.008)
Aid per capita * Asia and Pacific 0.0306** -0.0049(0.013) (0.025)
Aid per capita * MENA, Europe and Central Asia 0.0136 -0.0308(0.014) (0.030)
Aid per capita * LAC 0.0058 -0.0024(0.009) (0.011)
Hansen Test: P-value 0.487AR2 test: P-value 0.853Number of Observations 465 465
Panel B. Periods
Aid per capita (excluded 1970-1989) -0.0073 -0.0078(0.006) (0.008)
Aid per capita * 1990-2004 -0.0062 -0.0197**(0.008) (0.008)
Hansen Test: P-value 0.632AR2 test: P-value 0.854Number of Observations 465 465
Panel C. Policies and Institutions
Aid per capita (excluded Low CPIA) -0.01 0.0024(0.006) (0.010)
Aid per capita * High CPIA -0.0001 -0.0410***(0.008) (0.014)
Hansen Test: P-value 0.545AR2 test: P-value 0.814Number of Observations 460 460
CPIA stands for the Country Policies and Institutions Index developed by the World Bank.Sub-Saharan Africa in the regions interaction, 1970-89 in the period interactions, and CPIA countries below the median in the CPIA interactions are the excluded categories.The regressions include the same controls as in Table 1.One lag of predetermined and endogenous variables are used as instruments.***, ** and * denote significance at 1, 5 and 10 percent respectively.
Log Infant Mortality (per 1000)

24
Periods Aid in general may have become more effective since the end of the Cold War, when it became less dictated by political motives (Bourguignon and Leipziger, 2006). In order to see whether the end of the Cold War improved the effectiveness of health aid, we interact per capita health aid with a post-1990 indicator variable in Table 9, Panel B. The results from the GMM specification suggest that the effect of health aid strengthened after 1990, as a doubling of health aid is associated with a 0.8 percent reduction in infant mortality before 1990 and a 2.8 percent reduction after 1990.27 Policies and institutions Burnside and Dollar (2000) suggest that aid, even if it does not unconditionally help growth, promotes growth in those countries that have good policies and institutions. Table 9 (panel C) report results from specifications in which aid was interacted with World Bank’s Country Policy and Institutions Index (CPIA), a measure of the quality of polices and institutions in a country. Countries whose average CPIA score over the period fall below and above the median are treated as low and high CPIA countries, respectively. Table 9 shows some evidence, in the GMM specification, that health aid is more effective in reducing infant mortality in countries with higher institutional quality (significant at 1 percent level). In high CPIA countries, doubling health aid leads to a 7 percent decline in infant mortality. However, in the OLS specification, health aid is not demonstrably more effective in high CPIA countries. Furthermore, the existing indices of institutions like the CPIA do not fully capture the institutional characteristics of countries that are especially relevant for the management of aid (e.g., monitoring of aid-related spending, program indicators, etc.). Therefore, the GMM results should be interpreted with appropriate caution. Types of health aid Finally, we disaggregate health aid into the two primary categories listed in Table A1, to see if the estimated effect of aid varies by category. The first category is general health aid, the largest component of which is health policy and administrative management, including aid to health ministries and public health administration. The second is basic health aid, where the large components are basic health care—basic and primary health care programs, supply of drugs, medicines and vaccines, and infectious diseases control. Table 10 shows that both types of health aid have a negative and statistically significant effect on infant mortality. The difference in the estimated effects of the two different types is not statistically significant, however. We also examine whether the effectiveness of one type of aid depends on the other type of aid received. Columns III and IV show results from a specification where the two types of health aid are interacted. The results are consistent with a beneficial interactive effect,
27 The increased effectiveness of aid in the post-1990 era could also reflect changes in mechanisms of aid delivery towards system-wide and government led intervention in health, rather than the small and isolated projects typical of the early 1970s.

25
Table 10. Estimated Effect of Types of Health Aid on Infant Mortality, 1975–2004
as the negative association between basic health aid and infant mortality is strongest when countries receive a high amount of general health aid. To summarize, the effect of health aid did not vary across regions or over time, but there is some evidence that health aid has led to relatively larger reductions in infant mortality since 1990 and in countries with better policies and institutions. In addition, there is some evidence that different types of health aid may be complementary.
VI. OVERALL AID AND HEALTH OUTCOMES
One would expect that aid given specifically for health purposes should have a larger effect on health outcomes, since there is a greater probability that these resources are spent on health specific projects (as also suggested by Table A1b). However, there is a view that aid is fungible (Rajan and Subramanian 2005a), and to the extent that different types of aid are not tied to specific purposes, they primarily relax the government’s budget constraint, and should have similar effects on economic and social outcomes. In this section, we examine the effect of overall aid on health outcomes to assess whether there is something specific about “health aid” that affects health, and thus shed light on the degree to which health aid is as fungible as overall aid. Infant mortality The regression results for the impact of overall aid on infant mortality are shown in Table 11. Specification I shows the OLS regression results without country fixed effects. The estimated coefficient on lagged aid per capita is negative and statistically significant (at the 5 percent
Dependent variable
OLS System GMM OLS System GMM
Lagged Log General Health Aid Per Capita -0.0051 -0.0085* -0.0085** -0.0127*** (DAC 5 code=121) (0.004) (0.005) (0.004) (0.005)
Lagged Log Basic Health Aid Per Capita -0.0087** -0.0128** -0.0132*** -0.0204*** (DAC 5 code=122) (0.004) (0.006) (0.004) (0.006)
Lagged Log General Health Aid Per Capita interacted with -0.0054** -0.0078**Lagged Log Basic Health Aid Per Capita (0.003) (0.003)
Hansen Test: P-value 0.661 0.569AR2 test: P-value 0.734 0.801Number of Observations 465 465 465 465
The regressions include the same controls as in Table 1.One lag of predetermined and endogenous variables are used as instruments.***, ** and * denote significance at 1, 5, and 10 percent respectively.
Log Infant mortality rate (per 1000)

26
Table 11. Estimated Effect of Overall Aid on Infant Mortality, 1965–2004
level) in the OLS specification. The magnitude of -0.01 implies that a doubling of aid is associated with a one percent reduction in infant mortality. Specification II shows the GMM estimates, where the identification is based on the lags of aid. As with the health aid estimation, two and three period lagged levels of these variables are used as instruments in the difference equation whereas lagged and twice-lagged differences are used in the level equations. The estimated coefficients are also close to -0.01 but are no longer statistically significant in the GMM specifications. The Hansen’s test of over identifying restrictions passes and the hypothesis of no second order correlation in residuals cannot be rejected.
OLS System GMM Lagged Log Aid Per Capita -0.0100** -0.0139
(0.005) (0.011)
Lagged Log Infant Mortality 1.0343*** 1.0523*** (0.017) (0.035)
Lagged Log Per Capita Income -0.0267*** -0.0654*** (0.005) (0.020)
Lagged Log Population -0.0093*** -0.0117(0.003) (0.012)
Lagged Log Fertility Rate 0.0118 -0.0318(0.025) (0.036)
War Dummy 0.0183 -0.0098(0.012) (0.017)
HIV AIDS rate 0.0020*** 0.0011* (0.000) (0.001)
First Stage F-stat Hansen Test: P-value 0.274 AR1 Test: P-value 0.001 AR2 test: P-value 0.768 Number of Countries 118 118 Number of Observations 700 700
Standard errors are denoted in parentheses. The regressions include country and period fixed effects. All variables are averages over five year periods (except for war dummies).***, ** and * denote significance at 1, 5, and 10 percent respectively.In the GMM specification, the lags of aid per capita, infant mortality, population, fertility,and per capita GDP are treated as endogenous; two lags are used as instruments.
Dependent variable : Log Infant mortality rate (per 1000)

27
Table A8 shows that the estimated effect of overall aid on infant mortality shown in Table 11 is robust to using different lag structures as instruments. The Hansen’s test for over identifying restrictions and the AR2 test for no second order serial correlation pass in all the specifications. Table A9 shows weak evidence that overall aid is effective in reducing infant mortality over a 10-year period. However, the coefficient is insignificant or weakly significant in the system GMM specifications. We do not find any contemporaneous effect of overall aid in reducing infant mortality.28
Discussion of the results The estimated effects of overall aid are slightly more beneficial than the two previous studies that have examined this question, and far more precisely estimated than both. Boone (1996) using a fixed effects specification also finds a positive and statistically insignificant effect of aid on infant mortality with a coefficient estimate of 0.165 (se = 0.61). The estimated effect of aid on life expectancy in Boone is 0.079 (se = 1.38). Masud and Yontcheva (2005) look at the effect of bilateral aid on infant mortality and also find a positive but statistically insignificant effect in the fixed effects specification. The magnitude of the coefficient on bilateral aid per capita in Masud and Yontcheva (coeff = 0.006, se = 0.648) is closer to our estimate, but the standard errors in that paper are much higher. To summarize, we fail to find a robust effect of overall aid in reducing infant mortality. The effect is precisely estimated, relative to the two previous studies, and is close to zero.
VII. AID AND GOVERNMENT SPENDING
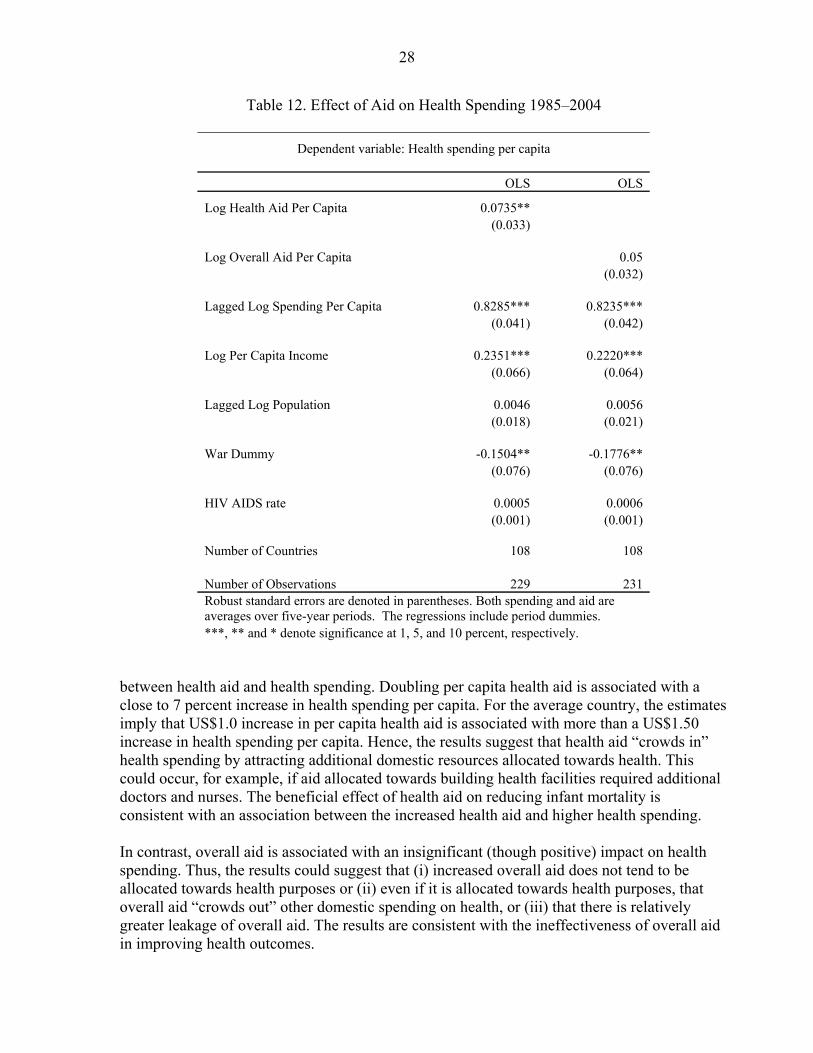
Why are overall aid inflows not significantly associated with reduced infant mortality while health aid inflows are? One possible explanation is that overall aid is not allocated towards increased health spending, while health aid is directed specifically towards health purposes. In other words, health aid may be less fungible than overall aid. In this section, we make a preliminary attempt to explore the effect of aid on health spending. Increased government spending on health is neither a necessary nor sufficient condition for a beneficial effect of aid on health outcomes. Nonetheless, aid advocates often argue that aid will help increase health spending, and higher spending is a natural channel by which higher overall aid might improve health. First, we estimate the relationship between health aid on health spending. Table 12 shows the results. Data on health spending come from the IMF’s fiscal database and are available only for four periods. Since the GMM estimates are unreliable in such a small sample, only the OLS estimates are shown.29 The OLS results suggest a positive and significant correlation 28 Table A10 shows the regression results for the impact of overall foreign aid on life expectancy. The coefficient is positive but statistically insignificant in all the specifications. The coefficient estimate of 0.004 in Specification II suggests that doubling per capita aid per capita raises life expectancy by 0.4 percent. 29 At least five periods are required in order to carry out the test for no autocorrelation in the residuals, which is a necessary condition for the consistency of GMM estimates.
28
Table 12. Effect of Aid on Health Spending 1985–2004
Dependent variable: Health spending per capita OLS OLS
Log Health Aid Per Capita 0.0735** (0.033) Log Overall Aid Per Capita 0.05 (0.032) Lagged Log Spending Per Capita 0.8285*** 0.8235*** (0.041) (0.042) Log Per Capita Income 0.2351*** 0.2220*** (0.066) (0.064) Lagged Log Population 0.0046 0.0056 (0.018) (0.021) War Dummy -0.1504** -0.1776** (0.076) (0.076) HIV AIDS rate 0.0005 0.0006 (0.001) (0.001) Number of Countries 108 108 Number of Observations 229 231 Robust standard errors are denoted in parentheses. Both spending and aid are averages over five-year periods. The regressions include period dummies. ***, ** and * denote significance at 1, 5, and 10 percent, respectively.
between health aid and health spending. Doubling per capita health aid is associated with a close to 7 percent increase in health spending per capita. For the average country, the estimates imply that US$1.0 increase in per capita health aid is associated with more than a US$1.50 increase in health spending per capita. Hence, the results suggest that health aid “crowds in” health spending by attracting additional domestic resources allocated towards health. This could occur, for example, if aid allocated towards building health facilities required additional doctors and nurses. The beneficial effect of health aid on reducing infant mortality is consistent with an association between the increased health aid and higher health spending. In contrast, overall aid is associated with an insignificant (though positive) impact on health spending. Thus, the results could suggest that (i) increased overall aid does not tend to be allocated towards health purposes or (ii) even if it is allocated towards health purposes, that overall aid “crowds out” other domestic spending on health, or (iii) that there is relatively greater leakage of overall aid. The results are consistent with the ineffectiveness of overall aid in improving health outcomes.
29
VIII. CAVEATS AND CONCLUSIONS
Although past studies have failed to document robust evidence that aid encourages economic growth, there remains hope among academics, policy makers, and the media that aid serves a critical role by saving lives. This hope is consistent with micro-level evidence of the success of specific public health intervention programs. In addition, economic growth plays a limited role in explaining changes in health outcomes, implying that focusing exclusively on the effect of aid on growth may overlook important health benefits from aid. Despite the vast empirical literature considering the effect of foreign aid on growth, the hope that aid improves health outcomes is backed by surprisingly little systematic evidence. The main contribution of this paper is to present new, systematic and comprehensive cross-country evidence on the effect of health aid on a key health outcome—infant mortality. To the best of our knowledge, this paper is the first empirical study to examine the effect of health aid on health outcomes. In a sample of 118 countries from 1970–2004, we find that increased health aid is associated with a statistically significant reduction in infant mortality. The estimated effect of doubling health aid is a 2 percent reduction in infant mortality rates, which is small relative to the goals envisioned by the MDGs. In contrast, we fail to find robust evidence for a significant effect of overall aid in reducing infant mortality. The results are consistent with suggestive evidence that unlike overall aid, health aid is associated with a statistically significant rise in health spending. The estimates of the effect of health aid on health outcomes need to be qualified because the health aid data are likely to suffer from underreporting. However, health aid is reported by donors, and there is no reason to believe that the cost of accurately reporting aid commitments depends on the recipient. Therefore, it is plausible that measurement error due to the underreporting of health aid is not systematically related to the characteristics of the recipient country. In this case, the estimated effect of health aid would be attenuated, and our estimates would understate the true beneficial effect of health aid. Second, in the GMM estimations, the effect of aid is identified using variation in a country’s aid history, while controlling for several predetermined variables. As with GMM estimates in general, this source of identification is biased if the initial conditions assumed by the model are violated (Bond, 2002). This could occur, for example, if donors’ aid decisions in the initial period partially reflected their expectations of the recipients’ economic and social conditions in the future. This concern is ameliorated to some extent by the failure to reject both the null hypotheses of no second order serial autocorrelation in the residuals, and the validity of over identifying moment conditions. Finally, the paper takes a cross-country approach to estimate the effect of foreign aid on health similar to the existing literature on aid and growth. Although the effect of aid is identified using within-country changes in aid and health outcomes over time, the estimated effect is nonetheless an average across a very heterogeneous set of countries. The use of cross-country data to address this question should therefore be considered as a first step, to be complemented by detailed case studies of the nature and effects of health aid in individual countries.

30
Appendix Tables
Table A1. List of CRS Purpose Codes DAC 5 CODE CRS CODE DESCRIPTION Clarifications / Additional notes on coverage 120 HEALTH
121 Health, generalHealth policy and administrative management Health sector policy, planning and programmes; aid to health ministries,
public health administration; institution capacity building and advice; medical insurance programmes; unspecified health activities.
12181 Medical education/training Medical education and training for tertiary level services.
12182 Medical research General medical research (excluding basic health research).
Medical services Laboratories, specialised clinics and hospitals (including equipment and supplies);
ambulances; dental services; mental health care; medical rehabilitation; control of non-infectious diseases; drug and substance abuse control [excluding narcotics traffic control (16063)].
122 Basic health12220 Basic health care Basic and primary health care programmes; paramedical and nursing care programmes;
supply of drugs, medicines and vaccines related to basic health care.
12230 Basic health infrastructure District-level hospitals, clinics and dispensaries and related medical equipment; excluding specialised hospitals and clinics (12191).
Basic nutrition Direct feeding programmes (maternal feeding, breastfeeding and weaning foods,
child feeding, school feeding); determination of micro-nutrient deficiencies; provision of vitamin A, iodine, iron etc.; monitoring of nutritional status; nutrition and food hygiene education; household food security.
12250 Infectious disease control Immunisation; prevention and control of malaria, tuberculosis, diarrheal diseases, vector-borne diseases (e.g. river blindness and guinea worm), etc.
12261 Health education Information, education and training of the population for improving health knowledge and practices; public health and awareness campaigns.
12281 Health personnel development Training of health staff for basic health care services.
Source. OECD, Development Assistance Committeehttp://www.oecd.org/document/21/0,2340,en_2649_34469_1914325_1_1_1_1,00.html
12110
12191
12240

31
Table A2. Description of Major CRS Purposes
Donor Recipient Short descritption Percent of total
1 Multiple Multiple Health Policy & Admin. Management 8.32 IDA India Up Health Systems Development 2.93 United Kingdom Pakistan National Health Facility 2.64 Multiple Multiple Health Sector Support Project 2.45 IDA India Tamil Nadu Health Systems Project 2.46 IDA Indonesia Provincial Health 2.17 IDA Ghana Second Health Sector Program Support Project 2.18 IDA Indonesia Health, Nutrition & Population 2.19 Netherlands Ghana Support To The Ghanaian Ministry Of Health:Implementat Prog. Of Work 2.0
10 IDA India Rajasthan Health Systems Development Project 1.911 Multiple Multiple Other 71.1
1 Multiple Multiple Basic Health Care 11.42 IDA Nigeria Health Systems Development Project 4.43 United Kingdom India Healthy Life Services Guarantee Scheme: Basic Health Care 3.04 UNICEF Multiple Young Child Health 1.85 IDA India Food And Drugs Capacity Building Project 1.76 Australia Papua New Guinea Basic Health Services Support Program 1.67 United States Multiple Child Survival & Health Programs Fund 1.68 Denmark Tanzania Support To Health Sector Strategic Plan Through Basket Funds 1.59 UNICEF Multiple Health, General 1.5
10 Multiple Ghana and Uganda Health Sector Programme 1.511 Multiple Multiple Other 70
1 IDA India Immunization Strengthening Program 5.82 United Kingdom India Pulse Polio 5.43 United States Multiple Polio Immunizations In-Country Activities 3.84 IDA India India Immunization Strengthening Project 3.05 EC Nigeria Prime-Partnership To Reinforce Immunization 2.86 United Kingdom India Polio Eradication Programme 2.67 United Kingdom Multiple Human Disease Control 2.58 Multiple Multiple Polio Eradication 2.19 United Kingdom China China: Projects/Health 1.8
10 United Kingdom Kenya Basic Health: Social Marketing 1.811 Multiple Multiple Other 68.5
Basic Health Care, 2000-04
Health Policy and Administrative Management, 2000-04
Infectious Disease Control, 2000-04
Table A3. List of Variables and Data Sources
Variable Source
Infant Mortality (per 1000 live births) UN, 2004Life Expectancy (years) UN, 2004Aid ('03 $) OECD DAC Health Aid ('03 $) OECD CRSPopulation IMF, World Economic Outlook, 2006Wars Heidelberg Institute for International Conflict Research and World BankInstituional quality index (CPIA) World BankPer capita GDP ('03 $) World Bank, WDI, 2006Health Spending ($) IMF Fiscal Affairs DepartmentHIV AIDS (cases per 100,000) Papageorgiou and Stoytcheva, 2006Fertility (children per woman) UN, 2004Female Literacy (percentage of females age 15 and above) World Bank, WDI, 2006Prevalence of undernourishment (percentage of population) World Bank, WDI, 2006Number of phsicians per 1000 people World Bank, WDI, 2006Improved water source (% of population with access) World Bank, WDI, 2006Improved sanitation facilities (% of population with access) World Bank, WDI, 2006

32
Table A4. Countries in Sample
Country Observations Country Observations Country Observations
Albania 2 Hungary 2 South Africa 2Algeria 2 India 6 Sri Lanka 6Angola 5 Indonesia 6 Sudan 5
Argentina 6 Iran 1 Swaziland 4Armenia 2 Iraq 1 Syria 3
Azerbaijan 2 Jamaica 4 Tajikistan 2Bangladesh 6 Jordan 5 Tanzania 6
Belarus 2 Kazakhstan 2 Thailand 6Benin 6 Kenya 6 Togo 5
Bolivia 5 Kyrgyzstan 2 Trinidad And Tobago 3Bosnia 2 Lao Pdr 5 Tunisia 6
Botswana 4 Latvia 2 Turkey 6Brazil 5 Lebanon 5 Turkmenistan 2
Bulgaria 1 Lesotho 4 Uganda 5Burkina Faso 5 Liberia 2 Ukraine 2
Burundi 5 Libya 1 Uruguay 5Cambodia 3 Lithuania 2 Uzbekistan 2Cameroon 5 Macedonia 1 Venezuela 2
Central African Republic 6 Madagascar 6 Vietnam 5Chad 5 Malawi 5 Yemen 2Chile 4 Malaysia 4 Zambia 5China 4 Mali 5 Zimbabwe 3
Colombia 5 Mauritania 6 465Congo, Dem. Rep. Of 6 Mauritius 5
Congo, Rep Of 6 Mexico 3Costa Rica 3 Moldova 2
Cote D'Ivoire 5 Mongolia 1Croatia 2 Morocco 4
Cuba 3 Mozambique 5Czech Republic 1 Myanmar 6
Dominican Republic 5 Nepal 5Ecuador 5 Nicaragua 6
Egypt 5 Niger 5El Salvador 5 Nigeria 5
Eritrea 2 Oman 2Estonia 2 Pakistan 6
Ethiopia 6 Panama 5Fiji 4 Papua New Guinea 3
Gabon 4 Paraguay 6Gambia 4 Peru 6Georgia 2 Philippines 5
Ghana 5 Poland 2Guatemala 5 Romania 2
Guinea 5 Russia 2Guinea-Bissau 4 Rwanda 4
Guyana 2 Senegal 5Haiti 6 Sierra Leone 5
Honduras 5 Slovakia 1
33
Table A5. Sample Summary Statistics
Observations Mean Standard Deviation
Infant Mortality (per 1000 live births) 465 72.75 42.94Life Expectancy (in year) 465 59.01 10.58Lagged per capita health aid ('03 $) 465 1.67 2.43Lagged per capita overall aid ('03 $) 465 48.61 56.52War Dummy 465 0.09 0.29HIV AIDS rate (reported cases per 100,000 people) 465 4.22 11.67Lagged CPIA 465 2.90 1.32Lagged Per Capita Income ('03 $) 465 1,279.5 1,484.6Lagged Population 465 4.E+07 1.E+08Lagged Fertility Rate (children per woman) 465 4.88 1.83Lagged Female Literacy (percentage of females age 15 and above) 465 40.81 36.74Lagged Percent of Population Malnourished 455 21.01 16.01Lagged Physicians per 1000 460 0.73 1.01Lagged Percent of Population with Sanitation Access 453 53.71 25.95Lagged Percent of Population with Water Access 455 72.16 19.46Per Capita Health spending (in '03 $) 297 35.12 59.36
Table A6. Estimated Effect of Health Aid on Infant Mortality, Alternative Truncation Threshold on Health AidPercentile of Health Aid
OLS Sys GMM OLS Sys GMM OLS Sys GMM OLS Sys GMM Lagged Log Health Aid Per Capita -0.0046 -0.0069* -0.0059 -0.0102** -0.0096** -0.0172*** -0.0121** -0.0235***
0.003 0.004 0.004 0.005 0.005 0.006 0.005 0.008
Hansen Test: P-value 0.303 0.371 0.408 0.479 AR2 test: P-value 0.738 0.704 0.731 0.697 Number of Countries 118 118 118 118 118 118 118 118 Number of Observations 465 465 465 465 465 465 465 465
The controls are the same as Table 1. The alternative specifications show the results when we truncate the health aid series at various percentiles.***, ** and * denote significance at 1, 5 and 10 percent respectively.
$00
$0.0510 20
$0.17 $0.3930

34
Table A7. Estimated Effect of Health Aid on Infant Mortality Without Lagged Controls
Dependent variable :
no controls with controls
Lagged Log Health Aid Per Capita 0.1403*** -0.0110**(0.029) (0.005)
Lagged Log Infant Mortality 1.0408***(0.019)
Lagged Log Per Capita Income -0.0169***(0.006)
Lagged Log Population -0.0094***(0.003)
Lagged Log Fertility Rate 0.028(0.029)
War Dummy 0.3351*** 0.0053(0.095) (0.013)
HIV AIDS rate 0.0068** 0.0021***(0.003) (0.000)
Number of Countries 118 118 Number of Observations 465 465
See notes to Table 1.***, ** and * denote significance at 1, 5 and 10 percent respectively.
OLS
Log Infant mortality rate (per 1000)

35
Table A8. Estimated Effect of Overall Aid on Infant Mortality: GMM Robustness Check
Number of lags 1 2 3 4 All Dependent variable :
Lagged Log Aid Per Capita -0.0043 -0.0139 -0.0154 -0.0142 -0.015(0.011) (0.011) (0.009) (0.010) (0.010)
Hansen Test: P-value 0.14 0.274 0.254 0.329 0.353AR2 test: P-value 0.786 0.768 0.792 0.767 0.764Number of Instruments 81 103 103 103 103Number of Countries 118 118 118 118 118Number of Observations 700 700 700 700 700
See notes to Table 11. This table repeats the System GMM-Lags specification in Table 11 with different lags.
Log Infant Mortality (per 1000)
Table A9. Estimated Effect of Overall Aid on Infant Mortality 1965–2004: Short-Run vs. Long-Run Effect
Dependent variable
OLS System GMM
Current Log Aid Per Capita -0.0073 -0.0025(0.005) (0.012)
First stage F stat Hansen Test: P-value 0.4
AR2 test: P-value 0.59Number of countries 118 118
Number of observations 697 697
Twice Lagged Aid Per Capita -0.0162*** -0.0230*(0.005) (0.013)
First stage F stat Hansen Test: P-value 0.233
AR2 test: P-value 0.73Number of countries 118 118
Number of observations 617 617
The controls are the same as in Table 11. See notes to Table 11.***, ** and * denote significance at 1, 5, and 10 percent respectively.
Log Infant mortality rate (per 1000)

36
Table A10. Estimated Effect of Overall Aid on Life Expectancy 1965–2004
Dependent variable : Log Life Expectancy (in years) OLS System GMM Lagged Log Aid Per Capita 0.0016 0.0042 (0.002) (0.004) Lagged Log Life Expectancy 0.9437*** 0.9937*** (0.040) (0.060) Lagged Log Per Capita Income 0.004 0.0041 (0.004) (0.008) Lagged Log Population 0.0021 0.0105* (0.001) (0.006) War Dummy -0.0149*** -0.0117** (0.006) (0.005) HIV AIDS rate -0.0019*** -0.0017*** (0.000) (0.000) First Stage F-stat Hansen Test: P-value 0.296 AR1 Test: P-value 0.044 AR2 test: P-value 0.968 Number of Countries 118 118 Number of Observations 700 700 Standard errors are denoted in parentheses. The regressions include country and period fixed effects. All variables are averages over five year periods (except for war dummies). ***, ** and * denote significance at 1 percent, 5 percent, and 10 percent respectively. In GMM specification, lagged aid per capita, lagged life expectancy, lagged population, lagged fertility, and lagged per capita GDP are treated as endogenous.
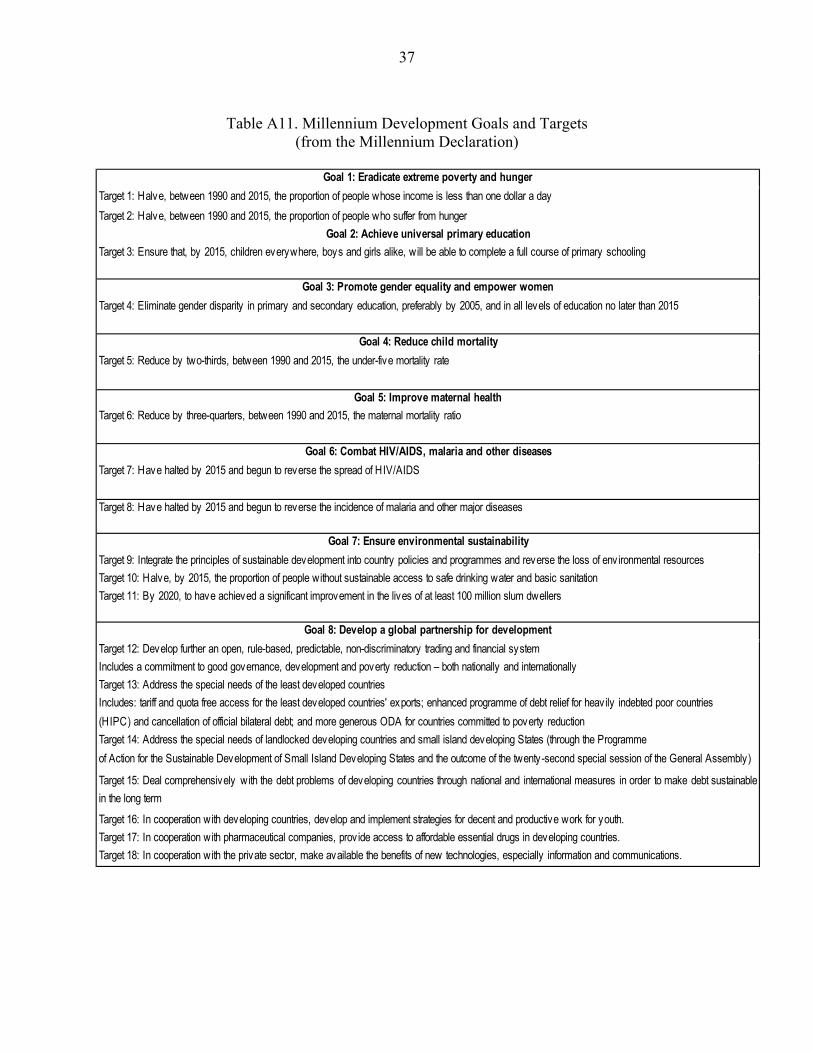
37
Table A11. Millennium Development Goals and Targets
(from the Millennium Declaration)
Goal 1: Eradicate extreme poverty and hungerTarget 1: Halve, between 1990 and 2015, the proportion of people whose income is less than one dollar a dayTarget 2: Halve, between 1990 and 2015, the proportion of people who suffer from hunger
Goal 2: Achieve universal primary educationTarget 3: Ensure that, by 2015, children everywhere, boys and girls alike, will be able to complete a full course of primary schooling
Goal 3: Promote gender equality and empower womenTarget 4: Eliminate gender disparity in primary and secondary education, preferably by 2005, and in all levels of education no later than 2015
Goal 4: Reduce child mortalityTarget 5: Reduce by two-thirds, between 1990 and 2015, the under-five mortality rate
Goal 5: Improve maternal healthTarget 6: Reduce by three-quarters, between 1990 and 2015, the maternal mortality ratio
Goal 6: Combat HIV/AIDS, malaria and other diseasesTarget 7: Have halted by 2015 and begun to reverse the spread of HIV/AIDS
Target 8: Have halted by 2015 and begun to reverse the incidence of malaria and other major diseases
Goal 7: Ensure environmental sustainabilityTarget 9: Integrate the principles of sustainable development into country policies and programmes and reverse the loss of env ironmental resourcesTarget 10: Halve, by 2015, the proportion of people without sustainable access to safe drinking water and basic sanitationTarget 11: By 2020, to have achieved a significant improvement in the lives of at least 100 million slum dwellers
Goal 8: Develop a global partnership for developmentTarget 12: Develop further an open, rule-based, predictable, non-discriminatory trading and financial systemIncludes a commitment to good governance, development and poverty reduction – both nationally and internationallyTarget 13: Address the special needs of the least developed countriesIncludes: tariff and quota free access for the least developed countries' exports; enhanced programme of debt relief for heavily indebted poor countries (HIPC) and cancellation of official bilateral debt; and more generous ODA for countries committed to poverty reductionTarget 14: Address the special needs of landlocked developing countries and small island developing States (through the Programmeof Action for the Sustainable Development of Small Island Developing States and the outcome of the twenty-second special session of the General Assembly)
Target 15: Deal comprehensively with the debt problems of developing countries through national and international measures in order to make debt sustainablein the long term
Target 16: In cooperation with developing countries, develop and implement strategies for decent and productive work for youth.Target 17: In cooperation with pharmaceutical companies, prov ide access to affordable essential drugs in developing countries.Target 18: In cooperation with the private sector, make available the benefits of new technologies, especially information and communications.

38
References
Arellano, Manuel, and Stephen Bond, 1991, “Some Tests for Specification for Panel Data: Monte Carlo Evidence and an Application to Employment Equations,” Review of Economic Studies, 58 (2), pp. 277–97.
Bauer, Peter, 1982, “The Effect of Aid,” Encounter. ———, 1971, Dissent on Development (London: Weidenfield and Nicholson). Bloom, David, Canning, David, and Dean Jamison, 2004, “Health, Wealth and Welfare,”
Finance and Development, 41, No. 1 (March), pp. 10–15. Blundell, Richard, and Stephen Bond, 2000, “GMM Estimation with Persistent Panel Data, An
Application to Production Functions,” Econometric Reviews, 19, pp. 321–40. Boone, Peter, 1996, “Politics and the Effectiveness of Foreign Aid,” European Economic
Review, Vol. 40, Issue 2 (February), pp. 289–329. Bond, Stephen, 2002, Dynamic Panel Data Models: A Guide to Micro Data Methods and
Practice,” Portuguese Economic Journal, Vol. 1, pp. 141–62. Bongaarts, John, 1987, “Does Family Planning Reduce Infant Mortality Rates?” Population and
Development Review, 13 (2), pp. 323–34. Bourguignon, Francoise, and Danny Leipziger, 2006, “Aid, Growth and Poverty Reduction,
Toward a New Partnership Model,” mimeo, World Bank. Burnside, Craig, and David Dollar, 2000, “Aid, Policies, and Growth,” American Economic
Review, 90 (4), pp. 847–68. Clemens, Michael, Steven Radelet, and Rikhil Bavnani, 2004, “Counting Chickens when they
Hatch: The Short-term Effect of Aid on Growth,” CGD working paper no. 44, Center for Global Development, Washington, DC.
Cutler, David, Angus Deaton, and Adriana Lleras–Muney, 2006, “The Determinants of
Mortality,” NBER Working Paper No. 11963 (Cambridge, Massachusetts: National Bureau of Economic Research).
Deaton, Angus, 2006, “Global Patterns of Income and Health. Facts, Interpretations and
Policies,” NBER Working Paper No. 12735 (Cambridge, Massachusetts: National Bureau of Economic Research).
Development Assistance Committee, 2002, “Reporting Directives for the Creditor Reporting
System,” OECD.

39
Easterly, William, 1999, “Life During Growth,” Journal of Economic Growth, Vol. 4 Issue 3 (September), pp. 239–75.
Filmer, Deon, and Lant Pritchett, 1999, “The Impact of Public Spending on Health: Does Money
Matter?” Social Science & Medicine, Vol. 49 (November), pp. 1309–23. Fogel, Robert W., 1994, “Economic Growth, Population Theory and Physiology: The Bearing of
Long Term Processes on the Making of Economic Policy,” American Economic Review, Vol. 84, No. 3, pp. 369–95.
Friedman, Milton, 1958, “Foreign Economic Aid,” Yale Review, Vol. 47, pp. 500–16. Hadi, Ali, 1992, “Identifying Multiple Outliers in Multivariate Data,” Journal of the Royal
Statistical Society, Series B, 54, pp. 761–71. International Monetary Fund, 2006, World Economic Outlook (Washington: International
Monetary Fund). Kanbur, Ravi, et. al., 1999, The Future of Development Assistance: Common Pool and
International Public Goods (Washington: Overseas Development Council). Kristof, Nicholas, 2006, ''Foreign Aid Has Flaws. So What?'' The New York Times, June 13. LeGrand, Thomas, and James Phillips, 1996, “The Effect of Fertility Reductions on Infant and
Child Mortality: Evidence from Matlab in Rural Bangladesh,” Population Studies, 50, pp. 51–68.
Levine, Ruth, and the What Works Working Group, 2004, “Millions Saved, Proven Successes in
Global Health,” (Washington: Center for Global Development). Masud, Nadia, and Boriana Yontcheva, 2005, “Does Foreign Aid Reduce Poverty? Empirical
Evidence from Nongovernmental and Bilateral Aid,” IMF Working Paper 05/100 (Washington: International Monetary Fund).
Papageorgiou, Chris, and Petia Stoytcheva, 2006, “What Do We Know About the Impact of
AIDS on Cross-Country Income So Far?” Departmental Working Papers 2005-01, Department of Economics, Louisiana State University.
Pritchett, Lant, and Lawrence Summers, 1996. “Wealthier is Healthier,” Journal of Human
Resources, Vol. 31 No. 4 (Autumn), pp. 841–68. Rajan, Raghuram, and Arvind Subramanian, 2005a, “Aid and Growth: What Does the Cross-
Country Evidence Really Show?” IMF Working Paper 05/127 (Washington: International Monetary Fund).
40
———, 2005b, “What Undermines Aid’s Impact on Growth?” IMF Working Paper 05/126. (Washington: International Monetary Fund).
Reddy, Sanjay and Camelia Minoiu, 2006, "Development Aid and Economic Growth: A Positive
Long-Run Relation," SSRN working paper, http://ssrn.com/abstract=903865. Roodman, David, 2004, “The Anarchy of Numbers: Aid, Development and Cross–Country
Empirics,” Working Paper No. 32 (Washington: Center for Global Development). ———, 2005, “Xtabond2: Stata module to extend xtabond dynamic panel data estimator,”
Statistical Software Components, Boston College Department of Economics. Sachs, J., 2005, The End of Poverty: Economic Possibilities for Our Time (New York: Penguin
Press). United Nations, 2004, Demographic Yearbook. Wagstaff, Adam, 2000, “Socioeconomic Inequalities in Child Mortality: Comparisons across
Nine Developing Countries,” Bulletin of the World Health Organization, Vol. 78, pp. 19–29.
Wolpin, Kenneth, 1997, “Determinants and Consequences of the Mortality and Health of Infants
and Children,” in Handbook of Population and Family Economics, ed. by M. Rosenzweig and O. Stark (Amsterdam: Elsevier).
World Bank, 2006, World Development Indicators (Washington: World Bank). World Health Organization, 1999, The World Health Report, 1999: Making a Difference,
(Geneva: World Health Organization). ———, 2006, World Health Organization Mortality Database. Younger, Stephen, 1992, “Aid and the Dutch Disease: Macroeconomic Management When
Everybody Loves You,” World Development, Vol. 20, No. 1.