Headwinds on the Road to Zero and the Promise of New ... Headwinds on the Road to Zero and the...
45
iihs.org Headwinds on the Road to Zero and the Promise of New Technology Advancing Safety through Data November 2, 2017 Detroit, Michigan Adrian Lund, Ph.D. President, IIHS and HLDI
Transcript of Headwinds on the Road to Zero and the Promise of New ... Headwinds on the Road to Zero and the...

iihs.org
Headwinds on the Road to Zero and the Promise of New Technology
Advancing Safety through DataNovember 2, 2017
Detroit, Michigan
Adrian Lund, Ph.D.
President, IIHS and HLDI
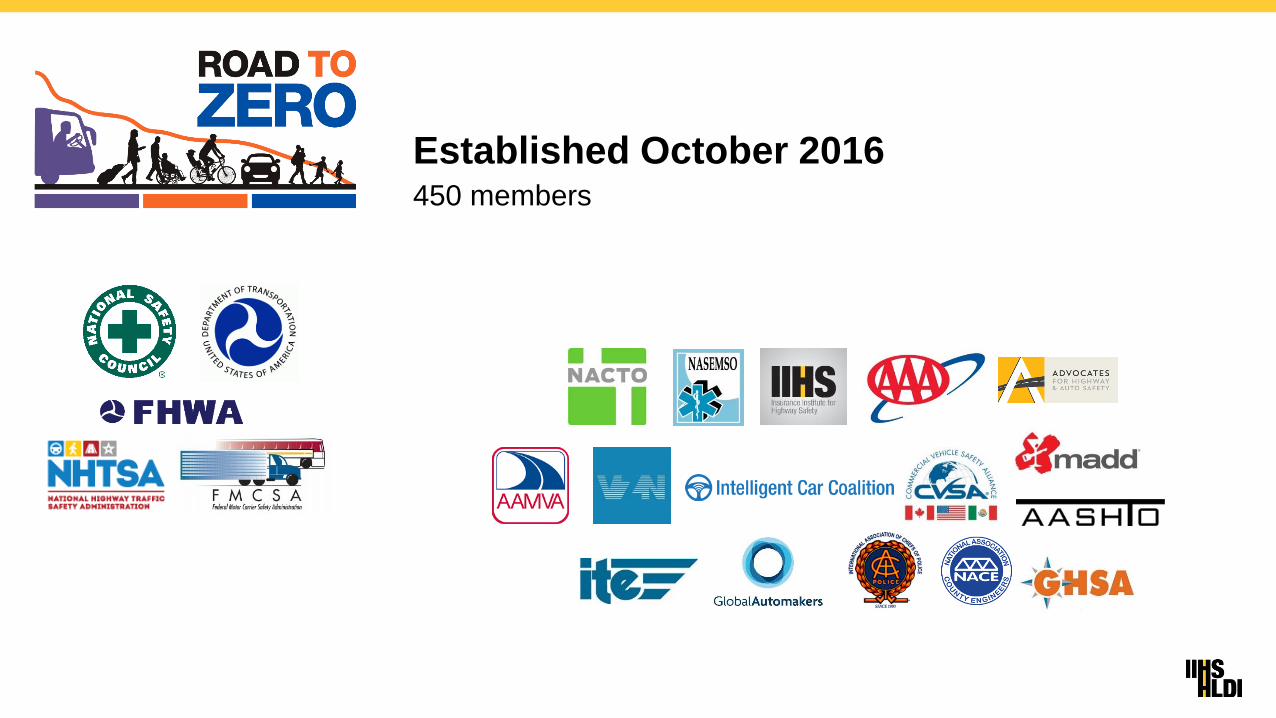
Established October 2016450 members

Motor vehicle
crash deaths have
declined significantly
in the U.S. during
the past 50+ years.
30,000
35,000
40,000
45,000
50,000
55,000
60,000
1950 1960 1970 1980 1990 2000 2010 20160
10
20
30
40
50
60
70
80
Motor vehiclecrash deaths
Crash deaths perbillion vehicle miles traveled
201637,461 deaths
11.8 per billion
U.S. motor vehicle crash deaths and deaths
per billion vehicle miles traveled
1950-2016

Automakers can take pride in that much of the improved safety in recent years is due to vehicle designs

40
60
80
100
120
140
160
180
1985 1987 1989 1991 1993 1995 1997 1999 2001 2003 2005 2007 2009 2011
Calendar year
Actual rates
Expected rates
Vehicle and non-vehicle factors and highway safetyPassenger vehicle driver deaths per million vehicles, actual vs. expected for 1985 fleet
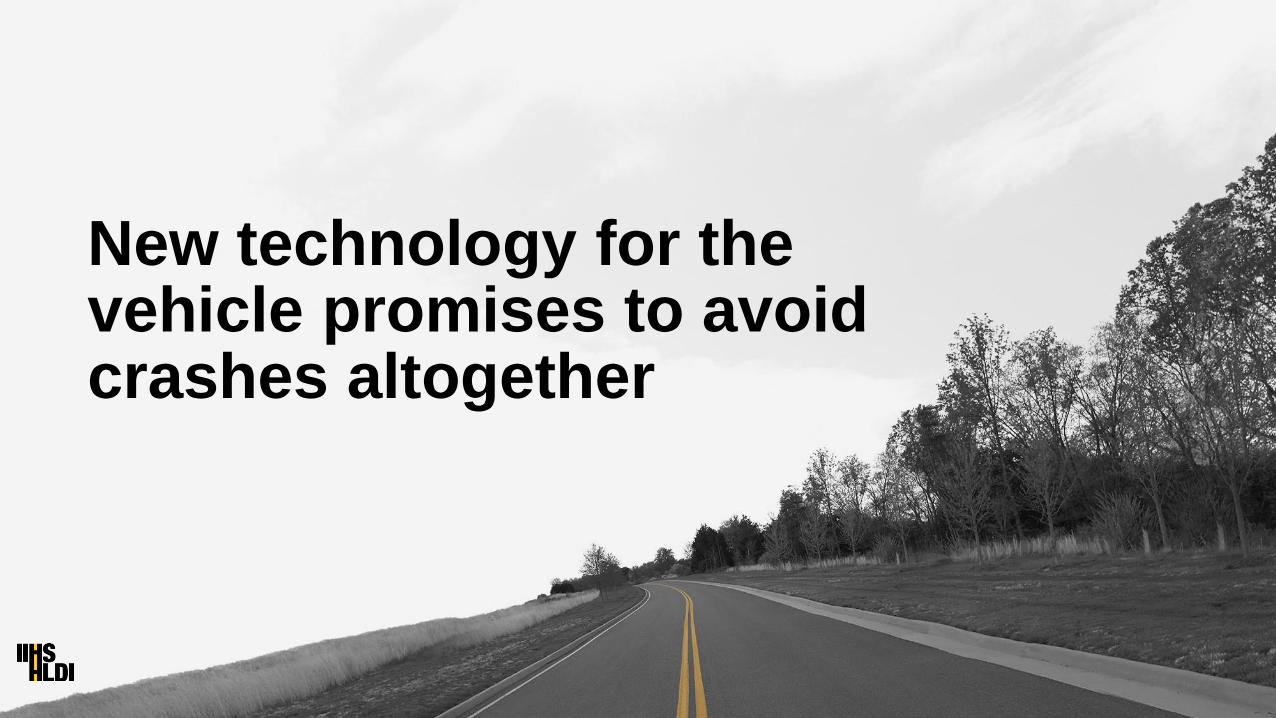
New technology for the vehicle promises to avoid crashes altogether
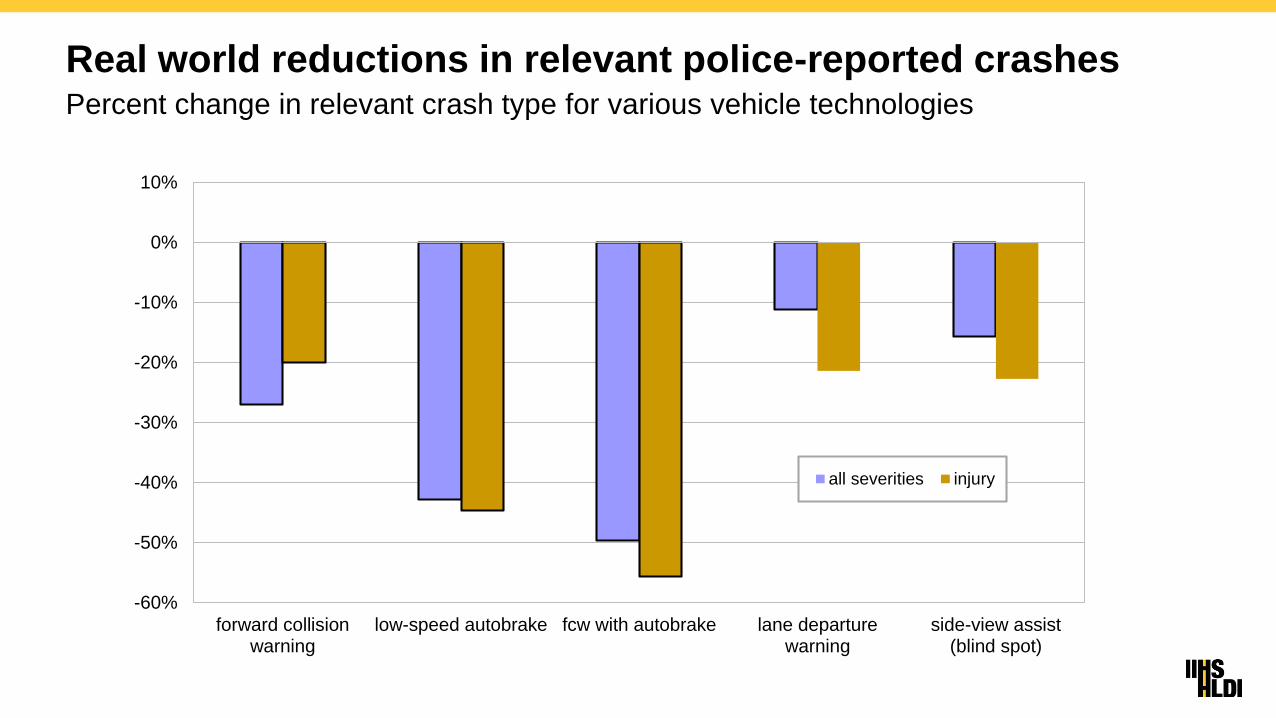
Real world reductions in relevant police-reported crashesPercent change in relevant crash type for various vehicle technologies
-60%
-50%
-40%
-30%
-20%
-10%
0%
10%
forward collisionwarning
low-speed autobrake fcw with autobrake lane departurewarning
side-view assist(blind spot)
all severities injury

20 automakers have committedto make AEB a standard feature
by September 2022
99+% of U.S. market

Kia plans fully driverless cars by 2030-The Detroit News, January 4, 2016
Two auto suppliers join for self-driving cars by 2019-USA Today, August 23, 2016
BMW Group, Intel and Mobileye team up to bring
fully autonomous driving to streets by 2021-Reuters, July 1, 2016
Ford targets fully autonomous vehicle for ride sharing in 2021;
invests in new tech companies, doubles Silicon Valley team-Ford media center, August 16, 2016
Lyft predicts mostly self-driving cars by 2021-New York Post, September 19, 2016

The promise and the reality of advanced safety technology

Driver acceptance and safe useof automated systems
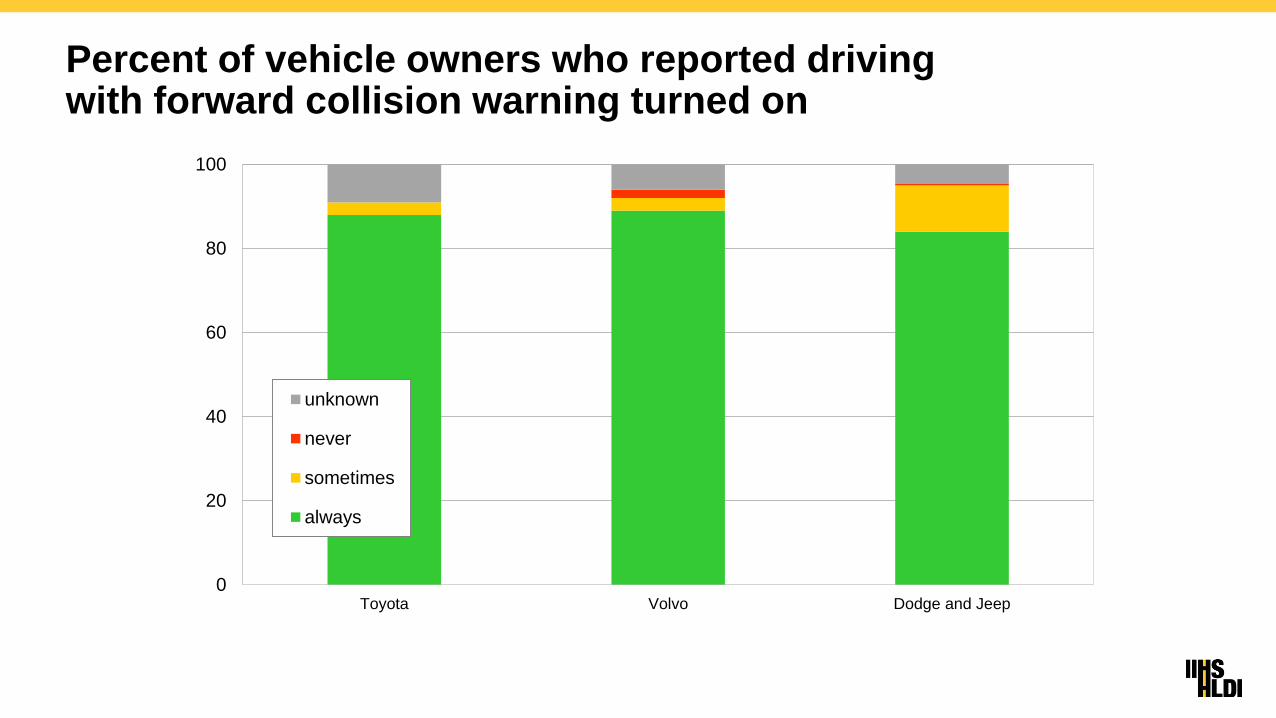
Percent of vehicle owners who reported driving with forward collision warning turned on
0
20
40
60
80
100
Toyota Volvo Dodge and Jeep
unknown
never
sometimes
always

On-off status of front crash prevention systemsBy manufacturer
percent with
system on
number
observed
Cadillac 92 206
Chevrolet 87 142
Honda 98 239
Lexus 50 8
Mazda 95 20
Volvo 94 52
total 93 667

Percent of vehicle owners who reported driving with lane-maintenance systems turned on
0
20
40
60
80
100
Volvolane departure warning
Infinitilane departure warning
Infinitilane departure prevention
Toyotalane departure prevention
unknown
never
sometimes
always

On-off status of lane-maintenance systemsBy manufacturer
percent with
system on
number
observed
Cadillac 57 207
Chevrolet 50 147
Ford/Lincoln 21 115
Honda 36 239
Lexus/Toyota 68 147
Mazda 77 26
Volvo 75 105
total 51 986

Active lane keeping ranked least in trustAverage rating and 95% confidence interval by system
side-view assist
(Honda, Audi, Infiniti)
lane departure warning
forward collision warning
active lane keeping
(Honda, Audi)
adaptive cruise control
strongly
disagree
disagree neutral agree strongly
agree

Technologies had different problem areasPercentage of drivers by complaint type
0
20
40
60
80
adaptive cruisecontrol
active lane keeping lane departurewarning
forward collisionwarning
side view assist
“You have to get in a wrestling match for control of
the wheel on curves.”
Participant 121SA
“I did not feel well notified by the system of when it
was on and had been working, but no longer could
identify the lines.”
Participant 329SV
“On highways this worked well, but … the constant
pressure in one direction was fatiguing.”
Participant 301SV
functionality and performance user interface circumstance none

Level 2 automated driving experience - issues

Lost lane linesOn-road testing of Tesla “Autopilot” 7.1 (hardware version 1)

Stopped lead vehicleOn-road testing – 2017 Mercedes-Benz E-Class

A potential role for Advancing Safety through Data

The importance of dataHeidi King, NHTSA Deputy Administrator, Automotive News, October 23, 2017
"To fulfill the promise of automated driving systems, we must give our full
consideration to safety in the testing and development of these vehicles."
"That means rigor, being transparent, learning from one another and broadening
public understanding, not only of these vehicles potential benefits, but how safety
is being addressed in their development and testing."

The Advancing Safety through Data consortium role
Develop a common database that can be searched by VIN for specific automated features
– Crash avoidance features
– Automated driving features
By level of automation
By operational domain
A standardized database across different automakers at time of manufacture would
– Facilitate answers to public questions about the safety of these features on the road
– Make it easier to share lessons learned across automakers
– Be free of privacy concerns as the vehicle has not yet been sold
Make database available to third parties through
– The ASD consortium
– NHTSA
– IIHS/HLDI

Vehicle identification number is critical for evaluating the safety of driving automation technology
Safety benefits of vehicle features can be assessed when tied to crash and
exposure data
VIN standard requires certain information to be encoded
– Driver assistance technology and automated driving systems are not included
Manufacturers can supply information linking VIN to vehicle features
Vehicle registration, police crash reports, and insurance claim data can be
connected using VIN
VIN shown to be key for evaluating the effects of driver assistance systems
on police-reported crashes and insurance claims

NHTSA should create a
public VIN-indexed
database listing vehicles
equipped with automated
driving systems

And EDR information for after the crashAdvancing Safety through Data
Already looking at sharing of information from current sources
– Warranties
– Early warning system
– Relevant information from EDRs
Develop an agreed-upon set of data elements for EDRs that would
– Enable crash investigators to determine whether and which advanced features were engaged at the time of
the crash
– Facilitate understanding of crash etiology
Publicly available tools for downloading information from the EDRs by
– ASD
– NHTSA
– Research organizations
– Insurers

Why is this important?Other Headwinds on the Road to Zero

Headwinds on the Road to Zero--The economy

Motor vehicle
crash deaths have
declined significantly
in the U.S. during
the past 50+ years.
30,000
35,000
40,000
45,000
50,000
55,000
60,000
1950 1960 1970 1980 1990 2000 2010 20160
10
20
30
40
50
60
70
80
Motor vehiclecrash deaths
Crash deaths perbillion vehicle miles traveled
201637,461 deaths
11.8 per billion
U.S. motor vehicle crash deaths and deaths
per billion vehicle miles traveled
1950-2016

30,000
35,000
40,000
45,000
50,000
55,000
60,000
1950 1960 1970 1980 1990 2000 2010 2015
Motor vehicle crash deaths
20%
U.S. motor vehicle crash deaths and unemployment rate1950-2015
20155% rate
35,092 deaths
Unemployment rate
10%
15%
0%
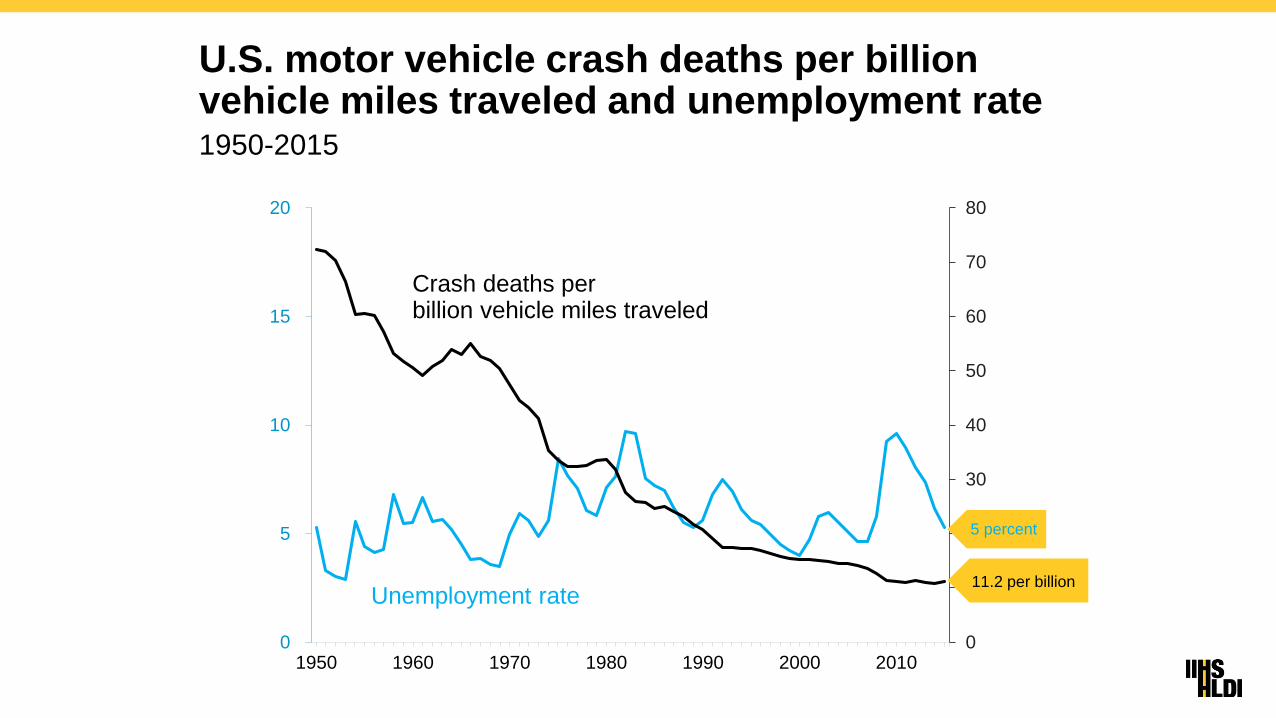
U.S. motor vehicle crash deaths per billion vehicle miles traveled and unemployment rate1950-2015
0
10
20
30
40
50
60
70
80
0
5
10
15
20
1950 1960 1970 1980 1990 2000 2010
Unemployment rate
Crash deaths perbillion vehicle miles traveled
11.2 per billion
5 percent

1950 1960 1970 1980 1990 2000 2010
Crash deaths perbillion vehicle miles traveled
Unemployment rate
Change in U.S. motor vehicle crash deaths per billion miles traveled and unemployment rate1950-2015
20%
15%
10%
5%
0%
-5%
-10%
-15%
-20%
80%
40%
0%
-40%
-80%

Motor vehicle crash deaths, 1990-2015With projections for 2016-24
30,000
35,000
40,000
45,000
1990 1995 2000 2005 2010 2015 2020
motor vehicle crash deaths
if unemployment remains steady at 4.9
if unemployment declines by 1.7% each year
if unemployment declines by 8.0% each year

Headwinds on the Road to Zero
--Rising speed limits

Maximum speed limitsOctober 2017
MD
DE
DC
MA
OR
RI
NJ
NH
ME
PA
WV
SC
GA
FL
OH
MI
INIL
WI
IA
MO
LA
NM
CO
SD
ID
CA
WA
TN
VT
MS
MT ND
NV
AZ
UT
WY
NE
KS
OK
TX
AR
AL
KY VA
NY
CT
AKHI
NC
MN
70 mph
75 mph
80 mph
85 mph
65 mph
60 mph
55 mph (DC only)

Effects of National Maximum Speed Limit
55 mph NMSL
– 3,000-5,000 fewer deaths in 1974
– 2,000-4,000 fewer deaths in 1983
Partial repeal
– 19 percent increase in deaths on rural interstates
– 2,000 more deaths during 1987-90
Full repeal
– 17 percent increase in fatality rates on interstates
– 1,000 more deaths during 1996-97
– 12,545 more deaths during 1995-2005

Deaths and expected deaths if maximum speed limits had not increased1993-2013
28,000
32,000
36,000
40,000
44,000
1993 1995 1997 1999 2001 2003 2005 2007 2009 2011 2013
deaths
expected
1,900deaths
33,000 deaths

Legalizing recreational use of marijuana
--Another headwind?

Combined evaluation of legal recreational-use states
MD
DE
DC
MA
OR
RI
NJ
NH
ME
PA
WV
NC
SC
GA
FL
OH
MI
IL
WI
IA
MO
LA
NM
CO
SD
ID
CA
WA
TN
VT
MS
MT ND
NV
AZ
UT
WY
NE
KS
OK
TX
AR
MN
AL
KY VA
NY
CT
AKHI
IN
study states
control states
correlation with CO
correlation with WA
correlation with OR
0.480.380.70
0.610.440.58
0.690.550.68
0.540.680.80
0.530.530.55

Collision claims after legalization of recreational marijuana useCombined analysis of Colorado, Oregon, and Washington – HLDI 2017
study states Colorado, Washington, Oregon
additional control states Idaho, Montana, Nevada, Utah, Wyoming
calendar years January 2012-October 2016
exposure49,225,462 vehicle years
for vehicles up to 33 years of age
total number claims 2,494,668
outcome measurechanges in collision claims per insured
vehicle year
result2.7% increase in collision claims
(statistically significant)

Competing studies leave haze of uncertainty connecting marijuana to traffic accidents Colorado Politics, July 3, 2017
After-legalization traffic studies draw conflicting conclusions Ganjapreneur, June 26, 2017
Two U.S. studies differ over effects of marijuana on drivers U.S. News & World Report, June 22, 2017
Two studies about driving and marijuana have very different results Emerald Report, June 29, 2017
Studies offer conflicting conclusions on marijuana legalization’s role
in car crashes, fatalitiesThe Cannabist, June 23, 2017
Studies differ over impact of legalized pot on highway crash numbers Portland Press Herald, June 26, 2017
The jury is still out on legalizing marijuana impacting road collision rates Auto Evolution, June 28, 2017

Pre-period correlations of collision claim rates between study states and control states used by Aydelotte et al. 2017, AJPH
MD
DE
DC
MA
OR
RI
NJ
NH
ME
PA
WV
NC
SC
GA
FL
OH
MI
IL
WI
IA
MO
LA
NM
CO
SDID
CA
WA
TN
VT
MS
MT ND
NV
AZ
UT
WY
NE
KS
OK
TX
AR
MN
AL
KYVA
NY
CT
AKHI
IN
study states
control states0.03-0.15
correlation with CO
correlation with WA
-0.21-0.13
0.620.62
-0.030.37
0.470.22
0.01-0.07
-0.22-0.17
0.790.32

Crash deaths after legalization of recreational marijuana useColorado and Washington – Aydelotte et al. 2017, AJPH
study states Colorado and Washington
control states
Alabama, Indiana, Kentucky, Missouri,
South Carolina, Tennessee, Texas,
Wisconsin
calendar years January 2009-December 2015
outcome measurechanges in annual motor vehicle crash
fatality rates per billion miles traveled
result2.7% increase in fatalities
(not statistically significant)

Established October 2016450 members

More information and links to our YouTube channel and Twitter feedat iihs.org
iihs.org
Adrian Lund, Ph.D.President