Head Start Program Performance Standards - ECLKC · Head Start Program Performance Standards 45 CFR...
83
Head Start Program Performance Standards 45 CFR Chapter XIII RIN 0970-AC63 Department of Health and Human Services Administration for Children and Families Preamble - Part 2
-
Upload
vuongxuyen -
Category
Documents
-
view
214 -
download
0
Transcript of Head Start Program Performance Standards - ECLKC · Head Start Program Performance Standards 45 CFR...

Head Start Program
Performance Standards
45 CFR Chapter XIIIRIN 0970-AC63
Department of Health and Human ServicesAdministration for Children and Families
Preamble - Part 2


iii
Agency:
Office of Head Start (OHS), Administration for Children and Families (ACF), Department of Health and Human Services (HHS).
Action:
Final rule.
Summary:
This final rule modernizes the Head Start Program Performance Standards, last revised in 1998. In the Improving Head Start for School Readiness Act of 2007, Congress instructed the Office of Head Start to update its performance standards and to ensure any such revisions to the standards do not eliminate or reduce quality, scope, or types of health, educational, parental involvement, nutritional, social, or other services programs provide. This rule responds to pub-lic comment, incorporates extensive findings from research and from consultation with experts, reflects best practices, lessons from program input and innovation, integrates recommendations from the Secretary’s Advisory Committee Final Report on Head Start Research and Evaluation, and reflects the Obama Administration’s deep commitment to improve the school readiness of young children. These performance standards will improve program quality, reduce burden on programs, and improve regulatory clarity and transparency. They provide a clear road map for current and prospective grantees to support high-quality Head Start services and to strengthen the outcomes of the children and families Head Start serves.
Dates:
Effective Date: Provisions of this final rule become effective November 7, 2016.
Compliance Date(s): To allow programs reasonable time to implement certain performance standards, we phase in compliance dates over several years after this final rule becomes effec-tive. In the SUPPLEMENTARY INFORMATION section below, we provide a table, Table 1: Compliance Table, which lists dates by which programs must implement specific standards.
iv
Table of ContentsVI. Regulatory Process Matters ..................................................................................................................1
a. Regulatory Flexibility Act ..............................................................................................................1b. Regulatory Planning and Review Executive Order 12866 .......................................................1
1. Need for Regulatory Action ...............................................................................................12. Cost and Savings Analysis ...................................................................................................3
i. Structural Program Option Provisions .........................................................................13ii. Staff Quality Provisions .................................................................................................28iii. Curriculum and Assessment Provisions .....................................................................33iv. Administrative/Managerial Provisions ........................................................................39
3. Benefits Analysis ..................................................................................................................524. Accounting Statement – Table of Quantified Costs, and Transfers ............................655. Distributional effects ...........................................................................................................676. Regulatory Alternatives .......................................................................................................68
c. Unfunded Mandates Reform Act .................................................................................................72d. Treasury and General Government Appropriations Act of 1999 ..........................................73e. Federalism Assessment Executive Order 13132 ........................................................................73f. Congressional Review.....................................................................................................................73g. Paperwork Reduction Act of 1995 ..............................................................................................74
VII. Tribal Consultation Statement ............................................................................................................76

v

Regulatory Process Matters
1
VI. Regulatory Process Matters
a. Regulatory Flexibility Act
The Regulatory Flexibility Act (RFA),1 as amended by the Small Business Regulatory Enforce-ment Fairness Act, requires federal agencies to determine, to the extent feasible, a rule’s eco-nomic impact on small entities, explore regulatory options for reducing any significant econom-ic impact on a substantial number of such entities, and explain their regulatory approach.
This final rule will not result in a significant economic impact on a substantial number of small entities. It is intended to ensure accountability for federal funds consistent with the purposes of the Improving Head Start for School Readiness Act of 20072 and is not duplicative of other requirements.
b. Regulatory Planning and Review Executive Order 12866
Executive Order 12866 requires federal agencies to submit significant regulatory actions to the Office of Management and Budget (OMB) for review. The Order defines “significant regu-latory actions,” generally, as any regulatory action that is likely to result in a rule that may (1) have an annual effect on the economy of $100 million or more or adversely affect in a material way the economy, a sector of the economy, productivity, competition, jobs, the environment, public health or safety, or state, local, or tribal governments or communities; (2) create a seri-ous inconsistency or otherwise interfere with an action taken or planned by another agency; (3) materially alter the budgetary impact of entitlements, grants, user fees, or loan programs or the rights and obligations of recipients thereof; or (4) raise novel legal or policy issues arising out of legal mandates, the President’s priorities, or the principles set forth in this Executive Order.3 This final rule is different from many rules in the federal government in that it will not require Head Start programs to spend more or less money on Head Start services, rather it will require programs to spend the money they are awarded in different ways. Nonetheless, given that the cost of the rule exceeds $100 million and that, if fully implemented, the costs will either be borne by the federal government in the form of additional appropriations for Head Start or by Head Start programs in the form of loss of slots for eligible children and teacher employment, we have determined this rule represents a significant regulatory action as defined by Executive Order 12866. Given both the directives of the Order and the importance of understanding the costs savings, and benefits associated with these requirements both with and without additional appropriations, we describe the costs, savings, and benefits associated with this final rule as well as available regulatory alternatives below.
1. Need for Regulatory Action
The purpose of Head Start, as prescribed by the Act, is to “promote the school readiness
1 5 U.S.C. 605(b).2 42 U.S.C. 98013 Executive Order 12866 section 3(f)(1).

2
Regulatory Process Matters
of low-income children by enhancing their cognitive, social, and emotional development.”4 This mission is based upon decades of scientific research that documents the strong and lasting impact of children’s experiences in their first five years of life on brain development, learning, and health,5,6,7 and the significant economic impact of such benefits on children individually and on society as a whole. A wealth of research suggests that participation in early learning programs can help support optimal child development during these crucial first five years, particularly for children from low-income families, with benefits for so-ciety lasting well into adulthood.8,9,10,11 However, provision of consistently high-quality early learning experiences is central to reaping these benefits from early learning programs, including Head Start programs. The congressionally mandated, randomized control trial study of Head Start’s impact did not show lasting effects on the outcomes measured beyond the end of the Head Start program years for all children. Specifically, while the Impact Study found effects at the end of participation in Head Start, by third grade the control and treatment groups showed no significant differences.12 However, recent reanal-ysis of data from the Head Start Impact Study suggests that those programs that were full-day had a more positive impact on children’s cognitive outcomes.13 In order for Head Start to achieve its mission to be an effective tool in supporting children’s success in kindergarten and beyond, all programs must be high quality. Decades of best practices, the latest research in early education, expert advice, the Secretary’s Advisory Committee’s recommendations, and Congressional mandates from the Act, all demonstrate that more can be done to ensure all Head Start programs provide consistently high-quality early learning experiences that prepare children for kindergarten and have long-term effects on their academic success. These findings all culminate in the need for policy changes. Additionally, we streamlined requirements and minimized administrative burden on local programs and anticipate these changes will help move Head Start away from a compliance-oriented culture to an
4 42 U.S.C. 98315 National Scientific Council on the Developing Child (2007). The Timing and Quality of Early Experiences Combine to Shape Brain Architecture: Working Paper No. 5. Cambridge, MA: Author.6 Anda R.F., Felitti V.J., Bremner J.D., Walker J.D., Whitfield C., Perry, B.D., Dube, S.R., & Giles, W.H. (2006). The enduring effects of abuse and related adverse experiences in childhood. A convergence of evidence from neurobiology and epidemiology. European Archives of Psychiatry and Clinical Neuroscience, 256(3), 174-186.7 National Scientific Council on the Developing Child (2010). Early Experiences Can Alter Gene Expression and Affect Long-Term Development: Working Paper No. 10. Cambridge, MA: Author.8 Heckman, J.J., Moon, S.H., Pinto, R., Savalyev, P.A. & Yavitz, A. (2010). The Rate of Return to the High/Scope Perry Preschool Program. Journal of Public Economics, 94(1-2), 114–128.9 The Council of Economic Advisers. (December, 2014). The Economics of Early Childhood Investments. Washington, DC: Authors.10 Reynolds, A.J., Temple, J.A., Robertson, D.L., Mann, E.A. (2002). Age 21 Cost-Benefit Analysis of the Title I Chicago Child-Parent Centers. Educational Evaluation and Policy Analysis, 24(4), 267-303.11 Yoshikawa, H., Weiland, C., Brooks-Gunn, J., Burchinal, M., . . .Zaslow, M. (2013). Investing in our future: The evidence base on preschool education. Foundation for Child Development.12 Puma, M., Bell, S., Cook, R., Heid, C., Broene, P., Jenkins, F., & Downer, J. (2012). Third grade follow-up to the Head Start impact study final report. US Department of Health and Human Services Office of Planning, Research and Evaluation.13 Walters, C. (2014). Inputs in the production of early childhood human capital: Evidence from Head Start. American Economic Journal: Applied Economics, 7(4), 76-102.
Cost and Savings Analysis
3
outcomes-focused one. Furthermore, we believe this approach will support better collab-oration with other programs and funding streams. We believe the final rule, which incorpo-rates these needed changes, will empower all programs to achieve this goal.
2. Cost and Savings Analysis
In this section, we first summarize and respond to comments we received on the Regulatory Impact Analysis in the NPRM. Then, we describe the data sources and general method-ology used to calculate costs and savings throughout this analysis. We also summarize the total estimated costs and cost savings associated with this rule, split into four categories: costs and cost savings borne by Head Start, costs and cost savings borne by other parties, opportunity costs, and transfer costs. Finally, we itemize the cost and cost savings estimates associated with individual provisions and describe the assumptions, methodology, and data used to calculate each estimate.
Comment and Response
Comment: Many commenters noted that new requirements would impose additional costs. Some of the costs that commenters highlighted were already accounted for in the Regulato-ry Impact Analyses of the NPRM including costs associated with increased duration, back-ground checks, curriculum requirements, mentor coaching, additional staff qualifications, the waiver application process, providing annual notice to parents of release of personally identifiable information, and costs to implement the changes to the Head Start Program Performance Standards (HSPPS). Other commenters explicitly suggested that the Regula-tory Impact Analysis underestimated the costs associated with the provisions it addressed, such as the cost of additional facilities or other start-up costs including cots for naptime, in the estimate for increasing Head Start center-based duration. Some of these commenters did not provide evidence or a rationale to support these claims. Other commenters sug-gested costs in their community would be higher for a variety of reasons.
Response: We estimate the costs associated with increasing duration, additional background checks, new curriculum requirements, coaching, additional staff qualifications, the waiver application process, providing annual notice to parents of release of personally identifiable information, and many other new requirements in the HSPPS in this Regulatory Impact Analysis. We acknowledge there are additional costs associated with facilities and other start-up activities for increasing duration. Given the period of ramp-up that most programs will need to implement the duration requirements with additional funding, we anticipate that a portion of any first 12-month operational award will be available for the purchase or renovation of facilities and other start-up activities before programs begin serving chil-dren at the higher duration. Nonetheless, we have included an estimate of start-up costs and assumed that these one-time costs will be borne the year prior to the effective dates for duration requirements to reflect the additional costs that would be incurred if these requirements were implemented without adequate funding. In addition, we have adjusted estimates throughout this analysis to reflect revisions to requirements in response to public comments, for example, the final rule requires 1,020 annual hours rather than prescribing 6 hours per day and 180 days per year for Head Start center-based programs, and the final
4
Cost and Savings Analysis
rule reinstates the requirement for parent committees. While we understand that costs of specific provisions will vary across communities, we use the best available data to estimate the cost for all Head Start programs, on average.
Comment: Some commenters expressed concerns related to costs that the NPRM would have imposed or they perceived the NPRM to impose. These costs include the cost of group socialization sites needing to be licensed, costs in rural areas if the home-based option for preschool was removed as a standard option, reduced benefits from the elimina-tion of family partnership agreements, transportation for child health services, partnering with universities to adapt curricula, decreased in-kind matches in volunteer hours and en-gagement due to reduced enrollment, loss of transportation when partnering with an LEA because of full day requirements, and services to children with significant delays who do not yet have IEPs or IFSPs.
Response: Throughout the preamble of the final rule, we address comments suggesting concerns related to requirements that would have imposed unnecessary or unaccounted for costs. We revised the final rule to provide greater flexibility or prevent unintended conse-quences that would have resulted in additional costs for many of the concerns commenters noted. For example, the final rule requires 1,020 annual hours rather than prescribing 6 hours per day and 180 days per year for Head Start center-based programs. The final rule also allows programs to align their schedules with their local education agency to maintain or facilitate partnerships. These changes address concerns about costs that would arise from disrupted partnerships with local education agencies and costs associated with extend-ing the year in cases where 1,020 annual hours are already being provided through a slightly shorter year.
Comment: Some commenters expressed concerns about costs that are implicitly required in current regulation but more explicitly required in the revision of the HSPPS including tracking and analyzing data for continuous quality improvement, providing mental health consultation services, and appropriate training for staff or volunteers involved in the trans-portation of children.
Response: Although we recognize there are costs associated with these services, the purpose of the Regulatory Impact Analysis is to estimate the costs associated with new require-ments. Tracking and analyzing data for continuous quality improvement, providing mental health consultation services, and appropriate training for staff or volunteers are require-ments that existed in the previous performance standards so those costs have not been quantified here. However, in the Benefits Analysis section, we have noted that the clarity the final rule provides should lead to improved compliance with these and other require-ments which should be associated with improved child safety and stronger child and family outcomes.
Comment: Some commenters suggested that the Regulatory Impact Analysis should incor-porate costs associated with prioritizing three year olds for enrollment in Head Start. These commenters highlighted the lower group size and ratio requirements for three-year-olds as an indication of greater cost.
Response: We would consider prioritizing three-year olds and thereby serving fewer chil-

Cost and Savings Analysis
5
dren in Head Start a conversion that would not change the grantee’s overall budget and would not be supported by additional funds. Therefore we have not accounted for any monetary costs associated with this provision here. While we recognize that this would lead to a reduction in slots, it would actually be an increase in the number of children served by early childhood programs overall, because the prioritization is only required if there are programs in the community serving four-year olds. Further, we lack data to support a reasonable assumption about how often and at what point in the future other programs in Head Start communities would be available to serve four-year-olds. Therefore, we have not quantified these costs to programs or any transfer of benefits here.
Comment: Many commenters suggested specific costs associated with new requirements in the NPRM that are being maintained in the final rule and that were not addressed in the original Regulatory Impact Analysis, including use of a parenting curriculum, attempting to contact parents if they have not notified the program that their children will be absent, participation in state Quality Rating Improvement Systems, and participation in state longi-tudinal data systems.
Response: We have estimated costs associated with these requirements in the Regulatory Impact Analysis below.
Comment: Many commenters expressed the desire for the Head Start Program Perfor-mance Standards to require and account for increased teacher compensation.
Response: We agree that teacher compensation is vitally important to attracting and re-taining effective teachers. However, addressing compensation is outside the scope of this regulation because teacher compensation is determined by congressional appropriations and local decisions. Nonetheless, our cost estimates for increasing duration assume costs will be driven in large part by additional pay for teacher’s time, such that programs that must increase their duration as a result of this rule could increase teacher pay in a commensurate fashion if sufficient funds are available.
Comment: Some commenters suggested the Regulatory Impact Analysis should include mention of the benefits associated with longer duration allowing parents to work.
Response: We agree and have revised the discussion of potential benefits to include the benefits associated with allowing more Head Start parents to work.
Comment: Some commenters suggested revisions to our cost estimates for specific provi-sions. Commenters suggested we revise the assumption that there would be no additional administrative costs associated with transforming double session programs into single session, full school day and full school year programs. Commenters also suggested that the regulatory impact analysis should build in cost of living increases overtime to reflect the true cost of the rule.
Response: We have revised our estimates in response to these comments. With regard to administrative costs we no longer assume a reduction in the cost estimate for increasing du-ration based on lower administrative costs. In addition, while the Regulatory Impact Anal-ysis reports costs in real dollars, we have added a table in the section on the implications of Congressional and Secretarial action that reflects the costs of the rule, adjusted for cost of

6
Cost and Savings Analysis
living increases over time, to ensure the full cost and the potential slot loss associated with those costs are clearly articulated.
Data Sources and Methodology
The majority of the estimates in this regulatory impact analysis utilize two Office of Head Start internal datasets: the Grant Application and Budget Instrument (GABI) and the Pro-gram Information Report (PIR). Whenever possible, in this regulatory impact analysis, esti-mates are based upon these datasets. When a data point is necessary to estimate the cost of any provision that cannot be drawn from the GABI or PIR, other data sources are utilized. These data sources are described or cited in the narrative of the relevant cost estimates.
The Head Start GABI is a uniform OMB approved application and budget instrument to standardize the format for the collection of program-specific data grantees provide with a continuation grant application. Head Start grantees provide a range of data on their pro-posed budgets including non-federal share, any other sources of funding, program options, and program schedules.
The PIR is a survey of all grantees that provides comprehensive data on Head Start, Early Head Start and Migrant Head Start programs nationwide. Data collection for the PIR is automated to improve efficiency in the collection and analysis of data. Head Start achieves a 100 percent response rate annually from approximately 2,600 respondents.
These datasets have some limitations. For example, depending on where programs are in the application process or if they are submitting competitive applications, rather than continuation applications, the GABI data can be incomplete. We addressed this limitation in two ways. For grantees that had not submitted GABI data in FY 2015 due to DRS transitions or other factors, we used their FY 2014 GABI data. In addition, to account for missing data, we determined which specific grantees did not have program schedules in the 2015 GABI data, and then determined the funded enrollment associated with those specific grantees using data from the Head Start Enterprise System. Through this analysis, we learned that 11 percent of Head Start funded enrollment slots and 13 percent of Early Head Start enrollment slots are missing from the 2015 GABI data. Therefore, throughout this analysis, we increase estimates using GABI data by 11 percent for Head Start and 13 percent for Early Head Start. Further, the PIR data is self-reported data that has not been independently verified.
The methodology we use to estimate costs and cost savings associated with individual pro-visions varies throughout this analysis. We have included a description of each methodolo-gy in the Itemized Costs and Cost Savings section of this analysis. As appropriate, estimates associated with new salaries have been doubled to account for fringe benefits and overhead. Estimates associated with duration requirements that increase the hours and days staff must work and increases to salaries based on higher credentials are inflated by one-third to include costs associated with an increase in fringe benefits but exclude any additional over-head costs.
Finally, in general, we have rounded total cost estimates but have not rounded itemized cost estimates for transparency of the estimation process. These unrounded itemized cost esti-

Cost and Savings Analysis
7
mates should not be interpreted as overly precise, but instead represent our best estimation given limitations.
Summary of Costs and Cost Savings
Throughout this analysis, we identify and itemize the costs and cost savings to society associated with the changes from the previous regulation in three categories: costs borne by Head Start, costs borne by other parties, and opportunity costs. We describe the calcu-lation of each of these costs in the appropriate sections throughout this analysis. The table below summarizes all of the itemized costs for every year over a ten year window. The final year (year ten) represents our best estimation of costs in year ten and ongoing costs thereafter. We analyze the costs of the regulation two ways in the table and throughout this analysis – we estimate the costs of the regulation without consideration of the sub-stantial resources provided in FY 2016 to increase duration in Head Start and we estimate the costs net of these resources which have already been provided and are now part of the budget baseline for the Head Start program, assuming this funding increase is maintained across the ten year window. In year 10, the total cost to Head Start after accounting for the funding Congress has already provided to expand duration total $1,003,152,645; without the $294 million in funding provided in FY 2016 and now part of the budget baseline, the total cost would be $1,297,152,645. In year ten and ongoing, costs borne by other parties total $46,464,140, and opportunity costs total $4,202,017. Therefore, we estimate the net cost to society of the final rule, if fully implemented, to be $1,053,818,802 in year ten and ongoing, when the funding Congress has already provided is taken into account.
Without additional appropriations in future years or action by the Secretary as described in §1302.21(c)(3) to lower the requirements described in paragraphs §1302.21(c)(2)(iii) and (iv) of the final rule, Head Start programs would need to absorb any additional costs within their current budgets. We discuss the implications of Congressional and Secretarial actions, as well as potential slot and teacher job loss, in more detail in the Benefits Analysis section below.
Summary Table of All Costs Borne by Head Start Years 1-5
Year 1 2016-2017*
Year 2 2017-2018*
Year 3 2018-2019*
Year 4 2019-2020*
Year 5 2020-2021*
Increased Head Start Center-Based (CB) Program Duration, Excluding Duration Funding Appropriated in FY 2016 $ - $ - $ - $508,440,805 $508,440,805
FY 2016 Funding Appropriated to Expand Head Start CB Duration $ - $ - $ - ($263,121,940) ($263,121,940)
Net Costs of Head Start CB Duration Increase $ - $ - $ - $245,318,865 $245,318,865
Increased EHS CB Duration, Excluding Duration Funding Appropriated in FY 2016 $ - $ - $30,878,060 $30,878,060 $30,878,060

8
Cost and Savings Analysis
FY 2016 Funding Appropriated to Expand EHS CB Duration ($30,878,060) ($30,878,060) ($30,878,060)
Net Cost of EHS CB Duration Increase $0 $0 $0
Start-up Costs for Duration Increase for CB Programs $ - $6,175,612 $101,688,161 $ - $124,109,936
Increased EHS Home-Based (HB) Duration $ - $8,188,508 $8,188,508 $8,188,508 $8,188,508
Waiver for Two-Year-Old Ratios ($24,541,262) ($24,541,262) ($24,541,262) ($24,541,262) ($24,541,262)
Waiver Applications $42,751 $54,137 $60,153 $80,899 $80,899
Home Visit for Frequently Absent Children $927,603 $834,842 $742,082 $649,322 $556,562
Parent Contact - Unexpectedly Absent Children $3,540,199 $3,540,199 $3,540,199 $3,540,199 $3,540,199
Associate’s Degree for Head Start (HS) Teachers $10,472,585 $10,472,585 $10,472,585 $10,472,585 $10,472,585
Home-visiting CDA for Home Visitors $ - $ - $5,112,499 $5,112,499 $5,112,499
Credential for New Family Service Workers $549,046 $549,046 $549,046 $549,046 $549,046
Bachelor's Degree for New Management Staff $ 2,182,809 $ 3,977,108 $5,515,809 $6,798,912 $7,826,417
Mentor Coaching $ - $141,978,651 $141,978,651 $141,978,651 $141,978,651
Improving Curriculum $ - $4,390,220 $4,390,220 $4,390,220 $4,390,220
Monitoring Fidelity of Curriculum Implementation $ - $33,983 $33,983 $33,983 $33,983
Assessments for Dual Language Learners $ - $6,082,338 $6,082,338 $ 6,082,338 $6,082,338
Removal of Head Start-specific IEPs ($41,180,576) ($41,180,576) ($41,180,576) ($41,180,576) ($41,180,576)
Parenting Curriculum $4,055,157 $4,055,157 $4,055,157 $4,055,157 $4,055,157
Memorandum of Understanding (MOU) $61,506 $ - $ - $ - $ -
Criminal Background Checks $ - $4,117,348 $4,117,348 $4,117,348 $4,117,348
Mediation and Arbitration $333,000 $333,000 $333,000 $333,000 $333,000
Removal of Annual Audits ($306,000) ($306,000) ($306,000) ($306,000) ($306,000)
Delegate Appeals ($833,638) ($833,638) ($833,638) ($833,638) ($833,638)
Clarification of Facilities Application Process ($4,350,000) ($4,350,000) ($4,350,000) ($4,350,000) ($4,350,000)
Community Assessment ($1,152,558) ($1,152,558) ($1,152,558) ($1,152,558) ($1,152,558)
Managerial Planning ($2,298,905) ($2,298,905) ($2,298,905) ($2,298,905) ($2,298,905)
Data Management $ - $6,643,811 $6,643,811 $6,643,811 $6,643,811
Participation in QRIS $ - $1,695,928 $1,695,928 $1,695,928 $1,695,928

Cost and Savings Analysis
9
Participation in State longitudinal data systems $ - $824,593 $824,593 $824,593 $824,593
Implementation Planning $ 3,474,474 $ 3,474,474 $ - $ - $ -
TOTAL, Excluding Duration Funding Appropriated in FY 2016 ($46,320,371) $134,637,446 $264,118,036 $ 672,906,362 $797,951,042
TOTAL, Including Duration Funding Appropriated in FY 2016 n/a n/a n/a $378,906,362 $503,951,042
* Year ranges refer to Head Start program years, which for these estimates, begin on August 1st of each year and end on or before July 31st.
Summary Table of All Costs Years 6-10
Year 6 2021-2022*
Year 7 2022-2023*
Year 8 2023-2024*
Year 9 2024-2025*
Year 10 2025-2026*
Increased Head Start CB Program Duration, Excluding Duration Funding Appropriated in FY 2016 $1,128,990,485 $1,128,990,485 $1,128,990,485 $1,128,990,485 $1,128,990,485
FY 2016 Funding Appropriated to Expand Head Start CB Duration ($263,121,940) ( $263,121,940) ($263,121,940) ($263,121,940) ($263,121,940)
Net Cost of Head Start CB Duration Increase $865,868,545 $865,868,545 $865,868,545 $865,868,545 $865,868,545
Increased EHS CB Program Duration, Excluding Duration Funding Appropriated in FY 2016 $30,878,060 $ 30,878,060 $ 30,878,060 $30,878,060 $30,878,060
FY 2016 Funding Appropriated to Expand EHS CB Duration ($30,878,060) ($30,878,060) ($30,878,060) ($30,878,060) ($30,878,060)
Net Cost of EHS CB Duration Increase $0 $0 $0 $0 $0
Increased EHS HB Duration $8,188,508 $8,188,508 $8,188,508 $ 8,188,508 $8,188,508
Waiver for Two-Year-Old Ratios ($24,541,262) ($24,541,262) ($24,541,262) ($24,541,262) ($24,541,262)
Waiver Applications $104,650 $20,930 $20,930 $ 20,930 $20,930
Home Visit for Frequently Absent Children $463,801 $463,801 $463,801 $463,801 $463,801
Parent Contact - Unexpectedly Absent Children $3,540,199 $3,540,199 $3,540,199 $3,540,199 $3,540,199
Associate’s Degree for HS Teachers $10,472,585 $10,472,585 $10,472,585 $10,472,585 $10,472,585
Home-visiting CDA for Home Visitors $5,112,499 $5,112,499 $5,112,499 $5,112,499 $5,112,499
Credential for New Family Service Workers $549,046 $549,046 $549,046 $549,046 $549,046

10
Cost and Savings Analysis
Bachelor's Degree for New Management Staff $ 8,726,123 $9,370,230 $10,014,338 $10,525,534 $ 10,908,931
Mentor Coaching $141,978,651 $141,978,651 $141,978,651 $141,978,651 $141,978,651
Improving Curriculum $4,390,220 $4,390,220 $4,390,220 $4,390,220 $4,390,220
Monitoring Fidelity of Curriculum Implementation $33,983 $33,983 $33,983 $33,983 $33,983
Assessments for Dual Language Learners $6,082,338 $6,082,338 $6,082,338 $6,082,338 $ 6,082,338
Removal of Head Start-specific IEPs ($41,180,576) ($41,180,576) ($41,180,576) ($41,180,576) ($41,180,576)
Parenting Curriculum $4,055,157 $4,055,157 $4,055,157 $4,055,157 $4,055,157
Memorandum of Understanding (MOU) $ - $ - $ - $ - $ -
Criminal Background Checks $4,117,348 $4,117,348 $4,117,348 $4,117,348 $4,117,348
Mediation and Arbitration $333,000 $333,000 $333,000 $333,000 $333,000
Removal of Annual Audits ($306,000) ($306,000) ($306,000) ($306,000) ($306,000)
Delegate Appeals ($833,638) ($833,638) ($833,638) ($833,638) ($833,638)
Clarification of Facilities Application Process ($4,350,000) ($4,350,000) ($4,350,000) ($4,350,000) ($4,350,000)
Community Assessment ($1,152,558) ($1,152,558) ($1,152,558) ($1,152,558) ($1,152,558)
Managerial Planning ($2,298,905) ($2,298,905) ($2,298,905) ($2,298,905) ($2,298,905)
Data Management $6,643,811 $6,643,811 $6,643,811 $6,643,811 $6,643,811
Participation in QRIS $1,695,928 $2,024,583 $2,024,583 $2,024,583 $2,352,595
Participation in State longitudinal data systems $824,593 $965,550 $965,550 $965,550 $1,106,507
Implementation Planning $ - $ - $ - $ - $ -
TOTAL, Excluding Duration Funding Appropriated in FY 2016 $1,294,396,889 $1,295,285,932 $1,296,895,589 $1,297,406,786 $1,297,152,645
TOTAL, Including Duration Funding Appropriated in FY 2016 $1,000,396,889 $1,001,285,932 $1,002,895,589 $1,003,406,786 $1,003,152,645
* Year ranges refer to Head Start program years, which for these estimates, begin on August 1st of each year and end on or before July 31st.
Summary Table of All Costs Borne by Other Parties and Opportunity Costs Years 1-5
Year 1 2016-2017*
Year 2 2017-2018*
Year 3 2018-2019*
Year 4 2019-2020*
Year 5 2020-2021*
Costs Borne by Other Parties
Managerial Planning ($1,043,016) ($1,043,016) ($1,043,016) ($1,043,016) ($1,043,016)
Data Management $ - $741,978 $741,978 $741,978 $741,978
Memorandum of Understanding (MOU) $28,679 $ - $ - $ - $ -
Community Assessment ($352,028) ($352,028) ($352,028) ($352,028) ($352,028)
Improving Curriculum $ - $140,396 $140,396 $140,396 $140,396

Cost and Savings Analysis
11
Implementation Planning $1,624,843 $1,624,843 $ - $ - $ -
Waiver Application $14,023 $17,758 $19,731 $26,537 $26,537
Bachelor's Degree for New Management Staff $1,036,673 $1,888,833 $2,619,603 $3,228,982 $3,716,971
Participation in QRIS $ - $888,598 $888,598 $888,598 $888,598
Participation in State longitudinal data systems $ - $399,268 $399,268 $399,268 $399,268
Removal of Head Start-specific IEPs $41,180,576 $41,180,576 $41,180,576 $41,180,576 $41,180,576
SUBTOTAL $42,489,751 $44,745,228 $43,853,127 $44,469,312 $44,957,301
Opportunity Costs
Home Visit for Frequently Absent Children $455,721 $410,149 $364,577 $319,005 $273,433
Criminal Background Checks $ - $ 838,985 $838,985 $838,985 $838,985
Data Management $ - $2,393,194 $2,393,194 $2,393,194 $2,393,194
SUBTOTAL $455,721 $4,384,306 $4,338,734 $4,293,161 $4,247,589
* Year ranges refer to Head Start program years, which for these estimates, begin on August 1st of each year and end on or before July 31st.
Summary Table of All Costs Borne by Other Parties and Opportunity Costs Years 1-5
Year 6 2021-2022*
Year 7 2022-2023*
Year 8 2023-2024*
Year 9 2024-2025*
Year 10 2025-2026*
Costs Borne by Other Parties
Managerial Planning ($1,043,016) ($1,043,016) ($1,043,016) ($1,043,016) ($1,043,016)
Data Management $ - $741,978 $741,978 $741,978 $741,978
Memorandum of Understanding (MOU) $ - $ - $ - $ - $ -
Community Assessment ($352,028) ($352,028) ($352,028) ($352,028) ($352,028)
Improving Curriculum $140,396 $140,396 $140,396 $140,396 $140,396
Implementation Planning $ - $ - $ - $ - $ -
Waiver Application $34,327 $6,865 $6,865 $6,865 $6,865
Bachelor's Degree for New Management Staff $4,144,265 $4,450,168 $4,756,072 $4,998,852 $5,180,938
Participation in QRIS $888,598 $1,119,660 $1,119,660 $1,119,660 $1,350,409
Participation in State longitudinal data systems $399,268 $469,767 $469,767 $469,767 $540,267
Removal of Head Start-specific IEPs $41,180,576 $41,180,576 $41,180,576 $41,180,576 $41,180,576
SUBTOTAL $45,392,386 $45,972,388 $46,278,292 $46,521,072 $46,464,140
Opportunity Costs
Home Visit for Frequently Absent Children $227,861 $227,861 $227,861 $227,861 $227,861

12
Cost and Savings Analysis
Criminal Background Checks $838,985 $838,985 $838,985 $ 838,985 $838,985
Data Management $2,393,194 $2,393,194 $2,393,194 $2,393,194 $2,393,194
SUBTOTAL $4,207,017 $4,202,017 $4,202,017 $4,202,017 $4,202,017
* Year ranges refer to Head Start program years, which for these estimates, begin on August 1st of each year and end on or before July 31st.
Summary Table of Net Cost to Society Years 1-10
Year 1 2016-2017*
Year 2 2017-2018*
Year 3 2018-2019*
Year 4 2019-2020*
Year 5 2020-2021*
Net Cost to Society, Excluding Duration Funding Appropriated Beginning in FY 2016 ($3,374,899) $183,367,712 $311,910,629 $721,269,567 $846,756,665
Net Cost to Society, Including Duration Funding Appropriated Beginning in FY 2016 n/a n/a n/a $427,269,567 $552,756,665
Year 6 2021-2022*
Year 7 2022-2023*
Year 8 2023-2024*
Year 9 2024-2025*
Year 10 2025-2026*
Net Cost to Society, Excluding Duration Funding Appropriated Beginning in FY 2016 $1,343,592,024 $1,344,990,571 $1,346,906,131 $1,347,660,108 $1,347,818,802
Net Cost to Society, Including Duration Funding Appropriated Beginning in FY 2016 $1,049,592,024 $1,050,990,571 $1,052,906,131 $1,053,660,108 $1,053,818,802
* Year ranges refer to Head Start program years, which for these estimates, begin on August 1st of each year and end on or before July 31st.

Structural Program Option Provisions
13
Itemized Costs and Cost Savings
In the following sections, we itemize each of the regulatory changes for which we expect there to be associated costs or cost savings in the areas of structural program option pro-visions, staff quality provisions, curriculum and assessment provisions, and administrative/managerial provisions.
i. Structural Program Option Provisions
This final rule includes several provisions that increase the duration of the Head Start experience for children. It also includes provisions intended to improve child attendance. We analyzed costs associated with the following specific requirements: minimum of 1,020 hours of planned class operations for all Head Start center-based programs in §1302.21(c)(2)(iii)-(iv) minimum of 1,380 hours for all Early Head Start center-based programs in §1302.21(c)(1)(i)-(ii); minimum of 46 home visits and 22 group socializations for all Early Head Start home-based programs in §1302.22(c)(1)(i) and (ii); and additional home visits for chronically absent children, as appropriate, and contacting parents when children are unex-pectedly absent in §1302.16. In all cases, costs are estimated based on data about whether programs are currently meeting these new minimum requirements.
Increased Head Start Center-Based Program Duration
This final rule increases the minimum annual hours that Head Start programs must pro-vide to 1,020 annual hours. The requirements in §1302.21(c)(2)(iii) and (iv) phase in the minimum annual hour requirement for Head Start such that each grantee must operate 50 percent of its Head Start center-based slots at the 1,020 annual hour minimum by August 1, 2019 and 100 percent of its Head Start center-based slots at this minimum by August 1, 2021. Further, to minimize the potential for slot loss as described above the requirements in §1302.21(c)(3) give the Secretary the authority to reduce these percentages if adequate funding is not available to support the policy.
These changes will increase the amount of exposure to Head Start experiences, which re-search suggests will, in turn, result in larger impacts on school readiness and long-term out-comes.14,15 Research suggests that previous Head Start minimums are inadequate to achieve strong child outcomes and effectively promote school readiness. Specifically, research on full school day programs, instructional time, summer learning loss and attendance demon-strates the importance of extending the minimum hours of early learning in Head
14 Weiland, C., & Yoshikawa, H. (2013). Impacts of a prekindergarten program on children’s mathematics, language, literacy, executive function, and emotional skills. Child Development, 84, 2112–2130.15 Barnett, W.S., Jung, K., Youn, M.J., and Frede, E.C. (2013). Abbott Preschool Program Longitudinal Effects Study: Fifth Grade Follow-Up. National Institute for Early Education Research Rutgers—The State University of New Jersey.

14
Structural Program Option Provisions
Start.16,17,18,19,20,21,22,23,24,25,26,27,28,29,30,31 Research finds that pre-kindergarten programs that focus on intentional teaching and both small group and one-to-one interactions have larger impacts on child outcomes.
50 Percent Estimate for the Extension of Head Start Center-Based Program Duration
Starting in year four following publication of this rule (program year 2019-2020), programs are required to serve 50 percent of their children in Head Start center-based classrooms for at least 1,020 hours per year. In this section, we estimate costs associated with the addition-al service provided by these programs. Note that Migrant and Seasonal Head Start pro-grams are excluded from these requirements. We first estimate the marginal cost per child for the Head Start services that exist today, updated to account for teacher salary increases
16 Logan, J.A.R., Piasta, S.B., Justice, L.M., Schatschneider, C., & Petrill, S. (2011). Children’s Attendance Rates and Quality of Teacher-Child Interactions in At-Risk Preschool Classrooms: Contribution to Children’s Expressive Language Growth. Child & Youth Forum 40(6), 457-477.17 Hubbs-Tait, L., McDonald Culp, A., Huey E., Culp, R., Starost, H., & Hare, C. (2002). Relation of Head Start attendance to children’s cognitive and social outcomes: moderation by family risk. Early Childhood Research Quarterly, 17, 539–558.18 Lamdin, D.J. (1996). Evidence of student attendance as an independent variable in education production functions. Journal of Educational Research, 89(3), 155-162.19 Wong, V. C., Cook, T. D., Barnett, W. S., & Jung, K. (2008). An effectiveness-based evaluation of five state prekindergarten programs. Journal of Policy Analysis and Management, 27, 122-154.20 Camilli, G., Vargas, S., Ryan, S., & Barnett, W. S. (2010). Meta-analysis of the effects of early education interventions on cognitive and social development. The Teachers College Record, 112, 579-620.21 Yoshikawa, H., Weiland, C., Brooks-Gunn, J., Burchinal, M., . . .Zaslow, M. (2013). Investing in our future: The evidence base on preschool education. Foundation for Child Development. New York, NY.22 Barnett, W. S., & Hustedt, J. T. (2005). Head start’s lasting benefits. Infants & Young Children, 18(1), 16-24.23 Schweinhart, L. J., Montie, J., Xiang, Z., Barnett, W. S., Belfield, C. R., & Nores, M. (2005). Lifetime effects: The HighScope Perry Preschool study through age 40. Ypsilanti, MI: HighScope Press.24 Aikens, N., Kopack Klein, A., Tarullo, L., & West, J. (2013). Getting Ready for Kindergarten: Children’s Progress During Head Start. FACES 2009 Report. OPRE Report 2013-21a. Washington, DC: Office of Planning, Research and Evaluation, Administration for Children and Families, U.S. Department of Health and Human Services.25 The Council of Economic Advisers. (December, 2014). The Economics of Early Childhood Investments. Washington, DC: Authors.26 Peisner-Feinberg, E. S., Schaaf, J. M., LaForett, D. R., Hildebrandt, L.M., & Sideris, J. (2014). Effects of Georgia’s Pre-K Program on children’s school readiness skills: Findings from the 2012-2013 evaluation study. Chapel Hill: The University of North Carolina, FPG Child Development Institute.27 Weiland, C., & Yoshikawa, H. (2013). Impacts of a prekindergarten program on children’s mathematics, language, literacy, executive function, and emotional skills. Child Development, 84, 2112–2130.28 Gormley, W., Gayer, T., Phillips, D.A., & Dawson, B. (2005). The effects of universal Pre-K on cognitive development. Developmental Psychology, 41, 872-884.29 Campbell, F. A., Ramey, C. T., Pungello, E., Sparling, J., & Miller-Johnson, S. (2002). Early childhood education: Young adult outcomes from the Abecedarian project. Applied Developmental Science, 6, 42-57.30 Schweinhart, L. J., Montie, J., Xiang, Z., Barnett, W. S., Belfield, C. R., & Nores, M. (2005). Lifetime effects: The HighScope Perry Preschool study through age 40. Ypsilanti, MI: HighScope Press.31 Ehrlich, S.B., Gwynne, J.A…..Sorice, E. (2014). Preschool Attendance in Chicago Public Schools: Relationships with Learning Outcomes and Reasons for Absences. University of Chicago Consortium on Chicago School Research. Reynolds, A.J. (2000). Success in early intervention: The Chicago Child-Parent Centers. Lincoln, Nebraska: University of Nebraska Press

Structural Program Option Provisions
15
associated with the final rule. These salary increases are discussed later in this analysis. To estimate this cost, we first calculate the Head Start cost per child under the final rule by adding total Head Start grant expenditures in FY 2015 ($6,354,595,188) to teacher salary increases associated with requirements in the final rule in §1302.91(e) ($7,874,124), and divide this sum by FY 2015 Head Start funded enrollment (791,886). This results in a cost per child of $8,035, which is an increase of ten dollars per child from the FY 2015 actual annual Head Start cost per child of $8,025.
We estimate costs for Head Start center-based double session and non-double session pro-grams separately. We assume grantees will move double session and non-double sessions, and three-year-old and four- and five-year-old slots, to 1,020 annual hours proportionately.
Given that double session programs include a morning and afternoon session with the same teacher, we estimate that for every two children in these programs, the marginal cost of providing additional service in line with the rule’s requirements will be equivalent to providing Head Start services to an additional child, resulting in a cost of $8,035. There-fore, we estimate for Head Start double session center-based programs, 31,197 new slots would need to be created and we estimate the cost to move these slots to 1,020 hours to be $250,664,993. However, this cost excludes the impact of the funding already provided by Congress in FY 2016 to expand duration. As discussed below, some of these costs will be covered by that funding.
We take a different approach to estimate costs for non-double session programs. We calcu-late the number of Head Start center-based non-double session slots that operate for fewer than 1,020 annual hours and would need to be increased in order for each grantee to meet the 50 percent requirement (121,116, after inflating values for missing GABI data). Based on GABI data, the average number of hours that a non-double session slot would need to add in order to reach the 1,020 hours annually is 290.354 hours. We assume that programs would choose to increase their service duration to the 1,020 annual hour requirement in a variety of ways, some by adding hours to each day of service and some by adding additional service days. Based on the service duration patterns of programs that currently provide 1,020 or more annual hours of service, we assume 30 percent of programs would decide to add only hours to each day of service already provided, and therefore their costs would be driven entirely by teaching salaries. We assume 70 percent of programs would choose to in-crease the number of days they operate per year to meet the 1,020 annual hour requirement.
We next estimate the marginal cost per hour per child for Head Start non-double session, center-based slots. This is done using the sum of the average teacher ($18.70) and average assistant teacher ($11.99) hourly wages from the PIR to calculate the cost per classroom per hour for teaching staff on average ($30.69). Then, we increased this cost per classroom per hour for teaching staff by 0.124 percent to account for the marginal increase in teacher salaries associated with all teaching staff meeting the minimum education requirements de-scribed later in this analysis ($7,874,124). This increase was calculated by finding the mar-ginal increase in the cost per child after accounting for these salary increases ($8,035) from the FY 2015 actual cost per child for Head Start ($8,025). The new cost per classroom per hour for teaching staff is $30.73, on average. Then, we inflated this cost per classroom per hour by one-third to account for fringe benefits, which is $40.87 (we assumed no additional
16
Structural Program Option Provisions
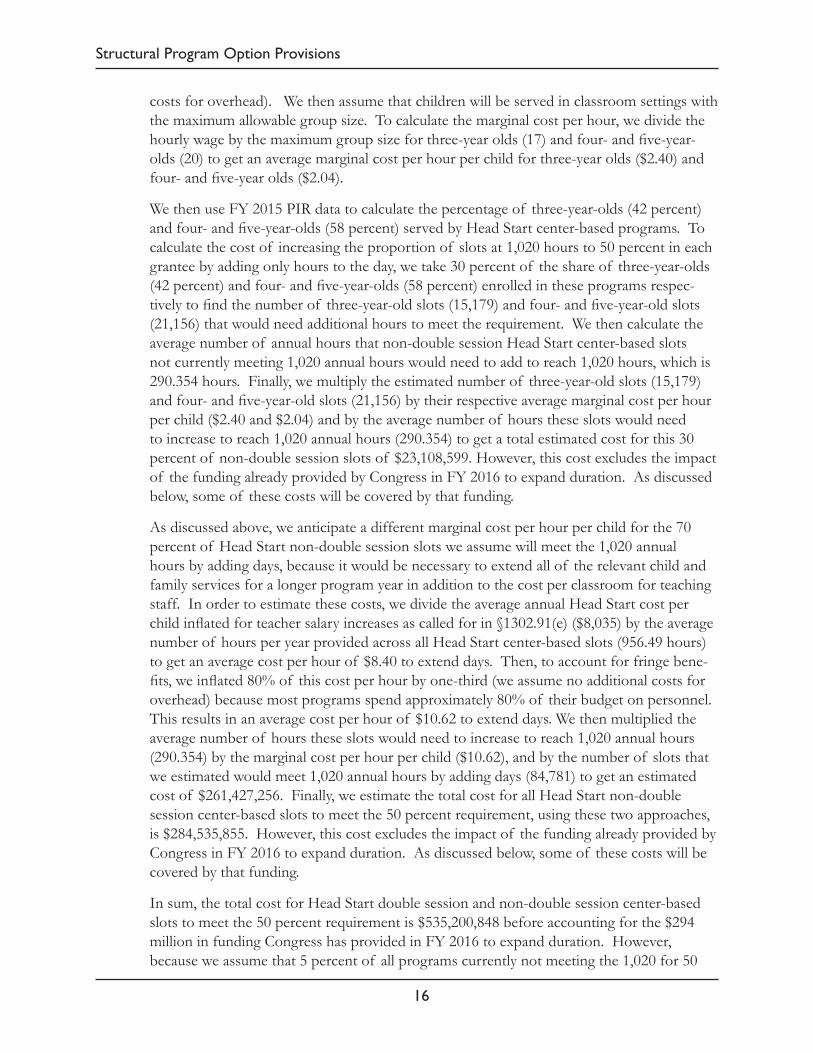
costs for overhead). We then assume that children will be served in classroom settings with the maximum allowable group size. To calculate the marginal cost per hour, we divide the hourly wage by the maximum group size for three-year olds (17) and four- and five-year-olds (20) to get an average marginal cost per hour per child for three-year olds ($2.40) and four- and five-year olds ($2.04).
We then use FY 2015 PIR data to calculate the percentage of three-year-olds (42 percent) and four- and five-year-olds (58 percent) served by Head Start center-based programs. To calculate the cost of increasing the proportion of slots at 1,020 hours to 50 percent in each grantee by adding only hours to the day, we take 30 percent of the share of three-year-olds (42 percent) and four- and five-year-olds (58 percent) enrolled in these programs respec-tively to find the number of three-year-old slots (15,179) and four- and five-year-old slots (21,156) that would need additional hours to meet the requirement. We then calculate the average number of annual hours that non-double session Head Start center-based slots not currently meeting 1,020 annual hours would need to add to reach 1,020 hours, which is 290.354 hours. Finally, we multiply the estimated number of three-year-old slots (15,179) and four- and five-year-old slots (21,156) by their respective average marginal cost per hour per child ($2.40 and $2.04) and by the average number of hours these slots would need to increase to reach 1,020 annual hours (290.354) to get a total estimated cost for this 30 percent of non-double session slots of $23,108,599. However, this cost excludes the impact of the funding already provided by Congress in FY 2016 to expand duration. As discussed below, some of these costs will be covered by that funding.
As discussed above, we anticipate a different marginal cost per hour per child for the 70 percent of Head Start non-double session slots we assume will meet the 1,020 annual hours by adding days, because it would be necessary to extend all of the relevant child and family services for a longer program year in addition to the cost per classroom for teaching staff. In order to estimate these costs, we divide the average annual Head Start cost per child inflated for teacher salary increases as called for in §1302.91(e) ($8,035) by the average number of hours per year provided across all Head Start center-based slots (956.49 hours) to get an average cost per hour of $8.40 to extend days. Then, to account for fringe bene-fits, we inflated 80% of this cost per hour by one-third (we assume no additional costs for overhead) because most programs spend approximately 80% of their budget on personnel. This results in an average cost per hour of $10.62 to extend days. We then multiplied the average number of hours these slots would need to increase to reach 1,020 annual hours (290.354) by the marginal cost per hour per child ($10.62), and by the number of slots that we estimated would meet 1,020 annual hours by adding days (84,781) to get an estimated cost of $261,427,256. Finally, we estimate the total cost for all Head Start non-double session center-based slots to meet the 50 percent requirement, using these two approaches, is $284,535,855. However, this cost excludes the impact of the funding already provided by Congress in FY 2016 to expand duration. As discussed below, some of these costs will be covered by that funding.
In sum, the total cost for Head Start double session and non-double session center-based slots to meet the 50 percent requirement is $535,200,848 before accounting for the $294 million in funding Congress has provided in FY 2016 to expand duration. However, because we assume that 5 percent of all programs currently not meeting the 1,020 for 50

Structural Program Option Provisions
17
percent of their slots will receive a waiver to continue operating at their current level of annual hours, we reduce this estimate by 5 percent for a total cost borne by Head Start of $508,440,805 before accounting for the $294 million in funding Congress has provided in FY 2016 to expand duration. These costs will be realized in years four and five, if the rule is fully implemented. As noted, Congress appropriated $294 million in FY 2016 to increase the duration of Early Head Start and Head Start programs. Thus, a substantial share of the $508 million in costs will be absorbed by this funding, assuming this funding increase is maintained across the ten year window.
50% Extension of Head Start Center-based Duration: Costs Borne by Head Start
Total DS Slots New Slots neededCost per child (less admin) Cost
Double Session (DS) 62,393 31,197 $8,035 $250,664,993
SlotsAverage cost per
child per hour Hours needed Cost
Non-double session adding hours (30%)
3 year olds 15,179 $2.40 290.354 $10,577,515
Non-double session adding hours (30%)
4 year olds 21,156 $2.04 290.354 $12,531,084
Subtotal $23,108,599
Non-double session adding days (70%) 84,781 $10.62 290.354 $261,427,256
Total, Excluding Duration Funding Appropriated Beginning in FY 2016 $535,200,848
Less 5% Waiver, Excluding Duration Funding Appropriated Beginning in FY 2016 $508,440,805
Total, Including Duration Funding Appropriated Beginning in FY 2016 $245,318,865
100 Percent Estimate for the Extension of Head Start Center-Based Program Duration
Starting in year six following publication of the final rule (program year 2021-2022), most programs are required to serve children for at least 1,020 hours. In order to estimate the cost associated with this requirement for each grantee to operate all of their Head Start center-based slots for 1,020 annual hours, we used the same approach described above for the 50 percent requirement. The only difference in the estimate is that we used GABI data to calculate the number of slots for which each grantee would need to increase duration in order to operate all of its center-based Head Start slots for 1,020 annual hours. As above, we estimate the cost of increasing double session and non-double session slots to 1,020 annual hours separately. Therefore, as described above, we estimate for Head Start double session center-based programs, 72,727 new slots would need to be created. As a result, starting in year six following publication of the final rule, we estimate costs of $584,363,052 associated with providing additional service to these children in line with the requirements of the final rule. However, this cost excludes the impact of the funding already provided by

18
Structural Program Option Provisions
Congress in FY 2016 to expand duration. As discussed below, some of these costs will be covered by that funding.
For Head Start non-double session center-based programs, we estimate 36,355 slots would meet the 100 percent requirement by increasing only hours per day. We estimate the share of three-year-old slots is 35,746, and the share of four- and five-year-old slots is 49,821. Therefore, we estimate the cost of meeting the 100 percent requirement for these pro-grams to be $54,419,668. For Head Start non-double session center-based programs, we estimate 199,656 slots would meet the 100 percent requirement by adding days. There-fore, we estimate the cost of meeting the 100 percent requirement for these programs to be $615,651,152. Finally, we estimate the total cost for all Head Start non-double session center-based slots to meet the 100 percent requirement, using these two approaches, is $670,070,820. However, this cost excludes the impact of the funding already provided by Congress in FY 2016 to expand duration. As discussed below, some of these costs will be covered by that funding.
In sum, the estimated total cost for Head Start double session and non-double session center-based slots to meet the 1,020 requirement is $1,254,433,872 before accounting for the $294 million in funding Congress has provided in FY 2016 to expand duration. This represents an additional $719,233,024 over the 50 percent requirement. However, be-cause we assume that 10 percent of all programs not currently meeting the 1,020 annual hours minimum will receive a waiver to continue operating at their current level of annual hours, we reduce this estimate by 10 percent for a total cost borne by Head Start of $1,128,990,485 before accounting for the $294 million in funding Congress has provided in FY 2016 to expand duration. This represents an additional $620,549,679 over the 50 per-cent requirement. These costs will be realized in year six and annually thereafter, if the rule is fully implemented. As noted, Congress appropriated $294 million in FY 2016 to increase the duration of Early Head Start and Head Start programs. Thus, a substantial share of the $1,128,990,485 in costs will be absorbed by this funding, assuming this funding increase is maintained across the ten year window.

Structural Program Option Provisions
19
100% Extension of Head Start Center-based Duration: Costs Borne by Head StartTotal DS Slots New Slots needed Cost per child Cost
Double Session (DS) 145,454 72,727 $8,035 $584,363,052
Slots
Average cost per child per hour (less
admin) Hours needed Cost
Non-double session adding hours (30%) 3
year olds 35,746 $2.40 290.354 $24,909,586
Non-double session adding hours (30%) 4
year olds 49,821 $2.04 290.354 $29,510,082
Subtotal $54,419,668
Non-double session adding days (70%) 199,656 $10.62 290.354 $615,651,152
Total, Excluding Duration Funding Appropriated Beginning in FY 2016 $1,254,433,872
Less 10% Waiver, Excluding Duration Funding Appropriated Beginning in FY 2016 $1,128,990,485
Total, Including Duration Funding Appropriated Beginning in FY 2016 $865,868,545
Extension of Early Head Start Center-Based Program Duration
Similar to the approach to estimating the cost of increasing duration for Head Start, to esti-mate the costs associated with the requirement that Early Head Start center-based programs provide a minimum of 1,380 annual hours for all slots, we used GABI and PIR data. We excluded all programs not required to meet the 1,380 minimum. Therefore, we calculat-ed the cost using data from Early Head Start center-based programs including American Indian and Alaska Native programs but excluded all other program options and Migrant and Seasonal Head Start. We calculated estimates for Early Head Start center-based double session and non-double session programs separately. Double session programs include a morning and afternoon session with the same teacher, therefore, we used the entire FY 2015 Early Head Start cost per child for center-based services from the GABI ($13,041). Next, we divided the current Early Head Start funded enrollment in double session pro-grams (324, which is inflated for missing GABI data) by 2 to get a total estimated number of new Early Head Start slots that would need to be created to eliminate double sessions (162). We then multiplied the resulting number of slots by the average marginal cost per child. From these calculations, we estimate the cost of extending duration for all Early Head Start center-based double session slots to be $2,112,642. However, this cost excludes the impact of the funding already provided by Congress in FY 2016 to expand duration of Early Head Start programs. As discussed below, all of these costs will be covered by that funding.
For non-double session programs, we calculated the proportion of Early Head Start cen-ter-based non-double session slots that operate fewer than 1,380 annual hours (14,270, which is inflated for missing GABI data). First, we divided the average annual Early Head Start cost per child by the average number of hours per year provided across all Early Head Start non-double session center-based slots (1,627.61 hours) to get an average cost per hour

20
Structural Program Option Provisions
of $8.01. Then, to account for fringe, we inflated 80% of this cost per hour by one-third (we assume no additional costs for overhead) because most programs spend approximately 80% of their budget on personnel. This results in an average cost per hour of $10.12.
Further, we assumed all Early Head Start programs would choose to increase the number of days they operate per year to meet the 1,380 annual hour requirement because most Early Head Start programs already operate for a full day. In order to estimate the costs associated with meeting the requirement for these programs, we assumed they would need the full average cost per child per hour, inflated for fringe. Then we multiplied the adjusted cost per child per hour ($10.12) by the average number of hours programs not currently meeting the 1,380 minimum would need to add (210.443 hours) by the number of slots (14,270) that we estimated would need to move to meet 1,380 annual hours to get an esti-mated cost of $30,390,579. However, this cost excludes the impact of the funding already provided by Congress in FY 2016 to expand duration. As discussed below, all of these costs will be covered by that funding.
In sum, the total cost for Early Head Start double session and non-double session cen-ter-based slots to meet the 1,380 requirement is $32,503,221 before accounting for the $294 million in funding Congress has provided in FY 2016 to expand duration. However, be-cause we assume that 5 percent of all programs currently not meeting the 1,380 will receive a waiver to continue operating at their current level of annual hours, we reduce this estimate by 5 percent for a total cost borne by Head Start of $30,878,060 before accounting for the $294 million in funding Congress has provided in FY 2016 to expand duration. These costs will be realized in year three and annually thereafter. As noted, Congress appropriated $294 million in FY 2016 to increase the duration of Early Head Start and Head Start programs. Thus, the entirety of the $30,878,060 costs will be absorbed by this funding.
Extension of Early Head Start Center-based Duration: Costs Borne by Head StartTotal DS
Slots New Slots neededCost per child (less admin) Cost
Double Session (DS) 324 162 $13,041 $2,112,642
SlotsAverage cost per child per hour (less admin) Hours needed Cost
Non-double session 14,270 $10.12 210.443 $30,390,579
Total, excluding FY 2016 duration funding $32,503,221
Less 5 % Waiver, excluding FY 2016 duration funding $30,878,060
Total, including FY 2016 duration funding $0
Start-up Costs for Extension of Center-based Programs
In addition to the cost of extending center-based programs estimated for Head Start and Early Head Start above, there are additional costs associated with facilities and other start-
Structural Program Option Provisions
21
up activities for increasing duration. If there is adequate funding to support these require-ments, there will be a period of ramp-up that most programs will need to implement the duration requirements, therefore we anticipate that a portion of any first 12-month opera-tional award will be available for the purchase or renovation of facilities and other start-up activities before programs begin serving children at the higher duration. These costs would be subsumed in the grant awards to cover the costs estimated above. However, if the requirements are implemented in the absence of adequate additional funding, these start-up costs would represent additional costs that should be estimated here.
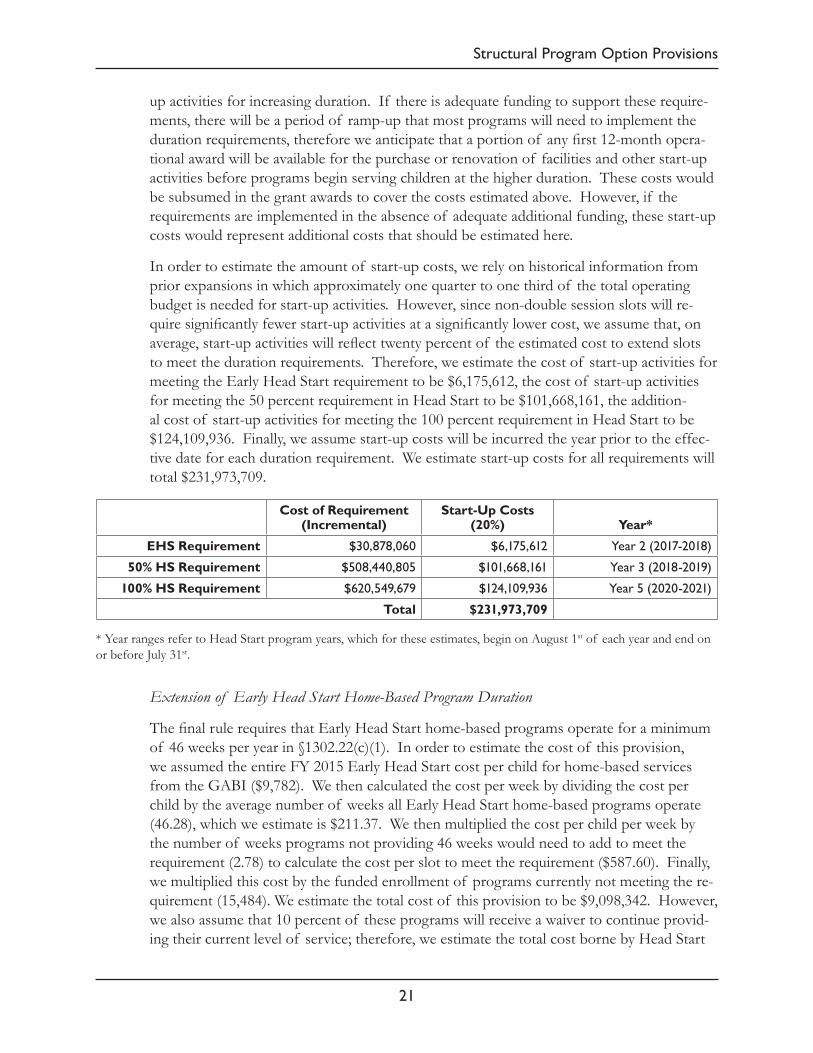
In order to estimate the amount of start-up costs, we rely on historical information from prior expansions in which approximately one quarter to one third of the total operating budget is needed for start-up activities. However, since non-double session slots will re-quire significantly fewer start-up activities at a significantly lower cost, we assume that, on average, start-up activities will reflect twenty percent of the estimated cost to extend slots to meet the duration requirements. Therefore, we estimate the cost of start-up activities for meeting the Early Head Start requirement to be $6,175,612, the cost of start-up activities for meeting the 50 percent requirement in Head Start to be $101,668,161, the addition-al cost of start-up activities for meeting the 100 percent requirement in Head Start to be $124,109,936. Finally, we assume start-up costs will be incurred the year prior to the effec-tive date for each duration requirement. We estimate start-up costs for all requirements will total $231,973,709.
Cost of Requirement (Incremental)
Start-Up Costs (20%) Year*
EHS Requirement $30,878,060 $6,175,612 Year 2 (2017-2018)
50% HS Requirement $508,440,805 $101,668,161 Year 3 (2018-2019)
100% HS Requirement $620,549,679 $124,109,936 Year 5 (2020-2021)
Total $231,973,709
* Year ranges refer to Head Start program years, which for these estimates, begin on August 1st of each year and end on or before July 31st.
Extension of Early Head Start Home-Based Program Duration
The final rule requires that Early Head Start home-based programs operate for a minimum of 46 weeks per year in §1302.22(c)(1). In order to estimate the cost of this provision, we assumed the entire FY 2015 Early Head Start cost per child for home-based services from the GABI ($9,782). We then calculated the cost per week by dividing the cost per child by the average number of weeks all Early Head Start home-based programs operate (46.28), which we estimate is $211.37. We then multiplied the cost per child per week by the number of weeks programs not providing 46 weeks would need to add to meet the requirement (2.78) to calculate the cost per slot to meet the requirement ($587.60). Finally, we multiplied this cost by the funded enrollment of programs currently not meeting the re-quirement (15,484). We estimate the total cost of this provision to be $9,098,342. However, we also assume that 10 percent of these programs will receive a waiver to continue provid-ing their current level of service; therefore, we estimate the total cost borne by Head Start

22
Structural Program Option Provisions
of this provision to be $8,188,508. These costs will be realized in year two and annually thereafter.
Extension of Early Head Start Home-based Duration: Costs Borne by Head StartCost of meeting
46 weeks per slot
Funded enrollment not meeting requirement Total Cost
Cost reduced by 10% waiver
46 weeks for EHS home-based $587.60 15,484 $9,098,342 $8,188,508
Head Start Home-Based Standard Option
We received comments expressing concern about our proposal in the NPRM to remove home-based services as a standard program option for Head Start. These comments are described in detail in the comment and response portion of this rule. In response to these comments, we have retained home-based services as a standard option for preschoolers in the final rule and no longer estimate costs associated with the removal of the home-based option for Head Start.
Waiver Authority for Ratios in Early Head Start Two-year-old Groups
This rule allows, for the first time, programs to request a waiver of ratios for groups with two-year-old children. We believe that programs in states that allow higher ratios for two-year-olds groups or mixed age groups may request waivers to allow them to serve more children and support continuity as children approach pre-school. We anticipate awarding waivers to programs who propose to serve two-year-old children at a ratio of 1:5 rather than 1:4, provided they have sufficient space to meet square footage requirements and can demonstrate it meets the needs of the community, the learning needs of children, and can ensure the change in ratio poses no health and safety risk. We estimate the savings associat-ed with receipt of this waiver here.
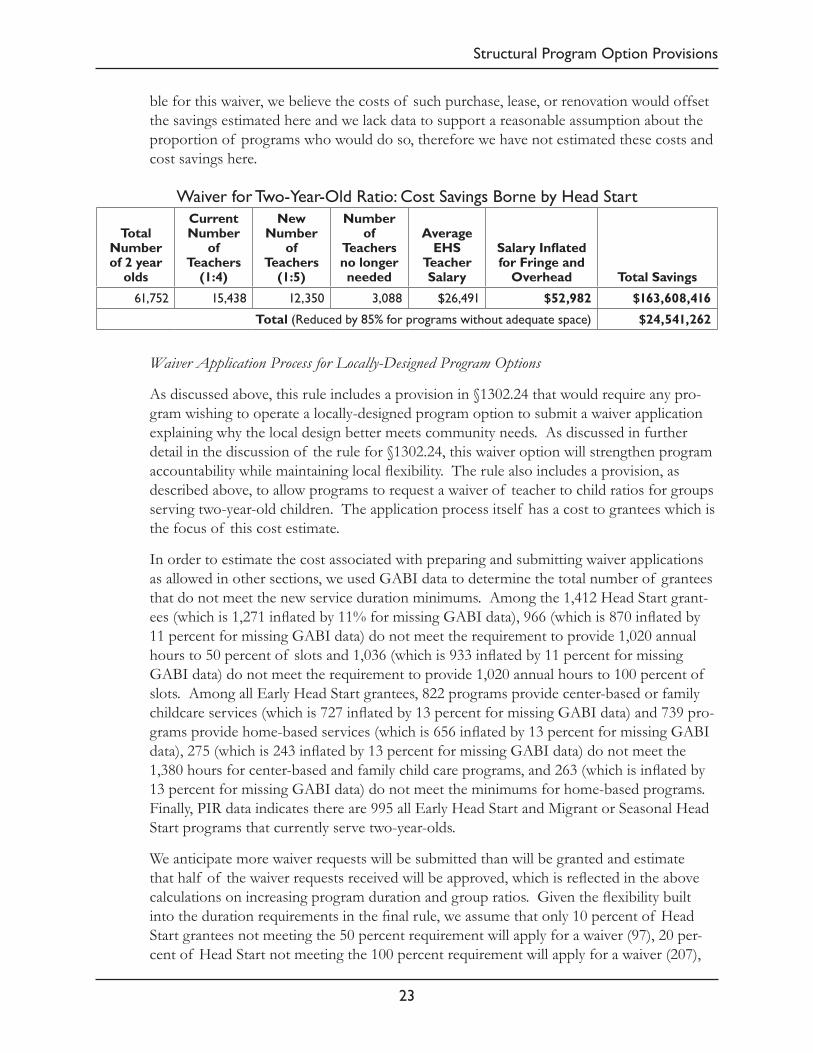
First, we estimated the savings associated with all two-year old groups operating with a 1:5 ratio. We used the total number of two-year-olds currently being served (61,752 from PIR data) to find the number of teachers that would no longer be needed by dividing the number of two-year-olds by the current ratio of 1:4 (which yields 15,438 teachers); and then by the 1:5 ratio that would now be allowed (which yields 12,350 teachers); and taking the difference (3,088). We then multiply this number of teachers that would no longer be needed (3,088) by the average Early Head Start teacher salary of $26,491, doubled to account for fringe and overhead ($52,982) to get a total potential savings of $163,608,416. However, while we assume that 20 percent of programs will apply to waive the ratio re-quirements for two-year olds given our experience with the Early Head Start- Child Care Partnership grantees, we assume that only approximately 15 percent of programs currently serving two-year-olds have adequate space to accommodate the larger group size associated with a 1:5 ratio. As such, we estimate only 15 percent of programs will receive the waiver. Therefore, we estimate that the actual total savings for this provision would be $24,541,262. These costs will be realized in year one and annually thereafter. While we recognize it is possible that programs will opt to purchase, lease, or renovate new space to become eligi-
Structural Program Option Provisions
23
ble for this waiver, we believe the costs of such purchase, lease, or renovation would offset the savings estimated here and we lack data to support a reasonable assumption about the proportion of programs who would do so, therefore we have not estimated these costs and cost savings here.
Waiver for Two-Year-Old Ratio: Cost Savings Borne by Head Start
Total Number of 2 year
olds
Current Number
of Teachers
(1:4)
New Number
of Teachers
(1:5)
Number of
Teachers no longer needed
Average EHS
Teacher Salary
Salary Inflated for Fringe and
Overhead Total Savings
61,752 15,438 12,350 3,088 $26,491 $52,982 $163,608,416
Total (Reduced by 85% for programs without adequate space) $24,541,262
Waiver Application Process for Locally-Designed Program Options
As discussed above, this rule includes a provision in §1302.24 that would require any pro-gram wishing to operate a locally-designed program option to submit a waiver application explaining why the local design better meets community needs. As discussed in further detail in the discussion of the rule for §1302.24, this waiver option will strengthen program accountability while maintaining local flexibility. The rule also includes a provision, as described above, to allow programs to request a waiver of teacher to child ratios for groups serving two-year-old children. The application process itself has a cost to grantees which is the focus of this cost estimate.
In order to estimate the cost associated with preparing and submitting waiver applications as allowed in other sections, we used GABI data to determine the total number of grantees that do not meet the new service duration minimums. Among the 1,412 Head Start grant-ees (which is 1,271 inflated by 11% for missing GABI data), 966 (which is 870 inflated by 11 percent for missing GABI data) do not meet the requirement to provide 1,020 annual hours to 50 percent of slots and 1,036 (which is 933 inflated by 11 percent for missing GABI data) do not meet the requirement to provide 1,020 annual hours to 100 percent of slots. Among all Early Head Start grantees, 822 programs provide center-based or family childcare services (which is 727 inflated by 13 percent for missing GABI data) and 739 pro-grams provide home-based services (which is 656 inflated by 13 percent for missing GABI data), 275 (which is 243 inflated by 13 percent for missing GABI data) do not meet the 1,380 hours for center-based and family child care programs, and 263 (which is inflated by 13 percent for missing GABI data) do not meet the minimums for home-based programs. Finally, PIR data indicates there are 995 all Early Head Start and Migrant or Seasonal Head Start programs that currently serve two-year-olds.
We anticipate more waiver requests will be submitted than will be granted and estimate that half of the waiver requests received will be approved, which is reflected in the above calculations on increasing program duration and group ratios. Given the flexibility built into the duration requirements in the final rule, we assume that only 10 percent of Head Start grantees not meeting the 50 percent requirement will apply for a waiver (97), 20 per-cent of Head Start not meeting the 100 percent requirement will apply for a waiver (207),

24
Structural Program Option Provisions
10 percent of Early Head Start center-based grantees not meeting the new minimums will apply for a waiver (28), and 20 percent of Early Head Start home-based grantees not meet-ing the new minimums will apply for a waiver (53). Finally, we assume that 20 percent of programs serving two-year-olds will apply for a waiver (199), even though only 15 percent of programs will receive it. Based on these assumptions we expect a total of 199 waiver applications in year one, 252 waiver applications in year two, 280 waiver applications in year three, 377 waiver applications in years four and five, and 487 waiver applications in year 6. Finally, we assume upon full implementation of the rule, programs would choose to reapply once every five years, resulting in an estimated 97 waiver applications annually in year 7 and ongoing.
In order to calculate the costs associated with these applications, we assume that each waiver application will require 8 hours of a program director’s time at $35.36 per hour. Therefore, we calculate the cost associated with the applications by multiplying the number of applications by 8 hours of a center director’s hourly wage ($285.30). Using this method, we calculate the total cost associated with these waiver provisions for each year in the table below. Then we applied the proportion of Head Start center director’s salary paid for with Head Start funds (75.3 percent) to the cost by year to find the costs borne by Head Start and the costs borne by other parties in the table below.
Waiver Applications: Total Cost to SocietyNumber of Programs Hours Cost per Hour Cost
50% HS Center-based duration 97 8 $35.36 $27,551
100% HS Center-based duration 207 8 $35.36 $59,093
EHS Center-based duration 28 8 $35.36 $7,988
EHS Home-based duration 53 8 $35.36 $15,121
Two-year-old ratio 199 8 $35.36 $56,775
The table below describes the cost to society disaggregated by costs borne by Head Start and costs borne by other parties for years three through ten. We assumed that programs would only apply for waivers once the compliance date of the provision they are request-ing a waiver for has passed. Therefore, we assumed that the cost of applying for a waiver from the 50 percent Head Start center-based duration requirement would be borne in years three through five; the cost of applying for a waiver from the 100 percent Head Start cen-ter-based duration requirement would be borne in year six; the cost of applying for a waiver from the Early Head Start center-based would be borne beginning in year three; the cost of applying for a waiver from the Early Head Start home-based duration requirement would be borne beginning in year two; and the cost of applying for a waiver from the Early Head Start ratio requirement would be borne beginning in year one. Finally, we assume upon full implementation of the rule, programs would choose to reapply once every five years, result-ing in the costs for years seven through ten.

Structural Program Option Provisions
25
Waiver Applications: Costs Borne by Head Start and by Other PartiesYear 1 Year 2 Year 3 Year 4 Year 5 Year 6 Years 7 -10
Cost to Society $56,775 $71,896 $79,884 $107,435 $107,435 $138,977 $27,795
Cost to Head Start (75.3%) $42,751 $54,137 $60,153 $80,899 $80,899 $104,650 $20,930
Cost borne by other
parties $14,023 $17,758 $19,731 $26,537 $26,537 $34,327 $6,865
Home Visits for Frequently Absent Children
The rule includes a new provision in §1302.16 that requires programs to provide addition-al services to families of children who are frequently absent (for non-illness or IFSP/IEP related reasons), which may include a home visit. This requirement will improve consistent attendance, which is important because research demonstrates that attendance is predic-tive of school success. For example, one study conducted in the Chicago Public Schools shows that preschool attendance is important for several reasons: (1) it sets up patterns for long-term school attendance; (2) children who regularly attend preschool perform better on kindergarten entry assessments tests; and 3) regular attendance enhances social-emotional development.32 Another study in Tulsa found that preschoolers who attended regularly showed more growth in literacy skills than their peers who were frequently absent.33 In Baltimore, researchers found that 25 percent of children who were chronically absent in pre-kindergarten and kindergarten were retained in later grades, compared to nine percent of their peers who regularly attended in these early years.34
We considered both monetary costs as well as opportunity costs in estimating the total cost of this new provision in §1302.16. In order to estimate the associated monetary costs, we used data from the Family and Child Experience Survey (FACES) and babyFACES, which are federally funded nationally representative surveys of Head Start and Early Head Start programs, respectively. These studies provided estimates of the proportion of children in both Head Start and Early Head Start who are absent for more than 20 days in a given school year. For Head Start, FACES data suggests 5.6 percent of children are absent for more than 20 days. We used this proportion as a proxy for the proportion of children who are frequently absent, and would trigger the requirement in the rule for an additional home visit. For Early Head Start, we assumed approximately half of this proportion would be children for whom absences were explained, given the frequency of illness among very young children and thus would not trigger this requirement. Therefore, we used half (17 percent) of the proportion from babyFACES data (34 percent) as a proxy for children in Early Head Start who are chronically absent and would thus trigger additional services, which could include an extra home visit. Then, we estimated the number of extra home
32 Allensworth, E. M., Ehrlich, S. B., Gwynne, J. A., & Pareja, A. S. (2013). Preschool Attendance in Chicago Public Schools: Relationships with Learning Outcomes and Reasons for Absences.33 Community Action Project Tulsa County. (2012). Attendance Works Peer Learning Network Webinar.34 Connolly, F., & Olson, L. S. (2012). Early Elementary Performance and Attendance in Baltimore City Schools’ Pre-Kindergarten and Kindergarten. Baltimore Education Research Consortium.
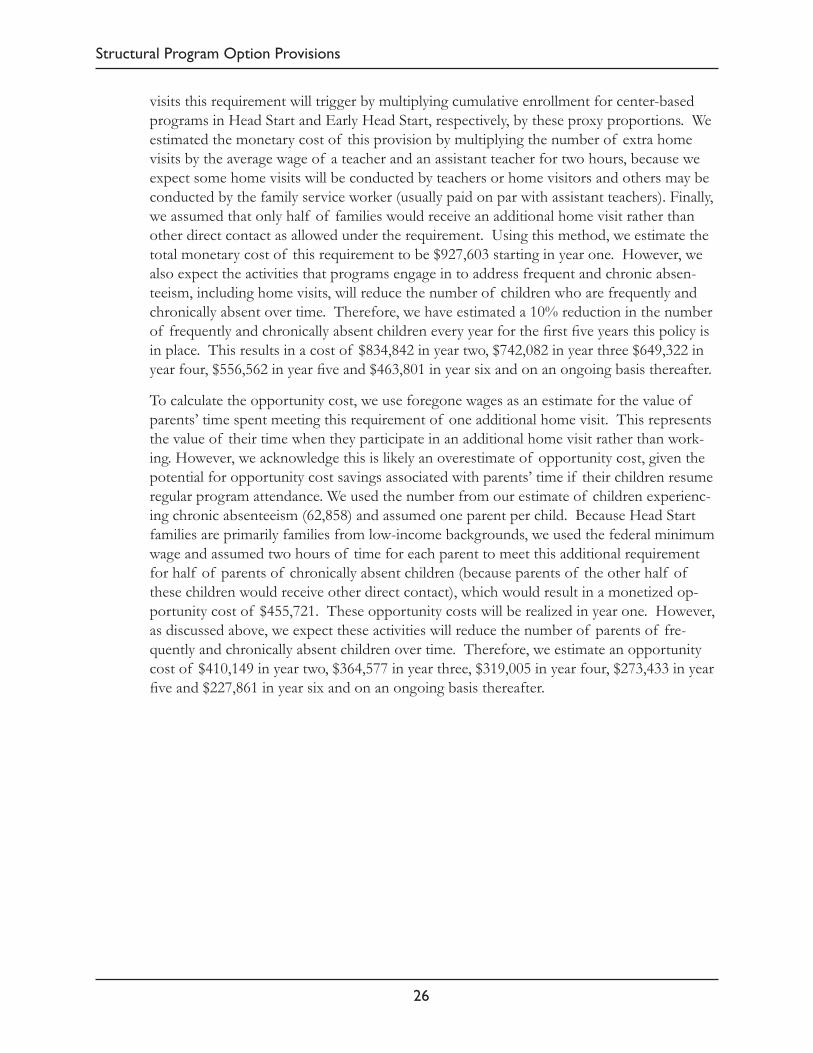
26
Structural Program Option Provisions
visits this requirement will trigger by multiplying cumulative enrollment for center-based programs in Head Start and Early Head Start, respectively, by these proxy proportions. We estimated the monetary cost of this provision by multiplying the number of extra home visits by the average wage of a teacher and an assistant teacher for two hours, because we expect some home visits will be conducted by teachers or home visitors and others may be conducted by the family service worker (usually paid on par with assistant teachers). Finally, we assumed that only half of families would receive an additional home visit rather than other direct contact as allowed under the requirement. Using this method, we estimate the total monetary cost of this requirement to be $927,603 starting in year one. However, we also expect the activities that programs engage in to address frequent and chronic absen-teeism, including home visits, will reduce the number of children who are frequently and chronically absent over time. Therefore, we have estimated a 10% reduction in the number of frequently and chronically absent children every year for the first five years this policy is in place. This results in a cost of $834,842 in year two, $742,082 in year three $649,322 in year four, $556,562 in year five and $463,801 in year six and on an ongoing basis thereafter.
To calculate the opportunity cost, we use foregone wages as an estimate for the value of parents’ time spent meeting this requirement of one additional home visit. This represents the value of their time when they participate in an additional home visit rather than work-ing. However, we acknowledge this is likely an overestimate of opportunity cost, given the potential for opportunity cost savings associated with parents’ time if their children resume regular program attendance. We used the number from our estimate of children experienc-ing chronic absenteeism (62,858) and assumed one parent per child. Because Head Start families are primarily families from low-income backgrounds, we used the federal minimum wage and assumed two hours of time for each parent to meet this additional requirement for half of parents of chronically absent children (because parents of the other half of these children would receive other direct contact), which would result in a monetized op-portunity cost of $455,721. These opportunity costs will be realized in year one. However, as discussed above, we expect these activities will reduce the number of parents of fre-quently and chronically absent children over time. Therefore, we estimate an opportunity cost of $410,149 in year two, $364,577 in year three, $319,005 in year four, $273,433 in year five and $227,861 in year six and on an ongoing basis thereafter.
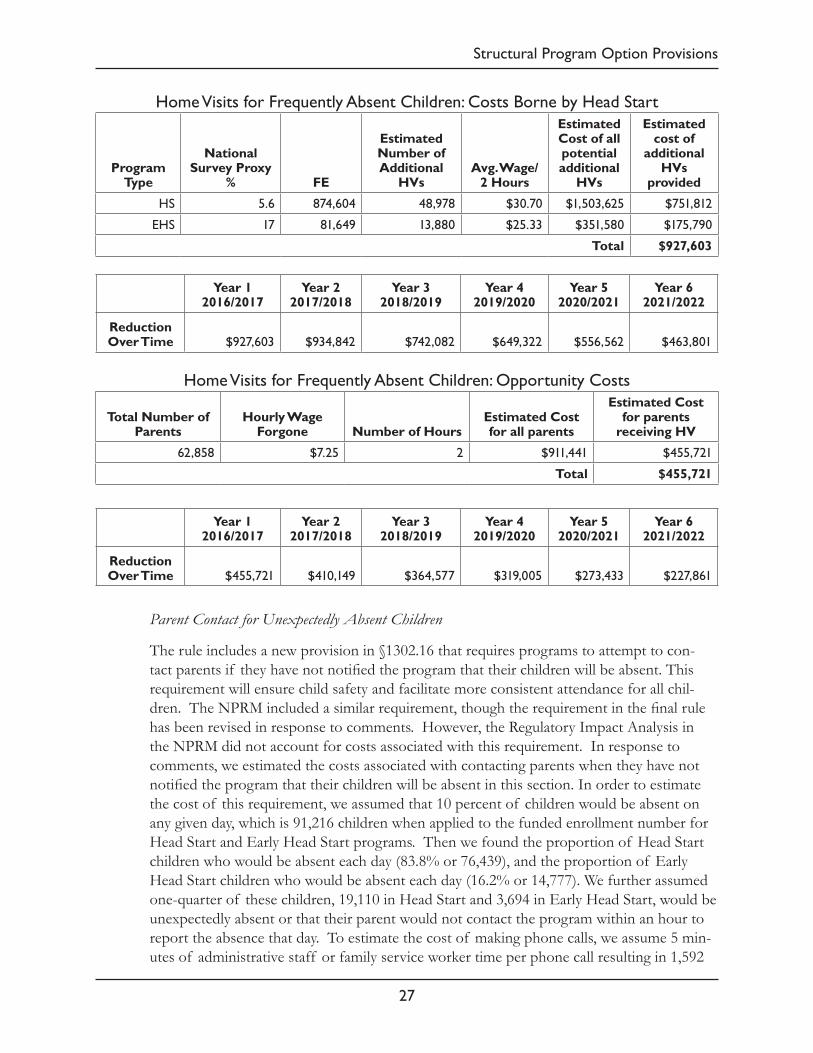
Structural Program Option Provisions
27
Home Visits for Frequently Absent Children: Costs Borne by Head Start
Program Type
National Survey Proxy
% FE
Estimated Number of Additional
HVsAvg. Wage/
2 Hours
Estimated Cost of all potential additional
HVs
Estimated cost of
additional HVs
provided
HS 5.6 874,604 48,978 $30.70 $1,503,625 $751,812
EHS 17 81,649 13,880 $25.33 $351,580 $175,790
Total $927,603
Year 1 2016/2017
Year 2 2017/2018
Year 3 2018/2019
Year 4 2019/2020
Year 5 2020/2021
Year 6 2021/2022
Reduction Over Time $927,603 $934,842 $742,082 $649,322 $556,562 $463,801
Home Visits for Frequently Absent Children: Opportunity Costs
Total Number of Parents
Hourly Wage Forgone Number of Hours
Estimated Cost for all parents
Estimated Cost for parents
receiving HV
62,858 $7.25 2 $911,441 $455,721
Total $455,721
Year 1 2016/2017
Year 2 2017/2018
Year 3 2018/2019
Year 4 2019/2020
Year 5 2020/2021
Year 6 2021/2022
Reduction Over Time $455,721 $410,149 $364,577 $319,005 $273,433 $227,861
Parent Contact for Unexpectedly Absent Children
The rule includes a new provision in §1302.16 that requires programs to attempt to con-tact parents if they have not notified the program that their children will be absent. This requirement will ensure child safety and facilitate more consistent attendance for all chil-dren. The NPRM included a similar requirement, though the requirement in the final rule has been revised in response to comments. However, the Regulatory Impact Analysis in the NPRM did not account for costs associated with this requirement. In response to comments, we estimated the costs associated with contacting parents when they have not notified the program that their children will be absent in this section. In order to estimate the cost of this requirement, we assumed that 10 percent of children would be absent on any given day, which is 91,216 children when applied to the funded enrollment number for Head Start and Early Head Start programs. Then we found the proportion of Head Start children who would be absent each day (83.8% or 76,439), and the proportion of Early Head Start children who would be absent each day (16.2% or 14,777). We further assumed one-quarter of these children, 19,110 in Head Start and 3,694 in Early Head Start, would be unexpectedly absent or that their parent would not contact the program within an hour to report the absence that day. To estimate the cost of making phone calls, we assume 5 min-utes of administrative staff or family service worker time per phone call resulting in 1,592

28
Staff Quality Provisions
hours of staff time per day across all Head Start programs and 308 hours of staff time per day across all Early Head Start programs. As a proxy for the hourly wage of this staff person, we averaged the hourly wage of Head Start and Early Head Start assistant teachers ($11.72). Then we estimate the cost associated with this provision per day to be this hourly wage multiplied by the number of hours of staff time, which is $18,650 for Head Start programs and $3,608 for Early Head Start programs. Finally, in order to estimate the cost of this provision annually, we multiplied the cost per day by the average number of days currently provided by Head Start (146.8) for a cost of $2,737,861 per year in Head Start, and by the average number of days currently provided by Early Head Start (222.364) for a cost of $802,338 per year in Early Head Start. Finally, we summed these costs for a total cost per year across all programs of $3,540,199.
Parent Contact for Unexpectedly Absent ChildrenNumber of Absent Children
Number of Unexpectedly
Absent Children
Hours of Staff Time
(5 mins per call)
Hours of Staff Time
(5 mins per call)Cost Per
DayCost Per
Year
Head Start 76,439 19,110 1,592 $18,650 $2,737,861
Early Head Start 14,777 3,694 308 $3,608 $802,338
Total $3,540,199
ii. Staff Quality Provisions
This rule also includes several provisions to improve the quality of staff in Head Start and Early Head Start programs. Specifically, we analyzed costs associated with the following requirements: minimum of associate’s degree for all Head Start teachers in §1302.91(e)(2)(ii); minimum of CDA or equivalent credential for all home visitors in §1302.91(e)(6)(i); credentials for newly hired family services workers in §1302.91(e)(7); credentials for newly hired management staff in §1302.91(d)(1)(i); and mentor coaching in §1302.92(d).
Associate’s Degree (AA) for Head Start Teachers
The Act detailed new degree requirements for all Head Start teachers. Specifically, 648A(a)(3)(B) of the Act codified a minimum requirement that all Head Start teachers have at least an associate’s degree. While progress towards meeting this requirement has been substan-tial, according to PIR data, a small percentage of Head Start teachers in 2015 (4.2%) did not have such a degree. In this rule, we added this requirement into the staff qualifications sec-tion of the performance standards in §1302.91(e)(2)(ii). Given that some teachers do not have the minimum degree, we estimated the cost associated with this requirement by find-ing the respective differences in average salaries for teachers with no credential and teachers with a Child Development Associate (CDA), compared to teachers with associate’s degrees. We then multiplied the number of teachers who currently have no credential or the number of teachers who currently have only a CDA by the additional salary for each group. Finally, we increased the estimated salary for these teachers by one-third to account for fringe ben-efits (we assumed no additional overhead costs). Using this method, we estimate the total
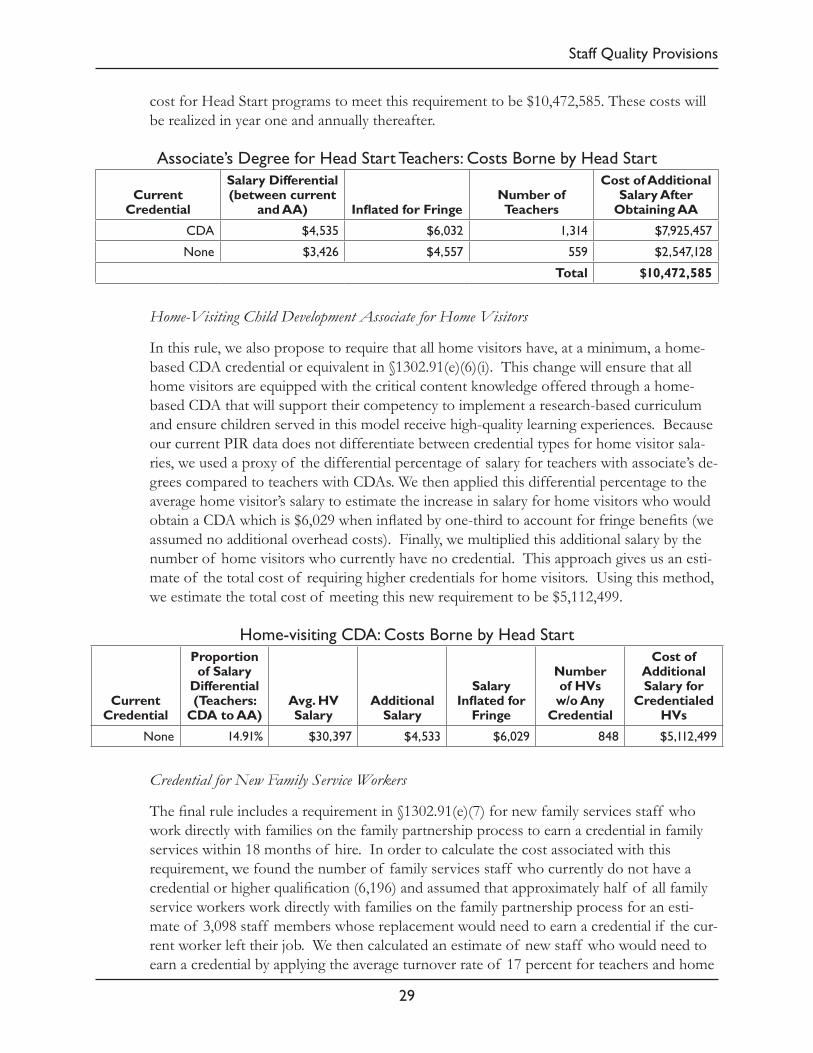
Staff Quality Provisions
29
cost for Head Start programs to meet this requirement to be $10,472,585. These costs will be realized in year one and annually thereafter.
Associate’s Degree for Head Start Teachers: Costs Borne by Head Start
Current Credential
Salary Differential (between current
and AA) Inflated for FringeNumber of Teachers
Cost of Additional Salary After
Obtaining AA
CDA $4,535 $6,032 1,314 $7,925,457
None $3,426 $4,557 559 $2,547,128
Total $10,472,585
Home-Visiting Child Development Associate for Home Visitors
In this rule, we also propose to require that all home visitors have, at a minimum, a home-based CDA credential or equivalent in §1302.91(e)(6)(i). This change will ensure that all home visitors are equipped with the critical content knowledge offered through a home-based CDA that will support their competency to implement a research-based curriculum and ensure children served in this model receive high-quality learning experiences. Because our current PIR data does not differentiate between credential types for home visitor sala-ries, we used a proxy of the differential percentage of salary for teachers with associate’s de-grees compared to teachers with CDAs. We then applied this differential percentage to the average home visitor’s salary to estimate the increase in salary for home visitors who would obtain a CDA which is $6,029 when inflated by one-third to account for fringe benefits (we assumed no additional overhead costs). Finally, we multiplied this additional salary by the number of home visitors who currently have no credential. This approach gives us an esti-mate of the total cost of requiring higher credentials for home visitors. Using this method, we estimate the total cost of meeting this new requirement to be $5,112,499.
Home-visiting CDA: Costs Borne by Head Start
Current Credential
Proportion of Salary
Differential (Teachers:
CDA to AA)Avg. HV Salary
Additional Salary
Salary Inflated for
Fringe
Number of HVs w/o Any
Credential
Cost of Additional Salary for
Credentialed HVs
None 14.91% $30,397 $4,533 $6,029 848 $5,112,499
Credential for New Family Service Workers
The final rule includes a requirement in §1302.91(e)(7) for new family services staff who work directly with families on the family partnership process to earn a credential in family services within 18 months of hire. In order to calculate the cost associated with this requirement, we found the number of family services staff who currently do not have a credential or higher qualification (6,196) and assumed that approximately half of all family service workers work directly with families on the family partnership process for an esti-mate of 3,098 staff members whose replacement would need to earn a credential if the cur-rent worker left their job. We then calculated an estimate of new staff who would need to earn a credential by applying the average turnover rate of 17 percent for teachers and home

30
Staff Quality Provisions
visitors as a proxy (because we do not have data on turnover of family services staff) for an annual estimate of 542 staff turning over. Then we assumed the average cost for each staff person to get the necessary credential within 18 months would be $1,013, based on an aver-age of costs for common family development credentials. Therefore, we estimate the cost of this provision at $549,046 annually. Given the difficulty, programs may face in the future finding staff that already have this credential, we have assumed this cost will be an ongoing annual cost. Therefore, these costs will be realized in year one and annually thereafter.
Credential for New Family Service Workers: Costs Borne by Head Start
Number of Family Service Workers w/o Credential
Proportion of Staff working
directly on Family
PartnershipsEstimated
Turnover rate
Total Staff Affected Annually
Cost of Credential
Total Estimated
Cost
6,196 3,098 17% 542 $1,013 $549,046
Bachelor’s Degree for New Management Staff
In response to comments described in the preamble of this rule, the final rule includes a requirement in §1302.91(d)(1) that newly hired staff who oversee health, disabilities, and family support services must have a bachelor’s degree (BA). If a grantee assigns a separate area manager for each of these three service areas, it would result in three additional man-agers being required to hold a BA or higher. However, it is currently common practice for programs to assign the duties associated with the oversight of two service areas to a single manager. We assume that half of programs assign oversight of disabilities services to their Education Coordinator (who is already required to have a BA), which would lead to two managers (one for health and one for family support services) needing to possess BAs, and that half of programs would assign oversight of disabilities and family services or health to a single manager. Therefore, we estimate that two managers at each program will need to possess BAs to meet this requirement.
We then estimated the number of supervisors or management staff affected by the require-ment who do not currently have a BA. We used data from the PIR on the education level of family services supervisors because we do not collect data on the educational attainment of other service area managers. Data indicate that 1,255 family services supervisors do not have a B.A. or higher. This estimate was then doubled based on the calculations and assumptions above for an estimate of 2,510 supervisory staff who do not currently have a B.A. or higher. Because we do not have turnover information on management staff, we then applied the average turnover rate for teachers and home visitors (17 percent) as a proxy, to the number of service managers without a B.A., in order to estimate the total number of managers without a BA that would turn-over each year (accounting for those who acquired a BA in prior years, through year ten).
Then, in order to determine the anticipated salary increase for managers with a B.A, we averaged the current salaries for family services, health, and disabilities managers from the PIR ($44,583) and found the difference between this salary and the average salary of education coordinators ($50,252) who are currently required to have a B.A. to estimate the

Staff Quality Provisions
31
average increase in salary for new managers with a B.A. ($5,669). We then inflated this additional salary by one-third to account for fringe benefits (we assumed no additional overhead) which is $7,540. We then applied this difference to the number of staff affected annually. Further, we applied the average proportion of management staff salaries’ borne by Head Start (67.8%) to find the cost borne by Head Start and the cost borne by other parties in years one through ten.
Bachelor’s Degree for New Management Staff: Costs Borne by Head Start and by Other Parties
Family Service Supervisors without
BA or higherInflated for other service areas (2)
Estimated Annual Turnover Rate
Estimated increase in salary
1,255 2,510 17% $7,540
Cost to Society Costs Borne by HSCosts Borne by Other
Parties
Year 1 $3,219,482 $ 2,182,809 $1,036,673
Year 2 $5,865,941 $ 3,977,108 $1,888,833
Year 3 $8,135,412 $5,515,809 $2,619,603
Year 4 $10,027,894 6,798,912 $3,228,982
Year 5 $11,543,388 $7,826,417 $3,716,971
Year 6 $12,870,387 $8,726,123 $4,144,265
Year 7 $13,820,398 $9,370,230 $4,450,168
Year 8 $14,770,409 $10,014,338 $4,756,072
Year 9 $15,524,386 $10,525,534 $4,998,852
Year 10 $16,089,869 $10,908,931 $5,180,938
Mentor Coaching
In this rule, we require programs to have a system of professional development in place that includes an intensive coaching strategy for teachers. As described in further detail in the discussion of the rule for §1302.92(d), this change will ensure teaching staff receive effective professional development, based on a growing body of research demonstrating the effectiveness of intensive professional development for improving teacher practices in early care and education settings35,36,37 and research demonstrating that such strategies support
35 Buysse, V., & Wesley, P. W. (2005). Consultation in Early Childhood Settings. Baltimore, MD: Paul H. Brookes Publishing.36 Tout, K., Halle, T., Zaslow, M., & Starr, R. (2009). Evaluation of the Early Childhood Educator Professional Development Program: Final Report: Report prepared for the U.S. Department of Education.37 Zaslow, M., Tout, K., Halle, T., Vick, J., & Lavelle, B. (2010). Towards the identification of features of effective professional development for early childhood educators: A review of the literature. Report prepared for the U.S. Department of Education.

32
Staff Quality Provisions
improved teacher practice in the classroom and an increase in classroom quality.38,39 This provision also gives programs some flexibility to identify the education staff that would benefit most from this form of intensive professional development and direct their efforts accordingly.
There are various ways that programs can secure the services of mentor coaches in order to meet this requirement. For example, grantees could hire a full-time mentor coach(es), mentor coaches could work part time in multiple programs, or geographically defined consortiums could be created to enable grantees to access the services of mentor coach-es. However, for the purposes of this estimate, we use a caseload of one coach per 15 teachers or teaching teams, and an overall salary comparable to that of an education man-ager ($50,252 from PIR), doubled for fringe benefits and overhead, which is estimated at $100,504 for each mentor coach. We assumed a caseload of 15 teachers based on a review of the literature that suggests caseloads vary across coaching models but that full-time coaches, on average, usually reported caseloads ranging from 13 to 22, though some coach-es had much higher or much lower caseloads.40,41,42 We then calculated the total number of mentor coaches needed to support all education staff by using 62,495 teachers (the number of lead Head Start and Early Head Start teachers) as a proxy for the total number of teachers and teaching teams that would receive mentor coaching. We estimated the cost of providing 4,238 coaches for 63,566 teachers or teaching teams at $425,935,952. We then assume that programs will utilize their flexibility to identify education staff or teaching teams who would most benefit from this type of professional development. We believe that while the proportion of teachers and teaching teams receiving coaching will vary by program, overall this will result in approximately one-third of teaching staff receiving inten-sive coaching on average. Therefore, our final estimate for the cost of the requirement is $141,978,651.
Given the lack of data regarding the quality and scope of coaching strategies programs may currently be using, we do not give any credit for programs that may already utilize mentor coaches in this estimate. Further, we acknowledge that this estimate may be an underesti-mate if Congress appropriates the necessary additional funds to support increased duration of Head Start and Early Head Start programs because additional teaching staff will need to be hired to support the transition of double session slots to full school day and full school
38 Isner, T., Tout, K., Zaslow, M., Soli, M., Quinn, K., Rothenberg, L., & Burkhauser, M. (2011). Coaching in early care and education programs and Quality Rating and Improvement Systems (QRIS): Identifying promising features. Child Trends.39 Lloyd, C. M., & Modlin, E. L. (2012). Coaching as a key component in teachers’ professional development: Improving classroom practices in Head Start settings. Administration for Children and Families.40 Howard, E. C., Rankin, V. E., Fishman, M., Hawkinson, L. E., McGroder, S. M., Helsel, F. K., et al. (2013). The Descriptive Study of the Head Start Early Learning Mentor Coach Initiative. OPRE Report #2014-5a; Washington, DC: U.S. Department of Health and Human Services, Administration for Children and Families, Office of Planning, Research and Evaluation.41 Isner, Tout, Zaslow, Soli, Quinn, Rothenberg and Burkhauser (2011). Coaching in Early Care and Education Programs and Quality Rating and Improvement Systems (QRIS): Identifying Promising Features. www.childtrends.org/wp.../2011-35CoachingQualityImprovement.pdf42 Yoshikawa, H., Weiland, C., Brooks-Gunn, J., Burchinal, M. R., Espinosa, L. M., Gormley, W. T., ... & Zaslow, M. J. (2013). Investing in our future: The evidence base on preschool education. Ann Arbor, MI: Society for Research in Child Development.

Curriculum and Assessment Provisions
33
year slots. We estimate that an additional 3,906 teachers would need to be hired to transi-tion all programs from double sessions, which would be associated with an additional cost of $8,723,452 and a new total cost of $150,702,102. However, this estimate may be an overestimate if the rule is fully implemented without additional funding and the Secretary does not exercise the discretion to reduce the duration requirements because the number of teachers would not increase. Therefore, a reasonable assumption for calculating this esti-mate is to use the status quo as the basis of the total number of education staff who may receive mentor coaching.
These costs will be realized in year two and annually thereafter.
Mentor Coaching: Costs Borne by Head StartMentor Coach
Salary, Fringe and Overhead
Number of Teachers and FCC
providersNumber of
CoachesEstimate for all
TeachersEstimate for 1/3
of Teachers
$100,504 63,566 4,238 $425,935,952 $141,978,651
iii. Curriculum and Assessment Provisions
This rule includes several provisions to improve curriculum and assessments. We ana-lyzed costs associated with the following specific requirements: improving curriculum in §1302.32(a)(1); monitoring the fidelity of curriculum implementation in §1302.32(a)(2); language assessment in home language and English for all dual language learners in §1302.33(c)(2), and opportunities for parents to participate in a parenting curriculum in §1302.51(b). We analyzed savings associated with the removal of Head Start designed IEPs from part 1308 of the previous standards.
Improving Curriculum
In this rule, we include several provisions intended to improve the quality of curricula that programs select in §1302.32(a)(1). Specifically, these new provisions will require programs to critically analyze the curricula they use to determine whether they are appropriately aligned with and sufficiently content-rich to support growth in the domains outlined in the Head Start Early Learning Outcomes Framework: Ages Birth to Five. This change will ensure all programs select and implement curricula with the key qualities that research sug-
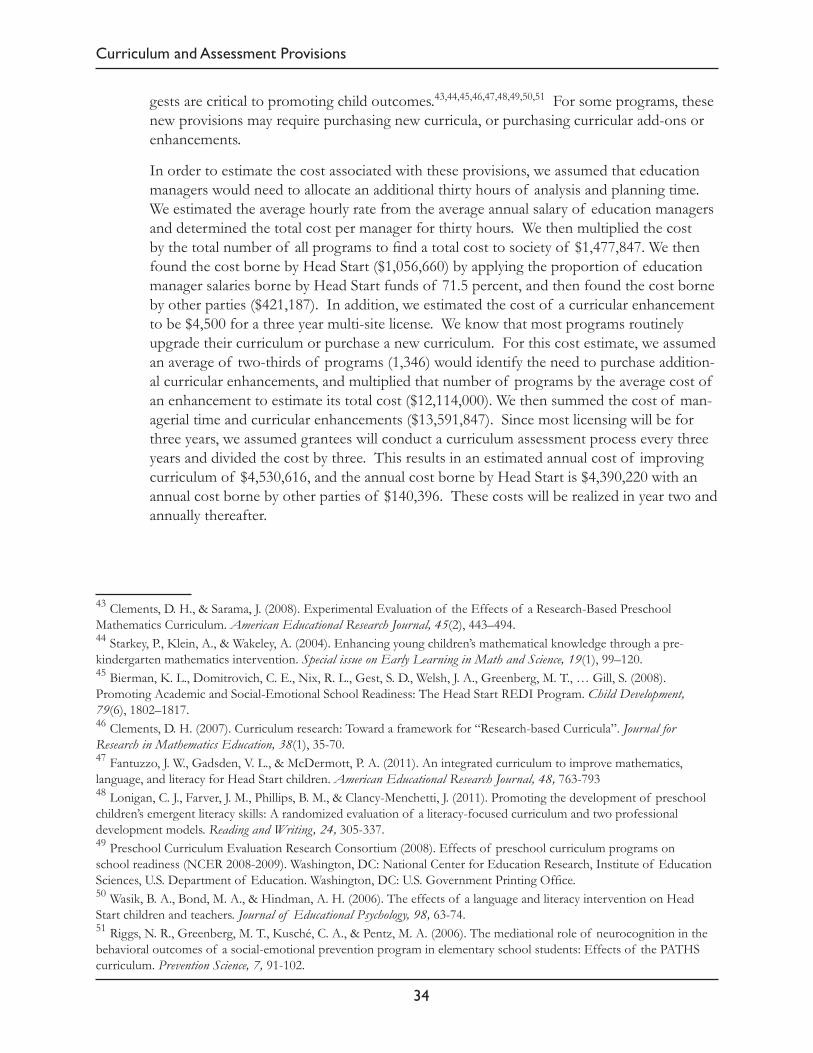
34
Curriculum and Assessment Provisions
gests are critical to promoting child outcomes.43,44,45,46,47,48,49,50,51 For some programs, these new provisions may require purchasing new curricula, or purchasing curricular add-ons or enhancements.
In order to estimate the cost associated with these provisions, we assumed that education managers would need to allocate an additional thirty hours of analysis and planning time. We estimated the average hourly rate from the average annual salary of education managers and determined the total cost per manager for thirty hours. We then multiplied the cost by the total number of all programs to find a total cost to society of $1,477,847. We then found the cost borne by Head Start ($1,056,660) by applying the proportion of education manager salaries borne by Head Start funds of 71.5 percent, and then found the cost borne by other parties ($421,187). In addition, we estimated the cost of a curricular enhancement to be $4,500 for a three year multi-site license. We know that most programs routinely upgrade their curriculum or purchase a new curriculum. For this cost estimate, we assumed an average of two-thirds of programs (1,346) would identify the need to purchase addition-al curricular enhancements, and multiplied that number of programs by the average cost of an enhancement to estimate its total cost ($12,114,000). We then summed the cost of man-agerial time and curricular enhancements ($13,591,847). Since most licensing will be for three years, we assumed grantees will conduct a curriculum assessment process every three years and divided the cost by three. This results in an estimated annual cost of improving curriculum of $4,530,616, and the annual cost borne by Head Start is $4,390,220 with an annual cost borne by other parties of $140,396. These costs will be realized in year two and annually thereafter.
43 Clements, D. H., & Sarama, J. (2008). Experimental Evaluation of the Effects of a Research-Based Preschool Mathematics Curriculum. American Educational Research Journal, 45(2), 443–494.44 Starkey, P., Klein, A., & Wakeley, A. (2004). Enhancing young children’s mathematical knowledge through a pre-kindergarten mathematics intervention. Special issue on Early Learning in Math and Science, 19(1), 99–120.45 Bierman, K. L., Domitrovich, C. E., Nix, R. L., Gest, S. D., Welsh, J. A., Greenberg, M. T., … Gill, S. (2008). Promoting Academic and Social-Emotional School Readiness: The Head Start REDI Program. Child Development, 79(6), 1802–1817.46 Clements, D. H. (2007). Curriculum research: Toward a framework for “Research-based Curricula”. Journal for Research in Mathematics Education, 38(1), 35-70.47 Fantuzzo, J. W., Gadsden, V. L., & McDermott, P. A. (2011). An integrated curriculum to improve mathematics, language, and literacy for Head Start children. American Educational Research Journal, 48, 763-79348 Lonigan, C. J., Farver, J. M., Phillips, B. M., & Clancy-Menchetti, J. (2011). Promoting the development of preschool children’s emergent literacy skills: A randomized evaluation of a literacy-focused curriculum and two professional development models. Reading and Writing, 24, 305-337.49 Preschool Curriculum Evaluation Research Consortium (2008). Effects of preschool curriculum programs on school readiness (NCER 2008-2009). Washington, DC: National Center for Education Research, Institute of Education Sciences, U.S. Department of Education. Washington, DC: U.S. Government Printing Office.50 Wasik, B. A., Bond, M. A., & Hindman, A. H. (2006). The effects of a language and literacy intervention on Head Start children and teachers. Journal of Educational Psychology, 98, 63-74.51 Riggs, N. R., Greenberg, M. T., Kusché, C. A., & Pentz, M. A. (2006). The mediational role of neurocognition in the behavioral outcomes of a social-emotional prevention program in elementary school students: Effects of the PATHS curriculum. Prevention Science, 7, 91-102.

Curriculum and Assessment Provisions
35
Improving Curriculum: Costs Borne by Head Start and by Other PartiesAvg. Ed
Manager Salary
Cost of 30 Hours
Number of Programs
Estimated Cost to Society
Costs Borne by Head
Start
Costs Borne by Other Parties
Additional Staff Time $50,252 $724.79 2,039 $1,477,847 $1,056,660 $421,187
Avg. Cost of Enhancement
Number of Programs
66% of Programs
Estimated Cost to Society
Curricular Enhancement $9,000 2,039 1,346 $12,114,000
Estimated Cost to Society
Costs Borne by Head
Start
Costs Borne by Other Parties
Total $13,591,847 $13,170,660 $421,187
Annual Total $4,530,616 $4,390,220 $140,396
Monitoring Fidelity of Curriculum Implementation
In addition to the curriculum quality requirements described in the previous section, this rule also requires in §1302.32(a)(2) that programs provide adequate supervision and regular monitoring of curriculum use to ensure effective curriculum implementation, which is criti-cal to reaping the benefits of using high quality curricula described above.52,53
In order to estimate the cost associated with this provision, we researched the cost of cur-riculum fidelity kits, which help programs assess how well their teachers are implementing a particular curricula through planned activities. At present, few curricula offer such a kit. However, based on those that are available, we assessed the average cost of an implemen-tation tool kit at $50. We then multiplied that estimate by the number of programs to find the total cost of this provision. We did not estimate additional staff time, because monitor-ing and staff supervision was required in the previous rule and individualization of this in-formation is included in our mentor coaching estimate. Using this method, we estimate the cost of fidelity tools for all programs to be $101,950. However, in response to comments, we modified the requirement in the final rule to provide additional flexibility for programs to determine how well their curriculum is being implemented. Therefore, we assume ap-proximately one-third of programs will use a fidelity tool and estimate the total cost of this requirement to be $33,983. These costs will be realized in year two and annually thereafter.
52 Lieber, J., Butera, G., Hanson, M., Palmer, S., Horn, E., Czaja, C., ... & Odom, S. (2009). Factors that influence the implementation of a new preschool curriculum: Implications for professional development. Early Education and Development, 20(3), 456-481.53 Landry, S. H., Anthony, J. L., Swank, P. R., & Monseque-Bailey, P. (2009). Effectiveness of comprehensive professional development for teachers of at-risk preschoolers. Journal of Educational Psychology, 101(2), 448.

36
Curriculum and Assessment Provisions
Monitoring Fidelity of Curriculum Implementation: Costs Borne by Head StartAvg. Cost of
Implementation Tool Kit Number of Programs
Estimated Cost for all programs
Estimated Cost of Requirement
$50 2,039 $101,950 $33,983
Assessments for Dual Language Learners
In this rule, we also codify best practice in assessing dual language learners (DLL) in §1302.33(c)(2) by requiring programs to administer language assessments to dual language learners in both English and their home language, as needed, either directly or through interpreters. These requirements will ensure that screening and assessment data is collected in both languages to ensure a more complete understanding of these children’s knowledge, skills and abilities.54 In order to estimate the costs associated with this proposal, we first determined the number of DLLs across Head Start and Early Head Start by assuming all children who speak a language other than English in the home are DLLs. We then deter-mined the proportion of DLL children who speak Spanish in the home and the number of children who speak other languages. For the purposes of this estimate, we assume that all DLLs who speak Spanish in the home will receive a direct assessment in Spanish, and for all DLLs who speak any language other than Spanish in the home will be assessed through an interpreter. For Spanish-speaking DLLs (265,209 children), we assumed the average cost of a Spanish-language assessment tool-kit (using the most frequently reported assess-ment as our proxy) is $200 and the average cost per pack of 25 assessment forms is $50. We determined the total number of tool-kits needed by finding the number of programs serving at least one Spanish-speaking child (1,651). We determined the number of packs of assessment forms needed by dividing the total number of Spanish-speaking children by 25 (10,610). We then multiplied the cost of the tool-kit by the number of programs and the cost of the assessment forms by the number of children and summed them to find the total cost of this provision for children who can be directly assessed. For DLLs speaking languages other than Spanish (56,658 children), we found the average hourly rate for an interpreter from the Bureau of Labor Statistics and assumed two hours for each assess-ment. Finally, we doubled this hourly wage to account for fringe and overhead ($46.08) even though we assume that programs will utilize the services of interpreters on a case-by-case basis rather than employing them as program staff. We then multiplied that cost by the number of non-Spanish-speaking DLLs to find the cost of this provision for children who need to be assessed through an interpreter. Finally, we summed these two estimates to produce a total cost estimate for the provision: $3,471,519. These costs will be realized in year two and annually thereafter.
54 Barrueco, S., Lopez, M., Ong, C., & Lozano, P. (2012). Assessing Spanish-English bilingual preschoolers: A guide to best approaches and measures. Baltimore, MD: Brookes.
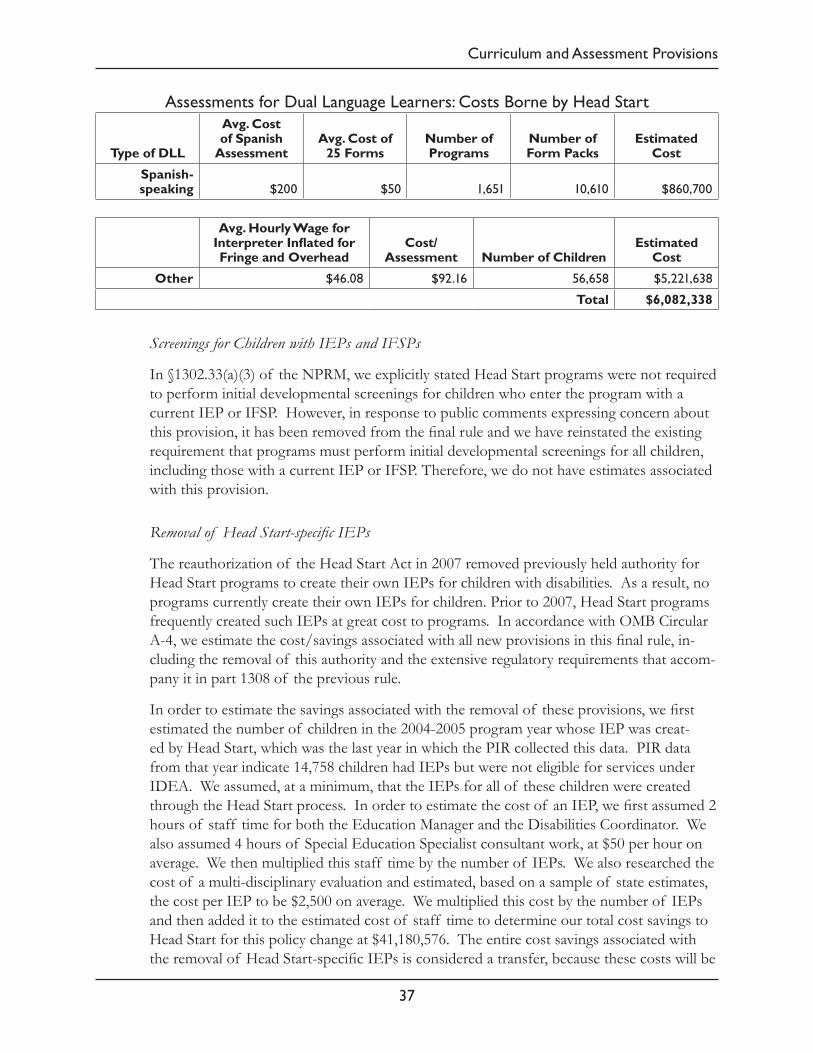
Curriculum and Assessment Provisions
37
Assessments for Dual Language Learners: Costs Borne by Head Start
Type of DLL
Avg. Cost of Spanish
AssessmentAvg. Cost of
25 FormsNumber of Programs
Number of Form Packs
Estimated Cost
Spanish-speaking $200 $50 1,651 10,610 $860,700
Avg. Hourly Wage for Interpreter Inflated for Fringe and Overhead
Cost/ Assessment Number of Children
Estimated Cost
Other $46.08 $92.16 56,658 $5,221,638
Total $6,082,338
Screenings for Children with IEPs and IFSPs
In §1302.33(a)(3) of the NPRM, we explicitly stated Head Start programs were not required to perform initial developmental screenings for children who enter the program with a current IEP or IFSP. However, in response to public comments expressing concern about this provision, it has been removed from the final rule and we have reinstated the existing requirement that programs must perform initial developmental screenings for all children, including those with a current IEP or IFSP. Therefore, we do not have estimates associated with this provision.
Removal of Head Start-specific IEPs
The reauthorization of the Head Start Act in 2007 removed previously held authority for Head Start programs to create their own IEPs for children with disabilities. As a result, no programs currently create their own IEPs for children. Prior to 2007, Head Start programs frequently created such IEPs at great cost to programs. In accordance with OMB Circular A-4, we estimate the cost/savings associated with all new provisions in this final rule, in-cluding the removal of this authority and the extensive regulatory requirements that accom-pany it in part 1308 of the previous rule.
In order to estimate the savings associated with the removal of these provisions, we first estimated the number of children in the 2004-2005 program year whose IEP was creat-ed by Head Start, which was the last year in which the PIR collected this data. PIR data from that year indicate 14,758 children had IEPs but were not eligible for services under IDEA. We assumed, at a minimum, that the IEPs for all of these children were created through the Head Start process. In order to estimate the cost of an IEP, we first assumed 2 hours of staff time for both the Education Manager and the Disabilities Coordinator. We also assumed 4 hours of Special Education Specialist consultant work, at $50 per hour on average. We then multiplied this staff time by the number of IEPs. We also researched the cost of a multi-disciplinary evaluation and estimated, based on a sample of state estimates, the cost per IEP to be $2,500 on average. We multiplied this cost by the number of IEPs and then added it to the estimated cost of staff time to determine our total cost savings to Head Start for this policy change at $41,180,576. The entire cost savings associated with the removal of Head Start-specific IEPs is considered a transfer, because these costs will be

38
Curriculum and Assessment Provisions
borne by other parties, leading to a net cost to society of zero dollars. The transfer of these costs will be realized in year one and annually thereafter.
Removal of Head Start-specific IEPs: Cost Savings to Head Start and Transfer Cost
Cost/ Hour for Staff
Consultation Cost of Consultation
Number of IEPs
Cost Savings Borne by Head
Star Transfer Cost Net Cost to Society
Staff/Consultant
Time $90.39 $200 14,758 $4,285,576 $4,285,576 $0
Cost of EvaluationNumber of IEPs
Cost Savings Borne by Head
Start Transfer Cost Net Cost to Society
Multi-disciplinary Evaluation $2,500 14,758 $36,895,000 $36,895,000 $0
Total $41,180,576 $41,180,576 $0
Parenting Curriculum
This rule includes a requirement in §1302.51(b) that programs provide parents with oppor-tunities to participate in a parenting curriculum. The NPRM proposed this requirement but the Regulatory Impact Analysis in the NPRM did not account for any costs associated with the requirement. We have added this cost estimate in response to comments that suggested we should acknowledge the costs associated with providing these opportunities to parents here.
In order to estimate the costs associated with this provision, we researched the cost of parenting curricula online and found and average cost of $1,087 for program-level materials and $14.25 per parent booklet. We then estimated that programs would provide oppor-tunities such that one-third of parents would participate in a parenting curriculum, which assuming one parent per child is 318,751 parent participants. We then found the total pro-gram-level cost to be $2,216,393 and the total parent-level cost to be $4,542,202, for a total cost of $6,758,595. However, given recent data55 that suggests that 41% of Head Start and Early Head Start parents already participate in parenting classes, we reduce this estimate by 40% for a total cost of $4,055,157.
Parenting CurriculumAverage Program-
Level Cost of Curriculum
Number of Programs
Average Cost per Parent
Participating Parents (One-
Third) Total Cost
$1,087 2,039 $14.25 318,751 $6,758,595
Reduced by 40% $4,055,157
55 Auger, A. (2015). Child Care and Community Services: Characteristics of Service Use and Effects on Parenting and the Home Environment, PhD dissertation. University of California-Irvine School of Education.
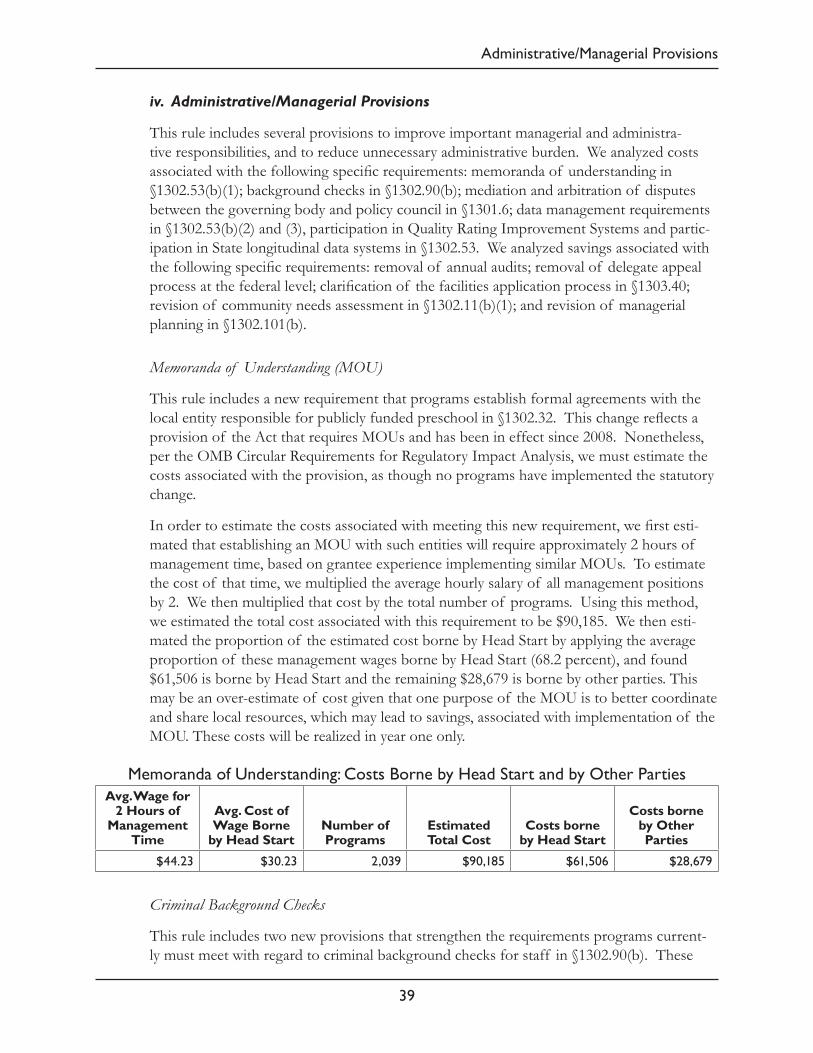
Administrative/Managerial Provisions
39
iv. Administrative/Managerial Provisions
This rule includes several provisions to improve important managerial and administra-tive responsibilities, and to reduce unnecessary administrative burden. We analyzed costs associated with the following specific requirements: memoranda of understanding in §1302.53(b)(1); background checks in §1302.90(b); mediation and arbitration of disputes between the governing body and policy council in §1301.6; data management requirements in §1302.53(b)(2) and (3), participation in Quality Rating Improvement Systems and partic-ipation in State longitudinal data systems in §1302.53. We analyzed savings associated with the following specific requirements: removal of annual audits; removal of delegate appeal process at the federal level; clarification of the facilities application process in §1303.40; revision of community needs assessment in §1302.11(b)(1); and revision of managerial planning in §1302.101(b).
Memoranda of Understanding (MOU)
This rule includes a new requirement that programs establish formal agreements with the local entity responsible for publicly funded preschool in §1302.32. This change reflects a provision of the Act that requires MOUs and has been in effect since 2008. Nonetheless, per the OMB Circular Requirements for Regulatory Impact Analysis, we must estimate the costs associated with the provision, as though no programs have implemented the statutory change.
In order to estimate the costs associated with meeting this new requirement, we first esti-mated that establishing an MOU with such entities will require approximately 2 hours of management time, based on grantee experience implementing similar MOUs. To estimate the cost of that time, we multiplied the average hourly salary of all management positions by 2. We then multiplied that cost by the total number of programs. Using this method, we estimated the total cost associated with this requirement to be $90,185. We then esti-mated the proportion of the estimated cost borne by Head Start by applying the average proportion of these management wages borne by Head Start (68.2 percent), and found $61,506 is borne by Head Start and the remaining $28,679 is borne by other parties. This may be an over-estimate of cost given that one purpose of the MOU is to better coordinate and share local resources, which may lead to savings, associated with implementation of the MOU. These costs will be realized in year one only.
Memoranda of Understanding: Costs Borne by Head Start and by Other PartiesAvg. Wage for
2 Hours of Management
Time
Avg. Cost of Wage Borne
by Head StartNumber of Programs
Estimated Total Cost
Costs borne by Head Start
Costs borne by Other Parties
$44.23 $30.23 2,039 $90,185 $61,506 $28,679
Criminal Background Checks
This rule includes two new provisions that strengthen the requirements programs current-ly must meet with regard to criminal background checks for staff in §1302.90(b). These
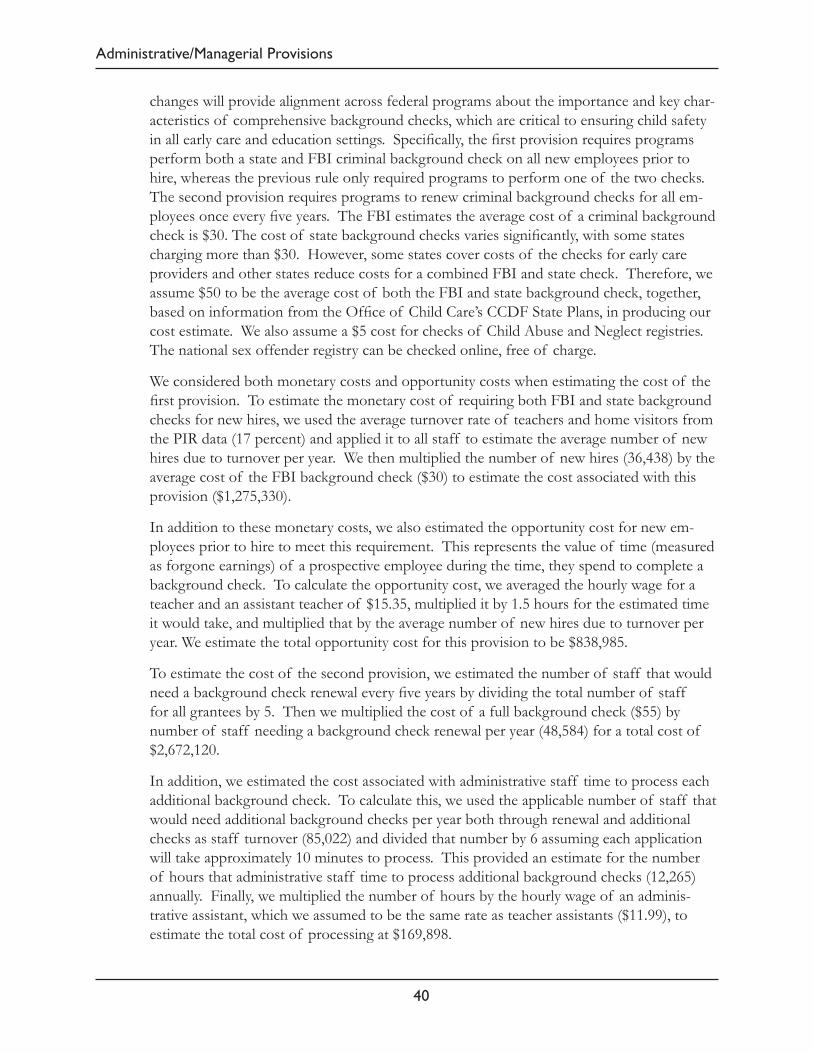
40
Administrative/Managerial Provisions
changes will provide alignment across federal programs about the importance and key char-acteristics of comprehensive background checks, which are critical to ensuring child safety in all early care and education settings. Specifically, the first provision requires programs perform both a state and FBI criminal background check on all new employees prior to hire, whereas the previous rule only required programs to perform one of the two checks. The second provision requires programs to renew criminal background checks for all em-ployees once every five years. The FBI estimates the average cost of a criminal background check is $30. The cost of state background checks varies significantly, with some states charging more than $30. However, some states cover costs of the checks for early care providers and other states reduce costs for a combined FBI and state check. Therefore, we assume $50 to be the average cost of both the FBI and state background check, together, based on information from the Office of Child Care’s CCDF State Plans, in producing our cost estimate. We also assume a $5 cost for checks of Child Abuse and Neglect registries. The national sex offender registry can be checked online, free of charge.
We considered both monetary costs and opportunity costs when estimating the cost of the first provision. To estimate the monetary cost of requiring both FBI and state background checks for new hires, we used the average turnover rate of teachers and home visitors from the PIR data (17 percent) and applied it to all staff to estimate the average number of new hires due to turnover per year. We then multiplied the number of new hires (36,438) by the average cost of the FBI background check ($30) to estimate the cost associated with this provision ($1,275,330).
In addition to these monetary costs, we also estimated the opportunity cost for new em-ployees prior to hire to meet this requirement. This represents the value of time (measured as forgone earnings) of a prospective employee during the time, they spend to complete a background check. To calculate the opportunity cost, we averaged the hourly wage for a teacher and an assistant teacher of $15.35, multiplied it by 1.5 hours for the estimated time it would take, and multiplied that by the average number of new hires due to turnover per year. We estimate the total opportunity cost for this provision to be $838,985.
To estimate the cost of the second provision, we estimated the number of staff that would need a background check renewal every five years by dividing the total number of staff for all grantees by 5. Then we multiplied the cost of a full background check ($55) by number of staff needing a background check renewal per year (48,584) for a total cost of $2,672,120.
In addition, we estimated the cost associated with administrative staff time to process each additional background check. To calculate this, we used the applicable number of staff that would need additional background checks per year both through renewal and additional checks as staff turnover (85,022) and divided that number by 6 assuming each application will take approximately 10 minutes to process. This provided an estimate for the number of hours that administrative staff time to process additional background checks (12,265) annually. Finally, we multiplied the number of hours by the hourly wage of an adminis-trative assistant, which we assumed to be the same rate as teacher assistants ($11.99), to estimate the total cost of processing at $169,898.

Administrative/Managerial Provisions
41
Using this method, we estimate the total monetary costs associated with the background check provisions to be $4,117,348 and the total opportunity cost to be $838,985. These costs will be realized in year two and annually thereafter.
Criminal Background Checks: Costs borne by Head Start
ProvisionAvg. Cost of
CheckTotal Number of
Staff Applicable Staff Estimated Cost
Initial Comprehensive
Background Check $35 242,918 36,438 $1,275,330
5-year Renewal $55 242,918 48,584 $2,672,120
Hourly wage Applicable Staff Number of Hours Estimated Cost
Staff time to process checks $11.99 85,022 14,170 $169,898
Total $4,117,348
Criminal Background Checks: Opportunity Costs
ProvisionAvg. Hourly
WageEstimated
Time in HoursTotal Wage
CostApplicable
StaffEstimated
Cost
FBI and State Check $15.35 1.5 $23.03 36,438 $838,985
Total $838,985
Mediation and Arbitration
The rule includes a requirement in §1301.6(b) and (c) that agencies unable to resolve im-passes through their own decision-making process must participate in a formal process of mediation. If agencies do not reach a resolution with a mediator, they must pursue arbi-tration and the arbitrator’s decision is final. We assume few grantees will reach an impasse and fewer grantees will be unable to resolve the impasse with their own decision-making process. For purposes of estimating the costs of these provisions, we assume one percent of programs, or 20 programs, will pursue mediation – likely an overestimate – and ten percent of those, or 2 programs, will go on to pursue arbitration. According to data from the National Arbitration Association, the costs of mediation vary but are significantly lower than arbitration. They cite the costs of arbitration services range from $200 to $700 per hour. To estimate the cost, we average the hourly cost and assume $450 per hour. The National Arbitration Association also states that arbitration usually takes no more than two weeks. Therefore, we assume 80 hours at $450 per hour for three programs for a total cost of $72,000. For mediation, we assume half the cost of arbitration (both hourly rate ($225) and length of time (40 hours), which is consistent with estimates we saw elsewhere. We assumed 20 programs would pursue mediation for a total cost of $261,000. The total for these two provisions is $333,000. These costs will be realized in year one and annually thereafter.
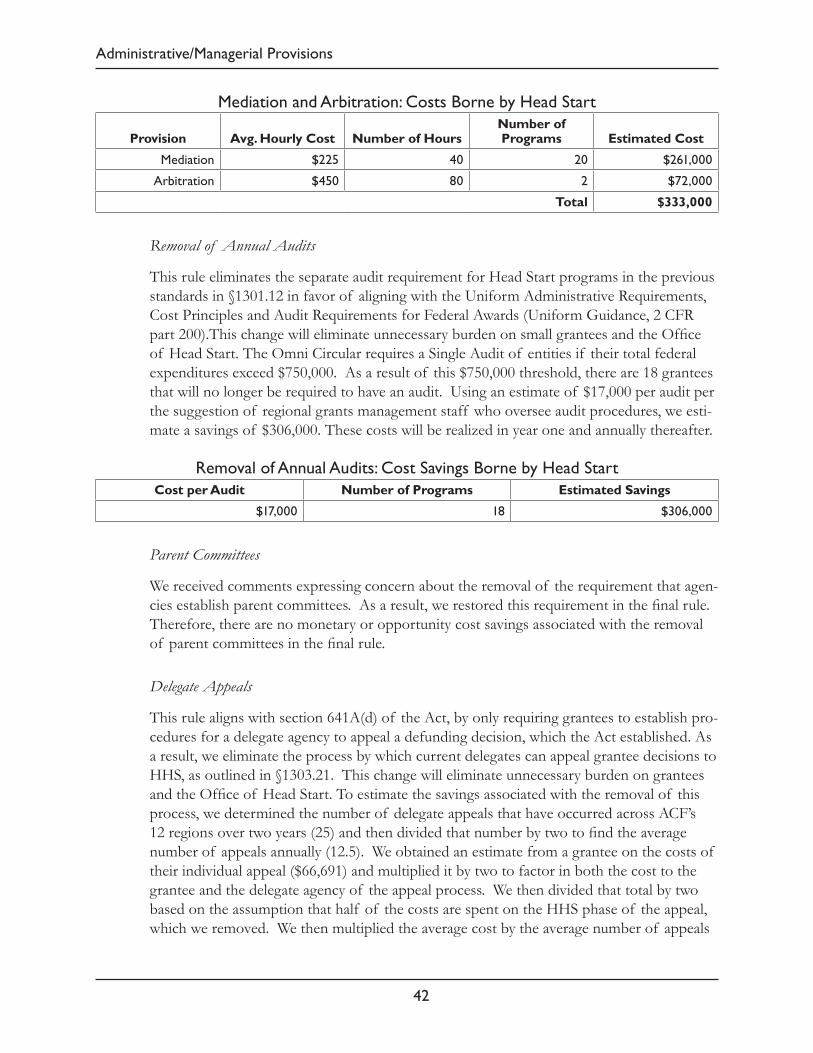
42
Administrative/Managerial Provisions
Mediation and Arbitration: Costs Borne by Head Start
Provision Avg. Hourly Cost Number of HoursNumber of Programs Estimated Cost
Mediation $225 40 20 $261,000
Arbitration $450 80 2 $72,000
Total $333,000
Removal of Annual Audits
This rule eliminates the separate audit requirement for Head Start programs in the previous standards in §1301.12 in favor of aligning with the Uniform Administrative Requirements, Cost Principles and Audit Requirements for Federal Awards (Uniform Guidance, 2 CFR part 200).This change will eliminate unnecessary burden on small grantees and the Office of Head Start. The Omni Circular requires a Single Audit of entities if their total federal expenditures exceed $750,000. As a result of this $750,000 threshold, there are 18 grantees that will no longer be required to have an audit. Using an estimate of $17,000 per audit per the suggestion of regional grants management staff who oversee audit procedures, we esti-mate a savings of $306,000. These costs will be realized in year one and annually thereafter.
Removal of Annual Audits: Cost Savings Borne by Head StartCost per Audit Number of Programs Estimated Savings
$17,000 18 $306,000
Parent Committees
We received comments expressing concern about the removal of the requirement that agen-cies establish parent committees. As a result, we restored this requirement in the final rule. Therefore, there are no monetary or opportunity cost savings associated with the removal of parent committees in the final rule.
Delegate Appeals
This rule aligns with section 641A(d) of the Act, by only requiring grantees to establish pro-cedures for a delegate agency to appeal a defunding decision, which the Act established. As a result, we eliminate the process by which current delegates can appeal grantee decisions to HHS, as outlined in §1303.21. This change will eliminate unnecessary burden on grantees and the Office of Head Start. To estimate the savings associated with the removal of this process, we determined the number of delegate appeals that have occurred across ACF’s 12 regions over two years (25) and then divided that number by two to find the average number of appeals annually (12.5). We obtained an estimate from a grantee on the costs of their individual appeal ($66,691) and multiplied it by two to factor in both the cost to the grantee and the delegate agency of the appeal process. We then divided that total by two based on the assumption that half of the costs are spent on the HHS phase of the appeal, which we removed. We then multiplied the average cost by the average number of appeals

Administrative/Managerial Provisions
43
per year (12.5) to arrive at the annual savings. We estimate savings of $833,638 because of this change. These savings will be realized in year one and annually thereafter.
Delegate Appeals: Cost Savings Borne by Head StartAverage Savings from Removal
of HHS Phase per AppealNumber of Delegate Appeals/
Year Estimated Savings
$66,691 12.5 $833,638
Clarification of Facilities Application Process
This rule reorders the application requirements for funds to purchase, construct or renovate facilities to align with typical project development in §1303.40. In doing so, we anticipate savings associated with grantees who are likely to identify unfeasible projects more quickly prior to soliciting costly professional advice or unnecessary testing (e.g. environmental), referred to as soft costs. To estimate the savings associated with these revisions, we assumed a per project cost for facilities projects of $500,000, based on our experience with facilities costs.
Since the savings would come from the soft costs that grantees incur at the beginning of a project – which under our reordered application process could be avoided for projects that grantees realize more quickly are not fundable – we assume that approximately 30 percent of the average per project costs, or $150,000 are for soft costs. Our data systems do not capture the number of applications for facility projects each year, so as a proxy, we used the total number of facilities with federal interest for the past 11 years, which is the timeframe for which we have data, with that total (4,051) divided by 11 for the number of facilities with federal interest per year (368). Based on historical data, we then estimate that 8 percent of the 368 facilities with federal interest (29 facilities projects) submit un-fundable applications annually. As a result, we then multiplied the $150,000 in estimated soft costs by 29 projects to determine the savings that would result if those grantees realized the unfea-sibility of their projects earlier and never spent those funds. We estimate the total savings associated with these revisions to total $4,350,000. These costs will be realized in year one and annually thereafter.
Clarification of Facilities Application Process: Cost Savings Borne by Head Start
Avg. Cost of Facility Project Avg. “Soft” Costs
Facilities with Federal Interest/
Year
Unfundable Facility
Applications/ Year Estimated Savings
$500,000 $150,000 368 29 $4,350,000
Community Assessment
This rule also includes provisions that change the previous requirement for programs to conduct full community assessments from every three years to every five years in §1302.11(b)(1). This change will streamline the community assessment process and elim-inate unnecessary burden on grantees and the Office of Head Start. We estimated the current cost of the community assessment and assumed a reduction in costs of 40 percent,
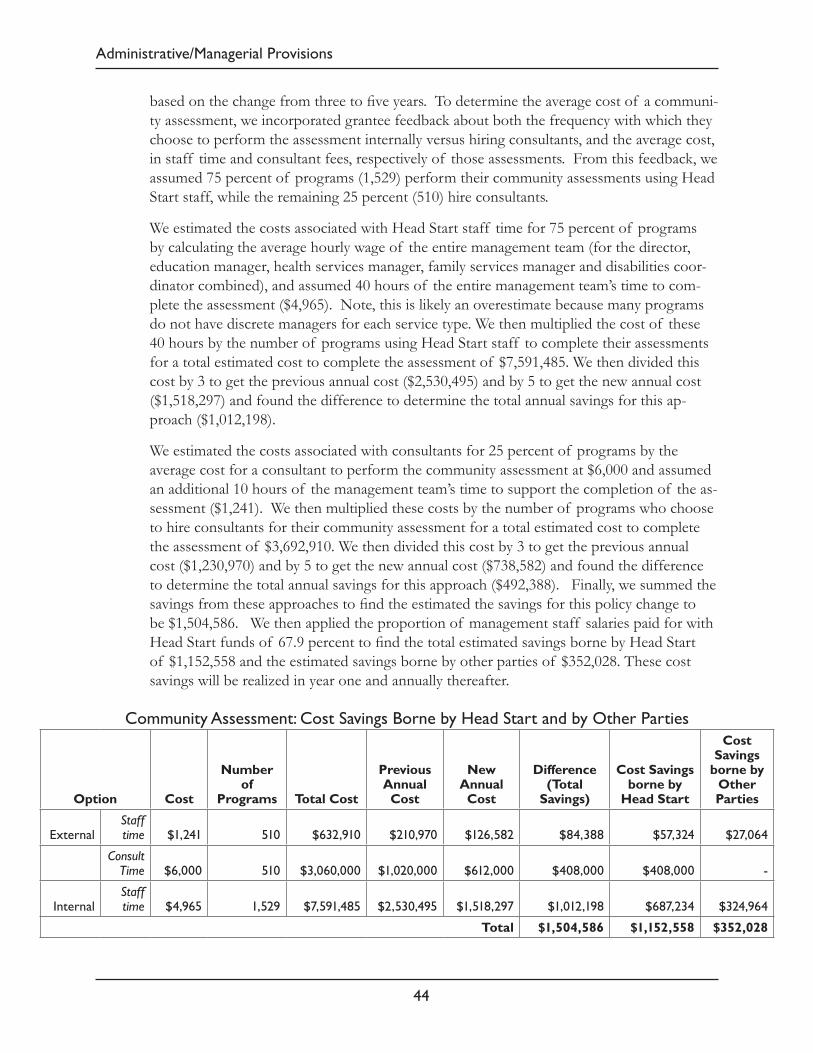
44
Administrative/Managerial Provisions
based on the change from three to five years. To determine the average cost of a communi-ty assessment, we incorporated grantee feedback about both the frequency with which they choose to perform the assessment internally versus hiring consultants, and the average cost, in staff time and consultant fees, respectively of those assessments. From this feedback, we assumed 75 percent of programs (1,529) perform their community assessments using Head Start staff, while the remaining 25 percent (510) hire consultants.
We estimated the costs associated with Head Start staff time for 75 percent of programs by calculating the average hourly wage of the entire management team (for the director, education manager, health services manager, family services manager and disabilities coor-dinator combined), and assumed 40 hours of the entire management team’s time to com-plete the assessment ($4,965). Note, this is likely an overestimate because many programs do not have discrete managers for each service type. We then multiplied the cost of these 40 hours by the number of programs using Head Start staff to complete their assessments for a total estimated cost to complete the assessment of $7,591,485. We then divided this cost by 3 to get the previous annual cost ($2,530,495) and by 5 to get the new annual cost ($1,518,297) and found the difference to determine the total annual savings for this ap-proach ($1,012,198).
We estimated the costs associated with consultants for 25 percent of programs by the average cost for a consultant to perform the community assessment at $6,000 and assumed an additional 10 hours of the management team’s time to support the completion of the as-sessment ($1,241). We then multiplied these costs by the number of programs who choose to hire consultants for their community assessment for a total estimated cost to complete the assessment of $3,692,910. We then divided this cost by 3 to get the previous annual cost ($1,230,970) and by 5 to get the new annual cost ($738,582) and found the difference to determine the total annual savings for this approach ($492,388). Finally, we summed the savings from these approaches to find the estimated the savings for this policy change to be $1,504,586. We then applied the proportion of management staff salaries paid for with Head Start funds of 67.9 percent to find the total estimated savings borne by Head Start of $1,152,558 and the estimated savings borne by other parties of $352,028. These cost savings will be realized in year one and annually thereafter.
Community Assessment: Cost Savings Borne by Head Start and by Other Parties
Option Cost
Number of
Programs Total Cost
Previous Annual
Cost
New Annual
Cost
Difference (Total
Savings)
Cost Savings borne by
Head Start
Cost Savings
borne by Other Parties
ExternalStaff time $1,241 510 $632,910 $210,970 $126,582 $84,388 $57,324 $27,064
Consult Time $6,000 510 $3,060,000 $1,020,000 $612,000 $408,000 $408,000 -
InternalStaff time $4,965 1,529 $7,591,485 $2,530,495 $1,518,297 $1,012,198 $687,234 $324,964
Total $1,504,586 $1,152,558 $352,028
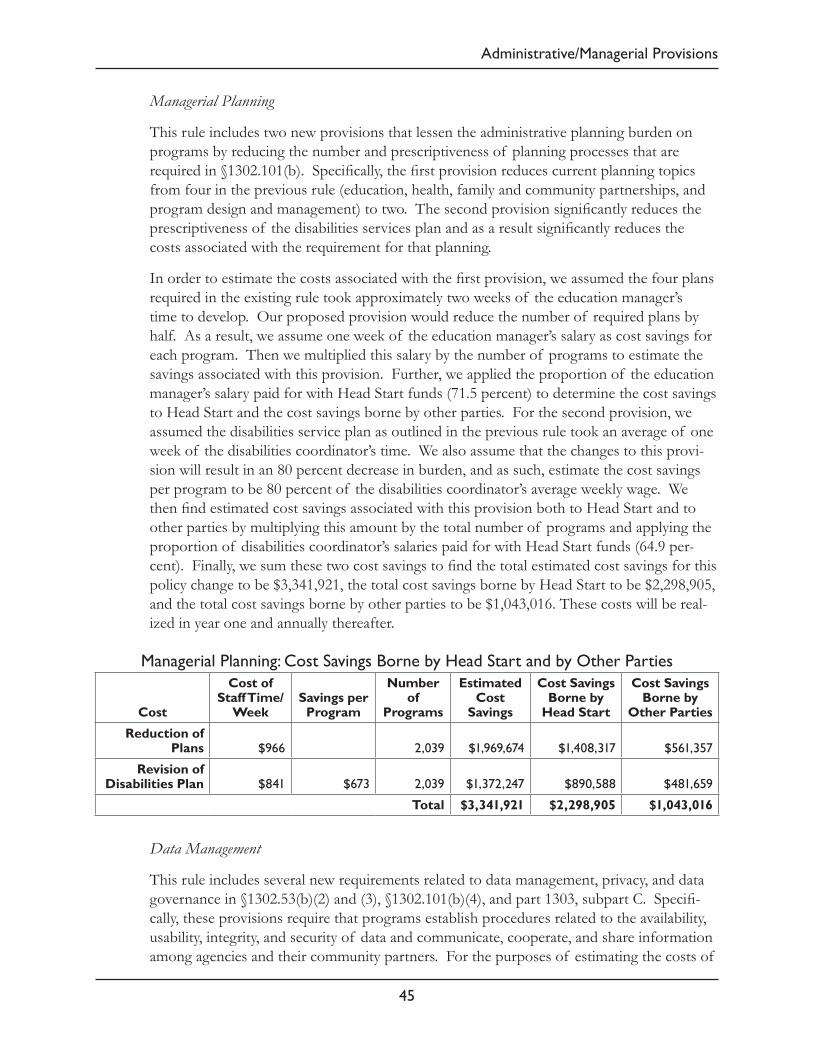
Administrative/Managerial Provisions
45
Managerial Planning
This rule includes two new provisions that lessen the administrative planning burden on programs by reducing the number and prescriptiveness of planning processes that are required in §1302.101(b). Specifically, the first provision reduces current planning topics from four in the previous rule (education, health, family and community partnerships, and program design and management) to two. The second provision significantly reduces the prescriptiveness of the disabilities services plan and as a result significantly reduces the costs associated with the requirement for that planning.
In order to estimate the costs associated with the first provision, we assumed the four plans required in the existing rule took approximately two weeks of the education manager’s time to develop. Our proposed provision would reduce the number of required plans by half. As a result, we assume one week of the education manager’s salary as cost savings for each program. Then we multiplied this salary by the number of programs to estimate the savings associated with this provision. Further, we applied the proportion of the education manager’s salary paid for with Head Start funds (71.5 percent) to determine the cost savings to Head Start and the cost savings borne by other parties. For the second provision, we assumed the disabilities service plan as outlined in the previous rule took an average of one week of the disabilities coordinator’s time. We also assume that the changes to this provi-sion will result in an 80 percent decrease in burden, and as such, estimate the cost savings per program to be 80 percent of the disabilities coordinator’s average weekly wage. We then find estimated cost savings associated with this provision both to Head Start and to other parties by multiplying this amount by the total number of programs and applying the proportion of disabilities coordinator’s salaries paid for with Head Start funds (64.9 per-cent). Finally, we sum these two cost savings to find the total estimated cost savings for this policy change to be $3,341,921, the total cost savings borne by Head Start to be $2,298,905, and the total cost savings borne by other parties to be $1,043,016. These costs will be real-ized in year one and annually thereafter.
Managerial Planning: Cost Savings Borne by Head Start and by Other Parties
Cost
Cost of Staff Time/
WeekSavings per
Program
Number of
Programs
Estimated Cost
Savings
Cost Savings Borne by
Head Start
Cost Savings Borne by
Other Parties
Reduction of Plans $966 2,039 $1,969,674 $1,408,317 $561,357
Revision of Disabilities Plan $841 $673 2,039 $1,372,247 $890,588 $481,659
Total $3,341,921 $2,298,905 $1,043,016
Data Management
This rule includes several new requirements related to data management, privacy, and data governance in §1302.53(b)(2) and (3), §1302.101(b)(4), and part 1303, subpart C. Specifi-cally, these provisions require that programs establish procedures related to the availability, usability, integrity, and security of data and communicate, cooperate, and share information among agencies and their community partners. For the purposes of estimating the costs of

46
Administrative/Managerial Provisions
these provisions, we focus on three major elements: designing and implementing a pro-gram-wide coordinated approach to data management and sharing data with other pro-grams and systems through parental consent and memoranda of understanding.
First, we estimated the cost to programs of designing and implementing a program-wide coordinated approach to data management. We assumed one full day (eight hours) of planning time, using a cumulative hourly wage of $123.81 for management staff for all 2,039 programs. This resulted in a cost of $2,019,589. We then applied the proportion of management salaries paid for with Head Start funds (67.9 percent) to estimate the total cost borne by Head Start and the costs borne by other parties for this provision. We estimate the total cost to Head Start to be $1,371,301 and the cost to other parties to be $648,288.
Second, we estimated the cost of sharing data in order to coordinate with other programs and systems. We assumed these costs entail costs associated with Head Start staff time requesting parental consent to share data and establishing Memoranda of Understanding (MOU). We assume that the parental consent process would be performed by family ser-vices workers; however, since we do not have PIR data on a family service worker’s hourly wage, we averaged the hourly wage of Head Start teachers and assistant teachers as a proxy for the family service worker wage ($15.35). To calculate the cost of the parental consent process, we further assumed that each consent process would take 20 minutes of the family service workers’ time and divided that hourly wage by three to arrive at the cost of each pa-rental consent ($5.12). Then, we multiplied the cost per consent by the number of parents from the PIR (988,923), for an estimated cost of $5,063,286.
We also estimated the cost of the MOU process for all programs. To do so, we averaged the hourly wages of management staff and assumed an average of three MOUs per pro-gram. We chose three MOUs based on the assumption that most programs would have an MOU with an educational agency, a local social services agency, and some other com-munity partner. We assumed two hours of a management staff time per MOU. We used an average hourly wage for managers of $24.76 and multiplied it by two hours per each of three MOUs for an estimated cost of $148.56 per program. Then we multiplied this cost by the total number of programs (2,039) for an estimated cost of $302,914 for the MOU process. We then applied the proportion of management salaries paid for with Head Start funds (67.9 percent) to estimate the total cost borne by Head Start and the total cost borne by other parties for the MOU process. The cost borne by Head Start is $205,680, and the cost borne by other parties is $97,234.
In sum, the total estimated cost of this provision is $7,385,789, the total estimated cost borne by Head Start is $6,643,811, and the total estimated cost borne by other parties is $741,978. These costs will be realized in year two and annually thereafter.
In addition to monetary costs, we also estimated the opportunity cost associated with par-ents’ time spent completing the parental consent process. To calculate this opportunity cost, we use foregone wages as an estimate for the value of parents’ time. This represents the value of their time when they participate in an additional home visit rather than working. Because Head Start families are primarily families from low-income backgrounds, we used the federal minimum wage and assumed twenty minutes of time for one parent from each
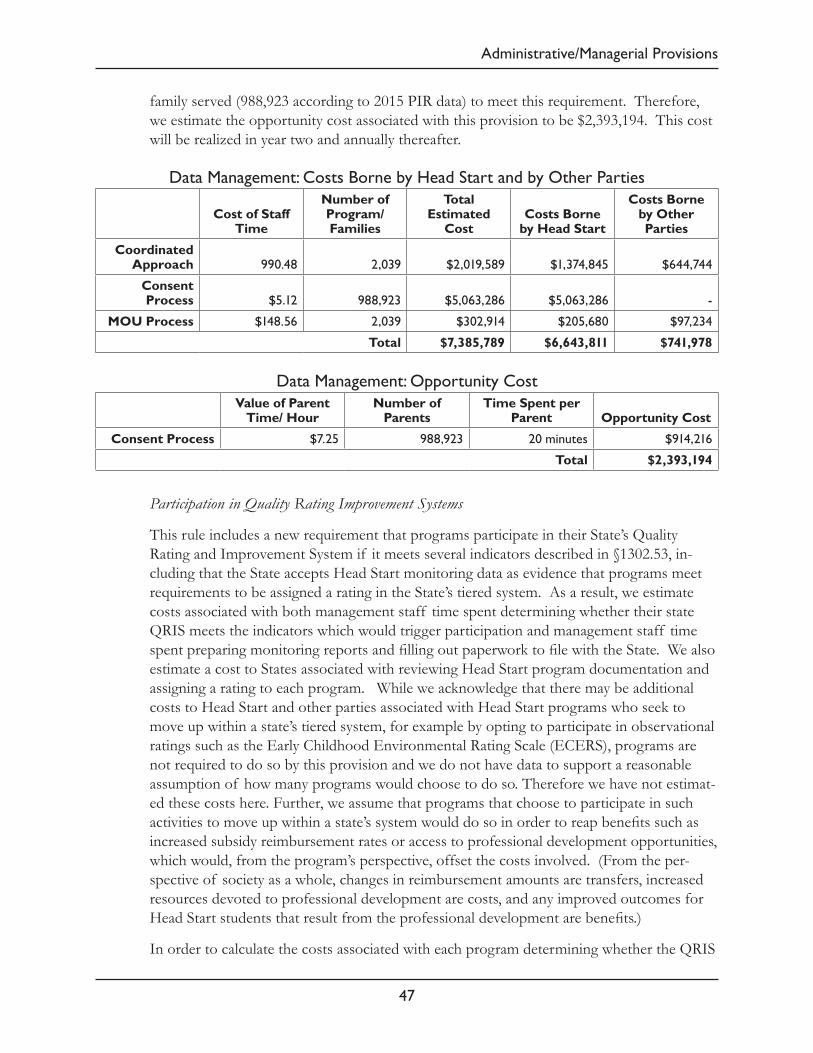
Administrative/Managerial Provisions
47
family served (988,923 according to 2015 PIR data) to meet this requirement. Therefore, we estimate the opportunity cost associated with this provision to be $2,393,194. This cost will be realized in year two and annually thereafter.
Data Management: Costs Borne by Head Start and by Other Parties
Cost of Staff Time
Number of Program/ Families
Total Estimated
CostCosts Borne
by Head Start
Costs Borne by Other Parties
Coordinated Approach 990.48 2,039 $2,019,589 $1,374,845 $644,744
Consent Process $5.12 988,923 $5,063,286 $5,063,286 -
MOU Process $148.56 2,039 $302,914 $205,680 $97,234
Total $7,385,789 $6,643,811 $741,978
Data Management: Opportunity CostValue of Parent
Time/ Hour Number of
ParentsTime Spent per
Parent Opportunity Cost
Consent Process $7.25 988,923 20 minutes $914,216
Total $2,393,194
Participation in Quality Rating Improvement Systems
This rule includes a new requirement that programs participate in their State’s Quality Rating and Improvement System if it meets several indicators described in §1302.53, in-cluding that the State accepts Head Start monitoring data as evidence that programs meet requirements to be assigned a rating in the State’s tiered system. As a result, we estimate costs associated with both management staff time spent determining whether their state QRIS meets the indicators which would trigger participation and management staff time spent preparing monitoring reports and filling out paperwork to file with the State. We also estimate a cost to States associated with reviewing Head Start program documentation and assigning a rating to each program. While we acknowledge that there may be additional costs to Head Start and other parties associated with Head Start programs who seek to move up within a state’s tiered system, for example by opting to participate in observational ratings such as the Early Childhood Environmental Rating Scale (ECERS), programs are not required to do so by this provision and we do not have data to support a reasonable assumption of how many programs would choose to do so. Therefore we have not estimat-ed these costs here. Further, we assume that programs that choose to participate in such activities to move up within a state’s system would do so in order to reap benefits such as increased subsidy reimbursement rates or access to professional development opportunities, which would, from the program’s perspective, offset the costs involved. (From the per-spective of society as a whole, changes in reimbursement amounts are transfers, increased resources devoted to professional development are costs, and any improved outcomes for Head Start students that result from the professional development are benefits.)
In order to calculate the costs associated with each program determining whether the QRIS
48
Administrative/Managerial Provisions
in their State meets the indicators, we assumed eight hours of assessment time for the entire management team, using a cumulative hourly wage of $124.13 for management staff for all 2,039 programs. This resulted in a cost of $2,024,809. We then applied the proportion of management salaries paid for with Head Start funds (67.9 percent) to estimate the total cost borne by Head Start and the costs borne by other parties for this provision. We estimate the total cost to Head Start to be $1,367,272 and the cost to other parties to be $657,537.
Then to estimate the cost of program participation in QRIS in states that meet the indica-tors described in §1302.53, we first assumed that the Program Director and the Education Manager (whose hourly wage is a total of $59.82, $40.28 of which is borne by Head Start and $19.55 of which is borne by other parties) in programs participating in QRIS would spend 16 hours (or two full days) preparing monitoring reports and filling out paperwork to file with the State. This calculation results in an estimated cost borne by Head Start of $644.42 per program and an estimated cost borne by other parties of $312.73 per program. Then, to estimate the cost per year, we had to make assumptions about what percent of programs would be in States that meet the described in §1302.53. Although we do not think most States currently meet these indicators, we assume that States who want Head Start programs to participate in QRIS will make adjustments to their systems over time to meet the indicators such that the Head Start performance standards require participation. Therefore, we assumed that 25% of programs would participate in the first year this re-quirement is in place (2017/2018), 50% would participate five years after the requirement is in place (2022/2023) and that by 2025/2026, 75% of programs would participate. To estimate the cost in each year, we multiplied the number of programs participating (510 in 2017/2018, 1,020 in 2022/2023, and 1,529 in 2025/2026). This results in costs borne by Head Start of $328,656 in 2017/2018, $657,311 in 2022/2023, and $985,323 in 2025/2026; and costs borne by other parties of $159,493 in 2017/2018, $318,985 in 2022/2023, and $478,165 in 2025/2026.
Then, we further assume additional costs borne by other parties, in costs to the State as-sociated with reviewing Head Start program documentation and assigning a rating to each program. In order to estimate these costs, we assumed 8 hours of administrative staff time using the average hourly wage for administrative assistants from the Bureau of Labor Statistics 2015 data ($17.55) for a cost of $140.40 per program participating in QRIS. We then applied this cost per program to the number of programs participating in each year as described above to find the cost borne by States to be $71,569 in 2017/2018, $143,138 in 2022/2023, and $214,707 in 2025/2026.
In sum, the total costs associated with meeting this requirement which are borne by Head Start programs are $1,695,928 in 2017/2018, $2,024,583 in 2022/2023, and $2,352,595 in 2025/2026. Finally, the total costs associated with meeting this requirement which are borne by other parties are $888,598 in 2017/2018, $1,119,660 in 2022/2023, and $1,350,409 in 2025/2026.

Administrative/Managerial Provisions
49
Participation in QRIS: Costs Borne by Head Start and by Other PartiesCost of Staff
Time Per Program
Number of
Programs Total Estimated
Cost
Costs Borne by Head Start
(67.9%)
Costs Borne by Other Parties
Determining Participation $993.04 2,039 $2,024,809 $1,367,272 $657,537
Participation in QRIS: Costs Borne by Head Start and by Other PartiesCost of Staff
Time Per Program
Number of
Programs
Estimated Cost for 25% of
Programs
Estimated Cost for 50% of
ProgramsEstimated Cost for 75% of Programs
To Head Start
To Other Parties
To Head Start
To Other Parties
To Head Start
To Other Parties
HS Management Staff for
Participating Programs $957.15 2,039 $328,656 $159,493 $657,311 $318,985 $985,323 $478,165
State Administrative
Staff $140.40 2,039 n/a $71,569 n/a $143,138 n/a $214,707
Participation in QRIS: Costs Borne by Head Start and by Other PartiesYear 2
2017-2018Year 3
2018-2019Year 4
2019-2020Year 5
2020-2021Year 6
2021-2022Year 7
2022-2023Year 8
2023-2024Year 9
2024-2025Year 10
2025-2026
Total Costs to Head
Start $1,695,928 $1,695,928 $1,695,928 $1,695,928 $1,695,928 $2,024,583 $2,024,583 $2,024,583 $2,352,595
Total Costs to Other
Parties $888,598 $888,598 $888,598 $888,598 $888,598 $1,119,660 $1,119,660 $1,119,660 $1,350,409
Participation in State Longitudinal Data Systems
This rule includes a new requirement in §1302.53 that programs should participate in State longitudinal data systems if they can participate and benefit in a similar fashion to other early childhood programs. As a result of the conditions for participation to be required, we estimate costs associated with both management staff time spent determining whether they should participate in State longitudinal data systems and qualified staff (such as a data analyst or the Education Manager) time spent preparing program data to be shared with the State. We also estimate a cost to States associated with integrating Head Start data into the state system. While we acknowledge that the cost of maintaining State longitudinal data systems can be costly to States, there is no evidence to suggest that States have passed these costs on to programs that contribute their data to the system. In this estimate, we have not estimated costs to Head Start programs associated with any fee for participation. If States began to pass these maintenance costs on to participating programs the costs presented below would represent an underestimate of the actual costs to Head Start programs and an equal-magnitude overestimate of the costs to other parties.

50
Administrative/Managerial Provisions
In order to calculate the costs associated with each program determining whether to partic-ipate in State longitudinal data systems, we assumed four hours of assessment time for the entire management team, using a cumulative hourly wage of $124.13 for management staff for all 2,039 programs. This resulted in a cost of $1,012,404. We then applied the pro-portion of management salaries paid for with Head Start funds (67.9 percent) to estimate the total cost borne by Head Start and the costs borne by other parties for this provision. We estimate the total cost to Head Start to be $683,636 and the cost to other parties to be $328,768.
Then to estimate the cost of program participation in State longitudinal data systems, we first assumed that staff with qualifications and a salaries equivalent to the Education Man-ager, who may or may not be the Education Manager (whose hourly wage is a total of $24.16, $17.27 of which is borne by Head Start and $6.89 of which is borne by other par-ties) in programs participating in State longitudinal data systems would spend 40 hours (or one full week) preparing program data to be shared with the State. This calculation results in an estimated cost borne by Head Start of $690.97 per program and an estimated cost borne by other parties of $275.42 per program. Then, to estimate the cost per year, we had to make assumptions about what percent of programs would participate. Given the costly nature of maintaining State longitudinal data systems for States, and the scarcity of grant funds to support these activities, we have assumed only a small proportion of programs will be in States who have longitudinal data systems that meet the conditions described in §1302.53 the first year this requirement is in place. Further, we assume only modest growth in the proportion of programs in such States over time. Therefore, we assumed that 10% of programs would participate in the first year this requirement is in place (2017/2018), 20% would participate five years after the requirement is in place (2022/2023) and that by 2025/2026, 30% of programs would participate. To estimate the cost in each year, we multiplied the number of programs participating (204 in 2017/2018, 408 in 2022/2023, and 612 in 2025/2026). This results in costs borne by Head Start of $140,957 in 2017/2018, $281,914 in 2022/2023, and $422,871 in 2025/2026; and costs borne by other parties of $56,186 in 2017/2018, $112,371 in 2022/2023, and $168,557 in 2025/2026.
Then, we further assume additional costs borne by other parties, in costs to the State associ-ated with integrating Head Start data into the state system. In order to estimate these costs, we assumed 4 hours of administrative staff time using the average hourly wage for adminis-trative assistants from the Bureau of Labor Statistics 2015 data ($17.55) for a cost of $70.20 per program participating in State longitudinal data systems. We then applied this cost per program to the number of programs participating in each year as described above to find the cost borne by States to be $14.314 in 2017/2018, $28,628 in 2022/2023, and $42,941 in 2025/2026.
In sum, the total costs associated with meeting this requirement which are borne by Head Start programs are $824,593 in 2017/2018, $965,550 in 2022/2023, and $1,106,507 in 2025/2026. Finally, the total costs associated with meeting this requirement which are borne by other parties are $399,268 in 2017/2018, $469,767 in 2022/2023, and $540,267 in 2025/2026.

Administrative/Managerial Provisions
51
Participation in State longitudinal data systems: Costs Borne by Head Start and by Other Parties
Cost of Staff Time Per Program
Number of Programs
Total Estimated
Cost
Costs Borne by Head Start
(67.9%)
Costs Borne by Other Parties
Determining Participation $496.52 2,039 $1,012,404 $683,636 $328,768
Participation in State longitudinal data systems: Costs Borne by Head Start and by Other Parties
Cost of Staff
Time Per Program
Number of Programs
Estimated Cost for 10% of Programs
Estimated Cost for 20% of Programs
Estimated Cost for 30% of
Programs
To Head Start
To Other Parties
To Head Start
To Other Parties
To Head Start
To Other Parties
HS Management Staff for
Participating Programs $690.97 2,039 $140.957 $56,186 $281,914 $112,371 $422,871 $168,557
State Administrative
Staff $70.20 2,039 n/a $14,314 n/a $28,628 n/a $42,941
Participation in State longitudinal data systems: Costs Borne by Head Start and by Other Parties
Year 2 2017-2018
Year 3 2018-2019
Year 4 2019-2020
Year 5 2020-2021
Year 6 2021-2022
Year 7 2022-2023
Year 8 2023-2024
Year 9 2024-2025
Year 10 2025-2026
Total Costs
to Head Start $824,593 $824,593 $824,593 $824,593 $824,593 $965,550 $965,550 $965,550 $1,106,507
Total Costs to
Other Parties $399,268 $399,268 $399,268 $399,268 $399,268 $469,767 $469,767 $469,767 $540,267
Implementation of Changes in the Program Performance Standards
This rule includes numerous changes to Head Start’s Program Performance Standards. As a result, we have included provisions in §1302.103 that require programs to develop a pro-gram-wide approach to prepare for and implement these changes, in order to ensure their effectiveness. In order to estimate the cost associated with these provisions, we estimated the costs associated with Head Start staff time by calculating the average hourly wage of the entire management team (for the director, education manager, health services manager, family services manager, and disabilities coordinator combined), and assumed 40 hours of the entire management team’s time to develop the approach ($4,965). Note, this is likely an overestimate because many programs do not have discrete managers for each service type.

52
Benefits Analysis
Using this method we estimate the total cost of this provision at $10,123,635. We then applied the average proportion of management salaries paid for with Head Start funds (67.9 percent) to estimate the total cost borne by Head Start ($6,873,948) and the total cost borne by other parties ($3,249,687) for planning.
Further, we expect there will be costs associated with printing and distribution of hard-copies of the standards to every grantee. We estimate the cost of printing and distribu-tion will be $75,000, based on the cost associated with printing and distributing the new Head Start Early Learning Outcomes Framework: Birth to Five, which was similar in length and was distributed to the same entities at a cost of $75,000. Including this cost, the total estimated cost of implementation planning is $10,198,635, the cost borne by Head Start is $6,948,948 and the cost borne by other parties is $3,249,687. We then divided the cost borne by Head Start and the cost borne by other parties in half, because we believe imple-mentation planning will be spread across two years. Therefore, these costs will be realized in years one and two only.
Implementation Planning: Costs Borne by Head Start and by Other Parties
Hourly Rate of
Management Team
Cost 40 of
Hours
Number of
ProgramsEstimated
Cost
Estimated Cost per
Year
Annual Costs Borne
by Head Start
Annual Costs Borne
by Other Parties
Management Time $124.13 $4,965 2,039 $10,123,635 $5,061,818 $3,436,974 $1,624,843
Printing and Distribution - - - $75,000 $32,500 $32,500 $0
Total $10,198,635 $5,099,318 $3,474,474 $1,624,843
3. Benefits Analysis
Overall, the policies included in this final rule are designed to strengthen Head Start qual-ity, improve child outcomes, and increase the return on taxpayer dollars. As discussed in more detail in the preamble for this final rule, these policies will improve teaching practices, through implementation of content-rich curriculum, effective use of assessment data, and strong professional development. These improvements are central to our effort to ensure every child in Head Start receives high quality early learning experiences that will build the skills they need to succeed in school and beyond. In order to maximize the effectiveness of Head Start and yield a high rate of return on investment, we believe it is essential to pair these improvements to the early learning experiences provided by Head Start with increases in program duration.
In this section, as part of our full regulatory analysis, we describe our expectation that this rule will result in a greater return on the federal investment in Head Start and outline our rationale. To do so, we first consider long-standing economic analysis of the return on investment through benefits to society of high quality early education and summarize the research linking the most costly provisions—extending program duration—to the expecta-tion for increased return on investment. Then, we describe the expected effect of the final

Benefits Analysis
53
rule on society by exploring the benefits of the quality and duration improvements on chil-dren enrolled in Head Start and their parents and the potential opportunity costs for chil-dren who might not have access to Head Start in the future, as well as other unquantified benefits. Further, we discuss the implications of both Congressional and Secretarial actions on the costs and benefits of this rule to society as a whole. Finally, we provide estimates of additional federal funding needed for overtime, adjusted for cost of living increases, to support the full implementation of this rule and we estimate the potential slot loss and ed-ucation staff job loss that may arise from this rule if the service duration policies described in part 1302, subpart B, are fully implemented without adequate additional funds.
Return on Investment in Early Childhood
There is no question that high-quality early learning programs yield significant benefits to children and society.56 Early learning programs provide a unique opportunity to intervene and support children’s development during a period in which learning and growth is at its most rapid.57,58,59 Early learning programs have short and long term effects on children’s math, reading and behavior skills, can reduce grade retention, teen pregnancy, and the need for special education services, and in the long-term can increase lifetime earnings and
56 Heckman, J. J., Moon, S. H., Pinto, R., Savelyev, P. A., & Yavitz, A. (2010). The rate of return to the HighScope Perry Preschool Program. Journal of Public Economics, 94, 114-128.57 National Scientific Council on the Developing Child (2007). The Timing and Quality of Early Experiences Combine to Shape Brain Architecture: Working Paper No. 5. Retrieved from www.developingchild.harvard.edu58 Anda R.F., Felitti V.J., Bremner J.D., Walker J.D., Whitfield C., Perry, B.D., Dube, S.R., & Giles, W.H. (2006). The enduring effects of abuse and related adverse experiences in childhood. A convergence of evidence from neurobiology and epidemiology. European Archives of Psychiatry and Clinical Neuroscience, 256(3), 174-186.59 National Scientific Council on the Developing Child (2010). Early Experiences Can Alter Gene Expression and Affect Long-Term Development: Working Paper No. 10. Cambridge, MA: Author.

54
Benefits Analysis
reduce crime.60,61,62,63,64,65,66,67,68,69,70,71,72 Numerous evaluations of both small-scale and large-scale early education programs demonstrate that the benefits to children and our so-ciety outweigh the financial costs of funding these programs. Studies examining the return on investment for early learning programs find a range of levels for positive returns. For example, the Perry Preschool project, a two-year early learning intervention for children from low-income families, netted approximately 7-10 dollars back for every dollar spent on the program, with a baseline estimate of $8.60.73,74 Most of these financial benefits came from later reductions in crime. Evaluations of the Chicago Child-Parent Center program (CPC) also show benefits from medium and long-term positive effects. When CPC par-ticipants reach age 21, analyses demonstrates that one and a half years of CPC preschool participation yielded a return for society of $7.10. In comparison to preschool children who did not participate in CPC, the preschool participants had lower rates of special educa-tion placement and grade retention and a higher rate of high school completion. They also had lower rates of juvenile arrests and lower arrest rates for a violent offense.75 A recent analysis by some of the country’s premier child development and early intervention experts
60 Aikens, N., Kopack Klein, A., Tarullo, L., & West, J. (2013). Getting Ready for Kindergarten: Children’s Progress During Head Start. FACES 2009 Report. OPRE Report 2013-21a. Washington, DC: Office of Planning, Research and Evaluation, Administration for Children and Families, U.S. Department of Health and Human Services.61 Schweinhart, L. J., Montie, J., Xiang, Z., Barnett, W. S., Belfield, C. R., & Nores, M. (2005). Lifetime effects: The HighScope Perry Preschool study through age 40. Ypsilanti, MI: HighScope Press.62 Barnett, W. S., & Hustedt, J. T. (2005). Head start’s lasting benefits. Infants & Young Children, 18(1), 16-24.63 Yoshikawa, H., Weiland, C., Brooks-Gunn, J., Burchinal, M., . . .Zaslow, M. (2013). Investing in our future: The evidence base on preschool education. Foundation for Child Development. New York, NY. 64 Camilli, G., Vargas, S., Ryan, S., & Barnett, W. S. (2010). Meta-analysis of the effects of early education interventions on cognitive and social development. The Teachers College Record, 112, 579-620.65 Wong, V. C., Cook, T. D., Barnett, W. S., & Jung, K. (2008). An effectiveness-based evaluation of five state prekindergarten programs. Journal of Policy Analysis and Management, 27, 122-154.66 Reynolds, A.J. (2000). Success in early intervention: The Chicago Child-Parent Centers. Lincoln, Nebraska: University of Nebraska Press.67 Schweinhart, L. J., Montie, J., Xiang, Z., Barnett, W. S., Belfield, C. R., & Nores, M. (2005). Lifetime effects: The HighScope Perry Preschool study through age 40. Ypsilanti, MI: HighScope Press.68 Gormley, W., Gayer, T., Phillips, D.A., & Dawson, B. (2005). The effects of universal Pre-K on cognitive development. Developmental Psychology, 41, 872-884.69 Campbell, F. A., Ramey, C. T., Pungello, E., Sparling, J., & Miller-Johnson, S. (2002). Early childhood education: Young adult outcomes from the Abecedarian project. Applied Developmental Science, 6, 42-57.70 Weiland, C., & Yoshikawa, H. (2013). Impacts of a prekindergarten program on children’s mathematics, language, literacy, executive function, and emotional skills. Child Development, 84, 2112–2130.71 Peisner-Feinberg, E. S., Schaaf, J. M., LaForett, D. R., Hildebrandt, L.M., & Sideris, J. (2014). Effects of Georgia’s Pre-K Program on children’s school readiness skills: Findings from the 2012-2013 evaluation study. Chapel Hill: The University of North Carolina, FPG Child Development Institute.72 The Council of Economic Advisers. (December, 2014). The Economics of Early Childhood Investments. Washington, DC: Authors73 Heckman, J.J., Moon, S.H., Pinto, R., Savalyev, P.A. & Yavitz, A. (2010). The Rate of Return to the High/Scope Perry Preschool Program. Journal of Public Economics, 94(1-2), 114–128.74 The Council of Economic Advisers. (December, 2014). The Economics of Early Childhood Investments. Washington, DC: Authors.75 Reynolds, A.J., Temple, J.A., Robertson, D.L., Mann, E.A. (2002). Age 21 Cost-Benefit Analysis of the Title I Chicago Child-Parent Centers. Educational Evaluation and Policy Analysis. 24(4), 267-303.

Benefits Analysis
55
conclude universal pre-kindergarten returns $3-5 in benefits for every dollar spent.76 Nobel Prize winning economist James Heckman concludes that educational interventions in the first five years of life show much greater benefits than later interventions.77
Taken together, this research suggests that participation in early learning programs can help support optimal child development, particularly for children from low-income families, with benefits for society lasting well into adulthood. However, early learning programs must be sufficiently high quality to reap these benefits. The congressionally mandated, randomized control trial study of Head Start’s impact did not show lasting effects on the outcomes measured beyond the end of the Head Start program years.78 However, recent reanalysis of data from the Head Start Impact Study suggests that those programs that were high-quality had greater effects on children, providing further confidence in the benefits of participation in high-quality Head Start programs.79 In addition, based on monitoring data, including Classroom Assessment Scoring System (CLASS), and findings from FACES and the Head Start Impact Study, we also know that there is significant variance in quality among Head Start programs.80,81,82 Further, longer program duration may allow more Head Start parents to work, which would have benefits to Head Start children and to society.83,84 In order for Head Start to achieve its mission to be an effective tool in supporting children’s success in kindergarten and beyond, and for society to reap the full benefits of this investment, every Head Start program is providing high quality services that will promote strong and lasting child outcomes.
Review of Research on Early Education Duration
The Secretary’s Advisory Committee recommended Head Start look to “optimize dosage,”
76 Yoshikawa, H., Weiland, C., Brooks-Gunn, J., Burchinal, M., . . .Zaslow, M. (2013). Investing in our future: The evidence base on preschool education. Foundation for Child Development.77 Heckman, J. J., Moon, S. H., Pinto, R., Savelyev, P. A., & Yavitz, A. (2010). The rate of return to the HighScope Perry Preschool Program. Journal of Public Economics, 94, 114-128.78 Puma, M., Bell, S., Cook, R., Heid, C., Broene, P., Jenkins, F., & Downer, J. (2012). Third grade follow-up to the Head Start impact study final report. US Department of Health and Human Services Office of Planning, Research and Evaluation.79 Walters, C. (2014). Inputs in the production of early childhood human capital: Evidence from Head Start. Working paper. http://eml.berkeley.edu/~crwalters/papers/HS_2_2014.pdf80 Office of Head Start (2014). A National Overview of Grantee CLASS(TM) Scores in 2013. Washington, DC: Office of Head Start, Administration for Children and Families, U.S. Department of Health and Human Services.81 Aikens, N., Kopack Klein, A., Tarullo, L., & J. West. (2013). Getting Ready for Kindergarten: Children’s Progress During Head Start. FACES 2009 Report. OPRE Report 2013-21a. Washington, DC: Office of Planning, Research and Evaluation, Administration for Children and Families, U.S. Department of Health and Human Services. 82 Puma, M., Bell, S., Cook, R., Heid, C., Broene, P., Jenkins, F., & Downer, J. (2012). Third grade follow-up to the Head Start impact study final report. US Department of Health and Human Services Office of Planning, Research and Evaluation.83 Huston, A. C., Duncan, G. J., McLoyd, V. C., Crosby, D. A., Ripke, M. N., Weisner, T. S., & Eldred, C. A. (2005). Impacts on children of a policy to promote employment and reduce poverty for low-income parents: new hope after 5 years. Developmental psychology, 41(6), 902.84 Huston, A. C., Duncan, G. J., Granger, R., Bos, J., McLoyd, V., Mistry, R., ... & Ventura, A. (2001). Work-based antipoverty programs for parents can enhance the school performance and social behavior of children. Child Development, 318-336.

56
Benefits Analysis
and our new requirements will ensure Head Start programs become more aligned with state pre-kindergarten programs that have shown strong effects over time.85,86 For example, North Carolina pre-kindergarten, which is offered to lower income families and operates 6.5 hours per day and 180 days per year, demonstrates strong effects. Children who attend the program make gains in language, literacy, math, general knowledge and social skills. At the end of 3rd grade, children from low-income families who had attended state pre-kin-dergarten scored higher on math assessments than children from low income families who did not attend. Moreover, children who are dual language learners make gains at even faster rates than other children.87 New Jersey’s state pre-kindergarten, which operates between 6-10 hours per day and 180-245 days per year shows significant impacts for child learning. Children who attend New Jersey pre-kindergarten show improvements in language, print awareness, and math at kindergarten entry, 1st grade, and 2nd grade. Gains still exist in language arts, literacy, math, and science at 4th and 5th grade. They also show a 40 percent decrease in grade retention and a 31 percent decrease in special education placement.88
Other states with service duration consistent with our minimum annual hours find strong results for children. For example, Georgia pre-kindergarten, which operates 6.5 hours per day and typically runs 180 days per year, finds medium to large effects on children’s lan-guage, literacy, and math skills at kindergarten entry.89 Tulsa pre-kindergarten also shows strong effects for children in language and math skills. This program operates 180 days per year and is mainly a full-day program for low-income children. There is some evidence that full-day attendance in Tulsa supports better outcomes for low income and minority chil-dren.90 Boston pre-kindergarten, which also operates for a full school day and school year, demonstrates large effects on children’s language and math skills.91
Only a small amount of research with young children has been able to isolate the impact of service duration on child learning, but what does exist links increasing the length of the program day and program year to improved children’s outcomes. For example, a random-ized control study in which one group of children attended pre-kindergarten for 8 hours per day for 45 weeks and another group of children attended the same program for 2.5-3 hours per day for 41 weeks found that by the spring of kindergarten, the children who had
85 Weiland, C., & Yoshikawa, H. (2013). Impacts of a prekindergarten program on children’s mathematics, language, literacy, executive function, and emotional skills. Child Development, 84, 2112–2130.86 Barnett, W.S., Jung, K., Youn, M.J., and Frede, E.C. (2013). Abbott Preschool Program Longitudinal Effects Study: Fifth Grade Follow-Up. National Institute for Early Education Research Rutgers—The State University of New Jersey.87 Peisner-Feinberg, E. S., Schaaf, J. M., LaForett, D. R., Hildebrandt, L.M., & Sideris, J. (2014). Effects of Georgia’s Pre-K Program on children’s school readiness skills: Findings from the 2012–2013 evaluation study. Chapel Hill: The University of North Carolina, FPG Child Development Institute.88 Barnett, W.S., Jung, K., Youn, M.J., and Frede, E.C. (2013). Abbott Preschool Program Longitudinal Effects Study: Fifth Grade Follow-Up. National Institute for Early Education Research Rutgers—The State University of New Jersey.89 Peisner-Feinberg, E. S., Schaaf, J. M., LaForett, D. R., Hildebrandt, L.M., & Sideris, J. (2014). Effects of Georgia’s Pre-K Program on children’s school readiness skills: Findings from the 2012–2013 evaluation study. Chapel Hill: The University of North Carolina, FPG Child Development Institute.90 Gormley, G.T., Gayer, T., Phillips, D., & Dawson, B. (2005). The effects of universal pre-k on cognitive development. Developmental Psychology, 4(6), 872-884.91 Weiland, C., & Yoshikawa, H. (2013). Impacts of a prekindergarten program on children’s mathematics, language, literacy, executive function, and emotional skills. Child Development, 84, 2112–2130.

Benefits Analysis
57
attended full-day pre-kindergarten had improved almost twice as much on vocabulary and math skills compared to the children who attended half day.92 Research with children in child care settings found 30 hours of participation each week to be necessary for low and middle income children to see stronger learning outcomes.93
Moreover, research on effective teaching practices for children at risk of school difficulties also support the need for full-day operation. A meta-analysis of pre-kindergarten programs found that those that focused on intentional teaching and small group and one-to-one inter-actions had larger impacts on child outcomes.94 It is very difficult for a half-day program to provide sufficient time for teachers to conduct learning activities and intentional instruction in small group and one-on-one interactions in the areas of skill development experts believe are important to later school success.
Researchers believe meaningful skill development in language, literacy, and math requires intentional, frequent, and specific methods of instruction and teacher-child interactions. These types of interactions are often complex, require a variety of types of interactions and intensities, and for many children in Head Start, need to be conducted in small groups to allow sufficient individualized scaffolding and skill development.95 Experts believe math curriculum and instruction must support development of broad and deep mathemati-cal thinking and knowledge, including development of abstract thought and reasoning.96 Targeted instruction and small group activities are teaching practices that are particularly important to include for supporting the learning of children who are behind.97,98 Language and literacy experts believe teachers must take an active role in supporting language and literacy development for children at risk of reading difficulties. That requires systematic and explicit instruction to foster vocabulary breadth and depth. Research with toddlers and preschool age children also finds that greater exposure to rich vocabulary enrichment allows
92 Robin, K.B., Frede, E.C., Barnett, W.S. (2006). Is More Better? The Effects of Full-Day vs. Half-Day Preschool on Early School Achievement. NIEER Working Paper. 93 Loeb, S., Bridges, M., Bassok, D., Fuller, B., Rumberger, R., (2005). How much is too much? The influence of preschool centers on children’s social and cognitive development. Working paper. National Bureau Of Economic Research.94 Camilli, G., Vargas, S., Ryan, S., & Barnett, W.S. (2010). Meta-analysis of the effects of early education interventions on cognitive and social development. Teachers College Record, 112(3), 579-620.95 Justice, L.M., Mcginty, A., Cabell, S.Q., Kilday, C.R., Knighton, K., & Huffman, G. (2010). Language and literacy curriculum supplement for preschoolers who are academically at risk: A feasibility study. Language, Speech, and Hearing Services in Schools, 41, 161-178.96 Ginsburg, H.P., Ertle, B., & Presser, A.L. (2014). Math curriculum and instruction for young children. Chapter 16 in Handbook of Response to Intervention in Early Childhood, Buysee, V., & Peisner-Feinberg, E. (Eds.). Baltimore: Paul H. Brookes Publishing.97 Buysse, V., Peisner-Feinber, E.S., Saikakou, E., & LaForett, D.R. (2014). Recognition & response: A model of response to Intervention to promote academic learning in early education. Chapter 5 in Handbook of Response to Intervention in Early Childhood, Buysee, V., & Peisner-Feinberg, E. (Eds.). Baltimore: Paul H. Brookes Publishing.98 Justice, L.M., McGinty, A., Cabell, S.Q., Kilday, C.R., Knighton, K., & Huffman, G. (2010). Language and literacy curriculum supplement for preschoolers who are academically at risk: A feasibility study. Language, Speech, and Hearing Services in Schools, 41, 161-178.

58
Benefits Analysis
for better scaffolding that can lead to improved language and literacy.99,100 As such, ex-perts recommend in addition to integration into group learning and free play, language and literacy instruction should be explicitly structured and sequenced in 15-20 minutes small group session at least three times per week.101 Math experts have similar time estimates for supporting adequate high quality learning experiences.102,103
Research on summer learning loss demonstrates the importance of extending the minimum days of operation in Head Start. Research on reading skills found high-income students gained skills over summer break, middle-income students maintained their skill level, and children from lower income families lost skills.104 Experts conclude the average student loses one month worth of skills and development over the summer break.105 The amount of learning loss is even greater for children from low income families who may not have as much access to educational resources and experiences during the summer and who are al-ready behind their more advantaged peers and need extra time to learn skills and strengthen development.106,107,108,109,110 This pattern is also true for the youngest children in elemen-tary school. Analysis of the ECLS finds that children from families with higher incomes learn more over the summer between kindergarten and 1st grade than do children from families with lower incomes.111 In fact, researchers believe the effects of summer learning
99 Harris, Golinkoff, & Hirsh-Pasell (2011). Lessons for the Crib for the Classroom: How Children Really Learn Vocabulary. In Handbook of Early Literacy Research, Vol 3. Ed by D. Dickinson and S. Neuman (NY: Guilford). 49-65.100 Dickinson, D.K., Flushman, T.R., & Freiberg, J.B. (2009). Learning, reading, and classroom supports: Where we are and where we need to be going. In B. Richards, M.H. Daller, D.D. Malvern, P. Meara, J. Milton, & Trefers-Daller (Eds.). Vocabulary Studies in First and Second Language Acquisition: The Interface Between Theory and Application. (pp. 23-38). Hampshire, England: Palgrave-McMillan.101 Curenton, S.M., Justice, L.M., Zucker, T.A., & McGinty, A.S. (2014). Language and literacy curriculum and instruction. Chapter 15 in in Handbook of Response to Intervention in Early Childhood, Buysee, V., & Peisner-Feinberg, E. (Eds.). Baltimore: Paul H. Brookes Publishing.102 Clements, D.H., Sarama, J., Wolfe, C.B., & Spitler, M.E. (2012). Longitudinal evaluation of a scale-up model for teaching mathematics with trajectories and technologies: persistence of effects in the third. American Educational Research Journal.103 Clements, D.H., & Sarama, J., (2008). Experimental evaluation of the effects of a research-based preschool mathematics curriculum. American Educational Research Journal, 45(2), 443-494. 104 Benson, J., & Borman, G.D. (2010). Family, Neighborhood, and School Settings Across Seasons: When Do Socioeconomic Context and Racial Composition Matter for the Reading Achievement Growth of Young Children? Teacher’s College Record, 112(5), 1338–1390.105 Sloan McCombs, J. et al., (2011). Making Summer Count. How Summer Programs Can Boost Children’s Learning. Santa Monica, Calif.: RAND Corporation. 106 Alexander, K. L., Entwisle D. R., & Olson L. S. (2007). Lasting consequences of the summer learning gap. American Sociological Review, 72, 167-180.107 Ibid.108 Sloan McCombs, J. et al., (2011). Making Summer Count. How Summer Programs Can Boost Children’s Learning. Santa Monica, Calif.: RAND Corporation.109 Allington, R.L. & McGill-Franzen, A. (2003). The Impact of Summer Setback on the Reading Achievement Gap. The Phi Delta Kappan, 85(1), 68-75.110 Fairchild, R. & Noam, G. (Eds.) (2007). Summertime: Confronting Risks, Exploring Solutions. San Francisco: Jossey-Bass/Wiley.111 Burkam, D.T., Ready, D.D., Lee, V.E. & LoGerfo, L.F. (2004). Social-Class Differences in Summer Learning Between Kindergarten and First Grade: Model Specification and Estimation. Sociology of Education, 77, 1–3

Benefits Analysis
59
loss for children from low-income families is cumulative and that the disparity in summer gains and losses over the first four summers of elementary school is greater than the differ-ential between children from high and low income families at school entry.112 Experts also conclude summer learning loss in elementary school predicts poor academic achievement in high school.113
Research on attendance also finds exposure to additional learning time is important for skill development.114,115 Research with elementary school children has shown an increase in school attendance predicted improved reading scores.116 A recent study of preschool atten-dance in Chicago found that even when accounting for children’s skill level at the beginning of preschool, attendance predicted better academic outcomes at the end of preschool and beyond and that attendance was most beneficial for children starting preschool with the lowest skills. Children who missed more preschool had lower math, letter recognition, and social-emotional skills and were also rated as lower on work habits by their teachers.117
In sum, providing high-quality early education is not a simple task. Standards must be high to create learning environments that allow teachers to facilitate effective early learning ex-periences and support must be provided that continuously builds teachers’ skills and knowl-edge. Taken together this research clearly indicates previous Head Start minimums for program operations are inadequate to achieve the results researchers and economists have shown are possible. Although the evidence does not point to a particular threshold for the length of the day or length of the year that is necessary to ensure positive child outcomes, the research is clear that children will benefit from more exposure to early learning experi-ences than our previous minimums provide.
Costs and Benefits to Society
It is our expectation that this rule will be implemented with sufficient funds to avoid slot loss resulting from costs associated with this rule. In FY 2016, Congress appropriated $294 million specifically to increase service duration for Early Head Start and Head Start pro-grams, which cover some of the costs of the duration requirements in this final rule. The President’s FY 2017 Budget includes a request for an additional $292 million. Collectively these funds would allow all programs to increase service duration so that at least 50 percent
112 Alexander, K. L., Entwisle D. R., & Olson L. S. (2007). Lasting consequences of the summer learning gap. American Sociological Review, 72, 167-180.113 Ibid.114 Logan, J.A.R., Piasta, S.B., Justice, L.M., Schatschneider, C., & Petrill, S. (2011). Children’s Attendance Rates and Quality of Teacher-Child Interactions in At-Risk Preschool Classrooms: Contribution to Children’s Expressive Language Growth. Child & Youth Forum 40(6), 457-477.115 Hubbs-Tait, L., McDonald Culp, A., Huey E., Culp, R., Starost, H., & Hare, C. (2002). Relation of Head Start attendance to children’s cognitive and social outcomes: moderation by family risk. Early Childhood Research Quarterly, 17, 539–558.116 Lamdin, D.J. (1996). Evidence of student attendance as an independent variable in education production functions. Journal of Educational Research, 89(3), 155-162.117 Ehrlich, S.B., Gwynne, J.A…..Sorice, E. (2014). Preschool Attendance in Chicago Public Schools: Relationships with Learning Outcomes and Reasons for Absences. University of Chicago Consortium on Chicago School Research. Research Report.
60
Benefits Analysis
of their Head Start center-based slots and 100 percent of their Early Head Start cen-ter-based slots would meet the respective new minimums of 1,020 and 1,380 annual hours by August 1, 2018, as required in this rule. Congress would need to appropriate additional funds to support the full implementation of the Head Start center-based service duration requirement by February 1, 2020, the date by which the Secretary will decide whether to lower the percentage of slots required to increase duration based on an assessment of the availability of sufficient appropriations to mitigate substantial slot loss. If fully funded, this rule would result in a significant increase in the quality of Head Start and the associated benefits of Head Start participation for all children. Ample research, also discussed above, demonstrates the potential for early education programs to produce large returns on invest-ment to society through benefits associated with short and long term effects on children’s math, reading and behavior skills; reduced grade retention, teen pregnancy, need for special education services, crime, and delinquency; and increased lifetime earnings.118,119,120,121,122,123,
124,125,126,127,128,129,130 This research, coupled with research indicating the importance of adequate duration in early learning programs, would suggest that extending program dura-tion and increasing program quality will result in additional benefits for any child enrolled in a Head Start program that does not already meet or exceed the bar set for program quality in this rule. The relative size of these additional benefits will likely vary from program to program and it is not possible for this analysis to quantify the precise benefit. Additional-ly, if the rule is fully implemented with adequate funding, there may be benefits associated with additional teacher jobs, higher staff salaries, and increased support for parental work.
118 Aikens, N., Kopack Klein, A., Tarullo, L., & West, J. (2013). Getting Ready for Kindergarten: Children’s Progress During Head Start. FACES 2009 Report. OPRE Report 2013-21a. Washington, DC: Office of Planning, Research and Evaluation, Administration for Children and Families, U.S. Department of Health and Human Services.119 Schweinhart, L. J., Montie, J., Xiang, Z., Barnett, W. S., Belfield, C. R., & Nores, M. (2005). Lifetime effects: The HighScope Perry Preschool study through age 40. Ypsilanti, MI: HighScope Press.120 Barnett, W. S., & Hustedt, J. T. (2005). Head start’s lasting benefits. Infants & Young Children, 18(1), 16-24.121 Yoshikawa, H., Weiland, C., Brooks-Gunn, J., Burchinal, M., . . .Zaslow, M. (2013). Investing in our future: The evidence base on preschool education. Foundation for Child Development. New York, NY.122 Camilli, G., Vargas, S., Ryan, S., & Barnett, W. S. (2010). Meta-analysis of the effects of early education interventions on cognitive and social development. The Teachers College Record, 112, 579-620.123 Wong, V. C., Cook, T. D., Barnett, W. S., & Jung, K. (2008). An effectiveness-based evaluation of five state prekindergarten programs. Journal of Policy Analysis and Management, 27, 122-154.124 Reynolds, A.J. (2000). Success in early intervention: The Chicago Child-Parent Centers. Lincoln, Nebraska: University of Nebraska Press.125 Schweinhart, L. J., Montie, J., Xiang, Z., Barnett, W. S., Belfield, C. R., & Nores, M. (2005). Lifetime effects: The HighScope Perry Preschool study through age 40. Ypsilanti, MI: HighScope Press.126 Gormley, W., Gayer, T., Phillips, D.A., & Dawson, B. (2005). The effects of universal Pre-K on cognitive development. Developmental Psychology, 41, 872-884.127 Campbell, F. A., Ramey, C. T., Pungello, E., Sparling, J., & Miller-Johnson, S. (2002). Early childhood education: Young adult outcomes from the Abecedarian project. Applied Developmental Science, 6, 42-57.128 Weiland, C., & Yoshikawa, H. (2013). Impacts of a prekindergarten program on children’s mathematics, language, literacy, executive function, and emotional skills. Child Development, 84, 2112–2130.129 Peisner-Feinberg, E. S., Schaaf, J. M., LaForett, D. R., Hildebrandt, L.M., & Sideris, J. (2014). Effects of Georgia’s Pre-K Program on children’s school readiness skills: Findings from the 2012-2013 evaluation study. Chapel Hill: The University of North Carolina, FPG Child Development Institute.130 The Council of Economic Advisers. (December, 2014). The Economics of Early Childhood Investments. Washington, DC: Authors

Benefits Analysis
61
Finally, this rule increases clarity of Head Start requirements which should lead to greater compliance, which should in turn, result in improved child safety and stronger child and family outcomes. However, it is also not possible for this analysis to quantify these benefits.
If the Secretary exercises this authority, the final rule would result in a smaller benefit to so-ciety than the fully funded rule, because fewer children would benefit from greater exposure to high-quality early learning experiences. However, if the Secretary does not exercise this authority, this rule could result in a decrease of as many as 123,000 slots, depending upon appropriations and whether programs are able to absorb any costs of the rule within their current operating budgets. This slot loss has costs to society because fewer children will have access to Head Start in the future; although these costs have been estimated in preced-ing portions of this regulatory impact analysis, the quantification does not account for the relative size of these potential costs, which likely vary from program to program and from child to child (perhaps most notably in the form of diminishing returns to Head Start expo-sure). Additionally, if the rule is fully implemented without adequate funding, there may be costs associated with job loss, however it is not possible for this analysis to quantify them.
Further, this cost to society may be mitigated by the availability of other early learning pro-grams, given findings from the Head Start Impact Study that indicate a wide range of early childhood education utilization among children who do not have access to Head Start.131 In this case, determining how the loss of slots impacts society depends on how benefits differ between Head Start and the alternative early childhood education programs. Among chil-dren whose future Head Start slots are eliminated, children who enroll in alternative early childhood education programs of similar quality would not experience a loss of benefits, while children who enroll in programs of lower quality or no program at all would expe-rience lost benefits. To be sure, quality and affordable early learning programs for poor families are limited and there is significant unmet need. A reduction in Head Start slots is unlikely to be fully absorbed by other programs given that other early learning programs are not universally available to all children and these programs only currently serve a fraction of the eligible population. The total benefit to society of the rule would depend upon the relative size of the benefits to children who receive greater exposure to high-quality early learning experiences compared to the lost benefits for children who no longer have access to Head Start.
Continuing to operate under widely varying minimums for program duration, in the face of the mounting evidence provided here, limits Head Start’s overall effectiveness and undermines Head Start’s mission. This rule is designed to ensure every child in Head Start receives the highest quality program. The requirements to extend program duration are in-extricably linked to reaping the full range of benefits that researchers and economists have demonstrated are possible.
Implications of Congressional and Secretarial Actions
The costs of this rule vary over the next ten years of implementation based upon com-
131 Puma, M., Bell, S., Cook, R., Heid, C., Broene, P., Jenkins, F., & Downer, J. (2012). Third grade follow-up to the Head Start impact study final report. US Department of Health and Human Services Office of Planning, Research and Evaluation.
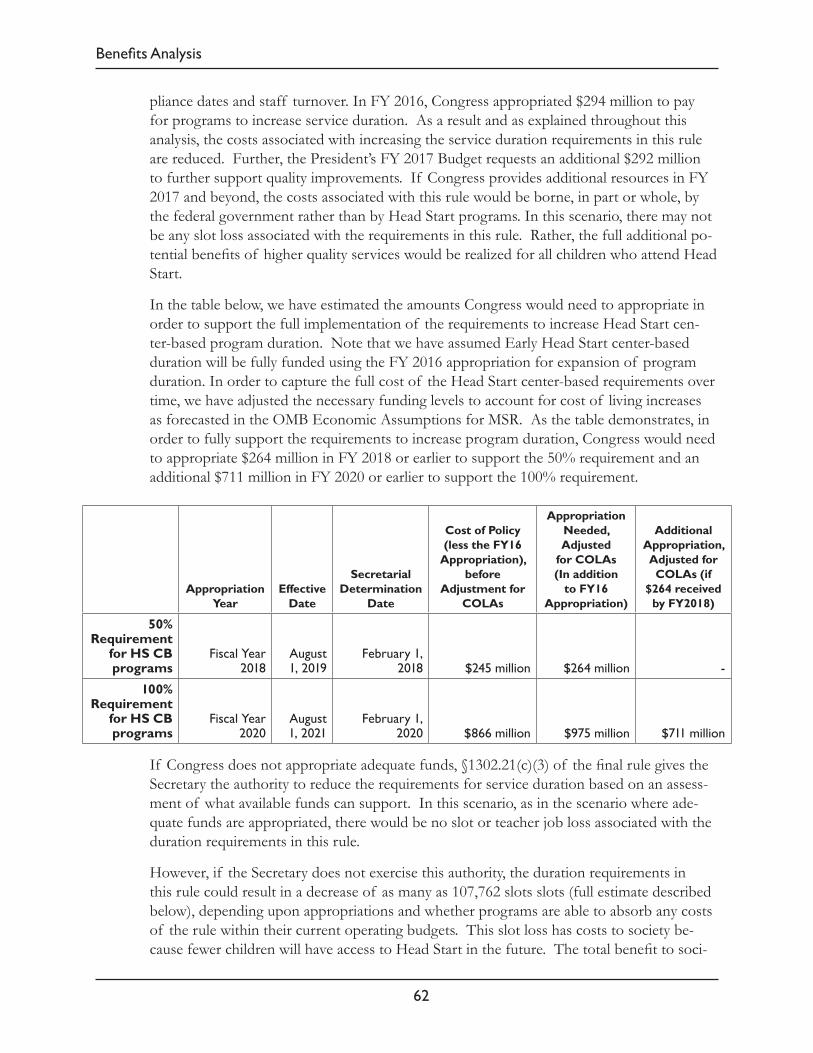
62
Benefits Analysis
pliance dates and staff turnover. In FY 2016, Congress appropriated $294 million to pay for programs to increase service duration. As a result and as explained throughout this analysis, the costs associated with increasing the service duration requirements in this rule are reduced. Further, the President’s FY 2017 Budget requests an additional $292 million to further support quality improvements. If Congress provides additional resources in FY 2017 and beyond, the costs associated with this rule would be borne, in part or whole, by the federal government rather than by Head Start programs. In this scenario, there may not be any slot loss associated with the requirements in this rule. Rather, the full additional po-tential benefits of higher quality services would be realized for all children who attend Head Start.
In the table below, we have estimated the amounts Congress would need to appropriate in order to support the full implementation of the requirements to increase Head Start cen-ter-based program duration. Note that we have assumed Early Head Start center-based duration will be fully funded using the FY 2016 appropriation for expansion of program duration. In order to capture the full cost of the Head Start center-based requirements over time, we have adjusted the necessary funding levels to account for cost of living increases as forecasted in the OMB Economic Assumptions for MSR. As the table demonstrates, in order to fully support the requirements to increase program duration, Congress would need to appropriate $264 million in FY 2018 or earlier to support the 50% requirement and an additional $711 million in FY 2020 or earlier to support the 100% requirement.
Appropriation Year
Effective Date
Secretarial Determination
Date
Cost of Policy (less the FY16
Appropriation), before
Adjustment for COLAs
Appropriation Needed, Adjusted
for COLAs (In addition
to FY16 Appropriation)
Additional Appropriation, Adjusted for COLAs (if
$264 received by FY2018)
50% Requirement
for HS CB programs
Fiscal Year 2018
August 1, 2019
February 1, 2018 $245 million $264 million -
100% Requirement
for HS CB programs
Fiscal Year 2020
August 1, 2021
February 1, 2020 $866 million $975 million $711 million
If Congress does not appropriate adequate funds, §1302.21(c)(3) of the final rule gives the Secretary the authority to reduce the requirements for service duration based on an assess-ment of what available funds can support. In this scenario, as in the scenario where ade-quate funds are appropriated, there would be no slot or teacher job loss associated with the duration requirements in this rule.
However, if the Secretary does not exercise this authority, the duration requirements in this rule could result in a decrease of as many as 107,762 slots slots (full estimate described below), depending upon appropriations and whether programs are able to absorb any costs of the rule within their current operating budgets. This slot loss has costs to society be-cause fewer children will have access to Head Start in the future. The total benefit to soci-

Benefits Analysis
63
ety of the rule would depend upon the relative size of the benefits to children who receive greater exposure to high-quality early learning experiences compared to the lost benefits for children who no longer have access to Head Start. Both Congressional and Secretarial decisions have important implications for the number of children served by the program and the characteristics of the program.
Although we are unable to quantify the associated costs and benefits that would arise from these implementation scenarios, it is important to keep these factors in mind as we consider both the societal costs and savings and the cost-benefit analysis of this final rule.
Potential Slot Loss
In order to estimate slot loss as programs adjust their budgets in the absence of additional funding, we first determined the proportion of current funded enrollment that are Head Start slots (83.8 percent) and Early Head Start slots (16.2 percent), respectively. We then applied this proportion to the total monetary cost associated with this rule, in each out-year, in FY 2016 dollars, and divided the cost that would be borne in Head Start slots by the average cost per slot for Head Start in FY 2015 ($8,035) and the cost that will be borne in Early Head Start by the average cost per slot for Early Head Start in FY 2015 ($12,189), which is inclusive of the cost per child for Early Head Start-Child Care Partnerships. We use FY 2015 average costs because it is the most recent year for which we have final data. In this case, we did not inflate the Head Start cost per child to incorporate teacher salary increases or additional service hours because we believe the current cost per child is the best indicator for the number of slots programs would need to cut to absorb new costs. We also assumed that the additional $294 million appropriated in FY 2016 will fully fund Early Head Start duration ($30,878,060) and support some proportion of all Head Start grantees slots serving children for 1,020 hours.
Without additional funding, the net costs of this rule borne by Head Start, if fully imple-mented could be associated with a reduction in slots (number of children served) of as many as 123,614 by year ten. However, it is important to note that we believe these are overestimates of the actual potential slot loss, because many of the costs estimated in this section, aside from the increases in duration, represent changes in how programs will use existing funds rather than additional new costs that would result in slot loss. As stated earli-er, this slot loss would not occur if the Secretary exercises discretion provided in the rule to reduce the duration requirements or if sufficient appropriations are provided by Congress to support the policy. This would also be an overestimate if Congress appropriates addi-tional funds to support the full implementation of this rule or if the Secretary exercises the authority to reduce the service duration requirements.
The table below describes the share of costs in years one through ten borne by Head Start and Early Head Start programs and the potential slot loss associated with those costs in each year. Costs vary by year based upon effective dates of individual provisions and whether those costs are one-time or ongoing.

64
Benefits Analysis
Potential Slot Loss (If Congress does not appropriate sufficient funding in future years and the Secretary does not use the discretion provided
in the Final Rule to lower the duration requirements)Year 1
2016/2017*Year 2
2017/2018*Year 3
2018/2019*Year 4
2019/2020*Year 5
2020/2021*
Share of Costs, Including FY 2016 Funding Appropriated for Duration Increases
HS $0 $105,964,210 $188,593,130 $350,403,218 $455,190,660
EHS $0 $28,673,236 $44,646,846 $28,503,144 $48,760,382
Potential Slot Loss
HS 0 13,188 23,471 43,610 56,651
EHS 0 2,352 3,663 2,338 4,000
Total 0 15,540 27,134 45,948 60,651
Year 6 2021/2022*
Year 7 2022/2023*
Year 8 2023/2024*
Year 9 2024/2025*
Year 10 2025/2026*
Share of Costs Including FY 2016 Funding Appropriated for Duration Increases
HS $971,741,327 $972,486,346 $973,835,238 $974,263,621 $974,050,651
EHS $28,655,562 $28,799,587 $29,060,351 $29,143,165 $29,101,994
Potential Slot Loss
HS 120,939 121,031 121,199 121,252 121,226
EHS 2,351 2,363 2,384 2,391 2,388
Total 123,289 123,394 123,583 123,643 123,614
* Year ranges refer Head Start program years, which for these estimates, begin on August 1st of each year and end on or before July 31st.
** The costs and slot loss estimates in this table take into account the $294 million appropriated for increased duration, and assume that this funding is applied beginning in Year 3 for Early Head Start and Year 4 for Head Start, when the initial duration requirement would be effective, and is maintained throughout the ten year window. This table also assumes that the share of HS and EHS slots is
stable over time.
Potential Education Staff Job Loss
In order to estimate the total potential number of education staff jobs that may be lost if a slot reduction occurs as a result of full policy implementation without additional funding, we first reduced the costs of the rule borne by Head Start by the cost of eliminating the option for double sessions for Head Start and Early Head Start. Double session programs typically have the same teacher operate a morning and afternoon session with different groups of children. Therefore, we assume double session teachers would not lose their jobs, even if fewer children are served in those programs because they would teach one group of children for a longer session. We also assumed that the additional $294 million appropriated in FY 2016 will fully fund Early Head Start center-based duration increase (estimated at $30,878,060). To determine the costs borne by Head Start (not including dura-tion) that may be associated with education staff job loss for Early Head Start, we subtract-ed center-based duration costs from the total costs borne by Early Head Start programs ($59,980,054), which is $29,101,994.
Accounting Statement – Table of Quantified Costs, and Transfers
65
In order to estimate the education staff job loss for Head Start that would be associated with costs borne by Head Start programs, we assumed that an equal distribution of double session and non-double session Head Start center-based slots will be increased using sup-plemental duration funds out of the FY 2016 appropriation of $294 million which will sup-port all grantees providing 1,020 hours for at least one-third of their slots. Based on this assumption, we divided the $263,121,940 appropriated in FY 2016 for duration (less the cost of the Early Head Start center-based duration increase) by two, which is $131,560,970. We then subtracted the $131,560,970 from the non-double session Head Start share of the total costs ($652,809,539) to find the cost of non-double session slots not supported by FY 2016 appropriations, which is $521,248,569. Then, we divided the $521,248,569 for Head Start by the average cost per child for Head Start, or $8,035, and the non-duration costs for Early Head Start ($29,101,994) by the average cost per slot for Early Head Start, or $12,189, to find the number of slots in Head Start (64,872) and Early Head Start (2,388) associated with these costs.
Then, to account for education staff to child ratios and caseloads that differ by the program option and the age of the child, we applied current percentages from the Program Informa-tion Report (PIR) for the proportion of Head Start slots that are center-based, home-based, and other program options (including family child care, locally designed, and combination programs), which are 96 percent, 2.2 percent, and 1.8 percent respectively. These propor-tions result in 62,277 Head Start center-based slots, 1,427 home-based, and 1,168 other program option slots, assuming programs would reduce center-based, home-based, and other program options proportionately in the face of insufficient funds. Finally, we applied the proportion of three- versus four- year olds in Head Start from the PIR to find 27,679 three-year-old and 34,599 four-year old center-based slots.
We also applied the proportion of Early Head Start slots that are center-based, home-based/ pregnant women, and other program options (including family child care, locally designed, and combination programs), 47 percent, 48 percent, and 5 percent respectively, to calculate that there would be 1,122 Early Head Start center-based slots, 1,146 home-based/ pregnant women slots, and 119 other program option slots, assuming programs would reduce center-based, home-based/pregnant women, and other program options propor-tionately in the face of insufficient funds. Finally, we applied the appropriate education staff to child ratios and caseloads for center-based program options by age, home-based, other program options to determine the total number of Head Start and Early Head Start education staff jobs that would potentially be lost.
If fully implemented without additional funding, this rule could result in a reduction of as many as 7,372 education staff jobs by year ten.
4. Accounting Statement – Table of Quantified Costs, and Transfers
As required by the Office of Management and Budget (OMB) Circular A-4, we have pre-pared an accounting statement table showing the classification of the impacts associated with implementation of this final rule. We decided to use a 10-year window for this regu-latory impact analysis. As required by OMB, we discount costs at 3 percent and 7 percent

66
Accounting Statement – Table of Quantified Costs, and Transfers
and have included total present value as well as annualized value of these estimates in our analyses below.
We also include costs borne by other parties, opportunity costs and cost transfer, separate from costs borne by Head Start, here, because they impact the total cost to society of the rule.
Summary of Costs and Discounting (in millions)Year 1
2016/2017Year 2
2017/2018 Year 3
2018/2019Year 4
2019/2020Year 5
2020/2021
Costs Borne by Head Start, excluding duration funding appropriated
beginning in FY 2016 $(46) $135 $264 $673 $798
Net Costs Borne by Head Start, including duration funding
appropriated beginning in FY 2016 $(46) $135 $264 $379 $504
Costs Borne by Other Parties $42 $45 $44 $44 $45
Opportunity Costs $0.5 $4 $4 $4 $4
Costs to Society (Undiscounted), excluding duration funding
appropriated beginning in FY 2016 $(3) $183 $312 $721 $847
3% Discount $(3) $178 $294 $660 $752
7% Discount $(3) $171 $272 $589 $646
Costs to Society (Undiscounted), including duration funding
appropriated beginning in FY 2016 $(3) $183 $312 $427 $553
3% Discount $(3) $178 $294 $391 $491
7% Discount $(3) $171 $272 $349 $422
Year 6 2021/2022
Year 7 2022/2023
Year 8 2023/2024
Year 9 2024/2025
Year 10 2025/2026
Costs Borne by Head Start, excluding duration funding appropriated
beginning in FY 2016 $1,294 $1,295 $1,297 $1,297 $1,297
Net Costs Borne by Head Start, including duration funding
appropriated beginning in FY 2016 $1,000 $1,001 $1,003 $1,003 $1,003
Costs Borne by Other Parties $45 $46 $46 $47 $46
Opportunity Costs $4 $4 $4 $4 $4
Cost to Society (Undiscounted), excluding duration funding
appropriated beginning in FY 2016 $1,344 $1,345 $1,347 $1,348 $1,348
3% Discount $1,159 $1,126 $1,095 $1,064 $1,033
7% Discount $958 $896 $839 $784 $733

Distributional effects
67
3% Discount $905 $880 $856 $832 $808
7% Discount $748 $700 $656 $613 $573
* Year ranges refer Head Start program years, which for these estimates, begin on August 1st of each year and end on or before July 31st.
** Note these costs do not include the potential lost benefits of children who may no longer have access to Head Start or the impact on children who attend other early education programs.
In total, we estimate the 10-year present value of the costs associated with new require-ments in this final rule to be $7,358 million when discounted at 3 percent, and $5,886 million when discounted at 7 percent before accounting for the $294 million in funding Congress has provided in FY 2016 to expand duration. We estimate the annualized costs of new requirements in this final rule to be $838 million when discounted at 3 percent, and $783 million when discounted at 7 percent before accounting for the $294 million in funding Congress has provided in FY 2016 to expand duration. As noted, Congress ap-propriated $294 million in FY 2016 to increase the duration of Early Head Start and Head Start programs. Thus, a substantial share of the costs in this rule will be absorbed by this funding. Accounting for the funding Congress has already provided in FY 2016 to increase duration, we estimate the 10-year present value of the costs to be $5,632 million when discounted at 3 percent, and $4,502 when discounted at 7 percent. The annualized costs of new requirements in this final rule, when taking into these amounts already appropriated for duration, would be $641 million when discounted at 3 percent and $599 million when discounted at 7 percent.
Costs to Society Discounted and Annualized (in millions)Annualized (Years 1-10) 10 Year Total
Discounted 3% Discounted 7% Discounted 3% Discounted 7%
Cost to Society, excluding duration funding appropriated beginning in FY 2016 $838 $783 $7,358 $5,886
Cost to Society, including duration funding appropriated beginning in FY 2016 $641 $599 $5,632 $4,502
5. Distributional effects
As part of our regulatory analysis, we considered whether the final rule will disproportion-ately benefit or harm a particular subpopulation. If adequate funds are not appropriated, the final rule has the potential to result in a reduction in the number of children being served by Head Start and an improvement in quality for the much larger group of low-in-come children who continue to participate. We do not expect the children who may lose access to Head Start if the funding is not provided to be systematically different in terms of meaningful subpopulations from the children who will be receiving greater benefits from higher quality services. We also acknowledge that if adequate funds are not appropriated, as many as 7,372 teachers, assistant teachers, and home visitors could no longer be em-ployed. Again, while these teachers would be economically harmed, the remaining 110,933 teachers, assistant teachers, and home visitors whose employment is not terminated, should
68
Regulatory Alternatives
receive pay increases because of working longer hours and longer program years. We do not expect the teachers who are no longer employed to be systematically different in terms of meaningful subpopulations from the teachers who will see increased pay because of this rule.
We also considered whether there would be a differential impact of the final rule, spe-cifically the requirements to increase duration, on either children or teachers based upon geographic location or tribal affiliation. While we found significant variation at the state level with regard to the proportion of slots that provide 1,020 annual hours in Head Start and 1,380 annual hours in Early Head Start, there are no systematic differences based on the region of the country (e.g., North vs. South; Midwest vs. West, etc.). Further, if the rule is fully implemented, some children in every state will benefit from increased duration. We also found no systematic differences between tribal programs and non-tribal programs with regard to meeting the new minimums.
6. Regulatory Alternatives
As part of our full regulatory analysis, we have considered several regulatory alternatives, which we outline below. Specifically, we have considered alternatives to the policy changes we have determined to be our largest cost-drivers: extension of Head Start center-based program duration and mentor coaching. We consider alternatives to these policy changes by analyzing the effect of the net cost in dollars, slots, and education staff jobs of making no change to the existing rule, as well as other more costly policy changes. In fact, the requirements in this rule for Head Start center-based duration represent an alternative to the requirements proposed in the NPRM. Justifications for the policies set by this rule are embedded throughout the discussion of comments received. However, we do provide additional rationale for not opting to propose or finalize the more costly regulatory alterna-tives in this section.
Extension of Head Start Center-based Program Duration
The rule requires Head Start center-based programs to provide a minimum of 1,020 annual hours for all children by August 1, 2021, but gives the Secretary authority to reduce this requirement to mitigate slot loss from the duration requirements in the event that Congress does not appropriate adequate funds to support the policy. As described in great detail above, these requirements will increase the amount of instructional time in Head Start programs, which research suggests is critical to reaping the full benefits of the other quali-ty improvements in the rule.132,133 In our cost analysis, we estimated the cost of the Head Start center-based duration requirement, if fully implemented to be $1,128,990,485. Once the expected proportion of the FY 2016 appropriation to increase program duration in Head Start is applied, the cost of these requirements is $865,868,544. These requirements are associated with a potential loss of between 0 and 107,762 slots and between 0 and 5,475
132 Weiland, C., & Yoshikawa, H. (2013). Impacts of a prekindergarten program on children’s mathematics, language, literacy, executive function, and emotional skills. Child Development, 84, 2112–2130.133 Barnett, W.S., Jung, K., Youn, M.J., and Frede, E.C. (2013). Abbott Preschool Program Longitudinal Effects Study: Fifth Grade Follow-Up. National Institute for Early Education Research Rutgers—The State University of New Jersey.

Regulatory Alternatives
69
education staff jobs, depending upon appropriations and Secretarial action. As part of our full regulatory analysis, we considered three alternatives to this policy change.
First, we considered the alternative of making no change to our previous minimums, thus eliminating the associated cost of $865,868,544. Using the methodology enumerat-ed above, making no change to this policy would be associated with up to 107,762 fewer slots lost and 5,475 fewer education staff no longer employed. However, not making this change would also prevent the significant predicted increase in impacts on child outcomes we have described in the Benefits Analysis section. We believe that strong child outcomes are best fostered through high-quality early education programs that provide at least a full school day and full school year of services and that children are best served if Head Start programs continue to move toward this goal and there is ample research that points to increased duration in achieving positive child outcomes.134,135,136,137,138,139,140,141,142,143,144 Therefore we have not included this alternative in the final rule.
We also considered the alternative proposed in the NPRM to extend the minimum Head Start year to 180 days and the Head Start day to 6 hours. Using the same method employed in our original cost analysis in the NPRM. We updated the original cost analysis by using 2015 data, inflating for missing GABI data, and inflating by 20% to reflect changes made to the final rule cost estimate in response to comments that account for fringe benefits and remove the assumption that additional administrative costs will not be necessary to support increased duration). These changes provide comparable estimates for weighing the poten-tial impacts of regulatory alternatives. Using this method, the total costs of this alternative
134 Lee, V. E., Burkam, D. T., Ready, D. D., Honigman, J., & Meisels, S. J. (2006). Full-Day versus Half-Day Kindergarten: In Which Program Do Children Learn More? American Journal of Education, 112(2), 163-208.135 Walston, J.T., and West, J. (2004). Full-day and Half-day Kindergarten in the United States: Findings from the Early Childhood Longitudinal Study, Kindergarten Class of 1998–99 (NCES 2004–078). U.S. Department of Education, National Center for Education Statistics. Washington, DC: U.S. Government Printing Office.136 Sloan McCombs, J. et al., (2011). Making Summer Count. How Summer Programs Can Boost Children’s Learning. Santa Monica, Calif.: RAND Corporation.137 Downey, D.B., von Hippel, P.T. & Broh, B.A. (2004). Are Schools the Great Equalizer? Cognitive Inequality During the Summer Months and the School Year. American Sociological Review, 69(5), 613–635.138 Ehrlich, S.B., Gwynne, J.A…,..Sorice, E. (2014). Preschool Attendance in Chicago Public Schools: Relationships with Learning Outcomes and Reasons for Absences. University of Chicago Consortium on Chicago School Research. Research Report.139 Peisner-Feinberg, E. S., Schaaf, J. M., LaForett, D. R., Hildebrandt, L.M., & Sideris, J. (2014). Effects of Georgia’s Pre-K Program on children’s school readiness skills: Findings from the 2012–2013 evaluation study. Chapel Hill: The University of North Carolina, FPG Child Development Institute.140 Barnett, W.S., Jung, K., Youn, M.J., and Frede, E.C. (2013). Abbott Preschool Program Longitudinal Effects Study: Fifth Grade Follow-Up. National Institute for Early Education Research Rutgers—The State University of New Jersey.141 Gormley, G.T., Gayer, T., Phillips, D., & Dawson, B. (2005). The effects of universal pre-k on cognitive development. Developmental Psychology, 4(6), 872-884.142 Weiland, C., & Yoshikawa, H. (2013). Impacts of a prekindergarten program on children’s mathematics, language, literacy, executive function, and emotional skills. Child Development, 84, 2112–2130.143 Walters, C. R. (2015). Inputs in the Production of Early Childhood Human Capital: Evidence from Head Start, American Economic Journal: Applied Economics, 7(4), 76–102.144 Yoshikawa, H., Weiland, C., Brooks-Gunn, J., Burchinal, M.R., Espinosa, L.M., Gormley, W.T., Ludwig, J., Magnuson, K.A., Phillips, D., & Zaslow, M.J. (2013). Investing in Our Future: The Evidence Base on Preschool Education. Policy Brief. Foundation for Child Development.

70
Regulatory Alternatives
(NPRM proposal) would be $ 1,308,629,691. Once the expected proportion of the FY 2016 appropriation to increase program duration in Head Start is applied, the cost of these requirements is $1,045,507,751. These costs would result in a total of 130,119 slots lost and 10,392 education staff no longer employed as a result of this provision alone. The ad-ditional associated costs of this alternative, compared to the requirements in the final rule, would be $179,639,207, which would result in as many as 22,357 additional slots lost and 4,917 additional education staff no longer employed.
Again, research clearly demonstrates that strong child outcomes are best fostered through high-quality early education programs that provide at least a full school day and full school year of services, however, research does not specify a threshold for this ef-fect.145,146,147,148,149,150,151,152,153,154,155 Given this, we believe it is important to allow programs to design a variety of different schedules within the minimum requirements that meet the specific needs of their families, communities, and staff. We believe the flexibility of the annual hours, rather than the specified hours per day and days per year of this regulatory alternative will allow programs to address many of the concerns that were raised in the comments, such as alignment of the summer break with the local education agency’s calen-dar, the availability of facilities, the continuation of partnerships, and state licensing require-ments.
Finally, we considered the alternative of requiring Head Start center-based programs to provide a minimum of 1,020 annual hours for all children by August 1, 2021, but not giving the Secretary authority to reduce this requirement to mitigate slot loss in the event that
145 Lee, V. E., Burkam, D. T., Ready, D. D., Honigman, J., & Meisels, S. J. (2006). Full-Day versus Half-Day Kindergarten: In Which Program Do Children Learn More? American Journal of Education, 112(2), 163-208.146 Walston, J.T., and West, J. (2004). Full-day and Half-day Kindergarten in the United States: Findings from the Early Childhood Longitudinal Study, Kindergarten Class of 1998–99 (NCES 2004–078). U.S. Department of Education, National Center for Education Statistics. Washington, DC: U.S. Government Printing Office.147 Sloan McCombs, J. et al., (2011). Making Summer Count. How Summer Programs Can Boost Children’s Learning. Santa Monica, Calif.: RAND Corporation.148 Downey, D.B., von Hippel, P.T. & Broh, B.A. (2004). Are Schools the Great Equalizer? Cognitive Inequality During the Sum¬mer Months and the School Year. American Sociological Review, 69(5), 613–635.149 Ehrlich, S.B., Gwynne, J.A…,..Sorice, E. (2014). Preschool Attendance in Chicago Public Schools: Relationships with Learning Outcomes and Reasons for Absences. University of Chicago Consortium on Chicago School Research. Research Report.150 Peisner-Feinberg, E. S., Schaaf, J. M., LaForett, D. R., Hildebrandt, L.M., & Sideris, J. (2014). Effects of Georgia’s Pre-K Program on children’s school readiness skills: Findings from the 2012–2013 evaluation study. Chapel Hill: The University of North Carolina, FPG Child Development Institute.151 Barnett, W.S., Jung, K., Youn, M.J., and Frede, E.C. (2013). Abbott Preschool Program Longitudinal Effects Study: Fifth Grade Follow-Up. National Institute for Early Education Research Rutgers—The State University of New Jersey.152 Gormley, G.T., Gayer, T., Phillips, D., & Dawson, B. (2005). The effects of universal pre-k on cognitive development. Developmental Psychology, 4(6), 872-884.153 Weiland, C., & Yoshikawa, H. (2013). Impacts of a prekindergarten program on children’s mathematics, language, literacy, executive function, and emotional skills. Child Development, 84, 2112–2130.154 Walters, C. R. (2015). Inputs in the Production of Early Childhood Human Capital: Evidence from Head Start, American Economic Journal: Applied Economics, 7(4), 76–102.155 Yoshikawa, H., Weiland, C., Brooks-Gunn, J., Burchinal, M.R., Espinosa, L.M., Gormley, W.T., Ludwig, J., Magnuson, K.A., Phillips, D., & Zaslow, M.J. (2013). Investing in Our Future: The Evidence Base on Preschool Education. Policy Brief. Foundation for Child Development.

Regulatory Alternatives
71
adequate funds to support the policy are not appropriated. This policy would guarantee, in the event that Congress does not appropriate adequate funds to support the policy, at least some children would lose access to Head Start and some education staff would no longer be employed by Head Start.
However, the negative effects of implementing this model in such a way that could lead to significant reductions in the number of children and families served by Head Start programs, may outweigh the benefits. Therefore, we specify an incremental timeline and process for grantees to shift their programs to provide at least a full school day and a full school year of services to all preschoolers in center-based settings, which will allow pro-grams to extend their service duration models thoughtfully. Further, we gave the Secretary the discretion to lower the required percentage of funded enrollment slots for which grant-ees must offer 1,020 annual hours of planned class operations to the percentage the Sec-retary estimates available appropriations can support. This balances the important policy goal of providing all preschoolers with a full school day and a full school year of services in Head Start with the disruption and potential slot loss such a policy might create in the absence of sufficient funding in a way that this regulatory alternative would not.
We believe the policy set by this final rule represents a balance between empowering Head Start programs to ensure all Head Start children receive enough high quality early learning experiences to improve their outcomes, and ensuring as many children from low-income families as possible are served by Head Start.
Regulatory Alternatives: Head Start Center-Based Duration
Status quo NPRM Proposal*
100% to 1,020 for Head Start Center-based
without Sec. authority Final Rule
Costs Borne by Head Start, excluding FY 2016
duration funding 0 $ 1,308,629,691 $1,128,990,485 $1,128,990,485
Costs Borne by Head Start, including FY 2016
duration funding $1,045,507,751 $865,868,544 $865,868,544
Slot Loss 0 130,119 107,762 0-107,762
Job Loss 0 10,392 5,475 0-5,475
* Note the NPRM proposal cost estimate has been inflated to reflect changes made to the final rule cost estimate that account for
fringe benefits and remove the assumption that additional administrative costs will not be necessary to support increased duration.
Mentor coaching
In this rule, we require programs to have a system of professional development in place that includes an intensive coaching strategy. As with our other largest cost drivers, as part of our full regulatory analysis, we considered two alternatives to this policy change. Specif-ically, we considered the alternative of not requiring mentor coaches for any teaching staff, thus eliminating the associated cost of $141,978,651. This alternative would be associat-ed with 16,694 fewer slots potentially lost and 1,902 fewer educations staff potentially no longer employed. However, a growing body of research demonstrates the effectiveness
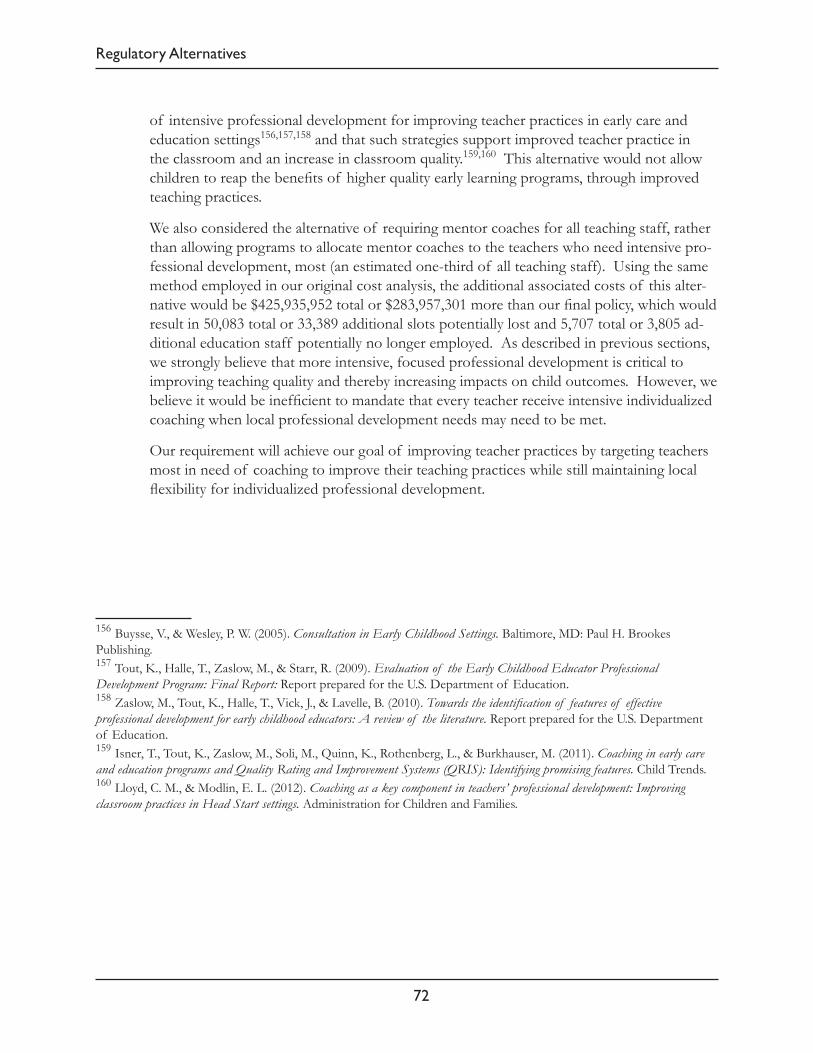
Regulatory Alternatives
of intensive professional development for improving teacher practices in early care and education settings156,157,158 and that such strategies support improved teacher practice in the classroom and an increase in classroom quality.159,160 This alternative would not allow children to reap the benefits of higher quality early learning programs, through improved teaching practices.
We also considered the alternative of requiring mentor coaches for all teaching staff, rather than allowing programs to allocate mentor coaches to the teachers who need intensive pro-fessional development, most (an estimated one-third of all teaching staff). Using the same method employed in our original cost analysis, the additional associated costs of this alter-native would be $425,935,952 total or $283,957,301 more than our final policy, which would result in 50,083 total or 33,389 additional slots potentially lost and 5,707 total or 3,805 ad-ditional education staff potentially no longer employed. As described in previous sections, we strongly believe that more intensive, focused professional development is critical to improving teaching quality and thereby increasing impacts on child outcomes. However, we believe it would be inefficient to mandate that every teacher receive intensive individualized coaching when local professional development needs may need to be met.
Our requirement will achieve our goal of improving teacher practices by targeting teachers most in need of coaching to improve their teaching practices while still maintaining local flexibility for individualized professional development.
156 Buysse, V., & Wesley, P. W. (2005). Consultation in Early Childhood Settings. Baltimore, MD: Paul H. Brookes Publishing. 157 Tout, K., Halle, T., Zaslow, M., & Starr, R. (2009). Evaluation of the Early Childhood Educator Professional Development Program: Final Report: Report prepared for the U.S. Department of Education. 158 Zaslow, M., Tout, K., Halle, T., Vick, J., & Lavelle, B. (2010). Towards the identification of features of effective professional development for early childhood educators: A review of the literature. Report prepared for the U.S. Department of Education. 159 Isner, T., Tout, K., Zaslow, M., Soli, M., Quinn, K., Rothenberg, L., & Burkhauser, M. (2011). Coaching in early care and education programs and Quality Rating and Improvement Systems (QRIS): Identifying promising features. Child Trends. 160 Lloyd, C. M., & Modlin, E. L. (2012). Coaching as a key component in teachers’ professional development: Improving classroom practices in Head Start settings. Administration for Children and Families.
72
Congressional Review
73
Regulatory Alternatives: Mentor Coaching
Status quo (No coaching)
Coaching for all teachers
Final Rule (Coaching for one-third of teachers)
Cost 0 $425,935,952 $141,978,651
Potential slot loss 0 50,083 16,694
Potential job loss 0 5,707 1,902
c. Unfunded Mandates Reform Act
The Unfunded Mandates Reform Act (UMRA)161 was enacted to avoid imposing unfunded federal mandates on state, local, and tribal governments, or on the private sector. Most of UMRA’s provisions apply to proposed and final rules for which a general notice of proposed rulemaking was published, and that include a federal mandate that may result in expenditures by state, local, or tribal governments, in the aggregate, or by the private sector of $100 million or more (adjusted annually for inflation) in any one year. The current threshold after adjustment for inflation is $146 million, using the most current (2015) implicit price deflator for the gross domestic product. This final rule does not impose unfunded mandates on state, local, and tribal governments, or on the private sector.
d. Treasury and General Government Appropriations Act of 1999
Section 654 of the Treasury and General Government Appropriations Act of 1999 requires federal agencies to determine whether a policy or regulation may negatively affect family well-being. If the agency determines a policy or regulation negatively affects family well-be-ing, then the agency must prepare an impact assessment addressing seven criteria specified in the law. This rule does not have any impact on the autonomy or integrity of the family as an institution. Accordingly, we concluded it was not necessary to prepare a family policymaking assessment.162
e. Federalism Assessment Executive Order 13132
Executive Order 13132 requires federal agencies to consult with state and local government officials if they develop regulatory policies with federalism implications. Federalism is rooted in the belief that issues that are not national in scope or significance are most appropriately addressed by the level of government close to the people. This final rule does not have sub-stantial direct impact on the states, on the relationship between the federal government and the states, or on the distribution of power and responsibilities among the various levels of govern-ment. Therefore, in accordance with section 6 of Executive Order 13132, it is determined that this final rule does not have sufficient federalism implications to warrant the preparation of a federalism summary impact statement.
f. Congressional Review161 2 U.S.C. §1501 et seq.162 Pub. L. 105–277
74
Paperwork Reduction Act of 1995
The Congressional Review Act (CRA) allows Congress to review “major” rules issued by federal agencies before the rules take effect.163 The CRA defines a major rule as one that has resulted or is likely to result in (1) an annual effect on the economy of $100 million or more; (2) a major increase in costs or prices for consumers, individual industries, federal, state or local government agencies, or geographic regions; or (3) significant adverse effects on competition, employment, investment, productivity, or innovation, or on the ability of United States-based enterprises to compete with foreign-based enterprises in domestic and export markets.164 This regulation is a major rule because it will likely result in an annual effect of more than $100 mil-lion on the economy.
g. Paperwork Reduction Act of 1995
The Paperwork Reduction Act of 1995 (PRA), P.L. 104-13, minimizes government imposed burden on the public. In keeping with the notion that government information is a valuable asset, it also is intended to improve the practical utility, quality, and clarity of information col-lected, maintained, and disclosed.
Regulations at 5 CFR part 1320 implemented the provisions of the PRA and §1320.3 of this part defines a “collection of information,” “information,” and “burden.” A “collection of information” is broadly defined and includes any requirement or request for persons to col-lect, maintain, or publicly disclose information. “Information” is defined in as any statement or estimate of fact or opinion, regardless of form or format, whether numerical, graphic, or narrative form, and whether oral or maintained on paper, electronic or other media. “Burden” means the total time, effort, or financial resources expended by persons to collect, maintain, or disclose information. Burden includes actions for the purposes of information request such as reviewing instructions, acquiring and using technology and systems, adjusting the existing ways to comply with any previously applicable instructions and requirements, completing and review-ing the collection of information, and transmitting the information. The PRA only counts as burden the net additional burden needed to comply with information request. Time, effort, and resources to collect information that would be incurred by persons in the normal course of their activities are excluded from the burden.
Section 1320.11(f) of 5 CFR part 1320 requires an agency to explain in the final rule how in-formation collections proposed in an NPRM respond to any comments received or the reasons such comments were rejected. We did not receive any comments directly related to information collections we proposed in the NPRM. Therefore, we did not make any changes here.
Below, we describe information collections and their burden estimates:
Title: Head Start Grants Administration
Description: We require information collections related to the protection for the privacy of child records. We require programs to collect parents’ written consent before they disclose per-
163 5 U.S.C. 802(a)164 5 U.S.C. Chapter 8

Paperwork Reduction Act of 1995
75
sonally identifiable information from a child’s records. We require programs to notify parents annually of their rights described in §§1303.20 through 1303.24 and of applicable definitions in part 1305. We also require programs to maintain, with each child record, information on all individuals, agencies, or organizations that have obtained access to personal identifiable infor-mation from child records.
Title: Head Start Performance Standards
Description: We require a new information collection to codify best practice in assessing dual language learners. Specifically, we require programs to administer language assessments to dual language learners in both English and their home language, either directly or through interpret-ers.
We also strengthen background check procedures to require state/tribal or federal criminal background checks, as well as clearance through available child abuse and neglect and sex of-fender registries. This requirement is consistent with the Office of Child Care’s requirement to minimize burden on programs that operate with both Head Start and Child Care Development Funds. This increases the record-keeping burden related to criminal record checks.
Description of Respondents and Burden Estimate: The total annual burden hours estimated is 1,019,473 hours. For some items, we calculated burden hours for individual children and fami-lies, for other items, we calculated burden hours for staff.
The table below lists burden hour estimates and indicates our bases for these estimations. See the Regulatory Impact Analysis section for cost estimations.
Information Collection
OMB Control Number
No. of Respondents
No. of Responses
per Respondent
Average Burden
per Response
Total Burden Hours
Annual Reporting Burden Estimates
N/A N/A N/A N/A N/A N/A
Annual Recording Keeping Burden Estimates
Head Start Grants Administration – §1303.22, 1303.24 Parental Consent,
Annual Notice, and Recordkeeping of PII Disclosure
0970-0423 988,923 (F) 1 20 minutes 329,641
Head Start Program Performance Standards – §1302.33 Language Assessments of Dual
Language Learners0970-0148 332,651 (C) 1 2 hours 665,302
Head Start Program Performance Standards – §1302.90 Background Checks
0970-0148 73,591 (S) 1 20 minutes 24,530
Annual Third-Party Disclosure Burden Estimates
N/A N/A N/A N/A N/A N/A
Total Burden Hours 1,019,473
Key: C = Children, F = Families, S = Staff

76
Tribal Consultation Statement
For informational purposes, currently approved collections of information that will no longer be required are described below:
• Head Start Grants Administration. This rule removed certain requirements for grantee agencies including the submission of audits, accounting systems certifications, and provisions applicable to personnel management.
• Appeal Procedures for Head Start. Grantees and Current or Prospective Delegate Agencies – This rule removed the appeal procedures by delegate agencies that came from denials or failure to act by grantees. It also removed the appeal procedures by a grantee of a suspension continu-ing for more than 30 days.
• Head Start Program Performance Standards. Numerous record-keeping requirements were removed which will result in a decrease in burden, i.e. documentation of the level of effort undertaken to establish community partnerships, written records of roles and responsibilities for each governing body members, the annual written and approval of plans for implemen-tation services for each program area, provisions applicable to personnel management, and record-keeping and sharing of a set of community services and resources.
• Purchase, Construction and Major Renovation of Head Start Facilities. We removed some requirements that involved collection of information that will result in a reduction in burden, including the submission of drawings and specifications, costs related to installation of modu-lar unit, statement of procurement procedure for modular units, and obtaining an independent analysis of the cost comparison.
VII. Tribal Consultation Statement
The Office of Head Start conducts an average of 5 Tribal Consultations each year for those tribes operating Head Start and Early Head Start. The consultations are held in geographic areas across the country – Southwest, Northwest, Midwest (Northern and Southern), and Eastern. The consultations are often held in conjunction with other tribal meetings or conferences, to ensure the opportunity for most of the 150 tribes served through OHS to be able to attend, and voice their concerns and issues for their HS/EHS programs. A report is completed after each consultation, and then a final report is compiled and submitted to the Secretary at the end of the year, summarizing the consulta-tions. For the past several years, the primary issues raised have been around Head Start requirements which are the subject of this regulation and ensuring tribes have sufficient funding to meet those requirements. Language and culture are also a primary topic, particularly Head Start supporting efforts to preserve and revitalize language within each tribe, which is specifically addressed in this final rule. Teacher credentials, and, Monitoring, and fiscal issues were also common themes across the consultations, which have allowed us to gather valuable information that informed the develop-ment of this rule. Through the notice and comment process we also received comments from tribal communities, including form the National Indian Head Start Directors Association which informed the development of this final rule.