Head Start Program Performance Measures · 13 Results of Classroom ... CHAPTER 2: CHARTING OUR...
96
Head Start Program Performance Measures Second Progress Report June 1998 Research, Demonstration and Evaluation Branch And the Head Start Bureau Administration on Children, Youth and Families U.S. Department of Health and Human Services
Transcript of Head Start Program Performance Measures · 13 Results of Classroom ... CHAPTER 2: CHARTING OUR...

Head StartProgram Performance Measures
Second Progress Report
June 1998
Research, Demonstration and Evaluation Branch And the Head Start Bureau Administration on Children, Youth and Families U.S. Department of Health and Human Services

ACKNOWLEDGMENTS
Head Start Program Performance MeasuresSecond Progress Report
Prepared for:Louisa B. Tarullo, Ed.D.
Henry Doan, Ph.D.Research, Demonstration and Evaluation BranchAdministration on Children, Youth and Families
Department of Health and Human ServicesWashington, DC
Prepared by:
Westat, Inc.Nicholas Zill, Ph.D., Project Director
Gary Resnick, Ph.D., Associate Project Director
Ellsworth Associates, Inc.Ruth Hubbell McKey, Ph.D., Co-Project DirectorCheryl Clark, M. Ed., Senior Research Analyst
Abt Associates, Inc.David Connell, Ph.D., Project Director
Janet Swartz, Ph.D., Senior Research Analyst
The CDM Group, Inc.Robert O’Brien, Ph.D., Co-Project Director
Mary Ann D’Elio, M.S., Senior Research Analyst

TABLE OF CONTENTS
INTRODUCTION AND OVERVIEW ......................................................................................................... 1
A. INTRODUCTION ...................................................................................................................................... 1
Conceptual Framework ............................................................................................................................ 2Overview of Report.................................................................................................................................. 6
B. FACES PROVIDES IMPORTANT NEW INFORMATION ON HEAD START ..................................................8
Head Start Classroom Quality is Good...................................................................................................... 8Head Start Children Are Ready for School................................................................................................ 9Program Quality is Linked to Child Performance.................................................................................... 10Head Start Families Are Involved Despite Challenges ............................................................................10Sequence of Remainder of Report .......................................................................................................... 11
CHAPTER 1 ................................................................................................................................................ 12
PART 1: IS HEAD START PROVIDING HIGH -QUALITY EDUCATIONAL SERVICES?.....................................12
Defining Quality.................................................................................................................................... 12Classroom Observation Procedures ........................................................................................................ 13Results of Classroom Data Collection Efforts ......................................................................................... 14
A. HEAD START CLASSROOMS AS CHILD DEVELOPMENT ENVIRONMENTS .............................................. 14
Thumbnail Sketch of a "Typical" Head Start Classroom.......................................................................... 14The Quality of Most Head Start Classrooms is Good .............................................................................. 16
B. STRENGTHS AND WEAKNESSES IN HEAD START CLASSROOMS............................................................ 21
Quality of Language Curriculum Is Strong in Some Areas, Weak in Others ............................................ 21Other Areas of Strengths and Weaknesses in Head Start Classrooms....................................................... 22Strengths in Head Start Classrooms ........................................................................................................ 22Weaknesses in Head Start Classrooms.................................................................................................... 23How Quality Varies Across Programs, Centers, and Classes ................................................................... 24Geographic/Demographic Correlates of Classroom Quality..................................................................... 26
PART 2. HOW WELL IS HEAD START FULFILLING ITS OBJECTIVE OF ENHANCING CHILD GROWTH AND
DEVELOPMENT ?........................................................................................................................................ 28
Measures of Change in Skills and Behavior Not Yet Available ............................................................... 29Research Questions That Can Be Addressed With Current Data.............................................................. 29Questions Concerning the Link Between Program Quality and Children’s Development ......................... 29Description of Head Start Children......................................................................................................... 30
A. MAKE -UP OF THE CHILD ASSESSMENT ................................................................................................. 30
Growth in Skills and Knowledge with Age............................................................................................. 32
B. WHAT HEAD START CHILDREN KNOW AND CAN DO AS THEY APPROACH K INDERGARTEN ................ 33
How the Cognitive Development of Head Start Children Compares With That of the General Populationof Preschoolers ...................................................................................................................................... 35Comparisons With Earlier Research Findings on Low-Income Children.................................................. 36
C. VARIATION IN CHILDREN ’S COGNITIVE DEVELOPMENT ACROSS HEAD START PROGRAMS ................ 37
Geographic and Ethnic Variations in Program Assessment Scores........................................................... 39Demographics Versus Program Quality in Accounting for Achievement Differences .............................. 39The Link Between Classroom Quality and Children’s Development ....................................................... 39Controlling for Family Background and Child Characteristics................................................................. 42

Assessment Performance Linked To Family SES and Child Disabilities.................................................. 44A Second Year of Head Start Makes A Difference.................................................................................. 44 Program-Level Differences In Assessment Performance Persist.............................................................. 44Higher Quality Classrooms Show Higher Average Assessment Scores.................................................... 46Summary and Implications..................................................................................................................... 47
PART 3: WHO ARE THE FAMILIES HEAD START SERVES? ........................................................................ 48
A. DEMOGRAPHIC CHARACTERISTICS OF HEAD START FAMILIES ............................................................ 48
Housing and Neighborhood Crime ......................................................................................................... 54
B. FAMILY ACTIVITIES WITH CHILDREN .................................................................................................. 55
C. PARENT INVOLVEMENT IN HEAD START .............................................................................................. 55
D. RELATIONSHIPS BETWEEN FAMILY CHARACTERISTICS AND PARENT INVOLVEMENT ......................... 57
E. RELATIONSHIP BETWEEN BARRIERS TO HEAD START PARTICIPATION AND PARENT INVOLVEMENT .. 61
F. PARENT SATISFACTION WITH HEAD START .......................................................................................... 61
CHAPTER 2: CHARTING OUR PROGRESS: AN INTERIM LOOK .................................................. 63
A. FACES FIELD TEST ............................................................................................................................ 63
B. RELATED HEAD START BUREAU QUALITY I NITIATIVES ....................................................................... 64
Head Start Program Performance Standards............................................................................................ 64Development of Performance Measures for Early Head Start .................................................................. 64Head Start's Monitoring System ............................................................................................................. 65Training and Technical Assistance ......................................................................................................... 65Program Information Report................................................................................................................... 66
C. ENSURE COMMUNICATION TO A VARIETY OF AUDIENCES................................................................... 66
D. HEAD START QUALITY RESEARCH CENTERS ...................................................................................... 67
Georgia State University Research Center on Head Start Quality ............................................................ 68High/Scope Quality Research Center...................................................................................................... 69North Carolina Center for Research on Head Start Quality...................................................................... 70New England Quality Research Center................................................................................................... 71
E. FUTURE PLANS FOR THE MEASURES INITIATIVE ................................................................................. 72
CHAPTER 3: MATRIX OF MEASURES AND INDICATORS ............................................................... 74
REFERENCES............................................................................................................................................. 89

TABLES AND FIGURES
Figure I.1 Head Start Program Performance Measures Conceptual Framework ...................................... 4Table I.1 Head Start Program Performance Measures............................................................................. ..5Figure I.2 FACES Sample and Data Collection................................................................................... ........7Table 1.1.1 Distribution of Classrooms by ECERS Mean Score. .............................................................. 17Figure 1.1.1 Classroom Quality Compares Favorably to Other Preschool Programs .............................. 18Table 1.1.2 Head Start Teachers Are Experienced and Qualified.............................................................20Figure 1.1.2 Head Start Classrooms are Strong in Some Areas of Language
Curriculum But Weak in Others ........................................................................................... 21Figure 1.1.3 Areas of High Quality in Head Start Classrooms..................................................................23Figure 1.1.4 Areas of Lower Quality in Head Start Classrooms................................................................ 24Figure 1.1.5 Classroom Quality Varies Across Programs and Centers.....................................................25Figure 1.1.6a Classroom Quality is Lower in the South............................................................................. 27Figure 1.1.6b Classroom Quality is Lower in High Minority Programs .................................................... 27Figure 1.2.1 Head Start Children's Knowledge of Word Meaning Shows Clear Progression with Age...33Figure 1.2.2 The Best Head Start Programs Have Average Assessment Scores at National Norms.........37Figure 1.2.3 There is Significant Variation in Assessment Scores Across Head Start Programs.............. 38Figure 1.2.4 Average Assessment Scores Are Lower in the South and in High-Minority Programs ........ 40Figure 1.2.5 Vocabulary Scores are Higher in Classrooms with Better Language Instruction................. 41Figure 1.2.6 Vocabulary Scores are Higher when Mothers have More Education ................................... 42Figure 1.2.7 Differences In Average Scores by Program Location and Ethnic Composition..................... 45Figure 1.3.1 Primary Caregivers are Equally Likely to be Married or Single .......................................... 49Figure 1.3.2 Most Head Start Households Have 2 or 3 Children............................................................... 50Figure 1.3.3 Most Primary Caregivers Have High School Diploma or Some College............................... 51Figure 1.3.4 Most Households Have One or Two Parents Employed........................................................52Figure 1.3.5 Most Families Receive Some Form of Assistance .................................................................. 53Figure 1.3.6 Almost a Third of Families Saw or Heard Violent Crime in Their Neighborhood ............... 54Table 1.3.1 Most Families Participated in Head Start Activities At Least Once a Year ........................... 56Figure 1.3.7 Educated Parents Participate More in Head Start Activities................................................ 58Figure 1.3.8 Employed Parents Participate Less in Head Start Activities................................................. 59Figure 1.3.9 Two-Parent Families Participate More in Head Start Activities........................................... 60Figure 1.3.10 Most Parents Are Very Satisfied with Head Start Services.................................................61Figure 1.3.11 Parents Rate The Head Start Experience Very Highly........................................................ 62

Introduction and Overview
A. Introduction
As the nation's premier early childhood education program, Head Start is leading the way in developing and reporting on its accountability for services to approximately 800,000 children and their families each year. From initial planning in 1995 to the publication of this Head Start Performance Measures Second Progress Report, Head Start has made dramatic progress toward the development of an outcome-oriented accountability system. This approach combines the best attributes of scientific research with program-level reporting and monitoring and is based on a consensus-driven set of criteria for program accountability.
The Head Start Program Performance Measures Initiative is a response to a specific legislative mandate, strategic planning for Head Start, and broader public emphasis on accountability and the general movement toward results-oriented evaluation.
Specifically the Program Performance Measures were developed in accordance with the recommendations of the Advisory Committee on Head Start Quality and Expansion, the mandate of Section 641A (b) of the Head Start Act (42 USC 9831 et seq.) as reauthorized in 1994 and the Government Performance and Results Act (GPRA)(Public Law 103-62). Signed into law in July 1993, the GPRA requires all federally funded programs to improve their performance and accountability. Other efforts taking place at the Federal level include the Chief Financial Officers Act and the Vice President's National Performance Review, both of which added impetus to the development of the Head Start Program Performance Measures.
A central principle emerging from the work of the Advisory Committee on Head Start Quality and Expansion in its December 1993 report, "Creating a 21st Century Head Start," was the need to ensure the quality of Head Start programs for children and families. As a major component of this principle, the Committee proposed a program performance measurement process that would:
• Identify outcomes to be measured; • Select measures and data collection techniques; and • Analyze the information gathered.
The Head Start Act envisions measures that will be used to identify strengths and weaknesses in the Head Start program - both nationally and by region - and pinpoint areas requiring additional training and technical assistance to improve performance. The Act defines Program Performance Measures as "methods and procedures for measuring, annually and over longer periods, the quality and effectiveness of programs operated by Head Start agencies." The Act specifies that the measures be designed to appraise the various services provided by Head Start and be adaptable for use in Head Start agency self-assessments and peer reviews. To comply with the statutory language, "Program Performance Measure" as used in this report is
1

defined as an indicator which can be used to determine the quality and effectiveness of Head Start.
In 1995, Head Start undertook a consensus-building process to develop the Head Start Program Performance Measures that drew on the opinions of Head Start program staff and parents, early childhood organization representatives, researchers, experts in the education, child development and early intervention fields, and Head Start Bureau officials. The report Charting Our Progress: Development of the Head Start Program Performance Measures, published in October 1995, summarized that process and outlined the genesis of the original 49 Head Start Program Performance Measures, data sources and data available at that time.
Conceptual Framework
In 1996-97, a conceptual framework for the Program Performance Measures was developed and the measures were revised and condensed. (The framework was presented in The First Progress Report on the Head Start Program Performance Measures which was released in May 1997.) The conceptual framework unifies and organizes the Program Performance Measures to display the linkages between process and outcome measures for Head Start children and families. (See Figure I.1 for the graphical representation of the framework.) The framework is based on the ultimate goal of Head Start, which is to promote the social competence of children. Social competence is the child's everyday effectiveness in dealing with his or her present environment and later responsibilities in school and life. For the five-year-old child coming to the end of the preschool period and entering school, an important life challenge and key test of the child’s social competence at this stage is whether he or she has acquired the skills, understandings, and behaviors that help insure successful functioning in this new environment, what is often called school readiness. Head Start has adopted the “whole child” view of school readiness that was recommended by the Goal One Technical Planning Group of the National Education Goals Panel (1991, 1993). This view sees school readiness as a multi-faceted phenomenon comprising five developmental domains that are important to the child’s readiness for school: physical well-being and motor development, social and emotional development, approaches to learning, language usage and emerging literacy, and cognition and general knowledge. Each of these domains is represented in the battery of measures that are being used to assess how well Head Start programs are performing. It takes into account the interrelatedness of cognitive, emotional, and social development; physical and mental health; and nutritional needs. Social competence is depicted at the top of the pyramid, with five objectives supporting it:
• Objective 1.Enhance children's healthy growth and development • Objective 2. Strengthen families as the primary nurturers of their children • Objective 3. Provide children with educational, health and nutritional services • Objective 4. Link children and families to needed community services • Objective 5. Ensure well-managed programs that involve parents in
decision-making.
Each of these objectives is critical to helping children of low-income families attain their full potential. They also represent key cornerstones of the Head Start program. Objectives 1 and
2

2 represent outcomes or results that the program is designed to produce. Achieving both of these objectives is critical to the ultimate success of Head Start. As parent involvement and family support are key tenets of Head Start, both child and family-oriented outcome measures are included here. Objectives 3, 4, and 5 comprise the lower tiers of the pyramid and contain the process measures that are key to the attainment of objectives 1 and 2 and the ultimate goal of enhancing children's social competence. An important aspect of the pyramid is the strong empirical connection between the provision of quality services (process measures) and improvements in child development (outcome measures).
Each Program Performance Measure has “Performance Indicators” that specify how the measure will be assessed. For example, the objective “Enhance children’s healthy growth and development” includes the Performance Measure “Head Start children demonstrate improved emergent literacy, numeracy, and language skills.” The Performance Indicator for this measure is the change in the Head Start children’s emergent literacy, numeracy and language skills over the Head Start year, measured by individual child assessments and parent and teacher reports of the child’s abilities. A more process-oriented measure is “Head Start assures children receive needed medical, dental and mental health services” which is under Objective 3: Provide children with educational, health, and nutritional services. The Performance Indicator for this measure is the number and percent of Head Start children who received needed medical services as reported by the programs themselves. In order to provide annual progress reports on the indicators supporting each of the objectives, data will be drawn from agency level sources, such as the Head Start Program Information Report (PIR) which is a program-level reporting system completed by each Head Start program annually, and program monitoring reports, as well as from the classroom, teacher, family and child level.
3

- -
Figure I.1Head Start Program Performance Measures
Conceptual Framework
5 ENSURE
well managed programs that involve parents in decision making
3 PROVIDE
children with educational, health and nutritional services .
4 LINK
children and families to needed community services.
1 ENHANCE children’s
healthy growth and development.
2 STRENGTHEN families as the
primary nurturers of their children.
CHILD’S SOCIAL
COMPETENCE
Pro
cess
es
Out
com
es
4

Table I.1 HEAD START PROGRAM PERFORMANCE MEASURES
OBJECTIVE I: ENHANCE CHILDREN'S GROWTH AND DEVELOPMENT.
1. Head Start children demonstrate improved emergent literacy, numeracy, and language skills.
2. Head Start children demonstrate improved general cognitive skills.
3. Head Start children demonstrate improved gross and fine motor skills.
4. Head Start children demonstrate improved positive attitudes toward learning.
5. Head Start children demonstrate improved social behavior and emotional well-being.
6. Head Start children demonstrate improved physical health.
OBJECTIVE 2: STRENGTHEN FAMILIES AS THE PRIMARY NURTURERS OF THEIR CHILDREN.
7. Head Start parents demonstrate improved parenting skills.
8. Head Start parents improve their self-concept and emotional well-being.
9. Head Start parents make progress toward their educational, literacy, and employment goals.
OBJECTIVE 3: PROVIDE CHILDREN WITH EDUCATIONAL, HEALTH AND NUTRITIONAL SERVICES.
10. Head Start programs provide developmentally appropriate educational environments.
11. Head Start staff interact with children in a skilled and sensitive manner.
12. Head Start programs support and respect children's cultures.
13. Head Start assures children receive needed medical, dental, and mental health services.
14. Head Start children receive meals and snacks that meet their daily nutritional needs.
15. Head Start programs provide individualized services for children with disabilities.
OBJECTIVE 4: LINK CHILDREN AND FAMILIES TO NEEDED COMMUNITY SERVICES.
16. Head Start parents link with social service agencies to obtain needed services.
17. Head Start parents link with educational agencies to obtain needed services.
18. Head Start parents link with health care services to obtain needed care.
19. Head Start parents secure child care in order to work, go to school, or gain employment training.
OBJECTIVE 5: ENSURE WELL-MANAGED PROGRAMS THAT INVOLVE PARENTS IN DECISION-MAKING.
20. Head Start programs are well-managed.
21. Head Start parents are involved actively in decisions about program operations.
22. Head Start programs employ qualified staff.
23. Head Start programs support staff development and training.
24. Head Start programs comply with Head Start regulations.
5

In addition to being categorized into this framework, the measures have been consolidated, numbered and indicators and data sources have been identified for each. The individual measures are presented in a matrix that lists the measure, performance indicator, data source and data for two years. The measures are listed in Table I.1. The Program Performance Measures Matrix is presented in Chapter 3 of this report.
Overview of Report
This current document is the 1998 report on the Program Performance Measures process. It provides preliminary outcome data for measures contained in Objectives 1 and 2, as well as process data for Objectives 3, 4, and 5. The outcome data are from the Head Start Family and Child Experiences Survey (FACES), a nationally representative sample of Head Start programs, classrooms, teachers, parents and children examining the quality and effects of Head Start.
The data in this report are drawn from the Spring 1997 FACES field test in which approximately 2,400 parents and children were studied in 40 Head Start programs. (More extensive technical reports on the FACES field test findings will be released later this year.) The field test was an opportunity to assess the feasibility of interviewing and assessing parents and children on a large scale using the selected instruments. Although it was a field test, it provided valuable information on the status of Head Start programs, children, and families which is partially reported in this document. FACES is continuing with Fall 1997 and Spring 1998 data collections on a nationally representative sample of 3,200 children and families in the same 40 programs, Figure I.2 presents the FACES study design. These phases will allow for a pre-post comparison, assessing the effects of Head Start by examining children and parents before their exposure to Head Start and determining their status at the end of the program. The Spring 1998 data collection will also examine a cohort of former Head Start children from the original field test sample who are completing kindergarten, to determine how they have performed in their first year of school. A Spring 1999 FACES data collection will examine results after kindergarten for the Fall 1997 Head Start cohort. Analyses of the Fall 1997-Spring 1998 comparisons will be available in 1999.
Additional efforts to improve the quality and effectiveness of Head Start are also underway. On January 1, 1998, revised Head Start Program Performance Standards were implemented. These regulations delineate the operations and quality of services to be offered by all Head Start programs. Concurrently, the Head Start program monitoring system is being revised to streamline the monitoring process and promote greater consistency and reliability in monitoring across HHS regions. The training and technical assistance system has also been recently redesigned to meet the needs and enhance program quality of Head Start grantees. All of these efforts are described in greater detail in Chapter 2 of this report. Data from the Head Start Monitoring and Tracking System (HSMTS) and the Program Information Report (PIR) also provide data for the measures. The findings from these data systems are contained in the Program Performance Measures Matrix in Chapter 3.
6

Figure I.2FACES Sample and Data Collection
SPRING 1997 FALL 1997 SPRING 1998 SPRING 1999 SPRING 2000
Field Test In Kindergarten
3, 4-and 5-year olds at the end
of H.S.
Assess child Interview parents Teacher reports
Observe program N=2400
Assess child Interview parents
K Teacher questionnaire N=1428
FACES Main Study
3-year olds
4-and 5-year olds
Field Test 4-and 5-year olds who return to H.S.
In H.S.
Assess childInterview parentsTeacher ReportsObserve program
N=1200
In H.S.
Assess childInterview parentsTeacher ReportsObserve program
N=1280
In H.S.
Assess childInterview parentsTeacher ReportsObserve program
N=720
In H.S.
Assess childInterview parentsTeacher ReportsObserve program
N=1104
In H.S.
Assess childInterview parentsTeacher ReportsObserve program
N=1178
In H.S.
Assess childInterview parentsTeacher ReportsObserve program
N=662
In H.S. In Kindergarten
Assess child Interview parents Teacher Reports Observe program
N=938
Assess child Interview parents
K Teacher questionnaire N=798
In Kindergarten
Assess childInterview parents
K Teacher questionnaireN=1001
In Kindergarten
Assess childInterview parents
K Teacher questionnaireN=563
7

B. FACES Provides Important New Information on Head Start
The Spring 1997 field test of the Head Start Family and Child Experiences Survey (FACES) collected extensive information about the quality of the educational services provided by a nationally representative sample of Head Start programs; the abilities of Head Start children on a variety of child development measures; and the characteristics, life experiences, and involvement with Head Start of Head Start families.
Head Start Classroom Quality is Good
FACES revealed important, objective data about Head Start program quality. The quality of most Head Start classrooms is good. Of the 403 classrooms observed, the overall average Early Childhood Environment Rating Scale (ECERS) score was in the "good" range with 17 percent of the classrooms rated as good to excellent, and no classrooms scoring below the "minimal quality" rating. Additional data on class size, child:adult ratio, and teacher background support the conclusion that Head Start classroom quality is good. The average class size for the FACES Head Start classrooms was 13.6 children (children present at the time of observation). The average child:adult ratio was 5.6 children per adult. Over 68 percent of Head Start teachers have some college experience or a college degree. On average, Head Start teachers have been teaching for over 11 years with 7.5 of those years in Head Start.
FACES also identified the strengths and weaknesses of the Head Start classrooms. Head Start classrooms received high scores for: 1) Many provisions and planning for children with disabilities; 2) A wide variety of furniture and emphasis on routines such as meals and snacks, toileting and personal grooming; 3) Good supervision of children's outdoor activities; 4) High level of parent involvement in the program; 5) A "calm but busy" classroom atmosphere; and 6) A balanced daily schedule of classroom activities. FACES also identified areas where Head Start classrooms needed improvement, including: 1) Insufficient multi-cultural awareness; 2) Little space for a child to be alone; 3) Displays in the classroom often not the children's own work; 4) Few areas available for the staff to relax or meet with parents; 5) Lack of enough softness or cozy areas in classrooms; and 6) Dramatic play areas primarily focused on housekeeping and did not encourage play related to work or transportation roles. With regard to language, Head Start classrooms were strong in receptive language activities (such as the availability of books and story-telling) and informal use of language in the classroom. However, they needed improvement in activities to stimulate thinking and reasoning and providing sufficient activities and materials to stimulate the child's expressive language skills (such as encouraging children to express their own ideas).
Analyses also revealed how quality varied across programs, centers, and classes on the ECERS measure of program quality. Head Start programs in the South showed lower levels of quality on this measure (although still above the minimal level). Programs serving higher concentrations of minority families also had lower quality ratings on the ECERS.
8

Head Start Children Are Ready for School
FACES provided large-scale, cross-sectional data on how well Head Start is fulfilling its objective of enhancing child growth and development, as well as on the link between program quality and children's development. The Head Start children studied reflected both the larger Head Start population and the sampling stratification strategy for this study. The FACES Sample was stratified by three characteristics: region of the country in which the program was located (Northeast, Midwest, South, or West); location in an urban or rural area; and whether the program served a predominately minority population. Almost half of the children were four years old in the Spring of 1997, about one-third were five years old, and 13 percent were three years old. Almost equal proportions of boys and girls were included. Almost three-quarters of the children were in their first year of Head Start. About one-third of the children were African-American and nearly one-third were White, 25 percent were Hispanic, 2 percent American Indian, and 1 percent Asian. Families reported that over 17 percent of the children had some kind of physical or emotional disability with speech/language impairments being the most prevalent type.
FACES found that the typical child completing Head Start has knowledge and skills in early literacy and numeracy as well as skills that signify a readiness to learn more in kindergarten. For example, a "typical" 4-year-old completing Head Start could: 1) Tell his/her full name and age; 2) Identify ten basic colors by name; 3) Show the meaning of basic shape and action words; 4) Count four objects and solve simple addition and subtraction problems; 5) Use a pencil to copy a circle or letters like "Z" and "E"; 6) Correctly repeat a series of 4 spoken digits; 7) Show the front cover of a story book and open it to start reading; and 8) Answer simple factual questions about a story that is read to them.
The children also had a variety of social skills important for kindergarten. According to their teachers, the majority of 4-year-old Head Start children “very often”: 1) Used free time in acceptable ways; 2) Helped in putting work materials away; 3) Followed the teacher’s directions; 4) Joined in activities without being told; 5) Followed rules in playing games; and 6) Waited their turns in games.
There were also a number of things that typical soon-to-be graduates of Head Start could not yet do. Among these were: 1) Tell their home addresses; 2) Identify most letters of the alphabet; 3) Show the meaning of less basic shape and action words; 4) Copy more complex geometric figures, like a star or parallelogram; and 5) Know to move from left to right and top to bottom when reading English text. Also less than half of these children showed the following social skills “very often”: 1) Accepting classmates’ ideas for play; 2) Inviting others to join in activities; 3) Giving compliments to classmates; and 4) Not getting upset when teased by other children.
There were four tasks in the FACES Child Assessment for which national norms data were available: the Peabody Picture Vocabulary Test-III; and, from the Woodcock-Johnson Psycho-Educational Battery-Revised, the Letter-Word Identification, Applied Problems, and Dictation Tasks. The median scores of FACES children were within the average range of the national distribution of scores on these tasks (almost 90) while the upper fourth of Head Start
9

children scored at the national mean (100 with a standard deviation of 15). National norms are based on samples of children at all income levels. Comparisons with earlier research studies of low-income children suggest that the Head Start children in FACES were performing above the levels that would be expected for children from low-income families who have not attended center-based programs.
Program Quality is Linked to Child Performance
FACES found considerable variation in the average assessment performance of children from different Head Start programs. Detailed analyses revealed that much of the variation in average assessment performance was due to family background differences in the child population of various programs. However, a significant part of the variation seemed to be attributable to differences across programs in the quality of the average classroom environment. For example, children were more likely to score higher on assessment measures when they had sensitive teachers who encouraged independence. The children also scored higher if their classrooms had a varied and appropriate daily schedule, were well-equipped with learning resources, and provided richer language learning opportunities. Children who attended two years of Head Start performed better than children attending only one year.
Head Start Families Are Involved Despite Challenges
The Head Start families that were studied in 40 communities across the country had many things in common, such as their low income levels, parenting of young children, and involvement in the Head Start program. However, they also differed in many ways that affected their interaction with Head Start and the characteristics and experiences, which their children brought to the program. The majority of Head Start parents were under 30 years old, almost equally likely to be single parents as married, lived in households of 4 or 5 people, had nearly 3 children, and had at least a high school degree or GED. Although at least one family member was working in nearly 80 percent of the households, the families had low incomes with a median of $13,200 per year. Over 80 percent of the families received some form of assistance such as food stamps, welfare, or Medicaid. Almost a quarter of the families spoke a primary language other than English and almost 20 percent of the primary caregivers were born outside the U.S.
Most of the families lived in single-family households and had not moved in the last year. Many Head Start families lived in neighborhoods where crime was frequent, with nearly a third having witnessed violent or non-violent crime in the past year.
The majority of Head Start families are highly representative of the working poor in the United States. As such, they face the typical challenges of families with very limited resources and opportunities. In addition, a significant minority of Head Start parents and children are facing major challenges in their lives. Fathers of the Head Start child were not present in 54 percent of the households. Over 8 percent of the families had more than 5 children. The primary caregiver had less than a high school education in 29 percent of the families. The household income was less than $500 a month in 12 percent of the families, and about 21 percent of the households contained no employed adult. Nearly 8 percent of the families had been homeless at
10

some point since the child's birth and about 4 percent of the children had been victims of crime or domestic violence.
Nevertheless, parents were actively involved in daily interactions with their children. Over 90 percent took the children on errands, played with them with toys or games, involved them in household chores, and talked with them about what happened in Head Start. Between 70 and 90 percent taught them letters, numbers or songs. About two-thirds of the families read to the children three or more times a week, although daily reading to children occurred in only 33 percent of the families. Head Start families were satisfied with the Head Start services they received, with more than 90 percent reporting that they felt welcome and supported by the teacher and that their children were respected and accepted by the teacher. Between 85 and 90 percent of parents were very satisfied with the safety of the program, program services for children and Head Start’s promotion of child growth and development.
Parent involvement is a cornerstone of Head Start and the survey found that the vast majority of Head Start parents (80 percent) had participated at least once in a Head Start activity that year. Over 40 percent had participated more than three times in such activities as volunteering in the classroom. However, about one-fifth of the parents had not participated in key Head Start activities such as parent-teacher conferences. Barriers to participation for all families included work schedules, child care needs, lack of transportation, and school or training schedules. Parents who were less likely to participate included parents who had not graduated from high school, employed parents and single parents, suggesting that Head Start should make greater efforts to reach these parents. However, parents participation was equal across English-speaking and primarily non-English speaking families, suggesting that Head Start programs are accommodating these language needs.
Sequence of Remainder of Report
This summary is drawn from the more extensive discussions of FACES findings presented in Chapter 1 which follows. Chapter 1 presents findings addressing the Objectives of the Head Start Program Performance Measures Conceptual Framework. Chapter 1 Section 1 provides information about Objective 3: Provide Children with Educational, Health and Nutritional Services, specifically the quality of the Head Start educational program. Chapter 1 Section 2 addresses Objective 1: Enhance Children's Growth and Development through the presentation of data on the children's performance on the assessment measures and the relationship of performance to classroom quality. Chapter 1 Section 3 presents findings about Objective 2: Strengthen Families as the Primary Nurturers of Their Children by describing Head Start families and their involvement in and satisfaction with Head Start.
11

3 PROVIDE
children with educational, health and nutritional services.
CHAPTER 1
Part 1: Is Head Start Providing High-Quality Educational Services?
One of Head Start's key performance objectives is reflected in Objective 3: To provide children with high-quality, developmentally appropriate educational services.1 FACES was designed to assess the quality of educational services through direct observation of the Head Start classrooms in operation and to correlate program quality with children's social and cognitive development. In the larger early childhood field, there has been an increased focus on measures of quality over the past 15 years. Research has consistently linked program quality variables such as child:adult ratio, group size, responsiveness of teacher-child interaction, and richness of learning environments to improved child outcomes. For the first time using a national sample, FACES tested the same linkages. It was expected that higher quality Head Start programs would have children showing higher levels of skills and, over time, displaying greater gains in developmental outcomes.
While provision of high-quality health and nutritional services was also assessed, those data are primarily reported from other sources than FACES; See Chapter 3 for the Program Performance Measures Matrix.
Defining Quality
In the FACES study, quality was considered to include the number of children and adults in each classroom, the physical arrangement of the classroom, the availability of learning materials, and the teacher's influence on the variety and type of learning opportunities provided to all children. Through the use of trained classroom observers as well as teacher questionnaires, FACES assessed the three primary domains of program quality well known in the research literature: structure, processes, and teacher qualifications.
Structure refers to regulatable characteristics of centers such as group size and child:adult ratio. These characteristics are assumed to affect the child indirectly by influencing the availability of stimulating resources in the classroom and determining the teacher's behavior as a director and facilitator of the child's learning. With more children and fewer adults in a classroom, the teacher becomes less able to provide individual attention to the children, to prevent negative behavior, and to engineer opportunities for learning during the course of the children's play.
Processes refer to the quality of the learning activities provided in the classroom; these reflect direct influences on the child of the teacher's behavior and classroom planning. Teachers in high-quality classrooms provide warmth, sensitivity and responsiveness; they also encourage independence and self-help skills. The teachers' influence in the classroom is evident through the variety of learning materials provided to stimulate both fine and gross motor development, creative and dramatic play, language and literacy, math and science, and cultural diversity.
12
1
Teachers in high-quality classrooms display a planful approach that is evident in classroom schedules providing for small group and individualized opportunities for discovery learning using both free play and structured activities. A range of developmentally appropriate activities that involve independent exploration as well as hands-on and experiential manipulation of materials in a "calm but busy" environment is emphasized.
Teacher qualifications include the number of years of teaching experience, the highest level of education achieved by the teachers, and the number of courses in early childhood education and child development taken. These are expected to be related to the ability of the teacher to provide a warm and attentive environment that encourages learning and to plan formal and informal learning opportunities in a stimulating classroom environment.
FACES measured a variety of dimensions of program quality using reliable, well-known measures that were designed to be employed by specially trained classroom observers. The classroom observers spent an entire "Head Start day" in the classroom and, using standard measures, assessed various aspects of the classroom that were known indicators of quality. Observers recorded the setup of the classroom, that is, the amount and arrangement of learning materials, and the daily schedule of activities. Observers counted the total number of children and adults present in the classroom. Observers also measured the warmth, responsiveness and prosocial discipline practices employed by the teachers in interactions with the children. Questionnaires completed by the teachers provided information about the teacher's qualifications and training.
In this report, we describe the nature of the quality in the FACES national sample of Head Start programs and classrooms, using data collected during the spring of 1997. We present findings showing the average quality across all classrooms, the areas in which Head Start classrooms appeared to show strengths according to the average quality scores, and the areas in which Head Start classrooms appeared to show lower levels of quality. The focus of these findings is on the process elements of program quality, including the arrangement of space and materials in the classrooms, the provision of early language stimulation and other learning activities including gross-motor and dramatic play activities, the quality of the teachers' supervision of learning activities and warmth of interactions with the children, and the provisions for diversity, exceptional children and parents. A brief description of the measures is provided in the section titled "Classroom Observation Procedures." A more complete description of the measures and the rationale for their use is provided in a separate forthcoming technical report (not part of this Performance Measures Progress Report).
Classroom Observation Procedures
The classroom quality data described were collected in the national field test of FACES during the spring of 1997. Specially trained observers, each of whom was present in one classroom throughout one full “Head Start” day, completed the following standardized and widely used measures:
• The Assessment Profile Scheduling scale. This scale assesses the written plans for classroom scheduling and how classroom activities are implemented.
13

• The Assessment Profile Learning Environment scale. This scale measures the variety of learning materials available in the classroom that provide learning experiences in small muscle/manipulatives, self-help, art, drama/role play, science, math, language, nutrition/health, and diversity.
• The Early Childhood Environment Rating Scale (ECERS). This measure consists of 37 items measuring a wide variety of quality related processes occurring in the classroom, including routines, teacher-child interaction particularly in the use of language, learning activities, classroom tone, creative, dramatic, and gross and fine motor activities, equipment and furnishings, and staff and parent facilities. The ECERS items were rated on a seven-point scale, with the following anchors: (1) inadequate, (3) minimal, (5) good, and (7) excellent. An overall quality rating for each classroom was then obtained by averaging the scores across all items.
• The Arnett Scale of Caregiver Behavior. This is a rating scale of teacher behavior towards the children in the class. It consists of 26 items that assess the teachers’ sensitivity, punitiveness, detachment, permissiveness, and the teachers’ encouragement of child self-help.
The classroom observers were also trained to observe individual children during free play interacting with other children and with teachers, using the Howes Peer Play Scale. This measure involved extensive, real-time behavioral observations of study children over random 20 second intervals. While these data are important because they will provide relatively objective evidence for the children's development in non-cognitive, social domains, they are still undergoing analyses and are not presented in this report.
Results of Classroom Data Collection Efforts
The Spring 1997 data collection in classrooms was highly successful. Classroom data were collected in all 40 programs and at least one classroom was observed in 156 out of the 157 possible centers. A total of 403 classrooms out of 414 possible were observed for a completion rate of 97 percent. Agreement between two independent observers in a sample of classrooms averaged 91 percent for the Assessment Profile and 86 percent across all ECERS scales (which includes direct hits and being off by one on a seven-point scale). These findings indicate the observers in the classroom were well-trained and followed the coding criteria in assigning scores for program quality.
A. Head Start Classrooms as Child Development Environments
Thumbnail Sketch of a "Typical" Head Start Classroom
Before presenting the quantitative findings, it is useful to describe what typically happens in a Head Start classroom. The following description is drawn from observations across many Head Start classrooms and represents a composite view of a typical Head Start classroom, looking at their strengths and weaknesses. This is not an attempt to fully capture the "ideal"
14

Head Start classroom, but rather to give a flavor for what happens in most classrooms, and is based on an analysis of the ECERS scales.
The Head Start classroom looks much like any other center-based preschool program or classroom, with the room divided into several learning areas by low shelves. The walls are decorated with bright, colorful posters and children's artwork. The typical classroom usually has a housekeeping area with child-sized kitchen furnishings and props to enhance dramatic play, a block area with a variety of different sized blocks and toy trucks and figures to use with the blocks, and an art area equipped with easels, paint and drying racks. A "sand table" with shovels, pails and plastic molds can double to hold water or dried beans or other creative play materials. The Head Start classroom usually has a quiet area, containing children's books and some have soft, upholstered furniture, separated from the rest of the room. There is usually an open space with a rug or cushions designed for large group activities like circle time. Finally, there is an outdoor play area containing different types of equipment for gross-motor play, such as a jungle gym, climbing bars and possibly outdoor dramatic play equipment. Many Head Start classrooms have other learning areas, including a science or math area, a flannel story board to tell a story, and a listening station for a number of children to hear a story or song on tape. Today, many classes also have computers with educational software for the children to use.
Most classroom schedules are posted in the room and identify key activities during a day. In many high-quality Head Start classrooms, there is a good balance between structured, teacher-led activities with specific learning objectives, and more open-ended free-play times for children to learn through manipulating different play materials and objects on their own, and through engaging in dramatic or pretend play. Teachers in high-quality classrooms where there are many adults for each child are able to do more individualized and small group activities with the children, helping children with particular learning needs.
When children first arrive and are greeted by the teachers, there is "circle time" in which the teacher leads the class in songs, stories, the assignment of classroom duties to individual children, and a brief lesson on a learning topic related to the theme for the week, such as farms, patterns, or colors. Following circle time, the children usually have approximately 45 minutes of free play indoors or they will go outdoors to play on the center's playground equipment. During free play, learning centers are available in which children have a choice of different activities specifically arranged to teach different skills through play. An example of a learning center in many classrooms is an art table arranged with children's scissors, glue and old magazines, and supervised by a teacher or volunteer. At this table the children make collages, choosing pictures with particular content related to the classroom theme. A mid-morning snack is preceded by supervised hand washing, and it is followed by another quiet activity such as storytelling or singing songs. If free play occurs in the early part of the morning, there is usually an outdoor play period after the quiet time. This leads into cleanup, washing hands, and lunch. Typically, lunch consists of a well-balanced hot meal of meat, vegetables, starch, milk and dessert. It is usually followed by supervised tooth-brushing and then quiet play activities, sometimes using puzzles or fine-motor manipulatives, or the teacher reads another story. Full-day programs have naptime, which is usually followed by a supervised bathroom break and hand washing, then, an afternoon snack. There may also be outdoor play if weather and time permit. At the end of the day, the children gather in their circle again and sing a farewell song before their departure.
15

Many Head Start programs operate only half-day sessions, for approximately three-and one-half hours, with a condensed program in which naptime is omitted and only one period each of free play and outdoor play are provided. Frequently programs have double sessions with part-day classes in both the morning and afternoon.
The tone of most Head Start classrooms may best be described as "calm but busy," with relaxed staff who supervise the children, reinforce cooperation and sharing, and show physical warmth and frequent smiling. Teachers set this tone in the classroom by providing for smooth transitions between activities so that the children are happy and engaged in a wide range of stimulating play activities. There seems to be mutual respect and sharing among children and adults. Teachers promote leadership and self-help skills, and assist children to make choices during activity periods.
The Quality of Most Head Start Classrooms is Good
Data collected in FACES assesses the three dimensions of program quality: process, structure and teacher backgrounds. All three dimensions converge to indicate that the quality of Head Start classrooms is good and above that usually found among center-based preschools.
The Early Childhood Environment Rating Scale (ECERS). A major finding of the Spring 1997 FACES was that the overall average ECERS score for the 403 classrooms in the national sample was 4.9 (with a standard deviation of 0.6). The ECERS provides labels for selected scale points that denote a level of quality associated with the scale score. Thus, a score of 1 on the 7-point scale is considered "inadequate", while 3 is given the label of "minimal quality", 5 is labeled "good quality" and 7 is termed "excellent quality." Table 1.1.1 displays the distribution of FACES classrooms along these ECERS scale points. Seventeen percent of the Head Start classrooms were given average ratings of 6 or higher2 which indicates quality between "good" and "excellent," which we will call "excellent" quality. We found that, in trying to group classrooms into a "low" quality category, we could not use the "minimal" label because only 1.5 percent of classrooms had an average score of 3 and no classrooms had an average score lower than 3. However, 22 percent of the classrooms scored 4 or lower and so we used this as the boundary for what we call "lower" quality. Still, "lower" quality in FACES does not mean the same as "minimal," because the FACES sample classrooms generally had higher quality scores.3
Figure 1.1.1 displays a comparison of the average ECERS scores, and the range (within 2 standard deviations), between the FACES sample and previous studies of center-based preschools. This figure shows that the FACES mean of 4.9 was considerably higher than the average quality found in commercial child-care or center-based preschool programs. Also, the variability of the FACES scores was less; none of the programs in the FACES sample fell below
2 The average scores were rounded off to the whole number reflecting the closest scale point, so that a score of 6 or higher includes scores of 5.5 or greater. A score of 4 or lower includes scores of 4.49 or less.
3 These results are based on the unweighted data. However, class-level weights were computed and the weighted results did not differ. In this report, only the results from unweighted data were given. A forthcoming technical report will provide results from weighted data, including standard error estimates.
16

the "minimal" score of 3, although 1.5 percent were at the "3" level. At the same time, the FACES average quality score and variability were almost identical to those found in an earlier study that included a sample of Head Start classrooms. The lowest ECERS scores were reported by two large studies of center-based preschool programs, while reported scores for school-based and non-profit child-care centers were slightly higher (although not at the same levels as the Head Start classrooms).
Table 1.1.1. Distribution of Classrooms by ECERS Mean Score
ECERS Labels ECERS Score Percent of
Classrooms
Inadequate 1
2
0
0
Minimal 3 1.5
4 20.0
Good 5 61.5
6 17.0
Excellent 7 0
100%
Source: Head Start Family and Child Experiences Survey (FACES) Spring, 1997 Data
Note: There were 395 classrooms with valid scores. Mean scores were rounded to the nearest scale point.
17

Figure 1.1.1 Classroom Quality Compares Favorably to Other Preschool Programs
1
2
3
4
5
6
7
Mea
n E
CER
S S
core
Minimal Quality
Head Start 39 Head Start 38 School-based 50 Non-profit 42 Child-care 120 Preschool 227 Preschool FACES Spring classrooms Centers ( Layzer Child-care Centers Centers ( Scarr Centers
1997 (403 (Layzer et al, et al, 1993) Centers (Cost, (Layzer et al, 1994) (National Child classrooms) 1993) Quality and
Outcomes Study, et al, 1993) Care Staffing
Study, 1995) Whitebook et al,
1989)
Studies
The range represents the mean plus or minus 2 SD's. It does not include classrooms that fall outside of these boundaries.
The conclusion from these findings is that Head Start classrooms do not have the same "bottom" to the distribution that is found in other preschool center-based programs. Further, a comparison with other studies supports the validity of the ECERS scores for the FACES national sample of Head Start programs and suggests that Head Start classrooms in general have higher quality than most center-based early childhood programs. A possible explanation for these findings is that the existing efforts towards monitoring program standards in Head Start have had the desired effect of bringing all programs above the minimal standard of quality. Two other domains of program quality, structural aspects such as class size and child:adult ratio, and teacher backgrounds, further support the findings from these process measures of program quality.
Group Size and Child:Adult Ratio. Structural aspects of program quality, such as class size, child:adult ratio and teacher backgrounds, further support the conclusion that the quality of many Head Start classrooms is good and higher than other center-based preschool programs. According to data collected by FACES observers at two separate time periods during their stay in the classroom, the number of children present per class (class size) averaged 13.6. The 75th
percentile of classrooms averaged 15.9 children, while the 25th percentile averaged 11.2 children. The class sizes found in FACES suggest that most Head Start programs sampled in this study meet or exceed the monitoring standards already in place.
18

The average child:adult ratio for the FACES Head Start classrooms was 5.6 children per adult, which is also far better than the NAEYC accreditation standard of eight or fewer three year olds or 10 or fewer four year olds for each adult. This ratio also exceeds the Head Start Program Performance Standards of 7.5 to 8.5 or fewer three year olds or 10 or fewer four year olds per adult. The 75th percentile of classrooms averaged 6.7 children per adult, whereas the 25th
percentile of classrooms averaged 4.3 children per adult. Again, even the worst quarter of the Head Start classrooms in the FACES sample had fewer children per adult than the NAEYC accreditation and Head Start Program Performance standards.
These child:adult ratios were based on the total number of adults in the classroom reported by FACES observers, averaged across two distinct time periods. The ratios included parents and other volunteers in the classroom, as long as they were actively involved in classroom activities. However, the Head Start Program Performance Standards and the NAEYC standards for child:adult ratio only count paid professional staff, so it is hard to compare. The method by which Head Start classrooms were able to have more favorable child:adult ratios was primarily through volunteer assistance, further underlining the importance of parent involvement as a contributor to overall program quality in Head Start.
These findings indicate that structural aspects of quality are important factors distinguishing Head Start classrooms from other preschool settings. Head Start classrooms provide substantially better child:adult ratios than current standards and, as we shall see, this factor plays an important role in the linkage between Head Start program quality and children's development.
Lead Teacher Characteristics. Head Start lead teachers were overwhelmingly female, with only a handful (five) of male teachers. While this is not in itself surprising, it is remarkable how few males were teaching Head Start (compared to the number of males teaching kindergarten and the primary grades). On average, lead teachers had been teaching in Head Start for 7.5 years and they had been teaching for an average of 11.7 years in all educational settings. Thus, teachers spent most of their teaching careers in Head Start classrooms. However, there was a wide range of teaching experience. Approximately one-fifth of the lead teachers were relatively new, having been teaching in Head Start for less than two years, while one-quarter had been teaching in Head Start for ten years or more.
Head Start lead teachers had good teaching qualifications, but lower than those of teachers in public elementary schools. One-third of the Head Start lead teachers had an undergraduate degree or higher, and another 35 percent had some college experience. Head Start teachers were generally between 30 and 50 years of age with 32 percent in the 40 to 49 year age group and another 30 percent in the 30 to 39 year age group. Fifty-eight percent belonged to a national professional association for early childhood educators (e.g. NAEYC, NHSA, NEA). Nearly three-quarters reported taking at least one course in child development or early childhood education. In terms of racial and ethnic background, 31 percent of the teachers were African-American, 25 percent were Hispanic, 2 percent were Asian and the remainder were white. Table 1.1.2 summarizes these biographical data. The data reveal that Head Start lead teachers are experienced and qualified to teach early childhood education.
19

Table 1.1.2 Head Start Teachers Are Experienced and Qualified
Count Table % TOTAL YEARS TEACHING
1-4 YRS 79 19.6% 5-9 YRS 113 28.0%
10-14 YRS 90 22.3% 15-19 YRS 49 12.2%
20+ YRS 72 17.9% Total 403 100%
YEARS TEACHING HEAD START 1-2 YRS 84 20.8% 3-4 YRS 80 19.9% 5-9 YRS 132 32.8% 10+ YRS 107 26.6%
Total 403 100% HIGHEST LEVEL OF EDUCATION ACHIEVED*
HIGH SCHOOL 36 7.1%ASSOCIATE DEGREE OR VOC TECH DIPLOMA 129 25.4%
ATTENDED COLLEGE 177 34.9%UNDERGRAD DEGREE 150 29.6%
GRADUATE DEGREE 15 3.0%Total 507 100%
NUMBER OF COURSES COMPLETED IN EARLY CHILDHOOD 0 113 27.6% 1 85 20.8% 2 55 13.4% 3 156 38.1%
Total 409 100% AGE CATEGORY
18-29 60 14.7% 30-39 124 30.5% 40-49 132 32.4% 50-59 70 17.2% 60-69 18 4.4%
70 OR OLDER 3 0.7% Total 407 100%
MEMBER OF EARLY EDUCATION ASSOCIATION NO 172 42.1%
YES 237 57.9% Total 409 100%
TEACHER ETHNICITY Black 130 31.3%
Hispanic 104 25.1% Asian 9 2.2% White 172 41.4%
Total 415 100%
* Teacher education data based on Fall 1997 data collection.
20

B. Strengths and Weaknesses in Head Start Classrooms
The ECERS measure of quality (described on page 18), as an assessment of the classroom processes, can help to identify those areas in Head Start where classrooms show strengths, as well as areas where Head Start classrooms may require some improvement.
Quality of Language Curriculum Is Strong in Some Areas, Weak in Others
Children's learning of language is a central focus of Head Start curricula. Using the ECERS, we can identify activities in the classroom that support high quality early language and literacy experiences. The language subscale of the ECERS consists of four items assessing expressive and receptive language activities, informal use of language in the classroom, and activities related to thinking and reasoning tasks (such as sorting or classification).
The analysis of the FACES Spring 1997 data revealed that Head Start classrooms were strong in two areas related to language: receptive language activities and informal use of language in the classroom (see Figure 1.1.2). Many classrooms (33 percent were rated "excellent") provided a variety of books and planned activities such as story telling and flannel story boards. These were aimed at improving children's understanding of language, for example, their vocabulary, learning letters and colors, learning numbers, etc. Teachers also provided good role models throughout the day in using language and in facilitating children's responses to questions beyond simple yes/no or short answers.
Figure 1.1.2 Head Start Classrooms are Strong in Some Areas of Language CurriculumBut Weak in Others
0%
25%
50%
75%
100%
Per
cent
of C
lass
room
s LOWER (4 or lower) GOOD (5) EXCELLENT (6 or 7)
Understanding of Informal Use of Using Language Using LearningLanguage (Receptive) Language (Expressive) Concepts (Reasoning)
ECERS Items
Thirty percent of classrooms received an "excellent" rating on the ECERS item labeled "informal use of language." That is, staff used language to exchange information with children and for social interaction, and in many classrooms, staff verbally expanded on ideas presented by the children and encouraged children to expand their vocabulary and understanding.
21

However, there were several areas where Head Start classrooms needed improvement (see Figure 1.1.2). In terms of activities to stimulate thinking and reasoning, 33 percent of classrooms received lower ratings (4 or below). There was a lack of planned or structured activities that encouraged children to engage in sorting or classification tasks with objects or to engage in cause-effect reasoning about daily events and sequences of events. Thirty-one percent of classrooms received lower ratings concerning the provision of sufficient activities and materials to stimulate the child's expressive language skills, that encouraged children to talk and express their own ideas. Activities of this type include recalling what each child did during free play, telling their own stories, or show-and-tell activities.
These results also reveal the importance of the language subscale of the ECERS and its link to children's development. Although language in the Head Start program is an important factor relating classroom quality to children's developmental progress, it is also useful to look at other aspects of quality that may contribute to children’s instruction in Head Start.
Other Areas of Strengths and Weaknesses in Head Start Classrooms
The 37 items in the ECERS measure covered personal care, furnishings, language and reasoning activities, gross and fine motor activities, creative activities, social activities, and provisions for adults and teachers. Each item was coded on a 7-point scale as described earlier. To identify strengths, we looked primarily at those items where at least 30 percent of the Head Start classrooms received scores of 6 or 7, which indicates "excellent" quality (see Figure 1.1.3). To identify weaknesses, we looked at those items where more than 50 percent of the classrooms received scores of 4 or lower on the 7-point scale, since no classrooms scored lower than 3 (see Figure 1.1.4). We termed these classrooms “lower” quality. The following summarizes these strengths and weaknesses by first listing the title of the relevant ECERS item (from the figures) and then providing a description of the key findings.
Strengths in Head Start Classrooms
• Provisions for exceptional children: Many provisions and planning for exceptional children (58 percent "Excellent").
• Routine care, personal grooming, toileting: Wide variety of furniture and emphasis on routines such as meals and snacks, toileting and personal grooming (38 percent to 57 percent "Excellent").
• Supervision (gross motor activities): Good supervision of children's outdoor activities (54 percent "Excellent").
• Provisions for parents: High level of parent involvement in the program (51 percent "Excellent").
• Tone: Classroom atmosphere was "calm but busy" (43 percent "Excellent”).
22

• Schedule: Balanced daily classroom schedule of activities (33 percent "Excellent").
Figure 1.1.3 Areas of High Quality in Head Start Classrooms
LOWER (4 or lower) GOOD (5) EXCELLENT (6 or 7)
0%
25%
50%
75%
100%
Per
cent
of C
lass
room
s
Provisions For Supervision Provisions Personal Toileting Tone Schedule for Routine (Gross for Grooming
Exceptional Care Motor Parents Children Activities)
ECERS Items
Weaknesses in Head Start Classrooms
• Cultural awareness: Insufficient multi-cultural awareness (75 percent "Lower").
• Space to be alone: Little space for a child to be alone (73 percent "Lower").
• Child-related display: Displays in the classroom were often not the children's own work (70 percent "Lower").
• Adult Personal Area: Few areas were available for the staff to relax or meet with parents (61 percent "Lower").
• Dramatic play: Dramatic play areas in the classroom primarily focused on housekeeping and did not encourage play related to work or transportation roles (62 percent "Lower").
• For relation and comfort: Classrooms did not have enough softness or cozy areas (51 percent "Lower").
23

Figure 1.1.4 Areas of Lower Quality in Head Start Classrooms
LOWER (4 or lower) GOOD (5) EXCELLENT (6 or 7)
0%
25%
50%
75%
100%
Per
cent
of C
lass
room
s
Cultural Space to be Child Related Adult Personal Dramatic For Relaxation Awareness Alone Display Area Play and Comfort
ECERS Items
We did not conduct separate analyses of how these individual ECERS items were linked to children's development, but rather we used the overall ECERS score (described earlier). However, the strengths and weaknesses are important to identify because they contribute to an overall composite of what defines a high-vs. low-quality Head Start classroom. When overall variation in program quality is assessed, the strengths and weaknesses provide insight into those factors producing variation in quality.
How Quality Varies Across Programs, Centers, and Classes
Earlier, we reported that the lowest quality Head Start classrooms were still higher than many commercial preschools and day care centers and that there was a "floor" to the levels of quality in Head Start. No programs were given less than a "minimal" rating of 3 of a possible 7 points and, the lowest score by any classroom was 3.25 on the 7-point scale. This finding does not mean that all programs were of equivalent quality. In FACES, we found that there was considerable variation in program quality across three levels: Head Start classrooms, centers, and programs. Classrooms are the most elemental level, where individual children experience Head Start, but classrooms are part of the larger Head Start center. A number of Head Start centers together comprise a Head Start program. The fact that significant variation exists at all of these levels supports continued efforts to improve program monitoring that involves all three levels.
24

An important finding from the FACES Spring 1997 analysis was that approximately one-third of the variation in classroom quality (according to the ECERS mean scores across all 37 items) could be attributed to each of the three levels: classroom, centers, and programs (see Figure 1.1.5). Slightly more variation occurred at the classroom and the program levels than at the center level. Thirty-six percent of the variation in quality occurred at the program level and thirty-five percent of the variation in quality occurred at the classroom level, compared to twenty-nine percent attributable to variation across centers. These findings indicate that, within a given Head Start program, classrooms in the same center tended to show more variation in quality compared with classrooms across centers (that are also part of the same program).
Figure 1.1.5 Classroom Quality Varies Across Programs and Centers
Across
Across Classes
35%
Centers Across 29% Programs
36%
Variation in classroom quality that occurred at the classroom level can be traced, for the most part, to the individual teachers who were in charge of each classroom. This suggests that monitoring and efforts to improve quality must address differences in teacher competence, training and experience. Variation in quality across Head Start centers suggests the role of the Center Director and the Educational Coordinator in maintaining quality, providing resources to teachers, and determining policies that affect quality across classrooms in the same center. Finally, the relatively larger variation in quality that was found at the program level indicates that factors at the level of the program's organization, such as resources, staff salaries, training policies, management practices, and perhaps support from the communities in which the programs operate, all have a significant impact on quality. This suggests that monitoring activities and quality improvement efforts should be targeted towards programs in specific regions of the country or specific types of communities that have been found to have lower program quality, on average. We now turn to variables at the program level that are correlated with program quality, including region, urbanicity and socio-economic circumstances of the families participating in Head Start.
25

Geographic/Demographic Correlates of Classroom Quality
A set of analyses were conducted to identify whether classroom quality differed by three factors These variables were those originally selected as stratifiers for the nationally representative sample of Head Start programs:
• The region in which the Head Start program was located (Northeast, Midwest, South or West);
• Urbanicity (urban vs. rural); and
• Percentage of minority families, high (50 percent or more) or low (less than 50 percent).
These analyses used several measures of classroom quality, including the ECERS mean scores, the Arnett teacher ratings, and child:adult ratio. Head Start programs in the South had significantly lower quality ratings, compared to programs in the other regions, whereas those from the West and Northeast revealed significantly higher quality ratings, on average (Figure 1.1.6a). There were no significant differences by urbanicity, that is, whether the Head Start program served primarily urban or rural families. Head Start programs in communities serving a higher concentration of minority families (50 percent or more of families enrolled) had significantly lower quality ratings on the ECERS mean score than programs with fewer than 50 percent minority families enrolled (Figure 1.16b).
However, there were also significant relationships among region, urbanicity and minority concentration that highlight somewhat more complex patterns for program quality. For example, Head Start programs serving high concentrations of minority families tended to be located in urban areas while Head Start programs with low concentrations of minority families were located in rural areas. In the South, however, programs in rural areas also tended to have high concentrations of minority families.
When looking across all three measures of program quality, some consistent geographic patterns emerged. For the most part, programs with significantly higher quality scores were those in the Northeast and the West located in rural areas. These programs also had relatively low concentrations of minority families. In the South, there were no or only slight differences in quality for programs in rural versus urban areas, and for programs with low versus high concentrations of minority families. Consistently, programs in the South had significantly lower quality scores, while rural programs in the West and Northeast revealed significantly higher quality scores.
26

Figure 1.1.6a.Classroom Quality is Lower in the South
NORTHEAST MIDWEST SOUTH WEST
Region
4
5
6M
ean
EC
ER
S S
core
s
6
Figure 1.1.6b. Classroom Quality is Lower in High Minority Programs
4
5
Mea
n E
CE
RS
Sco
res
<50% MINORITY >50% MINORITY
Percent Minority
27

1 ENHANCE
children’s healthy growth and development.
Part 2. How Well Is Head Start Fulfilling Its Objective of Enhancing Child Growth and Development?
As symbolized by its place at the top of the Program Performance Measures pyramid, the ultimate goal of Head Start is, “to enhance the social competence of children from low-income families.” Social competence has been defined by the Head Start Bureau as, "a child's everyday effectiveness in dealing with both the present environment and later responsibilities in school and life.” For the five-year-old child coming to the end of the preschool period, a key test of social competence is how well he or she functions and adjusts to the demands of kindergarten and elementary school, what is often called school readiness. One of the primary objectives supporting the goal of social competence and school readiness is Objective 1: to enhance children’s healthy growth and development.
There are several different kinds of skills, accomplishments, and behaviors that are relevant to a child’s social competence and school readiness. One component consists of early language learning, perceptual-motor skills, and comprehension capabilities that are essential if reading, writing, and arithmetic skills are later to be learned. Another component is made up of basic social skills (following adult directions, sharing, cooperating, waiting one’s turn, etc.) that enable the child to function smoothly in group situations without giving up his or her own goals and values. Other components consist of acquiring positive behaviors that foster learning and avoiding or growing out of negative behavior patterns that are self-limiting or disruptive of group situations. Examples of behavior patterns that foster learning are being curious, exploring, being able to focus and sustain attention on a task, having confidence in one’s own abilities to master new challenges, being persistent in the face of temporary setbacks, etc. Examples of problem behaviors in young children are extreme shyness or anxiety, chronic unhappiness or depression, frequent hitting or biting of other children, and excessive dependence on or clinging to adults.
The instruments used in the Head Start Family and Child Experiences Survey (FACES) were designed to tap each of these major components of social competence. Children’s cognitive development and early academic skills were measured through a direct child assessment administered to each of the sample children by specially trained assessors. Children’s developing social skills were assessed by means of standardized scales filled out by teachers and parents and through direct observation of the children’s social play, observations made during multi-day visits to Head Start centers. Children’s approaches to learning and problem behaviors were also captured through standardized teacher and parent reports, as well as through scales completed by the trained assessors after they had conducted their one-on-one testing sessions with the children.
28

Measures of Change in Skills and Behavior Not Yet Available
The Head Start Program Performance Measures framework focuses on the degree of change in children’s skills, knowledge, and behavior as key indicators of the extent to which programs are enhancing children’s social competence. And, indeed, when fully implemented, FACES will take repeated measures of children’s learning and behavior by means of the aforementioned procedures. Measurements will be taken in the Fall, at the beginning of the Head Start year, and in the Spring, at the end of the year. Additional measurements will be taken the following Spring, when the children are either at the end of their second year in Head Start (for younger children who attend the program for two years), or at the end of their kindergarten year.
However, the first sequence of “before-and-after” child development measures has not yet been completed as of the writing of this report. Only the results of a large-scale, cross-sectional field test of the FACES battery, carried out in the Spring of 1997, are currently available.
Despite the fact that only cross-sectional data taken at a single point in time are currently available, it is possible to use these field test results to give at least a preliminary answer to a number of research questions that bear on the performance of the Head Start program. These questions include the following:
Research Questions That Can Be Addressed With Current Data
• What are the school readiness skills that Head Start children have as they prepare to enter kindergarten? What are the skills they lack?
• How does the cognitive and social development of Head Start children compare with the development of the general population of preschool children in the United States? With that of other low-income children of preschool age not attending center-based programs?
• How much variation is there in children’s cognitive and social development across Head Start programs? Across centers within programs? Across classes within centers?
• What are some of the correlates of average differences in children’s cognitive and social development?
Questions Concerning the Link Between Program Quality and Children’s Development
The Spring 1997 FACES field test data can also provide some preliminary answers to research questions about the connection between measures of Head Start program quality and indicators of children’s cognitive and social development. These data can be used to answer questions such as the following:
29

• Is there a link between the quality of Head Start classroom environments and children’s cognitive and social development? Does the relationship hold up after controlling for family background and child characteristics?
• Which aspects of classroom quality seem to make the most difference for children’s cognitive and social development?
Before presenting the FACES findings applicable to these questions, we present information about the number and ages of the children who were assessed during the Spring 1997 data collection, and the types of tasks with which they were presented.
Description of Head Start Children
In the Spring 1997 data collection period, which ran from April 1st through June 8th, 1997, FACES interviewers completed one-on-one assessments with 2,237 children, or 93 percent of the planned total of 2,400 assessments. Of these, 1,856, or 83 percent, were conducted in English, and 381, or 17 percent, in Spanish.
There were nearly equal proportions of boys (51.8 percent) and girls (48.2 percent) among the Head Start children. Almost half of the children were 4 years old in the spring of 1997, about one-third were 5 years old and 13 percent were 3 years old. Almost three-quarters of the children had entered Head Start during the 1996-97 program year and were in their first year of Head Start.
Approximately one-third of Head Start children were identified as African-American by their primary caregivers, while 31 percent were identified as white, 25 percent as Hispanic, 2 percent as American Indian, and just over 1 percent as Asian. Approximately 8 percent of the children were identified as Other by their primary caregivers.
Primary caregivers reported that over 17 percent of Head Start children had some kind of physical or emotional disability. The most prevalent types of disabilities reported were speech/language impairments, reported for 13 percent of Head Start children. Approximately 2 percent of Head Start children were reported to have an emotional or behavioral disorder. In addition, about 2 percent of the children suffered from some form of chronic health impairment lasting six months or more (e.g., cerebral palsy, asthma, seizures).
A. Make-up of the Child Assessment
The FACES child assessment consisted of a series of tasks designed to appraise the children’s cognitive and perceptual-motor development in areas such as word knowledge, letter recognition, and phonemic awareness. These tasks have been shown to be predictive of later school achievement, especially of later reading proficiency and oral language skills (Horn & Packard, 1985; Snow et al., 1995; Pianta & McCoy, 1997). The assessment required 30-40 minutes per child. For assessments conducted in English, the average (median) duration was 35 minutes. Ideally, it was done somewhere in the Head Start center that was quiet and free of
30

distractions, at a tabletop or desk on which the assessor could show stimulus cards and the child could draw and write. Scoring procedures were relatively simple and objective, and did not require clinical judgment on the part of the assessors. Written parental permission was obtained prior to conducting the assessment. We requested that parents not be present during the assessment. Information on how individual children did on the assessment was not shared with parents or the Head Start program and did not go into children’s records.
During the assessment, children were asked to do the following:
• Tell his/her own name, age, birthday, and address;
• Show the meaning of spoken words by pointing to one of four pictures that best illustrated the meaning of each word;
• Copy simple designs, such as a circle, a right angle, and a star;
• Repeat a series of spoken numbers, forwards and backwards;
• Recognize colors by name;
• Count pictured objects and solve simple addition and subtraction problems;
• Trace letters and write own name; and
• Show familiarity with story books, understanding of print conventions, and comprehension of a simple story.
Several of the tasks included in the assessment were published tests with national norms, so that the cognitive development of Head Start children could be compared with that of the general population of preschool-aged children in the United States. These included the Peabody Picture Vocabulary Test, Third Edition (PPVT-III) (Dunn & Dunn, 1997); and, from the Woodcock-Johnson Psycho-Educational Battery-Revised (WJ-R), the Letter-Word Identification, Applied Problems, and Dictation tasks (Woodcock & Mather, 1989). Some of the tasks had also been used in earlier studies of Head Start and other young children from low-income families, so that the development of today’s Head Start children might be compared with that of these earlier groups.
Additional measures were used to assess children’s social, emotional development, and behavior. Both the Parent and Teacher Interviews include ratings of children’s positive behavior as well as behavior problems drawn from the Personal Maturity Scale (Alexander and Entwisle, 1988), the Social Skills Rating System (Elliott, Gresham, Freeman, and McCloskey, 1988) and the Child Behavior Checklist for Preschool-Aged Children (Achenbach, Edelbrock and Howell, 1987). The Teacher Questionnaire includes items from the same scales, as well as from the High/Scope Child Observation Report (COR) (High/Scope Educational Research Foundation, (1992). In the latter instrument the teacher rates the child’s progress in areas such as expression of feelings, social problem-solving, creative representation and music/movement. In addition,
31

classroom observers rated the content and complexity of children’s play behavior using the Howes Peer Play Scale (Howes, 1980,1987). Data on child social skills from the teacher interviews are included in this report. Data on the remaining socio-emotional measures will be included in later technical reports.
Growth in Skills and Knowledge with Age
Although the Spring 1997 FACES assessments were conducted during a single time-period at the end of the Head Start year, when the raw-score results were analyzed by the ages of the children, most of the tasks gave evidence of a clear age progression. That is, on average, 5-year-olds in Head Start did better on the tasks than 4-year-olds, and 4-year-olds did better than 3-year-olds. Moreover, when the one-year age-groups were subdivided according to whether children’s birthdays were in the first or second half of the year, older 4-year-olds generally did better than younger 4-year-olds, and older 3-year-olds did better than younger 3-year-olds.
The age progression may be clearly seen in Figure 1.2.1, which shows average raw scores on the Peabody Picture Vocabulary Test by age, for six-month age groups of Head Start children who received the English-language assessment in the Spring 1997 FACES. The median raw score went from 30 for the youngest age group (3 years, 0 months to 3 years, 5 months) to 46 for children who were a year older (4 years, 0 months to 4 years, 5 months) to 57 for children who had turned 5 by the end of the previous calendar year. Striking growth with age was also evident in the Woodcock-Johnson Applied Problems (math) subtest and Dictation (early writing skills) subtest, as well as other assessment tasks.
The increase in raw scores with age was not only found in the median or mean scores for the age groups, but also in the first quartile and third quartile scores. That is, children in the lowest quarter and highest quarter of the performance distribution also showed fairly steady growth in their skills and knowledge (see Figure 1.2.1). Notice, though, that children at the third quartile in the youngest age group had scores that were nearly as high as those of children in the oldest age group who were at the first quartile. Growth in age tended to be in parallel across the groups; there was little evidence of convergence between the top, middle, and bottom groups with increasing age.
These results indicate that most of the skills and knowledge areas appraised in the FACES Child Assessment were “developmentally appropriate”; i.e., they were capabilities that children were getting better at and domains about which children were becoming more knowledgeable over the age span covered by Head Start. However, not all of the skill areas covered in the original FACES Assessment showed the same kind of clear-cut progress with age that receptive vocabulary, applied math, and early writing skills displayed. Some of the tasks proved to be too difficult for a substantial fraction of the Head Start children, even those who were among the oldest in Head Start. As a consequence, the Child Assessment battery has been reshaped somewhat to make it more suitable for children in this age range who are from low-income families. The revised battery is being used in the main FACES data collection, conducted in the Fall of 1997 and the Spring of 1998.
32

Figure 1.2.1Head Start Children's Knowledge of Word Meaning Shows a Clear Progression with Age
10
20
30
40
50
60
70
80
PP
VT
Raw
Sco
re
Q1
MEDIAN
Q3
0 Sex Sex Age Age Age Age Age
F M 3,0 - 3,5 3,6 - 3,11 4,0 - 4,5 4,5 - 4,11 5,0 - 5,5
B. What Head Start Children Know and Can Do As They Approach Kindergarten
The Spring 1997 assessment results provide a nationally representative picture of what Head Start children know and can do as they complete the program year and prepare to enter kindergarten. These descriptive results are based on the performance of 1,051 children in the FACES sample who were 4 years old by the end of the previous calendar year (i.e., by December 31, 1996), and hence would be of the prescribed age for entering kindergarten in the fall in most states. The profile is based on the median performance levels of the children in this 4-year-old age group. (Children who had already turned five at the end of the previous year were excluded in calculating these medians. Also excluded were children who had not yet turned 4 at the end of the calendar year, even though some of these children may have been 4 at the time they were assessed. Recall that the assessments were carried out between April 1st and June 8th of 1997.)
33

FACES found that a “typical” 4-year-old completing Head Start could perform the following cognitive tasks:
• Tell his/her full name and age;
• Identify ten basic colors by name;
• Show the meaning of basic shape and action words;
• Count four objects and solve simple addition and subtraction problems;
• Use a pencil to copy a circle or letters like “Z” and “E”;
• Correctly repeat a series of 4 spoken digits;
• Show the front cover of a story book and open it to start reading; and
• Answer simple factual question about a story that is read to him/her.
Clearly, then, the typical child completing Head Start knows things and possesses skills that attest to a grasp of the rudiments of early literacy and numeracy and signify a readiness to learn more in kindergarten. Head Start children can listen and comprehend what they have heard, have at least a basic knowledge of word meanings, know shapes, know colors, show familiarity with books and story reading, can count several objects, can perform simple arithmetic, can use a pencil to draw or write letter-like shapes, and can demonstrate much of what they have learned in a structured assessment situation.
Most children completing Head Start have also learned many of the social skills they will need in the kindergarten classroom. According to the Head Start teachers questioned in FACES, majorities of 4-year-old students showed the following positive social behaviors “very often”:
• Using free time in acceptable ways (65%);
• Helping in putting work materials away (64%);
• Following the teacher’s directions (60%);
• Joining in activities without being told (55%);
• Following the rules when playing games (55%); and
• Waiting their turn in games (54%).
34

At the same time, the FACES results showed that there were a number of things that typical soon-to-be graduate of Head Start could not yet do. Among these were the following:
• Tell his/her home address;
• Identify most letters of the alphabet;
• Show the meaning of less basic shape and action words;
• Copy more complex geometric figures, like a star or parallelogram; and
• Know that you go from left to right and top to bottom when reading English text.
There were also social skills that most Head Start children had not yet mastered at the end of the year. According to their teachers, less than half of the graduating four-year-olds showed the following skills “very often”: accepting classmates’ ideas for play (47%) and inviting others to join in activities (43%). Only about a quarter gave compliments to classmates “very often,” or did not get upset when teased by other children.
None of the cognitive or social skills mentioned above is “required” for admission to kindergarten. Indeed, some of them, like being able to tell your home address, are things that children work on learning in most kindergarten programs. On the other hand, many middle-class preschoolers have already learned to do these things before entering kindergarten. Furthermore, if Head Start children lack some early literacy and social skills, it may contribute to later difficulties in elementary school (Horn & Packard, 1985; Pianta & McCoy, 1997; Snow et al., 1995).
How the Cognitive Development of Head Start Children Compares With That of theGeneral Population of Preschoolers
There were four tasks in the FACES Child Assessment for which norms were available that could be used to compare the performance of the sample of Head Start children with that of a broad cross-section of preschool-aged children. These were the Peabody Picture Vocabulary Test -- Third Edition (PPVT-III); and, from the Woodcock-Johnson Psycho-Educational Battery - Revised (WJ-R), the Letter-Word Identification, Applied Problems, and Dictation tasks. These measured children’s word knowledge, prereading skills, early counting and arithmetic skills, and prewriting skills, respectively. The published norms tables from these assessments were used to convert the raw scores achieved by FACES children into standard scores and percentile ranks for children of the same age group. (The overall means of the standard scores for the national standardization samples are set at 100, with standard deviations of 15.)
35

We focus again on those Head Start children who were four-years-old by the end of the previous calendar year, and hence would normally be beginning kindergarten in the Fall. These children had median standard scores of almost 90 on three of the four tasks for which normative data were available, within the central range of the national distribution of scores on these tasks. The median standard scores were 89.5 for the Peabody receptive vocabulary task; 88.9 on the WJ-R Letter-Word Identification task; 89.4 on the WJ-R Applied Problems math task; and 86.3 on the WJ-R Dictation prewriting task.
The upper fourth of standard scores for 4-year-old Head Start children were close to the national mean of 100 on all of the four tasks. These values are 98.0 for the Peabody receptive vocabulary task; 97.4 on the WJ-R letter identification task; 98.5 on the WJ-R math task; and 100.6 on the WJ-R prewriting task.
Comparisons With Earlier Research Findings on Low-Income Children
Comparing Head Start children with all preschool-aged children is somewhat misleading, however, as middle-class children benefit from family resources that stimulate early learning. Indeed, the very reason that the Head Start program was begun was to offer similar resources to poor children. Comparisons with earlier research studies suggest that the Head Start children in FACES were performing above the levels that would be expected for children from low-income families who have not attended center-based preschool programs. Earlier studies have found that the standard scores of low-income children without preschool experience on tests like the Peabody Picture Vocabulary Test and similar assessments are typically in the 82 to 85 range (Haskins, 1989; McKey et al., 1985; White, 1985-86). For some especially disadvantaged low-income populations, average scores of preschool children in the high 70's have been reported. For example, in the evaluation study of the Comprehensive Child Development Program recently completed by Abt Associates, average standard scores on the PPVT-R for 1,110 control group children aged 4 years was 77.3 (Abt Associates, 1997). Likewise, for a Philadelphia-based sample of 200 4-year-olds from low-income families who had been exposed to cocaine in utero, standard scores averaged 79 (findings of Hallam Hurt, as reported in Fitzgerald, 1997).
Thus, these comparisons suggest that the cognitive assessment score attained by a typical 4-year-old completing Head Start was 4 to 8 points higher than the score that a 4-year-old from a low-income family would be expected to achieve, if the latter child had no center-based preschool experience. While this difference is relatively modest (one-quarter to one-half a standard deviation), it does fall within the range that has been deemed “educationally meaningful” (Rosenthal & Rosnow, 1984), and is in line with earlier findings on the immediate effects of Head Start on children’s intellectual performance (Haskins, 1989, p. 277; McKey et al., 1985). The standard scores attained by Head Start children in the FACES assessment were also in line with results of prior research in which earlier editions of the PPVT were administered to samples of Head Start children (Mott & Quinlan, 1992; Lee, Brooks-Gunn, & Schnur, 1988). Of course, the samples of children in the earlier studies were smaller and less representative of the national Head Start population.
36

C. Variation in Children’s Cognitive Development Across Head Start Programs
FACES found that there was significant variation in the average assessment performance of children from different Head Start programs. For example, Figure 1.2.2 presents a stem-and-leaf diagram showing the mean standard scores on the PPVT-III for all children assessed in English in each of 38 Head Start programs (two programs in which all children were assessed in Spanish have been excluded). These means included the scores of 3-year-old and 5-year-old Head Start children as well as those of the 4-year-olds discussed above, and the overall average score across all 38 programs was about 88. In the six highest scoring programs, children’s receptive vocabulary scores standardized for age against the national norms averaged 96 to 102. Thus, the average scores in these programs were at or close to national norms.
Figure 1.2.2 The Best Head Start Programs Have Average Assessment Scores at National Norms
102 PG08 100
-Q3- 98 PG02 PG20 96 PG01 PG10 PG11 94
Average 92 PG07 PG09 PG15 PG32 PG33 PG40 PPVT 90 PG25 PG29
Standard Median 88 PG04 PG13 PG17 PG27 PG34 PG35 PG37 Scores 86 PG06 PG12 PG16 PG28 PG39
84 PG38 82 PG18 PG19 80 PG03 PG05 PG14 PG31 PG36
-Q1- 78 PG23 PG26 76 PG30 74 PG21
Mean = 87.6 S.D. = 14.9
Median = 88 Q1 = 78 Q3 = 98
Note: Each character block (e.g., “PG04”) represents one program in the FACES sample.
37

The variance in children’s standardized vocabulary scores was partitioned into four components: 1) that which was attributable to differences across programs; 2) that which was due to differences across centers within programs; 3) that which was attributable to differences across classes within centers; and, finally, 4) that which was due to differences across children within classes. When this was done, by far the largest component was the variation in scores within classrooms, which accounted for some 76 percent of the total variance (Figure 1.2.3). This result, which was parallel to those frequently found in educational research in higher grades, indicates that the majority of the variation in children’s assessment performance is attributable not to what happens in the classroom or school, but to family background factors and individual differences in children’s talents and experiences (Coleman et al., 1966; Jencks et al., 1972, pp. 84-93, 146-148; Bryce and Raudenbush, 1988, 1992).
Figure 1.2.3 There is Significant Variation in Assessment Scores Across Head Start Programs
15%
Within Classes
76%
Across Classes 5%
Across Centers 4%
Across Programs
Percent Distribution of Variance in Children’s Vocabulary Test Scores (Standardized for Age)
Despite the overriding importance of family background and individual student endowments, the FACES analysis showed that there was statistically significant variation in average test scores across Head Start programs, with this component accounting for 15 percent of the total variance. To quote Anthony Bryk and Stephen Raudenbush, “This is consistent with results typically encountered in cross-sectional studies of school effects where 10% to 30% of
38

the achievement variability is between schools” (Bryk & Raudenbush, 1992, p. 188). However, Bryk and Raudenbush also note that the results can be quite different when one looks at differences in learning rates, in which case a much larger portion of the variance may be between schools. There will be opportunity to look at differences in student learning rates across Head Start programs as multiwave data from FACES become available. The variation across programs was larger than that across centers within programs (which amounted to 4 percent of the total). It was also larger than the variation across classes within centers (which amounted to 5 percent of the total variance).
Geographic and Ethnic Variations in Program Assessment Scores
The FACES sample of Head Start programs was stratified by three characteristics: region of the country in which the program was located (Northeast, Midwest, South or West); whether the program was located in an urban or rural area; and whether the program served a student population that was predominantly a minority population in racial and ethnic terms or one which was less than 50 percent minority. Each of these stratification variables proved to be related to the average assessment scores that children in the programs achieved.
Head Start programs in the South had significantly lower average assessment scores than programs in the Midwest, West, or Northeast. For example, the mean standard score on the picture vocabulary test was 84.6 for programs in the South, 88.5 for programs in the Northeast, 90.0 for programs in the West, and 91.6 for programs in the Midwest. (Figure 1.2.4) As in the National Assessment of Educational Progress (NAEP) results for elementary students, the programs that showed the highest scores in the Head Start FACES assessment seemed to be concentrated in the northern tier of states in the Midwest, West, and East (U.S. Department of Education, 1995, 1997).
Demographics Versus Program Quality in Accounting for Achievement Differences
More detailed analyses of the FACES data have revealed that a good deal of the variation in average assessment performance was due to family background differences in the student population of various programs. However, a significant part of the variation across programs seemed to be attributable to differences across programs in the quality of the average classroom environment. Analyses showing the relationship of program quality factors to children’s assessment scores in vocabulary, prereading, early counting and arithmetic skills, and prewriting are summarized in the next section.
The Link Between Classroom Quality and Children’s Development
As described in Part One of this chapter, it was not just the knowledge, skills, and behavior of individual children that were appraised by the data collectors in Head Start FACES. They also observed what went on in the Head Start classrooms they visited and made use of well-established instruments to do standardized ratings of classroom procedures and resources that have been found to be indicators of program quality in other early childhood research. When these classroom quality ratings were compared with the average scores of children in the classes
39

on the assessment tasks, there were significant correlations between the two. Head Start classrooms that received higher ratings on specific aspects of program quality, such as having richer language learning opportunities also had children who performed significantly better on assessment tasks.
Figure 1.2.4 Average Vocabulary Scores Are Lower in the South and in High–Minority Programs
Region
Northeast Midwest South West
Urbanicity
75.0
85.0
95.0
Me
an
PP
VT
Sco
res
75.0
85.0
95.0
Me
an
PP
VT
Sco
res
Urban Rural
Percentage Minority in Program
75.0
85.0
95.0
Me
an
PP
VT
Sco
res
<50% Minority >50% Minority
40

For instance, the ECERS Language Scale gauges the variety and caliber of language learning opportunities observed in a given classroom. Classrooms that received relatively high ratings on this ECERS scale tended to have average standard scores on the receptive vocabulary task and other assessment tasks that were significantly higher than classrooms that received relatively low ratings on this ECERS measure. Specifically, classrooms with ECERS Language ratings greater than 5.5 had median vocabulary scores of 92, whereas classrooms with ECERS ratings less than 4.5 had median vocabulary scores of 85 (Figure 1.2.5).
FIGURE 1.2.5 Vocabulary Scores are Higher in Classrooms with Better Language Instruction
70
75
80
85
90
95
100
PP
VT
Sta
ndar
d S
core
Q1
MEDIAN
Q3
ECLANG ECLANG ECLANG Low (<4.5) Med (4.5-5.5) High (>5.5)
ECERS Language Score
Other aspects of observed classroom quality that correlated with children’s assessment performance on vocabulary, prewriting and early counting and arithmetic skills included the scheduling of the daily program (as gauged by the Assessment Profile Scheduling scale), the richness of the learning environment (as measured by the Assessment Profile Learning Environment scale), the teacher’s sensitivity to children’s interest and feelings (as gauged by the Arnett ratings), and the teacher’s encouragement of self-help and independence (also measured by the Arnett ratings).
41

It was not only the resource and process measures of classroom quality that showed correlations with children’s assessment performance. A broad measure of program exposure --whether the child had spent a second year in Head Start -- also showed positive correlations with assessment scores. After standardization for age, children who had been in the program for more than one year were found to have significantly higher scores on some of the assessment tasks than those who had spent only one year in the program.
Controlling for Family Background and Child Characteristics
A key research question was whether the observed relationships between observed classroom quality and direct assessments of children’s intellectual growth were ‘real,’ or were possibly due to variations across programs and classrooms in the kinds of families and children who were participating in Head Start. The survey results indicated that, even though most families in Head Start had to meet low-income criteria, there was still considerable variation across programs in the concentrations of families with low parent education levels, minority racial or ethnic statuses, and minority language status. The assessment results showed that family background factors did make a difference in children’s assessment performance. For example, children whose mothers had less than a 9th grade education had an average vocabulary standard score of 77, whereas those whose mothers had bachelor’s degrees had a mean score of 93 (Figure 1.2.6).
42
Figure 1.2.6 Vocabulary Scores are Higher when Mothers have More Education
PP
VT
Sta
ndar
d S
core
110
100
90
80
70
60
50
MEAN-(STD/2)
MEAN
MEAN+(STD/2)
No < 9th 9 -11 HS Some Assoc Bachelors Graduate Schooling grade grade Grad/ College Degree Degree Degree
GED
Mother's Education Level

Thus, it was important to try to adjust the differences in average assessment performance for the influence of family background factors (like parent education level, family income, and race and ethnicity) and child characteristics (like the parent-reported child’s disability status). In order to do this, we performed a series of multilevel regression analyses.
Differences in assessment scores (on vocabulary, prereading, math, and prewriting) between children were first adjusted for the age of the child by calculating standard scores that compared the child’s performance to the average performance and variation in performance among children in his or her age group. These standard scores were entered into three-stage hierarchical regression models that simultaneously estimated the contribution of family background, classroom quality, and program characteristics to children’s assessment scores. In Level One of the model, the regression procedure determined how well differences in standard scores across children could be estimated from family background characteristics (parent education level, family income, minority racial or ethnic status) and child’s characteristics (sex of child, disability status of child). In Level Two, the procedure determined how well differences in average assessment scores across classes could be estimated from the quality of the classroom environment, as ascertained by the standard observations and ratings done by the FACES field team. In Level Three, the procedure determined how well differences in average assessment scores across Head Start programs could be estimated from the sampling stratification variables: the region of the country in which the program operated, whether the program operated in a rural or urban area, and the racial and ethnic composition of the participating families (low-minority versus high-minority programs).
The multilevel analyses were performed with data from 1,802, 4- and 5-year-old Head Start children who had taken the English-language assessments and for whom family background information was available from the parent interviews. (Because the Spanish assessment scores have different scale properties, data from children who took the assessment in Spanish are being analyzed separately and will be presented in a later report.) The classroom- and program-level analyses were performed with data from 355 Head Start classrooms in 38 programs containing children who had been assessed with the English-language assessment and for which complete classroom quality observations were available.
The regression analyses showed that family background, program location and composition, and classroom quality all play a part in accounting for variations in what children know and can do at the end of the Head Start year.
43

Assessment Performance Linked To Family SES and Child Disabilities
Even within a predominantly low-income population, the socioeconomic status of the family and the child’s disability status were significantly related to children’s performance on assessment tasks dealing with word knowledge, prereading, early math skills, and prewriting skills. On average, Head Start children whose parents were more highly educated and had higher incomes tended to perform better on these tasks, while minority children and children with identified disabilities did not perform as well. In the model predicting to children’s vocabulary scores, for example, these family and child characteristics accounted for 9 percent of the variance in vocabulary scores between children within programs and classrooms. This was equivalent to a multiple correlation coefficient (eta) of .30.
A Second Year of Head Start Makes A Difference
Another important result of the level-one analyses was that, after standardizing for age and controlling for family and child characteristics, 4-year-old children who were in their second year of Head Start scored nearly two points higher on the vocabulary task and the prewriting task than children who were in their first Head Start year. These differences were small but statistically significant. We should note that Head Start programs sometimes select children who are more in need for their 3-year-old entrants. Thus, the 2-year students are doing better despite the potentially higher risk status of children who enter at 3.
Program-Level Differences In Assessment Performance Persist
The hierarchical regression models showed that substantial differences in average assessment scores across programs of different types remained after family background and classroom quality were statistically controlled. For example, after adjusting for child-level and classroom-level differences, 49 percent of the remaining variation in vocabulary scores across programs was accounted for by region and program ethnic composition. Region and ethnic minority composition accounted for lesser proportions of variance in the other three assessment measures.
On standard-score scales with standard deviations of approximately 15 points, Head Start programs in the South had average assessment scores that were 3-to-4 points lower than children in programs in other regions of the country. Differences among the other regions (Northeast, Midwest, West) were not statistically significant. There were also sizable differences in average scores between low-minority and high-minority programs, although these differences were found on some assessment tasks (vocabulary, early math) and not on others (prereading and prewriting tasks). Even after family background (including race and ethnicity) was controlled at the individual child level, programs with less than 50 percent minority children had average vocabulary scores that were nearly 7 points higher, and average math standard scores that were 4 points higher, than programs in which half or more of the children were black, Hispanic, Asian, or American Indian. Rural-urban differences were inconsistent in direction and not statistically significant (Figure 1.2.7).
44

Figure 1.2.7. Differences in Average Assessment Scores By Program Location and Ethnic Composition
Vocabulary Math Prewriting Prereading
0.9
-0.7
0.2
2.0
-2.1
0.0
-1.4
3.3*
6.7**
4.1**
3.8**
3.8**
Rural vs. Urban
Other Regions vs. South
Low- vs. High-Minority
Adjusted Score Difference
45

Although FACES found substantial differences between types of programs in the level of children’s assessment performance, early analyses of multiwave data from FACES suggest that children in high-minority programs and programs in the South may show significant gains in their assessment scores over the course of the Head Start year. These gains appear to be comparable in magnitude to those found in low-minority programs and programs in other regions of the country. Thus, it is important to wait until the longitudinal data from FACES have been fully collected and analyzed before drawing conclusions about the relative effectiveness of these programs.
Higher Quality Classrooms Show Higher Average Assessment Scores
The hierarchical regression models showed that classroom quality indicators helped account for statistically significant portions of the variation across classes in average assessment scores. This was so even after the influences of family background factors, individual child characteristics, and program location and ethnic composition had been statistically controlled.
Differences across classes in average scores on the vocabulary task were significantly related to the observed sensitivity and responsiveness of the lead teacher (total Arnett score). For each ten-point rise in the Arnett score, there was a corresponding one-point increase in the vocabulary standard score. Thus a change from a teacher with a relatively low Arnett score to one with a high one could be associated with a 3- or 4-point rise in average class vocabulary scores.
In addition, a quality factor score (formed by combining scores on the Assessment Profile Learning Environment and Scheduling Scales with the ECERS Language Scale) was significantly related in an inverse fashion to the slope relating the child’s expected score based on his or her family background to actual vocabulary performance (p < .05). That is, higher classroom quality not only was positively related to the average level of vocabulary scores, it also reduced the importance of family background in explaining vocabulary task performance at the end of the Head Start year. The reduction in the slope could be interpreted to mean that classroom quality may be especially important for children with family risk factors. In the model predicting to children’s vocabulary scores, classroom quality as measured by the quality factor score accounted for 6.4 percent of the variance in average vocabulary scores across classes. This was equivalent to a multiple correlation coefficient (eta) of .25.
The ECERS Language scale was positively related (p < .01) to average class scores on the early math skills task (WJR Applied Problems). The Arnett total score was positively related (p < .05) to average class scores on the prewriting task (WJR Dictation). One classroom characteristic that did not hold up when program location and ethnic composition were controlled was the child:adult ratio.
46

Summary and Implications
In summary, the FACES results to date show that Head Start and other early childhood education programs can make a difference in children’s early intellectual development. The findings point to specific aspects of program quality that seem to be significant for nurturing cognitive and social development. The quality of teacher-child interaction, the learning resources present in the classroom, and the frequency and caliber of language learning opportunities, all seem to have a measurable bearing on children’s demonstrated learning of early literacy and math skills.
At the same time, the FACES results show that exposure to Head Start does not usually eliminate developmental disparities between groups of children that originate in the diverse cultural backgrounds of families, though it may reduce them. At the end of the Head Start year, children in the best programs are at national norms for early literacy and math skills, but children in many programs are not. Of course, the current cross-sectional findings need to be replicated and extended through the longitudinal data collection effort that FACES is now undertaking, and through research being done by the Head Start Quality Research Consortium and other investigators.
The findings with regard to program quality suggest some steps that might be taken to move all Head Start programs toward the excellence demonstrated in the highest quality programs. They suggest that resources per child should be bolstered, especially for programs in the South and those with high concentrations of minority children, to insure that each child benefits from a teacher who is carefully selected and adequately trained and a classroom environment of sufficient quality to nurture early social and literacy skills and enhance the school readiness of Head Start children.
47

2 STRENGTHEN families as the
primary nurturers of their children
Part 3: Who Are the Families Head Start Serves?
"Strengthening families as the primary nurturers of their children" is the second of Head Start's performance objectives. Head Start strengthens families by involving parents in program activities, in program governance, in parent education and in assisting families to meet family needs. This section of the report describes the demographic characteristics of the families in the FACES Spring 1997 sample, selected information on their interactions with their children, their involvement in the Head Start program and their satisfaction with Head Start services.
A. Demographic Characteristics of Head Start Families
Information on the household composition, education level of parents, and employment status, as well as stresses that families encounter such as homelessness and crime, is presented in this section. In addition, the parents' activities with their child, their involvement with the Head Start program, and their satisfaction with Head Start are discussed. All of the information was drawn from the FACES Spring 1997 Parent Interview.4
Weights were constructed so that data collected from a sample of 2,390 families could be used to compute national estimates of the true characteristics of the national population of Head Start families. All data reported in this section are weighted and thus represent these national estimates.
The FACES parent interviews were conducted with the primary caregivers of Head Start children. Nearly all (94 percent) of the respondents were the parents of the child enrolled in Head Start, with most interviews (88 percent) conducted with the biological mother of the Head Start child.
The typical caregiver was:
• Between 21 and 30 years of age at the time of the interview (58 percent of respondents);
• Born in the United States (81 percent); and
• Living in a household of 4 or 5 people (53 percent), although a small proportion (11 percent) lived in households of 7 or more people.
Notably, a significant minority (19 percent) of the primary caregivers (but only 3 percent of Head Start children) was born outside of the United States, and almost one-quarter (23 percent) were interviewed in a language other than English, most often Spanish. This factor increases the complexity of encouraging parent involvement in the Head Start program.
48
4

Figure 1.3.1: Primary Caregivers are Equally Likely to be Married or Single
Single, never married
35%
Married
45%
Married, but separated
7%
13%
Divorced or Widowed
The largest proportion of respondents were married (52 percent, although 7 percent of those were separated). A significant proportion (35 percent) indicated that they were single and had never been married (Figure 1.3.1). Most households had 2 or 3 children (Figure 1.3.2).
49

Figure 1.3.2: Most Head Start Households Have 2 or 3 Children
15%
2 Children
37%
3 Children
26% 21%
1 Child
4 or More Children
In nearly all households (93 percent), the mother of the Head Start child was part of the family. In slightly less than half of the households (46 percent), the father of the Head Start child was present, and in 45 percent of the households both the mother and father were present.
50

Education. About 70 percent of the primary caregivers had attained at least a high school diploma or GED (Figure 1.3.3).
Figure 1.3.3: Most Primary Caregivers Have High School Diploma or Some College
Less than High School
29% Some College
27%
High School Diploma/GED
36%
A.A./B.A.
8%
In addition, more than one-third of the primary caregivers had attended some college, although only a small proportion had obtained an associate's, bachelor's, or higher level degree. Across all primary caregivers, regardless of their educational status, 20 percent were working toward some form of certification, licensure, or attainment of a diploma or degree at the time of the interview. More than half of the fathers living in the household with Head Start children had attained at least a high school diploma or GED. Further, about 20 percent of Head Start children were in households where both the father and mother had obtained at least a high school diploma or GED.
51

Employment. In almost half of the families, one parent was employed either full time or part time (Figure 1.3.4).
Figure 1.3.4: Most Households Have One or Two Parents Employed
0
30%
1
49%
2
21%
This was nearly as likely to be the mother of the Head Start child (51 percent) as the father (49 percent). In 21 percent of families, both parents in the household were employed. Another 22 percent of families received financial support from a father who did not live in the household. When all adult members of the household were considered (i.e., not just the parents of the Head Start child), there were nearly 80 percent of households where at least one person was employed.
Income. The median monthly household income of Head Start families was $1,100.5
Nearly 12 percent of households reported a monthly income of less than $500, while about 15 percent reported more than $2,000 in monthly income.
Monthly income from the parent interview includes all sources of money, including wages from all household members and public assistance. This is a much broader definition of income than the one used to determine eligibility for Head Start.
52
5

Only 16 percent of Head Start households reported receiving no financial or in-kind support at all from outside their home (Figure 1.3.5).
Figure 1.3.5: Most Families Receive Some Form of Assistance
No assistance
Medicaid medical assistance
Food stamps
WIC
Welfare
Child support
Energy assistance
SSI/SSDI
Social Security retirement
Money given to the family
Unemployment insurance
Foster care payment
Loan repayments 1%
2%
3%
6%
7%
13%
15%
20%
32%
48%
51%
59%
16%
0% 10% 20% 30% 40% 50% 60% Percent of Families
In those households, there were usually two or more persons who were employed, most often the mother and the father of the Head Start child. In the remaining households, most families were receiving Medicaid (59 percent), Food Stamps (51 percent), or WIC food supplements (48 percent). Approximately one-third of Head Start families received welfare payments.
53

Housing and Neighborhood Crime
Most families (91 percent) lived in their own house, apartment or trailer. This does not necessarily mean that they own their living space, but only that they were not sharing living quarters with another family. Twenty-two percent of families lived in subsidized housing.
The majority of Head Start families (69 percent) had not moved at all in the year prior to the interview. However, a small percentage of families (8 percent) had moved two or more times during the year prior to the interview. This suggests that, while Head Start families as a group are not highly transient, that a significant number moved frequently. Overall, 8 percent of Head Start families had been homeless at some time since the birth of the Head Start child. During the 1996-97 program year, just under 1 percent of the families in Head Start had been homeless, which, although a small percentage, translates into more than 7,800 homeless children across all Head Start programs.
Head Start families reported a significant amount of crime in their neighborhoods. Twenty-eight percent of primary caregivers reported seeing non-violent crimes, such as stealing or selling drugs, in their neighborhood during the past year, with 20 percent reporting seeing this type of activity more than once (Figure 1.3.6).
Figure 1.3.6: Almost a Third of Families Saw or Heard Violent Crime in Their Neighborhood
S a w n o n -v io le n t c r im e
H e a r d o r s a w v io le n t c r im e
K n o w v ic t im o f v io le n t c r im e
W a s v ic tim o f v io le n t c rim e
V io le n t c r im e in o w n h o m e 3 %
2 %
1 0 %
1 6 %
2 0 %
4 %
4 %
1 5 %
1 4 %
8 %
0 % 5 % 1 0 % 1 5 % 2 0 %
O n c e
M o re t h a n o n c e
P e rc e n t o f F a m i l ie s
Approximately 30 percent of respondents reported they saw or heard violent crime in their neighborhood in the past year, with 16 percent indicating that this happened more than once
54

in the past year. In addition, about one-quarter of primary caregivers reported they know someone who was the victim of violent crime in their neighborhood over the past year.
Violent crime among Head Start families was also reported at significant levels. Just over 5 percent of respondents indicated they were victims of violent crimes in their neighborhood, while 7 percent said they were victims of violent crimes in their homes.
Among Head Start children, 21 percent were reported to have been witness to a crime or domestic violence in their lifetime, while 4 percent were reported to have been a victim of a crime or domestic violence. Since birth, 22 percent of the children had a primary caregiver, other household member, or a non-household biological parent arrested or charged with a crime by the police. In 17 percent of families, one of these individuals spent some time in jail.
B. Family Activities with Children
The majority of Head Start parents involved their children in a variety of activities at home. Within the week, a large majority of caregivers reported taking the child to do errands (95 percent), playing with toys or games indoors (94 percent), involving the child in household chores (92 percent), and talking about what happened in Head Start (91 percent). Slightly fewer parents indicated that someone in the household had taught the child letters or numbers (88 percent), told the child a story (76 percent), played counting games (75 percent), or taught the child songs or music (71 percent). The most popular activities outside the home, reported for the prior month, included visiting a playground or park (84 percent), going to a mall (78 percent), and attending a church activity (58 percent). Mothers were most likely to be involved in these activities, although fathers and other household members were frequently involved as well.
Approximately two-thirds of parents reported that they or someone else in their household read to the Head Start child 3 or more times a week. Only 33 percent of parents indicated that the Head Start child was read to every day in the past week. A small minority of 7 percent reported that no one had read to the Head Start child during the previous week. However, large majorities of parents identified a variety of reading materials that were available in their household for themselves or their children to look at or read: children's books (98 percent), newspapers (78 percent), religious books (77 percent), dictionaries or encyclopedias (77 percent), and magazines for children (62 percent).
C. Parent Involvement in Head Start
An important component of Head Start is the active involvement of parents in all aspects of the program. The primary caregivers interviewed on the FACES parent interview were asked how often they had participated in specific activities during the past Head Start year. In many areas, Head Start parents were quite active in their participation (Table 1.3.1).
55

Table 1.3.1: Most Families Participated in Head Start Activities At Least Once a Year
Percent Participating At
Least Once
Percent Participating More
Than 3 Times Visited with Head Start staff member in own home 89 33 Observed in child’s classroom 80 46 Attended parent-teacher conferences 79 45 Volunteered in child’s classroom 71 46 Prepared food or materials for special events 65 35 Participated in fund raising activities 58 25 Attend parent education meetings or workshops 57 31 Attended Head Start social events 51 23 Helped with field trips or other special events 51 22 Attended Head Start event with other adult 37 13 Attended Head Start event with spouse or partner 34 11 Called or visited another Head Start parent 34 15 Participated in Policy Council or other planning groups 33 15 Prepared or distributed newsletters, fliers, or Head Start materials 25 11
Over three-quarters of respondents indicated that at least once during the prior school year they had visited with a Head Start staff member in their own home, observed in their child's classroom, and attended a parent-teacher conference. Almost half of the respondents indicated that they had participated in these ways 3 or more times. Somewhat fewer, but between half and three-quarters of respondents, reported volunteering in the child's classroom (and 46 percent stated that they participated in these ways 3 or more times), preparing food or materials for special events, attending parent education meetings/ workshops, attending Head Start social events, and helping with field trips.
Even with these high rates of parent involvement, there was a small group of respondents who indicated that they had not yet participated in activities that should have been routinely completed by Head Start staff at this time of year. These include parent-teacher conferences (20 percent) and home visits (16 percent). However, the interview did not ask whether another family member, rather than the respondent, participated at Head Start in these ways.
Recognizing that all parents may not be able to participate in Head Start at the same level, respondents were asked about situations that make it difficult for them to participate in program activities. The most common barriers to participation were work schedules (50 percent), a need for child care (35 percent), lack of transportation (19 percent), and school or training schedules (18 percent).
56

D. Relationships Between Family Characteristics and Parent Involvement
In addition to the barriers cited by respondents, other factors could also affect a parent's ability to participate in Head Start activities. These might include family characteristics, such as the number of children in the household or whether it is a single-parent or a two-parent family. To explore the relationship between family characteristics and parent involvement, we created a parent involvement scale comprised of the parent involvement activities shown in Table 1.3.16
and examined the relationship of scores on this scale to seven demographic characteristics:
• Education level of the primary caregiver; • Two-parent versus one-parent family; • Whether the primary caregiver was employed; • Language spoken at home; • Number of children in the household; • Number of adults in the household who were employed; and • Household income.
The level of parent involvement in Head Start was significantly related to just three of these demographic characteristics: 1) Education level of primary caregiver; 2) Two-parent versus one-parent households; and 3) Whether the primary caregiver was employed.
The creation of one scale of the 14 items was guided by factor analysis and principal component analysis, which both suggested that there was one factor or scale involved. The reliability of the scale was further assessed by calculating Cronbach's alpha, which was .81, indicating that the items correlate highly with the total score. The total parent involvement scores were then standardized to have a mean of 50 and a standard deviation of 10, to aid in the interpretation of the scale.
57
6

As shown in Figure 1.3.7, parents who did not graduate from high school were significantly less involved in Head Start than parents with either a high school diploma/GED or those with some college or other post secondary education. Although the differences on the parent involvement scale appear small for these three groups, they are statistically significant. The difference between those with less than a high school diploma and those with some post secondary education translates into about a third of a standard deviation, which is a moderate difference. The results suggest that Head Start programs may need to extend additional outreach to parents with less than a high school diploma to encourage their involvement in Head Start activities.
Figure 1.3.7: Educated Parents Participate More in Head Start Activities
51% 50% 48%
Greater than High School Diploma or GED Less than High School 0%
10%
20%
30%
40%
50%
60%
58

Figure 1.3.8: Employed Parents Participate Less in Head Start Activities
6 0
5 5
5 0
4 5
4 0
50 % 49 %
N o t e m p lo ye d E m p loye d
Parents who were employed were less involved in Head Start than those who were not working (Figure 1.3.8). Again, this is a small, but statistically significant difference. This finding suggests that Head Start may need to consider flexible scheduling for some parent involvement activities to encourage working parents to attend. This may become more of an issue for Head Start families as the employment and training requirements of welfare reform are initiated.
59

Single parents participated less actively in Head Start than primary caregivers in two-parent families (Figure 1.3.9). Single parents and employed parents may need child care beyond Head Start in order to participate in program activities, a barrier to participation also cited by interview respondents.
Figure 1.3.9: Two-Parent Families Participate More in Head Start Activities
6 0
5 5
5 0
4 5
4 0
5 1%
4 9%
T w o-pa re nt O n e-pa ren t
Among the characteristics of families that were not significantly related to parent involvement, additional analyses were conducted regarding the association of English language ability of the parents of Head Start children and their program participation. First, parent involvement was examined across three groups: 1) parents who speak English as their primary language, 2) parents whose primary language is not English, but who speak and understand English, and 3) parents who do not speak English as their primary language and need someone from Head Start to speak to them in their native language. There was no significant difference in parent involvement among these three groups. Second, fewer than one percent of all interviewed families reported that, although they needed to communicate in their native language, there was no one at Head Start fluent in their language. Taken together, these results are important because they suggest that Head Start has successfully adapted to the language needs of participating families.
60

E. Relationship Between Barriers to Head Start Participation and Parent Involvement
As noted earlier, the four most common barriers to parent participation in Head Start were: work schedules; need for child care; lack of transportation; and school or training schedules. Three of these four factors were significantly related to the level of parent involvement. Parents who indicated that work was a barrier to their participation reported significantly less involvement in Head Start than parents who did not indicate that their work schedules were a barrier. Similarly, parents who indicated that child care and transportation were barriers to participation also reported significantly lower levels of parent involvement. These findings corroborate the need for Head Start programs to be responsive to parents' work schedules and highlight the importance of providing child care and transportation during Head Start activities.
F. Parent Satisfaction with Head Start
Respondents provided highly positive reports regarding their and their children's experiences in Head Start (Figure 1.3.10).
61
Figure 1.3.10: Most Parents Are Very Satisfied with Head Start Services
Maintaining a safe program
Identifying and providing services for child
Supporting and respecting family's culture and background
Helping ch ild to grow and develop
Preparing ch ild to enter kindergarten
Open to parents' ideas and participation
Identifying and providing services that help the family
Helping parent become more involved in groups 63%
6 8 %
80%
82%
87%
88%
88%
90%
Very Satisfied
0 10 20 30 40 50 60 70 80 90 100 Pe rcent o f Families

More than 90 percent of parents reported that they always felt welcome by the teacher, that the teacher was supportive of the parent, that their child is treated with respect by teachers, and that their child always feels accepted by the teacher. In addition, the level of satisfaction with Head Start was consistently high across all areas of the program (Figure 1.3.11).
Figure 1.3.11: Parents Rate The Head Start Experience Very Highly
Parent feels welcomed by the teacher
Child is treated with respect by teachers
Child feels accepted by the teacher
The teacher is supportive of you as a parent
The teacher takes an interest in child
The teacher is warm and affectionate towards child
The teacher seems happy and content
The teacher handles discipline matters easily without being harsh
Child’s teacher is open to new information and learning
Child has been happy in the program
Child feels safe and secure in Head Start
T h e a s s is t a n t t e a c h e r /a id e is w a rm a n d a ff e c t io n a te to w a rd c h i ld
Child gets lots of individual attention 61%
83%
84%
84%
85%
85%
86%
89%
89%
91%
91%
93%
94%
Always
0 10 20 30 40 50 60 70 80 90 100 Percent of Families
Between 85 and 90 percent of parents were very satisfied with Head Start for maintaining a safe program; identifying and providing services for children; supporting and respecting family's culture and background; and helping their child to grow and develop.
62
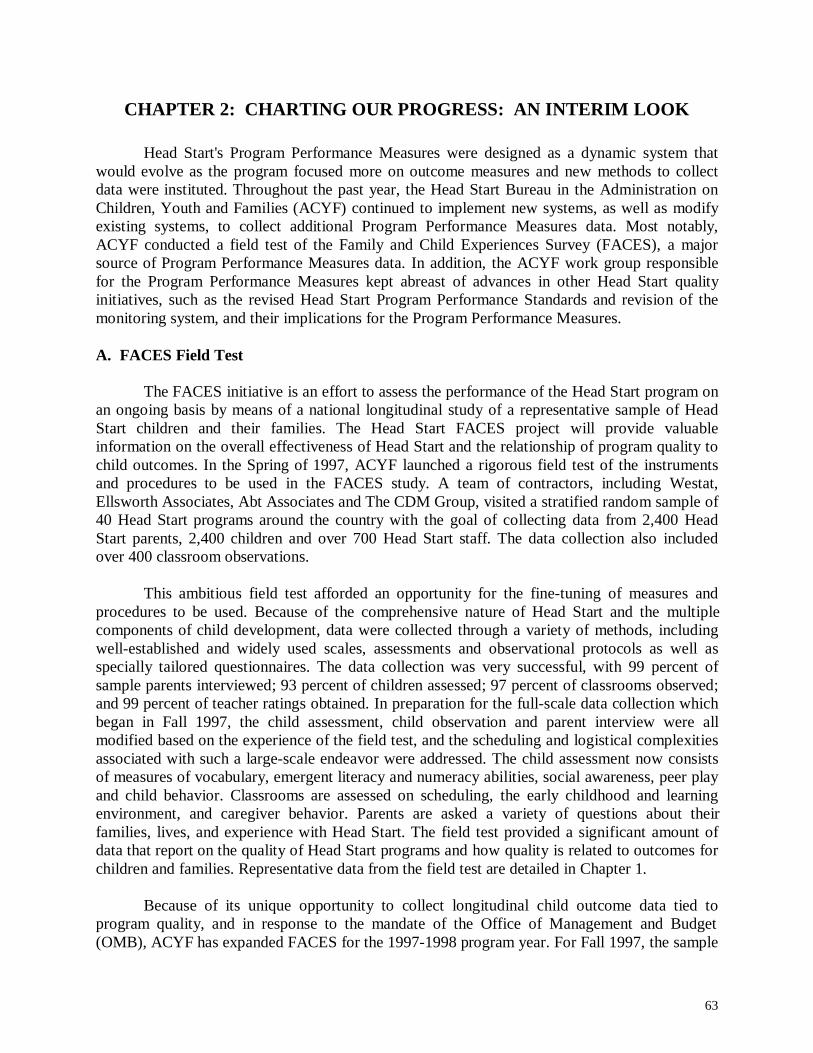
CHAPTER 2: CHARTING OUR PROGRESS: AN INTERIM LOOK
Head Start's Program Performance Measures were designed as a dynamic system that would evolve as the program focused more on outcome measures and new methods to collect data were instituted. Throughout the past year, the Head Start Bureau in the Administration on Children, Youth and Families (ACYF) continued to implement new systems, as well as modify existing systems, to collect additional Program Performance Measures data. Most notably, ACYF conducted a field test of the Family and Child Experiences Survey (FACES), a major source of Program Performance Measures data. In addition, the ACYF work group responsible for the Program Performance Measures kept abreast of advances in other Head Start quality initiatives, such as the revised Head Start Program Performance Standards and revision of the monitoring system, and their implications for the Program Performance Measures.
A. FACES Field Test
The FACES initiative is an effort to assess the performance of the Head Start program on an ongoing basis by means of a national longitudinal study of a representative sample of Head Start children and their families. The Head Start FACES project will provide valuable information on the overall effectiveness of Head Start and the relationship of program quality to child outcomes. In the Spring of 1997, ACYF launched a rigorous field test of the instruments and procedures to be used in the FACES study. A team of contractors, including Westat, Ellsworth Associates, Abt Associates and The CDM Group, visited a stratified random sample of 40 Head Start programs around the country with the goal of collecting data from 2,400 Head Start parents, 2,400 children and over 700 Head Start staff. The data collection also included over 400 classroom observations.
This ambitious field test afforded an opportunity for the fine-tuning of measures and procedures to be used. Because of the comprehensive nature of Head Start and the multiple components of child development, data were collected through a variety of methods, including well-established and widely used scales, assessments and observational protocols as well as specially tailored questionnaires. The data collection was very successful, with 99 percent of sample parents interviewed; 93 percent of children assessed; 97 percent of classrooms observed; and 99 percent of teacher ratings obtained. In preparation for the full-scale data collection which began in Fall 1997, the child assessment, child observation and parent interview were all modified based on the experience of the field test, and the scheduling and logistical complexities associated with such a large-scale endeavor were addressed. The child assessment now consists of measures of vocabulary, emergent literacy and numeracy abilities, social awareness, peer play and child behavior. Classrooms are assessed on scheduling, the early childhood and learning environment, and caregiver behavior. Parents are asked a variety of questions about their families, lives, and experience with Head Start. The field test provided a significant amount of data that report on the quality of Head Start programs and how quality is related to outcomes for children and families. Representative data from the field test are detailed in Chapter 1.
Because of its unique opportunity to collect longitudinal child outcome data tied to program quality, and in response to the mandate of the Office of Management and Budget (OMB), ACYF has expanded FACES for the 1997-1998 program year. For Fall 1997, the sample
63

was increased to include 1,454 entering 3-year-old children; 1,530 entering 4-year-old children; and 613 children returning from the Spring 1997 field test, for a total sample of 3,597 children and their families. Because of possible attrition, it is expected that a final sample of 3,200 children and families will be contacted. In addition, 1,428 children will be followed into kindergarten to examine the longitudinal effects of Head Start.
B. Related Head Start Bureau Quality Initiatives
In addition to the implementation of the Head Start Program Performance Measures and FACES, the Head Start Bureau has undertaken a series of other quality initiatives. Several of these initiatives are closely related to the Program Performance Measures, such as the revision of the Head Start Program Performance Standards and its accompanying guidance, the revision of Head Start's monitoring system, and the modification of the Program Information Report.
Head Start Program Performance Standards
On January 1, 1998, the revised Head Start Program Performance Standards became effective. For the first time, the Standards cover all children from birth through age five, served by both Early Head Start and the Head Start preschool program. As many of the Program Performance Measures are based on the Program Performance Standards, the two initiatives were closely coordinated. The Program Performance Standards have been updated to respond better to the changing needs of children, families and communities, and have been reorganized into three major areas: Early Childhood Development and Health Services, Family and Community Partnerships, and Program Design and Management. The organization of the Program Performance Measures reflects this design. The major updates to the Program Performance Standards include requiring the linking of each child with an ongoing source of medical care, or a medical home. The Family and Community Partnerships area focuses on building respectful relationships with families and strengthening linkages with other agencies in the community. The Program Design and Management section begins with Program Governance and contains new standards to improve management systems and accountability, the qualifications of staff and the support they receive, and the safety of facilities and equipment. Guidance was recently issued to help local programs interpret and implement the standards in their daily practices and routines.
Development of Performance Measures for Early Head Start
The Program Performance Measures, objectives, indicators, and data sources presented in this report focus on the Head Start preschool program for children aged 3 to 5 years. The overarching goal of Head Start (to promote children’s social competence) and the five Program Performance Measures objectives are also valid for the new Early Head Start program for children from birth to age three and their families. However, the specific performance indicators for Early Head Start must be developed to be responsive to the unique processes and outcomes of infant and toddler programs. The Early Head Start Research and Evaluation Project, including national evaluation contractors Mathematica Policy Research and Columbia University and a consortium of 15 local research teams, is currently developing constructs by which to assess the quality and outcomes of Early Head Start programs. This effort will provide an excellent
64

mechanism for developing, testing and refining the specific performance indicators applicable to Early Head Start programs.
Head Start's Monitoring System
At least once every three years, Head Start programs are monitored for adherence to the Program Performance Standards. With the revision of the Program Performance Standards, the Head Start Bureau also undertook a concomitant restructuring of its monitoring system. Using the On-Site Program Review Instrument (OSPRI), monitoring visits until now were focused on ensuring compliance with over 250 specific items dealing with all areas of the programs' services and operations. While still in the design and development phase, the new monitoring system will be structured around a review of key programmatic, management and fiscal systems or functions. The programmatic areas are early childhood development and health services, family and community partnerships and program design and management. A new monitoring instrument also is under development. At this time, several data collection strategies are envisioned for the instrument, including focus groups, interviews, observations and record reviews. As several Program Performance Measures currently derive their data from the Head Start Monitoring and Tracking System (HSMTS) which contains OSPRI data, new developments are being closely monitored by the Program Performance Measures work group. Those responsible for revising the monitoring system regularly brief the Program Performance Measures team on progress, and two members of the Steering Committee of the Quality Research Centers (which also contributes to the work on the Program Performance Measures) serve as members of the technical work group advising the revision of the monitoring system.
Program year 1997-1998 will be a transitional year for Head Start monitoring. Programs scheduled for monitoring will receive a review using an interim instrument, while the Head Start Bureau simultaneously develops and pilots its revised system. The Program Performance Measures will continue to utilize OSPRI data from FY 1997 while it is available, and will plan how data from Head Start's new monitoring system can be incorporated to satisfy Program Performance Measures information needs.
Training and Technical Assistance
In 1997 the Administration for Children and Families, Head Start Bureau competitively awarded 28 Cooperative Agreement grants for Quality Improvement Centers (QICs) to qualified institutions and organizations to provide training and technical assistance (T/TA) to local Head Start programs. This revised T/TA system reflects a national commitment to quality improvement, local capacity-building and ongoing evaluation. In addition, it is consistent with the recommendations discussed in the final report of the Advisory Committee on Head Start Quality and Expansion (1993), the legislative mandates in the Head Start Act of 1994, and also the results of a year long focus group process.
The 28 QICs form a regionally-based system, whose common purpose is to support local Head Start programs in providing high quality and effective services to children and families, and to support national emerging priorities such as child care partnerships, Early Head Start, expansion, and welfare reform.
65

Sixteen of these Cooperative Agreements focus on program service areas of Early Childhood Development and Health, Family and Community Partnerships, Program Design and Management including program governance, facilities, transportation and technology. The other 12 QICs offer Disabilities Services training and technical assistance across all program service areas. The revised T/TA network stresses partnership and flexibility, and a systematic approach to needs assessment, strategic planning, implementation and evaluation. These features will provide QICs with the flexibility to respond quickly to new or emerging issues whether such issues be identified at the Federal, regional or local level.
The T/TA activity cycle is designed to identify local priorities for training, provide a mechanism to set priorities and focus T/TA activity to best meet the needs of the program, coordination to provide T/TA services closer to the Head Start or Early Head Start programs, and regular, on-going assessment of the quality and quantity of T/TA services.
Program Information Report
The Head Start Bureau also continued to streamline its data collection efforts and reduce burden on local programs by modifying the Program Information Report (PIR). This annual report collects program-level data describing the children and families enrolled and the services provided. As the only mandated annual report required of all programs, the PIR is an important vehicle for the collection of Program Performance Measures data. In the past year, the PIR was modified to collect data on additional Program Performance Measures, including staff-turnover for teachers, teacher aides and home visitors as well as the caseloads of family service workers.
Other modifications were made that affected the PIR data used for the Program Performance Measures. The PIR annually collects data regarding medical and dental services provided to children, which are reported as performance indicators. Historically, the survey separately collected the number of children receiving ongoing treatment and the children whose treatment was completed. In an effort to reduce respondent categories, the 1996-1997 PIR collapsed these two categories. This may have caused some confusion among programs. As a result, the medical services reported in 1996-1997 declined by 10 percent, although they had remained fairly constant for the previous five years. Similarly, the dental services reported declined 15 percent in 1996-1997, although they too had remained relatively constant for the past five years. Instructions for these questions will be clarified for the 1997-1998 PIR.
C. Ensure Communication to a Variety of Audiences
One of the important goals of the Program Performance Measures is to ensure communication of the results to local Head Start programs; decision makers in the Head Start Bureau, ACYF and ACF; and other federal agencies. This goal has been achieved through a variety of steps, including disseminating this report; holding briefings for various audiences; and maintaining liaisons with representatives from several federal agencies, including the Department of Education and the Office of Management and Budget (OMB).
66

The publication of results through annual progress reports is a major component of the dissemination strategy. The Progress Reports on the Head Start Program Performance Measures are available via the Head Start Bureau's web page (www.acf.dhhs.gov/programs/hsb) and the Head Start Publication Management Center (fax: 703-683-5769, e-mail: [email protected]). The initiative has also been reported at the National Head Start Association's (NHSA) annual conference. These strategies will continue in the upcoming year, with additional conference presentations planned at NHSA and at Head Start's Fourth National Research Conference.
The FACES team has also held several briefings for Head Start Bureau, ACYF and ACF decision-makers. The goals and objectives of the study, methods, research questions and results were presented, including the quality of Head Start programs, areas of strength and weakness in Head Start classrooms, parent characteristics, child outcomes, and the link between classroom quality and children's development.
Finally, other federal agencies are included in the Program Performance Measures Initiative to the fullest extent possible. Representatives from the Department of Education attend Steering Committee meetings, and OMB was involved in the decisions to increase the scope of FACES. The Quality Research Center Consortium has also been actively involved in the design and implementation of the measures and of FACES, as well as carrying out their own research on Head Start program quality. These ongoing collaborations continue to enhance the implementation of FACES as it collects crucial data on Head Start's performance.
D. Head Start Quality Research Centers
In 1995, the Head Start Bureau funded four Quality Research Centers (QRCs), acting in partnership with local Head Start programs, to work collaboratively with the federal Head Start Bureau in the Administration on Children, Youth and Families to define, assess and verify the effectiveness of high-quality program practices in Head Start programs. The four Centers engage in collaborative work with each other, ACYF and the federal Head Start Bureau in addition to their center-specific work. The four centers are Georgia State University Research Center on Head Start Quality, Georgia State University, Atlanta, Georgia; High/Scope Quality Research Center, High/Scope Educational Research Foundation, Ypsilanti, Michigan; North Carolina Center for Research on Head Start Quality, Frank Porter Graham Child Development Center, University of North Carolina, Chapel Hill, North Carolina; and the New England Quality Research Center, Education Development Center, Newton, Massachusetts with partners at Harvard University and Boston College.
The goals of the collaborative work of the Quality Research Centers are: 1) to support the exploration of important research questions relating to quality program practices; 2) to identify existing measures and to develop, test and refine new measures of program quality and methods of assessing program quality; 3) to develop ongoing databases and analytic strategies useful for examining quality practices in Head Start; 4) to explore linkages among program practices, program quality measures, program performance measures, and observable outcomes for children and families; and 5) to serve as technical advisors to the design, development and implementation of program performance measures, including the FACES study. The work of the four centers is described below.
67

Georgia State University Research Center on Head Start Quality
The Georgia State University (GSU) Quality Research Center (QRC) is working in partnership with Concerted Services Head Start (Waycross, GA), Ninth District Opportunity Head Start (Gainesville, GA), and Jefferson County Committee for Economic Opportunity Head Start (Birmingham, AL) to address the influences on quality and the impact of quality on children and families. The partnerships are facilitated by the GSU Site Coordinators who are employed full time on the GSU research project and provided office space at the three Head Start partners. These partnerships involve full cooperation and participation of the Head Start programs and their staff in all research activities. The GSU QRC research questions, activities and findings include:
1) What teacher characteristics, teacher beliefs and classroom structural factors are associated with classroom quality?
Teachers' education level, teacher beliefs, instructional activities, classroom structure, attitudes toward Head Start families, and quality of classroom teaching practices were examined in this research. It was found that the teachers' educational level and teacher beliefs had indirect effects on quality through instructional activities, whereas the classroom structure impacted the quality of classroom teaching practices directly. Both the teachers' educational level and the quality of classroom teaching practices impacted the teachers' attitudes toward Head Start families.
2) Is the quality of classroom teaching practices associated with child outcomes?
The relationship between the quality of classroom teaching practices and population density was examined. The research findings suggest that for families in low density areas, both the Head Start children and their parents scored higher on their respective literacy measures when they were part of a high quality classroom as opposed to a low quality classroom.
3) What parent and family characteristics are associated with child outcomes? What indicators of classroom quality are associated with child outcomes?
A developmental checklist used to assess individual children's progress was completed by the Head Start teachers at the beginning and end of the year. The research findings suggest that teachers who are better able to tailor the classroom activities to the individual needs of particular children are also better able to overcome the potentially limiting effects of age on the developmental checklist scores at the beginning of the year. The research findings using the Head Start teachers' rating of child behavior are also of interest. This research indicates that the classrooms with more planful teachers moderate the influence of maternal depression on children's disruptive behavior. In addition, classrooms with more planful teachers help children to generalize the positive behaviors learned in Head Start to other settings. These findings are very encouraging and illustrate subtle and indirect, yet important connections, between the quality of classroom teaching practices and children's social development.
68

4) Are staff perceptions of program policies and procedures associated with program quality?
The development of the Head Start Policy and Program Management Survey has involved qualitative interviews with administrators, parents, and teachers, and several pilot studies. This instrument addresses: Communication, Workload and Self Development, Clarity of Policies, Hiring and Retention, Support, and Management Climate.
5) Are characteristics of the family services workers associated with child and family outcomes?
This research activity was initiated with a literature search and qualitative data from three focus groups of Head Start family services workers. Several themes emerged as important factors in relation to the family service worker and instruments to assess these factors have been identified and field-tested. In addition, 18 family risk variables from the Parent Interview data have been identified and will be used to examine the relationship between family risk levels and family service worker loads and contact hours.
Papers reporting these research findings are being presented at the American Educational Research Association Conferences, the National Head Start Association Annual Conference, the National Association for the Education of Young Children Annual Conference, and Head Start‘s National Research Conference. GSU's Head Start partners will be helpful in making the dissemination efforts both relevant and useful to Head Start audiences.
High/Scope Quality Research Center
The High/Scope QRC, located at the High/Scope Foundation in Ypsilanti, Michigan, has two major foci in studies being conducted with its Head Start agency partners. Head Start partners include City of Detroit Department of Human Services Head Start in Detroit, MI; Wayne County Regional Education Services Agency in Wayne, MI; Oakland-Livingston Human Services Agency in Pontiac, MI; Southfield Public Schools in Southfield, MI; and Capital Area Community Services in Lansing, MI. One major research focus is on the contributions of naturalistic assessments of Head Start programs and their influences on children and families. The High/Scope Child Observational Record (COR) — an observational assessment of children engaged in spontaneous activities in their natural program setting — is being examined along with several more traditional methods of child assessments. The High/Scope Head Start Program Quality Assessment (PQA) is a comprehensive observational and interview instrument on Head Start's comprehensive services for children and families. The PQA was developed from previous High/Scope program assessment instruments and the Head Start Program Performance Standards and evaluation approach. The High/Scope QRC is gathering data from Head Start programs on the relationship between the PQA and other approaches often used in early childhood program evaluations.
A second major focus of the High/Scope QRC is on the role of staff development in promoting program quality and children's development, based in part on previous High/Scope research. Although Head Start is a leader in supporting inservice training, there is limited knowledge about which kinds of staff development best support effective program practices. To
69

date, the overall picture emerging from these studies emphasizes the importance of staffing issues in implementing high quality early education programs. Extending other studies on general education versus specialized early childhood training, the High/Scope QRC has found teaching staff in public school and nonprofit settings to have more formal education whereas Head Start staff more often have early childhood degrees. Unlike previous studies, High Scope's current data show that experience, over and above formal education and training, is a significant predictor of program quality.
Also intriguing are recent findings on effective inservice training practices. The training methods most positively associated with good program quality included curriculum-centered training, hands-on learning experiences, classroom observation and feedback to teachers, and continuity and follow-up by a consistent trainer. In Head Start and other early childhood programs, training was most often conducted using an "expert-of-the-month" model - a series of experts lecturing staff on varied topics, without opportunities for follow-up assistance for implementation.
North Carolina Center for Research on Head Start Quality
The NCQRC, located at the University of North Carolina's Frank Porter Graham Child Development Center and the Department of Maternal and Child Health in the School of Public Health, is working with four Head Start partners in central North Carolina, including Franklin Vance Warren Head Start in Henderson, NC; WAGES Head Start in Goldsboro, NC; Chapel Hill-Carrboro Head Start in Chapel Hill, NC; and Wake Orange Chatham Head Start in Raleigh, NC. The NCQRC is studying several questions related to quality in Head Start: What is "quality" in the service delivery domains of education, health, family services, parent involvement? How can quality best be measured? How do different measures relate to each other? How does quality relate to child and family outcomes? What types of measurement are helpful for Head Start programs to use in their own evaluation efforts?
In the first year (1995-96) the NCQRC conducted 12 focus groups of Head Start parents, teachers, coordinators and family service workers to examine their definitions of "quality.” The NCQRC learned about the characteristics that all groups believe to be important for a good Head Start program and some characteristics that particular groups deem more important than others. In the second year, the NCQRC used many different sources of information to measure the quality of programs in different domains, including observations of classrooms, interviews with parents, and staff surveys. This information, along with child assessments, were the pilot work for designing and finalizing the year 3 studies of quality interrelationships and the relations of quality to child and family outcomes.
In the current year 3 research, the NCQRC staff are interviewing over 200 families, assessing over 250 children, and surveying all staff from the four programs in both the fall and spring to find out how different aspects of quality relate to each other and to child and family outcomes. These data will help answer questions as to whether some dimensions of quality are highly correlated, whether overall quality or specific dimensions of quality are likely to influence parent and child outcomes, and whether the overall quality of a Head Start program makes more difference for some types of families and children than others. The NCQRC is also collecting
70

information about parent involvement in the classrooms, parent education via parent meetings, and volunteer activities to gain detailed information about the parental involvement component of Head Start. Extensive child attendance data were also collected from all classrooms, day by day, to examine the amount of turnover in these four programs. This information is important because the intensity of treatment (i.e., attendance) may be a mediator of the effects of program quality.
In year 4, the extensive data gathered in the current year of the study will be analyzed and reported to both scientific and practitioner communities. The NCQRC's Head Start partners will be helpful in guiding the form and content of the dissemination activities needed to make the information user-friendly for Head Start audiences. In years 4 and 5, the feasibility of Head Start staff's use of quality measures will be examined. This will involve modifying existing measures for self-assessment, studying the types and amount of training needed for Head Start staff to use these measures successfully, and conducting validity and reliability studies of both the measures and their use.
New England Quality Research Center
The New England Quality Research Center (NEQRC) is located at the Center for Children & Families at Education Development Center (EDC) in Newton, Massachusetts and includes three research partners, Harvard's Graduate School of Education, Boston College, and the Massachusetts Society for the Prevention of Cruelty to Children. The NEQRC is working closely with four Head Start partners, Community Action Program Inter-City (based in communities north of Boston), Communities United, Inc. (based in communities west of Boston), Community Teamwork, Inc. (based in Lowell), and Cambridge Head Start. The NEQRC is examining four major questions:
1) What is the quality of the different aspects of Head Start programs (classrooms, management practices, provision of social services) as determined by varied measures of program quality?
2) How is the development of children affected by variations in the quality of the Head Start program they attend in the short term (one year) and after they enter kindergarten?
3) How does variation in program quality affect parent's child-rearing, engagement with the program, and progress toward meeting their personal goals?
4) How does the child's and family's linguistic and cultural background affect patterns of child development and the family engagement and benefits from participating in Head Start?
The NEQRC is developing tools to assess multiple aspects of program quality. To examine details of teacher-child interaction, the Teacher-Child Verbal Interaction Profile was developed. The Language and Culture Questionnaire is being developed to examine beliefs and practices important for considering how teachers work with children from linguistically and culturally diverse backgrounds. The NEQRC has developed the Information and Management Practices Inventory to describe management practices related to information management and
71

decision-making. Finally, NEQRC is devising a tool to examine how family service workers respond to the needs of diverse families, the Family Services Language and Culture Survey.
The NEQRC also has developed tools to assess children's development. The Profile of Early Literacy Development assesses early print knowledge and phonemic awareness and Naming Categories assesses children's ability to use language to categorize objects. Both of these tools have been developed for use in English and Spanish. The NEQRC also developed a teacher rating tool, the Teacher Evaluation of Language & Literacy Development. Finally, with the partners at BC, the Bronson Social Task Skill Profile was revised for use in Head Start. The Bronson Profile is an observational tool that examines children's social and mastery orientation.
Research is being carried out in 40 classrooms with 250 children in the four Head Start programs with whom NEQRC is working closely. Fall and spring data are being collected on children's language, literacy, and social development using individually administered assessments, an observational tool and teacher ratings. The language development of children whose first language is Spanish is being assessed in both English and Spanish. Parents' child rearing practices, need for services and progress toward economic self-sufficiency is being determined through fall and spring interviews. During the winter, classroom quality is being assessed through three days of data collection using observational tools that assess overall quality, teacher sensitivity and responsiveness, and the nature of teacher-child conversations. Program quality will also be assessed using surveys that examine management practices and efforts of the social service workers. Next year children who enter kindergarten will be tracked and their progress assessed.
E. Future Plans for the Measures Initiative
In the coming year, the availability of additional data from several sources will greatly enhance Head Start's ability to assess the quality of its programs and its effects on children and families. The Fall 1997 to Spring 1998 FACES data analysis will be available in late 1998. Through its pre-post study design, FACES will provide the most comprehensive measure of the progress Head Start children make on the largest sample in 35 years. In addition to child development, FACES will also provide information on changes in family experiences and behaviors over the year. It will also further assess the quality of Head Start classrooms, teachers, and programs. This will produce an extremely rich database for examining the many relationships between program quality and child and family development.
The Quality Research Centers will continue to collect and analyze data on their examinations of Head Start quality in their specific areas of interest.
The revision of the Head Start monitoring system will be completed and implementation will begin. This should provide Head Start with an increasingly reliable assessment of the performance of all Head Start programs while reducing program burden and cost.
The PIR will also undergo revision to respond to national topics of interest, as well as to revise questions for consistent response by all Head Start programs each year.
72

As with this report, the additional information to be provided next year will enable Head Start to objectively review its program performance, strategically plan for future investments, and respond to identified program needs to serve low-income families with young children better. Head Start is right on target in implementing its strategic plan for making Program Performance Measures an integral part of the program. Most importantly, it has developed and refined a multi-source system of data collection which will continue to contribute to a better understanding of the strengths and needs of the children and families served by Head Start.
73

CHAPTER 3: MATRIX OF MEASURES AND INDICATORS
Chapter 1 presented FACES outcome and process data that address three objectives of the Performance Measures Conceptual Framework: Objective 1: Enhance children's healthy growth and development; Objective 2: Strengthen families as the primary nurturers of their children; and Objective 3: Provide children with educational, health and nutritional services. In this chapter process data from the PIR and HSMTS are presented for Objectives 2 and 3; Objective 4: Link children and families to needed community services; and Objective 5: Ensure well-managed programs that involve parents in decision-making. The matrix of Head Start Program Performance Measures identifies each specific measure, the indicator of performance on that measure, the data source, and data from two years of program operations (1996 and 1997).
The matrix presents all of the Program Performance Measures data that are currently available from the PIR and HSMTS for 1996 and 1997. The PIR (Program Information Report) is a self-reporting program level data system through which data are submitted by every Head Start program to the Head Start Bureau at the end of each program year. The PIR contains data on children and families served, services delivered, staff characteristics, and issues of special interest to the Bureau, such as facilities operated. The Head Start Monitoring and Tracking System (HSMTS) contains data collected by Head Start monitoring teams. Each program is monitored on-site every three years, so data for each year of HSMTS represent only one third of the programs. Data are collected using the On-Site Program Review Instrument (OSPRI) which rates whether programs are in or out-of-compliance with program standards. As the Head Start monitoring system and data collection instrument are currently under revision, Program Year 1997-98 will be one of transition from the old to the new system. HSMTS data for 1997 will be the last data reported under the old system.
Many of the items in the Performance Measures Matrix will be obtained from the Family and Child Experiences Survey (FACES) Fall 1997 and Spring 1998 data collection, and so will not be available until the next Head Start Program Performance Measures Report. The availability of data from these two time periods will provide information on progress made by children and families over the Head Start year. Those items in the Performance Measures Matrix with data sources identified as child assessments, classroom observations, parent interviews, teacher ratings, or staff interviews will be obtained from FACES.
74

HEAD START PROGRAM GOALS, OBJECTIVES, MEASURES, INDICATORS AND DATA SOURCES
ULTIMATE GOAL: To bring about a greater degree of social competence in preschool children from low-income families
OBJECTIVE 1: ENHANCE CHILDREN'S GROWTH AND DEVELOPMENT
PERFORMANCE MEASURE PERFORMANCE INDICATOR Percent of change in:
DATA SOURCE 1996 DATA 1997 DATA
1. Head Start children demonstrate improved emergent literacy, numeracy, and language skills
Head Start children's emergent literacy
Child assessment, parent interview, teacher ratings
Not available FACES field test data in Chapter 1. Pre-post data to be provided from FACES in 1999
Head Start children's language skills Child assessment, parent interview, teacher ratings
Not available FACES field test data in Chapter 1. Pre-post data to be provided from FACES in 1999
Head Start children’s numerical skills Child assessment, parent interview, teacher ratings
Not available FACES field test data in Chapter 1. Pre-post data to be provided from FACES in 1999
2. Head Start children demonstrate improved general cognitive skills
Head Start children's general memory, reasoning, and problem solving
Child assessment, parent interview, teacher ratings
Not available FACES field test data in Chapter 1. Pre-post data to be provided from FACES in 1999
Head Start children's musical ability and creativity
Teacher ratings Not available To be provided from FACES in 1999
3. Head Start children demonstrate improved gross and fine motor skills
Head Start children's gross and fine motor skills
Child assessment, parent interview, teacher ratings
Not available FACES field test data in Chapter 1. Pre-post data to be provided from FACES in 1999
75

PERFORMANCE MEASURE PERFORMANCE INDICATOR Percent of change in:
DATA SOURCE 1996 DATA 1997 DATA
4. Head Start children demonstrate improved positive attitudes toward
Head Start children's initiative and attitudes toward learning
Teacher ratings Not available To be provided from FACES in 1999
learning Head Start children's task mastery Parent interview,
classroom observation Not available To be provided
from FACES in 1999
5. Head Start children demonstrate improved social behavior and
Head Start children's positive social behavior and behavior problems
Parent interview, teacher ratings
Not available To be provided from FACES in 1999
emotional well-being Head Start children's social interaction with peers
Parent interview, classroom observation
Not available To be provided from FACES in 1999
6. Head Start children demonstrate improved physical health
The extent to which Head Start children experience normal height and weight growth rates
Record Reviews Not available Not currently collected
76

OBJECTIVE 2: STRENGTHEN FAMILIES AS THE PRIMARY NURTURERS OF THEIR CHILDREN
PERFORMANCE MEASURE PERFORMANCE INDICATOR Percent of change in:
DATA SOURCE 1996 DATA 1997 DATA
7. Head Start parents demonstrate improved parenting skills
Head Start children's home environment safety
Parent interview Not available To be provided from FACES in 1999
Head Start children’s learning environment in the home
Parent Interview Not available To be provided from FACES in 1999
Head Start parents’ limit-setting and disciplinary methods
Parent Interview Not available To be provided from FACES in 1999
8. Head Start parents improve their self-concept and emotional well-being
Head Start parents’ sense of control over their own lives
Parent Interview Not available To be provided from FACES in 1999
Head Start parents’ depression Parent Interview Not available To be provided from FACES in 1999
Head Start parents’ social support network
Parent Interview Not available To be provided from FACES in 1999
9. Head Start parents make progress toward their educational, literacy, and employment goals
Head Start parents’ receipt of needed employment, job training, education, and literacy services
Parent interview Not available To be provided from FACES in 1999
Of the total number of paid staff or volunteers, the number and percent who are current or former Head Start parents
PIR 44,350 of 147,535 Head Start staff (30%) are current or former Head Start parents
46,364 of 147,473 Head Start staff (31%) are current or former Head Start parents
77

OBJECTIVE 3: PROVIDE CHILDREN WITH EDUCATIONAL, HEALTH, AND NUTRITIONAL SERVICES
PERFORMANCE MEASURE PERFORMANCE INDICATOR DATA SOURCE 1996 DATA 1997 DATA
10. Head Start programs provide developmentally appropriate educational environments
Measurement of Head Start programs’ classroom physical environments including space, equipment, and materials
Classroom observation Not available FACES field test data in Chapter 1. Pre-post data to be provided from FACES in 1999
The extent to which Head Start program activities are varied and well-planned
Classroom observation Not available FACES field test data in Chapter 1. Pre-post test data to be provided from FACES in 1999
Measurement of Head Start programs’ opportunities for child choice and self-initiated learning
Classroom observation Not available FACES field test data in Chapter 1. Pre-post data to be provided from FACES in 1999
Measurement of parents’ satisfaction with the helpfulness of Head Start services and support
Parent interview Not available To be provided from FACES in 1999
11. Head Start staff interact with children in a skilled and sensitive manner
Measurement of teachers’ facilitation of children’s cognitive, linguistic, social, emotional, and physical development
Classroom observation Not available FACES field test data in Chapter 1. Pre-post data to be provided from FACES in 1999
Measurement of Head Start teachers’ emotional tone of adult-child interaction
Classroom observation Not available FACES field test data in Chapter 1. Pre-post data to be provided from FACES in 1999
78
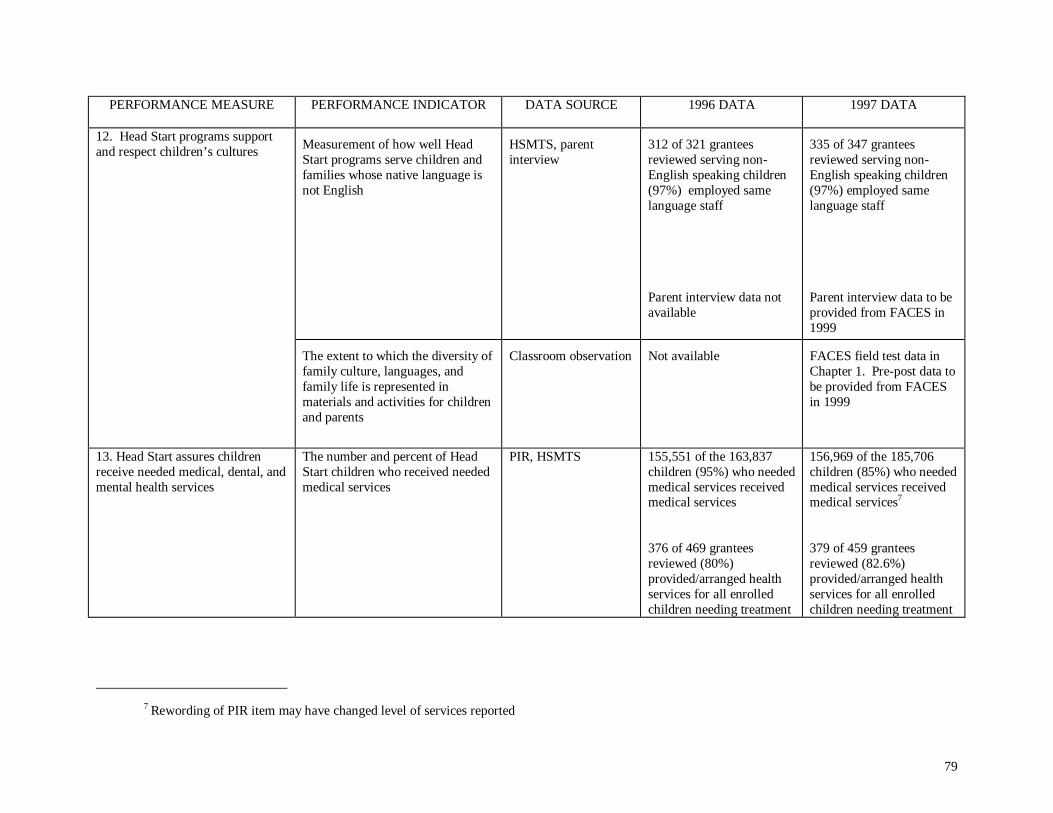
PERFORMANCE MEASURE PERFORMANCE INDICATOR DATA SOURCE 1996 DATA 1997 DATA
12. Head Start programs support and respect children’s cultures Measurement of how well Head
Start programs serve children and families whose native language is not English
HSMTS, parent interview
312 of 321 grantees reviewed serving non-English speaking children (97%) employed same language staff
Parent interview data not available
335 of 347 grantees reviewed serving non-English speaking children (97%) employed same language staff
Parent interview data to be provided from FACES in 1999
The extent to which the diversity of family culture, languages, and family life is represented in materials and activities for children and parents
Classroom observation Not available FACES field test data in Chapter 1. Pre-post data to be provided from FACES in 1999
13. Head Start assures children receive needed medical, dental, and mental health services
The number and percent of Head Start children who received needed medical services
PIR, HSMTS 155,551 of the 163,837 children (95%) who needed medical services received medical services
376 of 469 grantees reviewed (80%) provided/arranged health services for all enrolled children needing treatment
156,969 of the 185,706 children (85%) who needed medical services received medical services7
379 of 459 grantees reviewed (82.6%) provided/arranged health services for all enrolled children needing treatment
7 Rewording of PIR item may have changed level of services reported
79

PERFORMANCE MEASURE PERFORMANCE INDICATOR DATA SOURCE 1996 DATA 1997 DATA
13. Head Start assures children receive needed medical, dental, and mental health services (continued)
The number and percent of Head Start children who received needed dental services
PIR 206,795 of the 220,676 children (94%) who needed dental services received dental services
179,403 of the 226,761 children (79%) who needed dental services received dental services8
The number and percent of Head Start children who received needed mental health services
PIR 20,628 of the 27,353 children (75%) who needed mental health services received mental health services
30,610 of the 39,980 children (77%) who needed mental health services received mental heath services8
The number and percent of Head Start children who received needed immunizations
PIR 786,997 of 838,496 children (94%) received needed immunizations
790,178 of 841,170 children (94%) received needed immunizations
14. Head Start children receive meals and snacks that meet their daily nutritional needs
The number and percent of children who received meals and snacks meeting their nutritional needs
HSMTS 250 of 264 grantees reviewed (95%) were providing required meals and snacks
253 of 268 grantees reviewed (94%) were providing required meals and snacks
8Rewording of PIR item may have changed level of services reported
80

PERFORMANCE MEASURE PERFORMANCE INDICATOR DATA SOURCE 1996 DATA 1997 DATA
15. Head Start programs provide individualized services for children with disabilities
Measurement of how well Head Start serves children with disabilities:
a. Number and percent with Individualized Education Plans (IEPs)
b. Number and percent receiving services in their IEPs
c. Number and percent fully engaged in program activities
PIR, HSMTS, classroom observation
a. Data not collected in 1996 PIR
a. 377 of 469 grantees reviewed (80%) had an IEP for every child with a disability
b. 413 of 469 grantees reviewed (88%) provided special education and related services as soon as possible after the IEP meeting
c. Not available
a. 95,071 of 107,473 children with disabilities (88%) had IEPs
a. 398 of 459 grantees reviewed (87%) had an IEP for every child with a disability
b. 411 of 459 of grantees reviewed (90%) provided special education and related services as soon as possible after the IEP meeting
c. FACES field test data in Chapter 1. Pre-post data to be provided from FACES in 1999
Percent of Head Start parents who are able to better meet the special needs of their children with disabilities because of Head Start
Parent interview Not available To be provided from FACES in 1999
81

PERFORMANCE MEASURE PERFORMANCE INDICATOR DATA SOURCE 1996 DATA 1997 DATA
16. Head Start parents link with social service agencies to obtain needed services
The ratio of the total number of Head Start families to the number of family service workers
PIR Not included in 1996 PIR 17,445 family service workers to 781,836 Head Start families provide a 1/45 ratio of family service workers to families
The extent to which parents received needed social services (e.g., child care, WIC, housing assistance)
Parent interview Not available To be provided from FACES in 1999
17. Head Start parents link with educational agencies to obtain needed services
The extent to which parents received needed educational services (e.g., GED classes)
Parent interview, staff interview
Not available To be provided from FACES in 1999
Measurement of how well Head Start helped parents and children make the transition from Head Start to kindergarten (e.g., talking to kindergarten teachers, visiting the new school)
Parent interview, staff interview
Not available To be provided from FACES in 1999
82

PERFORMANCE MEASURE PERFORMANCE INDICATOR DATA SOURCE 1996 DATA 1997 DATA
18. Head Start parents link with health care services to obtain needed care
The number and percent of parents who report that they and their children have an ongoing source of continuous, accessible health care (i.e., a medical home)
Parent interview, staff interview
Not available To be provided from FACES in 1999
The extent to which parents secured needed health services (e.g., child immunizations, mental health services)
Parent interview Not available To be provided from FACES in 1999
19. Head Start parents secure child care in order to work, go to school, or gain employment training
The number and percent of Head Start programs providing child care
PIR 551 of 2,011 Head Start programs (27%) provided child care
772 of 1,972 Head Start programs (39%) provided child care
Of the Head Start programs that do not provide child care to Head Start children, the number and percent of Head Start programs providing linkages to child care
PIR, Parent interview 498 of 2,011 Head Start programs (25%) were providing linkages to child care
Not available
PIR data not collected on this item in 1997: will be available in 1998 by family
Parent interview data to be provided from FACES in 1999
The number and percent of Head Start parents who report they have stable child care services
Parent interview Not available To be provided from FACES in 1999
83

OBJECTIVE 5: ENSURE WELL-MANAGED PROGRAMS THAT INVOLVE PARENTS IN DECISION-MAKING
PERFORMANCE MEASURE PERFORMANCE INDICATOR DATA SOURCE 1996 DATA 1997 DATA
20. Head Start programs are well-managed The number and percent of
programs using a financial management system that ensures budget management; maintains control over current operations; and provides timely, accurate, current, and complete disclosure of financial matters
HSMTS 411 of 469 grantees reviewed (88%) had appropriate financial management systems
408 of 459 grantees reviewed (89%) had appropriate financial management systems
The number and percent of programs that performed annual self-assessments
HSMTS 402 of 469 grantees reviewed (86%) conducted annual self-assessments
415 of 459 grantees reviewed (90%) conducted annual self-assessments
Head Start staff ratings of how important program goals regarding meeting parent needs are to staff (e.g. to teach parents about health and nutrition)
Staff interview Not available To be provided from FACES in 1999
The number and percent of programs that conducted a Community Assessment (CA) and used the information from the CA for planning purposes
HSMTS 374 of 469 grantees reviewed (80%) conducted CAs and used the information for planning purposes
366 of 459 grantees reviewed (80%) conducted CAs and used the information for planning purposes
84

PERFORMANCE MEASURE PERFORMANCE INDICATOR DATA SOURCE 1996 DATA 1997 DATA
21. Head Start parents are involved actively in decisions about program operations
The number and percent of programs that met all of the criteria regarding effective parent participation in the process of making decisions about the nature and operation of Head Start
HSMTS 307 of 469 grantees reviewed (65%) met all criteria for effective parent participation in decision-making
336 of 459 grantees reviewed (73%) met all criteria for effective parent participation in decision making
The extent to which parents influence Head Start programs
Parent interview Not available To be provided from FACES in 1999
22. Head Start programs employ qualified staff
The number and percent of classroom teachers with a degree in Early Childhood Education (ECE), a Child Development Associate (CDA) credential, a State-awarded preschool certificate, or a degree in a field related to ECE plus a State-awarded certificate
PIR, staff interview 30,016 of 35,644 Head Start teachers (84%) had early childhood credentials
32,152 of 35,707 Head Start teachers (90%) had early childhood credentials
FACES field test data in Chapter 1. Staff interview data to be provided from FACES in 1999
The number and percent of home-visitors with a degree in child and family studies, adult education, home economics, psychology, or social work; a degree in ECE; or a home-visitor CDA
PIR 2,840 of 4,809 home visitors (59%) had appropriate credentials
2,739 of 4,276 home visitors (64%) had appropriate credentials
85

PERFORMANCE MEASURE PERFORMANCE INDICATOR DATA SOURCE 1996 DATA 1997 DATA
22. Head Start programs employ qualified staff (continued) The number and percent of
programs operating center-based or combination center/home-based options that employ at least two paid staff per classroom and maintain appropriate class sizes for the ages of the children served
HSMTS, classroom observations
422 of 464 grantees reviewed (91%) maintained appropriate staffing and class size
404 of 459 grantees reviewed (88%) maintained appropriate staffing and class size;
FACES field test data in Chapter 1. Additional class size and adult:child ratio data to be provided from FACES in 1999
The number and percent of programs operating home-based options that maintain an average caseload of 10 to 12 families per home visitor and no more than 12 families for any home visitor
HSMTS 177 of 184 home based grantees reviewed (96%) had appropriate caseloads for home visitors
163 of 171 home-based grantees reviewed (95%) had appropriate caseloads for home visitors
86

PERFORMANCE MEASURE PERFORMANCE INDICATOR DATA SOURCE 1996 DATA 1997 DATA
22. Head Start programs employ qualified staff (continued) The extent to which Head Start staff
salaries are equitable with national averages
PIR, National Center for Early Childhood Workforce
Head Start staff Directors-$39,460 Teachers-$17,104 Aides-$10,824 Home Visitors-NA
Head Start staff Directors-$40,688 Teachers-$17,771 Aides-$11,243 Home Visitors-$15,227
NCECW Data available only for teaching staff. In 1994 dollars, average child care teaching staff earned $11,725 per year for a 50 week year
Earnings for teaching staff by educational level HS Diploma- $10,151 Some college $11,617 College Degree $14,506
Of the total number of staff, length of service and number and percent who left the program and were replaced
PIR, staff interview Not collected in 1996 Of 147,473 total staff, 12,143 (8%) were replaced during the operating year
Staff interview data to be provided from FACES in 1999
87

PERFORMANCE MEASURE PERFORMANCE INDICATOR DATA SOURCE 1996 DATA 1997 DATA
22. Head Start programs employ qualified staff (continued) The extent to which Head Start staff
receive appropriate ongoing training and staff development
HSMTS, staff interview 428 of 469 grantees reviewed (91%) provided staff and parent training in child development
Not available
408 of 459 grantees reviewed, (89%) provided staff and parent training in child development
Staff interview data to be provided from FACES in 1999
23. Head Start programs support staff development and training
The extent to which Head Start programs provide ongoing and effective staff development and training activities
HSMTS, staff interview 428 of 469 grantees reviewed (91%) provided appropriate staff development and training;
Not available
423 of 459 grantees reviewed (92%) provided appropriate staff development and training
Staff interview data to be provided from FACES in 1999
The extent to which Head Start programs maintain a positive organizational climate that offers administrative and peer support and teamwork
Staff Interview Not available To be provided from FACES in 1999
24. Head Start programs comply with Head Start regulations
Of the programs identified as having significant performance problems, the number and percent that have corrected their deficiencies or have been replaced
Regional Office Reports
120 grantees were identified as having deficiencies and were working on Quality Improvement Plans. Since October 1993, 65 programs had relinquished their grants or been terminated
92 grantees were identified as having deficiencies and were working on Quality Improvement Plans. Since October 1993, 90 programs had relinquished their grants or been terminated
88

References
Abt Associates, Inc. (1997). Comprehensive Child Development Program Evaluation Report. Prepared for the Administration for Children and Families, U.S. DHHS.
Achenbach, T.M., Edelbrock, C. and Howell, C. T. (1987). Empirically based assessment of the behavioral/emotional problems of 2-and 3-year-old children. Journal of Abnormal Child Psychology, 15, 629-650.
Administration on Children, Youth and Families. (1997). Head Start Bureau. First progress report on the Head Start Program Performance Measures. Washington, D.C.: U.S. DHHS.
Administration on Children, Youth and Families. (1995). Head Start Bureau. Charting our progress: development of the Head Start Program Performance Measures. Washington, D.C.: U.S.DHHS.
Alexander, K.L., & Entwisle, D.R. (1988). Achievement in the first 2 years of school: Patterns and processes. Monographs of the Society for Research in Child Development. Serial No. 218, Vol. 53, No. 2.
Bryk, A.S., & Raudenbush, S.W. (1992). Hierarchical linear models: Applications and data analysis methods. Newbury Park, CA: Sage Publications.
Bryk, A.S., & Raudenbush, S.W. (1988). On heterogeneity of variance in experimental studies: A challenge to conventional interpretations. Psychological Bulletin, 104(3), 396-404.
Coleman, J.S. et. al. (1966). Equality of educational opportunity. Washington, DC: U.S. Government Printing Office.
Cost, Quality and Child Outcomes Study Team. (1995). Cost, quality and child outcomes in child care centers, public report, second edition. Denver: Economics Department, University of Colorado at Denver.
Dunn, Lloyd M., & Dunn, Leota M. (1997). Peabody Picture Vocabulary Test, Third Edition. Examiner’s Manual and Norms Booklet. Circle Pines, MN: American Guidance Service.
Elliott, S.N., Gresham, F.M., Freeman, R. & McCloskey, G. (1988). Teacher and observer ratings of children’s social skills: Validation of the Social Skills Rating Scales. Journal of Psychoeducational Assessment, 6, 152-161.
Emlen, A. (1998). From a Parent’s Point of View: Flexibility, income, and quality of child care. Background paper for New Perspectives on Child Care Quality Conference, SEED 2000 Consortium of Federal Agencies, Bethesda, MD.
89

Fitzgerald, Susan. (September 16, 1997). ‘Crack baby’ fears may have been overstated. The Washington Post, Health Section, pp. 10-11.
Goal One Technical Planning Group. (1991). The Goal One Technical Planning Subgroup report on school readiness. In National Education Goals Panel, (Ed.), Potential strategies for long-term indicator development: Reports of the technical planning subgroups. Report No. 91-0, 1-18. Washington, DC: National Education Goals Panel.
Goal One Technical Planning Group. (1993). Reconsidering children’s early development and learning: Toward shared beliefs and vocabulary. Draft report to the National Education Goals Panel. Washington, DC: National Education Goals Panel.
Haskins, R. (1989). Beyond metaphor: The efficacy of early childhood education. American Psychologist, 44(2), 274-282.
High/Scope Educational Research Foundation. (1992). Child Observation Record-Manual. Ypsilanti, MI: High/Scope Educational Research Foundation.
Horn, W.F., & Packard, T. (1985). Early identification of learning problems: A meta-analysis. Journal of Educational Psychology, 77, 597-607.
Howes, C. (1980). Peer play scale as an index of complexity of peer interaction. Developmental Psychology, 16, 371-372.
Howes, C. (1987). Social competence with peers in young children: developmental sequences. Developmental Review, 7,252-272.
Jencks, C., with Smith, M., Acland, H., Bane, M.J., Cohen, D., Gintis, H., Heyns, B., & Michelson, S. (1972). Inequality: A reassessment of the effect of family and schooling in America. New York: Basic Books.
Layzer, J., Goodson, B., & Moss, M. (1993). Final report volume 1: Life in preschool. Cambridge, MA: Abt Associates, Inc.
Lee, V.C., Brooks-Gunn, J., & Schnur, E. (1988). Does Head Start work? A 1-year follow-up comparison of disadvantaged children attending Head Start, no preschool, and other preschool programs. Developmental Psychology, 24(2), 210-222.
McKey, R.H., Condelli, L., Ganson, H., Barrett, B.J., McConkey, C., & Plantz, M.C. (1985). The impact of Head Start on children, families, and communities (DHHS Publication No. OHDS 85-31193). Washington, DC: U.S. Government Printing Office.
Mott, F.L., & Quinlan, S.V. (1992). Participation in Project Head Start: Determinants and possible short-term consequences. Center for Human Resource Research, The Ohio State University, 45 pp.
90

Pianta, R.C., & McCoy, S.J. (1997). The first day of school: The predictive utility of early school screening. Journal of Applied Developmental Psychology, 18(1), 1-22.
Rosenthal, R., & Rosnow, R.L. (1984). Essentials of behavioral analysis: Methods and data analysis. New York: McGraw-Hill.
Scarr, S., Eisenberg, M., & Deater-Deckard, K. (1994). Measurement of quality in child care centers. Early Childhood Research Quarterly, 9, 131-151.
Snow, C.E., Tabors, P.O., Nicholson, P.A., & Kurland, B.F. (1995). SHELL: Oral language and early literacy skills in kindergarten and first-grade children. Journal of Research in Early Childhood Education, 10(1), 37-48.
U.S. Department of Education, National Center for Education Statistics. National Assessment of Educational Progress. (1995). 1994 NAEP Reading, Revised Edition: A First Look. Prepared by Educational Testing Service. Washington, DC: National Center for Education Statistics.
U.S. Department of Education, National Center for Education Statistics. (1997). Digest of Education Statistics, 1997. Table 111, p. 118. NCES 98-015, by Thomas Snyder. Production Manager, Charlene M. Hoffman, Program Analyst, Claire M. Geddes. Washington, DC: National Center for Education Statistics.
Whitebook, M., Howes, C., & Phillips, D. (1989). “Who cares? child care teachers and the quality of care in America: final report: National Child Care Staffing Study.” Berkeley, CA: Child Care Employee Project.
White, K.R. (1985-1986). Efficacy of early intervention. Journal of Special Education, 41, 401-416.
Woodcock, R.W., & Mather, N. (1989, 1990). WJ-R Tests of Achievement: Examiner’s Manual. In: R.W. Woodcock & M.B. Johnson, Woodcock-Johnson Psycho-Educational Battery --Revised. Chicago: Riverside.
91