HCV core antigen is an alternative marker to HCV … for anti-HCV antibody (anti-HCV Ab) status...
18
Submitted 16 August 2017 Accepted 18 October 2017 Published 6 November 2017 Corresponding author Yong Poovorawan, [email protected] Academic editor Mario Alberto Flores-Valdez Additional Information and Declarations can be found on page 13 DOI 10.7717/peerj.4008 Copyright 2017 Wasitthankasem et al. Distributed under Creative Commons CC-BY 4.0 OPEN ACCESS HCV core antigen is an alternative marker to HCV RNA for evaluating active HCV infection: implications for improved diagnostic option in an era of affordable DAAs Rujipat Wasitthankasem 1 , Preeyaporn Vichaiwattana 1 , Chompoonut Auphimai 1 , Nipaporn Siripon 1 , Sirapa Klinfueng 1 , Pisit Tangkijvanich 2 , Sompong Vongpunsawad 1 and Yong Poovorawan 1 1 Center of Excellence in Clinical Virology, Faculty of Medicine, Chulalongkorn University, Bangkok, Thailand 2 Research Unit of Hepatitis and Liver Cancer, Department of Biochemistry, Faculty of Medicine, Chulalongkorn University, Thailand ABSTRACT The core antigen of the hepatitis C virus (HCV Ag) presents an alternative marker to HCV RNA when screening patients for HCV viremia. This study sought to evaluate the utility of HCV Ag as a marker to assess active HCV infection in individuals residing in an HCV-endemic area. From 298 HCV-seropositive individuals evaluated for the presence of anti-HCV antibody, HCV Ag and HCV RNA, anti-HCV antibody was detected in 252 individuals (signal-to-cutoff ratios ≥5), HCV RNA was detected in 222 individuals (88%), and HCV Ag was reactive (≥3 fmol/L) in 220 individuals (87%). HCV genotype 1, 3, and 6 were identified. HCV Ag significantly correlated with HCV RNA irrespective of HCV genotype and/or HBV co-infection (log HCV RNA = 2.67 + 0.95 [log HCV Ag], R 2 = 0.890, p < 0.001). To predict HCV viremia (HCV Ag ≥ 3 fmol/L), the accuracy, sensitivity, specificity, positive predictive value, and negative predictive value were 99%, 99%, 100%, 100% and 97%, respectively. We concluded that HCV Ag was a good surrogate marker for HCV RNA and could be used to diagnose active HCV infection in a resource-limited setting. As a result, a cost-effective strategy for screening and identifying active HCV carriers using HCV Ag detection would enable more patients access to efficacious and increasingly affordable direct-acting antivirals (DAAs) for the treatment of HCV infection. Subjects Molecular Biology, Virology, Epidemiology, Gastroenterology and Hepatology Keywords Hepatitis C virus, HCV Ag, HCV RNA, Active HCV infection INTRODUCTION Infection with hepatitis C virus (HCV) can lead to acute or chronic hepatitis, liver fibrosis, cirrhosis, end-stage liver disease, and hepatocellular carcinoma (Perz et al., 2006). Disease progression after HCV infection depends on factors including gender, coinfection with HIV, alcohol consumption, and duration of chronic infection (Hajarizadeh, Grebely & Dore, 2013; El-Serag, 2012). The global population seroprevalence of anti-HCV antibodies How to cite this article Wasitthankasem et al. (2017), HCV core antigen is an alternative marker to HCV RNA for evaluating active HCV infection: implications for improved diagnostic option in an era of affordable DAAs. PeerJ 5:e4008; DOI 10.7717/peerj.4008
Transcript of HCV core antigen is an alternative marker to HCV … for anti-HCV antibody (anti-HCV Ab) status...
Submitted 16 August 2017Accepted 18 October 2017Published 6 November 2017
Corresponding authorYong Poovorawan,[email protected]
Academic editorMario Alberto Flores-Valdez
Additional Information andDeclarations can be found onpage 13
DOI 10.7717/peerj.4008
Copyright2017 Wasitthankasem et al.
Distributed underCreative Commons CC-BY 4.0
OPEN ACCESS
HCV core antigen is an alternativemarker to HCV RNA for evaluatingactive HCV infection: implications forimproved diagnostic option in an era ofaffordable DAAsRujipat Wasitthankasem1, Preeyaporn Vichaiwattana1, Chompoonut Auphimai1,Nipaporn Siripon1, Sirapa Klinfueng1, Pisit Tangkijvanich2, SompongVongpunsawad1 and Yong Poovorawan1
1Center of Excellence in Clinical Virology, Faculty of Medicine, Chulalongkorn University, Bangkok, Thailand2Research Unit of Hepatitis and Liver Cancer, Department of Biochemistry, Faculty of Medicine,Chulalongkorn University, Thailand
ABSTRACTThe core antigen of the hepatitis C virus (HCV Ag) presents an alternative marker toHCV RNA when screening patients for HCV viremia. This study sought to evaluate theutility of HCV Ag as a marker to assess active HCV infection in individuals residingin an HCV-endemic area. From 298 HCV-seropositive individuals evaluated for thepresence of anti-HCV antibody, HCV Ag and HCV RNA, anti-HCV antibody wasdetected in 252 individuals (signal-to-cutoff ratios≥5), HCV RNA was detected in 222individuals (88%), and HCV Ag was reactive (≥3 fmol/L) in 220 individuals (87%).HCV genotype 1, 3, and 6 were identified. HCV Ag significantly correlated with HCVRNA irrespective of HCV genotype and/or HBV co-infection (log HCV RNA = 2.67+ 0.95 [log HCV Ag], R2
= 0.890, p< 0.001). To predict HCV viremia (HCV Ag ≥3 fmol/L), the accuracy, sensitivity, specificity, positive predictive value, and negativepredictive value were 99%, 99%, 100%, 100% and 97%, respectively.We concluded thatHCV Ag was a good surrogate marker for HCV RNA and could be used to diagnoseactive HCV infection in a resource-limited setting. As a result, a cost-effective strategyfor screening and identifying activeHCV carriers usingHCVAg detectionwould enablemore patients access to efficacious and increasingly affordable direct-acting antivirals(DAAs) for the treatment of HCV infection.
Subjects Molecular Biology, Virology, Epidemiology, Gastroenterology and HepatologyKeywords Hepatitis C virus, HCV Ag, HCV RNA, Active HCV infection
INTRODUCTIONInfection with hepatitis C virus (HCV) can lead to acute or chronic hepatitis, liver fibrosis,cirrhosis, end-stage liver disease, and hepatocellular carcinoma (Perz et al., 2006). Diseaseprogression after HCV infection depends on factors including gender, coinfection withHIV, alcohol consumption, and duration of chronic infection (Hajarizadeh, Grebely &Dore, 2013; El-Serag, 2012). The global population seroprevalence of anti-HCV antibodies
How to cite this article Wasitthankasem et al. (2017), HCV core antigen is an alternative marker to HCV RNA for evaluating active HCVinfection: implications for improved diagnostic option in an era of affordable DAAs. PeerJ 5:e4008; DOI 10.7717/peerj.4008
is estimated at around 1.6%, or roughly 115 million people (Gower et al., 2014). Thepresence of HCV antibodies can be found in spontaneous clearance, resolved infectionpost-treatment or persistently active disease. Early treatment for HCV infection, especiallyin the acute phase, can facilitate viral clearance and prevent chronic infection, therebylimiting HCV-induced liver damage and mortality (Jaeckel et al., 2001; Gerlach et al., 2003;Singal et al., 2010).
Screening for anti-HCV antibody (anti-HCV Ab) status often facilitates HCVsurveillance in the community (Meffre et al., 2010; Garcia Comas et al., 2015; Morisco etal., 2016). Although simple, such an assay cannot differentiate between past and presentinfection and requires supplemental HCV RNA testing to confirm active HCV infectionand monitor antiviral treatment. Despite its high sensitivity and reliability, an HCV RNAassay involving nucleic acid testing (NAT) and quantitative real-time RT-PCR requiresskilled laboratory personnel, sophisticated equipment, and expensive reagents (Roth etal., 2012; Halfon et al., 2006). Therefore, routine screening using these tests is limitedparticularly for many resource-constrained setting. In contrast, testing for HCV coreantigen (HCV Ag) presents a more attractive alternative owing to the lower cost and shortturnaround time. HCV Ag has been shown to be an indirect marker for HCV replicationcomparable to the detection of HCV RNA (Schuttler et al., 2004; Bouvier-Alias et al., 2002;Ottiger, Gygli & Huber, 2013; Florea et al., 2014). In addition to serving as a reliable markerto diagnose active HCV infection, HCV Ag can also be used to evaluate the treatmentresponse to antiviral therapy (Mederacke et al., 2009; Rockstroh et al., 2017; Alonso et al.,2017). Another advantage of the HCVAg assay is that it can often be performed on the sameinstrument and simultaneously with the anti-HCV assay, an added value when determiningthe HCV prevalence in the community (Kuo et al., 2012; Mixson-Hayden et al., 2015).
New and effective therapeutic direct-acting antivirals (DAAs) taken orally have becomewidely available in recent years. DAAs have advanced HCV therapy with higher rates ofsustained-virological response (SVR) post-treatment than those obtained from traditionalinterferon-based therapies independent of HCV genotype (Sulkowski et al., 2014; Zeuzemet al., 2014; Gane et al., 2015). Despite the availability of these highly efficient drugs,asymptomatic nature of HCV infection and expensive diagnostic screening processrepresent major obstacles in identifying and treating HCV-infected individuals (Cox,2015). Therefore, a simple, cost-effective testing feasible for routine HCV screening wouldbe ideal for low- to middle- income countries (LMIC) such as Thailand. In this study, weaimed to evaluate the diagnostic utility of HCVAg as an alternative to HCVRNA to identifyactive HCV infection in a relatively high endemic area. We also assessed the cost feasibilityand savings of implementing such program towards public health policy in an era of DAAs.
MATERIALS AND METHODSThis follow-up study examined the prevalence and genotypes of HCV found in Petchabunand Khon Kaen province and comprised part of a previous HCV surveillance projectinvolving 3,077 samples fromhigh- and average-levelHCV-endemic areas (Wasitthankasemet al., 2017). All HCV-seropositive individuals were informed of their status and invited to
Wasitthankasem et al. (2017), PeerJ, DOI 10.7717/peerj.4008 2/18
participate in confirmatory testing for HCV infection using anti-HCV, HCV Ag, and HCVRNA assays combined with liver enzyme levels and liver stiffness tests in March 2016. Thestudy protocol was approved by the institutional review board of the Faculty of Medicine,Chulalongkorn University (IRB No. 258/58). Objectives of the study were explained to thepatients and written informed consents were obtained.
Study subjectsOf the 310 eligible individuals with positive anti-HCV Ab results, 270 subjects participatedin the follow-up study (Fig. 1). Another 28 subjects with anti-HCV positive statusestablished after blood donor screening were also enrolled in this study. In all, 298 subjects(aged 34–64 years) provided demographic information and blood samples. Liver functiondata including aspartate aminotransferase (AST) and alanine transaminase (ALT) levelswere obtained, and HCV viral loads were determined from blood plasma. The degree ofliver fibrosis was assessed by transient-electrography (FibroScan, Echosens, Paris, France).Hepatitis B virus (HBV) and HIV status were previously determined using HBsAg and HIVAg/Ab automated screening (ARCHITECT, Abbott Diagnostics, Wiesbaden, Germany).
Anti-HCV serological testAll sera were tested for an anti-HCV Ab using automated chemiluminescent microparticleimmunoassays (CMIA) (ARCHITECT anti-HCV assay; Abbott Diagnostics, Wiesbaden,Germany). Signal-to-cutoff ratio (S/CO) indicated the presence of anti-HCV, with S/CO≥ 1.00 automatically assigned as reactive by the ARCHITECT i1000SR platform. TheUS Centers for Disease Control and Prevention (CDC) recommended the true predictiveresult above 95%when the S/CO ratio is≥5. Therefore, the latter was adopted, and reactiveanti-HCV samples were further categorized based on this criterion.
HCV RNA measurementPlasma HCV RNA level was determined using an automated in vitro reverse-transcriptionpolymerase chain reaction (RT-PCR) assay (Abbott RealTime HCV assay; AbbottMolecular, IL, USA). The lower and upper limits of quantitation of this kit were 12and 100,000,000 IU/mL, or log 1.08 and log 8.00 IU/mL, with a linearity range between8.21 log IU/mL to 0.91 log IU/mL (according to the manufacturer’s instructions). Samplesover the upper detection limit were examined for viral genotype and were not included infurther analyses. Samples with HCV RNA level < 12 IU/mL and ≥12 IU/mL were definedas negative and positive for HCV RNA, respectively.
HCV Ag measurementHCV core antigen (HCV Ag) quantitation was determined by automated assays usingan Architect i2000SR system (ARCHITECT HCV Ag; Abbott Diagnostics, Wiesbaden,Germany). This assay is a CMIA based on the interaction between monoclonal anti-HCVand HCV Ag. A HCV Ag concentration < 3 fmol/L was interpreted as nonreactive, andthe other samples with higher titers were interpreted as being reactive for HCV Ag. Thedetection limit ranged from 0 to 20,000 fmol/L. Therefore, samples with HCV Ag over thelimit of detection (20,000 fmol/L) were further diluted (by a factor 1:9), and re-examined
Wasitthankasem et al. (2017), PeerJ, DOI 10.7717/peerj.4008 3/18
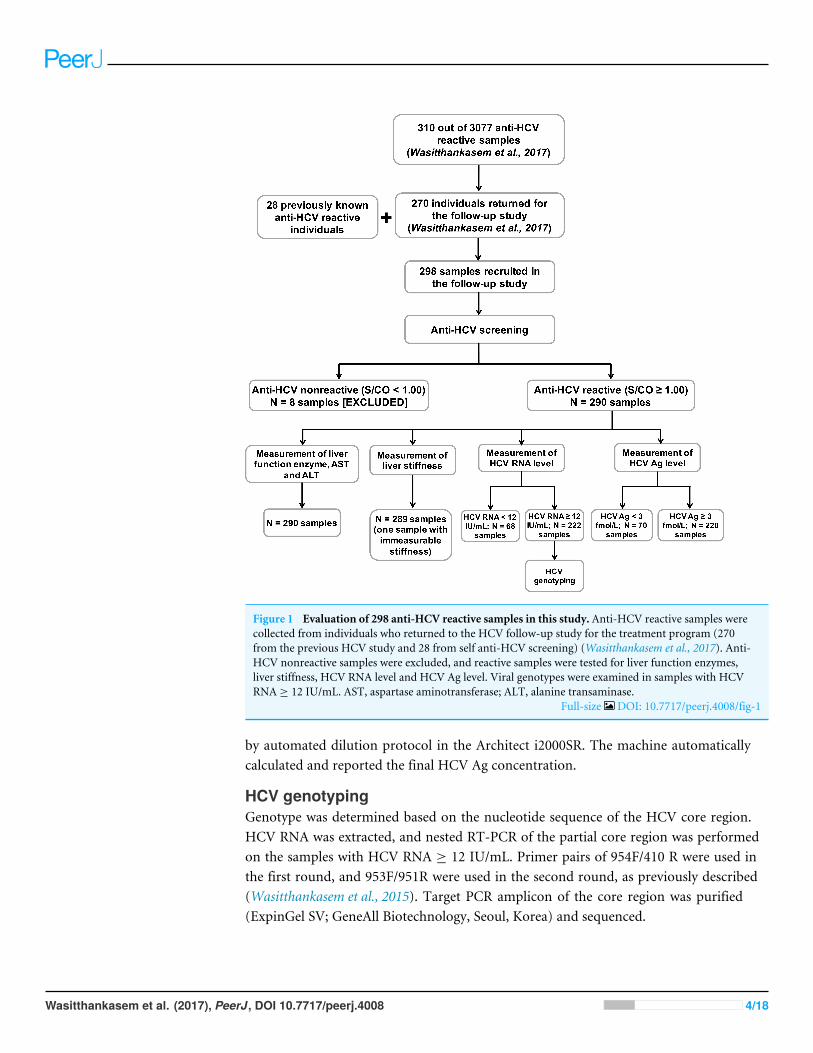
Figure 1 Evaluation of 298 anti-HCV reactive samples in this study. Anti-HCV reactive samples werecollected from individuals who returned to the HCV follow-up study for the treatment program (270from the previous HCV study and 28 from self anti-HCV screening) (Wasitthankasem et al., 2017). Anti-HCV nonreactive samples were excluded, and reactive samples were tested for liver function enzymes,liver stiffness, HCV RNA level and HCV Ag level. Viral genotypes were examined in samples with HCVRNA ≥ 12 IU/mL. AST, aspartase aminotransferase; ALT, alanine transaminase.
Full-size DOI: 10.7717/peerj.4008/fig-1
by automated dilution protocol in the Architect i2000SR. The machine automaticallycalculated and reported the final HCV Ag concentration.
HCV genotypingGenotype was determined based on the nucleotide sequence of the HCV core region.HCV RNA was extracted, and nested RT-PCR of the partial core region was performedon the samples with HCV RNA ≥ 12 IU/mL. Primer pairs of 954F/410 R were used inthe first round, and 953F/951R were used in the second round, as previously described(Wasitthankasem et al., 2015). Target PCR amplicon of the core region was purified(ExpinGel SV; GeneAll Biotechnology, Seoul, Korea) and sequenced.
Wasitthankasem et al. (2017), PeerJ, DOI 10.7717/peerj.4008 4/18
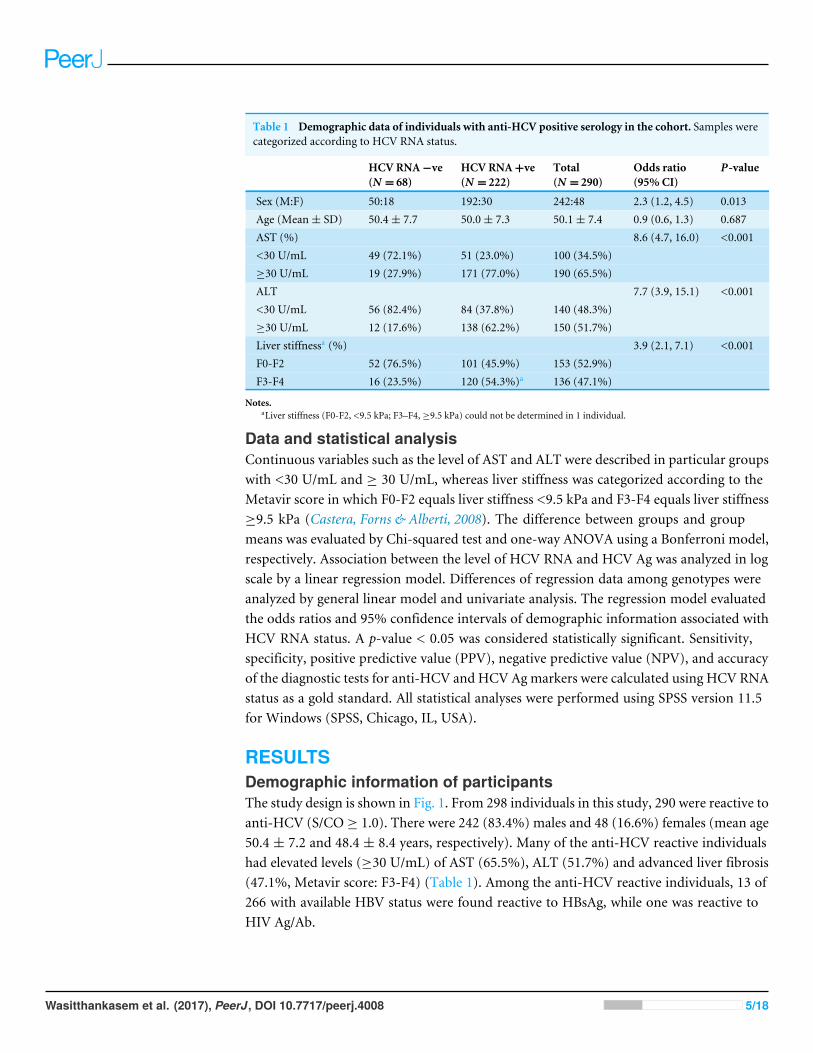
Table 1 Demographic data of individuals with anti-HCV positive serology in the cohort. Samples werecategorized according to HCV RNA status.
HCV RNA−ve(N = 68)
HCV RNA+ve(N = 222)
Total(N = 290)
Odds ratio(95% CI)
P-value
Sex (M:F) 50:18 192:30 242:48 2.3 (1.2, 4.5) 0.013Age (Mean± SD) 50.4± 7.7 50.0± 7.3 50.1± 7.4 0.9 (0.6, 1.3) 0.687AST (%) 8.6 (4.7, 16.0) <0.001<30 U/mL 49 (72.1%) 51 (23.0%) 100 (34.5%)≥30 U/mL 19 (27.9%) 171 (77.0%) 190 (65.5%)ALT 7.7 (3.9, 15.1) <0.001<30 U/mL 56 (82.4%) 84 (37.8%) 140 (48.3%)≥30 U/mL 12 (17.6%) 138 (62.2%) 150 (51.7%)Liver stiffnessa (%) 3.9 (2.1, 7.1) <0.001F0-F2 52 (76.5%) 101 (45.9%) 153 (52.9%)F3-F4 16 (23.5%) 120 (54.3%)a 136 (47.1%)
Notes.aLiver stiffness (F0-F2, <9.5 kPa; F3–F4, ≥9.5 kPa) could not be determined in 1 individual.
Data and statistical analysisContinuous variables such as the level of AST and ALT were described in particular groupswith <30 U/mL and ≥ 30 U/mL, whereas liver stiffness was categorized according to theMetavir score in which F0-F2 equals liver stiffness <9.5 kPa and F3-F4 equals liver stiffness≥9.5 kPa (Castera, Forns & Alberti, 2008). The difference between groups and groupmeans was evaluated by Chi-squared test and one-way ANOVA using a Bonferroni model,respectively. Association between the level of HCV RNA and HCV Ag was analyzed in logscale by a linear regression model. Differences of regression data among genotypes wereanalyzed by general linear model and univariate analysis. The regression model evaluatedthe odds ratios and 95% confidence intervals of demographic information associated withHCV RNA status. A p-value < 0.05 was considered statistically significant. Sensitivity,specificity, positive predictive value (PPV), negative predictive value (NPV), and accuracyof the diagnostic tests for anti-HCV and HCV Agmarkers were calculated using HCV RNAstatus as a gold standard. All statistical analyses were performed using SPSS version 11.5for Windows (SPSS, Chicago, IL, USA).
RESULTSDemographic information of participantsThe study design is shown in Fig. 1. From 298 individuals in this study, 290 were reactive toanti-HCV (S/CO≥ 1.0). There were 242 (83.4%) males and 48 (16.6%) females (mean age50.4 ± 7.2 and 48.4 ± 8.4 years, respectively). Many of the anti-HCV reactive individualshad elevated levels (≥30 U/mL) of AST (65.5%), ALT (51.7%) and advanced liver fibrosis(47.1%, Metavir score: F3-F4) (Table 1). Among the anti-HCV reactive individuals, 13 of266 with available HBV status were found reactive to HBsAg, while one was reactive toHIV Ag/Ab.
Wasitthankasem et al. (2017), PeerJ, DOI 10.7717/peerj.4008 5/18
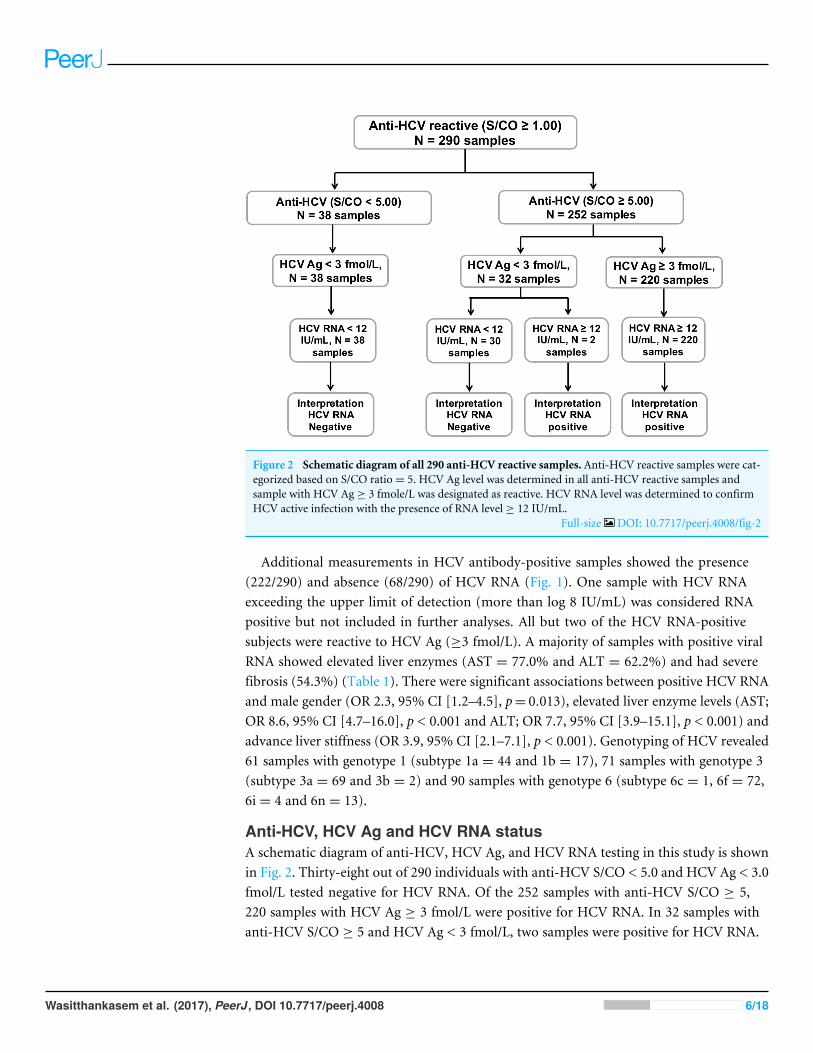
Figure 2 Schematic diagram of all 290 anti-HCV reactive samples. Anti-HCV reactive samples were cat-egorized based on S/CO ratio= 5. HCV Ag level was determined in all anti-HCV reactive samples andsample with HCV Ag ≥ 3 fmole/L was designated as reactive. HCV RNA level was determined to confirmHCV active infection with the presence of RNA level ≥ 12 IU/mL.
Full-size DOI: 10.7717/peerj.4008/fig-2
Additional measurements in HCV antibody-positive samples showed the presence(222/290) and absence (68/290) of HCV RNA (Fig. 1). One sample with HCV RNAexceeding the upper limit of detection (more than log 8 IU/mL) was considered RNApositive but not included in further analyses. All but two of the HCV RNA-positivesubjects were reactive to HCV Ag (≥3 fmol/L). A majority of samples with positive viralRNA showed elevated liver enzymes (AST = 77.0% and ALT = 62.2%) and had severefibrosis (54.3%) (Table 1). There were significant associations between positive HCV RNAand male gender (OR 2.3, 95% CI [1.2–4.5], p= 0.013), elevated liver enzyme levels (AST;OR 8.6, 95% CI [4.7–16.0], p < 0.001 and ALT; OR 7.7, 95% CI [3.9–15.1], p < 0.001) andadvance liver stiffness (OR 3.9, 95% CI [2.1–7.1], p < 0.001). Genotyping of HCV revealed61 samples with genotype 1 (subtype 1a = 44 and 1b = 17), 71 samples with genotype 3(subtype 3a = 69 and 3b = 2) and 90 samples with genotype 6 (subtype 6c = 1, 6f = 72,6i = 4 and 6n = 13).
Anti-HCV, HCV Ag and HCV RNA statusA schematic diagram of anti-HCV, HCV Ag, and HCV RNA testing in this study is shownin Fig. 2. Thirty-eight out of 290 individuals with anti-HCV S/CO < 5.0 and HCV Ag < 3.0fmol/L tested negative for HCV RNA. Of the 252 samples with anti-HCV S/CO ≥ 5,220 samples with HCV Ag ≥ 3 fmol/L were positive for HCV RNA. In 32 samples withanti-HCV S/CO ≥ 5 and HCV Ag < 3 fmol/L, two samples were positive for HCV RNA.
Wasitthankasem et al. (2017), PeerJ, DOI 10.7717/peerj.4008 6/18
Among 13 HBV reactive samples, there were six HCV RNA positive samples, five ofwhich were positive for HCV Ag. One sample showed evidence of triple infection withHIV, HBV, and HCV.
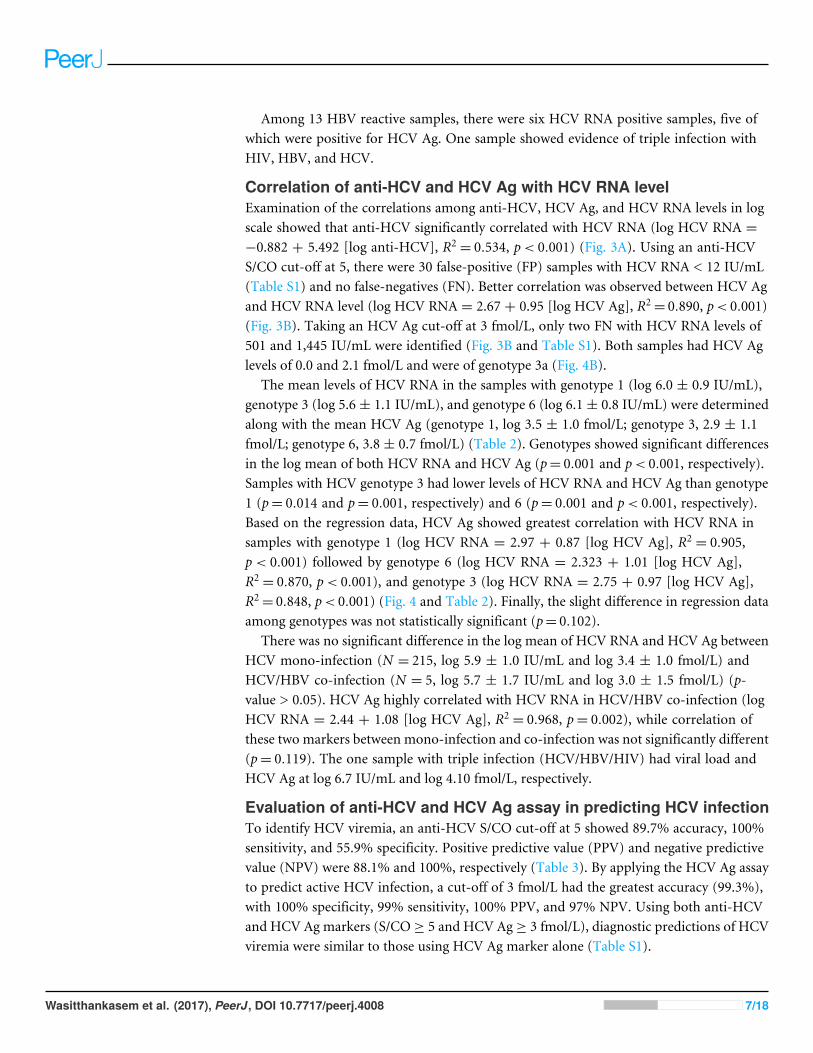
Correlation of anti-HCV and HCV Ag with HCV RNA levelExamination of the correlations among anti-HCV, HCV Ag, and HCV RNA levels in logscale showed that anti-HCV significantly correlated with HCV RNA (log HCV RNA =−0.882 + 5.492 [log anti-HCV], R2
= 0.534, p< 0.001) (Fig. 3A). Using an anti-HCVS/CO cut-off at 5, there were 30 false-positive (FP) samples with HCV RNA < 12 IU/mL(Table S1) and no false-negatives (FN). Better correlation was observed between HCV Agand HCV RNA level (log HCV RNA = 2.67 + 0.95 [log HCV Ag], R2
= 0.890, p< 0.001)(Fig. 3B). Taking an HCV Ag cut-off at 3 fmol/L, only two FN with HCV RNA levels of501 and 1,445 IU/mL were identified (Fig. 3B and Table S1). Both samples had HCV Aglevels of 0.0 and 2.1 fmol/L and were of genotype 3a (Fig. 4B).
The mean levels of HCV RNA in the samples with genotype 1 (log 6.0 ± 0.9 IU/mL),genotype 3 (log 5.6 ± 1.1 IU/mL), and genotype 6 (log 6.1 ± 0.8 IU/mL) were determinedalong with the mean HCV Ag (genotype 1, log 3.5 ± 1.0 fmol/L; genotype 3, 2.9 ± 1.1fmol/L; genotype 6, 3.8 ± 0.7 fmol/L) (Table 2). Genotypes showed significant differencesin the log mean of both HCV RNA and HCV Ag (p= 0.001 and p< 0.001, respectively).Samples with HCV genotype 3 had lower levels of HCV RNA and HCV Ag than genotype1 (p= 0.014 and p= 0.001, respectively) and 6 (p= 0.001 and p< 0.001, respectively).Based on the regression data, HCV Ag showed greatest correlation with HCV RNA insamples with genotype 1 (log HCV RNA = 2.97 + 0.87 [log HCV Ag], R2
= 0.905,p < 0.001) followed by genotype 6 (log HCV RNA = 2.323 + 1.01 [log HCV Ag],R2= 0.870, p< 0.001), and genotype 3 (log HCV RNA = 2.75 + 0.97 [log HCV Ag],
R2= 0.848, p< 0.001) (Fig. 4 and Table 2). Finally, the slight difference in regression data
among genotypes was not statistically significant (p= 0.102).There was no significant difference in the log mean of HCV RNA and HCV Ag between
HCV mono-infection (N = 215, log 5.9 ± 1.0 IU/mL and log 3.4 ± 1.0 fmol/L) andHCV/HBV co-infection (N = 5, log 5.7 ± 1.7 IU/mL and log 3.0 ± 1.5 fmol/L) (p-value > 0.05). HCV Ag highly correlated with HCV RNA in HCV/HBV co-infection (logHCV RNA = 2.44 + 1.08 [log HCV Ag], R2
= 0.968, p= 0.002), while correlation ofthese two markers between mono-infection and co-infection was not significantly different(p= 0.119). The one sample with triple infection (HCV/HBV/HIV) had viral load andHCV Ag at log 6.7 IU/mL and log 4.10 fmol/L, respectively.
Evaluation of anti-HCV and HCV Ag assay in predicting HCV infectionTo identify HCV viremia, an anti-HCV S/CO cut-off at 5 showed 89.7% accuracy, 100%sensitivity, and 55.9% specificity. Positive predictive value (PPV) and negative predictivevalue (NPV) were 88.1% and 100%, respectively (Table 3). By applying the HCV Ag assayto predict active HCV infection, a cut-off of 3 fmol/L had the greatest accuracy (99.3%),with 100% specificity, 99% sensitivity, 100% PPV, and 97% NPV. Using both anti-HCVand HCV Ag markers (S/CO≥ 5 and HCV Ag≥ 3 fmol/L), diagnostic predictions of HCVviremia were similar to those using HCV Ag marker alone (Table S1).
Wasitthankasem et al. (2017), PeerJ, DOI 10.7717/peerj.4008 7/18
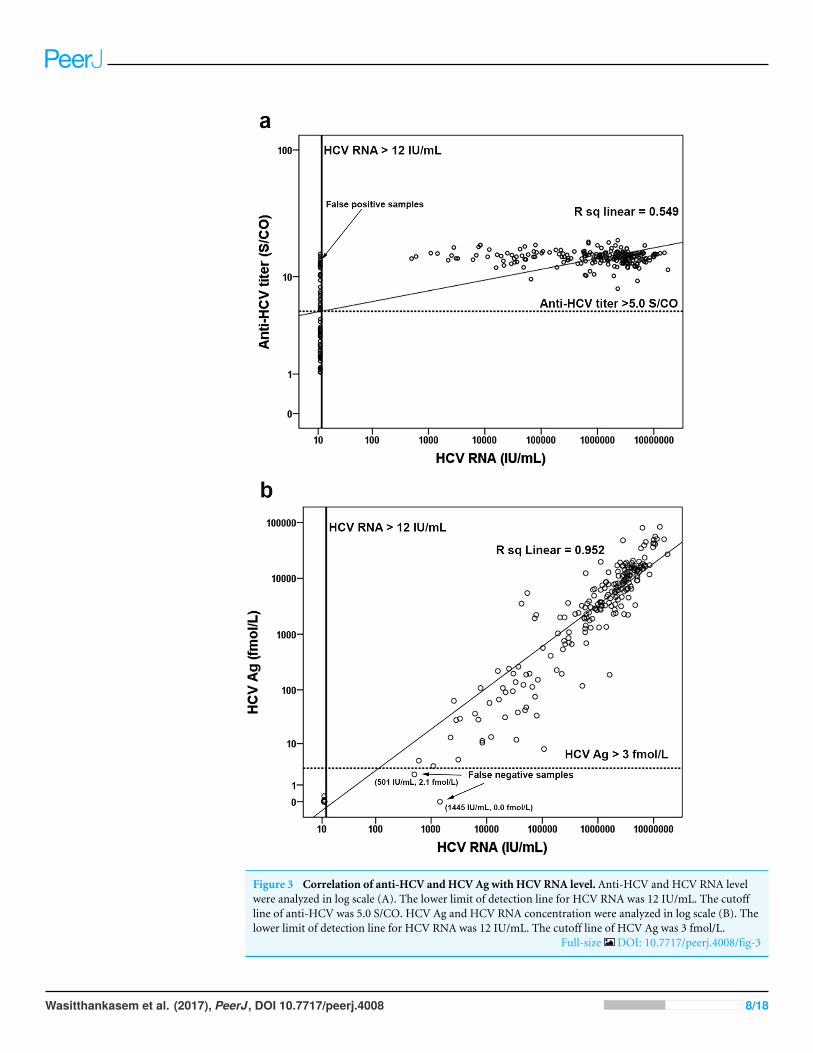
Figure 3 Correlation of anti-HCV and HCV Ag with HCV RNA level. Anti-HCV and HCV RNA levelwere analyzed in log scale (A). The lower limit of detection line for HCV RNA was 12 IU/mL. The cutoffline of anti-HCV was 5.0 S/CO. HCV Ag and HCV RNA concentration were analyzed in log scale (B). Thelower limit of detection line for HCV RNA was 12 IU/mL. The cutoff line of HCV Ag was 3 fmol/L.
Full-size DOI: 10.7717/peerj.4008/fig-3
Wasitthankasem et al. (2017), PeerJ, DOI 10.7717/peerj.4008 8/18
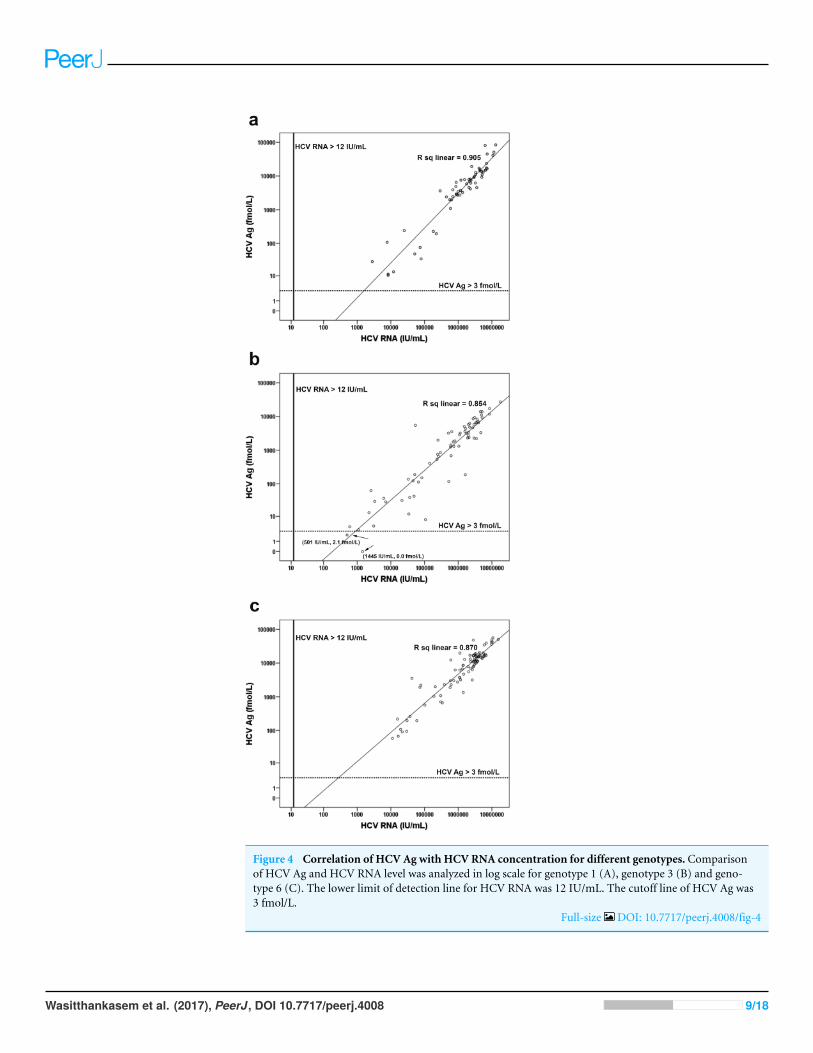
Figure 4 Correlation of HCV Ag with HCV RNA concentration for different genotypes. Comparisonof HCV Ag and HCV RNA level was analyzed in log scale for genotype 1 (A), genotype 3 (B) and geno-type 6 (C). The lower limit of detection line for HCV RNA was 12 IU/mL. The cutoff line of HCV Ag was3 fmol/L.
Full-size DOI: 10.7717/peerj.4008/fig-4
Wasitthankasem et al. (2017), PeerJ, DOI 10.7717/peerj.4008 9/18
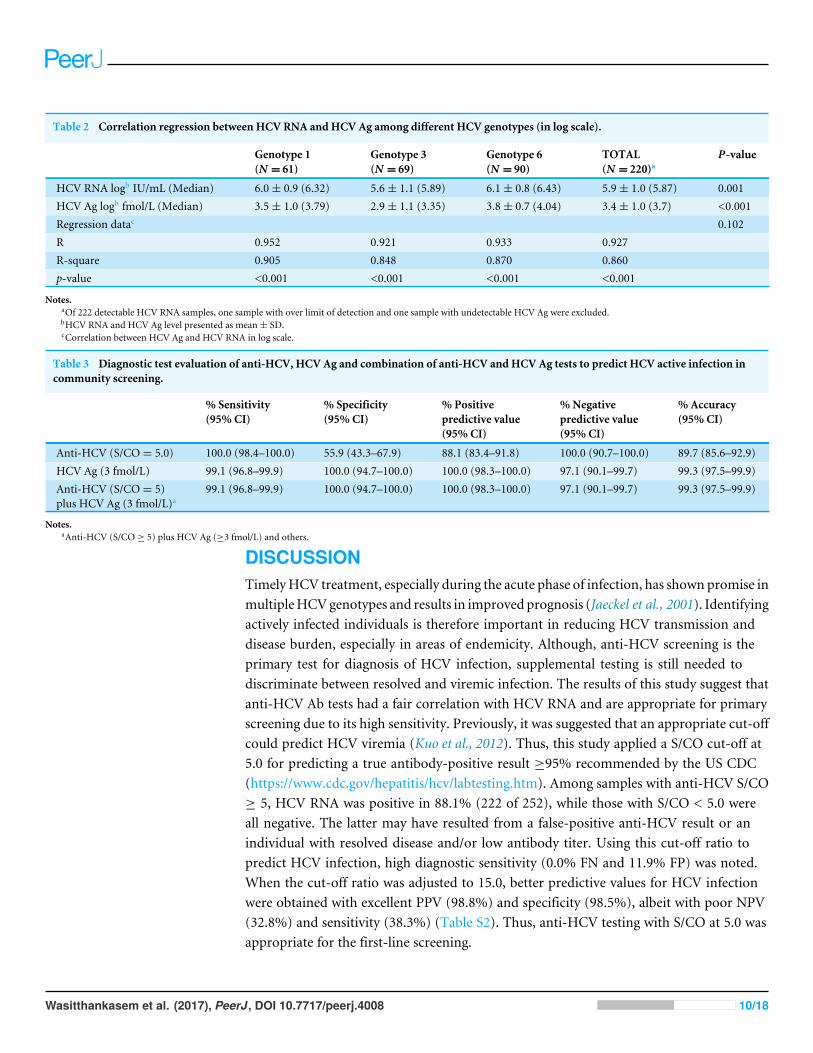
Table 2 Correlation regression between HCV RNA and HCV Ag among different HCV genotypes (in log scale).
Genotype 1(N = 61)
Genotype 3(N = 69)
Genotype 6(N = 90)
TOTAL(N = 220)a
P-value
HCV RNA logb IU/mL (Median) 6.0± 0.9 (6.32) 5.6± 1.1 (5.89) 6.1± 0.8 (6.43) 5.9± 1.0 (5.87) 0.001HCV Ag logb fmol/L (Median) 3.5± 1.0 (3.79) 2.9± 1.1 (3.35) 3.8± 0.7 (4.04) 3.4± 1.0 (3.7) <0.001Regression datac 0.102R 0.952 0.921 0.933 0.927R-square 0.905 0.848 0.870 0.860p-value <0.001 <0.001 <0.001 <0.001
Notes.aOf 222 detectable HCV RNA samples, one sample with over limit of detection and one sample with undetectable HCV Ag were excluded.bHCV RNA and HCV Ag level presented as mean± SD.cCorrelation between HCV Ag and HCV RNA in log scale.
Table 3 Diagnostic test evaluation of anti-HCV, HCV Ag and combination of anti-HCV and HCV Ag tests to predict HCV active infection incommunity screening.
% Sensitivity(95% CI)
% Specificity(95% CI)
% Positivepredictive value(95% CI)
%Negativepredictive value(95% CI)
% Accuracy(95% CI)
Anti-HCV (S/CO= 5.0) 100.0 (98.4–100.0) 55.9 (43.3–67.9) 88.1 (83.4–91.8) 100.0 (90.7–100.0) 89.7 (85.6–92.9)HCV Ag (3 fmol/L) 99.1 (96.8–99.9) 100.0 (94.7–100.0) 100.0 (98.3–100.0) 97.1 (90.1–99.7) 99.3 (97.5–99.9)Anti-HCV (S/CO= 5)plus HCV Ag (3 fmol/L)a
99.1 (96.8–99.9) 100.0 (94.7–100.0) 100.0 (98.3–100.0) 97.1 (90.1–99.7) 99.3 (97.5–99.9)
Notes.aAnti-HCV (S/CO ≥ 5) plus HCV Ag (≥3 fmol/L) and others.
DISCUSSIONTimelyHCV treatment, especially during the acute phase of infection, has shown promise inmultipleHCVgenotypes and results in improved prognosis (Jaeckel et al., 2001). Identifyingactively infected individuals is therefore important in reducing HCV transmission anddisease burden, especially in areas of endemicity. Although, anti-HCV screening is theprimary test for diagnosis of HCV infection, supplemental testing is still needed todiscriminate between resolved and viremic infection. The results of this study suggest thatanti-HCV Ab tests had a fair correlation with HCV RNA and are appropriate for primaryscreening due to its high sensitivity. Previously, it was suggested that an appropriate cut-offcould predict HCV viremia (Kuo et al., 2012). Thus, this study applied a S/CO cut-off at5.0 for predicting a true antibody-positive result ≥95% recommended by the US CDC(https://www.cdc.gov/hepatitis/hcv/labtesting.htm). Among samples with anti-HCV S/CO≥ 5, HCV RNA was positive in 88.1% (222 of 252), while those with S/CO < 5.0 wereall negative. The latter may have resulted from a false-positive anti-HCV result or anindividual with resolved disease and/or low antibody titer. Using this cut-off ratio topredict HCV infection, high diagnostic sensitivity (0.0% FN and 11.9% FP) was noted.When the cut-off ratio was adjusted to 15.0, better predictive values for HCV infectionwere obtained with excellent PPV (98.8%) and specificity (98.5%), albeit with poor NPV(32.8%) and sensitivity (38.3%) (Table S2). Thus, anti-HCV testing with S/CO at 5.0 wasappropriate for the first-line screening.
Wasitthankasem et al. (2017), PeerJ, DOI 10.7717/peerj.4008 10/18
Unlike anti-HCV Ab, HCV Ag showed excellent diagnostic validity and correlationwith HCV RNA. At a cutoff of 3 fmol/L, HCV Ag was a good predictive marker of HCVviremia with 0 (0.0%) FP and 2 (2.9%) FN cases. The validity of HCV Ag testing was betterthan the anti-HCV marker that had 99.1% sensitivity, 100% specificity, 100% PPV, 97.1%NPV and 99.3% accuracy. It has been suggested that combining anti-HCV and HCV Agat the appropriate cutoff point would improve the predictive value for HCV viremia, butthe validity was similar to HCV Ag alone when combining those two markers (Kuo et al.,2012). In addition, HCV Ag correlates well with RNA levels and may therefore serve as apredictor for response-guided therapy and for monitoring treatment response (Nguyen etal., 2017; Alonso et al., 2017).
The 2 FN cases from the HCV Ag assay had low viral loads and were of genotype 3. Theseresults may be related to the viral level and detection limit of the respective genotypes. Lowlevels of HCV RNA tended to increase the coefficient of variation and contributed to FN onHCV Ag assays (Aghemo et al., 2016; Ottiger, Gygli & Huber, 2013). Several studies suggestthat the lower limit of HCV Ag detection is equivalent to HCV RNA between 1,000 and5,000 IU/mL, therefore low RNA level in these two samples (501 IU/mL and 1,445 IU/mL)may have contributed to the FN result (Florea et al., 2014; Freiman et al., 2016; Ottiger,Gygli & Huber, 2013). In addition, adequate analytical sensitivity at 3 fmol/L of HCV Ag ofgenotype 3 required approximately 1,002 IU/mL of HCV RNA, which was higher than forgenotype 1 (896 IU/mL) (Ross et al., 2010; Tillmann, 2014). Similar to this cohort, greatervariation in genotype 3 samples with low HCV Ag but high HCV RNA was previouslyreported (Ottiger, Gygli & Huber, 2013; Mederacke et al., 2009). Discordant result found inthis study (0.7%, 2/290) could potentially be resolved with a confirmatory RNA testing(e.g., reactive anti-HCV and non-reactive HCV Ag) (Rockstroh et al., 2017).
A meta-analysis demonstrated that HCV Ag had excellent correlation with viremiadespite limitations on the effect of HCV genotypes and HBV or HIV co-infection (Freimanet al., 2016). A significant difference was observed in the log mean of viral RNA and antigenlevels among genotypes, but this was not apparent in the correlation between these twomarkers. Previous studies also reported that HCV Ag of genotype 1, 2, 3 and 4 had goodcorrelation with viral load (Mederacke et al., 2009; Ottiger, Gygli & Huber, 2013; Ross et al.,2010). Our study also showed good correlation between HCV Ag and RNA in HCV/HBVco-infection samples. However, poor correlation in the HBV co-infection group maysometimes occur especially with genotypes other than genotype 1 (Mederacke et al., 2012).This may be attributed to very low or very high concentration of HCV Ag relative to HCVRNA in some samples. Therefore, HCV Ag retesting should be performed in the sampleswith very low or very high concentrations. Excellent correlation had been reported inHCV/HIV co-infection (Mederacke et al., 2012; Thong et al., 2015), but that informationwas insufficient in triple infection samples.We found only one sample withHCV/HBV/HIVtriple infection and elevated HCV viremia and HCV Ag. Further studies are required toelucidate the correlations in subjects with dual infections and triple infections.
Previous studies examining HCV Ag in HCV infection were conducted in industrializedcountries (Mederacke et al., 2009; Mixson-Hayden et al., 2015; Rockstroh et al., 2017;Freiman et al., 2016), while data from LMIC have been scarced (Khan et al., 2017; Freiman
Wasitthankasem et al. (2017), PeerJ, DOI 10.7717/peerj.4008 11/18
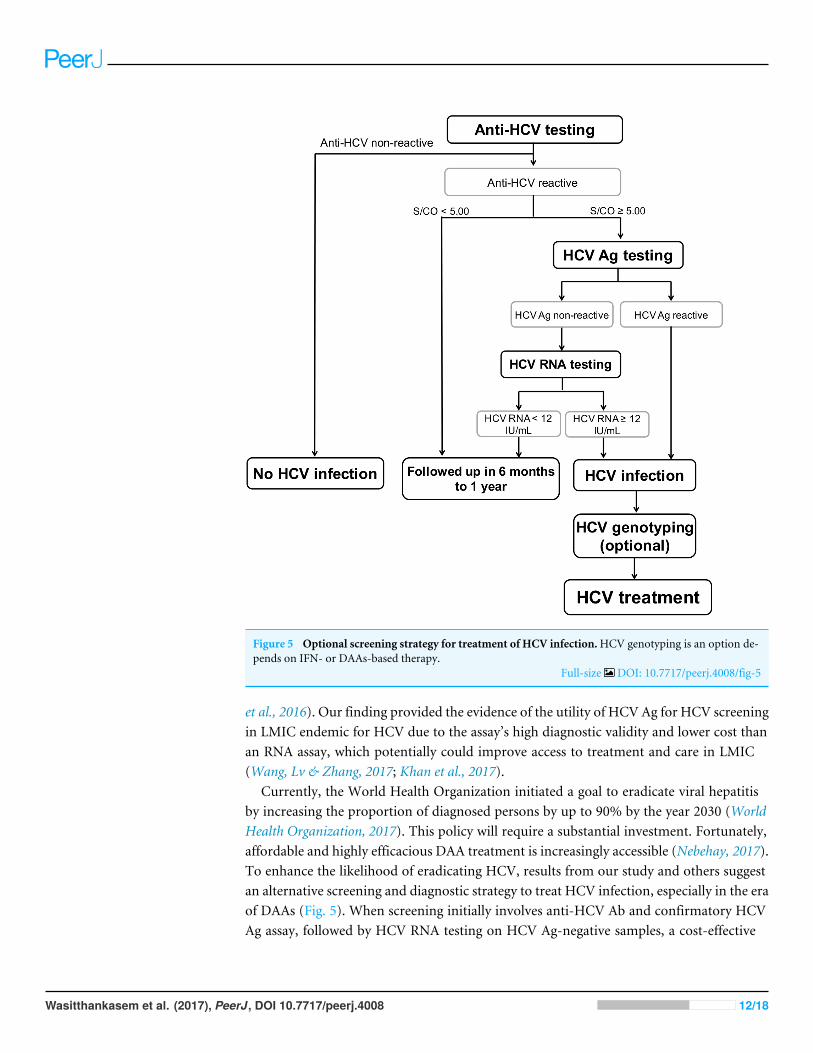
Figure 5 Optional screening strategy for treatment of HCV infection.HCV genotyping is an option de-pends on IFN- or DAAs-based therapy.
Full-size DOI: 10.7717/peerj.4008/fig-5
et al., 2016). Our finding provided the evidence of the utility of HCV Ag for HCV screeningin LMIC endemic for HCV due to the assay’s high diagnostic validity and lower cost thanan RNA assay, which potentially could improve access to treatment and care in LMIC(Wang, Lv & Zhang, 2017; Khan et al., 2017).
Currently, the World Health Organization initiated a goal to eradicate viral hepatitisby increasing the proportion of diagnosed persons by up to 90% by the year 2030 (WorldHealth Organization, 2017). This policy will require a substantial investment. Fortunately,affordable and highly efficacious DAA treatment is increasingly accessible (Nebehay, 2017).To enhance the likelihood of eradicating HCV, results from our study and others suggestan alternative screening and diagnostic strategy to treat HCV infection, especially in the eraof DAAs (Fig. 5). When screening initially involves anti-HCV Ab and confirmatory HCVAg assay, followed by HCV RNA testing on HCV Ag-negative samples, a cost-effective
Wasitthankasem et al. (2017), PeerJ, DOI 10.7717/peerj.4008 12/18
algorithm by us demonstrate a considerable reduction, roughly 48% compared to thestandard expenditure (standard algorithm; anti-HCV test followed by RNA assay, File S1)and is consistent with that proposed by others (Jülicher & Galli, 2017). This strategy wouldeffectively provide equal diagnostic performance that supports the possibility of large-scaleimplementation.
In conclusion, our population-based study showed high validity of HCV Ag as a reliablemarker for diagnosis of active HCV infection. This marker showed excellent correlationwith the viral RNA irrespective of genotypes and HBV co-infection. In addition, HCV Agcan serve as a supplemental marker after anti-HCV testing to reduce the sample numberrequiring further confirmatory RNA assays. A proposed cost-effective strategy wouldreduce the financial burden required for national screening and improve access to HCVtreatment and care in the era of affordable DAAs.
ACKNOWLEDGEMENTSWe would like to thank Ms Supapith Saiyatha and Mr. Chaiwat Thongmai, PhetchabunProvincial Public Health Office, Ms. Napha Thanetkongtong and Dr. ViboonsakVuthitanachot, Chumpare Hospital, Chum Phae, Khon Kaen and Ms Saowakon Sochoo,Lomkao Crown Prince Hospital for specimen collection and collaboration.
ADDITIONAL INFORMATION AND DECLARATIONS
FundingThis work was supported by the Research Chair Grant from the National Science andTechnology Development Agency (P-15-5004), Chulalongkorn University CentenaryAcademic Development Project (CU56-HR01); the Senior Research Scholar, ThailandResearch Fund (RTA5980008); Ratchadaphiseksomphot Endowment Fund forPostdoctoral Fellowship to Rujipat Wasitthankasem; the Center of Excellence in ClinicalVirology, Chulalongkorn University (GCE58- 014-30-004); and King ChulalongkornMemorial Hospital. The funders had no role in study design, data collection and analysis,decision to publish, or preparation of the manuscript.
Grant DisclosuresThe following grant information was disclosed by the authors:National Science and Technology Development Agency: P-15-5004.Chulalongkorn University Centenary Academic Development Project: CU56-HR01.Thailand Research Fund: RTA5980008.Ratchadaphiseksomphot Endowment Fund: GCE58- 014-30-004.King Chulalongkorn Memorial Hospital.
Competing InterestsThe authors declare there are no competing interests.
Wasitthankasem et al. (2017), PeerJ, DOI 10.7717/peerj.4008 13/18
Author Contributions• Rujipat Wasitthankasem conceived and designed the experiments, performed theexperiments, analyzed the data, wrote the paper, prepared figures and/or tables.• Preeyaporn Vichaiwattana, Chompoonut Auphimai and Sirapa Klinfueng performedthe experiments.• Nipaporn Siripon contributed reagents/materials/analysis tools.• Pisit Tangkijvanich contributed reagents/materials/analysis tools, reviewed drafts of thepaper.• Sompong Vongpunsawad reviewed drafts of the paper.• Yong Poovorawan conceived and designed the experiments, analyzed the data,contributed reagents/materials/analysis tools, wrote the paper, reviewed drafts of thepaper.
Human EthicsThe following information was supplied relating to ethical approvals (i.e., approving bodyand any reference numbers):
This study was part of the overall research ‘‘Prevalence and genotypes of hepatitis C virusin Petchaboon and Khon Kane province as a model for treatment’’. The study protocolwas approved by the institutional review board of the Faculty of Medicine, ChulalongkornUniversity (IRB No. 258/58).
Data AvailabilityThe following information was supplied regarding data availability:
The raw data has been provided as a Supplemental File.
Supplemental InformationSupplemental information for this article can be found online at http://dx.doi.org/10.7717/peerj.4008#supplemental-information.
REFERENCESAghemo A, Degasperi E, De Nicola S, Bono P, Orlandi A, D’Ambrosio R, Soffredini
R, Perbellini R, Lunghi G, ColomboM. 2016. Quantification of core antigenmonitors efficacy of direct-acting antiviral agents in patients with chronic hep-atitis C virus infection. Clinical Gastroenterology and Hepatology 14:1331–1336DOI 10.1016/j.cgh.2016.03.035.
Alonso R, Perez-Garcia F, Ampuero D, Reigadas E, Bouza E. 2017. New direct-actingantivirals for patients with chronic HCV infection: can we monitor treatmentusing an HCV core antigen assay? Diagnostic Microbiology and Infectious Disease87:243–246 DOI 10.1016/j.diagmicrobio.2016.11.010.
Bouvier-Alias M, Patel K, Dahari H, Beaucourt S, Larderie P, Blatt L, Hezode C,Picchio G, Dhumeaux D, Neumann AU, McHutchison JG, Pawlotsky JM. 2002.Clinical utility of total HCV core antigen quantification: a new indirect marker ofHCV replication. Hepatology 36:211–218 DOI 10.1053/jhep.2002.34130.
Wasitthankasem et al. (2017), PeerJ, DOI 10.7717/peerj.4008 14/18
Castera L, Forns X, Alberti A. 2008. Non-invasive evaluation of liver fibrosis using tran-sient elastography. Journal of Hepatology 48:835–847 DOI 10.1016/j.jhep.2008.02.008.
Cox AL. 2015. Global control of hepatitis C virus. Science 349:790–791DOI 10.1126/science.aad1302.
El-Serag HB. 2012. Epidemiology of viral hepatitis and hepatocellular carcinoma.Gastroenterology 142:1264–1273, e1261 DOI 10.1053/j.gastro.2011.12.061.
Florea D, Neaga E, Nicolae I, MaximD, PopaM, Otelea D. 2014. Clinical usefulness ofHCV core antigen assay for the management of patients with chronic hepatitis C.Journal of Gastrointestinal and Liver Diseases 23:393–396DOI 10.15403/jgld.2014.1121.234.chcv.
Freiman JM, Tran TM, Schumacher SG,White LF, Ongarello S, Cohn J, EasterbrookPJ, Linas BP, Denkinger CM. 2016.Hepatitis C core antigen testing for diagnosis ofhepatitis C virus infection: a systematic review and meta-analysis. Annals of InternalMedicine 165:345–355 DOI 10.7326/M16-0065.
Gane EJ, Hyl RH, An D, Svarovskaia E, Pang PS, Brainard D, Stedman CA. 2015.Efficacy of ledipasvir and sofosbuvir, with or without ribavirin, for 12 weeks inpatients with HCV genotype 3 or 6 infection. Gastroenterology 149:1454–1461DOI 10.1053/j.gastro.2015.07.063.
Garcia Comas L, Ordobas GavinM, SanzMoreno JC, Ramos Blazquez B, GutierrezRodriguez A, Astray Mochales J, Moreno Guillen S. 2015. Prevalence of hepatitisC antibodies in the population aged 16–80 years in the Community of Madrid 2008–2009. Journal of Medical Virology 87:1697–1701 DOI 10.1002/jmv.24219.
Gerlach JT, Diepolder HM, Zachoval R, Gruener NH, JungMC, Ulsenheimer A,SchrautWW, Schirren CA,Waechtler M, BackmundM, Pape GR. 2003. Acutehepatitis C: high rate of both spontaneous and treatment-induced viral clearance.Gastroenterology 125:80–88 DOI 10.1016/S0016-5085(03)00668-1.
Gower E, Estes C, Blach S, Razavi-Shearer K, Razavi H. 2014. Global epidemiologyand genotype distribution of the hepatitis C virus infection. Journal of Hepatology61:S45–S57 DOI 10.1016/j.jhep.2014.07.027.
Hajarizadeh B, Grebely J, Dore GJ. 2013. Epidemiology and natural history ofHCV infection. Nature Reviews Gastroenterology & Hepatology 10:553–562DOI 10.1038/nrgastro.2013.107.
Halfon P, Bourliere M, Penaranda G, Khiri H, Ouzan D. 2006. Real-time PCR assays forhepatitis C virus (HCV) RNA quantitation are adequate for clinical management ofpatients with chronic HCV infection. Journal of Clinical Microbiology 44:2507–2511DOI 10.1128/JCM.00163-06.
Jaeckel E, CornbergM,Wedemeyer H, Santantonio T, Mayer J, Zankel M, PastoreG, DietrichM, Trautwein C, MannsMP. 2001. Treatment of acute hepatitisC with interferon alfa-2b. New England Journal of Medicine 345:1452–1457DOI 10.1056/NEJMoa011232.
Jülicher P, Galli C. 2017. Identifying cost-effective screening algorithms for activehepatitis C virus infections in a high prevalence setting. Journal of Medical EconomicsEpub ahead of print DOI 10.1080/13696998.2017.1369983.
Wasitthankasem et al. (2017), PeerJ, DOI 10.7717/peerj.4008 15/18
Khan H, Hill A, Main J, Brown A, Cooke G. 2017. Can hepatitis C virus antigen testingreplace ribonucleic acid polymearse chain reaction analysis for detecting hepatitisC virus? A systematic review. Open Forum Infectious Diseases 4:Article ofw252DOI 10.1093/ofid/ofw252.
Kuo YH, Chang KC,Wang JH, Tsai PS, Hung SF, Hung CH, Chen CH, Lu SN. 2012. Ishepatitis C virus core antigen an adequate marker for community screening? Journalof Clinical Microbiology 50:1989–1993 DOI 10.1128/JCM.05175-11.
Mederacke I, Potthoff A, Meyer-Olson D, Meier M, Raupach R, MannsMP,Wede-meyer H, Tillmann HL. 2012.HCV core antigen testing in HIV- and HBV-coinfected patients, and in HCV-infected patients on hemodialysis. Journal ofClinical Virology 53:110–115 DOI 10.1016/j.jcv.2011.11.009.
Mederacke I, Wedemeyer H, Ciesek S, Steinmann E, Raupach R,Wursthorn K, MannsMP, Tillmann HL. 2009. Performance and clinical utility of a novel fully automatedquantitative HCV-core antigen assay. Journal of Clinical Virology 46:210–215DOI 10.1016/j.jcv.2009.08.014.
Meffre C, Le Strat Y, Delarocque-Astagneau E, Dubois F, Antona D, Lemasson JM,Warszawski J, Steinmetz J, Coste D, Meyer JF, Leiser S, Giordanella JP, GueguenR, Desenclos JC. 2010. Prevalence of hepatitis B and hepatitis C virus infections inFrance in 2004: social factors are important predictors after adjusting for known riskfactors. Journal of Medical Virology 82:546–555 DOI 10.1002/jmv.21734.
Mixson-Hayden T, Dawson GJ, Teshale E, Le T, Cheng K, Drobeniuc J, Ward J, KamiliS. 2015. Performance of ARCHITECT HCV core antigen test with specimens fromUS plasma donors and injecting drug users. Journal of Clinical Virology 66:15–18DOI 10.1016/j.jcv.2015.02.015.
Morisco F, Loperto I, Stroffolini T, Lombardo FL, Cossiga V, GuarinoM, De Feo A,Caporaso N. 2016. Prevalence and risk factors of HCV infection in a metropolitanarea in southern Italy: tail of a cohort infected in past decades. Journal of MedicalVirology 89:291–297 DOI 10.1002/jmv.24635.
Nebehay S. 2017.Hepatitis drugs more affordable but disease still deadly: WHO. Avail-able at http://www.reuters.com/article/us-health-hepatitis-who-idUSKBN1AC2GG(accessed on 08 August 2017).
Nguyen LT1, Gray E, O’Leary A, Carr M, De Gascun CF, Irish Hepatitis C OutcomesResearch Network. 2017. Irish hepatitis C outcomes research network. The roleof hepatitis C virus core antigen testing in the era of direct acting antiviral ther-apies: what we can learn from the protease inhibitors. PLOS ONE 11:e0163900DOI 10.1371/journal.pone.0163900.
Ottiger C, Gygli N, Huber AR. 2013. Detection limit of architect hepatitis C coreantigen assay in correlation with HCV RNA, and renewed confirmation algo-rithm for reactive anti-HCV samples. Journal of Clinical Virology 58:535–540DOI 10.1016/j.jcv.2013.08.028.
Perz JF, Armstrong GL, Farrington LA, Hutin YJ, Bell BP. 2006. The contributions ofhepatitis B virus and hepatitis C virus infections to cirrhosis and primary liver cancerworldwide. Journal of Hepatology 45:529–538 DOI 10.1016/j.jhep.2006.05.013.
Wasitthankasem et al. (2017), PeerJ, DOI 10.7717/peerj.4008 16/18
Rockstroh JK, Feld JJ, Chevaliez S, Cheng K,Wedemeyer H, Sarrazin C, MaasoumyB, Herman C, Hackett Jr J, Cohen DE, Dawson GJ, Cloherty G, Pawlotsky JM.2017.HCV core antigen as an alternate test to HCV RNA for assessment of virologicresponses to all-oral, interferon-free treatment in HCV genotype 1 infected patients.Journal of Virological Methods 245:14–18 DOI 10.1016/j.jviromet.2017.03.002.
Ross RS, Viazov S, Salloum S, Hilgard P, Gerken G, Roggendorf M. 2010. Analyticalperformance characteristics and clinical utility of a novel assay for total hepatitisC virus core antigen quantification. Journal of Clinical Microbiology 48:1161–1168DOI 10.1128/JCM.01640-09.
RothWK, BuschMP, Schuller A, Ismay S, Cheng A, Seed CR, Jungbauer C, Minsk PM,Sondag-Thull D,Wendel S, Levi JE, FearonM, Delage G, Xie Y, Jukic I, TurekP, UllumH, Tefanova V, Tilk M, Reimal R, Castren J, NaukkarinenM, Assal A,Jork C, Hourfar MK, Michel P, Offergeld R, Pichl L, Schmidt M, Schottstedt V,Seifried E,Wagner F, Weber-Schehl M, Politis C, Lin CK, TsoiWC, O’RiordanJ, Gottreich A, Shinar E, Yahalom V, Velati C, Satake M, Sanad N, Sisene I, BonAH, KoppelmannM, Flanagan P, Flesland O, Brojer E, LetowskaM, NascimentoF, Zhiburt E, Chua SS, Teo D, Stezinar SL, VermeulenM, Reddy R, Park Q,Castro E, Eiras A, Gonzales Fraile I, Torres P, Ekermo B, Niederhauser C, ChenH, Oota S, Brant LJ, Eglin R, Jarvis L, Mohabir L, Brodsky J, Foster G, JenningsC, Notari E, Stramer S, Kessler D, Hillyer C, Kamel H, Katz L, Taylor C, PanzerS, Reesink HW. 2012. International survey on NAT testing of blood donations:expanding implementation and yield from 1999 to 2009. Vox Sanguinis 102:82–90DOI 10.1111/j.1423-0410.2011.01506.x.
Schuttler CG, Thomas C, Discher T, Friese G, Lohmeyer J, Schuster R, Schae-fer S, GerlichWH. 2004. Variable ratio of hepatitis C virus RNA to viralcore antigen in patient sera. Journal of Clinical Microbiology 42:1977–1981DOI 10.1128/JCM.42.5.1977-1981.
Singal AG, VolkML, Jensen D, Di Bisceglie AM, Schoenfeld PS. 2010. A sustainedviral response is associated with reduced liver-related morbidity and mortality inpatients with hepatitis C virus. Clinical Gastroenterology and Hepatology 8:280–288DOI 10.1016/j.cgh.2009.11.018.
Sulkowski MS, Gardiner DF, Rodriguez-Torres M, Reddy KR, Hassanein T, JacobsonI, Lawitz E, Lok AS, Hinestrosa F, Thuluvath PJ, Schwartz H, Nelson DR, EversonGT, Eley T,Wind-Rotolo M, Huang SP, GaoM, Hernandez D, McPhee F, ShermanD, Hindes R, SymondsW, Pasquinelli C, Grasela DM. 2014. Daclatasvir plussofosbuvir for previously treated or untreated chronic HCV infection. New EnglandJournal of Medicine 370:211–221 DOI 10.1056/NEJMoa1306218.
Thong VD, Akkarathamrongsin S, Avihingsanon A, Theamboonlers A, PoovorawanY, Tangkijvanich P. 2015. The correlation between hepatitis C core antigen andhepatitis C virus RNA levels with respect to human immunodeficiency virus status,hepatitis C virus genotype and interferon-lambda-4 polymorphism. Intervirology58:73–79 DOI 10.1159/000370070.
Wasitthankasem et al. (2017), PeerJ, DOI 10.7717/peerj.4008 17/18
Tillmann HL. 2014.Hepatitis C virus core antigen testing: role in diagnosis, diseasemonitoring and treatment.World Journal of Gastroenterology 20:6701–6706DOI 10.3748/wjg.v20.i22.6701.
Wang L, Lv H, Zhang G. 2017.Hepatitis C virus core antigen assay: an alternativemethod for hepatitis C diagnosis. Annals of Clinical Biochemistry 54:279–285DOI 10.1177/0004563216661218.
Wasitthankasem R, Vichaiwattana P, Siripon N, Posuwan N, Auphimai C, Klinfueng S,Thaneskongtong N, Vuthitanachot V, Saiyatha S, Thongmai C, SuwanpatoomlerdS, Sochoo S, Pongsuwan N, Poovorawan K, Tangkijvanich P, Vongpunsawad S,Poovorawan Y. 2017. Assessment of hepatitis C virus infection in two adjacentThai provinces with drastically different seroprevalence. PLOS ONE 12:e0177022DOI 10.1371/journal.pone.0177022.
Wasitthankasem R, Vongpunsawad S, Siripon N, Suya C, Chulothok P, Chaiear K,Rujirojindakul P, Kanjana S, Theamboonlers A, Tangkijvanich P, PoovorawanY. 2015. Genotypic distribution of hepatitis C virus in Thailand and Southeast Asia.PLOS ONE 10:e0126764 DOI 10.1371/journal.pone.0126764.
World Health Organization. 2017.Global hepatitis report 2017. WHO, Geneva. Avail-able at http://www.who.int/hepatitis/ publications/ global-hepatitis-report2017/ en/(accessed on 08 August 2017).
Zeuzem S, Dusheiko GM, Salupere R, Mangia A, Flisiak R, Hyland RH, Illeperuma A,Svarovskaia E, Brainard DM, SymondsWT, Subramanian GM,McHutchison JG,Weiland O, Reesink HW, Ferenci P, Hezode C, Esteban R, Investigators V. 2014.Sofosbuvir and ribavirin in HCV genotypes 2 and 3. New England Journal of Medicine370:1993–2001 DOI 10.1056/NEJMoa1316145.
Wasitthankasem et al. (2017), PeerJ, DOI 10.7717/peerj.4008 18/18