HCMC CBD Market Report | June 2014
16
JUNE 2014 | HCMC CENTRAL BUSINESS DISTRICT CBD MARKET REPORT HO CHI MINH CITY www.colliers.com/vietnam
-
Upload
colliers-international-vietnam -
Category
Real Estate
-
view
46 -
download
1
Transcript of HCMC CBD Market Report | June 2014

JUNE 2014 | HCMC CENTRAL BUSINESS DISTRICT
CBD MARKET REPORTHO CHI MINH CITY
www.colliers.com/vietnam

TABLE OF CONTENTSHCMC CBD MARKET REPORT | JUNE 2014
Market Highlights
OFFICE MARKET
• Market Overview
• Market Performance
• Outlook
• Table
RETAIL MARKET
• Market Overview
• Market Performance
• Outlook
• Table
HOTEL MARKET
• Market Overview
• Market Performance
• Outlook
• Table
SERVICED APARTMENT
• Market Performance
• Outlook
• Table
CONTACTS
Page
2-4
2
3
3
4
4-6
4
4
5
6
6-8
7
7
8
8
8-10
8
9
9
10
. . . . . . . . . . . . . . . . . . . . . . . . . . . . . . . . . . . . . . . . . . . . . . . . . . . . . . . . . . . . . . . .
. . . . . . . . . . . . . . . . . . . . . . . . . . . . . . . . . . . . . . . . . . . . . . . . . . . . . . . . . . . . . . .
. . . . . . . . . . . . . . . . . . . . . . . . . . . . . . . . . . . . . . . . . . . . . . . . . . . . . . . . . . . . . . .
. . . . . . . . . . . . . . . . . . . . . . . . . . . . . . . . . . . . . . . . . . . . . . . . . . . . . . . . . . . . . . .
. . . . . . . . . . . . . . . . . . . . . . . . . . . . . . . . . . . . . . . . . . . . . . . . . . . . . . . . . . . . . . .
. . . . . . . . . . . . . . . . . . . . . . . . . . . . . . . . . . . . . . . . . . . . . . . . . . . . . . . . . . . . . . .
. . . . . . . . . . . . . . . . . . . . . . . . . . . . . . . . . . . . . . . . . . . . . . . . . . . . . . . . . . . . . . .
. . . . . . . . . . . . . . . . . . . . . . . . . . . . . . . . . . . . . . . . . . . . . . . . . . . . . . . . . . . . . . .
. . . . . . . . . . . . . . . . . . . . . . . . . . . . . . . . . . . . . . . . . . . . . . . . . . . . . . . . . . . . . . .
. . . . . . . . . . . . . . . . . . . . . . . . . . . . . . . . . . . . . . . . . . . . . . . . . . . . . . . . . . . . . . .
. . . . . . . . . . . . . . . . . . . . . . . . . . . . . . . . . . . . . . . . . . . . . . . . . . . . . . . . . . . . . . .
. . . . . . . . . . . . . . . . . . . . . . . . . . . . . . . . . . . . . . . . . . . . . . . . . . . . . . . . . . . . . . .
. . . . . . . . . . . . . . . . . . . . . . . . . . . . . . . . . . . . . . . . . . . . . . . . . . . . . . . . . . . . . . .
. . . . . . . . . . . . . . . . . . . . . . . . . . . . . . . . . . . . . . . . . . . . . . . . . . . . . . . . . . . . . . .
. . . . . . . . . . . . . . . . . . . . . . . . . . . . . . . . . . . . . . . . . . . . . . . . . . . . . . . . . . . . . . .
. . . . . . . . . . . . . . . . . . . . . . . . . . . . . . . . . . . . . . . . . . . . . . . . . . . . . . . . . . . . . . .
. . . . . . . . . . . . . . . . . . . . . . . . . . . . . . . . . . . . . . . . . . . . . . . . . . . . . . . . . . . . . . .
. . . . . . . . . . . . . . . . . . . . . . . . . . . . . . . . . . . . . . . . . . . . . . . . . . . . . . . . . . . . . . .
. . . . . . . . . . . . . . . . . . . . . . . . . . . . . . . . . . . . . . . . . . . . . . . . . . . . . . . . . . . . . . .
. . . . . . . . . . . . . . . . . . . . . . . . . . . . . . . . . . . . . . . . . . . . . . . . . . . . . . . . . . . . . . .

As you focus on your customer, we focus on you.You’re an expert in knowing what your customers want—often before they do. We bring the same approach to your business.
Colliers International is built on an enterprising culture of collaboration and innovation. We provide creative, strategic solutions to all our clients.
Whether you need sales and leasing brokerage, property marketing, research and demographics, or asset and property management, we have retail professionals across Vietnam who can meet the real estate needs of retail tenants, landlords and developers.
Today’s real estate challenges require more than geographic reach and local knowledge: they require integrated expertise in market segmentation, valuation, disposition, assembly, debt and equity strategies and much more.
Our integrated platform and our experienced bring you closer to your customers.

HCMC CBD MARKET REPORT
JUNE 2014 | COMMERCIAL OFFICE MARKET
P.2 | Colliers International
From now to the end of this year, the balance of market power is generally toward side of landlords as demand for high-class office
spaces is broadly stable while current supply of prime buildings is limited.
As a result, the interest of tenants will be directed to peripheral locations including District 7, District 2 with better incentives and
similar building specifications.
Moreover, an improvement in global business sentiment as well as a strong growth of FDI inflow (most projects from Asia investors
including Japan with 23%, Singapore 13% and Korea 12%) in the first five months of 2014 boost office leasing activities.
Outlook
GRADE A OFFICE PERFORMANCE, JUNE 2014
Source: Colliers International
GRADE B OFFICE PERFORMANCE, JUNE 2014
Source: Colliers International
Source: Colliers International
Grade AAR Occupancy rate Supply
A ↔
B ↔
B ↔ ↔ ↔
B ↔ ↔
B ↔ ↔ ↔
CITY CENTRAL
FINANCIALHUB
NORTHERN CBD
SOUTHERN CBD
Market PerformanceIn May, most of Grade A buildings in CBD witnessed an
increase of occupancy rate, whilst asking rent slightly
declined by 2% month-on-month, yet growing 4% in
comparison to the same period of 2013.
The wave of contract renewal plus competitive offers
from Grade B buildings pressured weaken adjustment to
operators of Grade A towers in previous month; this is the
second occurence since March 2014.
Meanwhile, occupancy rate of Grade B continued its
upward trend. Grade B buildings in City Central showed
a decrease in occupancy rate while Northern CBD sector
had better performance with 2% m-o-m growth.

HCMC CBD MARKET REPORT
JUNE 2014 | COMMERCIAL OFFICE MARKET
P.3 | Colliers International
HCMC CBD MARKET REPORT
JUNE 2014 | COMMERCIAL OFFICE MARKET
* US$/ sq m/ month (on net area)
Office Market OverviewNo Name Address
Com-pletion Year
NLA (sq m)
Service Charges (*)
Occupancy rate
NFA asking rent (*)
1 Saigon Centre 65 Le Loi 1996 11,650 6.5 95% 40.02 Saigon Tower 29 Le Duan 1997 13,950 6.0 99% 37.03 Sunwah Tower 115 Nguyen Hue 1997 20,800 6.0 93% 44.04 The Metropolitan 235 Dong Khoi 1997 15,200 6.0 94% 41.05 Diamond Plaza 34 Le Duan 1999 15,936 8.0 99% 41.06 Kumho Asiana Plaza 39 Le Duan 2009 26,000 8.0 90% 44.07 Bitexco Financial Tower 45 Ngo Duc Ke 2010 37,710 8.0 88% 34.08 President Place 93 Nguyen Du 2012 8,330 6.0 97% 30.0
9 Times Square 22-36 Nguyen Hue 2012 9,000 7.0 60% 50.0
Grade A 184,280 7.0 90.3% 39.9
1 OSIC 8 Nguyen Hue 1993 6,500 6.0 97% 20.02 Yoco Building 41 Nguyen Thi Minh Khai 1995 5,000 4.0 100% 16.03 Somerset Chancellor Court 21-23 Nguyen Thi Minh Khai 1996 3,200 5.0 100% 21.04 Central Plaza 17 Le Duan 1997 6,094 5.0 100% 26.05 Saigon Riverside Office 2A-4A Ton Duc Thang 1997 10,000 5.0 98% 20.06 Saigon Trade Center 37 Ton Duc Thang 1997 31,416 6.0 96% 23.07 Harbour View Tower 35 Nguyen Hue 1997 8,000 5.0 93% 20.0
8 MeLinh Point Tower 02 Ngo Duc Ke 1999 17,600 6.0 99% 24.09 Zen Plaza 54-56 Nguyen Trai 2001 11,037 5.0 95% 21.010 Bitexco Office Building 19-25 Nguyen Hue 2003 6,000 5.0 92% 25.011 The Landmark 5B Ton Duc Thang 2005 8,000 5.0 82% 21.012 Opera View 161-167 Dong Khoi 2006 3,100 7.0 90% 26.013 Indochina Park Tower 4Bis Nguyen Dinh Chieu 2006 2,145 3.0 77% 10.014 Petro Tower 1-5 Le Duan 2007 13,304 5.0 99% 30.015 City Light 45 Vo Thi Sau 2007 10,000 5.0 98% 15.016 The Landcaster 22Bis Le Thanh Ton 2007 7,000 5.0 100% 24.017 Gemadept Tower 5 Le Thanh Ton 2008 14,000 7.0 100% 23.018 Fideco Tower 81-85 Ham Nghi 2008 15,000 6.0 100% 20.019 Havana Tower 132 Ham Nghi 2008 7,326 6.0 99% 21.020 Sailing Tower 51 Nguyen Thi Minh Khai 2008 16,910 6.0 98% 26.021 Royal Center 235 Nguyen Van Cu 2008 14,320 5.0 100% 23.022 TMS 172 Hai Ba Trung 2009 4,000 4.0 100% 23.023 Bao Viet Tower 233 Dong Khoi 2010 10,650 6.0 100% 21.024 Green Power Tower 35 Ton Duc Thang 2010 15,600 6.0 96% 22.025 Vincom Center 68-70-72 Le Thanh Ton 2010 56,600 5.0 70% 23.026 Saigon Royal 91 Pasteur 2010 5,340 4.0 100% 19.027 A&B Tower 76 Le Lai 2010 17,120 6.0 99% 28.028 Maritime Bank Tower 192 Nguyen Cong Tru 2010 19.596 5.0 89% 23.029 Empress Tower 138 Hai Ba Trung 2012 19,538 6.0 93% 26.030 Lim Tower 9-11 Ton Duc Thang 2013 29,265 6.0 97% 28.031 Sunny MB Tower 259 Tran Hung Dao 2013 13,200 5.5 12% 22.0
Grade B 399,596 6.0 89.5% 23.0

P.4 | Colliers International
HCMC CBD MARKET REPORT
JUNE 2014 | CBD OFFICE MAP
* US$/ sq m/ month (on net area)
HCMC CBD MARKET REPORT
JUNE 2014 | RETAIL MARKET
HCMC CBD MARKET REPORT
JUNE 2014 | CBD OFFICE MAP
HCMC CBD MARKET REPORT
JUNE 2014 | RETAIL MARKET
P.5 | Colliers International
The average rental rate of retail podium, department store and
shopping mall remain unchanged during May.
It is noticed that retail podium shows firm stability in rents
throughout last year given fully occupied condition.
Whereas, operators of shopping center and department store
in CBD area retain high rental rate since slight declining
adjustment since early of 2014.
Department store saw flat occupancy rate in May while that of
shopping center kept slumping with 2% drop.
Following brand consolidation trends, instead of moving
out, some tenants in CBD shopping malls tend to relocate to
small-sized spaces along walkway regarding efficient area
and cost saving.
However, there are still numbers of closed shops in central
retail areas as a result of long-lasting plunge of consumer
power.
Market Performance
Outlook
SHOPPING CENTER MARKET PERFORMANCE, JUNE 2014
SMALL-SIZED SHOPS ALONG WALKWAY @ UNIONSQUARE
Source: Colliers International
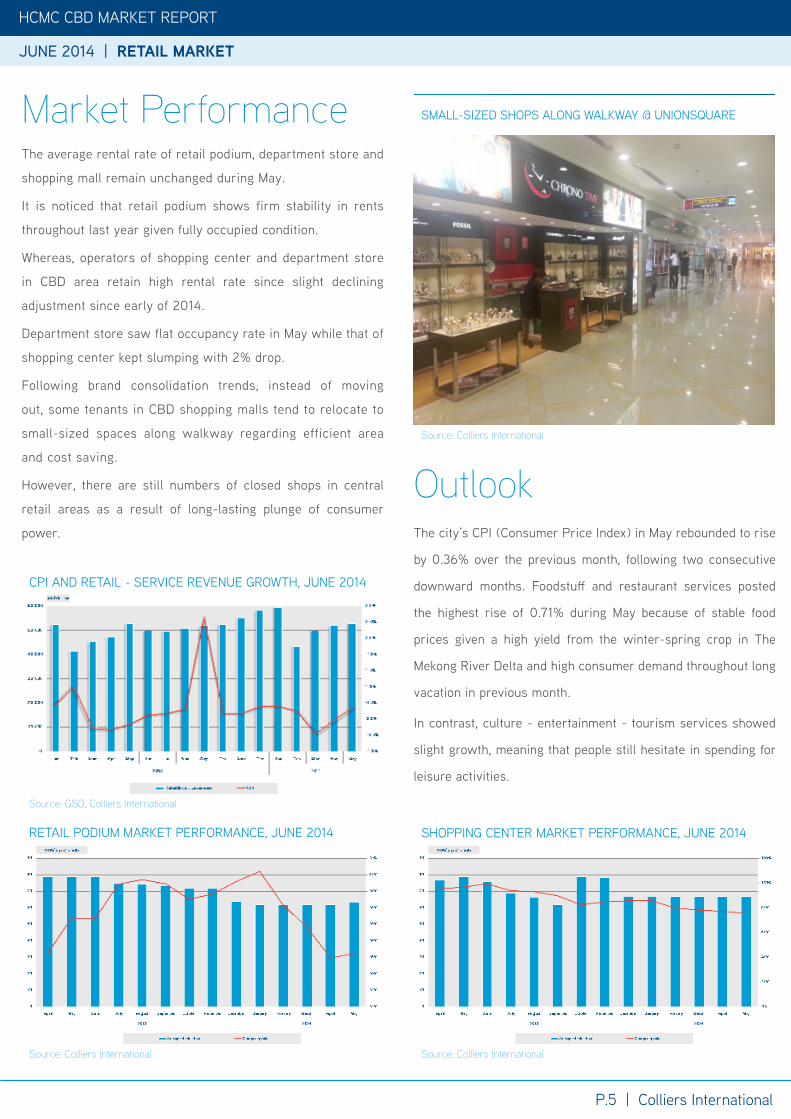
The city’s CPI (Consumer Price Index) in May rebounded to rise
by 0.36% over the previous month, following two consecutive
downward months. Foodstuff and restaurant services posted
the highest rise of 0.71% during May because of stable food
prices given a high yield from the winter-spring crop in The
Mekong River Delta and high consumer demand throughout long
vacation in previous month.
In contrast, culture - entertainment - tourism services showed
slight growth, meaning that people still hesitate in spending for
leisure activities.
Source: Colliers International
RETAIL PODIUM MARKET PERFORMANCE, JUNE 2014
Source: Colliers International
CPI AND RETAIL - SERVICE REVENUE GROWTH, JUNE 2014
Source: GSO, Colliers International
P.6 | Colliers International
HCMC CBD MARKET REPORT
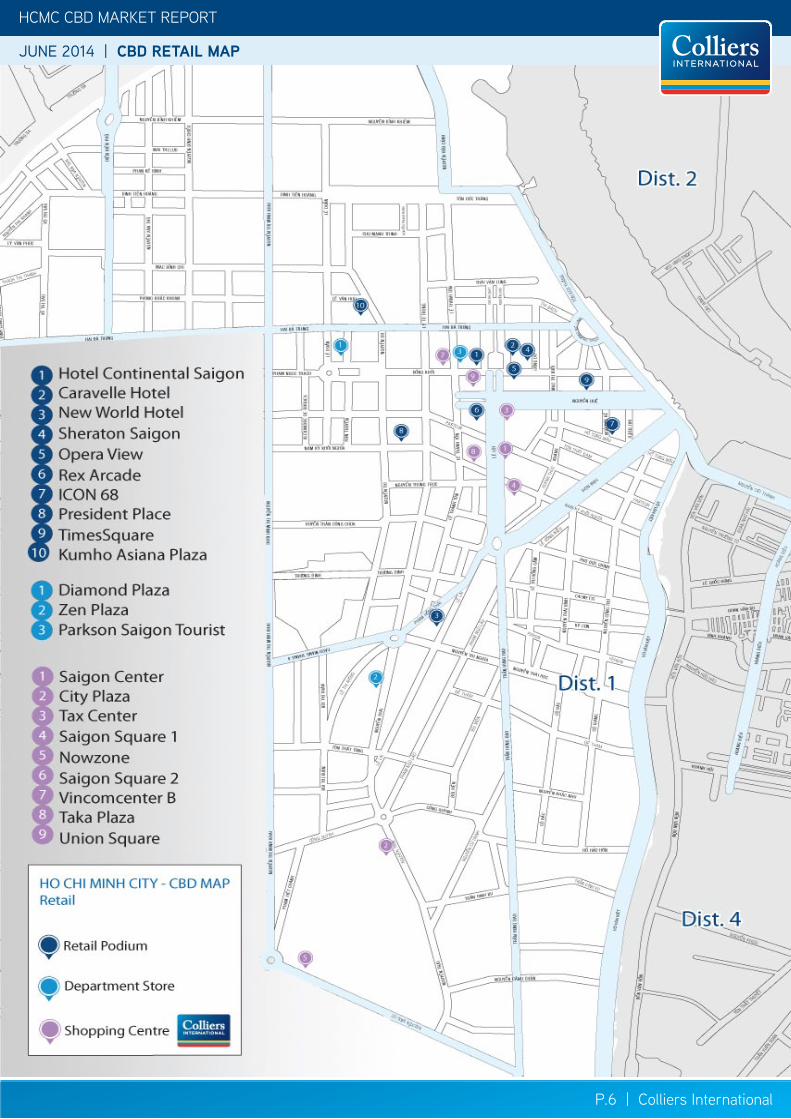
JUNE 2014 | CBD RETAIL MAP
* US$/ sq m/ month (on net area)
JUNE 2014 | RETAIL MARKET
JUNE 2014 | HOTEL MARKET

HCMC CBD MARKET REPORT
JUNE 2014 | CBD RETAIL MAP
KUMHO MONTHLY MARKET REPORTJUNE 2014 | RETAIL MARKET HCMC CBD MARKET REPORT
P.7 | Colliers International
No Name of Project /Building Address Location Comple-
tion YearNLA
(sq m)Average Rental
(US$/sq m/month) Occupancy Rate
1 Hotel Continental Saigon 132-134 Dong Khoi District 1 2000 200 90 100%2 Caravelle Hotel 19 Lam Son Square District 1 2000 150 90 100%3 New World Hotel 79 Le Lai District 1 2000 1,000 40 100%4 Sheraton Saigon 88 Dong Khoi District 1 2002 750 125 100%5 Opera View Lam Son Square District 1 2006 1,260 85 100%6 Kumho Asiana Plaza 35 Le Duan District 1 2009 6,830 35 100%7 Rex Arcade 141 Nguyen Hue District 1 2010 2,000 120 100%8 ICON 68 45 Ngo Duc Ke District 1 2011 8,000 35 79%9 President Place 93 Nguyen Du District 1 2012 800 70 71%10 Times Square 22-36 Nguyen Hue District 1 2013 9,000 90 72%
Retail Podium 29,990 63 82.9%
1 Diamond Plaza 34 Le Duan District 1 1999 9,000 83 100%2 Zen Plaza 54-56 Nguyen Trai District 1 2001 6,817 52 100%3 Parkson Saigon Tourist 35 Le Thanh Ton District 1 2002 17,000 90 100%
Department Store 30,200 82.6 100%
1 Saigon Center 65 Le Loi District 1 1996 3,500 75 100%2 City Plaza 230 Nguyen Trai District 1 2000 5,250 25 100%3 Tax Center 135 Nguyen Hue District 1 2003 7,000 75 100%4 Saigon Square 1 77-89 Nam Ky Khoi Nghia District 1 2006 1,300 167 100%5 Nowzone Nguyen Van Cu District 1 2008 9,000 35 95%6 Saigon Square 2 7-9 Ton Duc Thang District 1 2009 1,400 90 80%7 Vincom Center B 72 Le Thanh Ton District 1 2010 45,000 63 75%
8 Taka Plaza 102 Nam Ky Khoi Nghia District 1 2011 1,000 90 100%
9 Union Square Dong Khoi District 1 2012 38,000 73 60%
Shopping Centre 113,450 66.9 75%
No Name of Hotel Address Location Comple-tion Year Total Room Occupancy ARR(*)
1 Caravelle 19 Lam Son Square District 1 2000 335 60% 1772 New World Saigon 76 Le Lai District 1 2000 533 64% 1033 Sofitel Plaza Saigon 17 Le Duan District 1 2000 290 70% 1294 Rex 141 Nguyen Hue District 1 2000 289 79% 1005 Renaissance Riverside 8-15 Ton Duc Thang District 1 2001 350 71% 1166 Lotte Legend Hotel 2A-4A Ton Duc Thang District 1 2001 283 61% 1557 Sheraton 88 Dong Khoi District 1 2002 480 72% 1998 Park Hyatt Saigon 02 Lam Son Square District 1 2005 259 78% 2529 Majestic Saigon 1 Dong Khoi District 1 2007 175 68% 11610 InterContinental Asiana 39 Le Duan District 1 2009 305 82% 21411 Nikko Saigon 235 Nguyen Van Cu District 1 2011 334 76% 10012 Pullman Hotel 146 Tran Hung Dao District 1 2013 306 57% 91
5 Star 3,633 69% 145
1 Continental Saigon 132-134 Dong Khoi District 1 1990 86 74% 872 Norfolk Hotel 117-119 Le Thanh Ton District 1 1992 104 76% 863 Duxton 63 Nguyen Hue District 1 1996 203 80% 804 Royal City 133 Nguyen Hue District 1 2000 135 68% 755 Palace Saigon 56-66 Nguyen Hue District 1 2000 146 89% 576 Oscar 68A Nguyen Hue District 1 2000 108 73% 407 Liberty Central 179 Le Thanh Ton District 1 2010 140 75% 568 Grand 08 Dong Khoi District 1 2011 107 70% 779 Liberty Central Riverside 17 Ton Duc Thang District 1 2013 170 70% 64
4 Star 1,161 74% 65.7
JUNE 2014 | HOTEL MARKET HCMC CBD MARKET REPORT

P.8 | Colliers International
HCMC CBD MARKET REPORT
JUNE 2014 | CBD HOTEL MAP
* US$/ sq m/ month (on net area)
HCMC CBD MARKET REPORT
JUNE 2014 | CBD HOTEL MAP
P.9 | Colliers International
HCMC CBD MARKET REPORT
JUNE 2014 | HOTEL MARKET
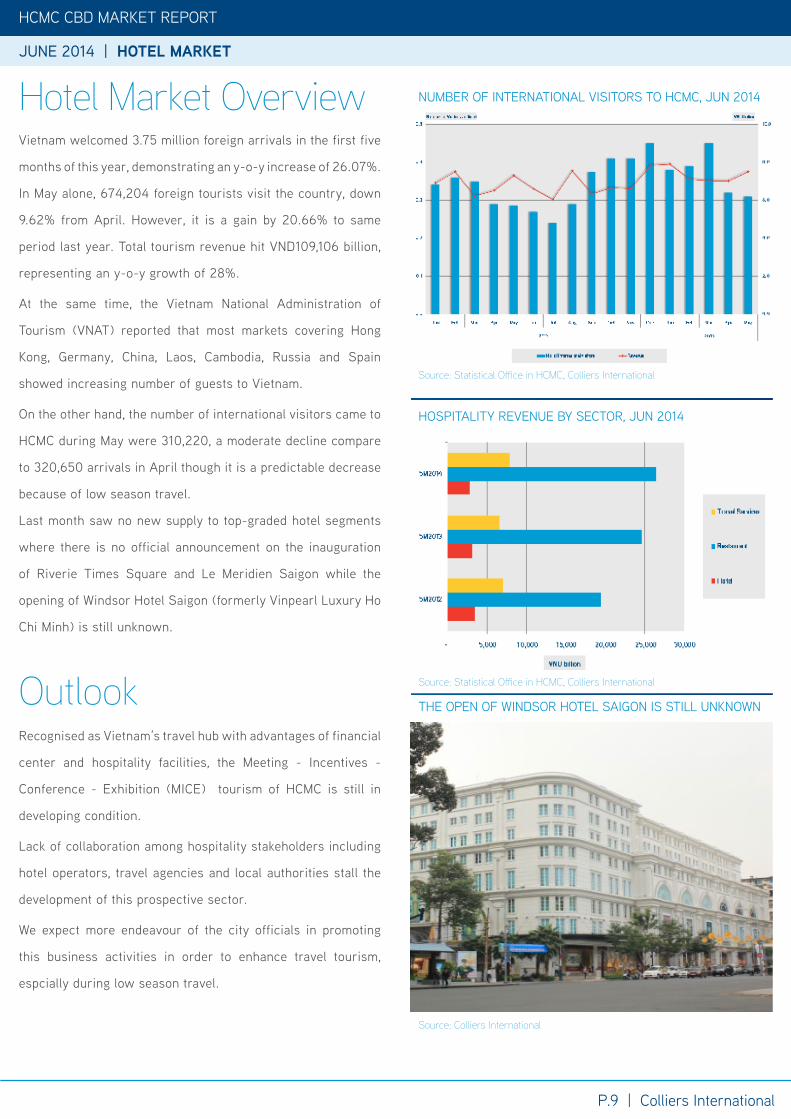
Vietnam welcomed 3.75 million foreign arrivals in the first five
months of this year, demonstrating an y-o-y increase of 26.07%.
In May alone, 674,204 foreign tourists visit the country, down
9.62% from April. However, it is a gain by 20.66% to same
period last year. Total tourism revenue hit VND109,106 billion,
representing an y-o-y growth of 28%.
At the same time, the Vietnam National Administration of
Tourism (VNAT) reported that most markets covering Hong
Kong, Germany, China, Laos, Cambodia, Russia and Spain
showed increasing number of guests to Vietnam.
On the other hand, the number of international visitors came to
HCMC during May were 310,220, a moderate decline compare
to 320,650 arrivals in April though it is a predictable decrease
because of low season travel.
Last month saw no new supply to top-graded hotel segments
where there is no official announcement on the inauguration
of Riverie Times Square and Le Meridien Saigon while the
opening of Windsor Hotel Saigon (formerly Vinpearl Luxury Ho
Chi Minh) is still unknown.
Hotel Market Overview
OutlookRecognised as Vietnam’s travel hub with advantages of financial
center and hospitality facilities, the Meeting - Incentives -
Conference - Exhibition (MICE) tourism of HCMC is still in
developing condition.
Lack of collaboration among hospitality stakeholders including
hotel operators, travel agencies and local authorities stall the
development of this prospective sector.
We expect more endeavour of the city officials in promoting
this business activities in order to enhance travel tourism,
espcially during low season travel.
NUMBER OF INTERNATIONAL VISITORS TO HCMC, JUN 2014
Source: Statistical Office in HCMC, Colliers International
HOSPITALITY REVENUE BY SECTOR, JUN 2014
Source: Statistical Office in HCMC, Colliers International
THE OPEN OF WINDSOR HOTEL SAIGON IS STILL UNKNOWN
Source: Colliers International

P.10 | Colliers International
HCMC CBD MARKET REPORT
JUNE 2014 | HOTEL MARKET
Both 4- and 5-star hotels in CBD area experienced periodical
downturn during May.
The average room rate of both segments drop 2% last month
given seasonal adjustment from the operators.
The 5-star segment saw 7% slide in occupancy rate while that of
4-star also decreased by 4%.
Market Performance
PERFORMANCE OF 5-STARS HOTEL, JUN 2014
Source: Colliers International
JUNE 2014 | SERVICED APARTMENT MARKET
Serviced Apartment OverviewCBD SERVICED APARTMENTS FUTURE DEMAND
Source: Colliers International
CBD SERVICED APARTMENTS PERFORMANCE, JUN 2014
Source: Colliers International
PERFORMANCE OF 4-STARS HOTEL, JUN 2014
Source: Colliers International
HCMC HOTEL PERFORMANCE BY GRADE, JUN 2014
Source: Statistical Office in HCMC, Colliers International
HCMC CBD MARKET REPORT
JUNE 2014 | SERVICED APARTMENT MARKET

HCMC CBD MARKET REPORT
JUNE 2014 | HOTEL MARKET
JUNE 2014 | SERVICED APARTMENT MARKET
P.11 | Colliers International
HCMC CBD MARKET REPORT
No Project Name Address Location Comple-tion Year
Total Room
Average Occupancy ARR(*)
1 The Landmark 5B Ton Duc Thang District 1 1995 66 82% 312 Somerset Chancellor Court 21-23 Nguyen Thi Minh Khai District 1 1996 172 92% 343 Sedona Suites 65 Le Loi District 1 1996 89 79% 304 Nguyen Du Park Villas 111 Nguyen Du District 1 2004 41 94% 305 The Landcaster 22 Bis Le Thanh Ton District 1 2007 55 73% 376 InterContinental Asiana Saigon 39 Le Duan District 1 2009 260 94% 36
Grade A 701 89% 34
1 Somerset HCM 8A Nguyen Binh Khiem District 1 1998 165 87% 262 Saigon Sky Garden 20 Le Thanh Ton District 1 1998 154 85% 263 Norfolk Mansion 17-21 Ly Tu Trong District 1 1998 126 90% 334 Diamond Plaza 34 Le Duan District 1 1999 42 93% 295 Garden View Court 101 Nguyen Du District 1 2000 76 93% 316 Ben Thanh Luxury 172-174 Ky Con District 1 2010 30 60% 187 Vincom Center 72 Le Thanh Ton District 1 2010 60 34% 26
8 Lafayette De Saigon 08 Phung Khac Khoan District 1 2010 18 100% 30
9 Spring Court 1Bis Phung Khac Khoan District 1 2011 14 78% 16
10 Nikko Saigon 235 Nguyen Van Cu District 1 2011 54 60% 28
11 Saigon City Residence 8A/3D2 Thai Van Lung District 1 2011 17 100% 30
Grade B 738 80% 27
* US$/sq m/month** Not including VAT*** Buildings are sorted by Year of Completion
JUNE 2014 | SERVICED APARTMENT MARKET
Besides Waterfront in District 7 and Waterfront Serviced Residence
in Thao Dien, District 2, HCMC serviced apartments market welcomed
another Waterfront Saigon development in District 1. This building is
refunctioned and renamed from the Delta River Tower project which
formly advertised as Residential and Commercial Complex.
Although details are not released yet, this CBD development is
expected to put more pressure on the highly competitive market
segment.
Outlook
Grade A and B serviced apartments in HCMC CBD showed stability in
both average asking rent and occupancy rate in the last two months.
Grade A serviced apartments retained occupied rate at almost 90%
while Grade B developments also unchanged 80% ratio.
Market Performance WATERFRONT SAIGON SERVICED APARTMENTS UNDER COMPLETION, JUN 2014
Source: Colliers International

HCMC CBD MARKET REPORT
JUNE 2014 | CBD SERVICED APARTMENT MAP
P.12 | Colliers International

HCMC CBD MARKET REPORT
JUNE 2014 | CBD SERVICED APARTMENT MAP
P.12 | Colliers International

HCMC CBD MARKET REPORT | JUNE 2014
With more than 100 professionals in 2 offices in Vietnam, the team is market driven and has proven and successful track record with both international and local experience.
From Hanoi to Ho Chi Minh City, we provide a full range of real estate services
•Research > Market research across all sectors > Market analysis, advisory, and strategy
•Valuation & Advisory Services > Valuation for land, existing property or development sites > Feasibility studies to determine NPV, IRR and highest & best use
•Office Services > Tenant Representation > Landlord Representation
•Residential Sales & Leasing
•Retail Services
• Investment Services
•Real Estate Management Services
•Corporate Services
• Industrial Leasing
The foundation of our services is the strength and depth of our experience.
COLLIERS INTERNATIONAL
HO CHI MINH CITYBitexco Office Building, 7th Floor19-25 Nguyen Hue StreetDistrict 1, HCM City, VietnamTel: + 84 8 3827 5665
HANOICapital Tower, 10th Floor109 Tran Hung Dao Street, Hoan Kiem District, Hanoi, VietnamTel: +84 4 3941 3277
485 offices in63 countries on6 continentsUnited StatesCanadaLatin AmericaAsia PacificEMEA
Accelerating success
: 140: 42: 20: 195: 85
QUANG NGUYENResearch [email protected]+84 938 056 603
YEN NGUYENResearch [email protected]+84 915 478 778
About Colliers InternationalColliers International is a leader in global real estate services, defined by our spirit of enterprise.Through a culture of service excellence and a shared sense of initiative, we integrate the resources of real estate specialists worldwide to accelerate the success of our partners.
We connect through a shared set of values that shape a collaborative environment throughout our organization that is unsurpassed in the industry.
Publication Coverage Frequency Content Availability
Investment Report Vietnam Quarterly Capital Markets Publicly available
Research & Forecast Report
Vietnam Cities Quarterly All market sectors Publicly available
CBD Report HCMC CBD Monthly Office, Retail, Hotel and Serviced Apartment
Publicly available
Asia Pacific Office Report
Asia Pacific in-cluding Vietnam
Quarterly Office market Publicly available
Vietnam Property Market Report
Vietnam cities Quarterly All market sectors On subscription
Development Recommendation
Vietnam cities At request All market sectors On subscription
$2billion in annual revenue
2.5billion square feet under management
15,700professionalsand staff
www.colliers.com/vietnam
Please contact, If you would like to recieve our other research reports
This document has been prepared by Colliers International for advertising and general information only. Colliers International makes no guarantees, representations or warranties of any kind, expressed or implied, regarding the information including, but not limited to, warranties of content, accuracy and reliability. Any interested party should undertake their own inquiries as to the accuracy of the information. Colliers International excludes unequivocally all inferred or implied terms, conditions and warranties arising out of this document and excludes all liability for loss and damages arising there from. This publication is the copyrighted property of Colliers International and/or its licensor(s). ©2013. All rights reserved.