
HCA’s 2017 Value-based Purchasing Survey Results · Regulatory changes (0.75) Tied Managed Care...
34
HCA’s 2017 Value-based Purchasing Survey Results Published: March 6, 2018 1
Transcript of HCA’s 2017 Value-based Purchasing Survey Results · Regulatory changes (0.75) Tied Managed Care...
HCA’s 2017 Value-based Purchasing Survey
Results
Published: March 6, 2018
1

HCA’s Value-based Roadmap
2
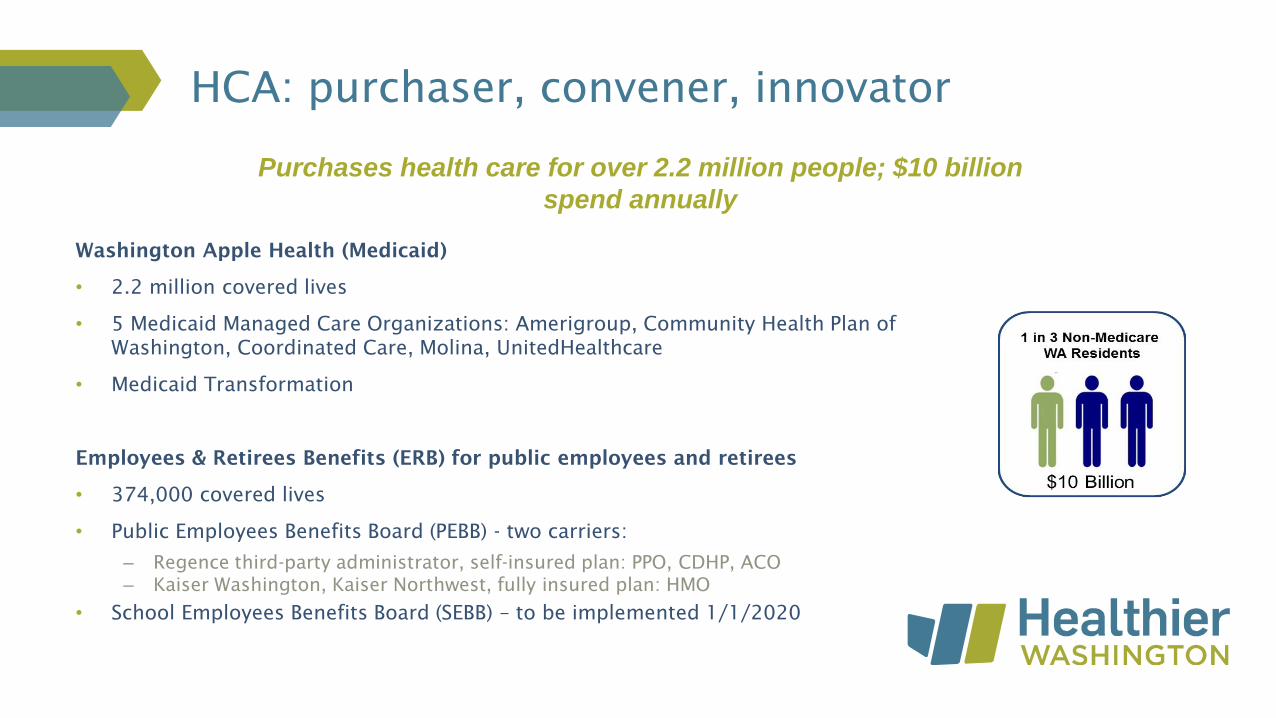
Washington Apple Health (Medicaid)
• 2.2 million covered lives
• 5 Medicaid Managed Care Organizations: Amerigroup, Community Health Plan of
Washington, Coordinated Care, Molina, UnitedHealthcare
• Medicaid Transformation
Employees & Retirees Benefits (ERB) for public employees and retirees
• 374,000 covered lives
• Public Employees Benefits Board (PEBB) - two carriers:
– Regence third-party administrator, self-insured plan: PPO, CDHP, ACO
– Kaiser Washington, Kaiser Northwest, fully insured plan: HMO
• School Employees Benefits Board (SEBB) – to be implemented 1/1/2020
HCA: purchaser, convener, innovator
Purchases health care for over 2.2 million people; $10 billion
spend annually

By 2021:
• 90 percent of state financed health care and 50 percent of
commercial health care will be in value-based payment (VBP)
arrangements (measured at the provider/practice level).
• Washington’s annual health care cost growth will be below the
national health expenditure trend.
HCA purchasing goals
Tools to accelerate VBP and health care transformation: • 2014 legislation directing HCA to implement VBP strategies• SIM Round 2 grant, 2015-2019• DSRIP Medicaid Transformation 2017-2021

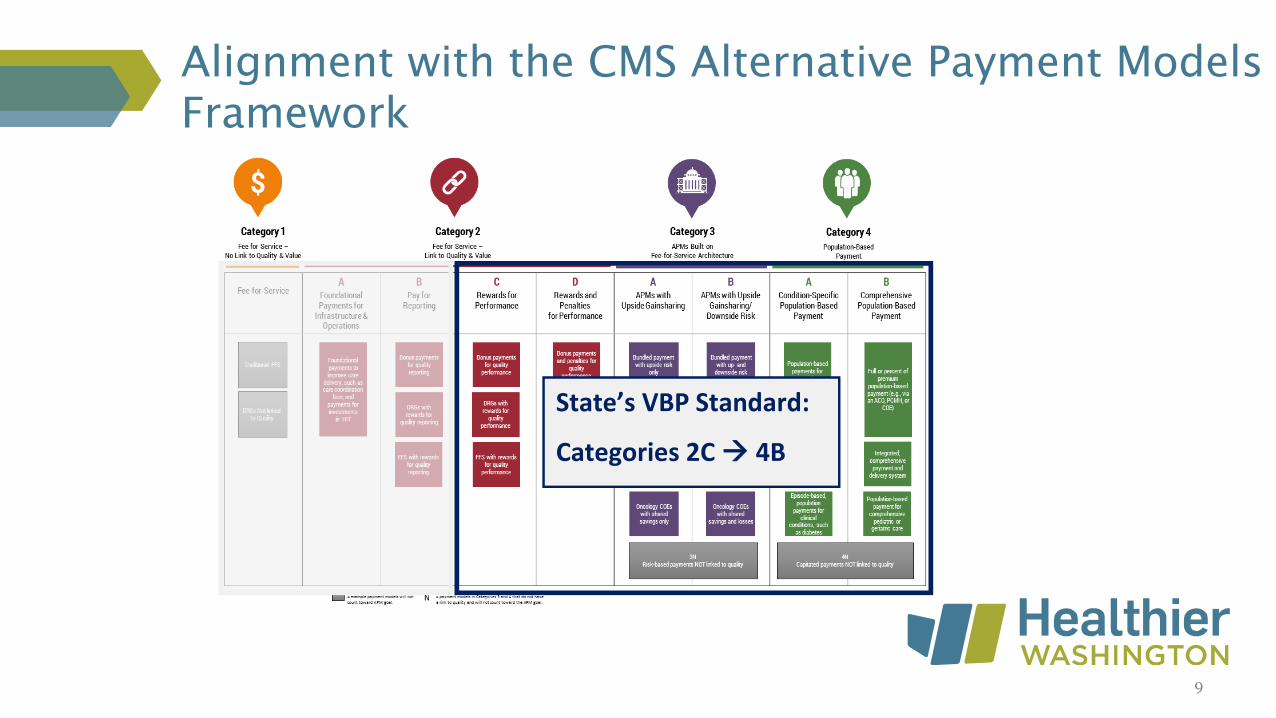
Alignment with the CMS Alternative Payment Models
Framework
State’s VBP Standard:
Categories 2C 4B
5

HCA’s Value-based Roadmap
6
Medicaid –Apple Health
Employee & Retiree Benefits
2016: 20% VBP
2021: 90% VBP
1. Reward patient-centered, high quality care
2. Reward health plan and system performance
3. Align payment and reforms with the federal government
4. Improve outcomes
5. Drive standardization
6. Increase sustainability of state health programs
7. Achieve Triple/Quadruple Aim
2016 actual: 30% VBP

HCA’s 2017 Value-based Purchasing Survey
7
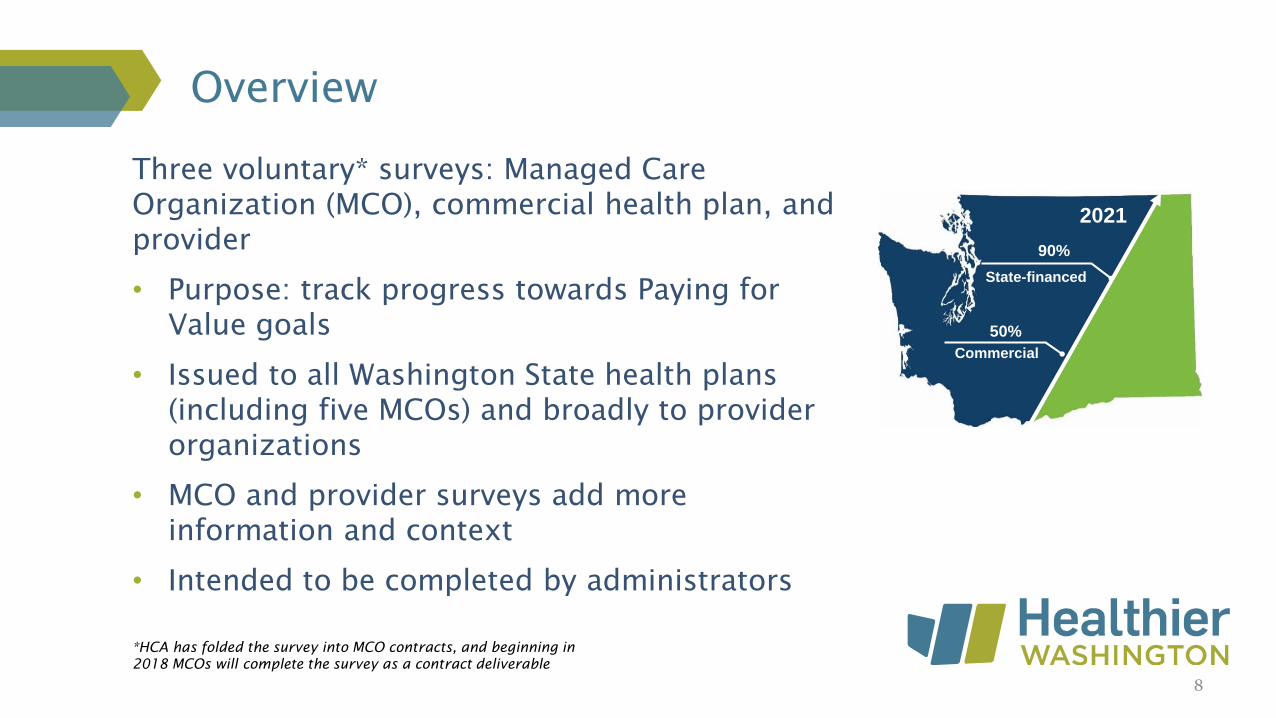
Three voluntary* surveys: Managed Care
Organization (MCO), commercial health plan, and
provider
• Purpose: track progress towards Paying for
Value goals
• Issued to all Washington State health plans
(including five MCOs) and broadly to provider
organizations
• MCO and provider surveys add more
information and context
• Intended to be completed by administrators
Overview
2021
90%
State-financed
50%
Commercial
8
*HCA has folded the survey into MCO contracts, and beginning in
2018 MCOs will complete the survey as a contract deliverable
Alignment with the CMS Alternative Payment Models
Framework
9
State’s VBP Standard:
Categories 2C 4B

Survey templates – payers
10
Medicaid Medicare Commercial
1
FFS – No Link to
Quality
1 Fee-for-Service - - -
2AFoundationalPayments for
Infrastructure & Operations - - -
2B Pay for Reporting - - -
2C Rewards for Performance - - -
2DRewards and Penalties for
Performance - - -
3A APMs with Upside Gainsharing - - -
3BAPMs with Updside Gainsharing and
Downside Risk - - -
4ACondition-Specific Population-Based
Payment - - -
4BComprehensive Population-Based
Payment - - -
APM
CategoryAPM Subcategory Strategy
2
FFS - Link to
Quality
Sector
3
APMs built on
FFS Architecture
4
Population-Based
Payment
Table 2: Total Annual Statewide Covered Lives by APM CategoryTable 1: Total Annual Statewide Payments by APM Category (2016)
Medicaid Medicare Commercial
1
FFS - No Link to
Quality
1 Fee-for-Service $ - $ - $ -
2AFoundationalPayments for
Infrastructure & Operations $ - $ - $ -
2B Pay for Reporting $ - $ - $ -
2C Rewards for Performance $ - $ - $ -
2DRewards and Penalties for
Performance $ - $ - $ -
3A APMs with Upside Gainsharing $ - $ - $ -
3BAPMs with Updside Gainsharing and
Downside Risk $ - $ - $ -
4ACondition-Specific Population-Based
Payment $ - $ - $ -
4BComprehensive Population-Based
Payment $ - $ - $ -
$ - $ - $ - Total Annual Payments
3
APMs built on
FFS Architecture
4
Population-Based
Payment
2
FFS - Link to
Quality
APM
Category
Sector
APM Subcategory Strategy
*Asked MCOs for regional (by ACH) breakdowns of payments and covered lives
I.
Barriers and Enablers to VBP Adoption
From the lists below, rank your perceived TOP FIVE barriers and TOP FIVE enablers to the
adoption of VBPs by using the numbers 1 through 5 in column B (with "1" corresponding with the
most significant barrier/enabler).
A)Barriers: In your organization's experience, what are the TOP FIVE BARRIERS to the
adoption of VBP arrangements?
Interoperable data systems
Lack of cost transparency
Payment model uncertainty
Consumer engagement
Attribution
Regulatory changes
Disparate incentives/contract requirements
Lack of collaboration
Disparate quality measurements/definitions
State-based initiatives (e.g. State Innovation Model grat - Healthier Washington; Medicaid
Transformation Demonstration)
Other:
B)Enablers: In your organization's experience, what are the TOP FIVE ENABLERS to the
adoption of VBP arrangements?
Interoperable data systems
Cost transparency
Payment model technical assistance
Consumer engagement
Attribution
Regulatory changes
Aligned incentives/contract requirements
Trusted partnerships and collaboration
Aligned quality measurements/definitions
State-based initiatives (e.g. State Innovation Model grat - Healthier Washington; Medicaid
Transformation Demonstration)
Other:
II. Quality Metrics Applied to Current VBP Contracts
A)
Alignment of Quality Measures Used to Assess Provider Performance in Current VBP
Contracts
(Select most appropriate response in drop down and provide any additional information in area to
right)
1. Contracts. Does your organization use the same set(s) of quality measures (e.g., HEDIS
measures, Statewide Common Measure Set, plan-specific measures) across provider contracts? If
so, please provide information on the extent of alignment across contracts and what types of
measures are used, if applicable.
2. State. Has your organization made any effort to align quality measures used in VBP contracts
with those used by the State (Health Care Authority)? If so, please provide information on the extent
of alignment.
3. Other Entities. Has your organization made any effort to align quality measures used in VBP
contracts with those used by any other entities or payment initiatives (e.g., other payers, specific
projects or initiatives)? If so, please provide information on the extent and nature of alignment.III. Traditional organization Functions
A)
Under certain VBP arrangements, organizations may shift traditionally organization-based
functions onto contracted providers. Which of the following roles are your providers with
VBP contracts performing, in all or in part? (Note: This refers to shared functionality
rather than formal delegation.)
(Select "X" for each that applies and provide any additional information in area to right, if
applicable)
Care coordination
Utilization management
Provider network management
Provider payments
Quality management
Other: _____________________________________________________________

Provider info
• Name
• Type
• Size
• Service location
VBP
• Revenue (total and %VBP by APM category)
• Rated experience w/VBP
• Enablers/barriers
• Projected future participation in VBP
Survey templates – providers
A)
B)
Other
Provider Information
Organization Name (Include provider name if independent practice)
Enter text here
Which type(s) of provider organization most closely aligns with your organization? (Select "X" for each applicable)
Not-for-profit
Independent, multi-provider single-specialty practice
Multi-specialty practice
Rural Health Clinic
For-profit
Single-provider practice
I.
Hospital
Critical Access Hospital
Inpatient clinic/facility, including evaluation and treatment centers
Outpatient clinic/facility
Behavioral health provider (e.g., mental health provider, substance use disorder provider)
Federally Qualified Health Center
Tribal health care provider
If other, please describe: Enter text here
11
A) Medicaid MedicareOther
GovernmentCommercial Self Pay
$ - $ - $ - $ - $ -
Medicaid MedicareOther
GovernmentCommercial Self Pay
1 - FFS, No Link
to Quality1 Fee-for-Service 0% 0% 0% 0% 0%
2A Foundational Payments for Infrastructure &
Operations 0% 0% 0% 0% 0%
2B Pay for Reporting 0% 0% 0% 0% 0%
2C Rewards for Performance 0% 0% 0% 0% 0%
2D Rewards and Penalties for Performance 0% 0% 0% 0% 0%
3A APMs with Upside Gainsharing 0% 0% 0% 0% 0%
3B APMs with Upside Gainsharing and Downside Risk 0% 0% 0% 0% 0%
4A Condition-Specific Population-Based Payment 0% 0% 0% 0% 0%
4B Comprehensive Population-Based Payment 0% 0% 0% 0% 0%
0% 0% 0% 0% 0%
2 - FFS, Link to
Quality
3 - APMs Built
on FFS
Total (should equal to 100% for each payer)
4 - Population-
Based Payment
(i) Total Revenue for CY 2016 (Enter revenue, as defined in
Definitions tab, in space to the right)
(ii) Did you receive any of this CY 2016 revenue through VBP,
defined as payments made through arrangements described in
Categories 2C through 4B, below? (Categories are listed below and
defined in Definitions tab; select "Yes" or "No" to right)
(iii) For each payer, what is the approximate percentage of
revenue for each payment category listed below? (Enter
approximate percentage to the right of each payment category, as
defined in Definitions tab)
For each payer (Medicaid, Medicare, commercial), please provide
the following:
II. Participation in Value-Based Payment (VBP)
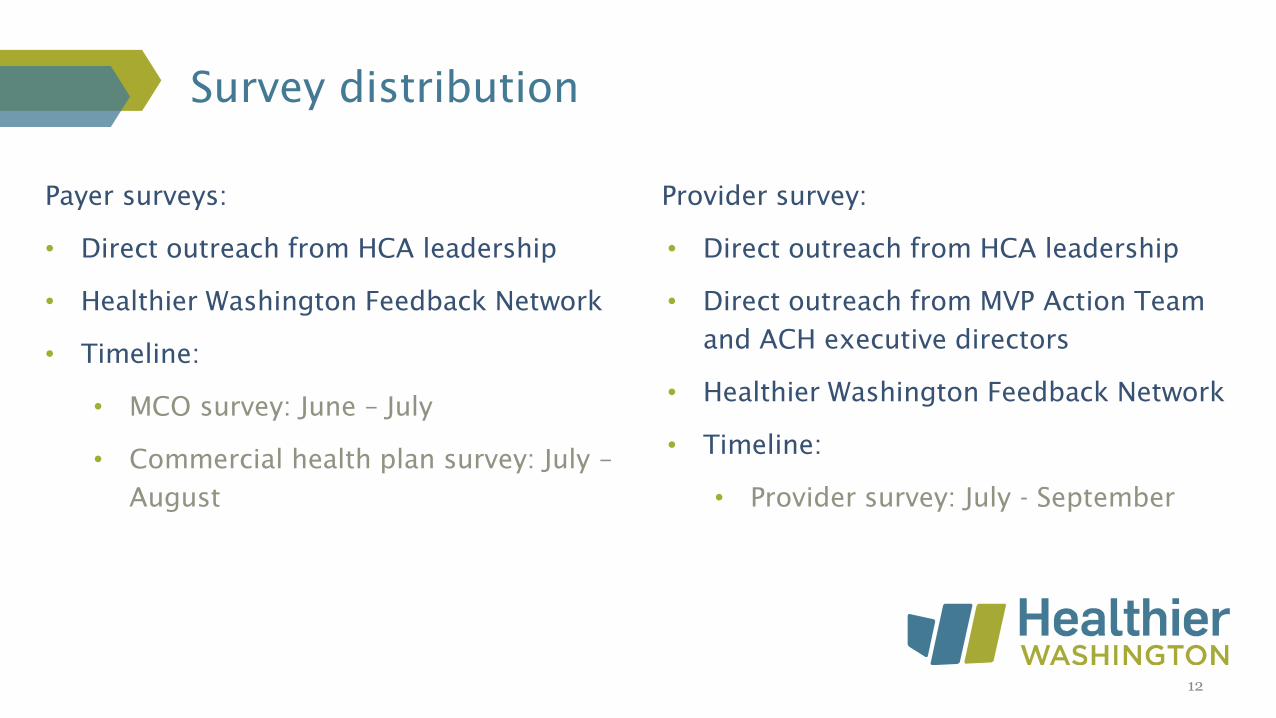
Survey distribution
12
Payer surveys:
• Direct outreach from HCA leadership
• Healthier Washington Feedback Network
• Timeline:
• MCO survey: June – July
• Commercial health plan survey: July –
August
Provider survey:
• Direct outreach from HCA leadership
• Direct outreach from MVP Action Team
and ACH executive directors
• Healthier Washington Feedback Network
• Timeline:
• Provider survey: July - September

• Medicaid MCO survey
– Released June 2, closed July 19
– Responses from all five MCOs
• Commercial health plan survey
– Released July 10, closed August 31
– Responses from five commercial (incl. Medicare Adv.)
payers
• Provider survey
– Released July 10, closed September 8
– 78 responses
Timelines
13

Respondents:
• MCOs:
– Amerigroup
– Community Health Plan of Washington
– Coordinated Care
– Molina*
– United
• Commercial/Medicare Advantage payers:
– Aetna
– Amerigroup
– Kaiser
– Premera
– Regence
Health Plan VBP surveys
(MCO and commercial payers)
14
*Molina provided statewide, aggregate values for payments in
Categories 3 & 4, and did not submit any covered lives information

Payments by APM Category
Health Plan VBP surveys (cont.)
61%
13%
20%
6%
Commercial Payments by APM Category
1 2A/2B 2C/2D 3 4
56%
11%
8%
25%
Medicare Payments by APM Category
1 2A/2B 2C/2D 3 4
71%
0%
1%
27%
Medicaid Payments by APM Category*
1 2A/2B 2C/2D 3 & 4
n=5
Total payments = $4.18B
VBP = $1.17B
*One MCO reported Categories 3 and 4 in
aggregate, limiting the APM breakdown of our
analysis
15
n=5
Total payments = $13.46B
VBP = $5.25B
n=5
Total payments = $1.95B
VBP = $858M
Statewide VBP = $7.28B (37%)
2016 survey results = 30%

16
30%
26%
25%
29%
45% 23%
52%
18%
38%
MCO VBP* by Accountable Community of Health
*One MCO reported Categories 3 and 4 in aggregate (statewide).
Consequently, the graphic above represents data from only four MCOs.
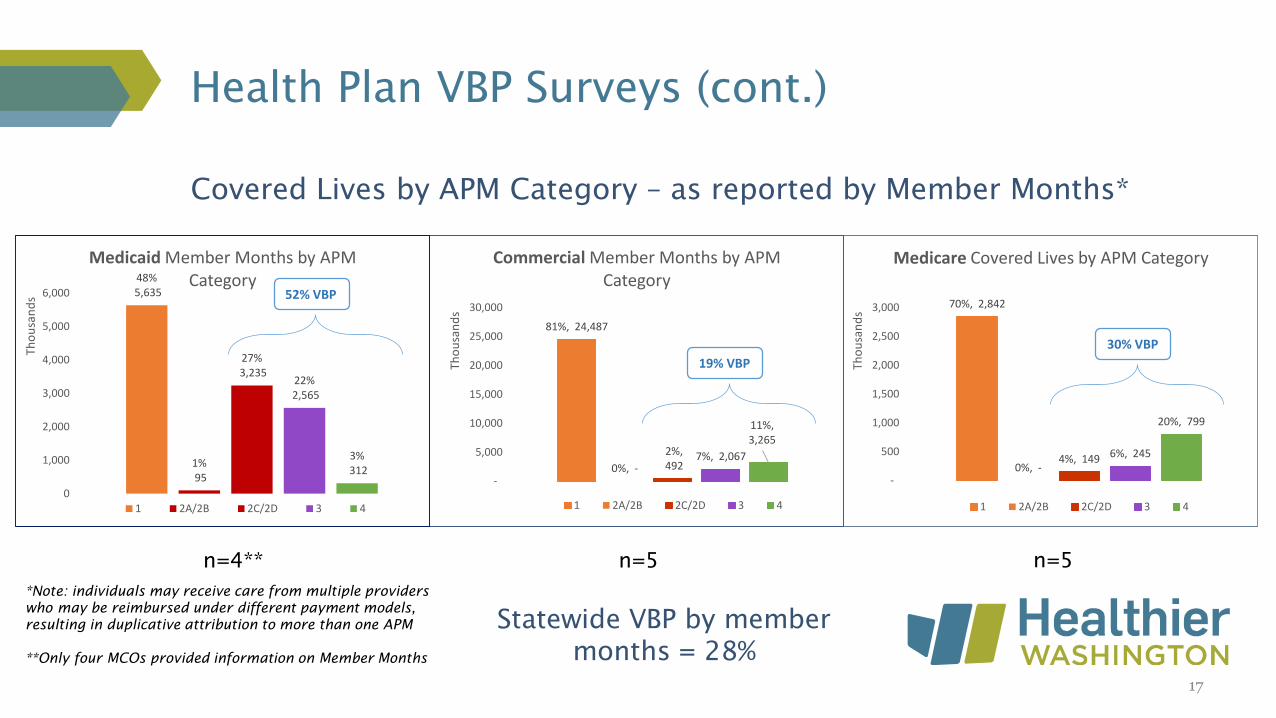
Health Plan VBP Surveys (cont.)
48%5,635
1%95
27%3,235
22%2,565
3%312
0
1,000
2,000
3,000
4,000
5,000
6,000
Tho
usa
nd
s
Medicaid Member Months by APM Category
1 2A/2B 2C/2D 3 4
52% VBP
81%, 24,487
0%, -
2%, 492
7%, 2,067
11%, 3,265
-
5,000
10,000
15,000
20,000
25,000
30,000
Tho
usa
nd
s
Commercial Member Months by APM Category
1 2A/2B 2C/2D 3 4
19% VBP
n=5n=4** n=5
Covered Lives by APM Category – as reported by Member Months*
*Note: individuals may receive care from multiple providers
who may be reimbursed under different payment models,
resulting in duplicative attribution to more than one APM
**Only four MCOs provided information on Member Months
17
70%, 2,842
0%, -4%, 149 6%, 245
20%, 799
-
500
1,000
1,500
2,000
2,500
3,000
Tho
usa
nd
s
Medicare Covered Lives by APM Category
1 2A/2B 2C/2D 3 4
30% VBP
Statewide VBP by member
months = 28%

Health Plan VBP Surveys (cont.)
Trusted partnerships and collaboration (4.00)
Aligned incentives/contract requirements (3.75)
Aligned quality measurements/definitions (2.00)
Consumer engagement (1.25)
Payment model technical assistance (0.75)
Regulatory changes (0.75)Tied
Commercial PayersManaged Care Organizations
Trusted partnerships and collaboration (4.20)
Aligned incentives/contract requirements (2.60)
Payment model technical assistance (1.80)
Interoperable data systems (1.40)
Aligned quality measurements/definitions (1.20)
n=4n=5
All Payers
Trusted partnerships and collaboration (4.11)
Aligned incentives/contract requirements (3.11)
Aligned quality measurements/definitions (1.67)
Payment model technical assistance (1.33)
Interoperable data systems (1.00)
n=9
Top five enablers (from highest impact to lowest) (average score out of 5)
18
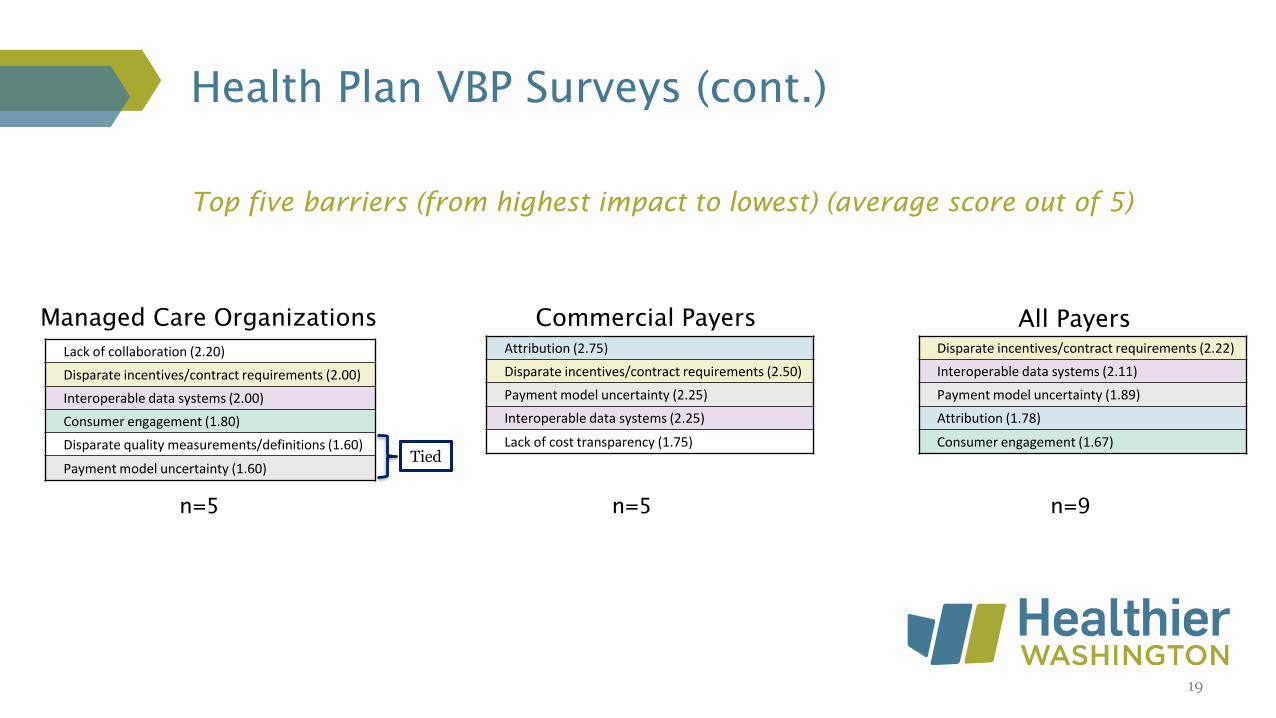
Health Plan VBP Surveys (cont.)
Commercial PayersManaged Care Organizations
Attribution (2.75)
Disparate incentives/contract requirements (2.50)
Payment model uncertainty (2.25)
Interoperable data systems (2.25)
Lack of cost transparency (1.75)
n=5n=5
Disparate incentives/contract requirements (2.22)
Interoperable data systems (2.11)
Payment model uncertainty (1.89)
Attribution (1.78)
Consumer engagement (1.67)
All Payers
n=9
Top five barriers (from highest impact to lowest) (average score out of 5)
Lack of collaboration (2.20)
Disparate incentives/contract requirements (2.00)
Interoperable data systems (2.00)
Consumer engagement (1.80)
Disparate quality measurements/definitions (1.60)
Payment model uncertainty (1.60)Tied
19

Health plan VBP surveys (cont.)
Trusted partnerships and collaboration (4.11)
Aligned incentives/contract requirements (3.11)
Aligned quality measurements/definitions (1.67)
n=9
20
Summary: top three enablers and barriers to VBP adoption
(from highest impact to lowest; average score out of 5)
Disparate incentives/contract requirements (2.22)
Interoperable data systems (2.11)
Payment model uncertainty (1.89)
n=9
All payers: Enablers All payers: Barriers

Health Plan VBP Surveys (cont.)
Functionality# of MCOs
responding “Yes”
# of commercial
health plans
responding “Yes”
Total # of health
plans responding
“Yes”
Care coordination 4/5 3/4 7/9
Quality management 4/5 2/4 6/9
Utilization management 1/5 1/4 2/9
Provider network
management1/5 0/4 1/9
Provider payments 1/5 4/4 5/9
Under certain VBP arrangements, health plans may shift traditionally payer-based functions onto
contracted providers. Which of the following roles are your providers with VBP contracts
currently performing—in all or in part?
(Note: This refers to shared functionality rather than formal delegation.)
21

Respondent provider organization type
(multiple selections per respondent possible)
Provider VBP survey
4
21
25
5
12
10
18
12
15
8
1
7
50
0 10 20 30 40 50 60
Tribal health care provider
Behavioral health provider
Outpatient clinic/facility
Inpatient clinic/facility
Critical Access Hospital
Hospital
Federally Qualified Health Center
Rural Health Clinic
Multi-specialty practice
Independent, multi-provider single-specialty practice
Single-provider practice
For-profit
Not-for-profit
22
n=78

Respondents’ number of clinicians
Provider VBP survey (cont.)
8
22
17
13
15
5
0 5 10 15 20 25
Count of 0 - 5
Count of 6-20
Count of 21-50
Count of 51-100
Count of 101-500
Count of 501 - 1000
Count of 1000+
23
n=78

Respondent service area by Accountable Community of Health
(multiple regions per respondent possible)
Provider VBP survey (cont.)
24
15
16
18
22
12
5
12
15
15
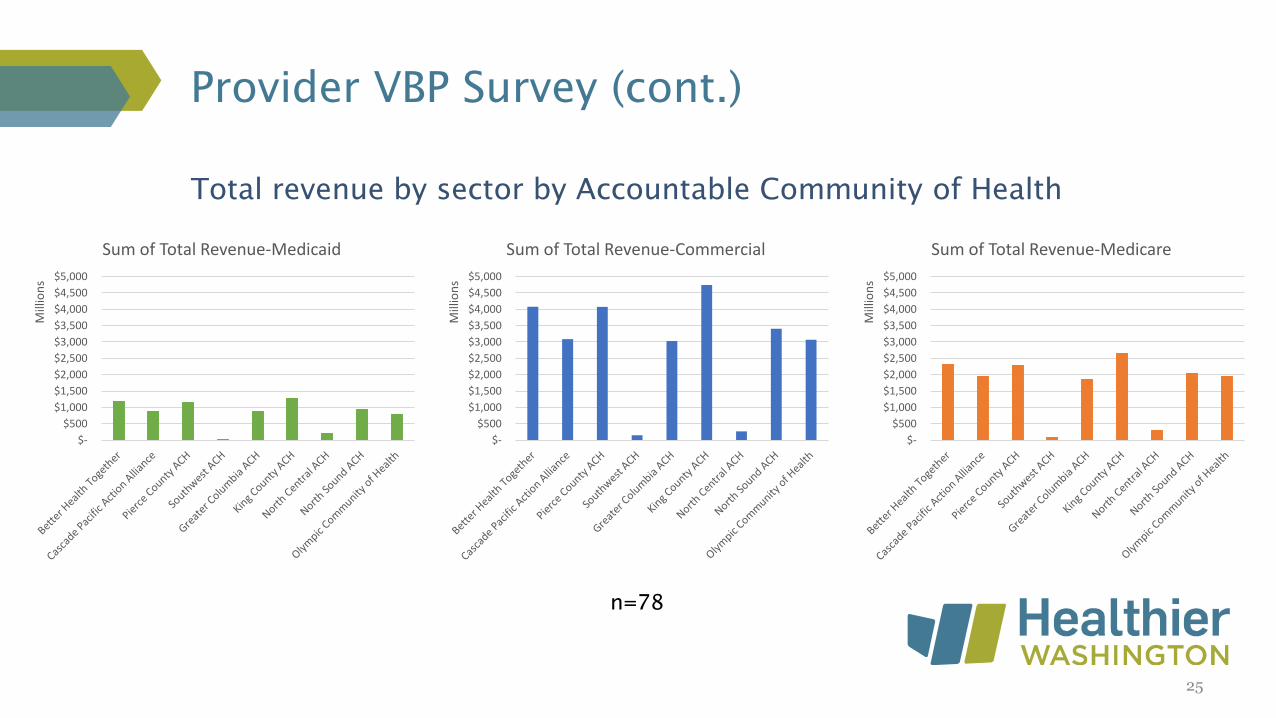
Total revenue by sector by Accountable Community of Health
Provider VBP Survey (cont.)
n=78
$-
$500
$1,000
$1,500
$2,000
$2,500
$3,000
$3,500
$4,000
$4,500
$5,000
Mill
ion
s
Sum of Total Revenue-Commercial
$-
$500
$1,000
$1,500
$2,000
$2,500
$3,000
$3,500
$4,000
$4,500
$5,000
Mill
ion
s
Sum of Total Revenue-Medicare
$-
$500
$1,000
$1,500
$2,000
$2,500
$3,000
$3,500
$4,000
$4,500
$5,000
Mill
ion
s
Sum of Total Revenue-Medicaid
25

Respondents with any revenue in VBP Categories 2C-4B
by sector
Provider VBP Survey (cont.)
64
60
56
0
25
50
75
Medicaid Commercial Medicare
26

Respondents’ experience with VBP
Provider VBP survey (cont.)
Very positive, 13
Somewhat positive, 17
Neutral, 14Somewhat negative, 1
Very negative, 1
N/A, 29
Very positive Somewhat positive Neutral
Somewhat negative Very negative N/A
n=75
27

Respondents’ top perceived enablers to adopting VBP
(from most often cited to least)
Provider VBP Survey (cont.)
n=78
Aligned incentives and/or contract requirements* (26)
Trusted partnerships and collaboration with payers* (26)
Aligned quality measurements and definitions* (24)
Access to comprehensive data on patient populations (19)
Ability to understand and analyze payment models* (19)
*Same or similar enabler reported by Washington health plans
28

Respondents’ top perceived barriers to adopting VBP
(from most often cited to least)
Provider VBP Survey (cont.)
n=78
Lack of interoperable data systems* (48)
Lack of timely cost data to assist with financial management (45)
Lack of access to comprehensive data on patient populations * (42)
Misaligned incentives and/or contract requirements (29)
Misaligned quality measurements and definitions* (28)
*Same or similar enabler reported by Washington health plans
29

Enablers
Provider VBP survey (cont.)
n=78
Aligned incentives and/or contract requirements* (26)
Trusted partnerships and collaboration with payers* (26)
Aligned quality measurements and definitions* (24)
*Same or similar enabler reported by Washington health plans
30
Barriers
n=78
Lack of interoperable data systems* (48)
Lack of timely cost data to assist with financial management (45)
Lack of access to comprehensive data on patient populations * (42)
Summary: top three enablers and barriers to VBP adoption
(from most often cited to least)
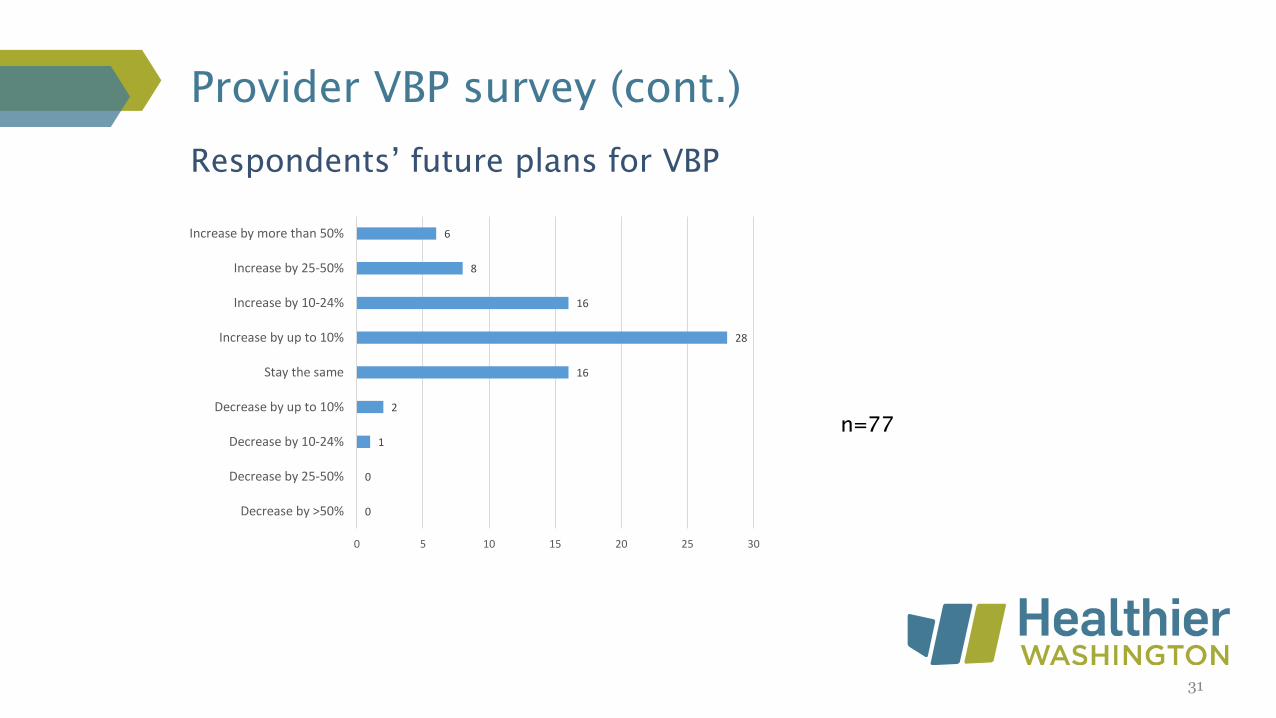
Respondents’ future plans for VBP
Provider VBP survey (cont.)
n=77
0
0
1
2
16
28
16
8
6
0 5 10 15 20 25 30
Decrease by >50%
Decrease by 25-50%
Decrease by 10-24%
Decrease by up to 10%
Stay the same
Increase by up to 10%
Increase by 10-24%
Increase by 25-50%
Increase by more than 50%
31

Summary: top enablers
32
All Payers
Trusted partnerships and collaboration (4.11)
Aligned incentives/contract requirements (3.11)
Aligned quality measurements/definitions (1.67)
n=9n=78
Aligned incentives and/or contract requirements* (26)
Trusted partnerships and collaboration with payers* (26)
Aligned quality measurements and definitions* (24)
*Same or similar enabler reported by Washington health plans
Providers

Summary: top barriers
33
n=78
Lack of interoperable data systems* (48)
Misaligned incentives and/or contract requirements (29)
*Same or similar enabler reported by Washington State health plans
Disparate incentives/contract requirements (2.22)
Interoperable data systems (2.11)
All Payers
n=9
Providers

Payers’ VBP increase from previous year
Providers’ experience with VBP has been generally positive
Providers generally plan to increase VBP participation
• To facilitate the acceleration:
– Transparent, consistent, and clear incentives
– Align quality measures
– Foster collaborative and trusting relationships
– Invest in interoperability
Summary findings – VBP is accelerating
34