31031TESTING1 TESTINGTESTING 310313 SOFTWARE ENGINEERING 310313 SOFTWARE ENGINEERING.
1 23
Arabian Journal for Science andEngineering ISSN 1319-8025Volume 36Number 7 Arab J Sci Eng (2011) 36:1423-1446DOI 10.1007/s13369-011-0118-9
Comparative Study of the C7+Characterization Methods: An Object-Oriented Approach
Hassan S. Naji
1 23
Your article is protected by copyright and
all rights are held exclusively by King Fahd
University of Petroleum and Minerals. This
e-offprint is for personal use only and shall
not be self-archived in electronic repositories.
If you wish to self-archive your work, please
use the accepted author’s version for posting
to your own website or your institution’s
repository. You may further deposit the
accepted author’s version on a funder’s
repository at a funder’s request, provided it is
not made publicly available until 12 months
after publication.
Arab J Sci Eng (2011) 36:1423–1446DOI 10.1007/s13369-011-0118-9
RESEARCH ARTICLE - PETROLEUM ENGINEERING
Hassan S. Naji
Comparative Study of the C7+ Characterization Methods:An Object-Oriented Approach
Received: 30 September 2009 / Accepted: 25 May 2010 / Published online: 19 October 2011© King Fahd University of Petroleum and Minerals 2011
Abstract When using equations of state (EOS) to predict the phase behavior of hydrocarbon mixtures,problems occur with the C7+ fraction that exists in such mixtures. Minimizing such problems requires eitherfine-tuning the EOS and/or characterizing the C7+ fraction. C7+ characterization is the most important, yetmost difficult step associated with the description of reservoir fluids. Several methods have been proposed forcharacterizing the C7+ fraction. Collectively, these methods are grouped into two main categories: correla-tion and splitting and lumping. This paper revisits the most common characterization methods presented inthe literature, which have received wide acceptance. In addition, a worthwhile contribution of this paper isthe proposed improvement to the Katz constant-parameter splitting method. A further contribution is that theresulting program is coded in an object-oriented manner, which offers flexibility in programming and allowsthe different parts of the code to be described easily and in a natural manner as if they were real world objects.
Keywords C7+ Splitting · Hydrocarbon plus fractions · Phase behavior · Equations of state · OOP application
H. S. Naji (B)Faculty of Earth Sciences, King Abdulaziz University,PO Box 80206, Jeddah 21589, Saudi ArabiaE-mail: [email protected]://www.hnaji.kau.edu.sa
123
Author's personal copy
1424 Arab J Sci Eng (2011) 36:1423–1446
NomenclatureMWn Molecular weight of the pseudo-component with n carbon atoms (lb/lb-mol)MWN Molecular weight of the last component in the extended system (lb/lb-mol)MWC7+ Molecular weight of the C7+ fraction in the hydrocarbon system (lb/lb-mol)i Running index of Whitson’s lumping scheme, i.e., 1, 2, 3 . . . NGn Number of carbon atoms in the pseudo-componentN Number of carbon atoms in the last component in the extended systemNG Number of MCN groups in Whitson’s lumping schemeSGn Specific gravity of the pseudo-component with n carbon atomsSG N Specific gravity of the last component in the extended systemSGC7+ Specific gravity of the C7+ fraction in the hydrocarbon systemZ6 Mole fraction of C6 component in the hydrocarbon systemZn Mole fraction of the pseudo-component with n carbon atomsZ N Mole fraction of the last component in the extended systemZC7+ Mole fraction of the C7+ fraction in the hydrocarbon system
1 Introduction
In compositional reservoir simulation, equations of state (EOS) are extensively used for pressure–volume–temperature (PVT) predictions and phase behavior calculations of hydrocarbon mixtures. Problems, however,arise when dealing with the C7+ fraction that exists in the hydrocarbon mixtures. To minimize these problems,numerous methods for fine-tuning the EOS and/or characterizing the C7+ fraction have been proposed. C7+characterization is the most important, yet most difficult step associated with the description of reservoir flu-ids. Several methods have been proposed for characterizing the C7+ fraction. Collectively, these methods aregrouped into two main categories: correlation and splitting and lumping.
It is a simple fact that, in most PVT studies, only specific gravity and molecular weight of the C7+ fractionare reported. Correlation refers to the prediction of C7+ properties solely from its specific gravity and molecularweight. Splitting refers to the process of breaking down the C7+ fraction into a number of pseudo-componentswith a single carbon number, C7, C8, C9 . . . , Cn . The pseudo-components are described by the same physicalproperties used for pure components, which are well defined. However, after splitting is done, it is unpracticalto list all the components contained in the C7+ fraction, because the cost required for compositional reservoirsimulation increases substantially with the number of components. Thus, lumping, which refers to the processof regrouping the components resulting from the splitting process into a lesser number of pseudo-components,say three or four components that are considered to describe the C7+ fraction, is coupled all the way withsplitting.
Several splitting methods have been proposed by different authors. The exponential molar distribution isthe simplest method for splitting the C7+ fraction, with the Katz method a special case thereof. This methoduses constant parameters; i.e., it only requires the C7+ mole fraction and the carbon number of the componentwhose mole fraction is to be calculated. However, the method performs poorly in some cases relative to othersplitting methods, because it does not take into account the specific gravity and molecular weight of the C7+fraction. In this paper, the constant parameters of the Katz method are replaced with variable parameters thattake into account the molecular weight and specific gravity of the C7+ fraction. This modification proves tobe simple and practical and compares well with other splitting schemes.
Another important aspect of the paper is that the program presented herein is developed using the object-oriented C# programming language, which provides substantial computing and programming advantages andallows the most difficult coding tasks to become truly feasible. To the best of my knowledge, no discussion onthe C# implementation of phase behavior applications is available. So far, most phase behavior programs havebeen developed using the traditional FORTRAN language, which is a natural choice from the viewpoint ofcontinuity in downstream data processing. Such a natural choice, however, may not necessarily be the optimalchoice. In fact, the use of an object-oriented language is more desirable for future reservoir simulators. Theparadigm of object-oriented programming allows the different parts constituting the process of petroleumreservoir simulation to be described easily and in a natural manner as if they were real world objects.
123
Author's personal copy
Arab J Sci Eng (2011) 36:1423–1446 1425
2 Characterizing C7+ Using Correlations
There are various correlations for characterizing the C7+ fraction. In this paper, we consider the correlationsof Kesler and Lee [1] and Riazi and Daubert [2].
2.1 Kesler and Lee Correlation
Kesler and Lee [1] proposed a set of equations to characterize the unknown petroleum fractions. The correla-tions use the fraction’s specific gravity and boiling point as the only input.
MW = −12,272.6 + 9,486.4γ + (4.6523 − 3.3287γ ) Tb
+ (1 − 0.77084γ − 0.02058γ 2)
(1.3437 − 720.79
Tb
)107
Tb
+ (1 − 0.80882γ + 0.02226γ 2)
(1.8828 − 181.98
Tb
)1012
T 3b
(1)
Tc = 341.7 + 811.1γ + (0.4244 + 0.1174γ ) Tb + (0.4669 − 3.26238γ ) 105
Tb(2)
pc = exp
{8.3634 − 0.0566
γ−
(0.24244 + 2.2898
γ+ 0.11857
γ 2
)10−3Tb
+(
1.4685 + 3.648
γ+ 0.47227
γ 2
)10−7T 2
b −(
0.42019 + 1.6977
γ 2
)10−10T 3
b
} (3)
ω =
⎧⎪⎪⎪⎨
⎪⎪⎪⎩
−7.904 + 0.1352K − 0.007465K 2 + 8.359� + (1.408−0.01063K )�
� ≥ 0.8
− ln( ppc
14.696
) − 5.92714 + 6.09648�
+ 1.28862 ln (�) − 0.169347�6
15.2518 − 15.6875�
− (13.4721) ln (�) + 0.43577�6� < 0.8
(4)
where
� = Tb
TcK = T 1/3
b
γ(5)
Zc = 0.2918 − 0.0928ω (6)
Vc = RZcTc
pc MW(7)
2.2 Riazi and Daubert Correlations
Riazi and Daubert [2] suggested a set of correlations for calculating the physical properties of unknown petro-leum fractions. The first set of correlations uses the specific gravity and true boiling point of the petroleumfraction as the correlation parameters.
MW = 581.96T 0.97476b γ 6.51274 exp
(5.43076 × 10⁻⁴Tb − 9.53384γ + 1.11056 × 10⁻³Tbγ
)(8)
Tc = 10.6443T 0.81067b γ 0.53691 exp
(−5.1747 × 10⁻⁴Tb − 0.54444γ + 3.5995 × 10⁻⁴Tbγ)
(9)
pc = 6.162 × 10⁶T −0.4844b γ 4.0846 exp
(−4.725 × 10⁻³Tb − 4.8014γ + 3.1939 × 10⁻³Tbγ)
(10)
Vc = 6.233 × 10⁻⁴T 0.7506b γ −1.2028 exp
(−1.4679 × 10⁻³Tb − 0.26404γ + 1.095 × 10⁻³Tbγ)
(11)
Zc = pcVc MW
RTc(12)
ω = 3 log( pc
14.696
)
7(
TcTb
− 1) − 1 (13)
123
Author's personal copy
1426 Arab J Sci Eng (2011) 36:1423–1446
The second set of correlations uses the specific gravity and molecular weight of the petroleum fraction as thecorrelation parameters.
Tb = 6.77857MW 0.401673γ −1.58262
× exp(3.77409 × 10⁻³ MW + 2.984036γ − 4.25288 × 10⁻³ MWγ
)(14)
Tc = 544.4MW 0.2998γ 1.0555 exp(−1.3478 × 10⁻⁴ MW − 0.61641γ
)(15)
pc = 4.5203 × 10⁴ MW −0.8063γ 1.6015 exp(−1.8078 × 10⁻³ MW − 0.3084γ
)(16)
Vc = 1.206 × 10⁻² MW 0.20378γ −1.3036
× exp(−2.657 × 10⁻³ MW + 0.5287γ + 2.6012 × 10⁻³ MWγ
)(17)
Zc = pcVc MW
RTc(18)
ω = 3 log( pc
14.696
)
7(
TcTb
− 1) − 1 (19)
where, in all cases, Tb and Tc are in ◦R, pc is in psia, and Vc is in ft3/lb.
3 Characterizing C7+ Using Splitting and Lumping
Splitting refers to the process of breaking down (re-extending) the C7+ fraction into a number of pseudo-components with a single carbon number. The pseudo-components of the extended analysis are assignedthe same physical properties used for pure components. The physical properties of pure components are welldefined, having been measured and compiled for many years. Katz and Firoozabadi [3] presented a generalizedset of physical properties for pure components C6 through C45. Whitson [4] modified the original tabulatedphysical properties to make their use more consistent. The last fraction of the extended analysis, however,is characterized using one of the characterization methods such as that by Kesler and Lee [1] or Riazi andDaubert [2]. Several splitting methods have been proposed by different authors. These methods are basedon the observation that lighter hydrocarbon systems such as gas condensates usually exhibit an exponentialmolar distribution (mole fraction/molecular weight relation), while heavier systems show a left-skewed molardistribution.
Extensive compositional analyses of many reservoir fluids from all over the world, such as those by Pedersenet al. [5], Zuo and Zhang [6], and Elsharkawy [7], however, have shown exponential molar distributions. Hencethe fact that exponential methods are extensively used by many researchers as a first choice for splitting the C7+fraction; for example Almehaideb et al. [8], Avaullee et al. [9], Elsharkawy [7], Whitson et al. [10], and Zuoand Zhang [6]. Other researchers are still suggesting improvements and enhancements to such methods; forexample Whitson et al. [10] and Pedersen et al. [5]. This is due to their feasibility in the sense that they do notcontain too many unknown or difficult-to-determine parameters. In addition, C7+ characterization representsonly a minor portion of the process of compositional reservoir simulation.
In most PVT studies, only the specific gravity and molecular weight of the C7+ fractions are reported.Splitting methods make use of this data to satisfy the following requirements.
• The sum of the mole fractions of the individual pseudo-components is equal to the mole fraction of C7+;i.e.,
N∑
n=7
zn = zC7+ . (20)
• The sum of the products of the mole fraction and molecular weight of the individual pseudo-componentsis equal to the product of the mole fraction and molecular weight of C7+; i.e.,
N∑
n=7
MWnzn = MWC7+ zC7+ . (21)
123
Author's personal copy
Arab J Sci Eng (2011) 36:1423–1446 1427
• The sum of the products of the mole fraction and molecular weight divided by the specific gravity of theindividual pseudo-components is equal to the product of the mole fraction and molecular weight dividedby the specific gravity of C7+; i.e.,
N∑
n=7
MWn
SGnzn = MWC7+
SGC7+zC7+ . (22)
3.1 Katz Split
Katz [11] proposed a simple graphical correlation for splitting the C7+ fraction. His correlation is representedin a mathematical form as follows:
zn = zC7+1.38205e−0.25903n, (23)
wheren = number of carbon atoms of the pseudo-component,Zn = mole fraction of the pseudo-component with number of carbon atoms of n,ZC7+ = mole fraction of the C7+ fraction in the hydrocarbon system.
3.2 Lohrenz Split
Lohrenz et al. [12] proposed that the heptane plus fraction could be divided into pseudo-components withcarbon number that ranges from 7 to 40. They stated that the mole fraction, zn , is related to its number ofcarbon atoms, n, and the mole fraction of the hexane fraction, z6, by the expression
zn = z6eA(n−6)2+B(n−6) n = 7, 8, 9, . . . , 40. (24)
The parameters A and B are determined in such a way that constraints (20) and (22) are satisfied; i.e., plugging(24) into (20) and (22) yields:
z6
40∑
n=7
eA(n−6)2+B(n−6) − zC7+ = 0 (25)
z6
40∑
n=7
MWn
SGneA(n−6)2+B(n−6) − MWC7+
SGC7+zC7+ = 0. (26)
Equations (25) and (26) are solved simultaneously for A and B. Once A and B have been found, mole fractionsof pseudo-components are calculated from (24).
3.3 Pedersen Split
Pedersen et al. [13] presented an exponential correlation to describe the extended analysis of the C7+ fractionthat exists in petroleum mixtures. Their correlation is written as:
zn = eA+B MWn , (27)
where parameters A and B are required to satisfy constraints (20) and (22); i.e., plugging (27) into (20) and(22) yields:
N∑
n=7
eA+B MWn − zC7+ = 0 (28)
N∑
n=7
MWn
SGneA+B MWn − MWC7+
SGC7+zC7+ = 0. (29)
Equations (28) and (29) are solved simultaneously for A and B. Once A and B have been found, mole fractionsof pseudo-components are calculated using (27).
123
Author's personal copy
1428 Arab J Sci Eng (2011) 36:1423–1446
3.4 Ahmed Split
Ahmed et al. [14] devised a simple method for splitting the C7+ fraction into pseudo-components,(C7, C8, C9, . . . , Cn). The only input data for the proposed method are the mole fraction and the molecu-lar weight of the C7+ fraction. The authors proposed the following expression to estimate the mole fractionsof the pseudo-component, (z7, z8, z9, etc.):
zn = zn+(
MW(n+1)+ − MWn+MW(n+1)+ − MWn
)n ≥ 7 (30)
where
zn+ = z(n−1)+ − z(n−1)
MWn+ = MWC7+ + S (n − 7) n ≥ 8
γn+ = γC7+
[1 + ae−bn
(MWn+MWC7+
− 1
)] (31)
and n is the number of carbon atoms. S is a coefficient given by:
Number of carbon atoms Condensate system Crude oil systemn �=8 S=15.5 S=16.5n > 8 S=17.0 S=20.1
The coefficients a and b are given by:
Coefficient Condensate system Crude oil systema 0.067730 0.247308b 0.008405 0.063241
3.5 Whitson Split
Whitson [15] proposed that the three-parameter gamma function can be used to model the molar distributionof the C7+ fraction. Whitson expressed this function as
zn = zC7+� (α)
∞∑
j=0
yα+ jn+1 e−yn+1 − yα+ j
n e−yn
� (α + j + 1), (32)
where
yn = MWn − η
β
yn+1 = MWn+1 − η
β
η ={
92 C7+14n − 6 Cn+ (33)
β = MWC7+ − η
α
The summation in the above equation can be terminated when∑
j+1
−∑
j
< 10−6. (34)
α is an adjustable parameter that can be calculated as
α = 0.5000876 + 0.1648852Y − 0.0544174Y 2
Y, (35)
123
Author's personal copy
Arab J Sci Eng (2011) 36:1423–1446 1429
where
Y = ln
[MWC7+ − η
mG
](36)
mG =[
N∏
i=n
(MWi − η)zi
] 1zC7+
. (37)
For the exponential molar distribution α takes the value 1.0. With some manipulation, Whitson’s relation isreduced to the form
zn = zC7+
[(λ − 14) e−yn − λe−yn+1
]
(λ − β − 7), (38)
where
λ = 14n + β + 2 (39)
β = MWC7+ − 86
yn = λ − β − 100
β(40)
yn+1 = λ − β − 86
β
3.6 Modified Katz Split
Direct implementation of the Katz splitting method frequently results in poor extended analysis that does notcompare well with other splitting methods. This drawback can render the method practically useless for thepurpose of PVT predictions and phase behavior calculations. To remedy this problem, the constant parametersof the Katz correlation are replaced with variable parameters; i.e., the Katz equation is rewritten as
zn = zC7+ Ae−Bn, (41)
where parameters A and B are required to satisfy constraints (20) and (22); i.e., plugging (41) into (20) and(22) yields
AN∑
n=7
e−Bn − 1 = 0 (42)
AN∑
n=7
MWn
SGne−Bn − MWC7+
SGC7+= 0. (43)
If constraint (21) were used instead of (22), the equations would consider only the C7+ molecular weight.Using constraint (22), however, forces the equations to consider the C7+ specific gravity as well. Solving (42)for A and plugging this into (43) yields
∑Nn=7
MWnSGn
e−Bn
∑Nn=7 e−Bn
− MWC7+SGC7+
= 0. (44)
Equation (44) represents a single nonlinear equation, which is solved by the Newton–Raphson method forB, and then (42) is directly solved for A. Once parameters A and B have been found, mole fractions of thepseudo-components are calculated from (41). This modification changes the correlation to match well withother splitting methods as can be seen from the presented examples.
123
Author's personal copy
1430 Arab J Sci Eng (2011) 36:1423–1446
3.7 Whitson Lumping
Whitson [15] proposed a regrouping scheme whereby the compositional distribution of the C7+ fraction isreduced to only a few Multiple Carbon Number (MCN) groups. He suggested that the number of MCN groupsis given by
NG = int[1 + 3.3 log (N − n)
], (45)
where
NG = number of MCN groups,N = number of carbon atoms of the last component in the extended system,n = number of carbon atoms of the first component in the extended system.
The molecular weights separating each MCN group are given by
MWi = MWN
[exp
(ln (MWN /MWn)
NG
)]i
, (46)
where
MWN = molecular weight of the last component in the extended analysis,MWn = molecular weight of the first component in the extended analysis,i = running index; i.e., 1, 2, 3 . . . NG .
3.8 Behrens and Sandler Lumping
Behrens and Sandler [16] suggested a method for fully describing the C7+ fraction by two pseudo-components.Their method starts by calculating the exponential parameter α of the distribution function F(I ). This is doneby solving the following nonlinear equation
g (α) = 1
α− �Cn + A − (A − B) e−Bα
(e−Aα − e−Bα
) , (47)
where
A = starting carbon number – 0.5 = 6.5,B = ending carbon number + 0.5 = 45.5 in the event that the split continues until C45.
�Cn = MWC7+ + 4
14(48)
The authors used the following distribution function
zC7+ =c∫
0
D (r) e−r dr , (49)
where c = α (B − A). The authors applied a Gaussian quadrature numerical integration method with a two-point integration to evaluate (49). They expressed the integral as
zC7+ =2∑
i=1
D (ri ) wi . (50)
123
Author's personal copy
Arab J Sci Eng (2011) 36:1423–1446 1431
Now with c calculated, the roots for the quadrature and weighting factors of the Gaussian quadrature are lookedup from the Behrens and Sandler roots and weights for the two-point integration. Next, the pseudo-componentcarbon number ni and mole fraction zi are calculated from the following expressions:
n1 = r1
α+ A
n2 = r2
α+ A (51)
z1 = w1zC7+z2 = w2zC7+ (52)
Finally, the physical properties of the pseudo-components are assigned according to the resulting carbonnumbers.
4 Program Development
The program in this paper was developed using the C# object-oriented programming (OOP) language, whichprovides substantial computing and programming advantages and allows the most difficult coding tasks tobecome truly feasible. OOP is a relatively new approach to creating applications related to the petroleumindustry. OOP techniques are firmly rooted in the structure and meaning of data, and the interaction betweendata and other data. The C# language has the benefit of extensibility, which is achieved using objects, as thename of the technology implies. An object is the building block for OOP applications. This building blockencapsulates the data together with the code that operates thereon.
Implementation of C7+ splitting using C# entailed creating a single class called PetroleumClassLibrary.Fluid.Compositional.Fraction or simply Fraction. This class includes three constructors asdescribed below.
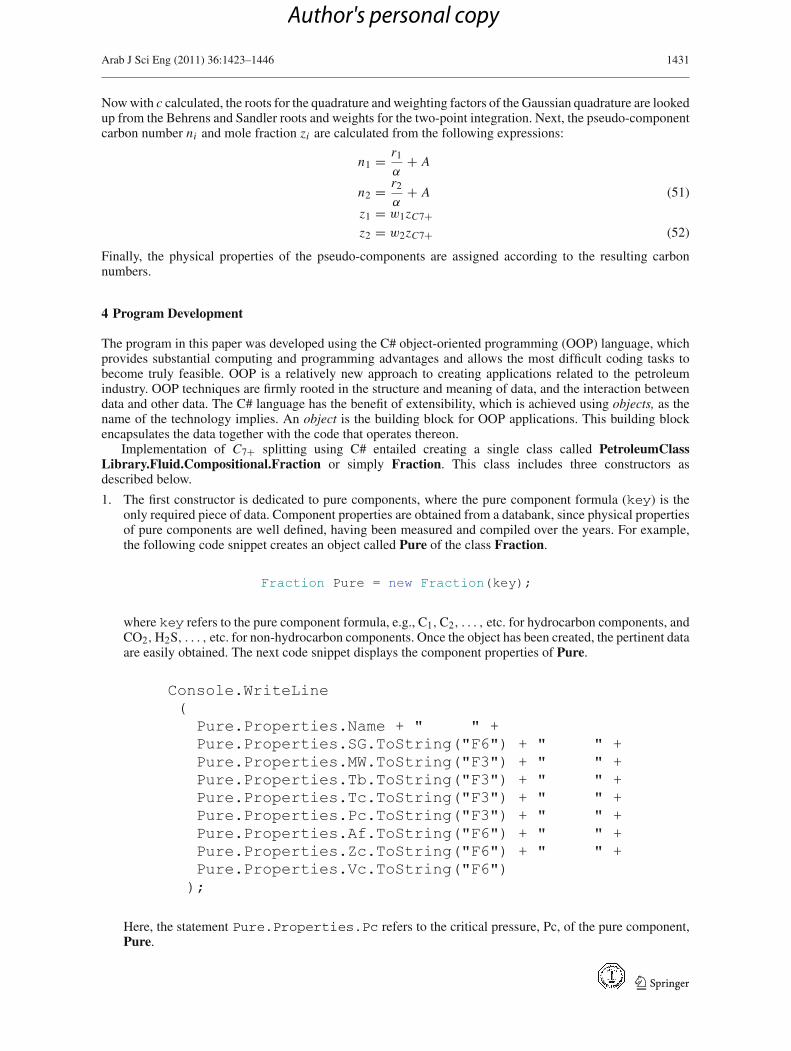
1. The first constructor is dedicated to pure components, where the pure component formula (key) is theonly required piece of data. Component properties are obtained from a databank, since physical propertiesof pure components are well defined, having been measured and compiled over the years. For example,the following code snippet creates an object called Pure of the class Fraction.
where key refers to the pure component formula, e.g., C1, C2, . . . , etc. for hydrocarbon components, andCO2, H2S, . . . , etc. for non-hydrocarbon components. Once the object has been created, the pertinent dataare easily obtained. The next code snippet displays the component properties of Pure.
Here, the statement Pure.Properties.Pc refers to the critical pressure, Pc, of the pure component,Pure.
123
Author's personal copy
1432 Arab J Sci Eng (2011) 36:1423–1446
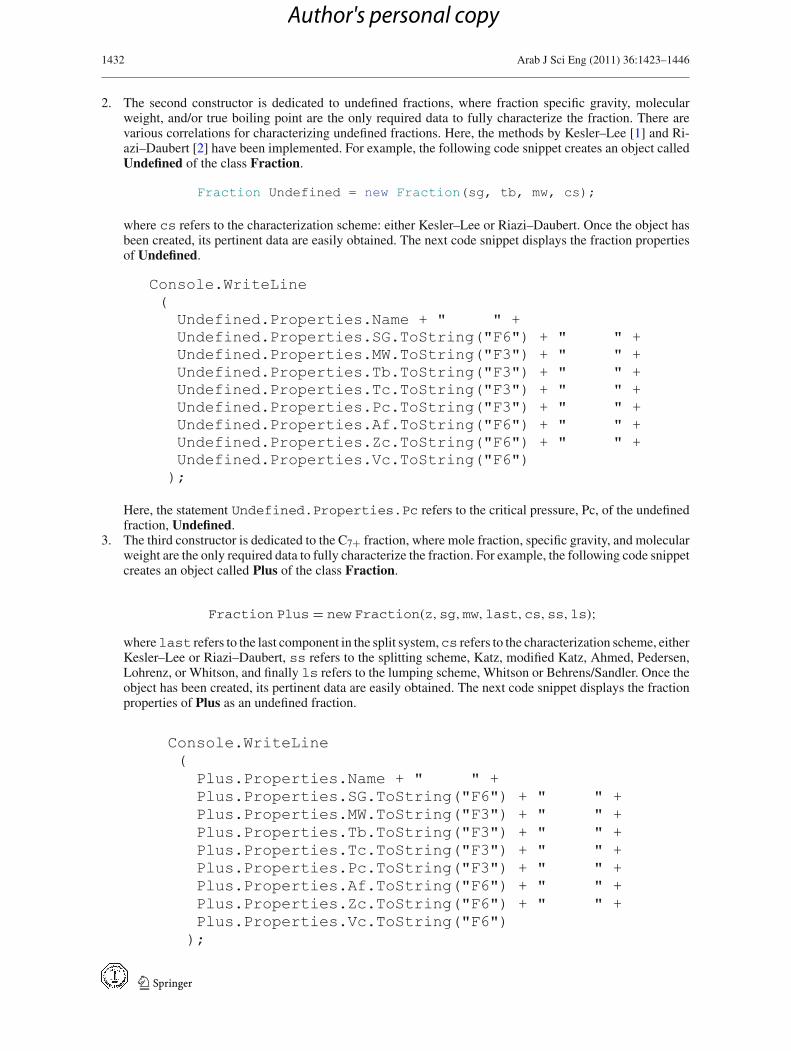
2. The second constructor is dedicated to undefined fractions, where fraction specific gravity, molecularweight, and/or true boiling point are the only required data to fully characterize the fraction. There arevarious correlations for characterizing undefined fractions. Here, the methods by Kesler–Lee [1] and Ri-azi–Daubert [2] have been implemented. For example, the following code snippet creates an object calledUndefined of the class Fraction.
where cs refers to the characterization scheme: either Kesler–Lee or Riazi–Daubert. Once the object hasbeen created, its pertinent data are easily obtained. The next code snippet displays the fraction propertiesof Undefined.
Here, the statement Undefined.Properties.Pc refers to the critical pressure, Pc, of the undefinedfraction, Undefined.
3. The third constructor is dedicated to the C7+ fraction, where mole fraction, specific gravity, and molecularweight are the only required data to fully characterize the fraction. For example, the following code snippetcreates an object called Plus of the class Fraction.
Fraction Plus = new Fraction(z,sg,mw,last,cs,ss,ls);wherelast refers to the last component in the split system,cs refers to the characterization scheme, eitherKesler–Lee or Riazi–Daubert, ss refers to the splitting scheme, Katz, modified Katz, Ahmed, Pedersen,Lohrenz, or Whitson, and finally ls refers to the lumping scheme, Whitson or Behrens/Sandler. Once theobject has been created, its pertinent data are easily obtained. The next code snippet displays the fractionproperties of Plus as an undefined fraction.
123
Author's personal copy
Arab J Sci Eng (2011) 36:1423–1446 1433
Again, the statement Plus.Properties.Pc refers to the critical pressure, Pc, of the plus fraction,Plus. Similarly, the next code snippet implements splitting the data of the plus fraction, Plus.
The statement Plus.Split[i].Pc refers to the critical pressure, Pc, of component (i) in the splitsystem of the plus fraction, Plus. Similarly, the next code snippet implements lumping the data of the plusfraction, Plus.
The statement Plus.Lump[i].Pc refers to the critical pressure, Pc, of component (i) in the lumpedsystem of the plus fraction, Plus.
From the above code snippets, it should be clear that the C# OOP language offers flexibility in programmingand allows the different parts of the code to be described easily and in a natural manner as if they were realworld objects.
123
Author's personal copy
1434 Arab J Sci Eng (2011) 36:1423–1446
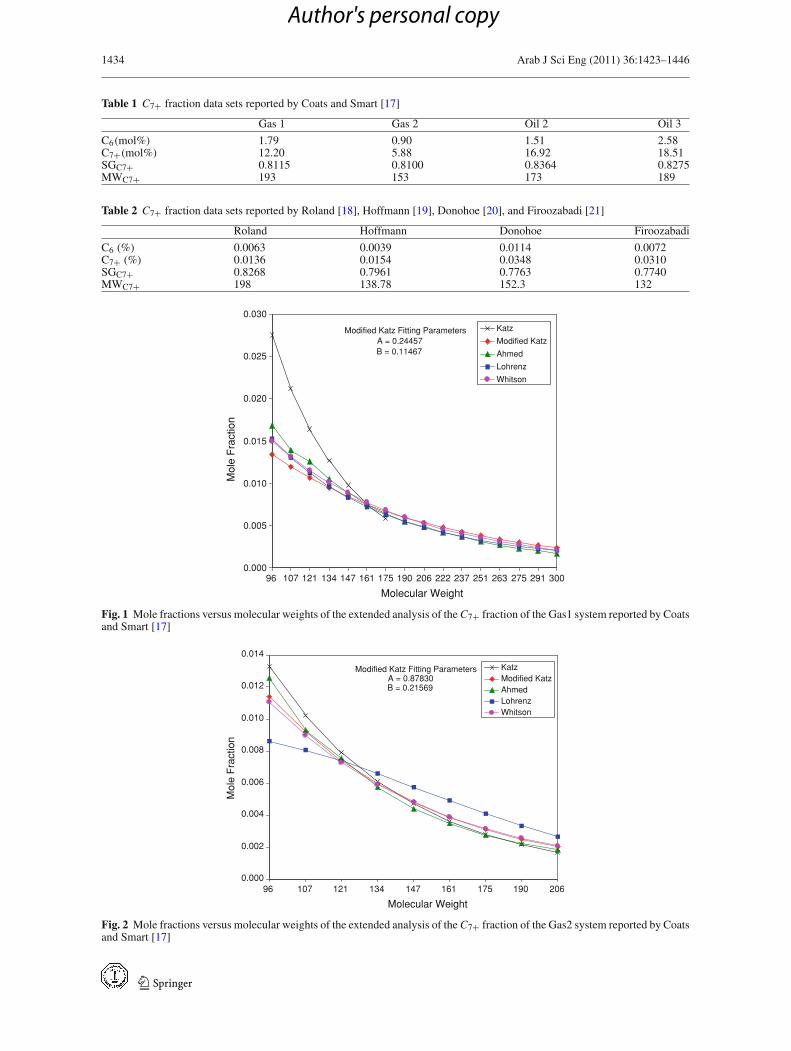
Table 1 C7+ fraction data sets reported by Coats and Smart [17]
Gas 1 Gas 2 Oil 2 Oil 3
C6(mol%) 1.79 0.90 1.51 2.58C7+(mol%) 12.20 5.88 16.92 18.51SGC7+ 0.8115 0.8100 0.8364 0.8275MWC7+ 193 153 173 189
Table 2 C7+ fraction data sets reported by Roland [18], Hoffmann [19], Donohoe [20], and Firoozabadi [21]
Roland Hoffmann Donohoe Firoozabadi
C6 (%) 0.0063 0.0039 0.0114 0.0072C7+ (%) 0.0136 0.0154 0.0348 0.0310SGC7+ 0.8268 0.7961 0.7763 0.7740MWC7+ 198 138.78 152.3 132
Modified Katz Fitting ParametersA = 0.24457B = 0.11467
0.000
0.005
0.010
0.015
0.020
0.025
0.030
96 107 121 134 147 161 175 190 206 222 237 251 263 275 291 300
Molecular Weight
Mol
e F
ract
ion
Katz
Modified Katz
Ahmed
Lohrenz
Whitson
Fig. 1 Mole fractions versus molecular weights of the extended analysis of the C7+ fraction of the Gas1 system reported by Coatsand Smart [17]
Modified Katz Fitting ParametersA = 0.87830B = 0.21569
0.000
0.002
0.004
0.006
0.008
0.010
0.012
0.014
96 107 121 134 147 161 175 190 206
Molecular Weight
Mol
e F
ract
ion
KatzModified KatzAhmedLohrenzWhitson
Fig. 2 Mole fractions versus molecular weights of the extended analysis of the C7+ fraction of the Gas2 system reported by Coatsand Smart [17]
123
Author's personal copy
Arab J Sci Eng (2011) 36:1423–1446 1435
Modified Katz Fitting ParametersA = 0.49471B = 0.16683
0.000
0.005
0.010
0.015
0.020
0.025
0.030
0.035
0.040
0.045
96 107 121 134 147 161 175 190 206
Molecular Weight
Mol
e F
ract
ion
KatzModified KatzAhmedLohrenzWhitson
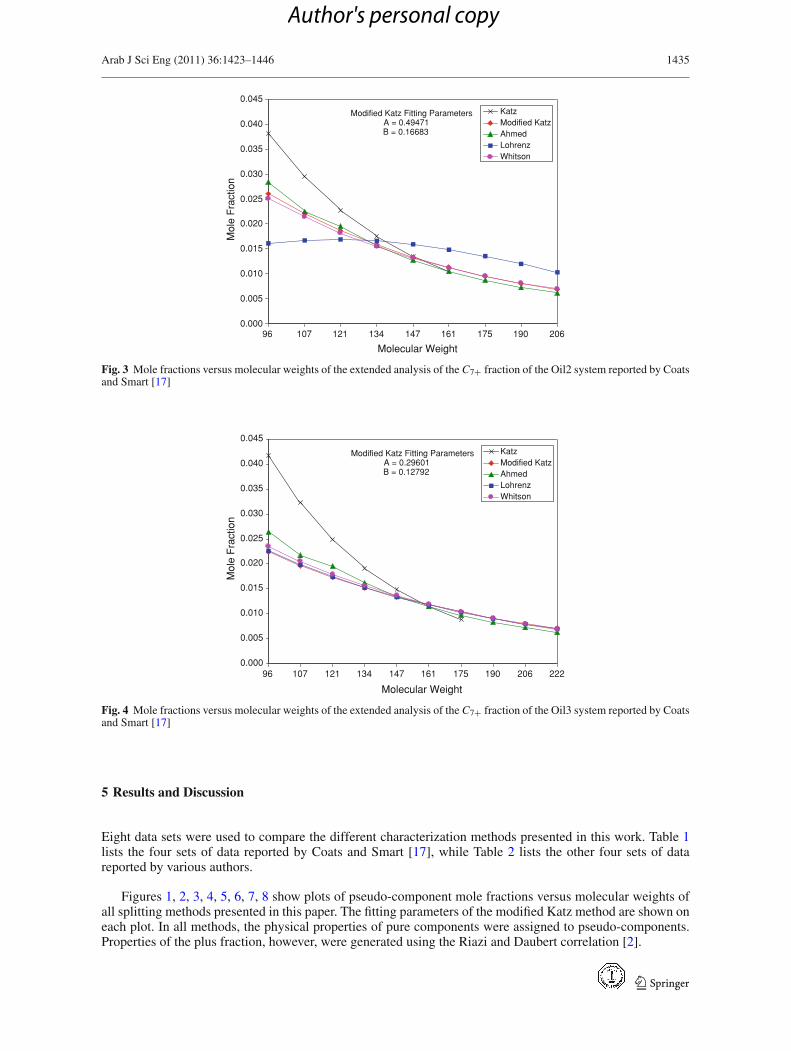
Fig. 3 Mole fractions versus molecular weights of the extended analysis of the C7+ fraction of the Oil2 system reported by Coatsand Smart [17]
Modified Katz Fitting ParametersA = 0.29601B = 0.12792
0.000
0.005
0.010
0.015
0.020
0.025
0.030
0.035
0.040
0.045
96 107 121 134 147 161 175 190 206 222
Molecular Weight
Mol
e F
ract
ion
KatzModified KatzAhmedLohrenzWhitson
Fig. 4 Mole fractions versus molecular weights of the extended analysis of the C7+ fraction of the Oil3 system reported by Coatsand Smart [17]
5 Results and Discussion
Eight data sets were used to compare the different characterization methods presented in this work. Table 1lists the four sets of data reported by Coats and Smart [17], while Table 2 lists the other four sets of datareported by various authors.
Figures 1, 2, 3, 4, 5, 6, 7, 8 show plots of pseudo-component mole fractions versus molecular weights ofall splitting methods presented in this paper. The fitting parameters of the modified Katz method are shown oneach plot. In all methods, the physical properties of pure components were assigned to pseudo-components.Properties of the plus fraction, however, were generated using the Riazi and Daubert correlation [2].
123
Author's personal copy
1436 Arab J Sci Eng (2011) 36:1423–1446
Modified Katz Fitting ParametersA = 0.23691B = 0.11253
0.0000
0.0005
0.0010
0.0015
0.0020
0.0025
0.0030
0.0035
0.0040
96 107 121 134 147 161 175 190 206 222
Molecular Weight
Mol
e F
ract
ion
KatzModified KatzAhmedLohrenzWhitson
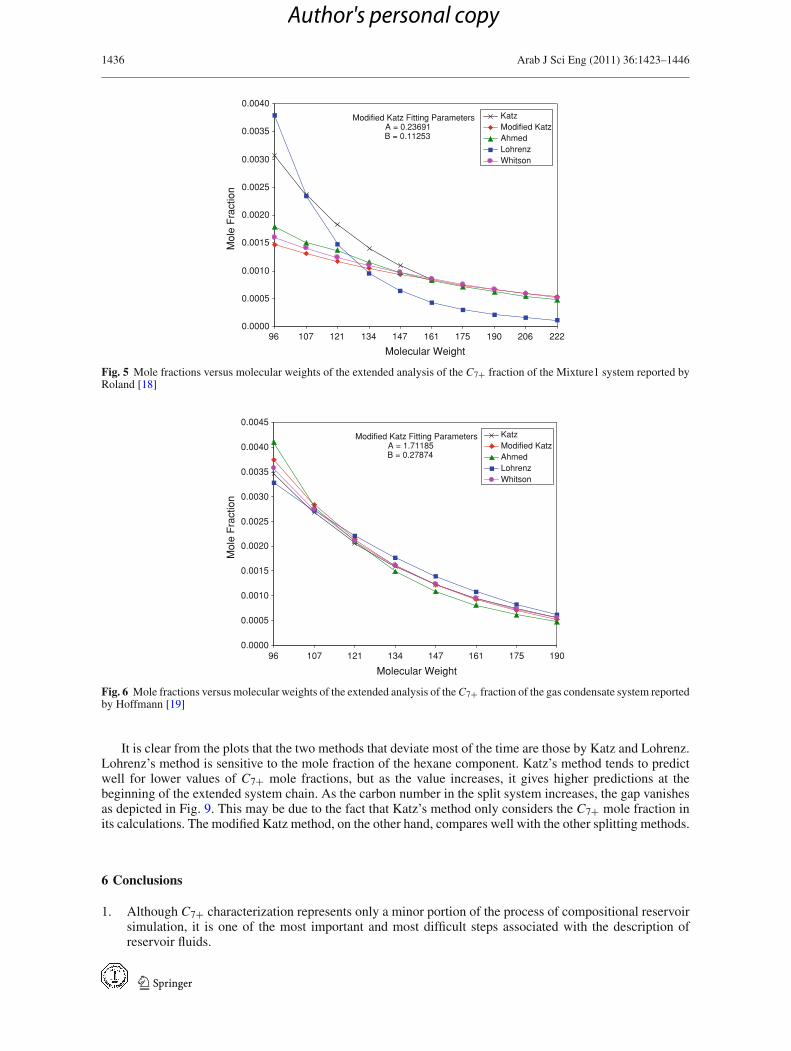
Fig. 5 Mole fractions versus molecular weights of the extended analysis of the C7+ fraction of the Mixture1 system reported byRoland [18]
Modified Katz Fitting ParametersA = 1.71185B = 0.27874
0.0000
0.0005
0.0010
0.0015
0.0020
0.0025
0.0030
0.0035
0.0040
0.0045
96 107 121 134 147 161 175 190
Molecular Weight
Mol
e F
ract
ion
KatzModified KatzAhmedLohrenzWhitson
Fig. 6 Mole fractions versus molecular weights of the extended analysis of the C7+ fraction of the gas condensate system reportedby Hoffmann [19]
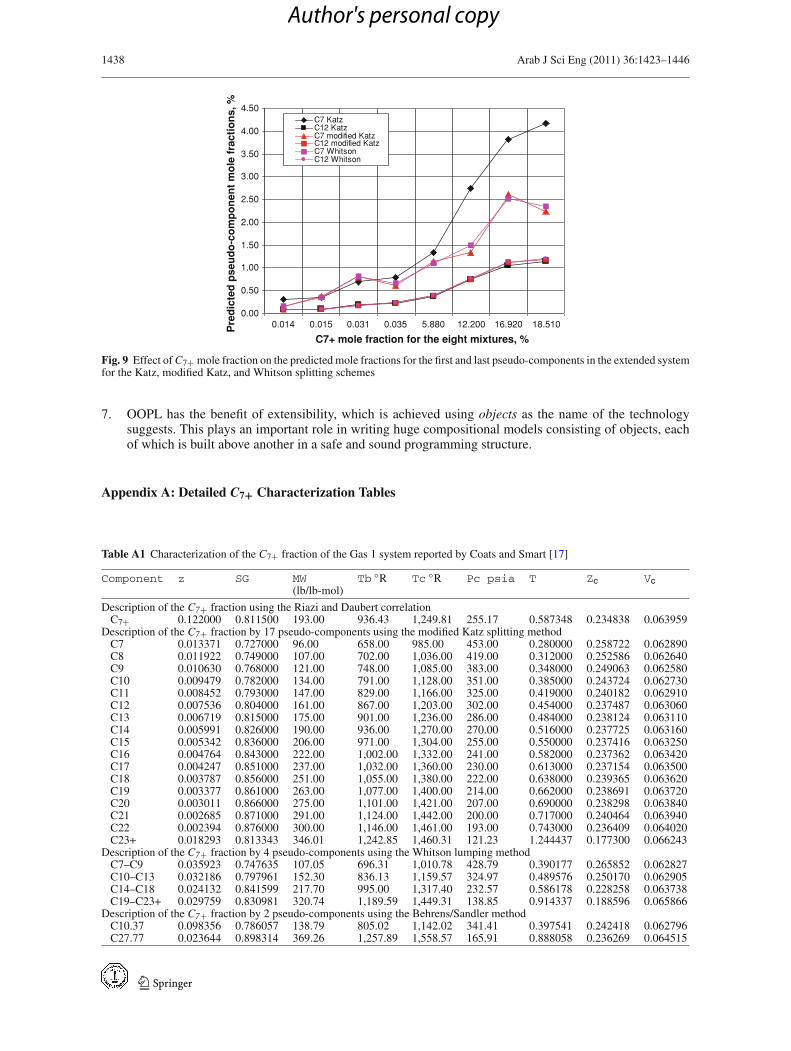
It is clear from the plots that the two methods that deviate most of the time are those by Katz and Lohrenz.Lohrenz’s method is sensitive to the mole fraction of the hexane component. Katz’s method tends to predictwell for lower values of C7+ mole fractions, but as the value increases, it gives higher predictions at thebeginning of the extended system chain. As the carbon number in the split system increases, the gap vanishesas depicted in Fig. 9. This may be due to the fact that Katz’s method only considers the C7+ mole fraction inits calculations. The modified Katz method, on the other hand, compares well with the other splitting methods.
6 Conclusions
1. Although C7+ characterization represents only a minor portion of the process of compositional reservoirsimulation, it is one of the most important and most difficult steps associated with the description ofreservoir fluids.
123
Author's personal copy
Arab J Sci Eng (2011) 36:1423–1446 1437
Modified Katz Fitting ParametersA = 0.67950B = 0.19318
0.000
0.001
0.002
0.003
0.004
0.005
0.006
0.007
0.008
0.009
96 107 121 134 147 161 175 190
Molecular Weight
Mol
e F
ract
ion
KatzModified KatzAhmedLohrenzWhitson
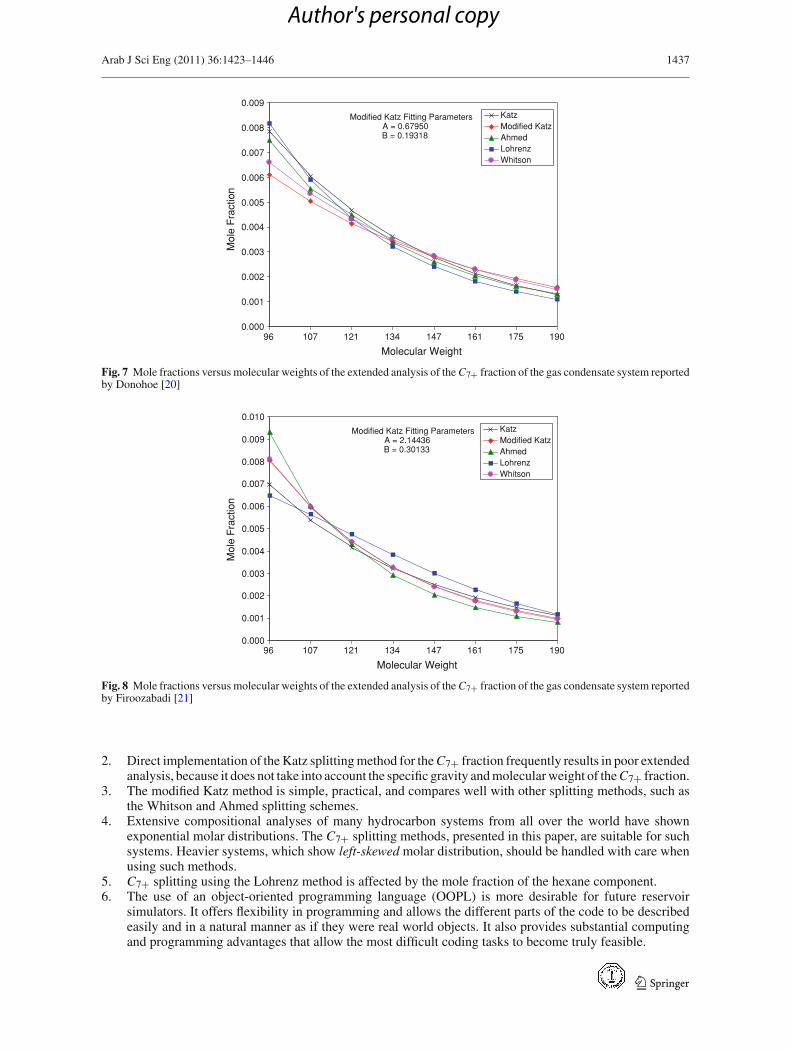
Fig. 7 Mole fractions versus molecular weights of the extended analysis of the C7+ fraction of the gas condensate system reportedby Donohoe [20]
Modified Katz Fitting ParametersA = 2.14436B = 0.30133
0.000
0.001
0.002
0.003
0.004
0.005
0.006
0.007
0.008
0.009
0.010
96 107 121 134 147 161 175 190
Molecular Weight
Mol
e F
ract
ion
KatzModified KatzAhmedLohrenzWhitson
Fig. 8 Mole fractions versus molecular weights of the extended analysis of the C7+ fraction of the gas condensate system reportedby Firoozabadi [21]
2. Direct implementation of the Katz splitting method for the C7+ fraction frequently results in poor extendedanalysis, because it does not take into account the specific gravity and molecular weight of the C7+ fraction.
3. The modified Katz method is simple, practical, and compares well with other splitting methods, such asthe Whitson and Ahmed splitting schemes.
4. Extensive compositional analyses of many hydrocarbon systems from all over the world have shownexponential molar distributions. The C7+ splitting methods, presented in this paper, are suitable for suchsystems. Heavier systems, which show left-skewed molar distribution, should be handled with care whenusing such methods.
5. C7+ splitting using the Lohrenz method is affected by the mole fraction of the hexane component.6. The use of an object-oriented programming language (OOPL) is more desirable for future reservoir
simulators. It offers flexibility in programming and allows the different parts of the code to be describedeasily and in a natural manner as if they were real world objects. It also provides substantial computingand programming advantages that allow the most difficult coding tasks to become truly feasible.
123
Author's personal copy
1438 Arab J Sci Eng (2011) 36:1423–1446
0.00
0.50
1.00
1.50
2.00
2.50
3.00
3.50
4.00
4.50
0.014 0.015 0.031 0.035 5.880 12.200 16.920 18.510
C7+ mole fraction for the eight mixtures, %
Pre
dic
ted
pse
ud
o-c
om
po
nen
t m
ole
fra
ctio
ns,
%
C7 KatzC12 KatzC7 modified KatzC12 modified KatzC7 WhitsonC12 Whitson
Fig. 9 Effect of C7+ mole fraction on the predicted mole fractions for the first and last pseudo-components in the extended systemfor the Katz, modified Katz, and Whitson splitting schemes
7. OOPL has the benefit of extensibility, which is achieved using objects as the name of the technologysuggests. This plays an important role in writing huge compositional models consisting of objects, eachof which is built above another in a safe and sound programming structure.
Appendix A: Detailed C7+ Characterization Tables
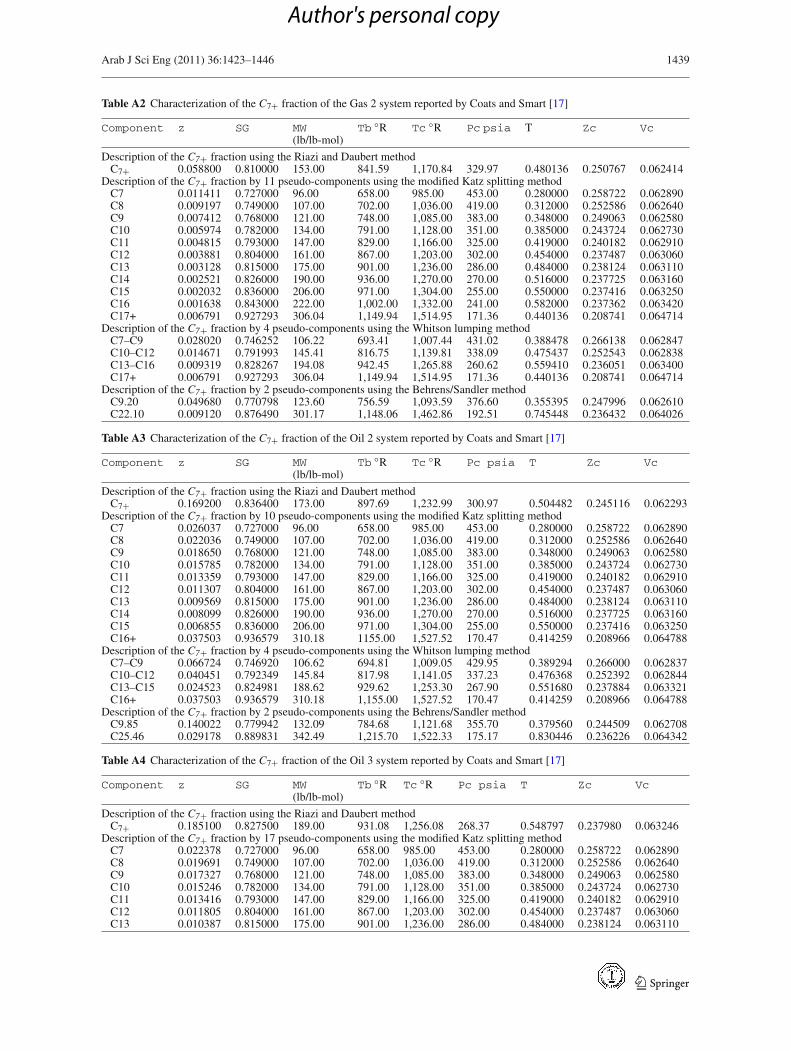
Table A1 Characterization of the C7+ fraction of the Gas 1 system reported by Coats and Smart [17]
Component z SG MW Tb ◦R Tc ◦R Pc psia T Zc Vc(lb/lb-mol)
Description of the C7+ fraction using the Riazi and Daubert correlationC7+ 0.122000 0.811500 193.00 936.43 1,249.81 255.17 0.587348 0.234838 0.063959
Description of the C7+ fraction by 17 pseudo-components using the modified Katz splitting methodC7 0.013371 0.727000 96.00 658.00 985.00 453.00 0.280000 0.258722 0.062890C8 0.011922 0.749000 107.00 702.00 1,036.00 419.00 0.312000 0.252586 0.062640C9 0.010630 0.768000 121.00 748.00 1,085.00 383.00 0.348000 0.249063 0.062580C10 0.009479 0.782000 134.00 791.00 1,128.00 351.00 0.385000 0.243724 0.062730C11 0.008452 0.793000 147.00 829.00 1,166.00 325.00 0.419000 0.240182 0.062910C12 0.007536 0.804000 161.00 867.00 1,203.00 302.00 0.454000 0.237487 0.063060C13 0.006719 0.815000 175.00 901.00 1,236.00 286.00 0.484000 0.238124 0.063110C14 0.005991 0.826000 190.00 936.00 1,270.00 270.00 0.516000 0.237725 0.063160C15 0.005342 0.836000 206.00 971.00 1,304.00 255.00 0.550000 0.237416 0.063250C16 0.004764 0.843000 222.00 1,002.00 1,332.00 241.00 0.582000 0.237362 0.063420C17 0.004247 0.851000 237.00 1,032.00 1,360.00 230.00 0.613000 0.237154 0.063500C18 0.003787 0.856000 251.00 1,055.00 1,380.00 222.00 0.638000 0.239365 0.063620C19 0.003377 0.861000 263.00 1,077.00 1,400.00 214.00 0.662000 0.238691 0.063720C20 0.003011 0.866000 275.00 1,101.00 1,421.00 207.00 0.690000 0.238298 0.063840C21 0.002685 0.871000 291.00 1,124.00 1,442.00 200.00 0.717000 0.240464 0.063940C22 0.002394 0.876000 300.00 1,146.00 1,461.00 193.00 0.743000 0.236409 0.064020C23+ 0.018293 0.813343 346.01 1,242.85 1,460.31 121.23 1.244437 0.177300 0.066243
Description of the C7+ fraction by 4 pseudo-components using the Whitson lumping methodC7–C9 0.035923 0.747635 107.05 696.31 1,010.78 428.79 0.390177 0.265852 0.062827C10–C13 0.032186 0.797961 152.30 836.13 1,159.57 324.97 0.489576 0.250170 0.062905C14–C18 0.024132 0.841599 217.70 995.00 1,317.40 232.57 0.586178 0.228258 0.063738C19–C23+ 0.029759 0.830981 320.74 1,189.59 1,449.31 138.85 0.914337 0.188596 0.065866
Description of the C7+ fraction by 2 pseudo-components using the Behrens/Sandler methodC10.37 0.098356 0.786057 138.79 805.02 1,142.02 341.41 0.397541 0.242418 0.062796C27.77 0.023644 0.898314 369.26 1,257.89 1,558.57 165.91 0.888058 0.236269 0.064515
123
Author's personal copy
Arab J Sci Eng (2011) 36:1423–1446 1439
Table A2 Characterization of the C7+ fraction of the Gas 2 system reported by Coats and Smart [17]
Component z SG MW Tb ◦R Tc ◦R Pc psia T Zc Vc(lb/lb-mol)
Description of the C7+ fraction using the Riazi and Daubert methodC7+ 0.058800 0.810000 153.00 841.59 1,170.84 329.97 0.480136 0.250767 0.062414
Description of the C7+ fraction by 11 pseudo-components using the modified Katz splitting methodC7 0.011411 0.727000 96.00 658.00 985.00 453.00 0.280000 0.258722 0.062890C8 0.009197 0.749000 107.00 702.00 1,036.00 419.00 0.312000 0.252586 0.062640C9 0.007412 0.768000 121.00 748.00 1,085.00 383.00 0.348000 0.249063 0.062580C10 0.005974 0.782000 134.00 791.00 1,128.00 351.00 0.385000 0.243724 0.062730C11 0.004815 0.793000 147.00 829.00 1,166.00 325.00 0.419000 0.240182 0.062910C12 0.003881 0.804000 161.00 867.00 1,203.00 302.00 0.454000 0.237487 0.063060C13 0.003128 0.815000 175.00 901.00 1,236.00 286.00 0.484000 0.238124 0.063110C14 0.002521 0.826000 190.00 936.00 1,270.00 270.00 0.516000 0.237725 0.063160C15 0.002032 0.836000 206.00 971.00 1,304.00 255.00 0.550000 0.237416 0.063250C16 0.001638 0.843000 222.00 1,002.00 1,332.00 241.00 0.582000 0.237362 0.063420C17+ 0.006791 0.927293 306.04 1,149.94 1,514.95 171.36 0.440136 0.208741 0.064714
Description of the C7+ fraction by 4 pseudo-components using the Whitson lumping methodC7–C9 0.028020 0.746252 106.22 693.41 1,007.44 431.02 0.388478 0.266138 0.062847C10–C12 0.014671 0.791993 145.41 816.75 1,139.81 338.09 0.475437 0.252543 0.062838C13–C16 0.009319 0.828267 194.08 942.45 1,265.88 260.62 0.559410 0.236051 0.063400C17+ 0.006791 0.927293 306.04 1,149.94 1,514.95 171.36 0.440136 0.208741 0.064714
Description of the C7+ fraction by 2 pseudo-components using the Behrens/Sandler methodC9.20 0.049680 0.770798 123.60 756.59 1,093.59 376.60 0.355395 0.247996 0.062610C22.10 0.009120 0.876490 301.17 1,148.06 1,462.86 192.51 0.745448 0.236432 0.064026
Table A3 Characterization of the C7+ fraction of the Oil 2 system reported by Coats and Smart [17]
Component z SG MW Tb ◦R Tc ◦R Pc psia T Zc Vc(lb/lb-mol)
Description of the C7+ fraction using the Riazi and Daubert methodC7+ 0.169200 0.836400 173.00 897.69 1,232.99 300.97 0.504482 0.245116 0.062293
Description of the C7+ fraction by 10 pseudo-components using the modified Katz splitting methodC7 0.026037 0.727000 96.00 658.00 985.00 453.00 0.280000 0.258722 0.062890C8 0.022036 0.749000 107.00 702.00 1,036.00 419.00 0.312000 0.252586 0.062640C9 0.018650 0.768000 121.00 748.00 1,085.00 383.00 0.348000 0.249063 0.062580C10 0.015785 0.782000 134.00 791.00 1,128.00 351.00 0.385000 0.243724 0.062730C11 0.013359 0.793000 147.00 829.00 1,166.00 325.00 0.419000 0.240182 0.062910C12 0.011307 0.804000 161.00 867.00 1,203.00 302.00 0.454000 0.237487 0.063060C13 0.009569 0.815000 175.00 901.00 1,236.00 286.00 0.484000 0.238124 0.063110C14 0.008099 0.826000 190.00 936.00 1,270.00 270.00 0.516000 0.237725 0.063160C15 0.006855 0.836000 206.00 971.00 1,304.00 255.00 0.550000 0.237416 0.063250C16+ 0.037503 0.936579 310.18 1155.00 1,527.52 170.47 0.414259 0.208966 0.064788
Description of the C7+ fraction by 4 pseudo-components using the Whitson lumping methodC7–C9 0.066724 0.746920 106.62 694.81 1,009.05 429.95 0.389294 0.266000 0.062837C10–C12 0.040451 0.792349 145.84 817.98 1,141.05 337.23 0.476368 0.252392 0.062844C13–C15 0.024523 0.824981 188.62 929.62 1,253.30 267.90 0.551680 0.237884 0.063321C16+ 0.037503 0.936579 310.18 1,155.00 1,527.52 170.47 0.414259 0.208966 0.064788
Description of the C7+ fraction by 2 pseudo-components using the Behrens/Sandler methodC9.85 0.140022 0.779942 132.09 784.68 1,121.68 355.70 0.379560 0.244509 0.062708C25.46 0.029178 0.889831 342.49 1,215.70 1,522.33 175.17 0.830446 0.236226 0.064342
Table A4 Characterization of the C7+ fraction of the Oil 3 system reported by Coats and Smart [17]
Component z SG MW Tb ◦R Tc ◦R Pc psia T Zc Vc(lb/lb-mol)
Description of the C7+ fraction using the Riazi and Daubert methodC7+ 0.185100 0.827500 189.00 931.08 1,256.08 268.37 0.548797 0.237980 0.063246
Description of the C7+ fraction by 17 pseudo-components using the modified Katz splitting methodC7 0.022378 0.727000 96.00 658.00 985.00 453.00 0.280000 0.258722 0.062890C8 0.019691 0.749000 107.00 702.00 1,036.00 419.00 0.312000 0.252586 0.062640C9 0.017327 0.768000 121.00 748.00 1,085.00 383.00 0.348000 0.249063 0.062580C10 0.015246 0.782000 134.00 791.00 1,128.00 351.00 0.385000 0.243724 0.062730C11 0.013416 0.793000 147.00 829.00 1,166.00 325.00 0.419000 0.240182 0.062910C12 0.011805 0.804000 161.00 867.00 1,203.00 302.00 0.454000 0.237487 0.063060C13 0.010387 0.815000 175.00 901.00 1,236.00 286.00 0.484000 0.238124 0.063110
123
Author's personal copy
1440 Arab J Sci Eng (2011) 36:1423–1446
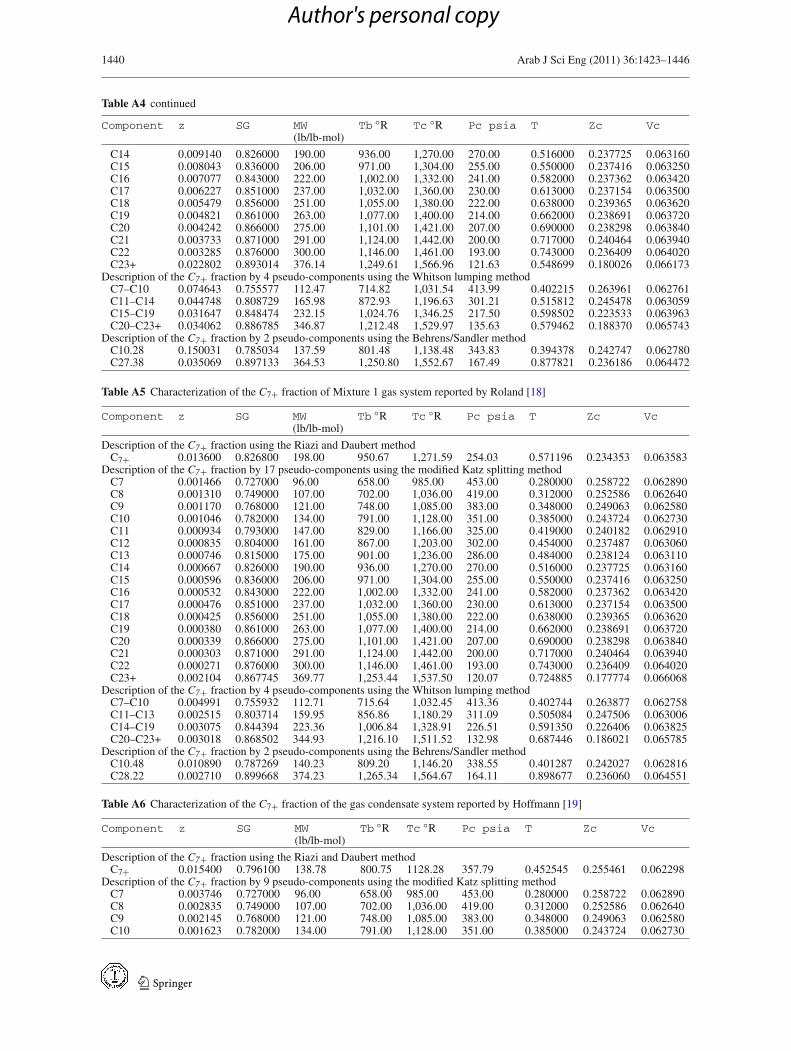
Table A4 continued
Component z SG MW Tb ◦R Tc ◦R Pc psia T Zc Vc(lb/lb-mol)
C14 0.009140 0.826000 190.00 936.00 1,270.00 270.00 0.516000 0.237725 0.063160C15 0.008043 0.836000 206.00 971.00 1,304.00 255.00 0.550000 0.237416 0.063250C16 0.007077 0.843000 222.00 1,002.00 1,332.00 241.00 0.582000 0.237362 0.063420C17 0.006227 0.851000 237.00 1,032.00 1,360.00 230.00 0.613000 0.237154 0.063500C18 0.005479 0.856000 251.00 1,055.00 1,380.00 222.00 0.638000 0.239365 0.063620C19 0.004821 0.861000 263.00 1,077.00 1,400.00 214.00 0.662000 0.238691 0.063720C20 0.004242 0.866000 275.00 1,101.00 1,421.00 207.00 0.690000 0.238298 0.063840C21 0.003733 0.871000 291.00 1,124.00 1,442.00 200.00 0.717000 0.240464 0.063940C22 0.003285 0.876000 300.00 1,146.00 1,461.00 193.00 0.743000 0.236409 0.064020C23+ 0.022802 0.893014 376.14 1,249.61 1,566.96 121.63 0.548699 0.180026 0.066173
Description of the C7+ fraction by 4 pseudo-components using the Whitson lumping methodC7–C10 0.074643 0.755577 112.47 714.82 1,031.54 413.99 0.402215 0.263961 0.062761C11–C14 0.044748 0.808729 165.98 872.93 1,196.63 301.21 0.515812 0.245478 0.063059C15–C19 0.031647 0.848474 232.15 1,024.76 1,346.25 217.50 0.598502 0.223533 0.063963C20–C23+ 0.034062 0.886785 346.87 1,212.48 1,529.97 135.63 0.579462 0.188370 0.065743
Description of the C7+ fraction by 2 pseudo-components using the Behrens/Sandler methodC10.28 0.150031 0.785034 137.59 801.48 1,138.48 343.83 0.394378 0.242747 0.062780C27.38 0.035069 0.897133 364.53 1,250.80 1,552.67 167.49 0.877821 0.236186 0.064472
Table A5 Characterization of the C7+ fraction of Mixture 1 gas system reported by Roland [18]
Component z SG MW Tb ◦R Tc ◦R Pc psia T Zc Vc(lb/lb-mol)
Description of the C7+ fraction using the Riazi and Daubert methodC7+ 0.013600 0.826800 198.00 950.67 1,271.59 254.03 0.571196 0.234353 0.063583
Description of the C7+ fraction by 17 pseudo-components using the modified Katz splitting methodC7 0.001466 0.727000 96.00 658.00 985.00 453.00 0.280000 0.258722 0.062890C8 0.001310 0.749000 107.00 702.00 1,036.00 419.00 0.312000 0.252586 0.062640C9 0.001170 0.768000 121.00 748.00 1,085.00 383.00 0.348000 0.249063 0.062580C10 0.001046 0.782000 134.00 791.00 1,128.00 351.00 0.385000 0.243724 0.062730C11 0.000934 0.793000 147.00 829.00 1,166.00 325.00 0.419000 0.240182 0.062910C12 0.000835 0.804000 161.00 867.00 1,203.00 302.00 0.454000 0.237487 0.063060C13 0.000746 0.815000 175.00 901.00 1,236.00 286.00 0.484000 0.238124 0.063110C14 0.000667 0.826000 190.00 936.00 1,270.00 270.00 0.516000 0.237725 0.063160C15 0.000596 0.836000 206.00 971.00 1,304.00 255.00 0.550000 0.237416 0.063250C16 0.000532 0.843000 222.00 1,002.00 1,332.00 241.00 0.582000 0.237362 0.063420C17 0.000476 0.851000 237.00 1,032.00 1,360.00 230.00 0.613000 0.237154 0.063500C18 0.000425 0.856000 251.00 1,055.00 1,380.00 222.00 0.638000 0.239365 0.063620C19 0.000380 0.861000 263.00 1,077.00 1,400.00 214.00 0.662000 0.238691 0.063720C20 0.000339 0.866000 275.00 1,101.00 1,421.00 207.00 0.690000 0.238298 0.063840C21 0.000303 0.871000 291.00 1,124.00 1,442.00 200.00 0.717000 0.240464 0.063940C22 0.000271 0.876000 300.00 1,146.00 1,461.00 193.00 0.743000 0.236409 0.064020C23+ 0.002104 0.867745 369.77 1,253.44 1,537.50 120.07 0.724885 0.177774 0.066068
Description of the C7+ fraction by 4 pseudo-components using the Whitson lumping methodC7–C10 0.004991 0.755932 112.71 715.64 1,032.45 413.36 0.402744 0.263877 0.062758C11–C13 0.002515 0.803714 159.95 856.86 1,180.29 311.09 0.505084 0.247506 0.063006C14–C19 0.003075 0.844394 223.36 1,006.84 1,328.91 226.51 0.591350 0.226406 0.063825C20–C23+ 0.003018 0.868502 344.93 1,216.10 1,511.52 132.98 0.687446 0.186021 0.065785
Description of the C7+ fraction by 2 pseudo-components using the Behrens/Sandler methodC10.48 0.010890 0.787269 140.23 809.20 1,146.20 338.55 0.401287 0.242027 0.062816C28.22 0.002710 0.899668 374.23 1,265.34 1,564.67 164.11 0.898677 0.236060 0.064551
Table A6 Characterization of the C7+ fraction of the gas condensate system reported by Hoffmann [19]
Component z SG MW Tb ◦R Tc ◦R Pc psia T Zc Vc(lb/lb-mol)
Description of the C7+ fraction using the Riazi and Daubert methodC7+ 0.015400 0.796100 138.78 800.75 1128.28 357.79 0.452545 0.255461 0.062298
Description of the C7+ fraction by 9 pseudo-components using the modified Katz splitting methodC7 0.003746 0.727000 96.00 658.00 985.00 453.00 0.280000 0.258722 0.062890C8 0.002835 0.749000 107.00 702.00 1,036.00 419.00 0.312000 0.252586 0.062640C9 0.002145 0.768000 121.00 748.00 1,085.00 383.00 0.348000 0.249063 0.062580C10 0.001623 0.782000 134.00 791.00 1,128.00 351.00 0.385000 0.243724 0.062730
123
Author's personal copy
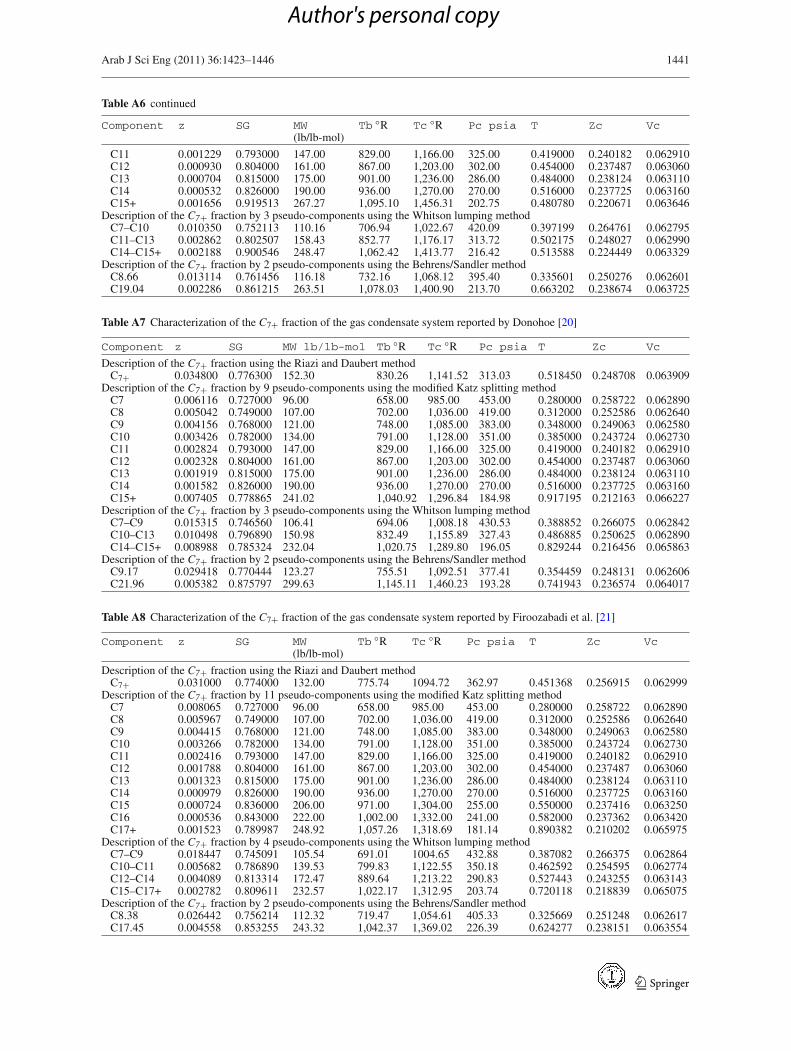
Arab J Sci Eng (2011) 36:1423–1446 1441
Table A6 continued
Component z SG MW Tb ◦R Tc ◦R Pc psia T Zc Vc(lb/lb-mol)
C11 0.001229 0.793000 147.00 829.00 1,166.00 325.00 0.419000 0.240182 0.062910C12 0.000930 0.804000 161.00 867.00 1,203.00 302.00 0.454000 0.237487 0.063060C13 0.000704 0.815000 175.00 901.00 1,236.00 286.00 0.484000 0.238124 0.063110C14 0.000532 0.826000 190.00 936.00 1,270.00 270.00 0.516000 0.237725 0.063160C15+ 0.001656 0.919513 267.27 1,095.10 1,456.31 202.75 0.480780 0.220671 0.063646
Description of the C7+ fraction by 3 pseudo-components using the Whitson lumping methodC7–C10 0.010350 0.752113 110.16 706.94 1,022.67 420.09 0.397199 0.264761 0.062795C11–C13 0.002862 0.802507 158.43 852.77 1,176.17 313.72 0.502175 0.248027 0.062990C14–C15+ 0.002188 0.900546 248.47 1,062.42 1,413.77 216.42 0.513588 0.224449 0.063329
Description of the C7+ fraction by 2 pseudo-components using the Behrens/Sandler methodC8.66 0.013114 0.761456 116.18 732.16 1,068.12 395.40 0.335601 0.250276 0.062601C19.04 0.002286 0.861215 263.51 1,078.03 1,400.90 213.70 0.663202 0.238674 0.063725
Table A7 Characterization of the C7+ fraction of the gas condensate system reported by Donohoe [20]
Component z SG MW lb/lb-mol Tb ◦R Tc ◦R Pc psia T Zc Vc
Description of the C7+ fraction using the Riazi and Daubert methodC7+ 0.034800 0.776300 152.30 830.26 1,141.52 313.03 0.518450 0.248708 0.063909
Description of the C7+ fraction by 9 pseudo-components using the modified Katz splitting methodC7 0.006116 0.727000 96.00 658.00 985.00 453.00 0.280000 0.258722 0.062890C8 0.005042 0.749000 107.00 702.00 1,036.00 419.00 0.312000 0.252586 0.062640C9 0.004156 0.768000 121.00 748.00 1,085.00 383.00 0.348000 0.249063 0.062580C10 0.003426 0.782000 134.00 791.00 1,128.00 351.00 0.385000 0.243724 0.062730C11 0.002824 0.793000 147.00 829.00 1,166.00 325.00 0.419000 0.240182 0.062910C12 0.002328 0.804000 161.00 867.00 1,203.00 302.00 0.454000 0.237487 0.063060C13 0.001919 0.815000 175.00 901.00 1,236.00 286.00 0.484000 0.238124 0.063110C14 0.001582 0.826000 190.00 936.00 1,270.00 270.00 0.516000 0.237725 0.063160C15+ 0.007405 0.778865 241.02 1,040.92 1,296.84 184.98 0.917195 0.212163 0.066227
Description of the C7+ fraction by 3 pseudo-components using the Whitson lumping methodC7–C9 0.015315 0.746560 106.41 694.06 1,008.18 430.53 0.388852 0.266075 0.062842C10–C13 0.010498 0.796890 150.98 832.49 1,155.89 327.43 0.486885 0.250625 0.062890C14–C15+ 0.008988 0.785324 232.04 1,020.75 1,289.80 196.05 0.829244 0.216456 0.065863
Description of the C7+ fraction by 2 pseudo-components using the Behrens/Sandler methodC9.17 0.029418 0.770444 123.27 755.51 1,092.51 377.41 0.354459 0.248131 0.062606C21.96 0.005382 0.875797 299.63 1,145.11 1,460.23 193.28 0.741943 0.236574 0.064017
Table A8 Characterization of the C7+ fraction of the gas condensate system reported by Firoozabadi et al. [21]
Component z SG MW Tb ◦R Tc ◦R Pc psia T Zc Vc(lb/lb-mol)
Description of the C7+ fraction using the Riazi and Daubert methodC7+ 0.031000 0.774000 132.00 775.74 1094.72 362.97 0.451368 0.256915 0.062999
Description of the C7+ fraction by 11 pseudo-components using the modified Katz splitting methodC7 0.008065 0.727000 96.00 658.00 985.00 453.00 0.280000 0.258722 0.062890C8 0.005967 0.749000 107.00 702.00 1,036.00 419.00 0.312000 0.252586 0.062640C9 0.004415 0.768000 121.00 748.00 1,085.00 383.00 0.348000 0.249063 0.062580C10 0.003266 0.782000 134.00 791.00 1,128.00 351.00 0.385000 0.243724 0.062730C11 0.002416 0.793000 147.00 829.00 1,166.00 325.00 0.419000 0.240182 0.062910C12 0.001788 0.804000 161.00 867.00 1,203.00 302.00 0.454000 0.237487 0.063060C13 0.001323 0.815000 175.00 901.00 1,236.00 286.00 0.484000 0.238124 0.063110C14 0.000979 0.826000 190.00 936.00 1,270.00 270.00 0.516000 0.237725 0.063160C15 0.000724 0.836000 206.00 971.00 1,304.00 255.00 0.550000 0.237416 0.063250C16 0.000536 0.843000 222.00 1,002.00 1,332.00 241.00 0.582000 0.237362 0.063420C17+ 0.001523 0.789987 248.92 1,057.26 1,318.69 181.14 0.890382 0.210202 0.065975
Description of the C7+ fraction by 4 pseudo-components using the Whitson lumping methodC7–C9 0.018447 0.745091 105.54 691.01 1004.65 432.88 0.387082 0.266375 0.062864C10–C11 0.005682 0.786890 139.53 799.83 1,122.55 350.18 0.462592 0.254595 0.062774C12–C14 0.004089 0.813314 172.47 889.64 1,213.22 290.83 0.527443 0.243255 0.063143C15–C17+ 0.002782 0.809611 232.57 1,022.17 1,312.95 203.74 0.720118 0.218839 0.065075
Description of the C7+ fraction by 2 pseudo-components using the Behrens/Sandler methodC8.38 0.026442 0.756214 112.32 719.47 1,054.61 405.33 0.325669 0.251248 0.062617C17.45 0.004558 0.853255 243.32 1,042.37 1,369.02 226.39 0.624277 0.238151 0.063554
123
Author's personal copy
1442 Arab J Sci Eng (2011) 36:1423–1446
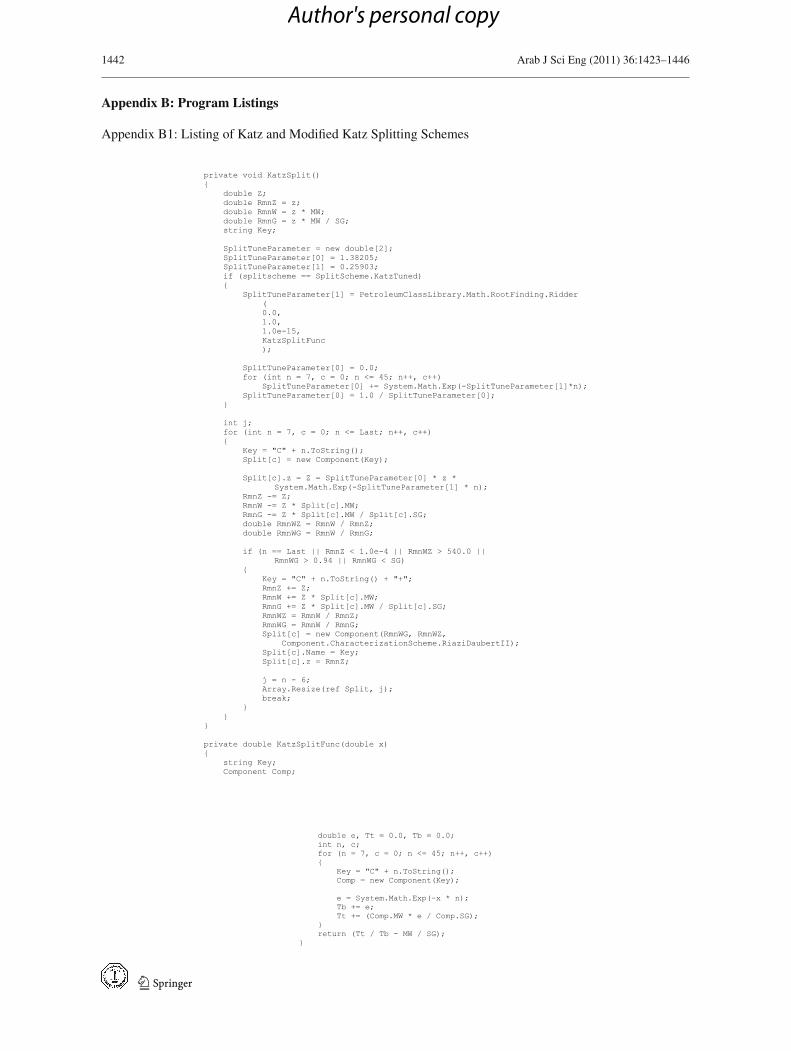
Appendix B: Program Listings
Appendix B1: Listing of Katz and Modified Katz Splitting Schemes
123
Author's personal copy

Arab J Sci Eng (2011) 36:1423–1446 1443
Appendix B2: Listing of Lohrenz Splitting Scheme
123
Author's personal copy
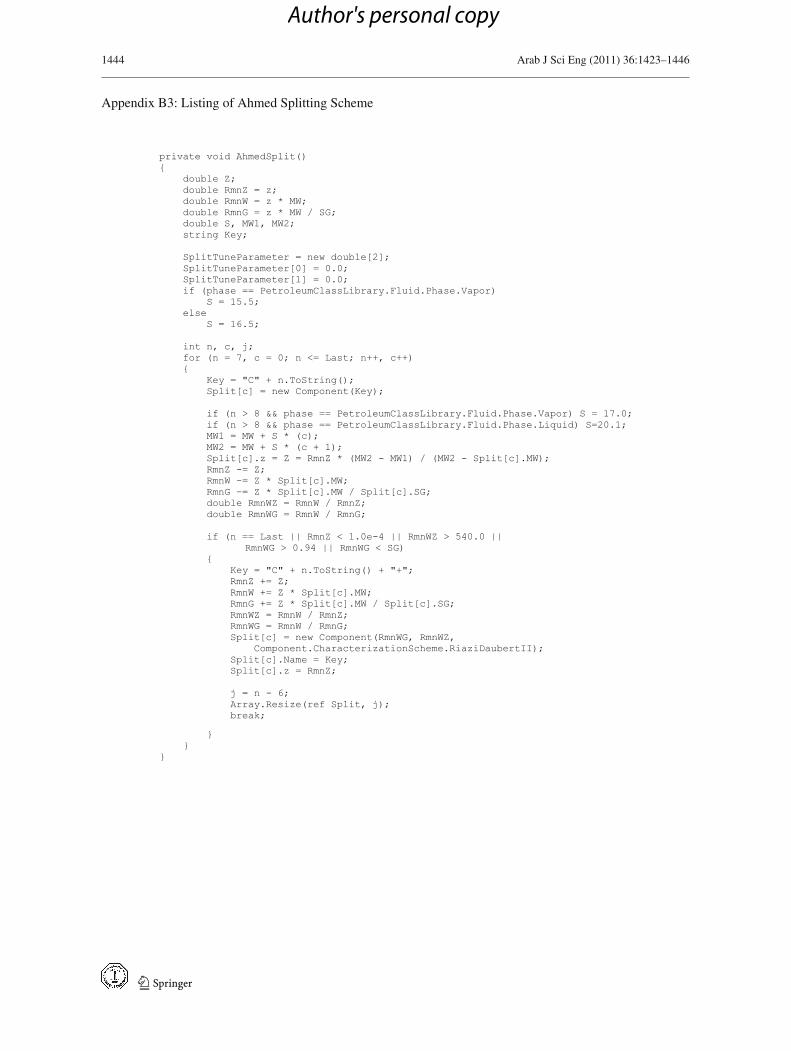
1444 Arab J Sci Eng (2011) 36:1423–1446
Appendix B3: Listing of Ahmed Splitting Scheme
123
Author's personal copy
Arab J Sci Eng (2011) 36:1423–1446 1445
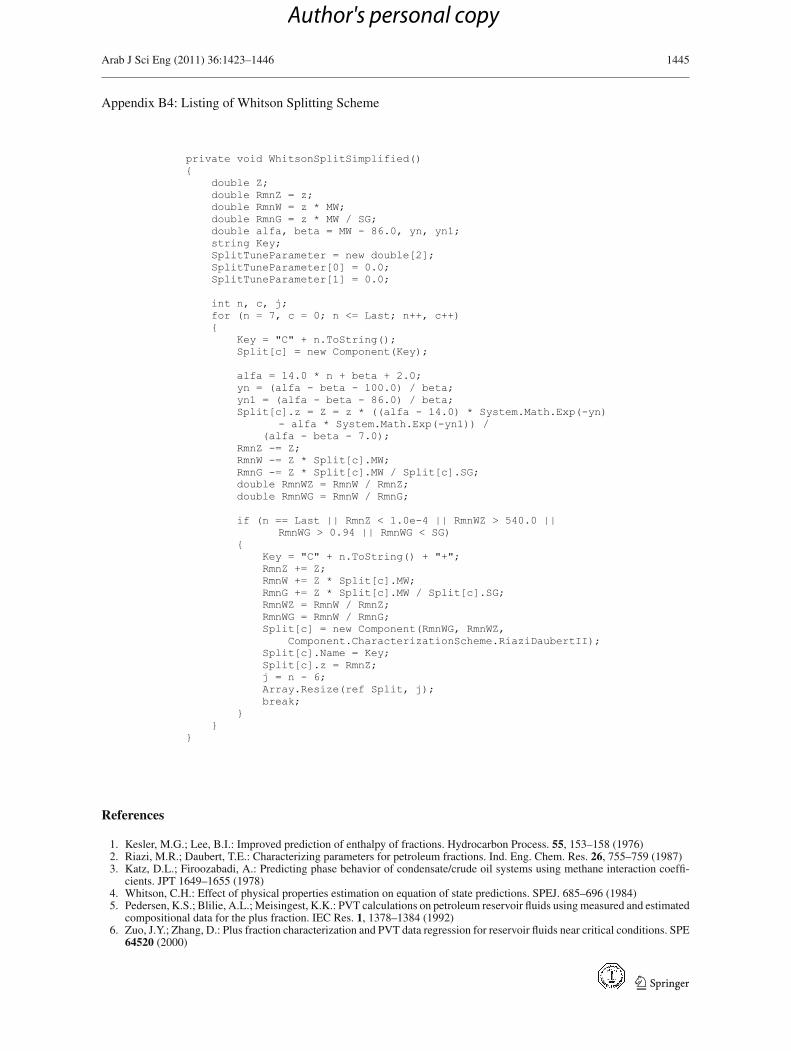
Appendix B4: Listing of Whitson Splitting Scheme
References
1. Kesler, M.G.; Lee, B.I.: Improved prediction of enthalpy of fractions. Hydrocarbon Process. 55, 153–158 (1976)2. Riazi, M.R.; Daubert, T.E.: Characterizing parameters for petroleum fractions. Ind. Eng. Chem. Res. 26, 755–759 (1987)3. Katz, D.L.; Firoozabadi, A.: Predicting phase behavior of condensate/crude oil systems using methane interaction coeffi-
cients. JPT 1649–1655 (1978)4. Whitson, C.H.: Effect of physical properties estimation on equation of state predictions. SPEJ. 685–696 (1984)5. Pedersen, K.S.; Blilie, A.L.; Meisingest, K.K.: PVT calculations on petroleum reservoir fluids using measured and estimated
compositional data for the plus fraction. IEC Res. 1, 1378–1384 (1992)6. Zuo, J.Y.; Zhang, D.: Plus fraction characterization and PVT data regression for reservoir fluids near critical conditions. SPE
64520 (2000)
123
Author's personal copy
1446 Arab J Sci Eng (2011) 36:1423–1446
7. Elsharkawy, A.M.: An empirical model for estimating the saturation pressures of crude oils. J. Petroleum Sci. Eng. 38, 57–77(2003)
8. Almehaideb, R.A.; Al-Khanbashi, A.S.; Abdulkarim, M.; Ali, M.A.: EOS tuning to model full field crude oil propertiesusing multiple well fluid PVT analysis. J. Petroleum Sci. Eng. 26, 291–300 (2000)
9. Avaullee, L.; Duchet-Suchaux, P.; Durandeau, M.; Jaubert, J.N.: A new approach in correlating the oil thermodynamicproperties. J. Petroleum Sci. Eng. 30, 43–65 (2001)
10. Whitson, C.H.; Anderson, T.F.; Soreide, I.: C7+ characterization of related equilibrium fluids using the gamma distribution.In: Chorn, L.G.; Mansoori, G.A. (eds.) C7+ Fraction Characterization, vol. 35. Taylor & Francis, New York (1990)
11. Katz, D.L.: Overview of phase behavior of oil and gas production. JPT 1205–1214 (1953)12. Lohrenz, J.; Bray, B.G.; Clark, C.R.: Calculating viscosities of reservoir fluids from their compositions. JPT Trans. AIME
231, 1171–1178 (1964)13. Pedersen, K.S.; Fredenslund, Aa.; Thomassen, P.: Properties of Oils and Natural Gases, pp. 116–124. Gulf Publishing Co.,
Houston (1989)14. Ahmed, T.H.; Cady, G.V.; Story, A.L.: A generalized correlation for characterizing the hydrocarbon heavy fractions. SPE
14266 (1985)15. Whitson, C.H.: Characterizing hydrocarbon plus fractions. SPEJ 23, 683–694 (1983)16. Behrens, R.; Sandler, S.: The use of semicontinuous description to model the C7+ fraction in equation of state calculations.
SPE Reservoir Eng. 1041–1047 (1988)17. Coats, K.H.; Smart, G.T.: Application of a regression-based EOS PVT program to laboratory data. SPERE, 277–299 (1986)18. Roland, C.H.: Vapor-liquid equilibria for natural gas-crude oil mixtures. Ind. Eng. Chem. Res. 37(10), 930–936 (1942)19. Hoffmann, A.E.; Crump, J.S.; Hocott, C.R.: Equilibrium constants for a gas condensate system. Trans. AIME 198, 1–10
(1953)20. Donohoe, C.W.; Buchanan, R.D.: Economic evaluation of cycling gas-condensate reservoirs with nitrogen. SPE 7494,
263–270 (1981)21. Firoozabadi, A.; Hekim, Y.; Katz, D.L.: Reservoir depletion calculations for gas condensate using extended analysis in the
Peng Robinson equation of state. Canad. J. Chem. Eng. 56, 610–615 (1978)
123
Author's personal copy