Hays Construction Recruitment and Retention Guide_Final
30
hays-us.com BUSINESS OPTIMISM DRIVING NEED FOR LONG-TERM HIRING SOLUTIONS The Hays Construction Recruitment and Retention Guide 2015/16 for Management & Technical Professionals
-
Upload
callum-hewitt -
Category
Documents
-
view
295 -
download
0
Transcript of Hays Construction Recruitment and Retention Guide_Final

hays-us.com
BUSINESS OPTIMISM DRIVING NEED FOR LONG-TERM HIRING SOLUTIONSThe Hays Construction Recruitment and Retention Guide 2015/16 for Management & Technical Professionals
2 | Construction Recruitment & Retention Guide
CONTENTS
Introduction - Dan Rodriguez, Managing Director, Hays US 03
Foreword with James Hawley, EVP, Hays US 04
Key findings & recommendations 06
Market confidence 09
Staffing insights 12
Compensation insights 20
Salary listings 22
Benefits 26 About the respondents 28
Construction Recruitment & Retention Guide | 3
INTRODUCTION
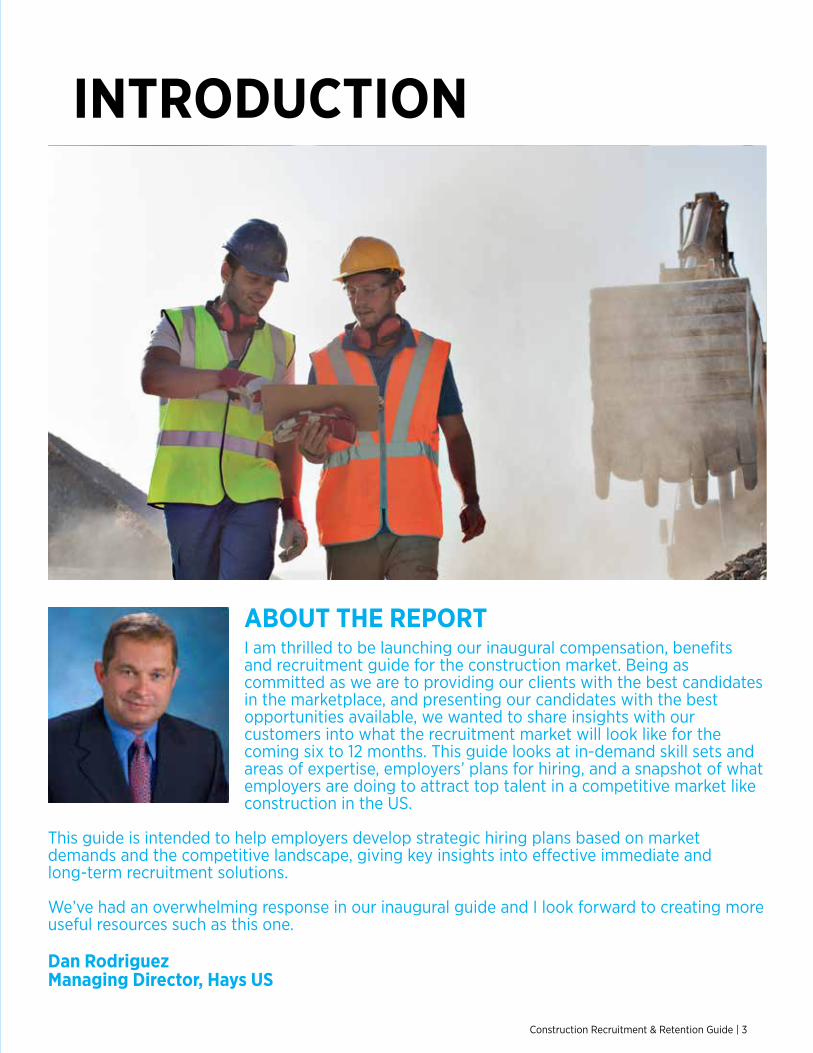
ABOUT THE REPORT I am thrilled to be launching our inaugural compensation, benefits and recruitment guide for the construction market. Being as committed as we are to providing our clients with the best candidates in the marketplace, and presenting our candidates with the best opportunities available, we wanted to share insights with our customers into what the recruitment market will look like for the coming six to 12 months. This guide looks at in-demand skill sets and areas of expertise, employers’ plans for hiring, and a snapshot of what employers are doing to attract top talent in a competitive market like construction in the US.
This guide is intended to help employers develop strategic hiring plans based on market demands and the competitive landscape, giving key insights into effective immediate and long-term recruitment solutions.
We’ve had an overwhelming response in our inaugural guide and I look forward to creating more useful resources such as this one.
Dan RodriguezManaging Director, Hays US
FOREWORD
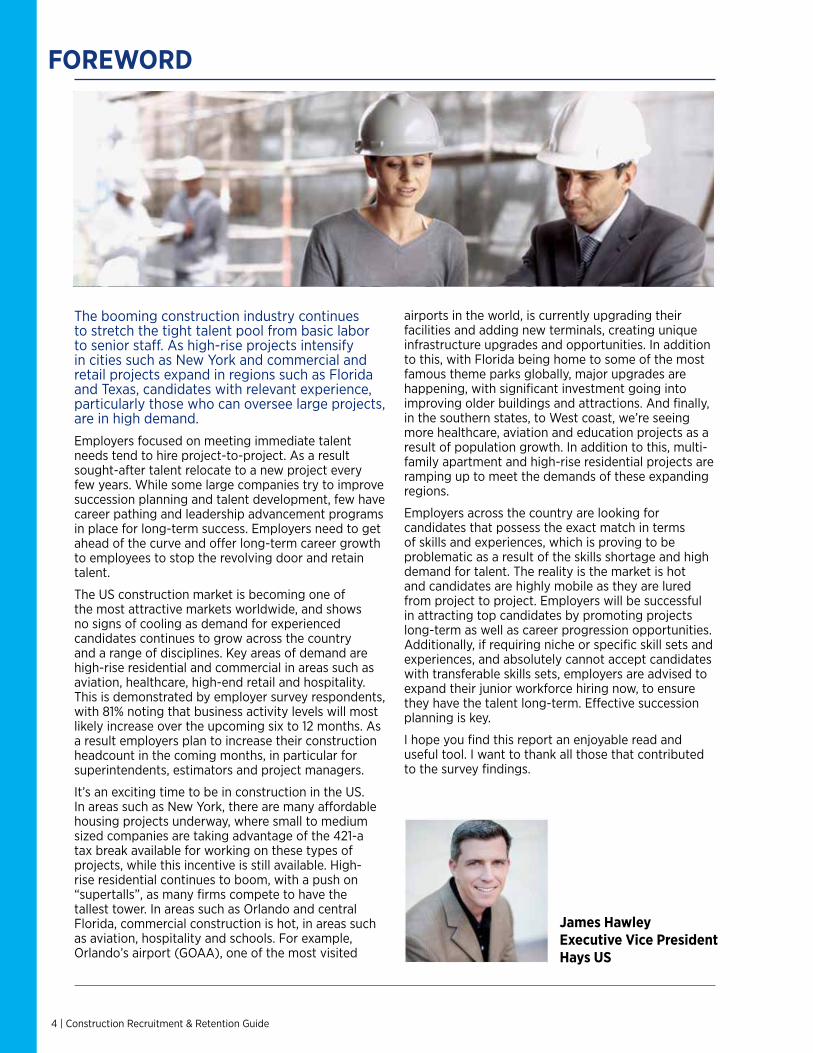
The booming construction industry continues to stretch the tight talent pool from basic labor to senior staff. As high-rise projects intensify in cities such as New York and commercial and retail projects expand in regions such as Florida and Texas, candidates with relevant experience, particularly those who can oversee large projects, are in high demand. Employers focused on meeting immediate talent needs tend to hire project-to-project. As a result sought-after talent relocate to a new project every few years. While some large companies try to improve succession planning and talent development, few have career pathing and leadership advancement programs in place for long-term success. Employers need to get ahead of the curve and offer long-term career growth to employees to stop the revolving door and retain talent.
The US construction market is becoming one of the most attractive markets worldwide, and shows no signs of cooling as demand for experienced candidates continues to grow across the country and a range of disciplines. Key areas of demand are high-rise residential and commercial in areas such as aviation, healthcare, high-end retail and hospitality. This is demonstrated by employer survey respondents, with 81% noting that business activity levels will most likely increase over the upcoming six to 12 months. As a result employers plan to increase their construction headcount in the coming months, in particular for superintendents, estimators and project managers.
It’s an exciting time to be in construction in the US. In areas such as New York, there are many affordable housing projects underway, where small to medium sized companies are taking advantage of the 421-a tax break available for working on these types of projects, while this incentive is still available. High-rise residential continues to boom, with a push on “supertalls”, as many firms compete to have the tallest tower. In areas such as Orlando and central Florida, commercial construction is hot, in areas such as aviation, hospitality and schools. For example, Orlando’s airport (GOAA), one of the most visited
airports in the world, is currently upgrading their facilities and adding new terminals, creating unique infrastructure upgrades and opportunities. In addition to this, with Florida being home to some of the most famous theme parks globally, major upgrades are happening, with significant investment going into improving older buildings and attractions. And finally, in the southern states, to West coast, we’re seeing more healthcare, aviation and education projects as a result of population growth. In addition to this, multi-family apartment and high-rise residential projects are ramping up to meet the demands of these expanding regions.
Employers across the country are looking for candidates that possess the exact match in terms of skills and experiences, which is proving to be problematic as a result of the skills shortage and high demand for talent. The reality is the market is hot and candidates are highly mobile as they are lured from project to project. Employers will be successful in attracting top candidates by promoting projects long-term as well as career progression opportunities. Additionally, if requiring niche or specific skill sets and experiences, and absolutely cannot accept candidates with transferable skills sets, employers are advised to expand their junior workforce hiring now, to ensure they have the talent long-term. Effective succession planning is key.
I hope you find this report an enjoyable read and useful tool. I want to thank all those that contributed to the survey findings.
4 | Construction Recruitment & Retention Guide
James HawleyExecutive Vice PresidentHays US

Construction Recruitment & Retention Guide | 5

KEY FINDINGS & RECOMMENDATIONS
6 | Construction Recruitment & Retention Guide
Key findings
Employers’ confidence in the US marketplace is pushing forward growth plans, which is exacerbating the already candidate short market. As a result, employers are looking to either create hybrid roles or add further responsibilities to current staff to address their immediate areas of concern. This, coupled with strong business activity levels, is adding pressure to existing workforces, which could cause potential retention issues. Construction candidates are finding themselves with the upper hand, as a significant number of employers plan to increase their headcount in the coming year.Despite being an attractive market for candidates in the US, employers are still being selective in who they hire. Employers are looking for candidates with specific project experience, such as size of project based on cost, or type of project based on sector, which is adding to the competitive landscape, especially at the middle management to senior management levels. Employers should look at candidates with transferable skills or experiences to help address their immediate hiring needs, looking at candidates from other regions or sectors, with a proven track record of success. In addition to this, employers should consider increasing the size of their junior workforce, placing emphasis on upskilling and growing their own future leaders. Both of these options will help ensure business plans are met.
Construction employers confidence in the economic stability is high, resulting in targeted hiring plans
Employers are confident in the economic outlook for the US and the majority of employers plan to increase business activity levels in the upcoming six to 12 months. This is resulting in a significant number of employers planning to add to their permanent headcount, creating further demand for professionals in already skill short areas such as estimators, project managers and superintendents.
Employers are willing to pay for top talent, as salary levels increase into 2016
Despite increasing salaries in the past six to 12 months, the majority of employers plan to increase salaries again in the coming six to 12 months, specifically for the skill short areas such as superintendents. Employers are feeling wage pressure, in particular at the middle to senior management levels, but are still willing to alter their salary offerings to attract top talent.
Recruitment is evolving, causing employers new hiring challenges
Almost all construction employer survey respondents say the US construction industry is facing some sort of a skills shortage. They also note that this shortage is negatively affecting their business activity, in particular causing productivity issues. Employers recognize the need to build a talent pipeline both internally and externally to address these issues. Building a talent pipeline externally requires an understanding of the evolving recruitment market and an investment in resources of tools, technology and time to nurture a candidate pool long-term.
Succession planning essential for tackling the skills shortage
Only a small proportion of survey respondents note having a succession plan in place, with a significant number either saying they do not have one or are unaware if they do. Employers further note that the number one motivator for a candidate to leave their organization is career progression (above salary). The US has a significant talent mismatch, and, according to survey respondents, there are not enough skilled candidates entering the construction industry. Currently, employers are not prioritizing building succession plans to address these issues.
Construction Recruitment & Retention Guide | 7
Recommendations
Based on the findings from this guide, the following are the key recommendations for action to support construction employers in building high-performing teams.
Build a talent pipeline for today and tomorrow through a long-term succession plan to meet business forecasts
Build a talent pipeline connected to business growth plans. Employers tend to focus more on issues affecting their bottom line today, but to be successful over the long-term, they need to develop medium to long-term succession plans. Doing so will help ensure that they have the right skills to deliver on their plans.
Invest in training – not only to support staff feeling workplace pressure, but also as an attractive recruitment incentive
Evaluate an existing and new workforce on its future potential rather than focusing solely on current skills and experiences. As part of an effective succession plan, offer training and development to junior and mid-level management staff to support future recruitment needs. Ensure to promote these efforts in your recruitment strategy, as a key selling feature to working for your organization.
Start selling your employer brand with a well thought-out digital recruitment strategy and Employer Value Proposition
Do not wait to advertise, particularly when a job becomes available. Build an employer brand strategy aligned with your internal recruitment efforts that supports future hiring plans and alleviates added pressure when it comes time to hire new staff.
Think beyond just salary with your job offer such as career progression and benefits
There are many components that go into an attractive job offer. To recruit hard-to-find-candidates you have to offer a competitive salary. However, while salary is important, it’s not the only thing candidates look for when deciding whether to accept a job offer or not. Ensure to promote all aspects of the offer such as career progression opportunities, upcoming projects and benefits packages in order to be competitive and attract the best talent.
Be open to transferable skill sets from professionals from other sectors within construction or other industries
Thinking out of the box can be a key factor to the success of a recruitment strategy. There are qualified candidates throughout the US that may be interested in your role, with the right offer and incentive, such as relocation packages. Look to regions that may have more candidates available and consider marketing your opportunities there. Additionally, candidates with strong experience in other sectors within construction may be the right fit for your role and team. Look for skill sets and experiences that are transferable before turning down a candidate. With the proper mentorship or on-boarding, these candidates may be the right fit for your roles.
KEY FINDINGS & RECOMMENDATIONS
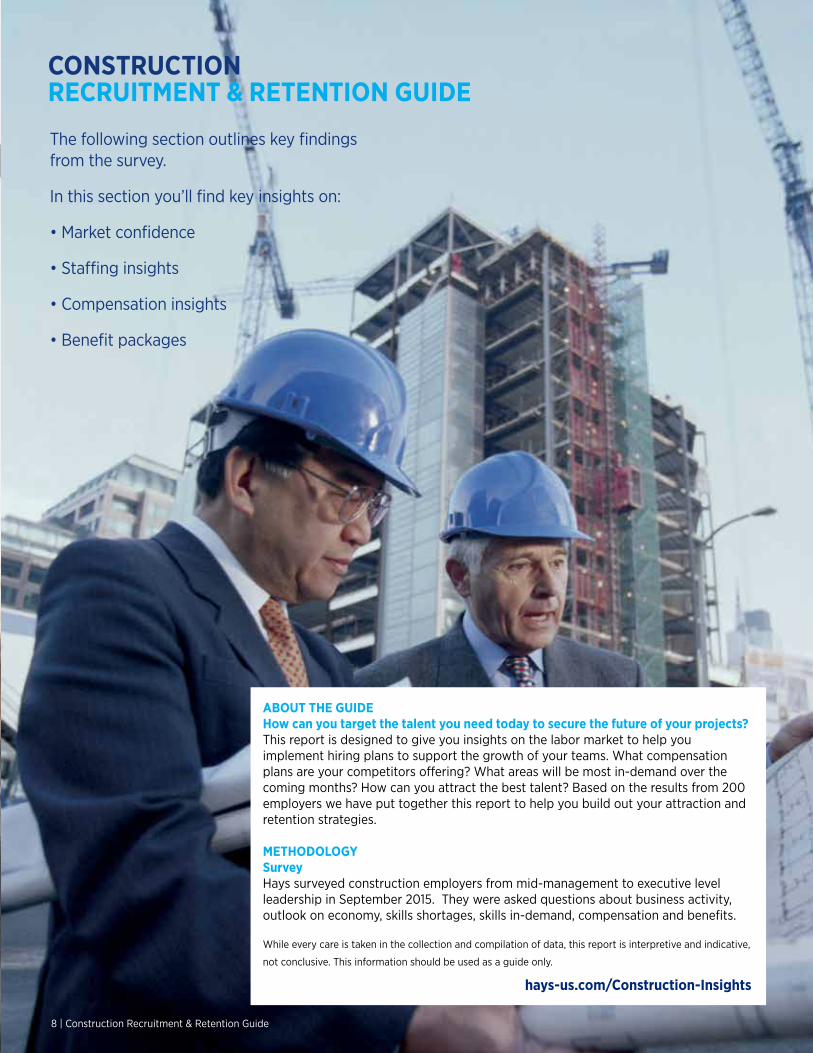
The following section outlines key findings from the survey.
In this section you’ll find key insights on:
• Market confidence
• Staffing insights
• Compensation insights
• Benefit packages
CONSTRUCTIONRECRUITMENT & RETENTION GUIDE
ABOUT THE GUIDEHow can you target the talent you need today to secure the future of your projects?This report is designed to give you insights on the labor market to help you implement hiring plans to support the growth of your teams. What compensation plans are your competitors offering? What areas will be most in-demand over the coming months? How can you attract the best talent? Based on the results from 200 employers we have put together this report to help you build out your attraction and retention strategies.
METHODOLOGYSurveyHays surveyed construction employers from mid-management to executive level leadership in September 2015. They were asked questions about business activity, outlook on economy, skills shortages, skills in-demand, compensation and benefits.
While every care is taken in the collection and compilation of data, this report is interpretive and indicative,
not conclusive. This information should be used as a guide only.
hays-us.com/Construction-Insights
8 | Construction Recruitment & Retention Guide
Construction Recruitment & Retention Guide | 9
MARKET CONFIDENCEAN EXCERPT FROM THE HAYS GLOBAL SKILLS INDEX
US LABOR MARKET OVERVIEW
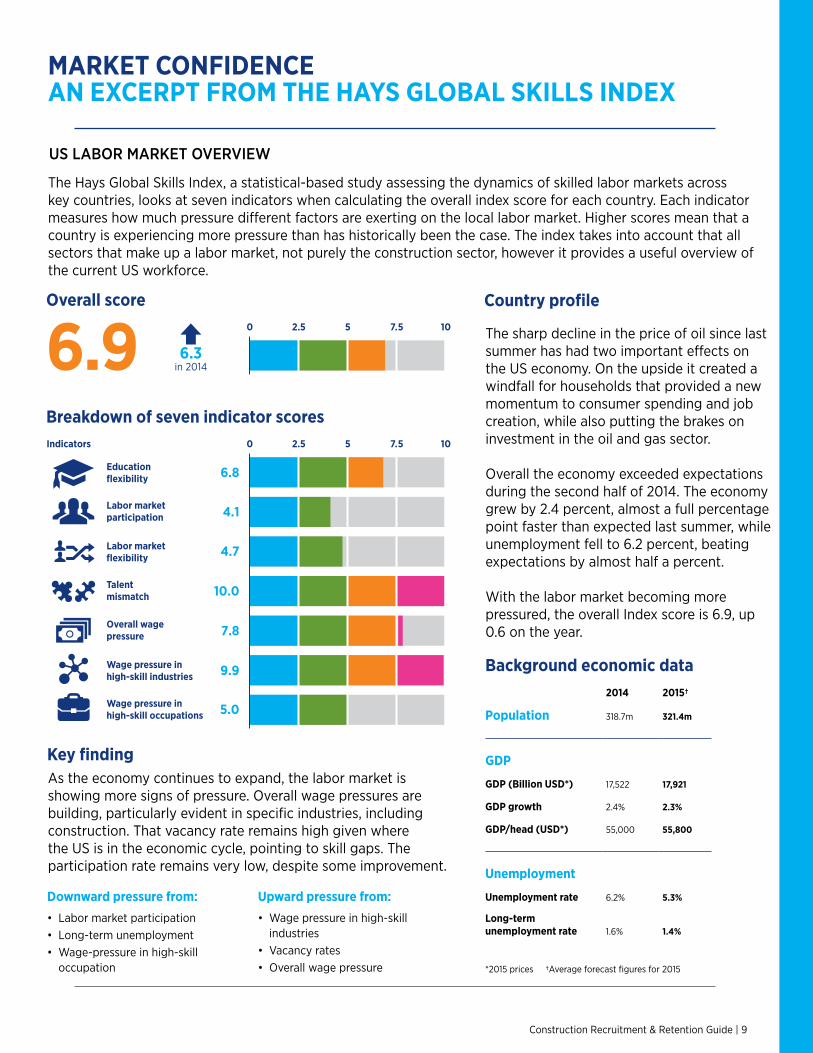
The Hays Global Skills Index, a statistical-based study assessing the dynamics of skilled labor markets across key countries, looks at seven indicators when calculating the overall index score for each country. Each indicator measures how much pressure different factors are exerting on the local labor market. Higher scores mean that a country is experiencing more pressure than has historically been the case. The index takes into account that all sectors that make up a labor market, not purely the construction sector, however it provides a useful overview of the current US workforce.
© Copyright Hays plc 2015. HAYS, the Corporate and Sector H devices, Recruiting experts worldwide, the HAYS Recruiting experts worldwide logo and Powering the World of Work are trade marks of Hays plc. The Corporate and Sector H devices are original designs protected by registration in many countries. All rights are reserved. The reproduction or transmission of all or part of this work, whether by photocopying or storing in any medium by electronic means or otherwise, without the written permission of the owner, is restricted. The commission of any unauthorised act in relation to the work may result in civil and/or criminal action. The analysis on which the Hays Global Skills Index was based utilised data as of Q2 2015. Developments subsequent to this date are not reflected in the 2015 findings.
THE HAYS GLOBAL SKILLS INDEX 2015
UNITED STATESCountry profileThe sharp decline in the price of oil since last summer has had two important effects on the US economy.
On the upside it created a windfall for households that provided a new momentum to consumer spending and job creation, while also putting the brakes on investment in the oil and gas sector.
Overall the economy exceeded expectations during the second half of 2014. The economy grew by 2.4 per cent, almost a full percentage point faster than expected last summer, while unemployment fell to 6.2 per cent, beating expectations by almost half a per cent.
With the labour market becoming more pressured, the overall Index score is 6.9, up 0.6 on the year.
Background economic data2014 2015†
Population 318.7m 321.4m
GDP
GDP (Billion USD*) 17,522 17,921
GDP growth 2.4% 2.3%
GDP/head (USD*) 55,000 55,800
Unemployment
Unemployment rate 6.2% 5.3%
Long-term unemployment rate 1.6% 1.4%
*2015 prices †Average forecast figures for 2015
View from the groundDespite some continued choppiness in the US, economic growth, hiring in the technology, life sciences and construction and property sectors remain strong and job creation picked up considerably in the first half of 2015 in all of these markets. The temp market is very competitive at present in the IT sector – employers are continuing to push forward on IT projects which are creating high demand for developers, especially those with experience in Java, mobile and security. This is creating wage pressure as companies battle from the limited pool of talent, especially for employers that aren’t willing to be flexible on location.
Dan Rodriguez, Managing Director, Hays USA
Key findingAs the economy continues to expand the labour market is showing more signs of pressure. Overall wage pressures are building with pressures particularly evident in some industries. That vacancy rate remains high given where the US is in the economic cycle, pointing to skill gaps. The participation rate remains very low, despite some improvement.
Downward pressure from:• Labour market participation• Long-term unemployment• Wage-pressure in high-skill
occupation
Upward pressure from:• Wage pressure in high-skill
industries• Vacancy rates• Overall wage pressure
Breakdown of seven indicator scores
6.8
4.7
4.1
10.0
7.8
9.9
5.0
0Indicators 2.5 5 7.5 10
Wage pressure in high-skill occupations
Educationflexibility
Labour market participation
Labour market flexibility
Talent mismatch
Overall wage pressure
Wage pressure in high-skill industries
Overall score
6.3in 20146.9 0 2.5 5 7.5 10 The sharp decline in the price of oil since last
summer has had two important effects on the US economy. On the upside it created a windfall for households that provided a newmomentum to consumer spending and job creation, while also putting the brakes on investment in the oil and gas sector.
Overall the economy exceeded expectations during the second half of 2014. The economy grew by 2.4 percent, almost a full percentagepoint faster than expected last summer, while unemployment fell to 6.2 percent, beating expectations by almost half a percent.
With the labor market becoming more pressured, the overall Index score is 6.9, up 0.6 on the year.
© Copyright Hays plc 2015. HAYS, the Corporate and Sector H devices, Recruiting experts worldwide, the HAYS Recruiting experts worldwide logo and Powering the World of Work are trade marks of Hays plc. The Corporate and Sector H devices are original designs protected by registration in many countries. All rights are reserved. The reproduction or transmission of all or part of this work, whether by photocopying or storing in any medium by electronic means or otherwise, without the written permission of the owner, is restricted. The commission of any unauthorised act in relation to the work may result in civil and/or criminal action. The analysis on which the Hays Global Skills Index was based utilised data as of Q2 2015. Developments subsequent to this date are not reflected in the 2015 findings.
THE HAYS GLOBAL SKILLS INDEX 2015
UNITED STATESCountry profileThe sharp decline in the price of oil since last summer has had two important effects on the US economy.
On the upside it created a windfall for households that provided a new momentum to consumer spending and job creation, while also putting the brakes on investment in the oil and gas sector.
Overall the economy exceeded expectations during the second half of 2014. The economy grew by 2.4%, almost a full percentage point faster than expected last summer, while unemployment fell to 6.2%, beating expectations by almost half a percent.
With the labor market becoming more pressured, the overall Index score is 6.9, up 0.6 on the year.
Background economic data2014 2015†
Population 318.7m 321.4m
GDP
GDP (Billion USD*) 17,522 17,921
GDP growth 2.4% 2.3%
GDP/head (USD*) 55,000 55,800
Unemployment
Unemployment rate 6.2% 5.3%
Long-term unemployment rate 1.6% 1.4%
*2015 prices †Average forecast figures for 2015
View from the groundDespite some continued choppiness in the US, economic growth, hiring in the technology, life sciences and construction and property sectors remain strong and job creation picked up considerably in the first half of 2015 in all of these markets. The flex market is very competitive at present in the IT sector – employers are continuing to push forward on IT projects which are creating high demand for developers, especially those with experience in Java, mobile and security. This is creating wage pressure as companies battle from the limited pool of talent, especially for employers that aren’t willing to be flexible on location.
Dan Rodriguez, Managing Director, Hays USA
Key findingAs the economy continues to expand the labor market is showing more signs of pressure. Overall wage pressures are building with pressures particularly evident in some industries. That vacancy rate remains high given where the US is in the economic cycle, pointing to skill gaps. The participation rate remains very low, despite some improvement.
Downward pressure from:• Labor market participation• Long-term unemployment• Wage-pressure in high-skill
occupation
Upward pressure from:• Wage pressure in high-skill
industries• Vacancy rates• Overall wage pressure
Breakdown of seven indicator scores
6.8
4.7
4.1
10.0
7.8
9.9
5.0
0Indicators 2.5 5 7.5 10
Wage pressure in high-skill occupations
Educationflexibility
Labor market participation
Labor market flexibility
Talent mismatch
Overall wage pressure
Wage pressure in high-skill industries
Overall score
6.3in 20146.9 0 2.5 5 7.5 10
As the economy continues to expand, the labor market is showing more signs of pressure. Overall wage pressures are building, particularly evident in specific industries, including construction. That vacancy rate remains high given where the US is in the economic cycle, pointing to skill gaps. The participation rate remains very low, despite some improvement.
© Copyright Hays plc 2015. HAYS, the Corporate and Sector H devices, Recruiting experts worldwide, the HAYS Recruiting experts worldwide logo and Powering the World of Work are trade marks of Hays plc. The Corporate and Sector H devices are original designs protected by registration in many countries. All rights are reserved. The reproduction or transmission of all or part of this work, whether by photocopying or storing in any medium by electronic means or otherwise, without the written permission of the owner, is restricted. The commission of any unauthorised act in relation to the work may result in civil and/or criminal action. The analysis on which the Hays Global Skills Index was based utilised data as of Q2 2015. Developments subsequent to this date are not reflected in the 2015 findings.
THE HAYS GLOBAL SKILLS INDEX 2015
UNITED STATESCountry profileThe sharp decline in the price of oil since last summer has had two important effects on the US economy.
On the upside it created a windfall for households that provided a new momentum to consumer spending and job creation, while also putting the brakes on investment in the oil and gas sector.
Overall the economy exceeded expectations during the second half of 2014. The economy grew by 2.4%, almost a full percentage point faster than expected last summer, while unemployment fell to 6.2%, beating expectations by almost half a percent.
With the labor market becoming more pressured, the overall Index score is 6.9, up 0.6 on the year.
Background economic data2014 2015†
Population 318.7m 321.4m
GDP
GDP (Billion USD*) 17,522 17,921
GDP growth 2.4% 2.3%
GDP/head (USD*) 55,000 55,800
Unemployment
Unemployment rate 6.2% 5.3%
Long-term unemployment rate 1.6% 1.4%
*2015 prices †Average forecast figures for 2015
View from the groundDespite some continued choppiness in the US, economic growth, hiring in the technology, life sciences and construction and property sectors remain strong and job creation picked up considerably in the first half of 2015 in all of these markets. The flex market is very competitive at present in the IT sector – employers are continuing to push forward on IT projects which are creating high demand for developers, especially those with experience in Java, mobile and security. This is creating wage pressure as companies battle from the limited pool of talent, especially for employers that aren’t willing to be flexible on location.
Dan Rodriguez, Managing Director, Hays USA
Key findingAs the economy continues to expand the labor market is showing more signs of pressure. Overall wage pressures are building with pressures particularly evident in some industries. That vacancy rate remains high given where the US is in the economic cycle, pointing to skill gaps. The participation rate remains very low, despite some improvement.
Downward pressure from:• Labor market participation• Long-term unemployment• Wage-pressure in high-skill
occupation
Upward pressure from:• Wage pressure in high-skill
industries• Vacancy rates• Overall wage pressure
Breakdown of seven indicator scores
6.8
4.7
4.1
10.0
7.8
9.9
5.0
0Indicators 2.5 5 7.5 10
Wage pressure in high-skill occupations
Educationflexibility
Labor market participation
Labor market flexibility
Talent mismatch
Overall wage pressure
Wage pressure in high-skill industries
Overall score
6.3in 20146.9 0 2.5 5 7.5 10

10 | Construction Recruitment & Retention Guide
MARKET CONFIDENCE
LOCAL MARKET UPDATE
“The cost of living, lower taxes
and good employment opportunities are attracting
people to Texas. This population growth is driving expansion and redevelopment projects in multi-family and high-rise residential construction, education and healthcare, increasing demand for estimators and superintendents, specifically with five to 10 years’ experience.”
Jason Harpum, Regional Manager
Texas
“Multi-million dollar projects are being carried out at major theme parks
and we are seeing renovations in hospitality and leisure. Many hotels and restaurants are seeing
the first upgrade projects since 2009. Furthermore, to deal with the 62 million visitors traveling here each year, the Greater Orlando Aviation Authority is carrying out infrastructure upgrades and extensions at Orlando International Airport, including a new terminal and transport services.”
Shenlee Walker, Senior Manager
Florida
“High-rise/multi-family residential
developers continue to push hard, with a significant number of ‘Supertall’s’ in construction
or design phase, plus a very strong market in the outer boroughs. This creates on-going pressure on
securing management talent to deliver these projects, exacerbated by the potential changes in the 421-a abatement scheme and employers demand for specific NYC experience.”
Alex PowellRegional Director
New York
Business activity is high across the construction industry, however the key regions with significant hiring plans are New York, Orlando and Texas. This is an overview of what’s happening in these markets.
Construction Recruitment & Retention Guide | 11
MARKET CONFIDENCE
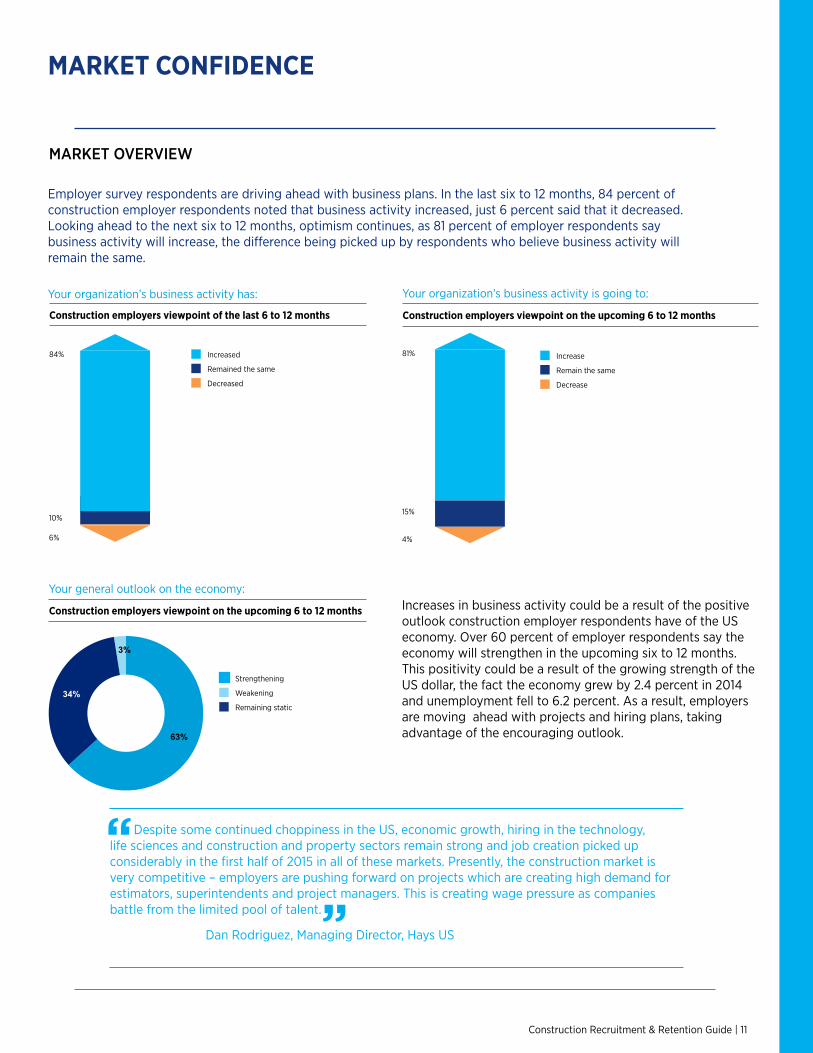
Employer survey respondents are driving ahead with business plans. In the last six to 12 months, 84 percent of construction employer respondents noted that business activity increased, just 6 percent said that it decreased. Looking ahead to the next six to 12 months, optimism continues, as 81 percent of employer respondents say business activity will increase, the difference being picked up by respondents who believe business activity will remain the same.
Construction employers viewpoint of the last 6 to 12 months
84%
6%
10%
Increased
Remained the same
Decreased
Construction employers viewpoint on the upcoming 6 to 12 months
81%
4%
15%
Your organization’s business activity is going to:
Increase
Remain the same
Decrease
Construction employers viewpoint on the upcoming 6 to 12 months
Your general outlook on the economy:
Strengthening
Weakening
Remaining static
Increases in business activity could be a result of the positive outlook construction employer respondents have of the US economy. Over 60 percent of employer respondents say the economy will strengthen in the upcoming six to 12 months. This positivity could be a result of the growing strength of the US dollar, the fact the economy grew by 2.4 percent in 2014 and unemployment fell to 6.2 percent. As a result, employers are moving ahead with projects and hiring plans, taking advantage of the encouraging outlook.
MARKET OVERVIEW
Your organization’s business activity has:
Despite some continued choppiness in the US, economic growth, hiring in the technology, life sciences and construction and property sectors remain strong and job creation picked up considerably in the first half of 2015 in all of these markets. Presently, the construction market is very competitive – employers are pushing forward on projects which are creating high demand for estimators, superintendents and project managers. This is creating wage pressure as companies battle from the limited pool of talent. Dan Rodriguez, Managing Director, Hays US
“
”
63%
34%
3%
12 | Construction Recruitment & Retention Guide
STAFFING INSIGHTS
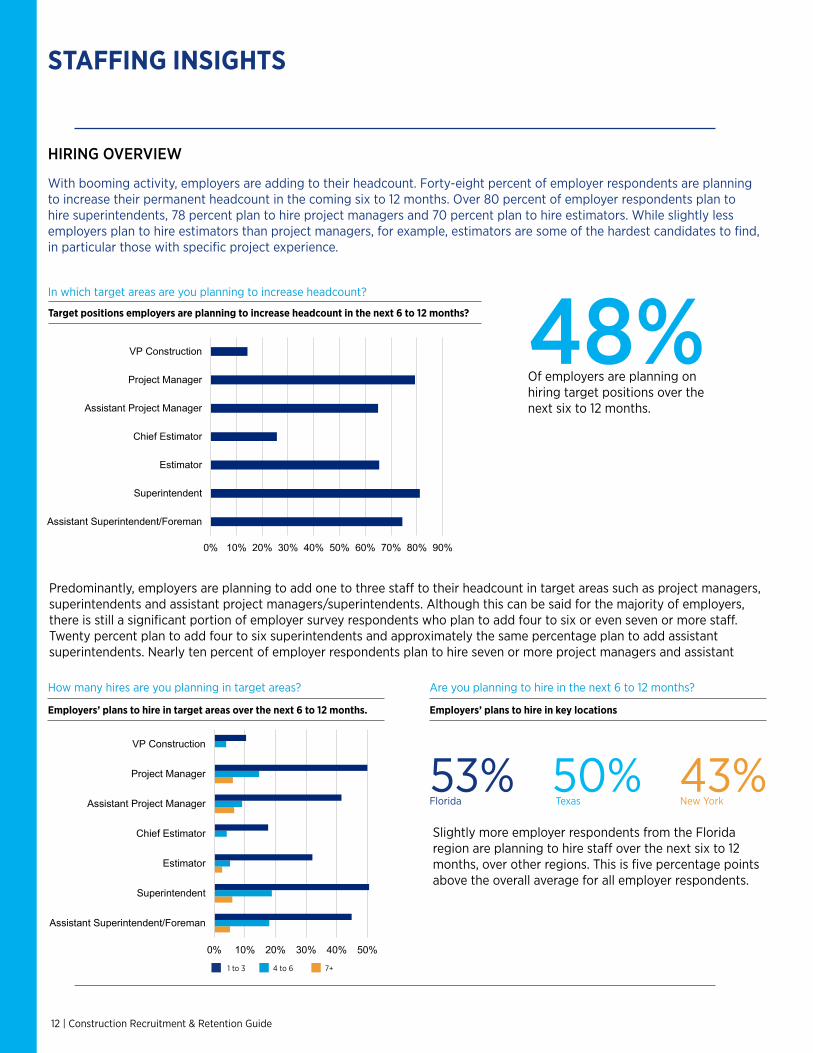
With booming activity, employers are adding to their headcount. Forty-eight percent of employer respondents are planning to increase their permanent headcount in the coming six to 12 months. Over 80 percent of employer respondents plan to hire superintendents, 78 percent plan to hire project managers and 70 percent plan to hire estimators. While slightly less employers plan to hire estimators than project managers, for example, estimators are some of the hardest candidates to find, in particular those with specific project experience.
Target positions employers are planning to increase headcount in the next 6 to 12 months?
In which target areas are you planning to increase headcount?
How many hires are you planning in target areas?
Employers’ plans to hire in target areas over the next 6 to 12 months.
HIRING OVERVIEW
48%Of employers are planning on hiring target positions over the next six to 12 months.
0% 10% 20% 30% 40% 50% 60% 70% 80% 90%
Assistant Superintendent/Foreman
Superintendent
Estimator
Chief Estimator
Assistant Project Manager
Project Manager
VP Construction
planning on hiring on these areas
0% 10% 20% 30% 40% 50% 60%
Assistant Superintendent/Foreman
Superintendent
Estimator
Chief Estimator
Assistant Project Manager
Project Manager
VP Construction
How many hires are you planning in target areas? Employers plans to hire in target areas over the nxt 6
to 12 months.
1 to 3 4 to 6 7+ 1 to 3 4 to 6 7+
53% 50% 43% Florida Texas New York
Are you planning to hire in the next 6 to 12 months?
Employers’ plans to hire in key locations
Slightly more employer respondents from the Florida region are planning to hire staff over the next six to 12 months, over other regions. This is five percentage points above the overall average for all employer respondents.
Predominantly, employers are planning to add one to three staff to their headcount in target areas such as project managers, superintendents and assistant project managers/superintendents. Although this can be said for the majority of employers, there is still a significant portion of employer survey respondents who plan to add four to six or even seven or more staff. Twenty percent plan to add four to six superintendents and approximately the same percentage plan to add assistant superintendents. Nearly ten percent of employer respondents plan to hire seven or more project managers and assistant
Construction Recruitment & Retention Guide | 13
STAFFING INSIGHTS
0%
5%
10%
15%
20%
25%
30%
Immediately <3 months 3-6 months 6 -12 months >12 months
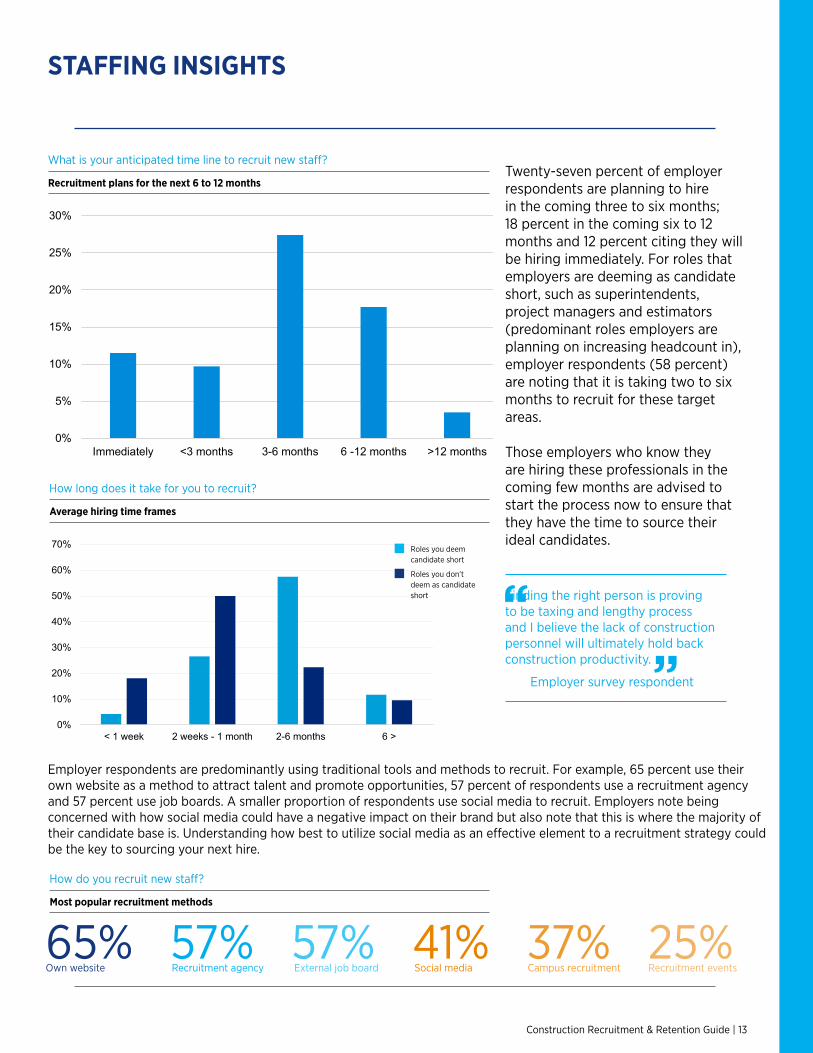
If you plan to hire, what is your anticipated timeline to recruit new staff for the upcoming year?
Recruitment plans for the next 6 to 12 months
What is your anticipated time line to recruit new staff?Twenty-seven percent of employer respondents are planning to hire in the coming three to six months; 18 percent in the coming six to 12 months and 12 percent citing they will be hiring immediately. For roles that employers are deeming as candidate short, such as superintendents, project managers and estimators (predominant roles employers are planning on increasing headcount in), employer respondents (58 percent) are noting that it is taking two to six months to recruit for these target areas.
Those employers who know they are hiring these professionals in the coming few months are advised to start the process now to ensure that they have the time to source their ideal candidates.
0%
10%
20%
30%
40%
50%
60%
70%
< 1 week 2 weeks - 1 month 2-6 months 6 >
How long does it take you to fill your open positions?
Roles you deem candidate short Roles you don’t deem as candidate short
Average hiring time frames
How long does it take for you to recruit?
Roles you deem candidate short
Roles you don’t deem as candidate short
65% 57% 57% 41% 37% 25%Own website Recruitment agency External job board Social media Campus recruitment Recruitment events
Most popular recruitment methods
How do you recruit new staff?
Employer respondents are predominantly using traditional tools and methods to recruit. For example, 65 percent use their own website as a method to attract talent and promote opportunities, 57 percent of respondents use a recruitment agency and 57 percent use job boards. A smaller proportion of respondents use social media to recruit. Employers note being concerned with how social media could have a negative impact on their brand but also note that this is where the majority of their candidate base is. Understanding how best to utilize social media as an effective element to a recruitment strategy could be the key to sourcing your next hire.
Finding the right person is proving to be taxing and lengthy process and I believe the lack of construction personnel will ultimately hold back construction productivity.
Employer survey respondent
“”

14 | Construction Recruitment & Retention Guide
STAFFING INSIGHTS
Of the survey respondents, 35 percent say that it is more difficult to fill vacancies than three to five years ago, 24 percent say it’s more difficult than last year. When asked what was their main challenge hindering their internal recruitment strategy, over 80 percent of respondents said it was due to the lack of available qualified candidates in the market. Employers are being very specific in their hiring, looking for candidates that possess an exact match in terms of experience which is proving to be difficult to source.
The second biggest reason is the low number of new candidates entering the industry, fueling the already short market. An area of lesser concern is salary levels. As noted in the compensation section of this report, employers are not adverse to increasing salary levels to attract top talent.
RECRUITING CHALLENGES
Main challenges employers say are hindering their recruitment strategies
What are the main recruitment challenges that you are currently facing?
0% 20% 40% 60% 80%
We don't have recruitment challenges
Company reputation
Competition from other regions
Competition from other sectors
Lack of internal resources
Salary levels
Number of new candidates entering the industry
Quality of available candidates
13%
14%
12%
13%
26%
21%
19%
20%
37%
33%
34%
39%
17%
21%
28%
16%
7%
11%
7%
12%
0% 20% 40% 60% 80% 100%
Last year
Last 2-3 years
Last 3-5 years
Over 5 years ago
It is more difficult to fill vacancies today, than compared to:
Strongly Disagree Disagree Undecided Agree Strongly Agree
How difficult it is to hire now compared to previously
“It is more difficult to fill vacancies today, than compared to...”
In addition to salary being a key motivator in attracting and retaining staff, career progression tops the list as the number one reason for an employee to leave an organization.
Being able to demonstrate career progression opportunities within the organization as well as communicating potential new projects to existing staff is an attractive selling feature and retention aid.
We have found that the market is very competitive right now and finding quality individuals is hard and expensive.
Employer survey respondent
“”
Construction Recruitment & Retention Guide | 15
STAFFING INSIGHTS
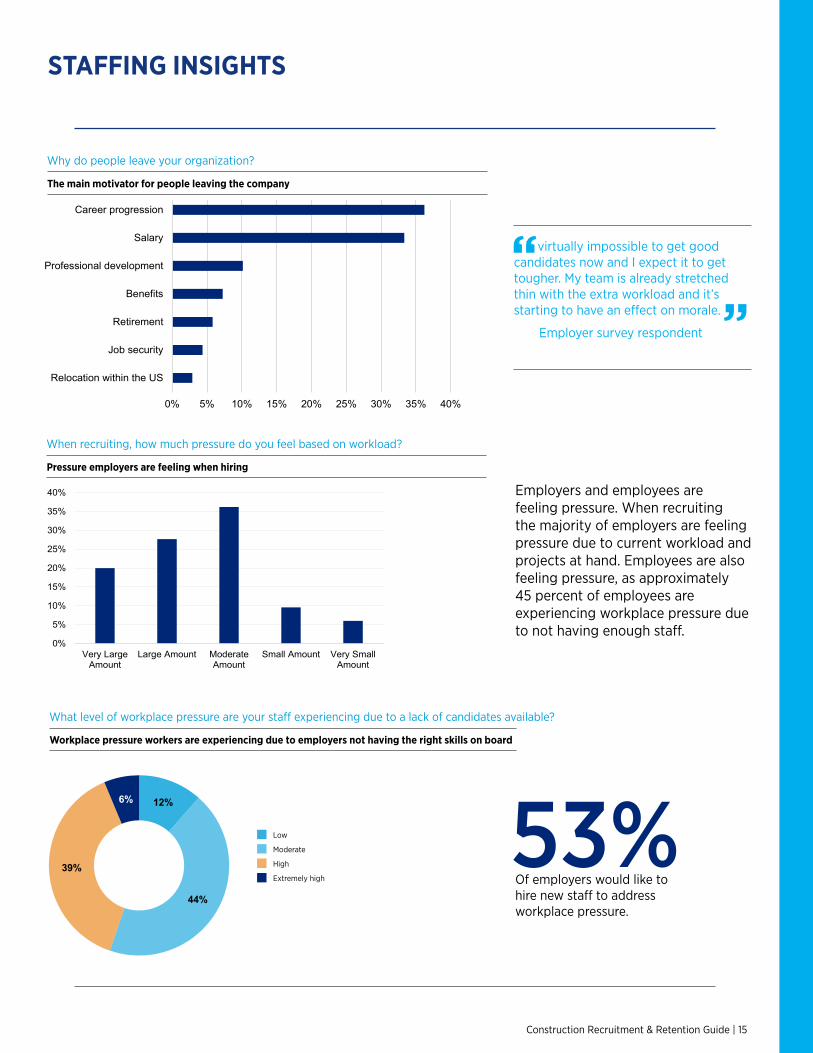
Pressure employers are feeling when hiring
When recruiting, how much pressure do you feel based on workload?
0%
5%
10%
15%
20%
25%
30%
35%
40%
Very LargeAmount
Large Amount ModerateAmount
Small Amount Very SmallAmount
When recuiting, how much pressure do you feel based on workload, management, and deadlines?
Workplace pressure workers are experiencing due to employers not having the right skills on board
What level of workplace pressure are your staff experiencing due to a lack of candidates available?
Low
Moderate
High
Extremely high
53%Of employers would like to hire new staff to address workplace pressure.
The main motivator for people leaving the company
Why do people leave your organization?
0% 5% 10% 15% 20% 25% 30% 35% 40%
Relocation within the US
Job security
Retirement
Benefits
Professional development
Salary
Career progression
Main reason for leaving
Employers and employees are feeling pressure. When recruiting the majority of employers are feeling pressure due to current workload and projects at hand. Employees are also feeling pressure, as approximately 45 percent of employees are experiencing workplace pressure due to not having enough staff.
It is virtually impossible to get good candidates now and I expect it to get tougher. My team is already stretched thin with the extra workload and it’s starting to have an effect on morale.
Employer survey respondent
“”
12%
44%
39%
6%
What level of workplace pressure does your staff experience due to the lack of candidates/skills available to assist with the work at
hand?
Low
Moderate
High
Extremely High
STAFFING INSIGHTSSKILLS SHORTAGE
16 | Construction Recruitment & Retention Guide
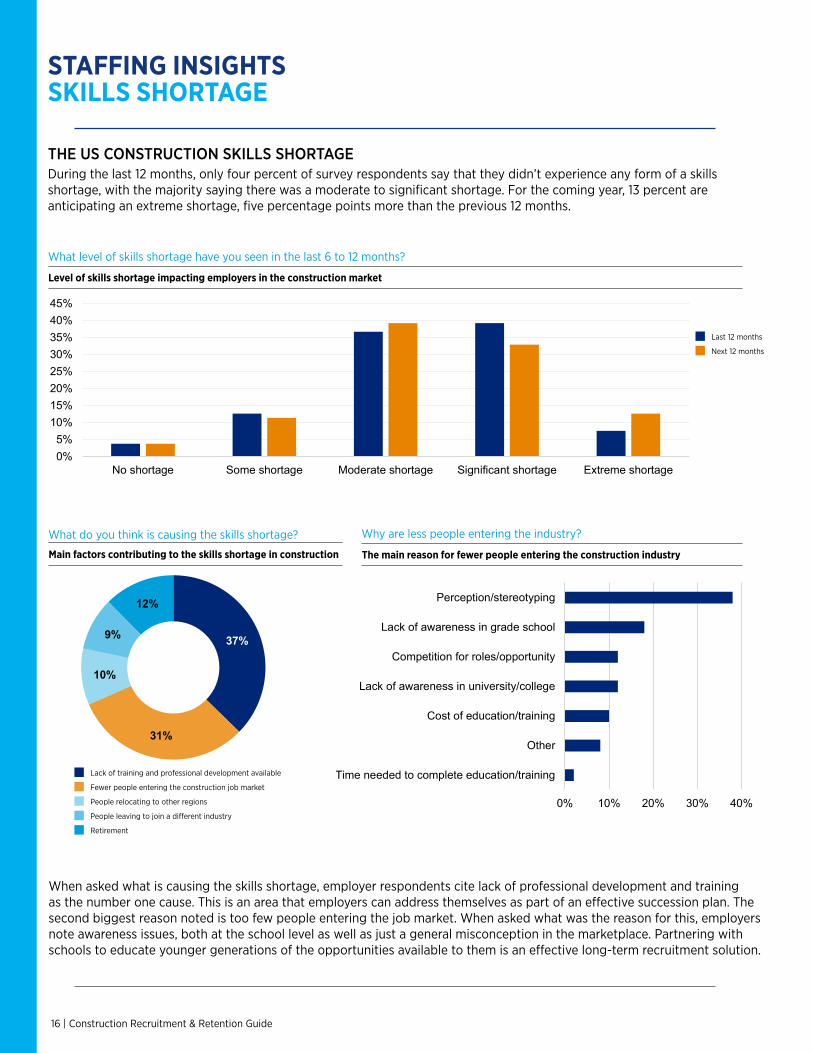
Level of skills shortage impacting employers in the construction market
What level of skills shortage have you seen in the last 6 to 12 months?
37%
31%
10%
9%
12%
What do you think the main reason is for the skills shortage in your industry?
Lack of training andprofessional developmentavailable
Fewer people entering theconstruction job market
People relocating to otherregions
People leaving to join adifferent industry
Retirement
Last 12 months
Next 12 months
Main factors contributing to the skills shortage in construction
What do you think is causing the skills shortage?
Lack of training and professional development available
Fewer people entering the construction job market
People relocating to other regions
People leaving to join a different industry
Retirement
The main reason for fewer people entering the construction industry
Why are less people entering the industry?
When asked what is causing the skills shortage, employer respondents cite lack of professional development and training as the number one cause. This is an area that employers can address themselves as part of an effective succession plan. The second biggest reason noted is too few people entering the job market. When asked what was the reason for this, employers note awareness issues, both at the school level as well as just a general misconception in the marketplace. Partnering with schools to educate younger generations of the opportunities available to them is an effective long-term recruitment solution.
During the last 12 months, only four percent of survey respondents say that they didn’t experience any form of a skills shortage, with the majority saying there was a moderate to significant shortage. For the coming year, 13 percent are anticipating an extreme shortage, five percentage points more than the previous 12 months.
THE US CONSTRUCTION SKILLS SHORTAGE
0%5%
10%15%20%25%30%35%40%45%
No shortage Some shortage Moderate shortage Significant shortage Extreme shortage
Chart Title
last 12 months next 12months
0% 10% 20% 30% 40%
Time needed to complete education/training
Other
Cost of education/training
Lack of awareness in university/college
Competition for roles/opportunity
Lack of awareness in grade school
Perception/stereotyping
Why are less people entering the industry?
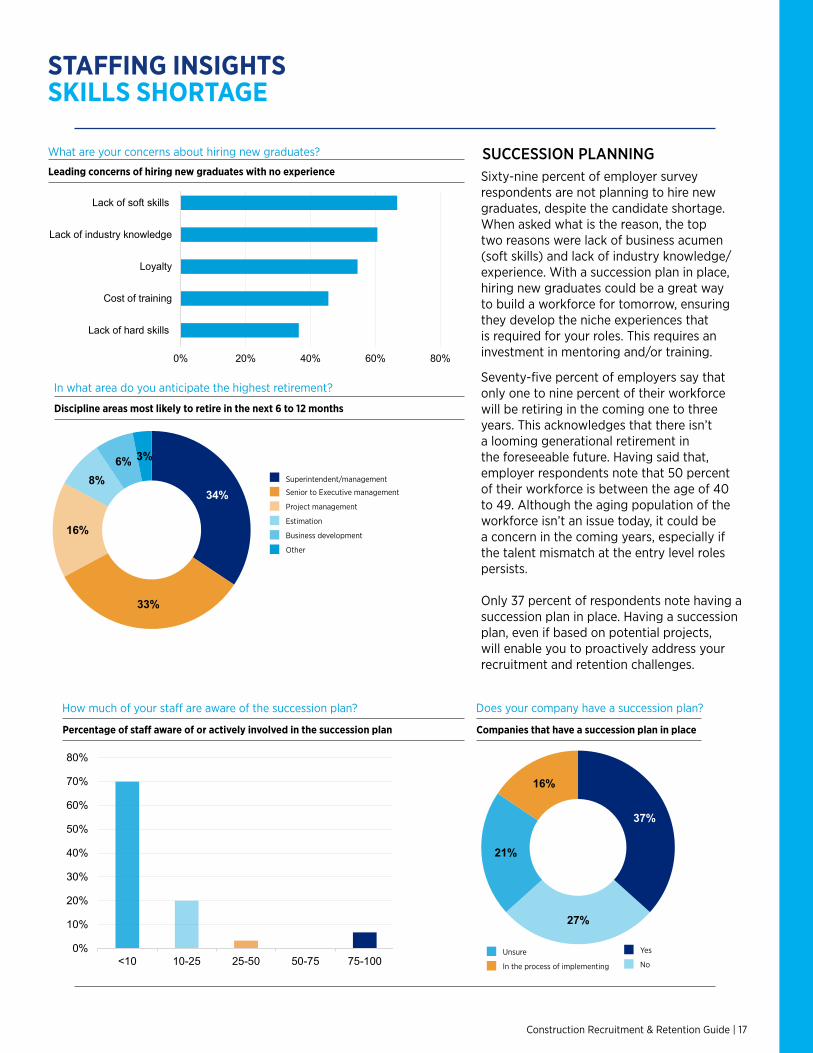
Leading concerns of hiring new graduates with no experience
What are your concerns about hiring new graduates?
37%
27%
21%
16%
Does your company have a succession plan?
Yes No Unsure In the process of implementing
Companies that have a succession plan in place
Does your company have a succession plan?
Unsure
In the process of implementing
0%
10%
20%
30%
40%
50%
60%
70%
80%
<10 10-25 25-50 50-75 75-100
What percentage of your staff are aware of, or actively involved in your succession planning?Percentage of staff aware of or actively involved in the succession plan
How much of your staff are aware of the succession plan?
SUCCESSION PLANNING
0% 20% 40% 60% 80%
Lack of hard skills
Cost of training
Loyalty
Lack of industry knowledge
Lack of soft skills
When it comes to the idea of hiring young workers or new graduates (no experience), what are your concerns?
Discipline areas most likely to retire in the next 6 to 12 months
In what area do you anticipate the highest retirement?
34%
33%
16%
8%6% 3%
Chart Title
Superintendent/Management
Senior to ExecutiveManagement
Project Management
Estimation
Business Development
Other
Superintendent/management
Senior to Executive management
Project management
Estimation
Business development
Other
STAFFING INSIGHTSSKILLS SHORTAGE
Sixty-nine percent of employer survey respondents are not planning to hire new graduates, despite the candidate shortage. When asked what is the reason, the top two reasons were lack of business acumen (soft skills) and lack of industry knowledge/experience. With a succession plan in place, hiring new graduates could be a great way to build a workforce for tomorrow, ensuring they develop the niche experiences that is required for your roles. This requires an investment in mentoring and/or training.
Seventy-five percent of employers say that only one to nine percent of their workforce will be retiring in the coming one to three years. This acknowledges that there isn’t a looming generational retirement in the foreseeable future. Having said that, employer respondents note that 50 percent of their workforce is between the age of 40 to 49. Although the aging population of the workforce isn’t an issue today, it could be a concern in the coming years, especially if the talent mismatch at the entry level roles persists.
Only 37 percent of respondents note having a succession plan in place. Having a succession plan, even if based on potential projects, will enable you to proactively address your recruitment and retention challenges.
Yes
No
Construction Recruitment & Retention Guide | 17
18 | Construction Recruitment & Retention Guide
13%
39%
44%
44%
51%
68%
Nothing
Promoting career progression
Offering competitive benefit packages
Offering training and professionaldevelopment
Promoting company culture
Offering competitive salary packages
0% 10% 20% 30% 40% 50% 60% 70% 80%
How are you making your company attractive to recruit top talent?Employer’s attracting strategies
How are you making your company attractive to recruit top talent?
Employers changing compensation plans to attract talent
Have you altered your compensation plans to attract top talent?
Yes
I plan to in the next 12 months
No but would consider it
No due to restricting factors (e.g. budget, unionized environment, etc.)
28%Of employers say their current salary is not competitive with the market average.
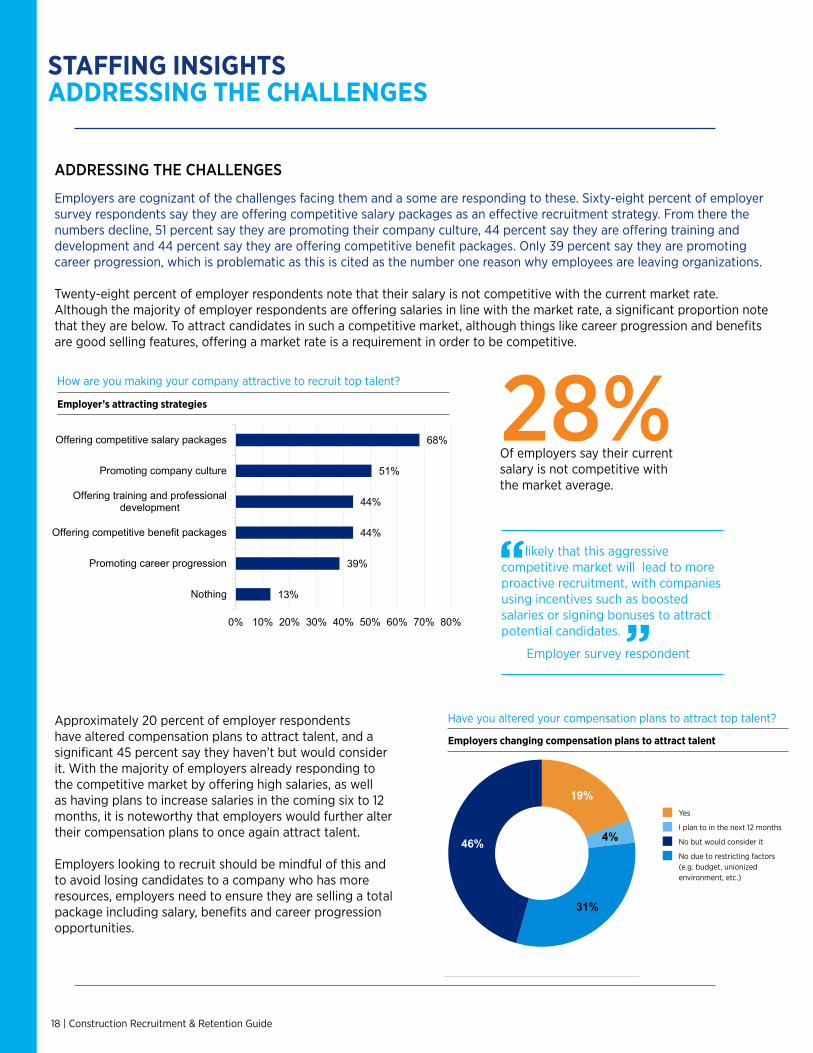
ADDRESSING THE CHALLENGES
Employers are cognizant of the challenges facing them and a some are responding to these. Sixty-eight percent of employer survey respondents say they are offering competitive salary packages as an effective recruitment strategy. From there the numbers decline, 51 percent say they are promoting their company culture, 44 percent say they are offering training and development and 44 percent say they are offering competitive benefit packages. Only 39 percent say they are promoting career progression, which is problematic as this is cited as the number one reason why employees are leaving organizations.
Twenty-eight percent of employer respondents note that their salary is not competitive with the current market rate. Although the majority of employer respondents are offering salaries in line with the market rate, a significant proportion note that they are below. To attract candidates in such a competitive market, although things like career progression and benefits are good selling features, offering a market rate is a requirement in order to be competitive.
It is likely that this aggressive competitive market will lead to more proactive recruitment, with companies using incentives such as boosted salaries or signing bonuses to attract potential candidates.
Employer survey respondent
“”
Approximately 20 percent of employer respondents have altered compensation plans to attract talent, and a significant 45 percent say they haven’t but would consider it. With the majority of employers already responding to the competitive market by offering high salaries, as well as having plans to increase salaries in the coming six to 12 months, it is noteworthy that employers would further alter their compensation plans to once again attract talent.
Employers looking to recruit should be mindful of this and to avoid losing candidates to a company who has more resources, employers need to ensure they are selling a total package including salary, benefits and career progression opportunities.
STAFFING INSIGHTSADDRESSING THE CHALLENGES
19%
4%
31%
46%
Have you altered your compensation plans to attract top talent?
Yes
I plan to in the next 12months
No due to restricting factors(eg. budget, unionizedenvironment, etc.)
No but would consider it

Construction Recruitment & Retention Guide | 19
20 | Construction Recruitment & Retention Guide
COMPENSATION INSIGHTS
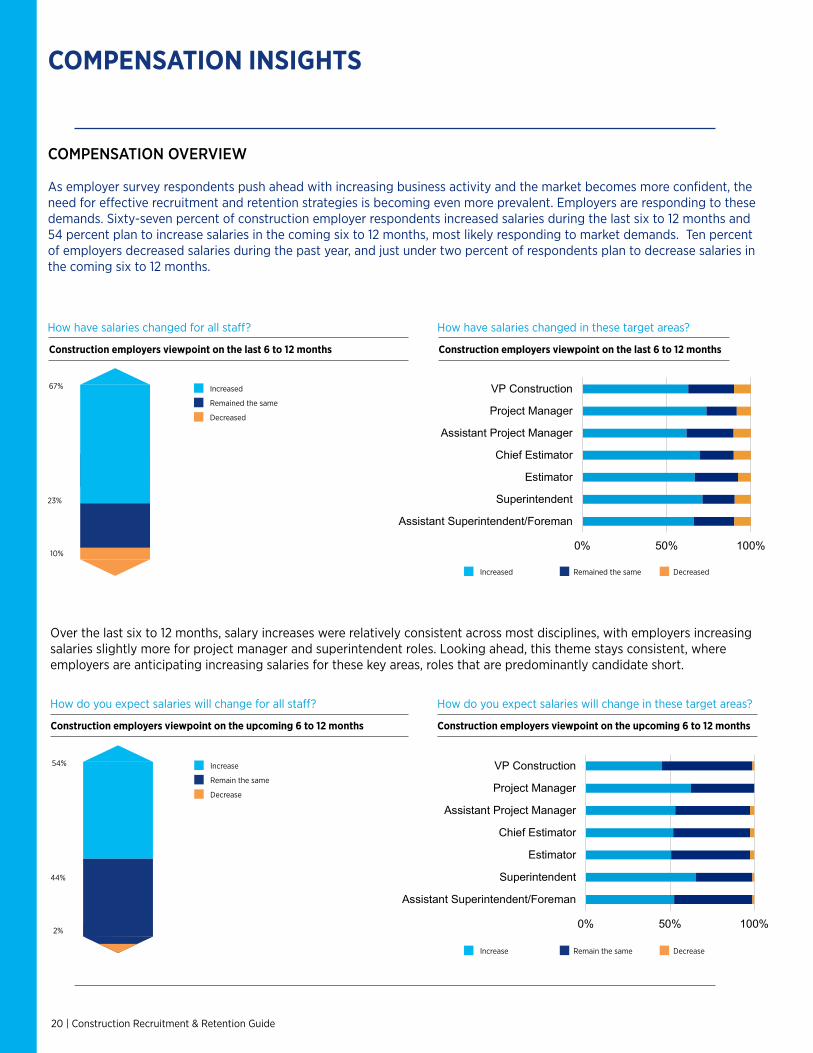
As employer survey respondents push ahead with increasing business activity and the market becomes more confident, the need for effective recruitment and retention strategies is becoming even more prevalent. Employers are responding to these demands. Sixty-seven percent of construction employer respondents increased salaries during the last six to 12 months and 54 percent plan to increase salaries in the coming six to 12 months, most likely responding to market demands. Ten percent of employers decreased salaries during the past year, and just under two percent of respondents plan to decrease salaries in the coming six to 12 months.
Construction employers viewpoint on the last 6 to 12 months
67%
10%
23%
Construction employers viewpoint on the upcoming 6 to 12 months
How do you expect salaries will change for all staff?
COMPENSATION OVERVIEW
How have salaries changed for all staff?
Over the last six to 12 months, salary increases were relatively consistent across most disciplines, with employers increasing salaries slightly more for project manager and superintendent roles. Looking ahead, this theme stays consistent, where employers are anticipating increasing salaries for these key areas, roles that are predominantly candidate short.
Increased
Remained the same
Decreased
54%
2%
44%
Increase
Remain the same
Decrease
0% 50% 100%
Assistant Superintendent/Foreman
Superintendent
Estimator
Chief Estimator
Assistant Project Manager
Project Manager
VP Construction
Increased Remained the same Decreased Increased Remained the same Decreased
Construction employers viewpoint on the last 6 to 12 months
How have salaries changed in these target areas?
Increase Remain the same Decrease
Construction employers viewpoint on the upcoming 6 to 12 months
How do you expect salaries will change in these target areas?
0% 50% 100%
Assistant Superintendent/Foreman
Superintendent
Estimator
Chief Estimator
Assistant Project Manager
Project Manager
VP Construction
Increase Stay the same Decrease
Construction Recruitment & Retention Guide | 21
COMPENSATION INSIGHTS
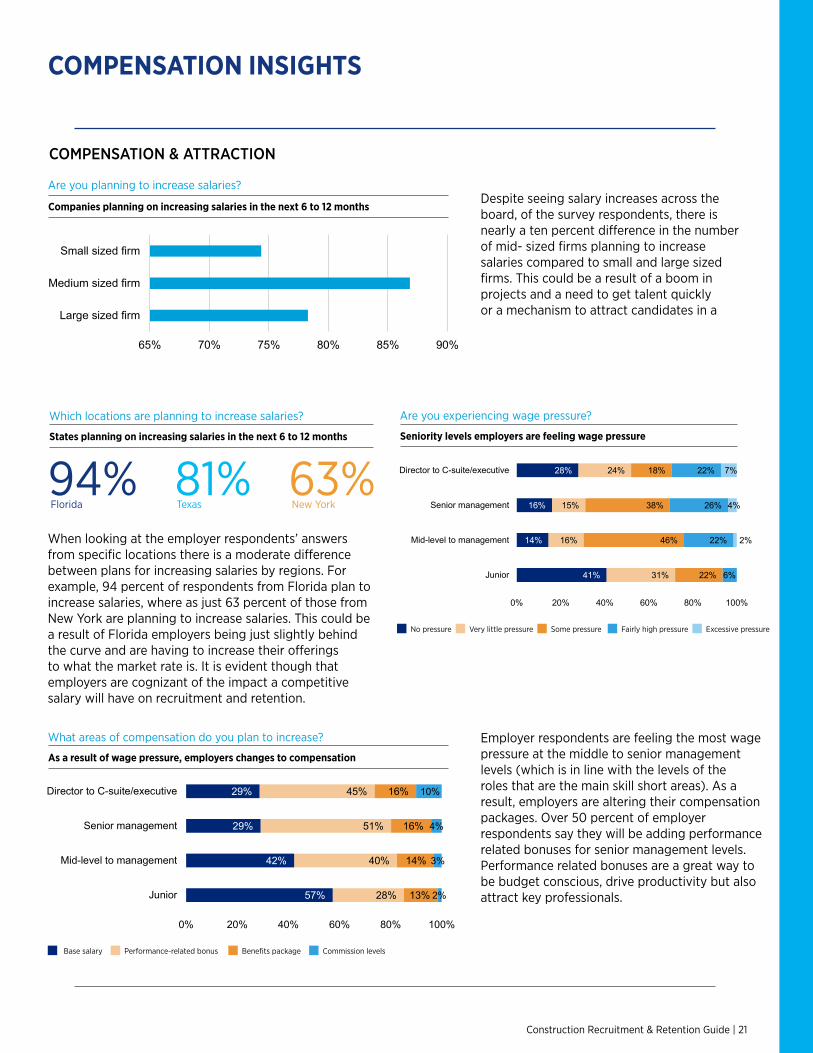
Companies planning on increasing salaries in the next 6 to 12 months
Are you planning to increase salaries?
COMPENSATION & ATTRACTION
65% 70% 75% 80% 85% 90%
Large sized firm
Medium sized firm
Small sized firm
% employers planning on increasing salaraies in next 12 months.
Despite seeing salary increases across the board, of the survey respondents, there is nearly a ten percent difference in the number of mid- sized firms planning to increase salaries compared to small and large sized firms. This could be a result of a boom in projects and a need to get talent quickly or a mechanism to attract candidates in a
94% 81% 63% Florida Texas New York
States planning on increasing salaries in the next 6 to 12 months
Which locations are planning to increase salaries?
41%
14%
16%
28%
31%
16%
15%
24%
22%
46%
38%
18%
6%
22%
26%
22%
2%
4%
7%
0% 20% 40% 60% 80% 100%
Junior
Mid-level to management
Senior management
Director to C-suite/executive
wage pressure your company is experiencing
No pressure Very little pressure Some pressure
Fairly high pressure Excessive pressure
Seniority levels employers are feeling wage pressure
Are you experiencing wage pressure?
As a result of wage pressure, employers changes to compensation
What areas of compensation do you plan to increase?
When looking at the employer respondents’ answers from specific locations there is a moderate difference between plans for increasing salaries by regions. For example, 94 percent of respondents from Florida plan to increase salaries, where as just 63 percent of those from New York are planning to increase salaries. This could be a result of Florida employers being just slightly behind the curve and are having to increase their offerings to what the market rate is. It is evident though that employers are cognizant of the impact a competitive salary will have on recruitment and retention.
Employer respondents are feeling the most wage pressure at the middle to senior management levels (which is in line with the levels of the roles that are the main skill short areas). As a result, employers are altering their compensation packages. Over 50 percent of employer respondents say they will be adding performance related bonuses for senior management levels. Performance related bonuses are a great way to be budget conscious, drive productivity but also attract key professionals.
Base salary Performance-related bonus Benefits package Commission levels
No pressure Very little pressure Some pressure Fairly high pressure Excessive pressure
57%
42%
29%
29%
28%
40%
51%
45%
13%
14%
16%
16%
2%
3%
4%
10%
0% 20% 40% 60% 80% 100%
Junior
Mid-level to management
Senior management
Director to C-suite/executive
As a result of this wage pressure, what areas of your compensation package do you plan to increase (if any) in
order to more effectively attract the right candidate?
Base salary Performance-related bonus
Benefits package Commission levels
22 | Construction Recruitment & Retention Guide
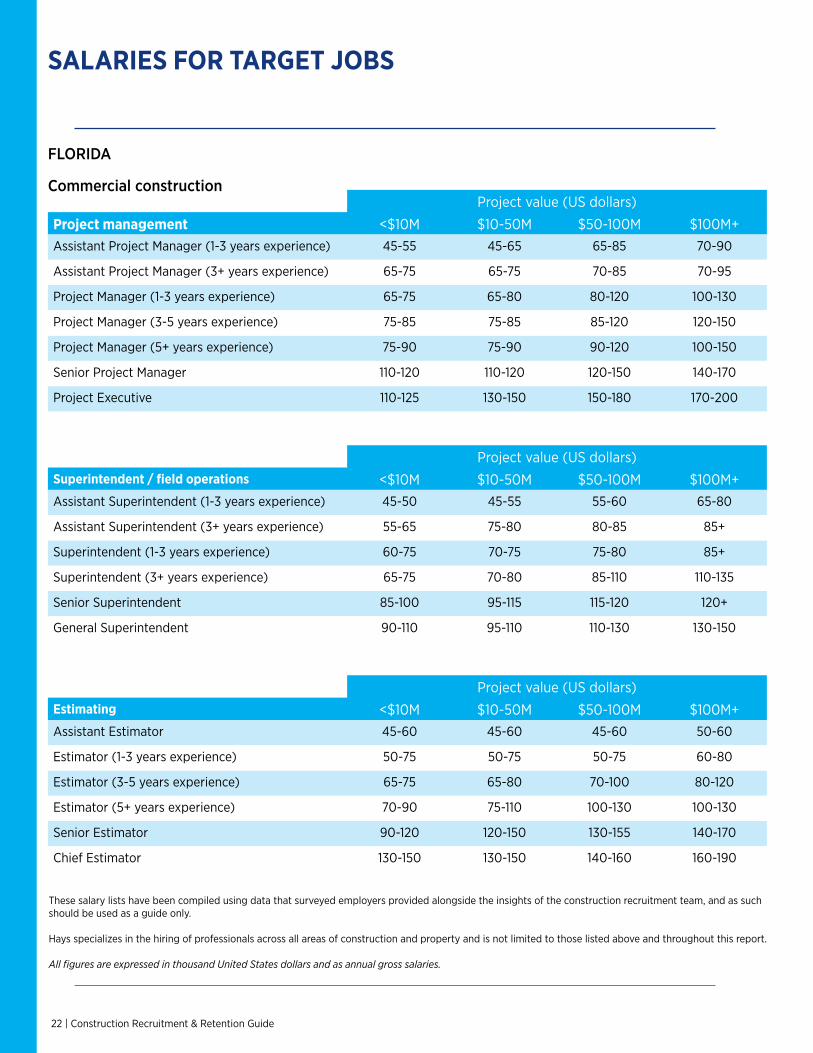
SALARIES FOR TARGET JOBS
Project value (US dollars)
Project management <$10M $10-50M $50-100M $100M+Assistant Project Manager (1-3 years experience) 45-55 45-65 65-85 70-90
Assistant Project Manager (3+ years experience) 65-75 65-75 70-85 70-95
Project Manager (1-3 years experience) 65-75 65-80 80-120 100-130
Project Manager (3-5 years experience) 75-85 75-85 85-120 120-150
Project Manager (5+ years experience) 75-90 75-90 90-120 100-150
Senior Project Manager 110-120 110-120 120-150 140-170
Project Executive 110-125 130-150 150-180 170-200
These salary lists have been compiled using data that surveyed employers provided alongside the insights of the construction recruitment team, and as such should be used as a guide only.
Hays specializes in the hiring of professionals across all areas of construction and property and is not limited to those listed above and throughout this report.
All figures are expressed in thousand United States dollars and as annual gross salaries.
Project value (US dollars)Superintendent / field operations <$10M $10-50M $50-100M $100M+Assistant Superintendent (1-3 years experience) 45-50 45-55 55-60 65-80
Assistant Superintendent (3+ years experience) 55-65 75-80 80-85 85+
Superintendent (1-3 years experience) 60-75 70-75 75-80 85+
Superintendent (3+ years experience) 65-75 70-80 85-110 110-135
Senior Superintendent 85-100 95-115 115-120 120+
General Superintendent 90-110 95-110 110-130 130-150
Project value (US dollars)Estimating <$10M $10-50M $50-100M $100M+Assistant Estimator 45-60 45-60 45-60 50-60
Estimator (1-3 years experience) 50-75 50-75 50-75 60-80
Estimator (3-5 years experience) 65-75 65-80 70-100 80-120
Estimator (5+ years experience) 70-90 75-110 100-130 100-130
Senior Estimator 90-120 120-150 130-155 140-170
Chief Estimator 130-150 130-150 140-160 160-190
FLORIDA
Commercial construction
Construction Recruitment & Retention Guide | 23
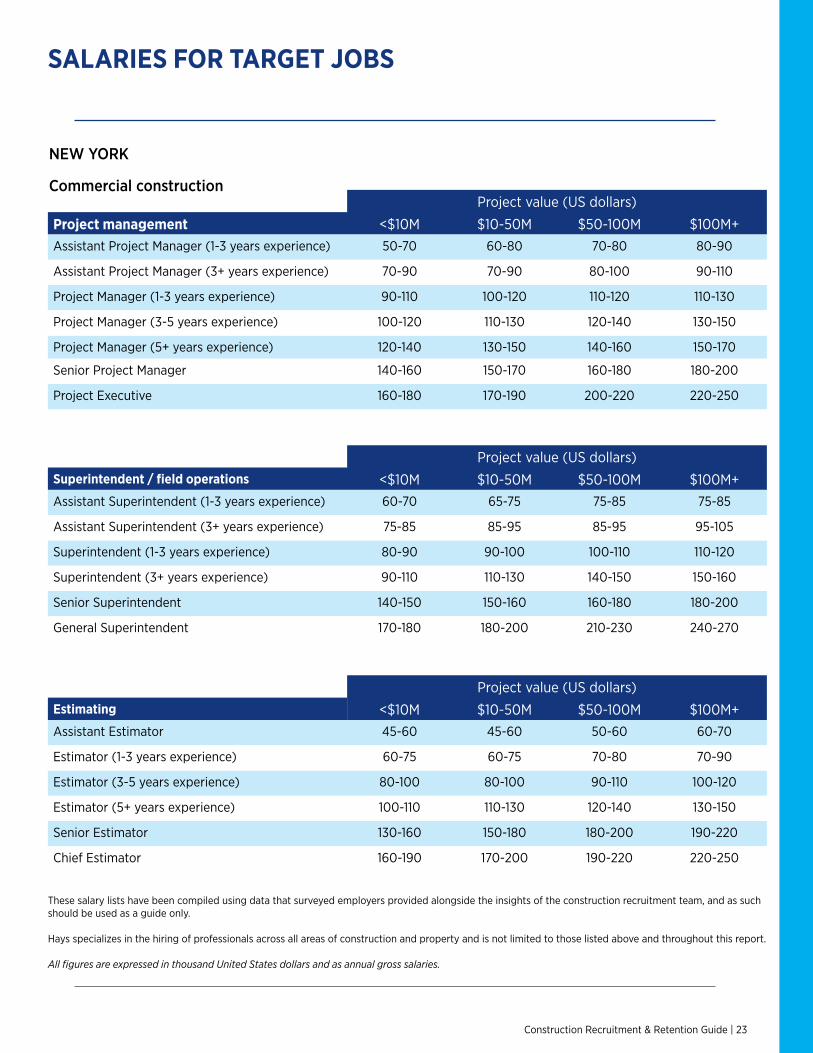
SALARIES FOR TARGET JOBS
Project value (US dollars)
Project management <$10M $10-50M $50-100M $100M+Assistant Project Manager (1-3 years experience) 50-70 60-80 70-80 80-90
Assistant Project Manager (3+ years experience) 70-90 70-90 80-100 90-110
Project Manager (1-3 years experience) 90-110 100-120 110-120 110-130
Project Manager (3-5 years experience) 100-120 110-130 120-140 130-150
Project Manager (5+ years experience) 120-140 130-150 140-160 150-170
Senior Project Manager 140-160 150-170 160-180 180-200
Project Executive 160-180 170-190 200-220 220-250
Project value (US dollars)Superintendent / field operations <$10M $10-50M $50-100M $100M+Assistant Superintendent (1-3 years experience) 60-70 65-75 75-85 75-85
Assistant Superintendent (3+ years experience) 75-85 85-95 85-95 95-105
Superintendent (1-3 years experience) 80-90 90-100 100-110 110-120
Superintendent (3+ years experience) 90-110 110-130 140-150 150-160
Senior Superintendent 140-150 150-160 160-180 180-200
General Superintendent 170-180 180-200 210-230 240-270
Project value (US dollars)Estimating <$10M $10-50M $50-100M $100M+Assistant Estimator 45-60 45-60 50-60 60-70
Estimator (1-3 years experience) 60-75 60-75 70-80 70-90
Estimator (3-5 years experience) 80-100 80-100 90-110 100-120
Estimator (5+ years experience) 100-110 110-130 120-140 130-150
Senior Estimator 130-160 150-180 180-200 190-220
Chief Estimator 160-190 170-200 190-220 220-250
NEW YORK
Commercial construction
These salary lists have been compiled using data that surveyed employers provided alongside the insights of the construction recruitment team, and as such should be used as a guide only.
Hays specializes in the hiring of professionals across all areas of construction and property and is not limited to those listed above and throughout this report.
All figures are expressed in thousand United States dollars and as annual gross salaries.
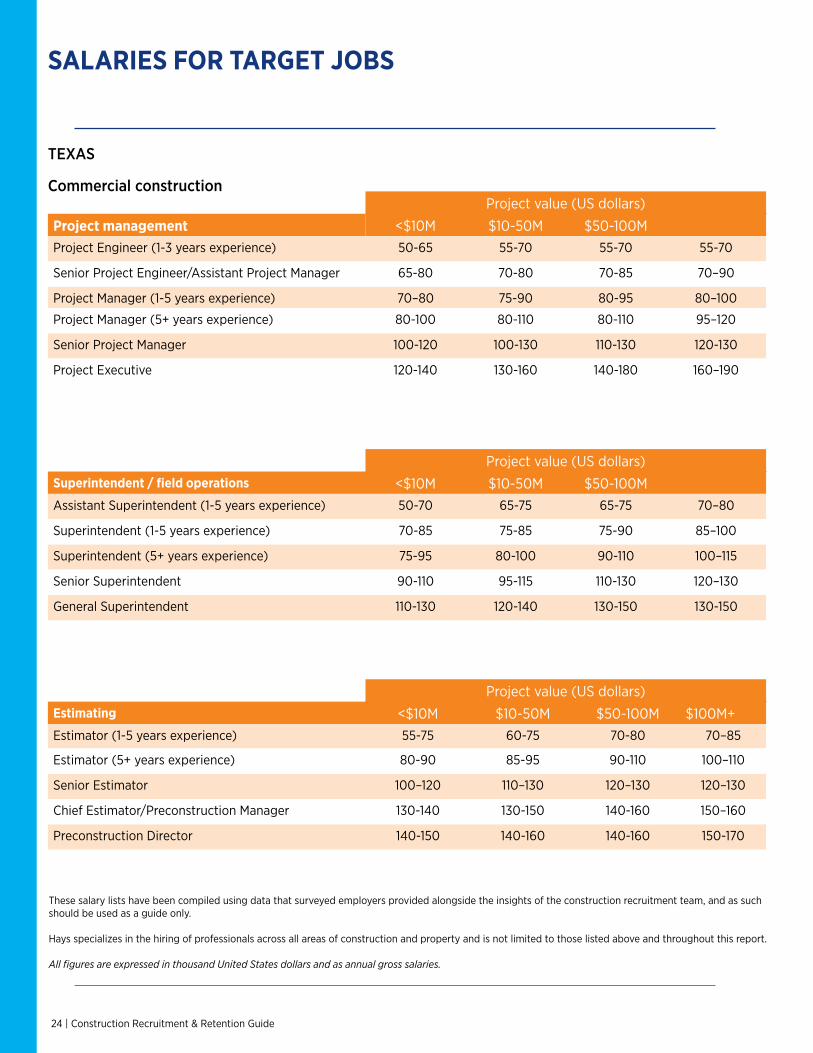
SALARIES FOR TARGET JOBS
W Project value (US dollars)
Project management <$10M $10-50M $50-100MProject Engineer (1-3 years experience) 50-65 55-70 55-70 55-70
Senior Project Engineer/Assistant Project Manager 65-80 70-80 70-85 70–90
Project Manager (1-5 years experience) 70–80 75-90 80-95 80–100
Project Manager (5+ years experience) 80-100 80-110 80-110 95–120
Senior Project Manager 100-120 100-130 110-130 120-130
Project Executive 120-140 130-160 140-180 160–190
Project value (US dollars)Superintendent / field operations <$10M $10-50M $50-100MAssistant Superintendent (1-5 years experience) 50-70 65-75 65-75 70–80
Superintendent (1-5 years experience) 70-85 75-85 75-90 85–100
Superintendent (5+ years experience) 75-95 80-100 90-110 100–115
Senior Superintendent 90-110 95-115 110-130 120–130
General Superintendent 110-130 120-140 130-150 130-150
Project value (US dollars)Estimating <$10M $10-50M $50-100M $100M+Estimator (1-5 years experience) 55-75 60-75 70-80 70–85
Estimator (5+ years experience) 80-90 85-95 90-110 100–110
Senior Estimator 100–120 110–130 120–130 120–130
Chief Estimator/Preconstruction Manager 130-140 130-150 140-160 150–160
Preconstruction Director 140-150 140-160 140-160 150-170
TEXAS
Commercial construction
24 | Construction Recruitment & Retention Guide
These salary lists have been compiled using data that surveyed employers provided alongside the insights of the construction recruitment team, and as such should be used as a guide only.
Hays specializes in the hiring of professionals across all areas of construction and property and is not limited to those listed above and throughout this report.
All figures are expressed in thousand United States dollars and as annual gross salaries.

Construction Recruitment & Retention Guide | 25

BENEFITS
26 | Construction Recruitment & Retention Guide
Benefits offered by construction employer survey respondents
What benefits do you currently offer to employees?
0%
10%
20%
30%
40%
50%
60%
70%
80%
1 week 2 weeks 3 weeks 4 weeks 5 weeks+
Chart Title
<1 year 1-3 years 5-10 years 10+ years
Vacation policy based on tenure
How much vacation does your staff receive based on years’ worked?
<1 year worked
1-5 years’ worked
5-10 years’ worked
10+ years’ worked
Employer survey respondents say almost 85 percent of companies who offer benefits include a 401K retirement plan.
Health plans are the second most prevalent benefit. Now everyone in the US must have healthcare coverage, offering health plans could be an effective way to bolster compensation plans and to attract talent. Training and certification support, both financial or non-financial, is offered by 56 percent of employer respondents. Given that 96 percent of employers have experienced some level of skills shortage over the past 12 months, adding training and development support into your offering could help alleviate workload pressure caused by a lack of skills.
0% 20% 40% 60% 80% 100%
Onsite childcare
Other
Extended parental benefits
Pension plan (non-matching)
Time off in lieu
Share incentives
Transit subsidy
Equity in the business
Gym membership
10 days+ of vacation (new hires)
Paid overtime
Memberships
Ability to work from home
Access to event season tickets/corporate box
Flexible work hours
Hiring bonus/incentive
Onsite parking/parking subsidy
Training / certification support
Company car/car allowance
Individual performance-related bonus
Health benefits
401K
BENEFITS
Construction Recruitment & Retention Guide | 27
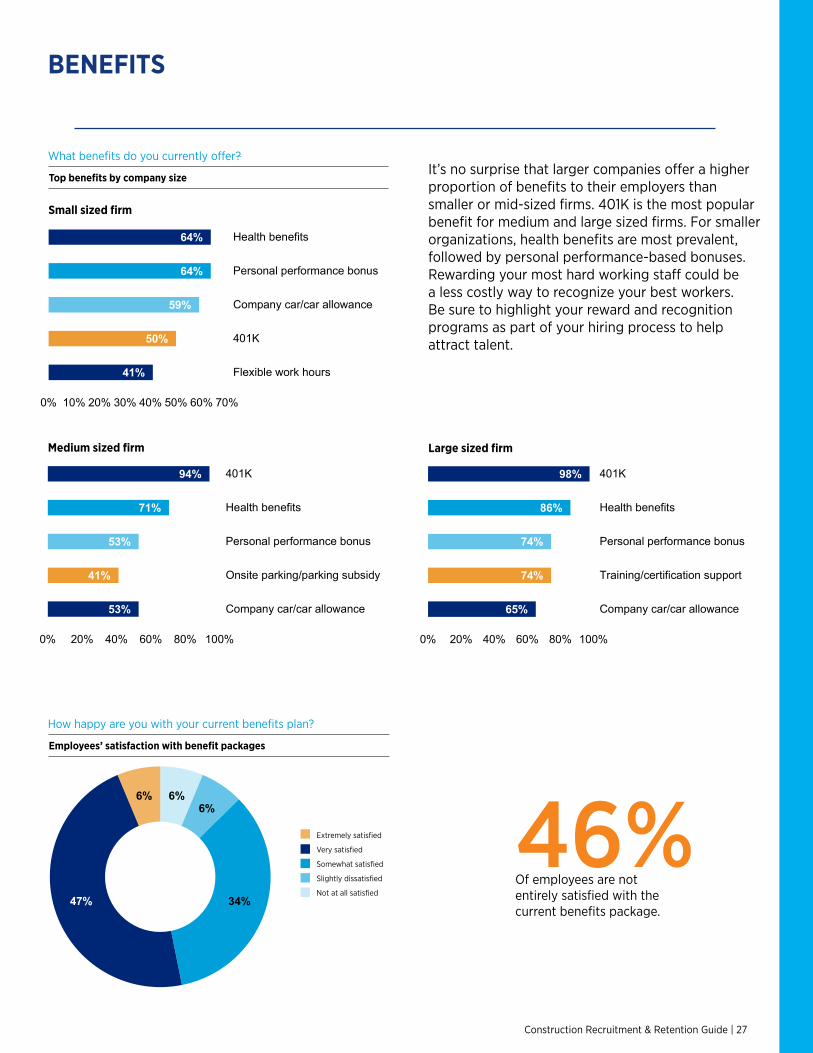
Top benefits by company size
What benefits do you currently offer?
6%6%
34%47%
6%
Not at all satisfied Slightly satisfied Somewhat satisfied Very satisfied Extremely satisfied
Extremely satisfied
Very satisfied
Somewhat satisfied
Slightly dissatisfied
Not at all satisfied
Employees’ satisfaction with benefit packages
How happy are you with your current benefits plan?
Small sized firm
Medium sized firm Large sized firm
46%Of employees are not entirely satisfied with the current benefits package.
It’s no surprise that larger companies offer a higher proportion of benefits to their employers than smaller or mid-sized firms. 401K is the most popular benefit for medium and large sized firms. For smaller organizations, health benefits are most prevalent, followed by personal performance-based bonuses. Rewarding your most hard working staff could be a less costly way to recognize your best workers. Be sure to highlight your reward and recognition programs as part of your hiring process to help attract talent.
41%
50%
59%
64%
64%
0% 10% 20% 30% 40% 50% 60% 70%
Flexible work hours
401K
Company car/car allowance
Personal performance bonus
Health benefits
Small sized firm
53%
41%
53%
71%
94%
0% 20% 40% 60% 80% 100%
Company car/car allowance
Onsite parking/parking subsidy
Personal performance bonus
Health benefits
401K
Medium sized firm
65%
74%
74%
86%
98%
0% 20% 40% 60% 80% 100%
Company car/car allowance
Training/certification support
Personal performance bonus
Health benefits
401K
Large sized firm
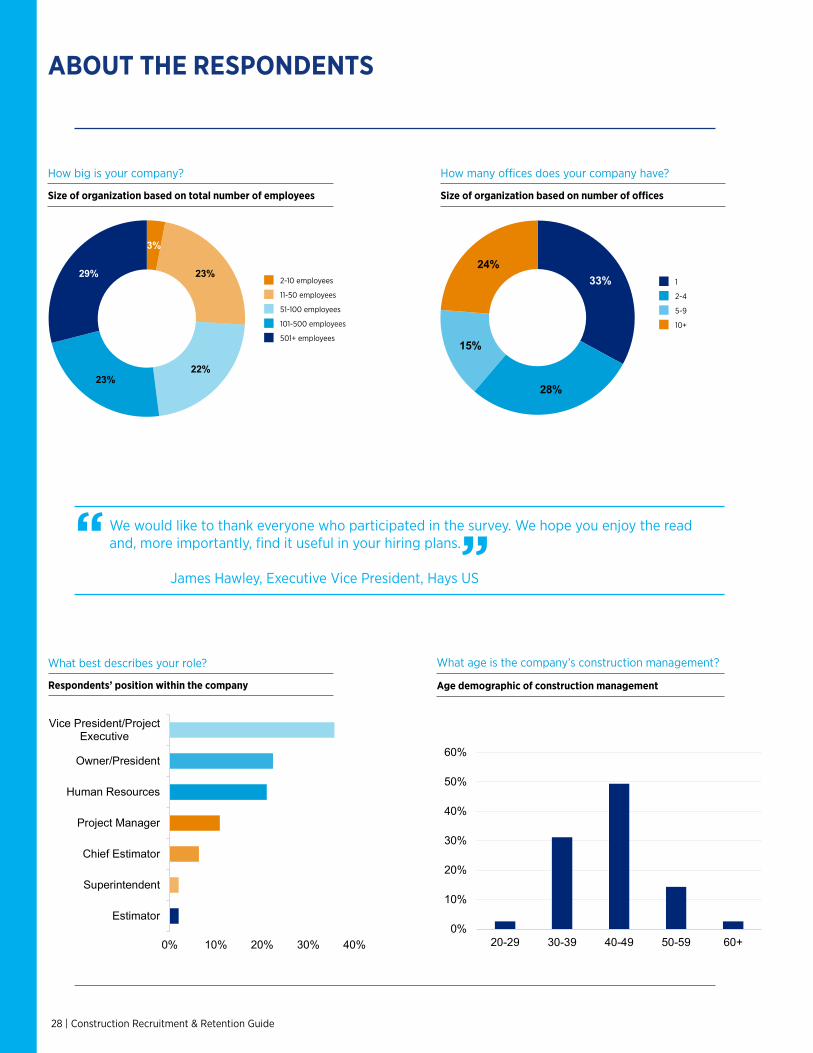
ABOUT THE RESPONDENTS
28 | Construction Recruitment & Retention Guide
Respondents’ position within the company
Size of organization based on total number of employees
How big is your company?
What best describes your role?
We would like to thank everyone who participated in the survey. We hope you enjoy the read and, more importantly, find it useful in your hiring plans.
James Hawley, Executive Vice President, Hays US
“ ”
Age demographic of construction management
What age is the company’s construction management?
2-10 employees
11-50 employees
51-100 employees
101-500 employees
501+ employees
Size of organization based on number of offices
How many offices does your company have?
1
2-4
5-9
10+
Estimator
Superintendent
Chief Estimator
Project Manager
Human Resources
Owner/President
Vice President/ProjectExecutive
0% 10% 20% 30% 40%
Chart Title
Estimator
Superintendent
Chief Estimator
Project Manager
Human Resources
Owner/President
Vice President/ProjectExecutive 0%
10%
20%
30%
40%
50%
60%
20-29 30-39 40-49 50-59 60+
Age demographic
3%
23%
22%23%
29%
2-10 employees 11-50 employees 51-100 employees
101-500 employees 501+ employees
33%
28%
15%
24%
1 2-4 5-9 10+

Construction Recruitment & Retention Guide | 29
How many offices does your company have?
Tampa4300 West Cypress Street, Suite 900 Tampa, FL 33607 T: (813) 936-7004 F: (813) 936-2925
Atlanta One Atlanta Plaza, 950 East Paces Ferry Road NE, Suite 2155 Atlanta, GA 30326 T: (404) 846-9392 F: (404) 846-9385
Chicago 200 North LaSalle Street, Suite 2370 Chicago, IL 60601 T/F: (312) 854-2860
Dallas 14785 Preston Road, Suite 995 Dallas, TX 75254 T/F: (214) 960-2574
Denver 5445 DTC Parkway, Penthouse 4 Greenwood Village, CO 8011 T: (720) 893-2880
hays-us.com
HAYS and the H device are protected by trade mark and design laws in many jurisdictions. © HAYS 2015
Houston 5718 Westheimer Road, Suite 1110 Houston, TX 77057 T: (713) 961 0359
Miami 1200 South Pine Island Road, Suite 430 Plantation, FL 33324 T/F: (954) 713-9406
Minneapolis 3800 American Boulevard West, Suite 1150 Bloomington, MN 55431 T: (952) 314-2523 F: (952) 314-2517
New York555 Eighth Avenue, Suite 2301 New York, NY 10018 T: (212) 548-4500
Orlando 485 North Keller Road, Suite 101 Maitland, FL 32751 T: (407) 244-3641 F: (407) 244-3646
Raleigh 2840 Plaza Place, Suite 340 Raleigh, NC 27612 T: (919) 278-2987 F: (919) 278-2988
Richmond 1100 Boulders Parkway, Suite 330 Richmond, VA 23225 T/F: (804) 665-9192
Washington D.C.8229 Boone Boulevard, Suite 460 Tyson’s Corner, VA 22182 T/F: (703) 956-2850