Hawai‘i Pathways Projectuhfamily.hawaii.edu/publications/brochures/4c755_HPP_Progress... · 2...
26
Progress Report August 2014‒September 2015 Hawai‘i Pathways Project
Transcript of Hawai‘i Pathways Projectuhfamily.hawaii.edu/publications/brochures/4c755_HPP_Progress... · 2...

ProgressReportAugust2014‒September2015
Hawai‘iPathwaysProject

2 Hawai‘i Pathways Project
Acknowledgements
Hawai‘i Pathways Project is funded by the Substance Abuse and Mental Health Services Administration
(SAMHSA), Cooperative Agreement to Benefit Homeless Individuals for States (CABHI‐States) Grant,
No.: TI025340, under the U.S. Department of Health and Human Services.
Data and information presented in this report were provided by the Hawai‘i Pathways Project Team,
including the Hawai‘i State Department of Health’s Alcohol and Drug Abuse Division’s Treatment Branch,
Helping Hands Hawai‘i, and Catholic Charities Hawai‘i. We especially appreciate the clients who
participated voluntarily in the survey interviews.
Photo on the cover page was taken by a Hawai‘i Pathways Project client in his home.
ReportCitation
Yuan, S., Liebreich, H., Morimoto, Y. (2016). Hawai‘i Pathways Project: Progress Report, August 2014‒
September 2015. Honolulu: University of Hawai‘i, Center on the Family.
ContactInformation
Center on the Family, University of Hawai‘i at Mānoa
2515 Campus Road, Miller Hall 103, Honolulu, HI 96822
Phone: 808‐956‐4132
Email: [email protected]
Website: www.uhfamily.hawaii.edu
Released 5‐9‐2016
Revised 5‐27‐2016
Progress Report, Aug 2014‒Sep 2015 3
TableofContents
Acknowledgements ............................................................................................................................................ 2
Executive Summary ............................................................................................................................................ 4
Introduction ........................................................................................................................................................ 5
Background ..................................................................................................................................................... 5
Logic Model .................................................................................................................................................... 6
Report Overview ............................................................................................................................................. 6
Program Activities and Outcomes ...................................................................................................................... 8
Referrals .......................................................................................................................................................... 8
Eligibility Determination Process .................................................................................................................. 10
Program Eligibility Criteria ............................................................................................................................ 11
Client Characteristics .................................................................................................................................... 13
Application for Benefits and IDs ................................................................................................................... 14
Health and Support Services Provided ......................................................................................................... 15
Housing Status .............................................................................................................................................. 17
Quality of Life ............................................................................................................................................... 18
Healthcare Utilization and Cost .................................................................................................................... 19
Challenges and Next Steps ............................................................................................................................... 20
Appendix 1 Hawai‘i Pathways Project: Progress Highlights, Aug 2014‒May 2015 .......................................... 21
Appendix 2 Hawai‘i Pathways Project: Progress Highlights, Aug 2014‒Sep 2015 ........................................... 23
Appendix 3 Estimated Healthcare Cost Reduction among Hawai‘i Pathways Clients in the State’s Housing
First Program ................................................................................................................................. 25
4 Hawai‘i Pathways Project
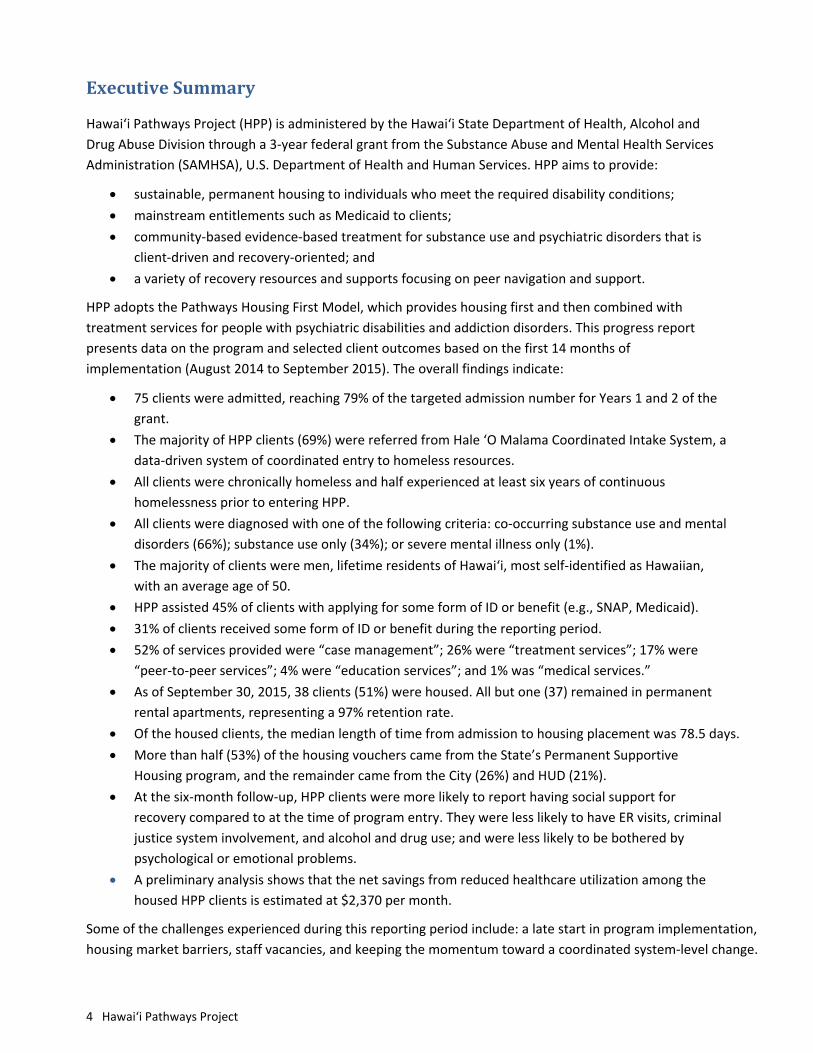
ExecutiveSummary
Hawai‘i Pathways Project (HPP) is administered by the Hawai‘i State Department of Health, Alcohol and
Drug Abuse Division through a 3‐year federal grant from the Substance Abuse and Mental Health Services
Administration (SAMHSA), U.S. Department of Health and Human Services. HPP aims to provide:
sustainable, permanent housing to individuals who meet the required disability conditions;
mainstream entitlements such as Medicaid to clients;
community‐based evidence‐based treatment for substance use and psychiatric disorders that is
client‐driven and recovery‐oriented; and
a variety of recovery resources and supports focusing on peer navigation and support.
HPP adopts the Pathways Housing First Model, which provides housing first and then combined with
treatment services for people with psychiatric disabilities and addiction disorders. This progress report
presents data on the program and selected client outcomes based on the first 14 months of
implementation (August 2014 to September 2015). The overall findings indicate:
75 clients were admitted, reaching 79% of the targeted admission number for Years 1 and 2 of the
grant.
The majority of HPP clients (69%) were referred from Hale ‘O Malama Coordinated Intake System, a
data‐driven system of coordinated entry to homeless resources.
All clients were chronically homeless and half experienced at least six years of continuous
homelessness prior to entering HPP.
All clients were diagnosed with one of the following criteria: co‐occurring substance use and mental
disorders (66%); substance use only (34%); or severe mental illness only (1%).
The majority of clients were men, lifetime residents of Hawai‘i, most self‐identified as Hawaiian,
with an average age of 50.
HPP assisted 45% of clients with applying for some form of ID or benefit (e.g., SNAP, Medicaid).
31% of clients received some form of ID or benefit during the reporting period.
52% of services provided were “case management”; 26% were “treatment services”; 17% were
“peer‐to‐peer services”; 4% were “education services”; and 1% was “medical services.”
As of September 30, 2015, 38 clients (51%) were housed. All but one (37) remained in permanent
rental apartments, representing a 97% retention rate.
Of the housed clients, the median length of time from admission to housing placement was 78.5 days.
More than half (53%) of the housing vouchers came from the State’s Permanent Supportive
Housing program, and the remainder came from the City (26%) and HUD (21%).
At the six‐month follow‐up, HPP clients were more likely to report having social support for
recovery compared to at the time of program entry. They were less likely to have ER visits, criminal
justice system involvement, and alcohol and drug use; and were less likely to be bothered by
psychological or emotional problems.
A preliminary analysis shows that the net savings from reduced healthcare utilization among the
housed HPP clients is estimated at $2,370 per month.
Some of the challenges experienced during this reporting period include: a late start in program implementation,
housing market barriers, staff vacancies, and keeping the momentum toward a coordinated system‐level change.
Progress Report, Aug 2014‒Sep 2015 5
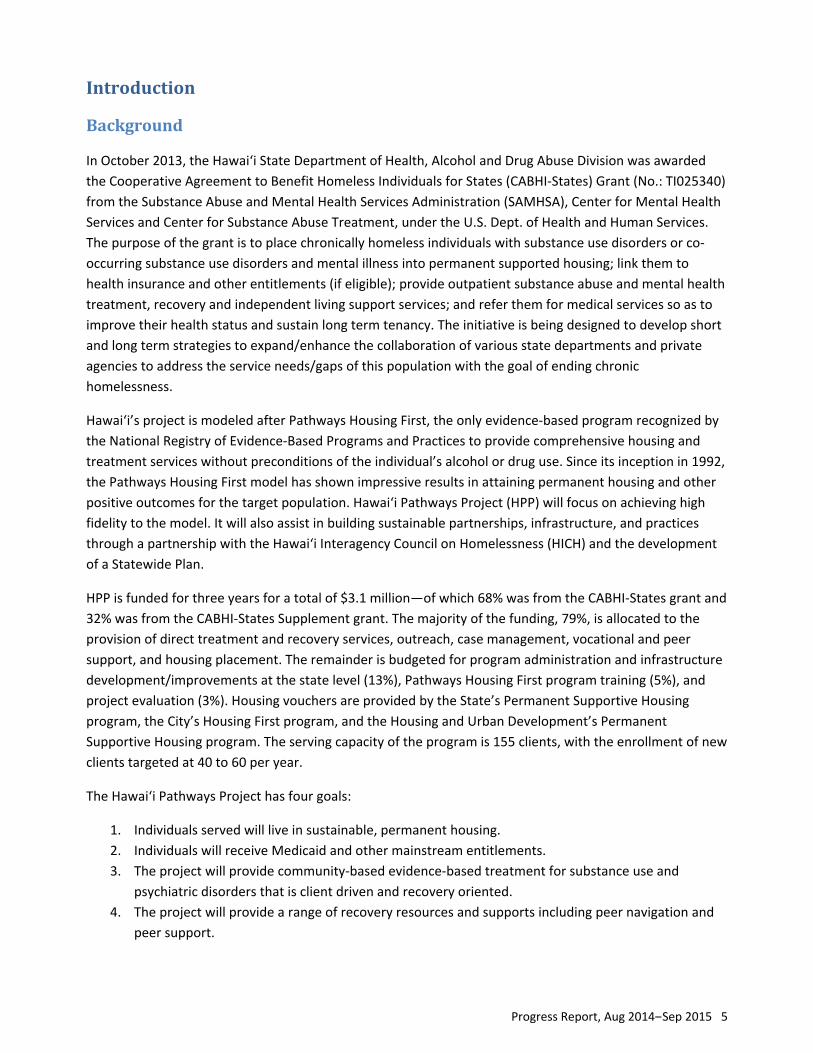
Introduction
Background
In October 2013, the Hawai‘i State Department of Health, Alcohol and Drug Abuse Division was awarded
the Cooperative Agreement to Benefit Homeless Individuals for States (CABHI‐States) Grant (No.: TI025340)
from the Substance Abuse and Mental Health Services Administration (SAMHSA), Center for Mental Health
Services and Center for Substance Abuse Treatment, under the U.S. Dept. of Health and Human Services.
The purpose of the grant is to place chronically homeless individuals with substance use disorders or co‐
occurring substance use disorders and mental illness into permanent supported housing; link them to
health insurance and other entitlements (if eligible); provide outpatient substance abuse and mental health
treatment, recovery and independent living support services; and refer them for medical services so as to
improve their health status and sustain long term tenancy. The initiative is being designed to develop short
and long term strategies to expand/enhance the collaboration of various state departments and private
agencies to address the service needs/gaps of this population with the goal of ending chronic
homelessness.
Hawai‘i’s project is modeled after Pathways Housing First, the only evidence‐based program recognized by
the National Registry of Evidence‐Based Programs and Practices to provide comprehensive housing and
treatment services without preconditions of the individual’s alcohol or drug use. Since its inception in 1992,
the Pathways Housing First model has shown impressive results in attaining permanent housing and other
positive outcomes for the target population. Hawai‘i Pathways Project (HPP) will focus on achieving high
fidelity to the model. It will also assist in building sustainable partnerships, infrastructure, and practices
through a partnership with the Hawai‘i Interagency Council on Homelessness (HICH) and the development
of a Statewide Plan.
HPP is funded for three years for a total of $3.1 million—of which 68% was from the CABHI‐States grant and
32% was from the CABHI‐States Supplement grant. The majority of the funding, 79%, is allocated to the
provision of direct treatment and recovery services, outreach, case management, vocational and peer
support, and housing placement. The remainder is budgeted for program administration and infrastructure
development/improvements at the state level (13%), Pathways Housing First program training (5%), and
project evaluation (3%). Housing vouchers are provided by the State’s Permanent Supportive Housing
program, the City’s Housing First program, and the Housing and Urban Development’s Permanent
Supportive Housing program. The serving capacity of the program is 155 clients, with the enrollment of new
clients targeted at 40 to 60 per year.
The Hawai‘i Pathways Project has four goals:
1. Individuals served will live in sustainable, permanent housing.
2. Individuals will receive Medicaid and other mainstream entitlements.
3. The project will provide community‐based evidence‐based treatment for substance use and
psychiatric disorders that is client driven and recovery oriented.
4. The project will provide a range of recovery resources and supports including peer navigation and
peer support.

6 Hawai‘i Pathways Project
LogicModel
The Hawai‘i Pathways Project (HPP) adopts the Pathways Housing First (PHF) evidence‐based program to
address the behavioral and mental health needs of chronically homeless individuals on O‘ahu, with a long‐
range goal of making an impact on ending chronic homelessness and enhancing the capacity of the
homeless service system in the State of Hawai‘i. The logic model of HPP is presented in Figure 1.
Figure 1 Hawai‘i Pathways Housing First Program: Logic Model
Impacts
Endingchronichomelessness Enhancingcapacityofthehomelessservicesystem
Outcomes Outputs Activities Inputs Objectives
Administration:DOH–AlcoholandDrugAbuseDivision(ADAD)
Sponsor:SAMHSA’sCABHI‐StatesGrant&SupplementGrant
ProgramDevelopment:DOH–OfficeofprogramandImprovementandExcellence
Consultant:PathwaystoHousing
Serviceprovider:HelpingHandsHawai‘i,CatholicCharitiesHawai‘i
KeyPartner:Hawai‘iInteragencyCouncilonHomelessness(HICH)
ProgramEvaluation:UH–CenterontheFamily
Placechronicallyhomelessindividualswhomeetrequireddisablingconditionsintopermanenthousing
Linkclientstohealthinsuranceandotherentitlementprograms
Provideclientswithsubstanceabuseandmentalhealthtreatmentaswellasrecoveryandindependentlivingsupportservicesincludingpeernavigationandpeersupport
Sustainablyreducechronichomelessness
Programfidelity
ImplementaPathwaysHousingFirstprogram
ProvideservicesviaAssertiveCommunityTreatment(ACT)team:
Harmreductionandtraumainformedapproaches
Treatmentservices
Casemanagementservices
Education/employmentservices
Peer‐to‐peerservices
Medicalservices Housingsupport
OfferPathwaysHousingFirstprogramtraining&socialmarketing
EstablishandfacilitateConsumerAdvisoryBoard(CAB)
WorkwithHICHtodeveloppolicyandexpandpartnership
TrainagenciesinhowtobecomeMedicaidproviders
OfferedaHousingFirstprogramwithhighfidelity
Served155clientswhometthefollowingconditions:
Chronicallyhomelesswithsubstanceuse,orco‐occurringsubstanceuseandmentaldisorders
Homelessveteranswithseverementalillness(SMI)orco‐occurringdisorders
ChronicallyhomelessindividualswithSMI
OrganizedHousingFirstcommunitytraining
ConvenedCABmeetings
Developedpoliciesandprocedures
Providedtrainingtostafffrom15agenciesinhowtobecomeMedicaidproviders
Improvementinlivingconditionsandhousingstabilityforclients
Qualityoflifeimprovesforclients(e.g.increasededucationlevels,employment,income,socialconnectedness)
Clientsspentlesstimeusingemergencyfacilitiesandmoretimeinprimarycaresettings
Clientsreducedtheirinvolvementwiththecriminaljusticesystem
Clientsmadeprogresstowardtheirpersonaltreatmentandrecoverygoals
ClientsaregenerallysatisfiedwiththeservicestheyreceivefromHPP
ClientLevel
Thestatewideplanhasbeendevelopedtoaddresstheneedsforinterimhousingandthelong‐termfinancingstrategiestosustainHousingFirstapproach
TheHPPmodelhashelpedexpediteaccesstobenefitprograms
Policies/procedureshavebeendevelopedtostreamlineaccesstothirdpartynetworkpayments
IncreaseinservicesbeingpaidtoclientsbyMedicaid
HPPreducescoststoservethispopulation
SystemLevel

Progress Report, Aug 2014‒Sep 2015 7
ReportOverview
This progress report covers the first 14 months of the implementation of Hawai‘i Pathways Project (HPP),
from August 2014 to September 2015. It serves as an update to two previous “progress highlights” of the
project (see Appendices 1 and 2). While the grant period started in October 2013, delays in grant
administration and the contractual process set back the implementation of the project for 10 months. In
this report, we will focus on assessing services received by the clients and client outcomes. A final report
will be completed at the end of the project, which will include the assessment of program fidelity, system‐
level activities and outcomes, in addition to a more comprehensive evaluation of the project using both
quantitative data and qualitative interviews of clients and key stakeholders. The key measures to be
discussed in this report include seven process measures (1‐7) and six outcome measures (8‐13) as follows:
1. Number of referrals admitted to the program
2. Length of eligibility determination process
3. Program eligibility criteria
4. Client Characteristics
5. Number of clients who applied for and received public benefit programs
6. Number and types of services provided
7. Length of time from admission to permanent housing placement
8. Housing stability
9. Improved quality of life
10. Reduced utilization of emergency facilities
11. Reduced involvement in the criminal justice system
12. Progress toward personal recovery goals
13. Cost reduction
Data for this report was collected by the HPP Project Team using data forms provided by SAMHSA and the
Project Evaluation Team. Data reports and frequency of data collection are outlined in Table 1. Of note,
throughout the report percentages may not add to 100% due to rounding.
Table 1 Data Sources
Data Method
Program Activities: (1) Referrals received, (2) eligibility assessment, (3) program admission
Report data online on a continuous basis
Client Updates: (1) Access to benefit programs, (2) housing stability, (3) education and employment
Report data online on a monthly basis
Government Performance & Results Acts (GPRA) Interviews: SAMSHA’s survey instrument used for collecting National Outcome Measures data
Conduct face‐to‐face interviews with clients at program intake, 6‐month, 12‐month, and discharge; submit data online within 7 days upon completion of interview
Service Log: Services provided to clients Enter data in an electronic file, submit data file on a monthly basis

8 Hawai‘i Pathways Project
ProgramActivitiesandOutcomes
Referrals
ReferralsAdmittedtotheProgram
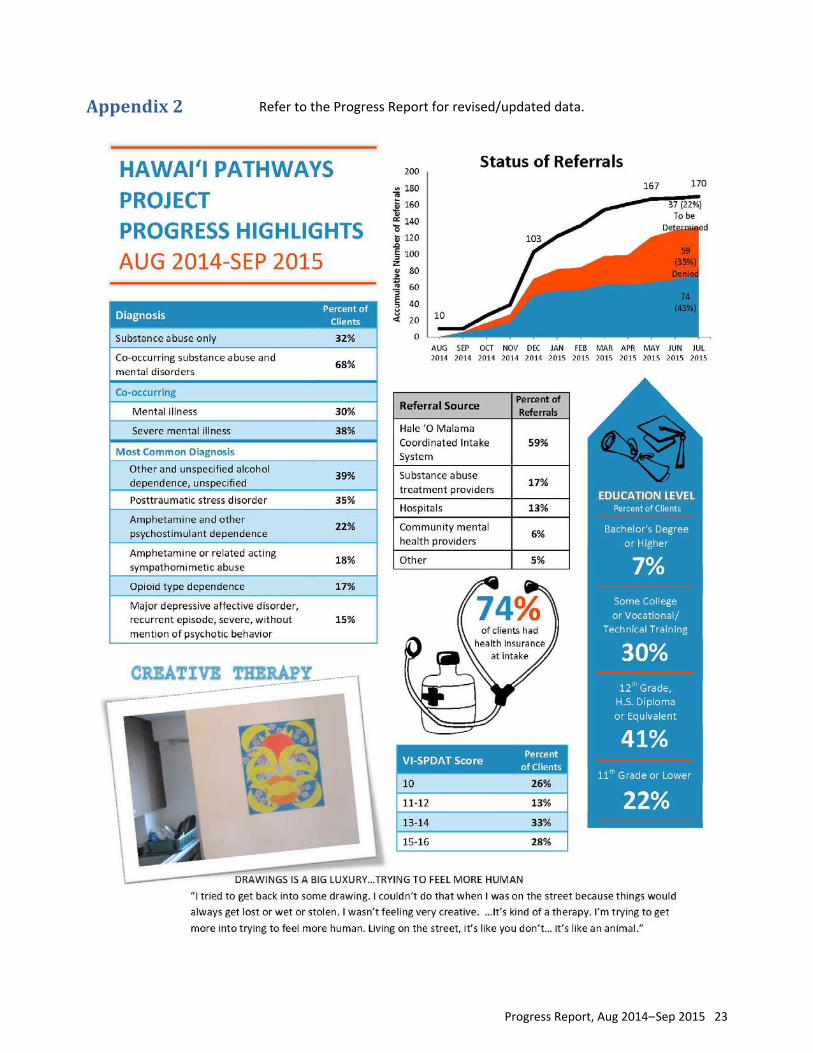
Between August 2014 and September 2015, Hawai‘i Pathways Project (HPP) received 171 referrals. Of the
130 referrals whose eligibility status was determined, 75 (58%) were admitted to HPP, and 55 (42%) were
declined due to eligibility reasons or declined consent for services. A total of 41 referrals (24%) were
pending a determination as of September 30, 2015.
The Project reached 79% of its targeted number of admission (95 clients) for Years 1 and 2 of the grant. The
peak number of admission (33) occurred in December 2014, reflecting the Project’s effort in catching up
with the admission goal as a result of the 10‐month delay in implementation.
Five clients (unhoused) were discharged from the program as housing opportunities became available from
another program.
Table 2 Referral Status
Month New Referrals
Admitted Denied Pending Cumulative Number of Referrals
Aug 2014 10 0 0 10 10
Sep 0 6 0 4 10
Oct 16 4 6 10 26
Nov 13 9 2 12 39
Dec 64 33 9 34 103
Jan 2015 19 6 7 40 122
Feb 13 2 1 50 135
Mar 19 7 7 55 154
Apr 8 0 1 62 162
May 6 2 19 47 168
Jun 1 4 3 41 169
Jul 2 2 0 41 171
Aug 0 0 0 41 171
Sep 0 0 0 41 171
Total 75 55 171

Progress Report, Aug 2014‒Sep 2015 9
ReferralSources
For those referrals who were extended HPP admission (N=75), the majority were referred via the Hale ‘O
Malama Coordinated Intake (69%), a data‐driven system of coordinated entry to homeless resources. The
reminder included: 11% referred by hospitals, 9% by substance abuse treatment providers, 8% by
community mental health providers, and 2% by other referral sources.
Those referred by Hale ‘O Malama, hospitals, and community mental health providers were more likely to
be admitted rather than denied or “pending.” Meanwhile, participants referred by substance abuse
treatment providers and other sources were more likely to be denied rather than admitted or “pending.”
For an overview of referral source by status, see Table 3.
Table 3 Referral Source by Status
Referral Source Number of Referrals Percent of Total Referrals
Adm. Den. Pend. Total Adm. Den. Pend. Total
Hale 'O Malama 52 27 21 100 30% 16% 12% 58%
SA Treatment Providers 7 16 7 30 4% 9% 4% 18%
Hospitals 8 4 11 23 5% 2% 6% 13%
CMHP 6 2 1 9 4% 1% 1% 5%
Other 2 6 1 9 1% 4% 1% 5%
Total 75 55 41 171 44% 32% 24% 100%
VI‐SPDATScore
A VI‐SPDAT (Vulnerability Index & Service Prioritization Decision Assistance Tool) score of 10 was the
minimum requirement for receiving HPP services. For those referrals who were admitted to HPP, over half
(63%) scored a 13 or higher on the VI‐SPDAT; meanwhile, a quarter of this group received a 10. For those
who were denied HPP admission, 39% had a VI‐SPDAT score lower than 10.
Table 4 VI‐SPDAT Score and Referral Status
VI‐SPDAT Score Admitted Denied Total
Below 10 0 18 18
10 18 2 20
11‐12 9 12 21
13‐14 24 9 33
15‐16 22 3 25
Above 16 0 2 2
Total 73 46 119
Note: VI‐SPDAT screening was not administered to 11 individuals prior to referral to Hawai‘i Pathways Project and therefore they were not included in the above table.
10 Hawai‘i Pathways Project
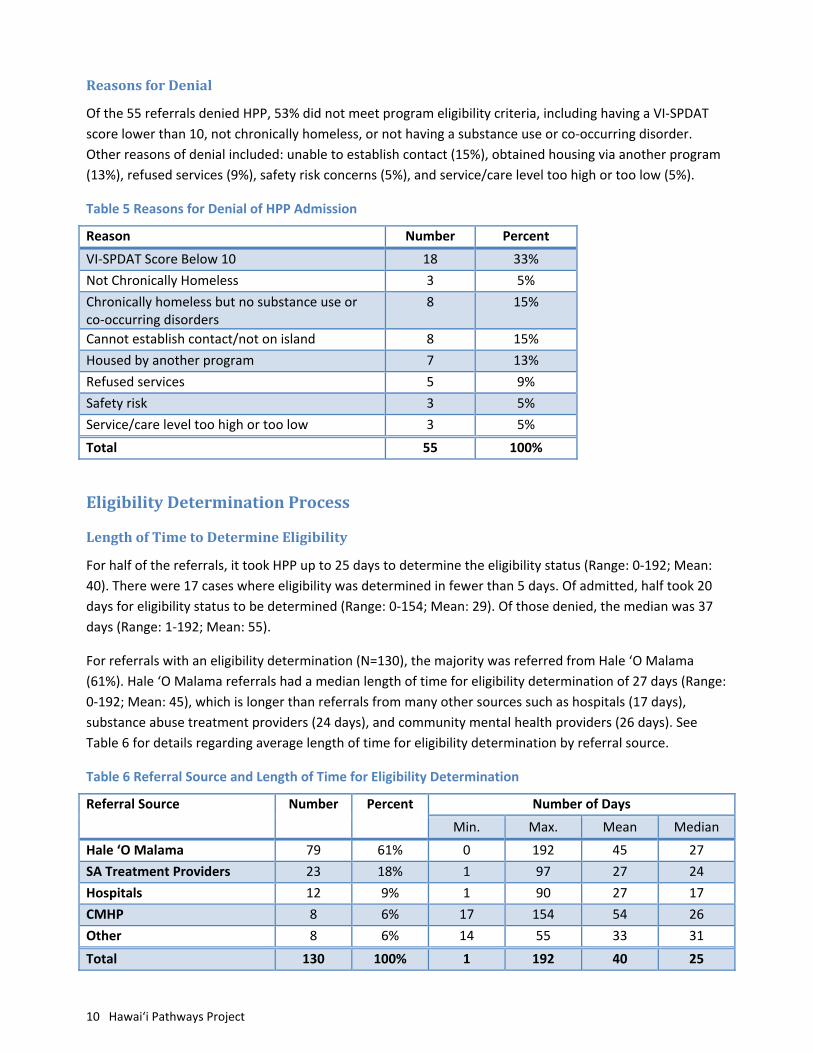
ReasonsforDenial
Of the 55 referrals denied HPP, 53% did not meet program eligibility criteria, including having a VI‐SPDAT
score lower than 10, not chronically homeless, or not having a substance use or co‐occurring disorder.
Other reasons of denial included: unable to establish contact (15%), obtained housing via another program
(13%), refused services (9%), safety risk concerns (5%), and service/care level too high or too low (5%).
Table 5 Reasons for Denial of HPP Admission
Reason Number Percent
VI‐SPDAT Score Below 10 18 33%
Not Chronically Homeless 3 5%
Chronically homeless but no substance use or co‐occurring disorders
8 15%
Cannot establish contact/not on island 8 15%
Housed by another program 7 13%
Refused services 5 9%
Safety risk 3 5%
Service/care level too high or too low 3 5%
Total 55 100%
EligibilityDeterminationProcess
LengthofTimetoDetermineEligibility
For half of the referrals, it took HPP up to 25 days to determine the eligibility status (Range: 0‐192; Mean:
40). There were 17 cases where eligibility was determined in fewer than 5 days. Of admitted, half took 20
days for eligibility status to be determined (Range: 0‐154; Mean: 29). Of those denied, the median was 37
days (Range: 1‐192; Mean: 55).
For referrals with an eligibility determination (N=130), the majority was referred from Hale ‘O Malama
(61%). Hale ‘O Malama referrals had a median length of time for eligibility determination of 27 days (Range:
0‐192; Mean: 45), which is longer than referrals from many other sources such as hospitals (17 days),
substance abuse treatment providers (24 days), and community mental health providers (26 days). See
Table 6 for details regarding average length of time for eligibility determination by referral source.
Table 6 Referral Source and Length of Time for Eligibility Determination
Referral Source Number Percent Number of Days
Min. Max. Mean Median
Hale ‘O Malama 79 61% 0 192 45 27
SA Treatment Providers 23 18% 1 97 27 24
Hospitals 12 9% 1 90 27 17
CMHP 8 6% 17 154 54 26
Other 8 6% 14 55 33 31
Total 130 100% 1 192 40 25
Progress Report, Aug 2014‒Sep 2015 11
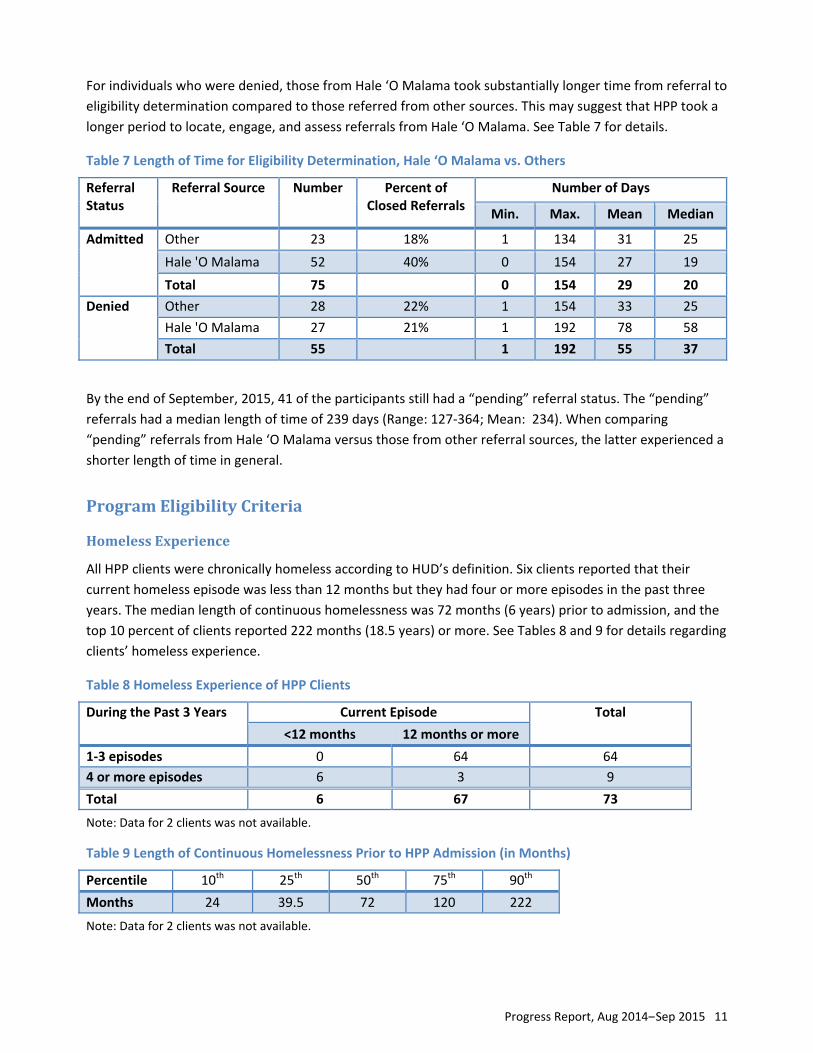
For individuals who were denied, those from Hale ‘O Malama took substantially longer time from referral to
eligibility determination compared to those referred from other sources. This may suggest that HPP took a
longer period to locate, engage, and assess referrals from Hale ‘O Malama. See Table 7 for details.
Table 7 Length of Time for Eligibility Determination, Hale ‘O Malama vs. Others
Referral Status
Referral Source Number Percent of Closed Referrals
Number of Days
Min. Max. Mean Median
Admitted
Other 23 18% 1 134 31 25
Hale 'O Malama 52 40% 0 154 27 19
Total 75 0 154 29 20
Denied
Other 28 22% 1 154 33 25
Hale 'O Malama 27 21% 1 192 78 58
Total 55 1 192 55 37
By the end of September, 2015, 41 of the participants still had a “pending” referral status. The “pending”
referrals had a median length of time of 239 days (Range: 127‐364; Mean: 234). When comparing
“pending” referrals from Hale ‘O Malama versus those from other referral sources, the latter experienced a
shorter length of time in general.
ProgramEligibilityCriteria
HomelessExperience
All HPP clients were chronically homeless according to HUD’s definition. Six clients reported that their
current homeless episode was less than 12 months but they had four or more episodes in the past three
years. The median length of continuous homelessness was 72 months (6 years) prior to admission, and the
top 10 percent of clients reported 222 months (18.5 years) or more. See Tables 8 and 9 for details regarding
clients’ homeless experience.
Table 8 Homeless Experience of HPP Clients
During the Past 3 Years Current Episode Total
<12 months 12 months or more
1‐3 episodes 0 64 64
4 or more episodes 6 3 9
Total 6 67 73
Note: Data for 2 clients was not available.
Table 9 Length of Continuous Homelessness Prior to HPP Admission (in Months)
Percentile 10th 25th 50th 75th 90th
Months 24 39.5 72 120 222
Note: Data for 2 clients was not available.

12 Hawai‘i Pathways Project
SubstanceAbuseandMentalDisorders
For the current reporting period, 34% of clients had a substance abuse only diagnosis, 1% was diagnosed
with severe mental illness (SMI) only, and 66% had a co‐occurring substance abuse and mental illness
disorder. Of those clients with a co‐occurring diagnosis, 30% had a diagnosis of mental illness and 36% had
a diagnosis of severe mental illness. The most common diagnoses among clients were: posttraumatic stress
disorder (35%); other and unspecified alcohol dependence (34%); amphetamine and other psychostimulant
dependence (22%); amphetamine or related acting sympathomimetic abuse (20%); opioid type dependence
(16%); and major depressive affective disorder, recurrent episode, severe, without mention of psychotic
behavior (15%).
Table 10 Substance Abuse and Mental Disorders
Diagnosis Number Percent
Category
Substance abuse only 25 34%
Severe mental illness (SMI) only 1 1%
Co‐occurring substance abuse and mental disorders/SMI 49 66%
Co‐Occurring substance abuse and...
Mental illness 22 30%
Severe mental illness 27 36%
Most Common Diagnosis
Posttraumatic stress disorder 26 35%
Other and unspecified alcohol dependence, unspecified 25 34%
Amphetamine and other psychostimulant dependence 16 22%
Amphetamine or related acting sympathomimetic abuse 15 20%
Opioid type dependence 12 16%
Major depressive affective disorder, recurrent episode, severe, without mention of psychotic behavior
11 15%
Note: Data based on information of 74 clients that was available.
VeteranStatus
Ten clients reported that they had previously served in the military, representing 13% of all clients.
Progress Report, Aug 2014‒Sep 2015 13
ClientCharacteristics
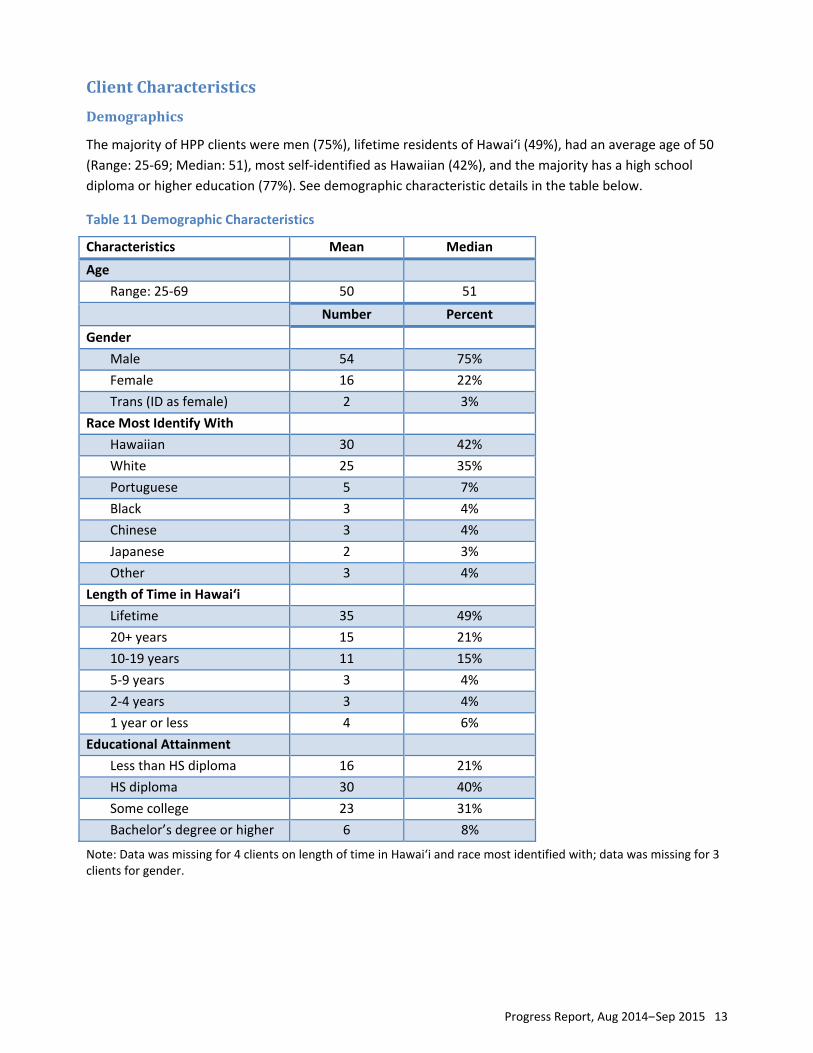
Demographics
The majority of HPP clients were men (75%), lifetime residents of Hawai‘i (49%), had an average age of 50
(Range: 25‐69; Median: 51), most self‐identified as Hawaiian (42%), and the majority has a high school
diploma or higher education (77%). See demographic characteristic details in the table below.
Table 11 Demographic Characteristics
Characteristics Mean Median
Age
Range: 25‐69 50 51
Number Percent
Gender
Male 54 75%
Female 16 22%
Trans (ID as female) 2 3%
Race Most Identify With
Hawaiian 30 42%
White 25 35%
Portuguese 5 7%
Black 3 4%
Chinese 3 4%
Japanese 2 3%
Other 3 4%
Length of Time in Hawai‘i
Lifetime 35 49%
20+ years 15 21%
10‐19 years 11 15%
5‐9 years 3 4%
2‐4 years 3 4%
1 year or less 4 6%
Educational Attainment
Less than HS diploma 16 21%
HS diploma 30 40%
Some college 23 31%
Bachelor’s degree or higher 6 8%
Note: Data was missing for 4 clients on length of time in Hawai‘i and race most identified with; data was missing for 3 clients for gender.

14 Hawai‘i Pathways Project
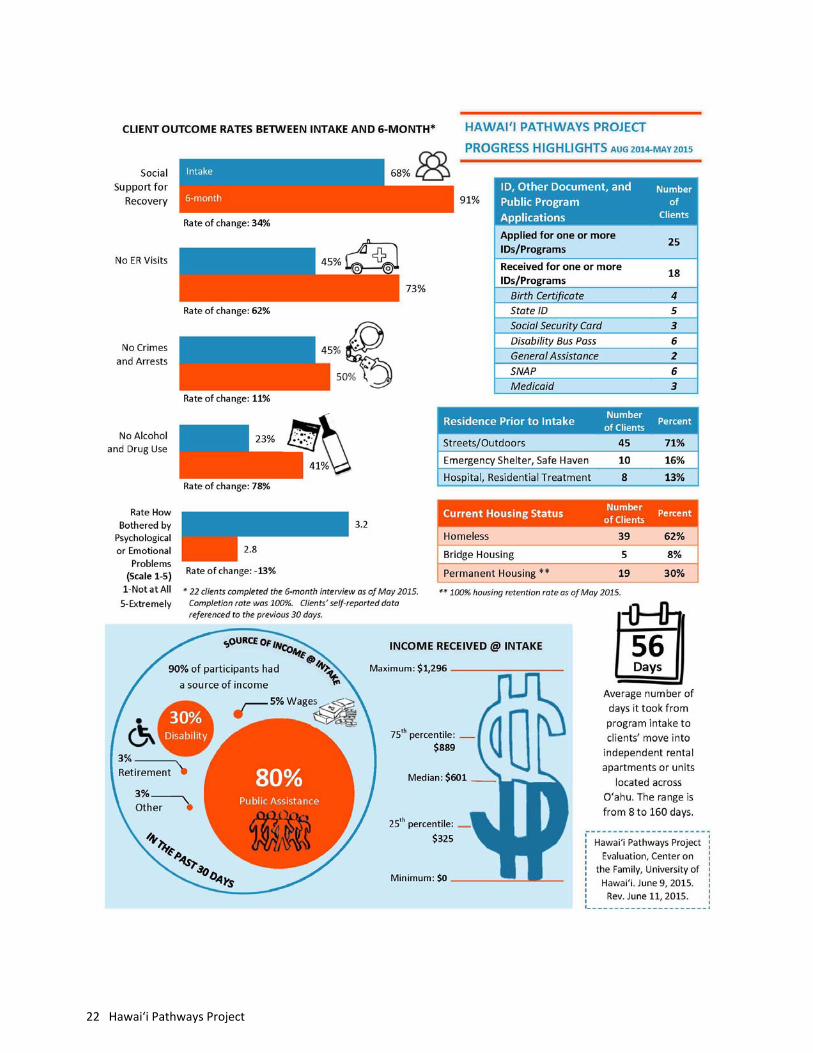
Income
The majority of clients have some form of income (92%), with most clients receiving income from public
assistance (79%). See Table 12 for details regarding source of income.
Table 12 Source of Income
Source Number Percent
Public Assistance 59 79%
Disability 22 29%
Other 9 12%
Wages 5 7%
Retirement 2 3%
Any income 69 92%
Note: Clients could select more than one type of income (N=75).
HealthInsurance
As of September 30, 2015, the majority of clients had health insurance (91%). The HMSA and ‘Ohana Health Plans were two major health insurers, each covered slightly over one third of the clients. See Table 13 for details regarding clients’ health insurance.
Table 13 Health Insurance
Health Insurer Number Percent
HMSA 27 36%
‘Ohana Health Plan 26 35%
United Healthcare 9 12%
AlohaCare 6 8%
No health insurance 7 9%
Total 75 100%
ApplicationforBenefitsandIDs
As of September 2015, 34 clients (45%) had applied for at least one benefit and/or one ID including: birth
certificate, state ID, social security card, bus pass, general assistance (GA), SNAP (Supplemental Nutrition
Assistance Program) benefits, Medicaid, supplemental security income (SSI), and social security disability
income (SSDI). About one‐third (23 clients) had received their documents and/or been approved for the
benefit programs during the reporting period.
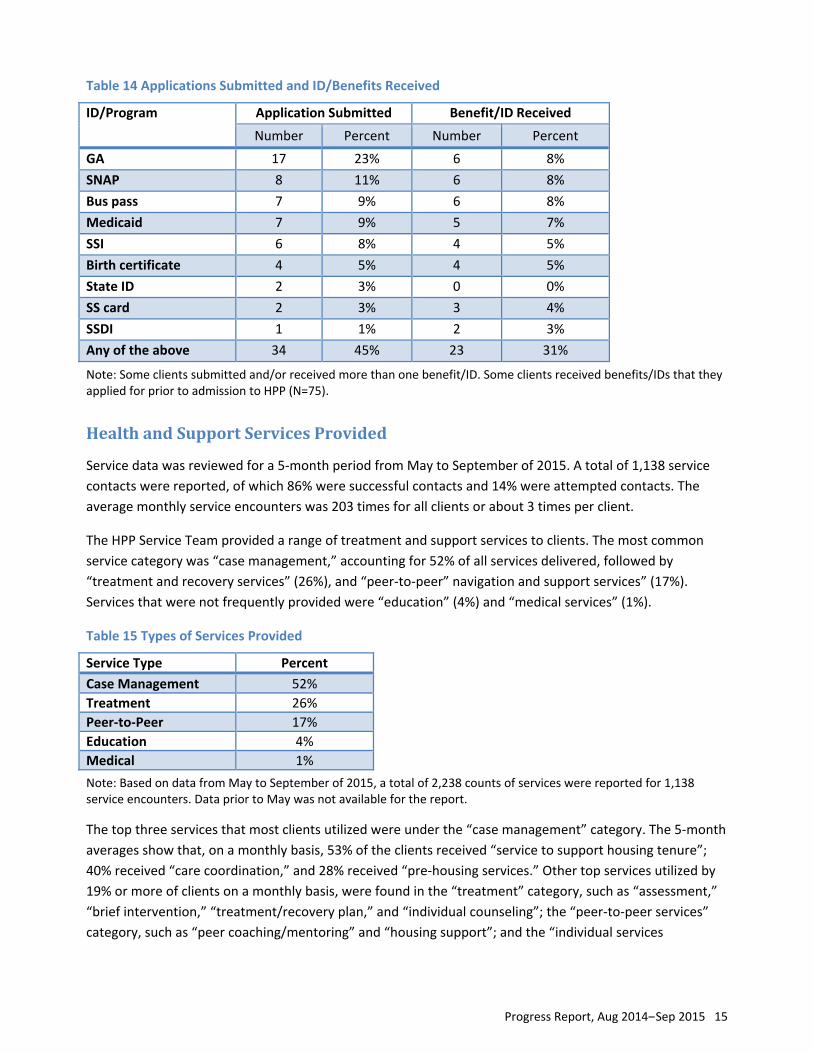
HPP assisted 17 clients (23%) to apply for GA and 7 to 8 clients (about 10%) applied for SNAP, bus passes,
and Medicaid each. Additionally, 12 clients applied for more than one benefit/ID. During the reporting
period, six clients each received GA, SNAP, and bus passes. Also, seven clients received more than one
benefit/ID. See Table 14 for details regarding benefits that clients applied for and received.
Progress Report, Aug 2014‒Sep 2015 15
Table 14 Applications Submitted and ID/Benefits Received
ID/Program Application Submitted Benefit/ID Received
Number Percent Number Percent
GA 17 23% 6 8%
SNAP 8 11% 6 8%
Bus pass 7 9% 6 8%
Medicaid 7 9% 5 7%
SSI 6 8% 4 5%
Birth certificate 4 5% 4 5%
State ID 2 3% 0 0%
SS card 2 3% 3 4%
SSDI 1 1% 2 3%
Any of the above 34 45% 23 31%
Note: Some clients submitted and/or received more than one benefit/ID. Some clients received benefits/IDs that they applied for prior to admission to HPP (N=75).
HealthandSupportServicesProvided
Service data was reviewed for a 5‐month period from May to September of 2015. A total of 1,138 service
contacts were reported, of which 86% were successful contacts and 14% were attempted contacts. The
average monthly service encounters was 203 times for all clients or about 3 times per client.
The HPP Service Team provided a range of treatment and support services to clients. The most common
service category was “case management,” accounting for 52% of all services delivered, followed by
“treatment and recovery services” (26%), and “peer‐to‐peer” navigation and support services” (17%).
Services that were not frequently provided were “education” (4%) and “medical services” (1%).
Table 15 Types of Services Provided
Service Type Percent
Case Management 52%
Treatment 26%
Peer‐to‐Peer 17%
Education 4%
Medical 1%
Note: Based on data from May to September of 2015, a total of 2,238 counts of services were reported for 1,138 service encounters. Data prior to May was not available for the report.
The top three services that most clients utilized were under the “case management” category. The 5‐month
averages show that, on a monthly basis, 53% of the clients received “service to support housing tenure”;
40% received “care coordination,” and 28% received “pre‐housing services.” Other top services utilized by
19% or more of clients on a monthly basis, were found in the “treatment” category, such as “assessment,”
“brief intervention,” “treatment/recovery plan,” and “individual counseling”; the “peer‐to‐peer services”
category, such as “peer coaching/mentoring” and “housing support”; and the “individual services

16 Hawai‘i Pathways Project
coordination” under the “case management” category. See Table 16 for a complete list of the 29 services
and the average number of clients served for each service type per month.
Table 16 Number of Clients Served by Type of Services
Service Type Average Number of Clients per Month
Percent of Clients
Treatment services
Screening 2 3%
Brief Intervention 14 19%
Assessment 16 22%
Treatment/Recovery Planning 14 19%
Individual Counseling 14 19%
Co‐Occurring Treatment/Recovery Services 1 1%
Pharmacological Interventions 5 7%
Community Integration & Recovery Supplemental Services 6 8%
Mental Health Services 11 15%
Referral to Treatment 1 1%
Case management services
Pre‐Employment 0 0%
Employment Coaching 1 1%
Transportation 7 10%
Pre‐Housing Services 20 28%
Services to Support Housing Tenure 38 53%
Re‐Housing Services 2 3%
Care Coordination 29 40%
Family Services 0 0%
Individual Services Coordination 15 21%
HIV/AIDS Service 0 0%
Education services
Substance Abuse Education 6 8%
Other Education Services 9 13%
Peer‐to‐peer services
Peer Coaching/Mentoring 14 19%
Housing Support 15 21%
Alcohol‐ and Drug‐Free Social Activities 0 0%
Peer‐Navigation Services 11 15%
Peer‐to‐Peer Recovery and Education Supplemental Group 0 0%
Medical services
Medical Care 1 1%
Other Medical Services 2 3%
Note: Based on data of all 72 clients enrolled during the period from May to September of 2015.

Progress Report, Aug 2014‒Sep 2015 17
HousingStatus
Prior to HPP admission, the majority of clients (73%) were unsheltered (streets, outdoors, other place not
meant for human habitation). The rest stayed in emergency shelters or Safe Haven—a supportive housing
program for single homeless adults with mental illnesses (15%), or were discharged from a residential
treatment facility or hospital (12%).
Table 17 Prior Residence
Type of Residence Number Percent
Unsheltered 55 73%
Emergency shelter, Safe Haven 11 15%
Residential treatment facility, Hospital
9 12%
Total 75 100%
During the reporting period, 38 clients were placed in a regular rental unit. As of September 30, 2015, 37
remained stably housed, but one client became homeless again after being housed for 301 days. Housing
retention rate was 97%. As a point of reference, programs implementing the Pathways Housing First model
elsewhere reported housing retention rates of 85%‒90%1.
Table 18 Current Housing Status
Housing Status Number Percent
Homeless 37 49%
Became homeless again 1 1%
Permanent Supportive Housing 37 49%
Total 75 100%
Note: Five unhoused clients were discharged from the program and their housing status at discharge is reported in the above table.
Considering all 75 HPP clients, 33% were housed within four months of program admission, including 15%
housed within six weeks. Of the 38 housed, 50% waited for 78.5 days for the housing placement. The
average was 101.8 days, with the fastest being 18 days and the slowest being 305 days.
Table 19 Length of time for Housing Placement
Number of Clients Percent of HPP Clients (N=75)
Housing Placement
Within 6 weeks of admission 11 15%
Within 4 months of admission 25 33%
Average Length of Time (N=38)
Median / Mean 78.5 days / 101.8 days
Range 18‒305 days
1 Pathways to Housing Annual Report 2012. Retrieved from https://pathwaystohousing.org/about/annual‐report
18 Hawai‘i Pathways Project
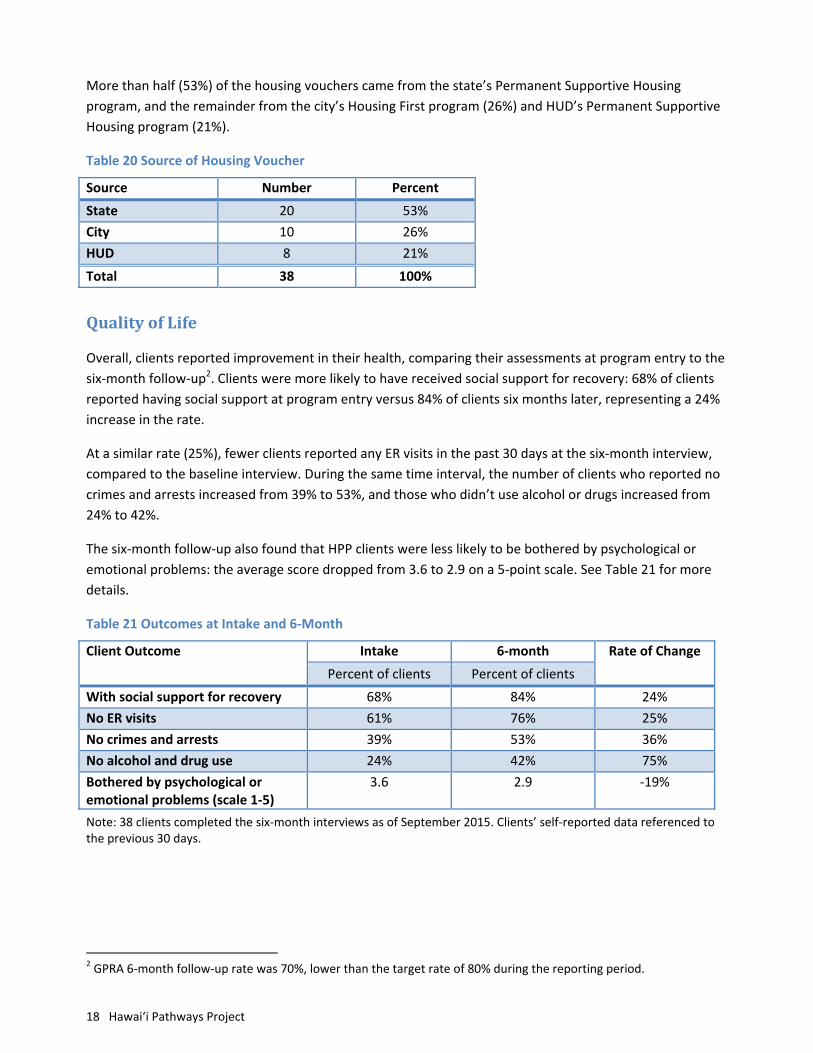
More than half (53%) of the housing vouchers came from the state’s Permanent Supportive Housing
program, and the remainder from the city’s Housing First program (26%) and HUD’s Permanent Supportive
Housing program (21%).
Table 20 Source of Housing Voucher
Source Number Percent
State 20 53%
City 10 26%
HUD 8 21%
Total 38 100%
QualityofLife
Overall, clients reported improvement in their health, comparing their assessments at program entry to the
six‐month follow‐up2. Clients were more likely to have received social support for recovery: 68% of clients
reported having social support at program entry versus 84% of clients six months later, representing a 24%
increase in the rate.
At a similar rate (25%), fewer clients reported any ER visits in the past 30 days at the six‐month interview,
compared to the baseline interview. During the same time interval, the number of clients who reported no
crimes and arrests increased from 39% to 53%, and those who didn’t use alcohol or drugs increased from
24% to 42%.
The six‐month follow‐up also found that HPP clients were less likely to be bothered by psychological or
emotional problems: the average score dropped from 3.6 to 2.9 on a 5‐point scale. See Table 21 for more
details.
Table 21 Outcomes at Intake and 6‐Month
Client Outcome Intake 6‐month Rate of Change
Percent of clients Percent of clients
With social support for recovery 68% 84% 24%
No ER visits 61% 76% 25%
No crimes and arrests 39% 53% 36%
No alcohol and drug use 24% 42% 75%
Bothered by psychological or emotional problems (scale 1‐5)
3.6 2.9 ‐19%
Note: 38 clients completed the six‐month interviews as of September 2015. Clients’ self‐reported data referenced to the previous 30 days.
2 GPRA 6‐month follow‐up rate was 70%, lower than the target rate of 80% during the reporting period.

Progress Report, Aug 2014‒Sep 2015 19
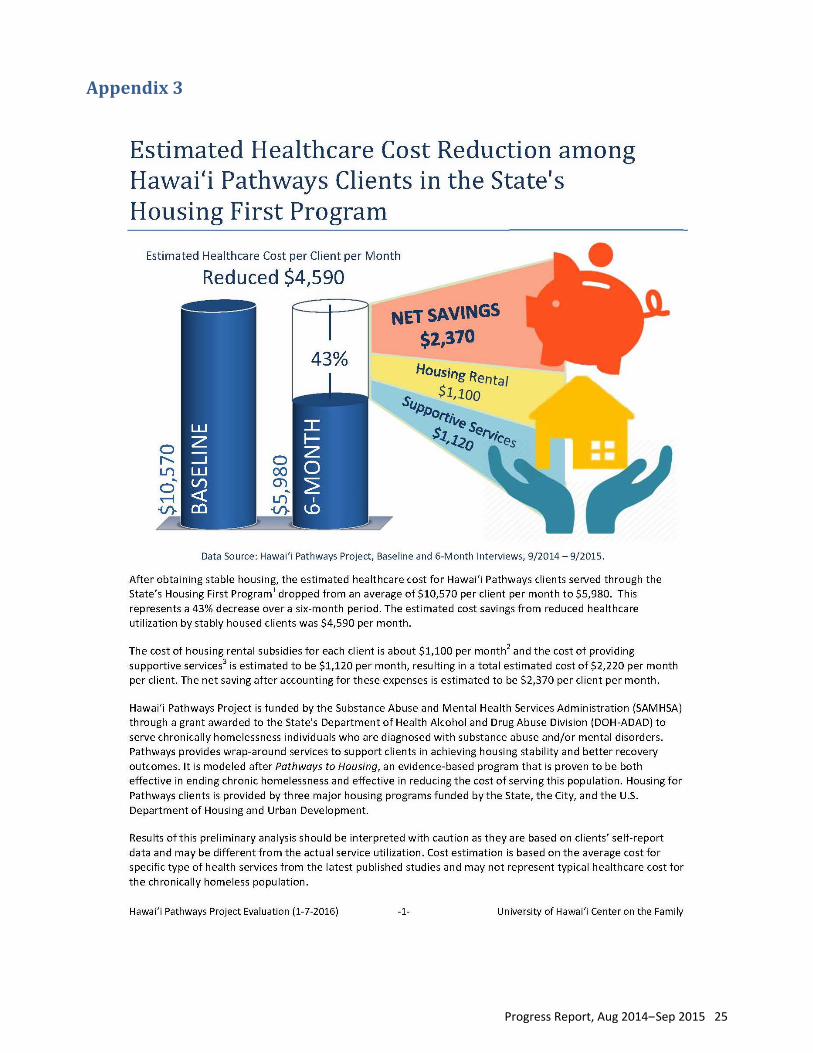
HealthcareUtilizationandCost
For the current reporting period, the estimated public healthcare cost per client per month was reduced by
$4,590 (from $10,570 at intake to $5,980 at six‐month interview), a 43% reduction. After accounting for the
cost of the average monthly housing rental ($1,100) as well as the cost of the average monthly supportive
services ($1,120), the net savings per client per month is estimated at $2,370.
As shown in Table 22, changes in the utilization of healthcare services resulted in an overall decrease in the
amount of public resources spent on a variety of healthcare services including: ER visits, inpatient care, and
outpatient visits. Please refer to Appendix 3 for details of the estimation methods.
Table 22 Changes in Healthcare Utilization among Hawai‘i Pathways Clients in the State’s Housing First Program
Type of Service 30‐Day Usage Estimated Cost Estimated Cost Savings Baseline 6‐month Change Baseline 6‐month Change
ER visit, time 11 5 ‐55% $13,563 $6,165 ‐55% $7,398
Inpatient care, nights 60 37 ‐38% $115,140 $71,003 ‐38% $44,137
Outpatient visit, times 150 63 ‐58% $29,850 $12,537 ‐58% $17,313
Total 221 105 ‐52% $158,553 $89,705 ‐43% $68,848
Average per client 14.7 7.0 ‐52% $10,570 $5,980 ‐43% $4,590
Note: The analysis includes all 15 Hawai‘i Pathways Project’s clients who utilize the State’s Housing First voucher and have completed both the baseline and six‐month interviews as of September 30, 2015. Future analysis will include housed clients who utilized other sources of vouchers.
20 Hawai‘i Pathways Project
ChallengesandNextSteps
Data from the first 14 months of program implementation showed positive outcomes for clients enrolled in
the Hawai‘i Pathways Project. However, programmatically, HPP has been struggling to reach enrollment
goal, to find housing for clients, and to address system issues. Some challenges and next steps are discussed
below.
LateStart
With the delays experienced by the state’s Alcohol and Drug Abuse Division (ADAD) in establishing the
program and executing the service contracts, the Hawai‘i Pathways Project (HPP) did not start until August
2014—10 months after the grant period began. To make up the time lost, HPP accepted a large number of
referrals (103) and focused its efforts in meeting the enrollment goal of 55 clients by the end of 2014. While
HPP was successful in meeting the goal within the first five months after its inauguration, there was
pressure placed on the service team to provide adequate services to the large influx of new clients.
TightHousingMarket
The tight housing market on O‘ahu created a barrier in placing clients into permanent housing. Although
the housing vouchers from the state, city, and HUD were readily available to HPP clients, it was often
difficult to find landlords willing to rent their apartments to this population. For the current reporting
period, only half of the enrolled clients have been placed into permanent housing. Additionally, only 29% of
clients who are currently housed were housed within the six‐week timeframe, a benchmark of the
Pathways Housing First Model. Five clients who were admitted into HPP left before being housed partly due
to the wait‐time associated with housing placement. While there is no easy solution to the housing market
situation, two important steps for HPP would be to increase outreach to landlords and address housing
policies.
StaffingVacancies
During the current reporting period, about half of the service team positions (15.5 FTE) were not filled.
Vacancies included 3.5 of 4.0 full‐time equivalent (FTE) for peer navigator positions, 2.0 of 5.5 FTE for case
manager positions, 1.0 of 1.0 FTE for family specialist position, and 0.5 of 1.5 FTE for housing specialist
positions. Lack of qualified applicants and a competitive job market were two major barriers. The Assertive
Community Treatment (ACT) team is required to have a low staff to client ratio of 1:10; as a consequence,
the overall HPP enrollment fell short of the target number, at 79%, as of September 30, 2015. Concerted
efforts to recruit qualified service team members are underway.
CoordinationforSystemChange
One of Hawai‘i Pathways Project’s long‐term goals is to develop a Statewide Plan with streamlined policies
and procedures that would improve services for chronically homeless individuals with mental and
substance use disorders. The project has been part of a larger coordinated effort that is being led by the
Hawai‘i Interagency Council on Homelessness (HICH) to address system‐level barriers. However, the project
coordinator position has been vacated since June 2015, which could affect the project’s momentum toward
achieving this goal. The ADAD has been actively recruiting for a replacement and expects to increase the
project’s efforts in addressing system issues once the position is filled again.

Progress Report, Aug 2014‒Sep 2015 21
Appendix1Hawai‘iPathwaysProject:ProgressHighlights,Aug2014‒May2015
Refer to the Progress Report for revised/updated data.
22 Hawai‘i Pathways Project
Progress Report, Aug 2014‒Sep 2015 23
Appendix2Hawai‘iPathwaysProject:ProgressHighlights,Aug2014‒Sep2015
Refer to the Progress Report for revised/updated data.

24 Hawai‘i Pathways Project
Progress Report, Aug 2014‒Sep 2015 25
Appendix3EstimatedHealthcareCostReductionamongHawai‘iPathwaysClientsintheState’sHousingFirstProgram
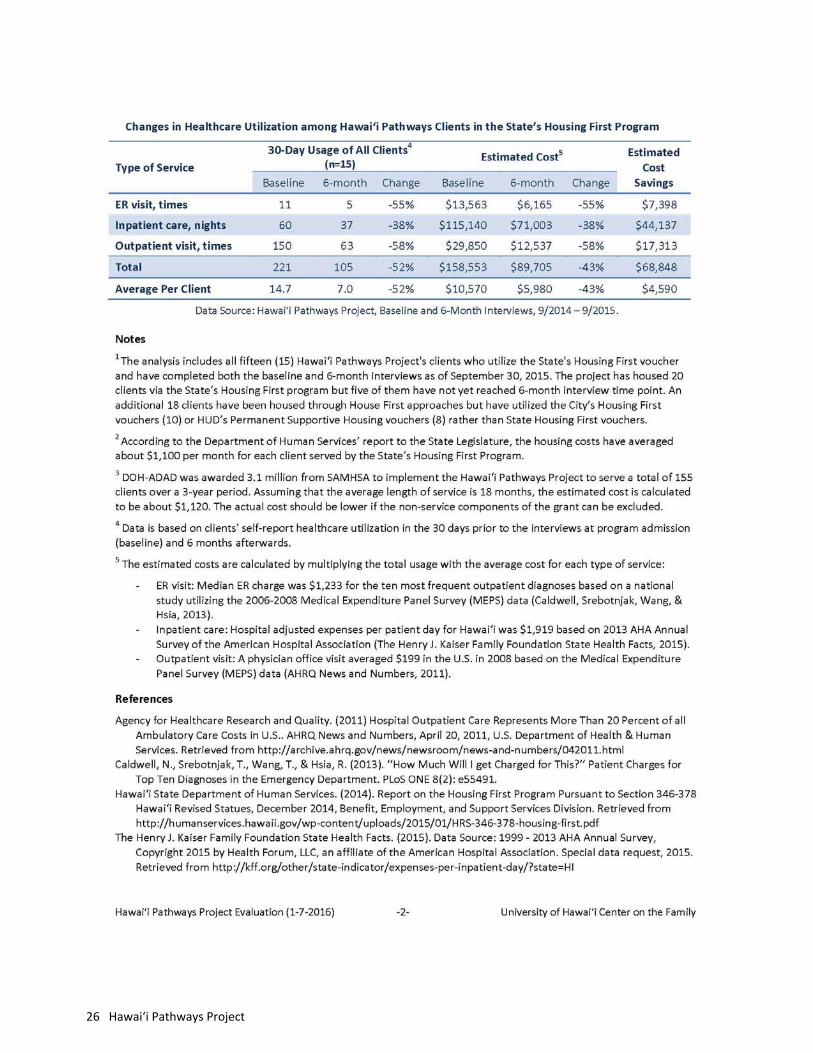
26 Hawai‘i Pathways Project