
Hawaii Employer-Union Health Benefits Trust Fund Retiree ......Jul 01, 2017 · The actuarial...
62
Hawaii Employer-Union Health Benefits Trust Fund Retiree Health Care Plan Aggregate Actuarial Valuation Report as of July 1, 2017
Transcript of Hawaii Employer-Union Health Benefits Trust Fund Retiree ......Jul 01, 2017 · The actuarial...

Hawaii Employer-Union Health Benefits Trust Fund Retiree Health Care Plan Aggregate Actuarial Valuation Report as of July 1, 2017

January 15, 2018 Mr. Derek Mizuno EUTF Administrator Hawaii Employer-Union Health Benefits Trust Fund 201 Merchant St.; Suite 1520 Honolulu, Hawaii 96813 Dear Mr. Mizuno:
Submitted in this report are the results of an actuarial valuation for the Hawaii Employer-Union Health Benefits Trust Fund (EUTF) of the liabilities associated with the employer financed retiree health benefits provided through the EUTF. The date of the valuation was July 1, 2017. The annual required contribution has been calculated for the fiscal year beginning July 1, 2018.
The actuarial calculations were prepared to determine the annual required employer contributions to satisfy the requirements of ACT 268, SLH 2013 (“ACT 268”). Determinations of the liability associated with the benefits described in this report for purposes other than satisfying the funding requirements of ACT 268 may produce significantly different results. This report may be provided to parties other than the EUTF only in its entirety and only with the permission of the EUTF.
The valuation was based upon information, furnished by the EUTF and the Employees’ Retirement System of the State of Hawaii (ERS), concerning retiree health benefits, members’ census and financial data. Data was checked for internal consistency but was not otherwise audited. Future actuarial measurements may differ significantly from the current measurements presented in this report due to such factors as the following: plan experience differing from that anticipated by the economic or demographic assumptions; changes in economic or demographic assumptions; increases or decreases expected as part of the natural operation of the methodology used for these measurements; and changes in plan provisions or applicable law.
The signing actuaries are independent of the plan sponsor. To the best of our knowledge, this report is complete and accurate and was made in accordance with generally recognized actuarial methods. Joseph Newton and Mehdi Riazi are members of the American Academy of Actuaries and meet the Qualification Standards of the Academy of Actuaries to render the actuarial opinion herein.
Respectfully submitted,
Joseph P. Newton, FSA, FCA, EA Lewis Ward Mehdi Riazi, FSA, EA Pension Market Leader Consultant Consultant

Hawaii Employer-Union Health Benefits Trust Fund Retiree Health Care Plan I
Table of Contents
Page Cover Letter Section A Overview ....................................................................................................................... 2
Executive Summary Agent Multiple Employer Plans ACT 268 Actuarial Assumptions and Methods Summary of Changes
Section B Valuation Results .......................................................................................................... 7
Results by Employer Liabilities Plan Assets Projected Benefits Determination of the ARC Schedule of Funding Progress Actuarial Methods and Assumptions Trend Sensitivity
Section C Projections .................................................................................................................. 16
Assuming minimum required under ACT 268 Section D Development of Baseline Costs ................................................................................. 20 Section E Summary of Benefit Provisions.................................................................................. 22 Section F Summary of Participant Data ..................................................................................... 39 Section G Actuarial Assumptions and Methods ........................................................................ 42
Summary of Actuarial Assumptions and Methods Miscellaneous and Technical Assumptions
Appendix A Demographic and Certain Economic Assumptions ................................................... 49
Appendix B Glossary ...................................................................................................................... 58

SECTION A EXECUTIVE SUMMARY
Hawaii Employer-Union Health Benefits Trust Fund Retiree Health Care Plan
Section A
2
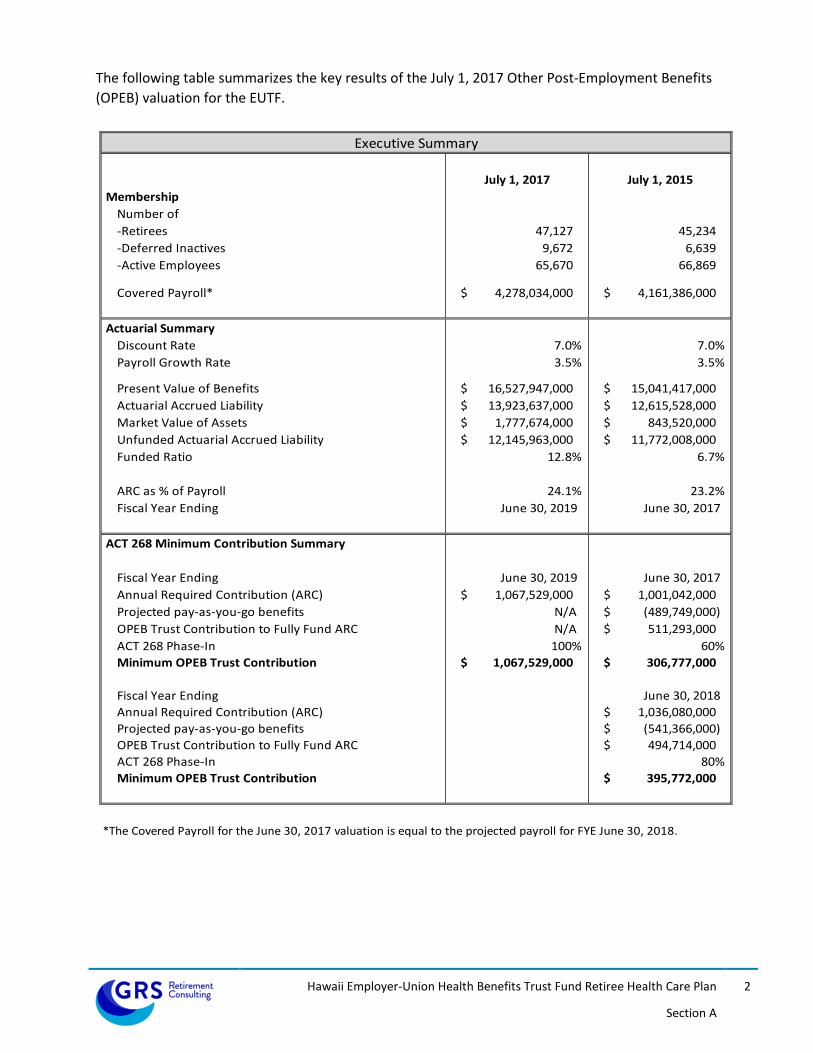
The following table summarizes the key results of the July 1, 2017 Other Post-Employment Benefits (OPEB) valuation for the EUTF.
July 1, 2017 July 1, 2015 Membership
Number of-Retirees 47,127 45,234 -Deferred Inactives 9,672 6,639 -Active Employees 65,670 66,869
Covered Payroll* 4,278,034,000$ 4,161,386,000$
Actuarial SummaryDiscount Rate 7.0% 7.0%Payroll Growth Rate 3.5% 3.5%
Present Value of Benefits 16,527,947,000$ 15,041,417,000$ Actuarial Accrued Liability 13,923,637,000$ 12,615,528,000$ Market Value of Assets 1,777,674,000$ 843,520,000$ Unfunded Actuarial Accrued Liability 12,145,963,000$ 11,772,008,000$ Funded Ratio 12.8% 6.7%
ARC as % of Payroll 24.1% 23.2%Fiscal Year Ending June 30, 2019 June 30, 2017
ACT 268 Minimum Contribution Summary
Fiscal Year Ending June 30, 2019 June 30, 2017Annual Required Contribution (ARC) 1,067,529,000$ 1,001,042,000$ Projected pay-as-you-go benefits N/A (489,749,000)$ OPEB Trust Contribution to Fully Fund ARC N/A 511,293,000$ ACT 268 Phase-In 100% 60%Minimum OPEB Trust Contribution 1,067,529,000$ 306,777,000$
Fiscal Year Ending June 30, 2018Annual Required Contribution (ARC) 1,036,080,000$ Projected pay-as-you-go benefits (541,366,000)$ OPEB Trust Contribution to Fully Fund ARC 494,714,000$ ACT 268 Phase-In 80%Minimum OPEB Trust Contribution 395,772,000$
*The Covered Payroll for the June 30, 2017 valuation is equal to the projected payroll for FYE June 30, 2018.
Executive Summary

Hawaii Employer-Union Health Benefits Trust Fund Retiree Health Care Plan
Section A
3
This report provides the minimum OPEB trust contributions required to satisfy the funding requirements of ACT 268 by the participating employers. The Annual Required Contributions (ARC) developed in this report are for the fiscal years ending June 30, 2019. Subsequently, the contribution determined by each valuation will be applicable for the fiscal year which begins one year after the valuation date. The one year lag between the valuation date and the applicable fiscal year will allow appropriate time for budgeting and management of the appropriations. Prior to July 1, 2017, the EUTF OPEB plan completed actuarial valuation reports biennially. Act 093, SLH 2017, requires the EUTF OPEB plan to complete actuarial valuation reports annually, beginning July 1, 2017. Section C provides a 30-year projection of liability and contribution information which should be useful to management for the operation of the OPEB program.
Agent Multiple-Employer Plans The EUTF OPEB plan operates as an agent multiple-employer plan. For agent multiple employer plans, separate asset accounts are maintained for each employer so that the employer’s contributions provide benefits only for the employees of that employer. A separate actuarial valuation is performed for each individual employer’s plan to determine the employer’s periodic contribution rate and other information for the individual plan. In a cost-sharing arrangement, such as the Employees’ Retirement System of the State of Hawaii (ERS), the plan’s assets can be used to pay the benefits for the retirees of any participating employer. By contrast, the assets of the participating government employers in an agent multiple-employer plan are pooled for investment purposes but separate accounts are maintained for each individual employer. As such, each employer’s assets at EUTF can only be used to pay benefits for that employer’s retirees. Each employer’s unfunded actuarial accrued liability and annual required contribution for retiree health benefits will be determined based solely on that employer’s membership and assets.

Hawaii Employer-Union Health Benefits Trust Fund Retiree Health Care Plan
Section A
4
ACT 268 ACT 304, SLH 2012 (ACT 304), created a separate trust fund (The OPEB Trust), as of June 30, 2013, specifically for pre-funding the participating employers OPEB benefits. Previous pre-funding contributions and related net investment earnings were transferred to each employer’s respective OPEB Trust account. As required by ACT 304, contributions to the OPEB Trust shall be irrevocable and the assets of the fund shall be dedicated exclusively to providing health and other benefits to retirees and their eligible dependents. The assets in the OPEB Trust shall not be subject to appropriation for any other purpose and shall not be subject to claims by creditors of the employers or the board or plan administrator. ACT 268 established an “annual required contribution” (ARC) equal to (a) the normal cost, plus (b) an amortization payment to fund the unfunded actuarial accrued liability over a period of no more than thirty years. Moreover, employers are required to contribute 100% of the ARC starting in fiscal year ending June 30, 2019. ACT 268 established mechanisms for funding the ARC if the employer fails to do so. Full funding of the ARC was phased-in according to the following schedule:
Fiscal Year ARC Phase-in 2014-2015 20% 2015-2016 40% 2016-2017 60% 2017-2018 80% 2018-2019 100%
ACT 268 established a funding policy which ensures the ARC will be consistently met. As a result, the liabilities in this valuation have been calculated using a 7.0% assumed long-term investment return on the OPEB Trust’s assets. The 7.0% return assumption is based on the OPEB Trust’s investment policy and we believe the assumption is consistent with the target asset allocation. Actuarial Assumptions and Methods In any long-term Actuarial Valuation (such as for Pensions and OPEB), certain demographic, economic and behavioral assumptions are made concerning the population, the investment return rates and the benefits provided. These Actuarial Assumptions form the basis for the actuarial model which is used to project the future population, the future benefits provided, and the future contributions collected. Then the investment return rate (discount rate) assumption is used to discount those projected net OPEB benefits to a present value. This and other related present values are used to calculate the Annual Required Contribution.
Hawaii Employer-Union Health Benefits Trust Fund Retiree Health Care Plan
Section A
5
Actuarial Assumptions and Methods (Continued) This Actuarial Valuation is similar to the Actuarial Valuations performed for the State’s pension plans. In fact, the demographic assumptions used in this OPEB Valuation were identical to those used in the June 30, 2015 ERS valuation. Because the assumptions were based upon the most recent actuarial experience study adopted by the Trustees of ERS, they were deemed reasonable for this OPEB Valuation and were employed in this report. There are some economic and behavioral assumptions which are unique to health benefits. It would be instructive to review the Section of this Report titled, “Actuarial Assumptions and Methods” for a detailed discussion and disclosure of all the relevant Actuarial Assumptions used in this Valuation. GASB Statement No. 43 provides an acceptable range of flexibility to governmental employers (and their actuaries) in the use of various actuarial cost methods. The Entry Age Normal Cost Method was used in this valuation. This is both an acceptable and reasonable cost method. Furthermore, the Normal Costs and the amortization of any Unfunded Actuarial Accrued Liabilities were calculated using a level percent of pay. Summary of Changes
The actuarial accrued liability increased from $12.62 billion to $13.92 billion. The increase was less than expected, mainly because of favorable health plan claims experience compared to the prior trend assumption. New demographic and health care assumptions increased the ARC and associated liabilities. The most significant assumption change was to reflect longer life expectancy. However, the favorable claims experience produced savings which offset the impact of the new assumptions. All assumption and method changes since the prior report are discussed in Section G. The market value of assets increased from $0.84 billion to $1.78 billion, primarily due to employer contributions. The funded ratio of the plan, increased from 6.7% to 12.8%. The unfunded actuarial accrued liability increased from $11.77 billion to $12.15 billion. The increase to the unfunded actuarial accrued liability was less than expected, mainly due to favorable claims experience and contributions to the plan which exceeded the minimums required by ACT 268.

SECTION B VALUATION RESULTS
Hawaii Employer-Union Health Benefits Trust Fund Retiree Health Care Plan
Section B
7
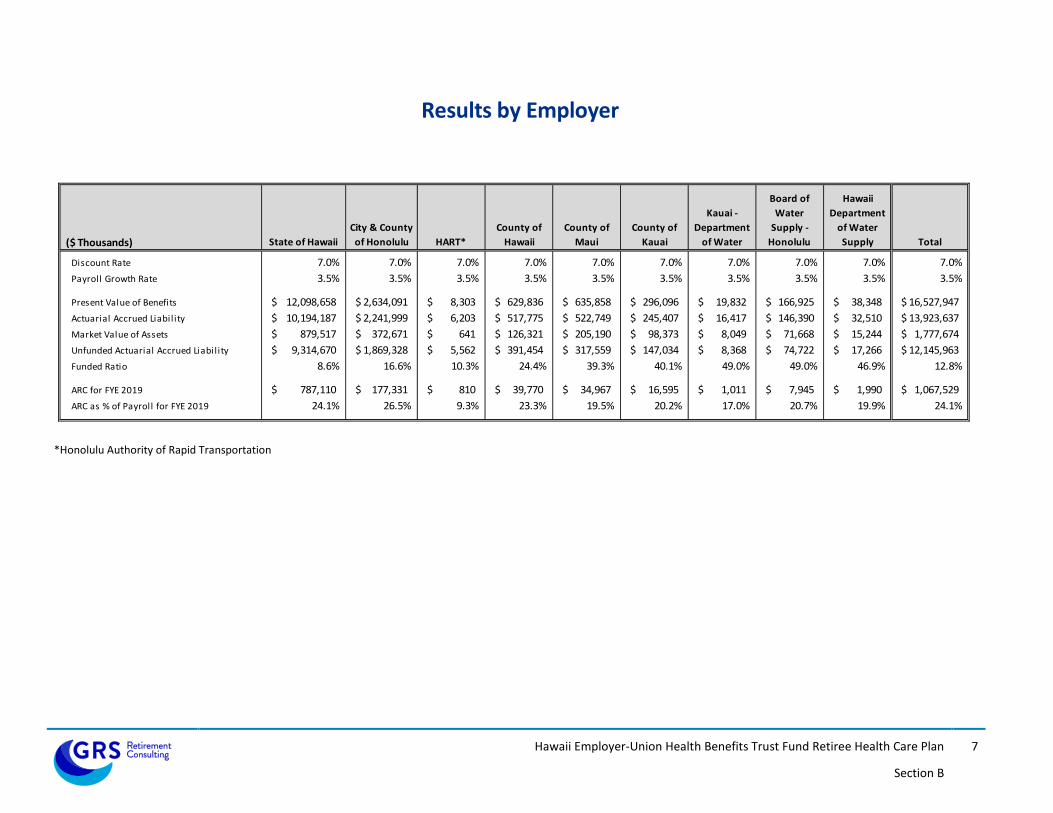
Results by Employer
($ Thousands) State of HawaiiCity & County of Honolulu HART*
County of Hawaii
County of Maui
County of Kauai
Kauai - Department
of Water
Board of Water
Supply - Honolulu
Hawaii Department
of Water Supply Total
Discount Rate 7.0% 7.0% 7.0% 7.0% 7.0% 7.0% 7.0% 7.0% 7.0% 7.0%Payroll Growth Rate 3.5% 3.5% 3.5% 3.5% 3.5% 3.5% 3.5% 3.5% 3.5% 3.5%
Present Value of Benefits 12,098,658$ 2,634,091$ 8,303$ 629,836$ 635,858$ 296,096$ 19,832$ 166,925$ 38,348$ 16,527,947$ Actuarial Accrued Liabil ity 10,194,187$ 2,241,999$ 6,203$ 517,775$ 522,749$ 245,407$ 16,417$ 146,390$ 32,510$ 13,923,637$ Market Value of Assets 879,517$ 372,671$ 641$ 126,321$ 205,190$ 98,373$ 8,049$ 71,668$ 15,244$ 1,777,674$ Unfunded Actuarial Accrued Liabil ity 9,314,670$ 1,869,328$ 5,562$ 391,454$ 317,559$ 147,034$ 8,368$ 74,722$ 17,266$ 12,145,963$ Funded Ratio 8.6% 16.6% 10.3% 24.4% 39.3% 40.1% 49.0% 49.0% 46.9% 12.8%
ARC for FYE 2019 787,110$ 177,331$ 810$ 39,770$ 34,967$ 16,595$ 1,011$ 7,945$ 1,990$ 1,067,529$ ARC as % of Payroll for FYE 2019 24.1% 26.5% 9.3% 23.3% 19.5% 20.2% 17.0% 20.7% 19.9% 24.1%
*Honolulu Authority of Rapid Transportation

Hawaii Employer-Union Health Benefits Trust Fund Retiree Health Care Plan
Section B
8
Liabilities The liabilities shown in the following exhibit were calculated as of July 1, 2017.
Medical/Prescription Drug/Dental/Vision/Life Medicare Part B Total
Present Value of Benefits (PVB)Retirees 5,676,841,000$ 1,325,540,000$ 7,002,381,000$ Deferred Inactives 796,325,000 301,054,000 1,097,379,000 Actives 6,745,828,000 1,682,359,000 8,428,187,000
Total PVB 13,218,994,000$ 3,308,953,000$ 16,527,947,000$ Actuarial Accrued Liability (AAL)
Retirees 5,676,841,000$ 1,325,540,000$ 7,002,381,000$ Deferred Inactives 796,325,000 301,054,000 1,097,379,000 Actives 4,743,330,000 1,080,547,000 5,823,877,000
Total AAL 11,216,496,000$ 2,707,141,000$ 13,923,637,000$ Normal Cost 234,450,000$ 73,915,000$ 308,365,000$
Hawaii Employer-Union Health Benefits Trust Fund Retiree Health Care Plan
Section B
9
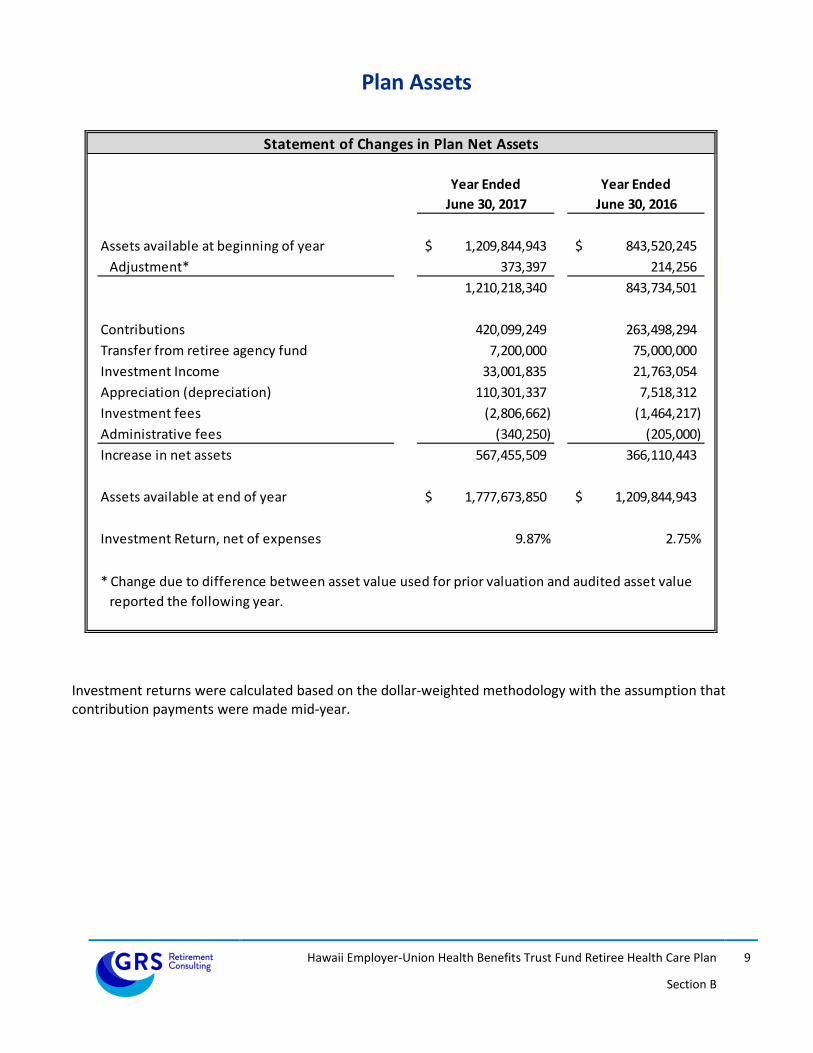
Plan Assets
Year Ended Year EndedJune 30, 2017 June 30, 2016
Assets available at beginning of year 1,209,844,943$ 843,520,245$ Adjustment* 373,397 214,256
1,210,218,340 843,734,501
Contributions 420,099,249 263,498,294Transfer from retiree agency fund 7,200,000 75,000,000Investment Income 33,001,835 21,763,054Appreciation (depreciation) 110,301,337 7,518,312Investment fees (2,806,662) (1,464,217)Administrative fees (340,250) (205,000)Increase in net assets 567,455,509 366,110,443
Assets available at end of year 1,777,673,850$ 1,209,844,943$
Investment Return, net of expenses 9.87% 2.75%
Statement of Changes in Plan Net Assets
* Change due to difference between asset value used for prior valuation and audited asset value reported the following year.
Investment returns were calculated based on the dollar-weighted methodology with the assumption that contribution payments were made mid-year.

Hawaii Employer-Union Health Benefits Trust Fund Retiree Health Care Plan
Section B
10
Projected Benefits The table below provides the EUTF’s estimated benefit payments (“pay-as-you-go”) for the 15 years following the valuation date.
Year EndingJune 30,
Medical/Prescription Drug/Dental/Vision/Life Medicare Part B Total
2018 407,780,000$ 79,200,000$ 486,980,000$ 2019 433,175,000 93,369,000 526,544,000 2020 468,052,000 101,616,000 569,668,000 2021 509,259,000 110,526,000 619,785,000 2022 554,442,000 119,835,000 674,277,000 2023 599,931,000 129,546,000 729,477,000 2024 646,741,000 139,838,000 786,579,000 2025 696,079,000 150,755,000 846,834,000 2026 746,123,000 162,263,000 908,386,000 2027 797,786,000 174,253,000 972,039,000 2028 850,159,000 186,789,000 1,036,948,000 2029 902,477,000 199,787,000 1,102,264,000 2030 952,105,000 213,630,000 1,165,735,000 2031 1,000,559,000 228,056,000 1,228,615,000 2032 1,049,209,000 242,632,000 1,291,841,000
Projected Benefit Payments

Hawaii Employer-Union Health Benefits Trust Fund Retiree Health Care Plan
Section B
11
Determination of the ARC Entry Age Normal Cost Actuarial Method
FYE 6/30/2019Discount Rate Used 7.0%
Normal Cost* 319,523,000$ Amortization of UAAL 748,006,000$ Total ARC 1,067,529,000$ % Payroll 24.1% *Includes plan administration fees.
The Annual Required Contribution is equal to the Normal Cost, the present value of benefits earned by the current employees in the respective fiscal year, plus an amortization payment to fund the liability attributable to past service. The table above provides the combined ARC for all participating employers. It is important to keep in mind that each participating employer is responsible for the amount that they contribute towards their own ARC.

Hawaii Employer-Union Health Benefits Trust Fund Retiree Health Care Plan
Section B
12
Schedule of Funding Progress
Valuation Date
Actuarial Value of Assets
(a)
Actuarial Accrued Liability (AAL)
(b)Unfunded AAL
(b) - (a)Funded Ratio
(a)/(b)Covered Payroll
(c)
Unfunded AAL as a % of Covered
Payroll(b - a)/(c)
July 1, 2007 0$ 9,194,300,000$ 9,194,300,000$ 0.0% 2,789,000,000$ 329.7%July 1, 2009 115,500,000$ 14,662,100,000$ 14,546,600,000$ 0.8% 2,758,000,000$ 527.4%July 1, 2011 178,200,000$ 16,458,800,000$ 16,280,600,000$ 1.1% 3,743,000,000$ 435.0%July 1, 2013 296,124,000$ 11,477,633,000$ 11,181,509,000$ 2.6% 3,881,223,000$ 288.1%July 1, 2015 843,520,000$ 12,615,528,000$ 11,772,008,000$ 6.7% 4,161,386,000$ 282.9%July 1, 2017 1,777,674,000$ 13,923,637,000$ 12,145,963,000$ 12.8% 4,278,034,000$ 283.9%
As a result of ACT 268's funding requirements, the discount rate was changed from 4.00% to 7.00% in the July 1, 2013 valuation for the State of Hawaii. The discount rate remained at 7.00% for the other participating employers.New demographic and healthcare assumptions were adopted in the July 1, 2017 valuation. The most significant assumption change was to reflect longer life expectancy.

Hawaii Employer-Union Health Benefits Trust Fund Retiree Health Care Plan
Section B
13
Actuarial Methods and Assumptions
Inflation rate 2.50%Investment rate of return 7.00%Actuarial Cost method Entry Age NormalAmortization method* Level percent, closedPayroll Growth 3.50%Asset Method MarketMortality
Participation Rates
Healthcare cost trend ratePPO**
HMO**
Part B & Base Monthly Contribution (BMC)
Dental 3.50%Vision 2.50%Life Insurance 0.00%
* Closed bases are established at each valuation for new unfunded liabilities.** Includes prescription drug assumptions.
Initial rates of 6.60%, 6.60% and 9.00%; declining to a rate of 4.86% after 14 yearsInitial rate of 9.00%; declining to a rate of 4.86% after 14 yearsInitial rates of 2.00% and 5.00%; declining to a rate of 4.70% after 14 years
98% healthcare participation assumption for retirees that receive 100% of the Base Monthly Contribution (BMC). Healthcare participation rates of 25%, 65%, and 90% for retirees that receive 0%, 50%, or 75% of the base monthly contribution, respectively. 100% for Life Insurance and 98% for Medicare Part B
System-specific mortality tables utilizing scale BB to project generational mortality improvement

Hawaii Employer-Union Health Benefits Trust Fund Retiree Health Care Plan
Section B
14
Trend Sensitivity
Actuarial valuations are based on the cost of benefits to be paid in the future. The payments considered will range from one month in the future to decades from the valuation date. When the benefits being valued are health benefits, a key factor is the future cost of the health benefits being promised. The future benefits are projected using the current cost of the health care benefits and assumed future health care cost increases. The final cost of providing retiree health care benefits will depend upon how the charges for health care services actually increase in the future. In order to demonstrate how the cost of these benefits can vary depending upon future health care cost increases, we have performed additional valuations based upon alternative health care cost increase assumptions. The following table shows the impact of a 1.0% increase or decrease in the assumed healthcare trend rates.
-1% Trend Baseline +1% TrendPresent Value of Benefits (PVB) 14,011,158,000$ 16,527,947,000$ 19,794,524,000$
Funded StatusActuarial Accrued Liability 12,032,229,000$ 13,923,637,000$ 16,310,494,000$ Assets 1,777,674,000 1,777,674,000 1,777,674,000 Unfunded AAL 10,254,555,000 12,145,963,000 14,532,820,000
ARC for FYE19 880,036,000$ 1,067,529,000$ 1,297,440,000$

SECTION C PROJECTIONS

Hawaii Employer-Union Health Benefits Trust Fund Retiree Health Care Plan
Section C
16
Summary of Funding Projections The projection in this section provides estimated future liabilities, assets, contributions and benefit payments based on the data used for the July 1, 2017 valuation and the actuarial assumptions/methods described in Section G of this report. The projections provide insight into how the employers’ contributions and the financial condition of the plan are assumed to change over time. Key items from the projections are:
• Prefunding the OPEB liability will require a significant commitment. However, the long-term savings will also be significant. Once the plan is well funded, the percentage of the benefits paid for by investment earnings is typically over 50%.
• The Annual Required Contribution (ARC) is developed using a level percentage of payroll amortization. Said another way, the ARC is assumed to grow at the same rate as payroll, 3.50%.
• The ARC is expected to remain level, as a percentage of payroll, until the initial amortization bases are paid off. • The projection assumes the employers will phase into the full ARC by paying the minimum amount required by ACT 268. • The employers’ annual costs, on a combined basis, for financing the retiree health benefit become less than what they would have been
under a pay-as-you-go approach starting in FYE2045. • Upcoming changes to the accounting rules will require employers to recognize a balance sheet liability similar to the Unfunded Actuarial
Accrued Liability (UAAL). Currently, the balance sheet liability is equal to the Net OPEB Obligation. • The projections include liabilities for future employees. However, the total number of active employees is assumed to remain level. • The projection provides estimated future results for the combined status of the plan. It is important to keep in mind that each participating
employer is responsible for the amount that they contribute towards their own ARC.
Please bear in mind that, depending on plan experience, actual results could deviate significantly from the actuarial projections. The key assumptions in the projections are:
1. the assumed 7.00% rate of investment return 2. future health care inflation 3. that the benefits and cost sharing provisions will remain the same as they currently are

Hawaii Employer-Union Health Benefits Trust Fund Retiree Health Care Plan
Section C
17
Fiscal Actuarial Beginning Unfunded Annual Contribution Benefit Benefits AdditionalYear Accrued Liability of Year AAL Funded Required Actual as % of Payment as % of Cost of
Ending Payroll (AAL) Assets (UAAL) Ratio Contribution Contribution Payroll Total Payroll Prefunding(a) (b) (c) (d) (e) (f) (g) (h) (i) (j) (k) (l)
2018 4,278,034,000$ 13,923,637,000$ 1,777,674,000$ 12,145,963,000$ 12.8% 1,036,080,000$ 882,752,000$ 20.6% 486,980,000$ 11.4% 395,772,000$ 2019 4,427,765,000 14,713,531,000 2,311,137,000 12,402,394,000 15.7% 1,067,529,000 1,067,529,000 24.1% 526,544,000 11.9% 540,985,000 2020 4,582,737,000 15,528,957,000 3,032,140,000 12,496,817,000 19.5% 1,110,497,000 1,110,497,000 24.2% 569,668,000 12.4% 540,829,000 2021 4,743,132,000 16,365,507,000 3,803,438,000 12,562,069,000 23.2% 1,149,423,000 1,149,423,000 24.2% 619,785,000 13.1% 529,638,000 2022 4,909,142,000 17,220,688,000 4,617,137,000 12,603,551,000 26.8% 1,190,340,000 1,190,340,000 24.2% 674,277,000 13.7% 516,063,000 2023 5,080,962,000 18,092,351,000 5,473,738,000 12,618,613,000 30.3% 1,233,128,000 1,233,128,000 24.3% 729,477,000 14.4% 503,651,000 2024 5,258,795,000 18,981,826,000 6,377,446,000 12,604,380,000 33.6% 1,277,869,000 1,277,869,000 24.3% 786,579,000 15.0% 491,290,000 2025 5,442,853,000 19,889,346,000 7,331,614,000 12,557,732,000 36.9% 1,324,594,000 1,324,594,000 24.3% 846,834,000 15.6% 477,760,000 2026 5,633,352,000 20,813,868,000 8,338,561,000 12,475,307,000 40.1% 1,373,348,000 1,373,348,000 24.4% 908,386,000 16.1% 464,962,000 2027 5,830,522,000 21,756,203,000 9,402,743,000 12,353,460,000 43.2% 1,424,236,000 1,424,236,000 24.4% 972,039,000 16.7% 452,197,000 2028 6,034,589,000 22,716,450,000 10,528,193,000 12,188,257,000 46.3% 1,477,286,000 1,477,286,000 24.5% 1,036,948,000 17.2% 440,338,000 2029 6,245,799,000 23,695,584,000 11,720,144,000 11,975,440,000 49.5% 1,532,706,000 1,532,706,000 24.5% 1,102,264,000 17.6% 430,442,000 2030 6,464,404,000 24,695,697,000 12,985,272,000 11,710,425,000 52.6% 1,590,553,000 1,590,553,000 24.6% 1,165,735,000 18.0% 424,818,000 2031 6,690,656,000 25,721,365,000 14,333,125,000 11,388,240,000 55.7% 1,650,870,000 1,650,870,000 24.7% 1,228,615,000 18.4% 422,255,000 2032 6,924,831,000 26,776,186,000 15,772,660,000 11,003,526,000 58.9% 1,713,818,000 1,713,818,000 24.7% 1,291,841,000 18.7% 421,977,000 2033 7,167,198,000 27,863,175,000 17,312,654,000 10,550,521,000 62.1% 1,779,598,000 1,779,598,000 24.8% 1,355,625,000 18.9% 423,973,000 2034 7,418,051,000 28,985,487,000 18,962,493,000 10,022,994,000 65.4% 1,848,254,000 1,848,254,000 24.9% 1,418,265,000 19.1% 429,989,000 2035 7,677,682,000 30,148,248,000 20,734,021,000 9,414,227,000 68.8% 1,919,834,000 1,919,834,000 25.0% 1,479,745,000 19.3% 440,089,000 2036 7,946,402,000 31,356,964,000 22,639,982,000 8,716,982,000 72.2% 1,994,491,000 1,994,491,000 25.1% 1,539,817,000 19.4% 454,674,000 2037 8,224,524,000 32,617,884,000 24,694,421,000 7,923,463,000 75.7% 2,072,334,000 2,072,334,000 25.2% 1,601,837,000 19.5% 470,497,000 2038 8,512,384,000 33,934,279,000 26,909,016,000 7,025,263,000 79.3% 1,846,252,000 1,846,252,000 21.7% 1,666,151,000 19.6% 180,101,000 2039 8,810,318,000 35,309,284,000 28,978,219,000 6,331,065,000 82.1% 1,919,869,000 1,919,869,000 21.8% 1,731,287,000 19.7% 188,582,000 2040 9,118,679,000 36,747,776,000 31,201,015,000 5,546,761,000 84.9% 1,996,538,000 1,996,538,000 21.9% 1,797,229,000 19.7% 199,309,000 2041 9,437,832,000 38,255,075,000 33,590,476,000 4,664,599,000 87.8% 2,030,348,000 2,030,348,000 21.5% 1,864,427,000 19.8% 165,921,000 2042 9,768,156,000 39,836,442,000 36,112,636,000 3,723,806,000 90.7% 2,111,836,000 2,111,836,000 21.6% 1,931,705,000 19.8% 180,131,000 2043 10,110,042,000 41,498,822,000 38,826,018,000 2,672,804,000 93.6% 2,196,280,000 2,196,280,000 21.7% 1,999,450,000 19.8% 196,830,000 2044 10,463,892,000 43,249,222,000 41,746,580,000 1,502,642,000 96.5% 2,284,407,000 2,284,407,000 21.8% 2,069,224,000 19.8% 215,183,000 2045 10,830,129,000 45,093,603,000 44,890,536,000 203,067,000 99.5% 1,030,987,000 1,030,987,000 9.5% 2,140,527,000 19.8% (1,109,540,000) 2046 11,209,184,000 47,038,951,000 46,884,234,000 154,717,000 99.7% 1,079,271,000 1,079,271,000 9.6% 2,212,876,000 19.7% (1,133,605,000) 2047 11,601,505,000 49,093,362,000 48,992,565,000 100,797,000 99.8% 1,107,875,000 1,107,875,000 9.5% 2,286,951,000 19.7% (1,179,076,000) 2048 12,007,558,000 51,264,925,000 51,201,412,000 63,513,000 99.9% 1,159,803,000 1,159,803,000 9.7% 2,364,087,000 19.7% (1,204,284,000) 2049 12,427,822,000 53,560,833,000 53,538,768,000 22,065,000 100.0% 1,191,126,000 1,191,126,000 9.6% 2,444,540,000 19.7% (1,253,414,000)
The projection assumes a constant workforce.
Minimum Contribution Required by ACT 268

Hawaii Employer-Union Health Benefits Trust Fund Retiree Health Care Plan
Section C
18
Minimum Contribution Required by ACT 268 Trust contribution is less than benefits paid starting in fiscal year ending June 30, 2045
0.00%
5.00%
10.00%
15.00%
20.00%
25.00%
30.00%
35.00%
$0
$2
$4
$6
$8
$10
$12
$14
$16
2019 2021 2023 2025 2027 2029 2031 2033 2035 2037 2039 2041 2043 2045 2047 2049
ACT 268 Minimum
and Pay-GoCosts
as % of Payroll
UnfundedActuarialAccruedLiability(UAAL)
$ billions
Year
UAAL Pay-Go ACT 268 Min

SECTION D DEVELOPMENT OF BASELINE COSTS

Hawaii Employer-Union Health Benefits Trust Fund Retiree Health Care Plan
Section D
20
Development of Baseline Costs
The underlying retiree claims costs were estimated using the plan premiums effective January 1, 2018, and are used for both current and future retirees. An inherent assumption in this methodology is that the projected future retirees will have a similar distribution by plan type as the current retirees (82% PPO and 18% HMO). The fully-insured retiree plans are separate from the active plans and are underwritten using the claims experience of the retired members only. The contracts for the retiree plans do not allow for any cross subsidization of premiums or rates. The prescription drug benefit for the PPO plan is self-insured. Based on conversations with EUTF’s health care consultant (Segal), we did not believe it was necessary to independently verify the premiums for the PPO prescription drug benefit. The estimated age-adjusted claims shown below include administration fees and are net of prescription drug rebates. Age-graded and sex-distinct premiums are utilized by this valuation. These costs are appropriate for the unique age and sex distribution currently existing. Over the future years covered by this valuation, the age and sex distribution will most likely change. Therefore, our process “distributes” the average premium over all age/sex combinations and assigns a unique premium for each combination. The age/sex specific costs more accurately reflect the health care utilization and cost at that age.
Baseline Costs for Retirees and Spouses (Medical and Prescription Drug)
(Expected Monthly Per Capita Costs for 2018) HMSA Kaiser
Age Male Female Male Female 50 $402.47 $495.81 $470.48 $579.58 55 529.61 578.25 619.09 675.96 60 684.02 673.52 799.59 787.32
65 345.86 326.22 419.21 395.40 70 376.77 364.58 456.67 441.90 75 404.66 394.85 490.48 478.60 80 424.81 417.38 514.90 505.90
Dental and vision benefits are not included in the age-adjusted benefits shown above. The underlying claims for the dental and vision benefits were not age-rated. Premiums for all medical, prescription drug, dental, and vision plans are shown in Section E.

SECTION E SUMMARY OF BENEFIT PROVISIONS

Hawaii Employer-Union Health Benefits Trust Fund Retiree Health Care Plan
Section E
22
Summary of the Substantive Plan Provisions Plan Participants Plan participants are retired members of the employees’ retirement system; the county pension system; or the police, firefighters, or bandsmen pension system of the State or county.
Base Monthly Contribution Amount
January 1, 2018 - Base Monthly Contribution Self Two-Party Family Non-Medicare $940.70 $1,896.14 $2,775.20 Medicare 670.12 1,343.12 1,956.24
The Base Monthly Contribution (BMC) determines the maximum amount provided by the employer to cover premiums for medical, prescription drug, dental and vision care. The BMC is adjusted annually based on the change in the Medicare Part B premium. The employer’s costs for providing the Medicare Part B premium reimbursement and the life insurance benefit are in addition to the contribution related to the BMC.
Deferred Retirement Employees who terminate employment are eligible for retiree health care benefits upon commencing a retirement or pension allowance.
Disability Retirement Employees who terminate due to disability are eligible for retiree health care benefits upon commencing a retirement or pension allowance.
Non-Duty Death in Service Retirement If an active employee dies while in service and is eligible to retire at the time of death, the ERS will retire the employee and the surviving spouse, domestic or civil union partner and eligible dependents are eligible for retiree health care benefits. If the member was not eligible for retirement at the time of death, the surviving spouse, domestic or civil union partner and eligible dependents are eligible for COBRA benefits only.
Duty Death in Service Retirement The surviving spouse, domestic or civil union partner and eligible dependents of an employee who is killed in the performance of the employee’s duty are eligible for retiree health care benefits. Regardless of the employee’s date of hire or years of service, the employer will pay up to the BMC for a spouse, domestic or civil union partner and eligible dependents of an employee who is killed in the performance of duty. Coverage ends when the surviving spouse or domestic or civil union partner remarries or enters into another domestic or civil union partnership or when the surviving child reaches age 19 or 24 if the child is a full-time student.

Hawaii Employer-Union Health Benefits Trust Fund Retiree Health Care Plan
Section E
23
Surviving Spouses of Retired Employees The employer's contribution percentage for a surviving spouse, domestic or civil union partner and eligible dependent of a retiree who was hired prior to July 1, 2001 will remain the same as the deceased retiree. For a surviving spouse, domestic or civil union partner and eligible dependent of a retiree who was hired after June 30, 2001, the employer's contribution percentage will be half of the deceased retirees' employer contribution percentage.
Life Insurance Retiree life insurance benefit is $2,235 as of July 1, 2017, and is provided at no cost to the retiree.
Medicare Part B Reimbursement Retirees and spouse/domestic and civil union partners are required to enroll in Medicare Part B coverage when they become eligible and enroll in a medical and/or prescription drug plan. The employer reimburses the Part B premium for both retiree and spouse/domestic or civil union partner at 100%. Surviving spouses/domestic or civil union partners, regardless of hire date, continue to receive the Part B reimbursement. The 2018 Medicare Part B premiums vary for current retirees due to the hold harmless provisions. The 2018 Part B premium is $134.00 per month for retirees enrolling in Part B for the first time or not enrolled in Social Security. EUTF will reimburse the entire Part B premium for retirees who pay income adjusted Part B premiums if they submit proof.
Employer’s Contribution The Employer’s percentage of the BMC for the year determines the maximum employer contribution payable. Any difference between the maximum employer contribution and the total premium for plans selected (medical, prescription drug, dental and vision) will be paid by the retiree.
Hire Date Year of Service % of BMC* Before < 10 50% 7/1/1996 10+ 100% Post < 10 0% 7/1/1996 10-14 50%
15-24 75% 25+ 100%
* Employees hired after 6/30/2001 only receive the % of the “Self” BMC.

Hawaii Employer-Union Health Benefits Trust Fund Retiree Health Care Plan
Section E
24
EUTF Monthly Retiree Rates Effective January 1, 2018 through December 31, 2018
Benefit Plan Type of Enrollment
Total Contribution Required
MEDICAL AND PRESCRIPTION DRUG PLANS - MEDICARE Self $234.22 HMSA 90/10 PPO Medical Plan Two-Party $456.38 Family $676.56
Self $164.80 SilverScript Prescription Drug Plan Two-Party $320.90 Family $475.80
Self $483.16 Kaiser Senior Advantage Medical and Prescription Drug Plan Two-Party $942.16
Family $1,396.24
MEDICAL AND PRESCRIPTION DRUG PLANS - NON-MEDICARE Self $520.18 HMSA 90/10 PPO Medical Plan Two-Party $1,013.62 Family $1,502.68
Self $181.50 CVS Caremark Prescription Drug Plan Two-Party $353.50 Family 524.12
Self $797.76 Kaiser HMO Comprehensive Medical and Prescription Drug Plan Two-Party $1,611.44
Family $2,377.30
DENTAL PLAN Self $39.48 HDS Dental Two-Party $77.04 Family $94.38
VISION PLAN Self $4.96 VSP Vision Two-Party $9.94 Family $13.34
LIFE INSURANCE USAble Life Insurance (Retiree only) Self $4.12

Hawaii Employer-Union Health Benefits Trust Fund Retiree Health Care Plan
Section E
25
HSTA VB Monthly Retiree Rates Effective January 1, 2018 through December 31, 2018
Benefit Plan Type of Enrollment
Total Contribution Required
MEDICAL AND PRESCRIPTION DRUG PLANS - MEDICARE Self $398.10 HMSA 90/10 PPO Medical and Chiropractic, SilverScript Two-Party $776.00 Prescription Drug, and VSP Vision Plans Family $1,147.60
Self $496.00 Kaiser Senior Advantage Medical, Chiropractic and Prescription Two-Party $967.38 Drug, and VSP Vision Plans Family $1,432.32
MEDICAL AND PRESCRIPTION DRUG PLANS - NON-MEDICARE Self $631.20 HMSA 90/10 PPO Medical and Chiropractic, CVS Caremark Two-Party $1,230.04 Prescription Drug, and VSP Vision Plans Family $1,820.74
Self $787.56 Kaiser HMO Comprehensive Medical, Chiropractic and Two-Party $1,591.20 Prescription Drug, and VSP Vision Plans Family $2,346.10
DENTAL PLAN Self $47.52 HDS Dental Two-Party $92.52 Family $113.44
VISION PLAN Self $4.96 VSP Vision Two-Party $9.94 Family $13.34
LIFE INSURANCE USAble Life Insurance (Retiree only) Self $4.12

Hawaii Employer-Union Health Benefits Trust Fund Retiree Health Care Plan
Section E
26
Medical Plan Benefits - EUTF Non-Medicare Retirees
Plan Benefits HMSA 90/10 PPO Kaiser HMO
General
Calendar Year Deductible Single/Family $100 per person
Maximum $300 per family None/None
Calendar Year Out-of-pocket limit Single/Family
$2,500 per person Maximum $7,500 per family
$2,000 per person Maximum $6,000 per family
Lifetime Benefit Maximum None None
In-Network Out-of-Network Physician Services
Primary Care Office Visit 10%* 30% $15
Specialist Office Visit 10%* 30% $15 Annual Wellness Exams (Covered under Medicare for Dependents with Medicare) No Charge No Charge No Charge
Annual Physical Exams No Charge* 30%* No Charge
Mammography 20%* 30%* No Charge (If Preventative)
Second opinion – surgery 10%* 30% $15
Emergency Room (ER care) 10%* 10%* $50 in area / 20% out
Ambulance 20% 30% 20%
Inpatient Hospital Services
Hospital Room & Board 10%* 30% No Charge
Ancillary Services 10%* 30% No Charge
Physician services 10%* 30% No Charge
Surgery 10%* (Cutting) 30% No Charge
Anesthesia 10%* 30% No Charge
Mental Health Care 10%* 30% No Charge
Outpatient Services
Chemotherapy 20% 30% $15
Radiation Therapy 20%* 30% $15
Surgery 10%* (Cutting) 30% $15
Allergy Testing 20% 30% $15
Other Diag. Lab, X-ray & Psych Testing 20%* 30% $15
Anesthesia 10%* 30% $15
Mental Health Care 10%* 30% $15
Other Services
Durable Medical Equipment 20% 30% 20%
Home Health care No Charge*; 150 visits per year
30%; 150 visits per year No Charge
Hospice Care No Charge* Not Covered No Charge
Nursing facility - skilled care 10%*,
120 days per year 30%,
120 days per year No Charge,
100 days per benefit period
Physical & Occupational Therapy 20% 30% $15
* Deductible does not apply
Hawaii Employer-Union Health Benefits Trust Fund Retiree Health Care Plan
Section E
27
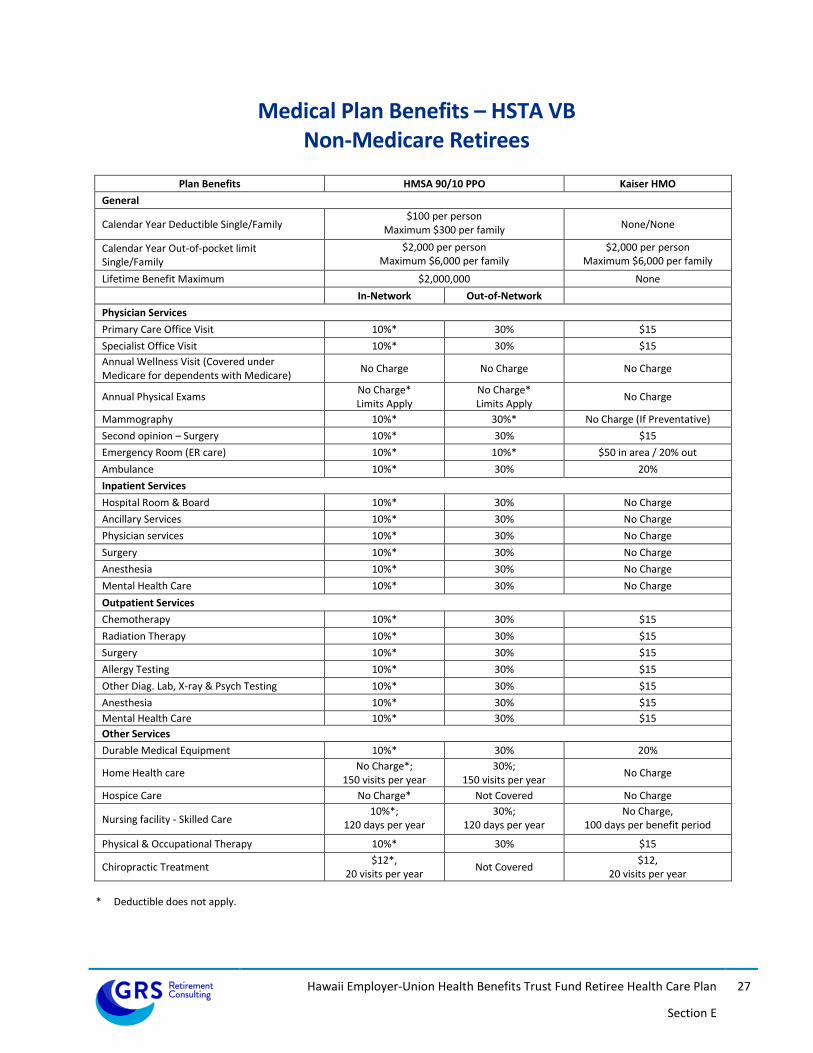
Medical Plan Benefits – HSTA VB Non-Medicare Retirees
Plan Benefits HMSA 90/10 PPO Kaiser HMO
General
Calendar Year Deductible Single/Family $100 per person
Maximum $300 per family None/None
Calendar Year Out-of-pocket limit Single/Family
$2,000 per person Maximum $6,000 per family
$2,000 per person Maximum $6,000 per family
Lifetime Benefit Maximum $2,000,000 None In-Network Out-of-Network Physician Services Primary Care Office Visit 10%* 30% $15 Specialist Office Visit 10%* 30% $15 Annual Wellness Visit (Covered under Medicare for dependents with Medicare) No Charge No Charge No Charge
Annual Physical Exams No Charge* Limits Apply
No Charge* Limits Apply No Charge
Mammography 10%* 30%* No Charge (If Preventative) Second opinion – Surgery 10%* 30% $15 Emergency Room (ER care) 10%* 10%* $50 in area / 20% out Ambulance 10%* 30% 20% Inpatient Services Hospital Room & Board 10%* 30% No Charge Ancillary Services 10%* 30% No Charge Physician services 10%* 30% No Charge Surgery 10%* 30% No Charge Anesthesia 10%* 30% No Charge Mental Health Care 10%* 30% No Charge Outpatient Services Chemotherapy 10%* 30% $15 Radiation Therapy 10%* 30% $15 Surgery 10%* 30% $15 Allergy Testing 10%* 30% $15 Other Diag. Lab, X-ray & Psych Testing 10%* 30% $15 Anesthesia 10%* 30% $15 Mental Health Care 10%* 30% $15 Other Services Durable Medical Equipment 10%* 30% 20%
Home Health care No Charge*; 150 visits per year
30%; 150 visits per year No Charge
Hospice Care No Charge* Not Covered No Charge
Nursing facility - Skilled Care 10%*;
120 days per year 30%;
120 days per year No Charge,
100 days per benefit period
Physical & Occupational Therapy 10%* 30% $15
Chiropractic Treatment $12*, 20 visits per year Not Covered $12,
20 visits per year
* Deductible does not apply.

Hawaii Employer-Union Health Benefits Trust Fund Retiree Health Care Plan
Section E
28
Prescription Drug Plan Benefits – EUTF Non-Medicare Retirees
Plan Benefits CVS PPO*
Kaiser HMO
CVS In-Network Pharmacy COPAYMENT
Out-of-Network Pharmacy** COPAYMENT
Kaiser Pharmacy COPAYMENT
Retail
Maintenance Medication Must be filled in a 90 day supply after the first 3-30 day initial fills+ Same as Generic and Brand
Day Supply 30 DAYS 60 DAYS 90 DAYS 30 DAYS 60 DAYS 90 DAYS 30 DAYS 90 DAYS
Generic $5 $10 $15 $5 + 20%
$10 + 20%
$15 + 20% $15 $30
Mail Order
Preferred Brand $15 $30 $45 $15 + 20%
$30 + 20%
$45 + 20% $15 $30
Mail Order
Non-Preferred Brand $30 $60 $90 $30 + 20%
$60 + 20%
$90 + 20% $15 $30
Mail Order
Specialty Drugs & Injectables
20% of eligible charges; Up to $250 maximum per prescription fill; $2,000 out-of-pocket maximum per calendar year; $30 copay oral oncology specialty
medications. Specialty drugs are not available through mail-order and only dispensed up to a 30-day supply.
Injectable Drugs: 30 days: $15 not available through
mail order. Eligible Specialty Drugs:
30 days: $15
Diabetic Supplies
Preferred Insulin $5 $10 $15 $5 + 20%
$10 + 20%
$15 + 20% $15
Not available thru mail
order
Other Insulin $15 $30 $45 $15 + 20%
$30 + 20%
$45 + 20% $15
Not available thru mail
order
Preferred Diabetic Supplies No Copayment $0 + 20% $15 $30 Mail Order
Other Diabetic Supplies $15 $30 $45 $15 + 20%
$30 + 20%
$45 + 20% $15 $30 Mail
Order Retail 90 & Mail Order
Day Supply 90 DAYS
*This plan is the prescription drug coverage for the HMSA PPO medical plan option and is administered by CVS
Caremark **If you receive services from a non-participating (out-of-
network) pharmacy you will pay full price for the prescription and must file a claim for reimbursement. You
are responsible for the copayment (including the penalty %) and any difference between the actual charge and the
eligible charge. +Notes: Maintenance medication can be filled through
mail-order or at any retail network pharmacy.
Generic $10
Preferred Brand $30
Non-Preferred Brand $60
Preferred Insulin $10
Other Insulin $30
Preferred Diabetic Supplies No Copayment
Other Diabetic Supplies $30

Hawaii Employer-Union Health Benefits Trust Fund Retiree Health Care Plan
Section E
29
Prescription Drug Plan Benefits – HSTA VB Non-Medicare Retirees
Plan Benefits CVS PPO* Kaiser HMO
CVS In-Network Retail Pharmacy
COPAYMENT
Out-of-Network Retail Pharmacy** COPAYMENT
Kaiser Pharmacy
COPAYMENT
Retail & Mail Order
Day Supply 30 DAYS 60 DAYS 90 DAYS 30 DAYS 60 DAYS 90 DAYS 30 DAYS 90 DAYS
Generic $5 $9 $9 $5 + 30%
$9 + 30%
$9 + 30% $10 $20
Mail Order
All Covered Brand Name $15 $27 $27 $15 + 30%
$27 + 30%
$27 + 30% $10 $20
Mail Order
Specialty Drugs & Injectables Specialty medications are subject to the applicable
Generic/Brand copayment. Specialty drugs are not available through mail-order and only dispensed up to a 30-day supply
Injectables: 30 days: $10 Not available through
mail-order Eligible Specialty Drugs:
30 days: $10
Diabetic Supplies
Insulin $5 $9 $9 $5 + 30%
$9 + 30%
$9 + 30% $10
Not available through
mail order
Lancets, Strips & Meters No Copayment 50%
* This plan is the prescription drug coverage for the HMSA PPO medical plan options and is administered by CVS Caremark.
** If you receive services from a non-participating (out-of-network) pharmacy you will pay full price for the prescription and must file
a claim for reimbursement. You are responsible for the copayment (including the penalty %) and any difference between the
actual charge and the eligible charge.
Note: Maintenance medication can be filled through mail-order or at any retail network pharmacy.
Hawaii Employer-Union Health Benefits Trust Fund Retiree Health Care Plan
Section E
30
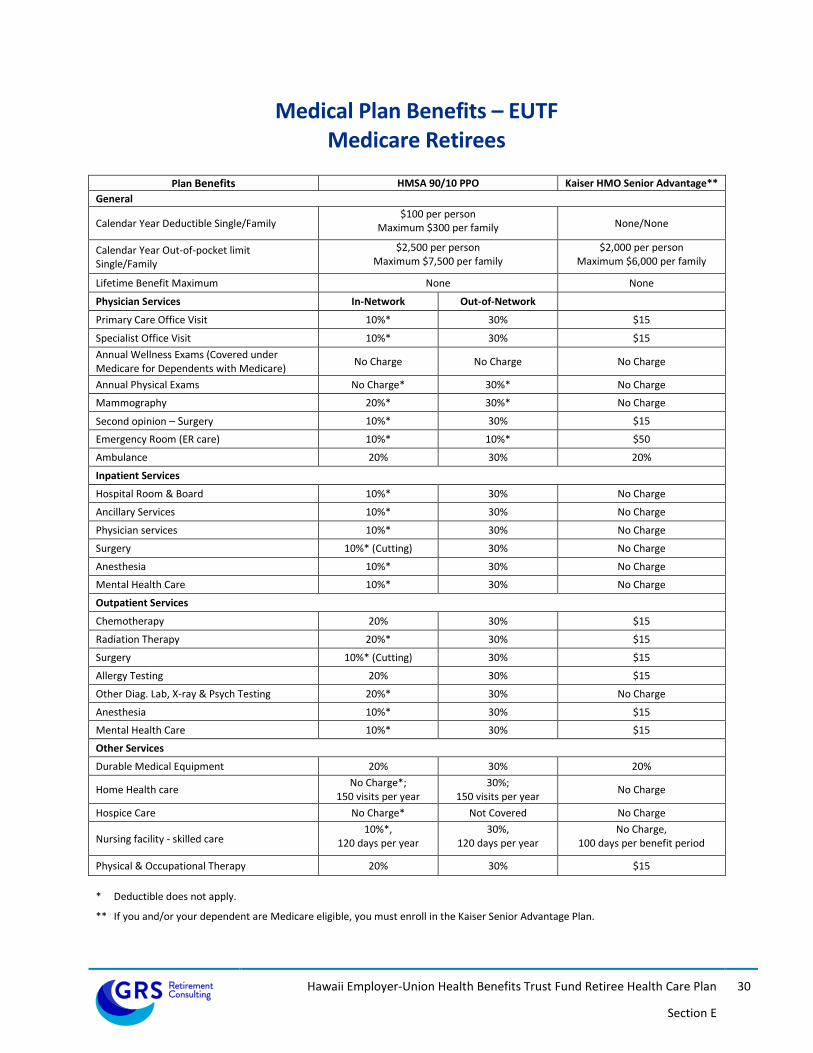
Medical Plan Benefits – EUTF Medicare Retirees
Plan Benefits HMSA 90/10 PPO Kaiser HMO Senior Advantage**
General
Calendar Year Deductible Single/Family $100 per person
Maximum $300 per family None/None
Calendar Year Out-of-pocket limit Single/Family
$2,500 per person Maximum $7,500 per family
$2,000 per person Maximum $6,000 per family
Lifetime Benefit Maximum None None
Physician Services In-Network Out-of-Network Primary Care Office Visit 10%* 30% $15
Specialist Office Visit 10%* 30% $15 Annual Wellness Exams (Covered under Medicare for Dependents with Medicare) No Charge No Charge No Charge
Annual Physical Exams No Charge* 30%* No Charge
Mammography 20%* 30%* No Charge
Second opinion – Surgery 10%* 30% $15
Emergency Room (ER care) 10%* 10%* $50
Ambulance 20% 30% 20%
Inpatient Services
Hospital Room & Board 10%* 30% No Charge
Ancillary Services 10%* 30% No Charge
Physician services 10%* 30% No Charge
Surgery 10%* (Cutting) 30% No Charge
Anesthesia 10%* 30% No Charge
Mental Health Care 10%* 30% No Charge
Outpatient Services
Chemotherapy 20% 30% $15
Radiation Therapy 20%* 30% $15
Surgery 10%* (Cutting) 30% $15
Allergy Testing 20% 30% $15
Other Diag. Lab, X-ray & Psych Testing 20%* 30% No Charge
Anesthesia 10%* 30% $15
Mental Health Care 10%* 30% $15
Other Services
Durable Medical Equipment 20% 30% 20%
Home Health care No Charge*; 150 visits per year
30%; 150 visits per year No Charge
Hospice Care No Charge* Not Covered No Charge
Nursing facility - skilled care 10%*,
120 days per year 30%,
120 days per year No Charge,
100 days per benefit period
Physical & Occupational Therapy 20% 30% $15
* Deductible does not apply.
** If you and/or your dependent are Medicare eligible, you must enroll in the Kaiser Senior Advantage Plan.

Hawaii Employer-Union Health Benefits Trust Fund Retiree Health Care Plan
Section E
31
Medical Plan Benefits – HSTA VB Medicare Retirees
Plan Benefits HMSA 90/10 PPO Kaiser HMO Senior Advantage**
General
Calendar Year Deductible Single/Family $100 per person Maximum $300 per family None/None
Calendar Year Out-of-pocket limit Single/Family
$2,000 per person Maximum $6,000 per family
$2,000 per person Maximum $6,000 per family
Lifetime Benefit Maximum $2,000,000 None In-Network Out-of-Network Physician Services Primary Care Office Visit 10%* 30% $15 Specialist Office Visit 10%* 30% $15 Annual Wellness Visit (Covered under Medicare for Dependents with Medicare) No Charge No Charge No Charge
Annual Physical Exams No Charge* Limits Apply
No Charge* Limits Apply No Charge
Mammography 10%* 30%* No Charge Second opinion – surgery 10%* 30% $15 Emergency Room (ER care) 10%* 10%* $50 Ambulance 10%* 30% 20% Inpatient Services Hospital Room & Board 10%* 30% No Charge Ancillary Services 10%* 30% No Charge Physician services 10%* 30% No Charge Surgery 10%* 30% No Charge Anesthesia 10%* 30% No Charge Mental Health Care 10%* 30% No Charge Outpatient Services Chemotherapy 10%* 30% $15 Radiation Therapy 10%* 30% $15 Surgery 10%* 30% $15 Allergy Testing 10%* 30% $15 Other Diag. Lab, X-ray & Psych Testing 10%* 30% No Charge Anesthesia 10%* 30% $15 Mental Health Care 10%* 30% $15 Other Services Durable Medical Equipment 10%* 30% 20%
Home Health care No Charge*; 150 visits per year
30%; 150 visits per year No Charge
Hospice Care No Charge* Not Covered No Charge, Home Care Only
Nursing facility - skilled care 10%*; 120 days per year
30%; 120 days per year
No Charge, 100 days per benefit period
Physical & Occupational Therapy 10%* 30% $15
Chiropractic Treatment $12*; 20 visits per year Not Covered $12;
20 visits per year
* Deductible does not apply.
** If you and your dependent are Medicare eligible, you must enroll in the Kaiser Senior Advantage Plan.

Hawaii Employer-Union Health Benefits Trust Fund Retiree Health Care Plan
Section E
32
Prescription Drug Plan Benefits – EUTF Medicare Retirees
Plan Benefits PPO Drug Plan SilverScript Medicare Part D
HMO Drug Plan Kaiser Senior Advantage
with Prescription Drug Plan In-Network Pharmacy
COPAYMENT Kaiser Pharmacy
COPAYMENT
Retail Day Supply 30 DAYS 60 DAYS 90 DAYS 30 DAYS 60 DAYS 90 DAYS Generic $5 $10 $10 $15 $30 $45 Preferred Brand $15 $30 $30 $15 $30 $45 Non-Preferred Brand $30 $60 $60 $15 $30 $45
Specialty Drugs & Injectables
20% of eligible charges; Up to $250 maximum per prescription fill; $2,000 out-
of-pocket maximum per calendar year Specialty drugs are only dispensed up to a
30-day supply
$15 $30 $45
Diabetic Supplies Covered Insulin Products $5 $10 $10 $15 $30 $45
Lancets, Strips and Meters No Copayment $15 $30 $45
Mail Order Generic $5 $10 $10 $15 $30 $30
Preferred Brand $15 $30 $30 $15 $30 $30
Non-Preferred Brand $30 $60 $60 $15 $30 $30
Specialty Drug Not available through mail order $15 $30 $30
Covered Insulin Products $5 $10 $10 $15 $30 $30
The EUTF’s Medicare Part D prescription drug plan is administered by SilverScript, the Medicare Part D administrator for CVS Caremark. This plan is
the prescription drug coverage for Medicare retirees enrolled in the HMSA PPO medical plan option and for stand-alone drug coverage. The Kaiser
Medicare Part D prescription drug coverage is included under the Kaiser Senior Advantage Medical Program.

Hawaii Employer-Union Health Benefits Trust Fund Retiree Health Care Plan
Section E
33
Prescription Drug Plan Benefits – HSTA VB Medicare Retirees
Plan Benefits PPO Drug Plan SilverScript Medicare Part D
HMO Drug Plan Kaiser Senior Advantage
with Prescription Drug Plan In-Network Pharmacy
COPAYMENT Kaiser Pharmacy
COPAYMENT
Retail Day Supply 30 DAYS 60 DAYS 90 DAYS 30 DAYS 60 DAYS 90 DAYS Generic & Covered Insulin $3 $9 $9 $10 $20 $30 All Covered Brand $9 $27 $27 $10 $20 $30
Specialty Drugs & Injectables
Specialty medications are subject to the applicable Generic/Brand copayment.
Specialty drugs are only dispensed up to a 30-day supply
$10 $20 $30
Diabetic Supplies Lancets, Strips and Meters No Copayment 20%
Mail Order Generic $3 $9 $9 $10 $20 $20
All Covered Brand Name $9 $27 $27 $10 $20 $20
Specialty Drug Not available through mail order $10 $20 $20
Diabetic Supplies Not available through mail order 20%
The HSTA VB’s Medicare Part D prescription drug plan is administered by SilverScript, the Medicare Part D administrator for CVS Caremark.
This plan is the prescription drug coverage for Medicare retirees enrolled in the HMSA PPO medical plan option. The Kaiser Medicare Part D
prescription drug coverage is included under the Kaiser Senior Advantage Medical Program.

Hawaii Employer-Union Health Benefits Trust Fund Retiree Health Care Plan
Section E
34
Dental Plan Benefits (Hawaii Dental Service [HDS]) – EUTF & HSTA VB
BENEFIT PLAN COVERS
PLAN MAXIMUM per calendar year per member (Jan 1 — Dec 31) $2,000 DIAGNOSTIC Examinations - twice per calendar year 100% Bitewing X-rays - twice per calendar year through age 14; once per calendar year thereafter 100% Other X-rays (full mouth X-rays limited to once every 5 years) 100% PREVENTIVE Cleanings — twice per calendar year 100% • Diabetic Patients — four Cleanings or *Periodontal Maintenance per calendar year • Expectant Mothers — three Cleanings or *Periodontal Maintenance per calendar year
*Periodontal Maintenance benefit level *60% • Fluoride (twice per calendar year through age 19) 100% • Fluoride — high risk — once per calendar year 100%
Space maintainers (through age 17) 100% Sealants (through age 18) — one treatment application. once per lifetime only to permanent molars with no prior occlusal restorations, regardless of the number of surfaces sealed. 100%
RESTORATIVE Amalgam (silver-colored) fillings 60% Composite (white-colored) fillings — limited to the anterior (front) teeth 60% Crowns and gold restorations (once every 5 years when teeth cannot be restored with amalgam or composite fillings) 60%
Note: Composite (white) and porcelain (white) restorations on posterior (back) teeth will be processed as the alternate benefit of the metallic equivalent — the patient is responsible for the cost difference up to the amount charged by the dentist.
ENDODONTICS 60% Pulpal therapy Root canal treatment, retreatment, apexification, apicoectomy PERIODONTICS 60% Periodontal scaling and root planing (once every two years) Gingivectomy, flap curettage and osseous surgery (once every three years) Periodontal Maintenance — twice per calendar year after qualifying periodontal treatment PROSTHODONTICS 60% Fixed bridges (once every 5 years; ages 16 and older) Dentures (complete and partial — once every 5 years; ages 16 and older) Implant Services ORAL SURGERY 60%
ADJUNCTIVE GENERAL SERVICES 60% Palliative treatment (for relief of pain but not to cure) 100%

Hawaii Employer-Union Health Benefits Trust Fund Retiree Health Care Plan
Section E
35
Vision Plan Benefits (Vision Service Plan [VSP]) – EUTF & HSTA VB
Vision Exam & Eye Wear Benefits Members can have an eye exam and choose between a pair of lenses or contact lenses every calendar year. Frames are covered every other calendar year.
Service Frequency In-Network Out-of-Network Exam Every calendar year 100% after $10 copay Up to $45.00 Prescription Glasses – Lenses:
- Single Vision Lenses - Lines Bifocals - Lines Trifocals - Polycarbonate (children up
to age 18) - UV Coating
Every calendar year 100% after $25 copay
Single Lens - up to $45.00
Bifocal Lens – up to $65.00
Trifocal Lens – up to $85.00
Prescription Glasses – Frames: Every other calendar year
$120 allowance plus 20% off out-of-pocket cost
*Costco - $65 allowance Up to $47.00
Contact Lenses Elective (Instead of Glasses) Every calendar year
$120 allowance (applies to cost of contacts and fitting &
evaluation) Up to $105.00
Extra Discounts and Savings from VSP Providers Glasses & Sunglasses
- Average 35-40% savings on all non-covered lens options (such as tints, progressive lenses, anti-scratch coatings, etc.)
- 30% off additional glasses & sunglasses, including lens options, from the same VSP doctor on the same day as your exam. Or 20% off any VSP doctor within 12 months of your last exam.*
Retinal Screening - Guaranteed pricing on retinal screening as an enhancement to your exam; $39 maximum copay.
Contact Lenses - 15% off cost of contact lens exam (fitting & evaluation) - VSP has partnered with leading contact lens manufacturers to provide VSP members exclusive offers. Check out
www.vsp.com for details.
Laser Vision Correction - Average 15% off the regular price or 5% off the promotional price from VSP-contracted facilities. - After surgery, use your frame allowance (if eligible) for sunglasses from any VSP doctor.
* Costco pricing applies; there are no additional discounts. All other affiliate provider locations 20% off additional glasses and 15% off contact
lens services within one year.

Hawaii Employer-Union Health Benefits Trust Fund Retiree Health Care Plan
Section E
36
Summary of Benefit Eligibility (For Members Hired Prior to 7/1/2012)
Noncontributory Plan Contributory Plan Hybrid Plan
Normal Retirement Age 62 and 10 years credited service; or age 55 and 30 years credited service
Age 55 and 5 years credited service Age 62 and 5 years credited service; or age 55 and 30 years credited service
Early Retirement Age 55 and 20 years credited service
Any age and 25 years credited service
Age 55 with 20 years credited service
Deferred Vesting 10 years credited service 5 years credited service and contributions left in the ERS
5 years credited service and contributions left in the ERS
Ordinary Disability 10 years credited service 10 years credited service 10 years credited service Service-Connected Disability Any age or credited service Any age or credited service Any age or credited service Ordinary Death Active employee at time of death
with at least 10 years of credited service
Active employee at time of death with at least 1 year of service
Active employee at time of death with at least 5 years of service
Service-Connected Death Any age or service Any age or service Any age or service
The benefit eligibilities summarized above apply to teachers and most State and County employees. Special provisions applicable to other groups of employees are outlined below: Police officers, firefighters, investigators of the Department of the Prosecuting Attorney and the Attorney General, narcotic enforcement investigators, and public safety investigators may retire at age 55 with 5 years of credited service or at any age with 25 years of credited service. Judges, elected officials, and legislative officers may retire at age 55 with at least 5 years of credited service, or at any age with at least 10 years of credited service. Judges hired after June 30, 1999 require 25 years of credited service in order to retire before age 55. Sewer workers in specified classifications, water safety officers, and emergency medical technicians (EMTs) may retire at any age if they are credited with 25 years of such service with the last 5 or more years in these occupations. (The 25-year feature is phased in through 7/1/2008 for EMTs.) Sewer workers in specified classifications, water safety officers, and emergency medical technicians (EMTs) that transfer to the Hybrid Plan may retire at age 62 with 5 years of credited service or at any age if they are credited with 25 years of such service with the last 5 or more years in these occupations.

Hawaii Employer-Union Health Benefits Trust Fund Retiree Health Care Plan
Section E
37
Summary of Benefit Eligibility (For Members Hired After 6/30/2012)
Contributory Plan
(for Police/Fire) Contributory Plan
(for Judges/Elected Officers)
Hybrid Plan
Normal Retirement Age 60 and 10 years credited service
Age 60 and 10 years credited service
Age 65 and 10 years credited service; or Age 60 and 30 years credited service Sewer workers, water safety officers, and EMTs may retire with 25 years credited service at age 55.
Early Retirement Age 55 and 25 years credited service
Age 55 and 25 years credited service any age with 10 years for elected officers
Age 55 with 20 years credited service Sewer workers, water safety officers, and emergency medical technicians (EMTs) may retire with 25 years credited service.
Deferred Vesting 10 years credited service and contributions left in the ERS
10 years credited service and contributions left in the ERS
10 years credited service and contributions left in the ERS
Ordinary Disability 10 years credited service 10 years credited service 10 years credited service Service-Connected Disability Any age or credited service Any age or credited service Any age or credited service Ordinary Death Active employee at time of death
with at least 1 years of credited service
Active employee at time of death with at least 1 years of credited service
Active employee at time of death with at least 10 years of service
Service-Connected Death Any age or service Any age or service Any age or service
SECTION F SUMMARY OF PARTICIPANT DATA

Hawaii Employer-Union Health Benefits Trust Fund Retiree Health Care Plan
Section F
39
Attained
Age 0 1 2 3 4 5-9 10-14 15-19 20-24 25-29 30-34 35 & Over Total
Under 25 332 216 64 35 7 1 - - - - - - 655
25-29 845 926 746 525 360 307 1 - - - - - 3,710
30-34 796 779 712 644 632 2,038 328 - - - - - 5,929
35-39 485 596 539 556 514 2,156 2,142 285 1 - - - 7,274
40-44 396 401 408 433 414 1,722 2,128 1,848 177 2 - - 7,929
45-49 325 350 381 319 316 1,400 1,814 2,031 1,821 424 2 - 9,183
50-54 248 308 262 293 222 1,218 1,515 1,483 1,558 2,110 273 4 9,494
55-59 194 239 239 268 236 1,117 1,300 1,386 1,259 1,903 1,068 178 9,387
60-64 153 151 141 168 183 875 1,088 1,086 959 1,267 780 636 7,487
65 & Over 62 65 77 79 107 540 738 708 500 642 413 691 4,622
Total 3,836 4,031 3,569 3,320 2,991 11,374 11,054 8,827 6,275 6,348 2,536 1,509 65,670
Age
Inactives Retirees Total<35 756 21 777
35-39 927 6 93340-44 1,103 16 1,11945-49 1,460 117 1,57750-54 1,765 402 2,16755-59 1,666 1,718 3,38460-64 1,481 5,047 6,52865-69 396 9,756 10,15270-74 104 10,076 10,18075-79 13 6,896 6,90980-84 1 5,530 5,53185-89 0 4,358 4,35890-94 0 2,385 2,38595+ 0 799 799
Total 9,672 47,127 56,799
Active Employee Age/Service Distribution
Years of Credited Service
Inactive Age Distribution
Deferred inactive counts include Maui Hospital employees who were active as of the census date (March 31, 2017), but who were terminated on June 30, 2017 when the privatization of Maui HHSC occurred.

Hawaii Employer-Union Health Benefits Trust Fund Retiree Health Care Plan
Section F
40
Hawaii Employee-Union Trust FundDistribution by Health Plan and Coverage Type
ActivesSingle Two-Party Family Waived Total
PPO 18,935 5,995 10,161 N/A 35,091 HMO 8,719 2,473 3,511 N/A 14,703 Others 0 0 12 N/A 12Waived 15,864 15,864 Total Medical 65,670
Dental 26,632 11,651 15,585 11,802 65,670 Vision 26,358 10,461 14,181 14,670 65,670
RetireesSingle Two-Party Family Total
PPO 21,574 14,105 1,186 36,865 HMO 4,784 2,632 224 7,640 Others 157 79 4 240Total Medical 44,745
Dental 26,530 17,081 1,379 44,990 Vision 26,511 17,278 1,447 45,236 Life 41,679

SECTION G ACTUARIAL ASSUMPTIONS AND METHODS

Hawaii Employer-Union Health Benefits Trust Fund Retiree Health Care Plan
Section G
42
Summary of Actuarial Assumptions and Methods
The actuarial assumptions used in the valuation are shown in this Section. Assumptions that are specific to certain groups (i.e. General Employees, Teachers, Police and Firefighters) are discussed under the first subsection that follows. Assumptions that are common to all types of members and unique to this valuation are then shown on the following pages. Demographic and Certain Economic Assumptions This Actuarial Valuation of the OPEB is similar to the Actuarial Valuations performed for ERS. All of the demographic assumptions and most of the economic assumptions used in this OPEB Valuation were identical to those used in the June 30, 2017 retirement system valuations performed by Gabriel, Roeder, Smith and Company. The assumptions which are common to the pension and OPEB valuations are described in Appendix A of this report.

Hawaii Employer-Union Health Benefits Trust Fund Retiree Health Care Plan
Section G
43
Healthcare and Other Economic Assumptions General Inflation was assumed to be 2.50% per year. The rate of investment return was assumed to be 7.00% a year, compounded annually net after investment expenses. The assumed real return is the rate of return in excess of price inflation. Considering other assumptions used in the valuation, the nominal rate translates to a net real return of 4.50% a year. Health Cost and Premium Increases – See table below
Year HMSA (PPO)
Kaiser (HMO) Dental Vision
Part B Premiums*
2019 6.60% 9.00% 3.50% 2.50% 2.00% 2020 6.60% 9.00% 3.50% 2.50% 5.00% 2021 9.00% 8.00% 3.50% 2.50% 5.00% 2022 7.50% 7.50% 3.50% 2.50% 5.00% 2023 7.25% 7.25% 3.50% 2.50% 5.00% 2024 7.00% 7.00% 3.50% 2.50% 5.00% 2025 6.75% 6.75% 3.50% 2.50% 5.00%
2026 6.50% 6.50% 3.50% 2.50% 5.00%
2027 6.25% 6.25% 3.50% 2.50% 5.00%
2028 6.00% 6.00% 3.50% 2.50% 5.00%
2029 5.75% 5.75% 3.50% 2.50% 5.00%
2030 5.50% 5.50% 3.50% 2.50% 5.00%
2031 5.25% 5.25% 3.50% 2.50% 4.90%
2032 5.00% 5.00% 3.50% 2.50% 4.80%
2033+ 4.86% 4.86% 3.50% 2.50% 4.70%
The premiums for 2017 and 2018 were known at the time of the valuation. The first trend rate shown above is assumed to occur at 1/1/2019. Future increases are also assumed to occur on 1/1. The HMSA and Kaiser trend rates are blended rates used to project both medical and prescription drug costs. * The trend rates shown above for the Part B premiums apply to the BMC and the Part B premiums for future retirees. As a result of the “hold harmless” provision in the Part B statutes, retirees who were enrolled in Social Security in 2017 will see varying increases in their Part B premiums in 2018. It was assumed that Part B premiums for the retirees who have been held harmless would converge to the standard Part B premiums in 2019. As a result, it was assumed that the Part B premiums for the participants who were retired as of the valuation date would increase by 22.94% effective 1/1/2018 and by 4.71% effective 1/1/2019. The 4.86% ultimate trend assumption for the HMSA and Kaiser plans is comprised of 2.50% long-term price inflation + 2.20% real GDP growth + 0.16% for excise tax.

Hawaii Employer-Union Health Benefits Trust Fund Retiree Health Care Plan
Section G
44
Healthcare and Other Economic Assumptions (Continued) Plan Participation The plan participation rates were assumed to vary based on the employer contribution percentage, as follows:
Employer Contribution
Rates of Participation Medical,
Prescription Drug, Dental and Vision
Life
Insurance
Medicare
Part B 0% 25% 100% 98%
50% 65% 100% 98% 75% 90% 100% 98%
100% 98% 100% 98% The same assumptions were used for terminated participants with vested pension benefits. However, current active employees who terminate service prior to the age of 35 are not assumed to ever participate in the retiree health plan. For current retirees, the actual family coverage election is used. For future retirees, the family coverage assumptions are 40% single / 50% two-party / 10% family prior to age 65 and 50% single / 50% two-party after the age of 65. For those that elect two-party or family coverage, it was assumed that coverage would continue to the spouse upon death of the retiree. Plan Elections For current retirees, plan elections were based on the plan in which they are currently enrolled. For future retirees, plan participation was assumed to be 82% HMSA / 18% Kaiser. Administration Fees The following table provides the assumed 2018 administration fees. For the purpose of the OPEB valuation, it was assumed that the administration fees would be in addition to the premiums shown in Section E.
Monthly Fee Single Party Two-Party Family Medical and Drug $3.89 $7.78 $11.67 Dental 0.27 0.54 0.81 Vision 0.05 0.09 0.14 Life 0.02 n/a n/a

Hawaii Employer-Union Health Benefits Trust Fund Retiree Health Care Plan
Section G
45
Healthcare and Other Economic Assumptions (Continued) Aging Factors: In any given year, the cost of medical and prescription drug benefits vary by age. As the ages of retirees in the covered population increase so does the cost of benefits. Morbidity tables are employed to develop Per Capita Costs at every relevant age. The following table represents the percent by which the cost of medical and prescription drug benefits at one age is higher than the cost for the previous age. For example, according to the following table, the cost of benefits for a male age 55 is 5.50% higher than for one age 54. These percentages below are separate from the annual Medical Trend, which operates to increase costs independent of and in addition to the Aging Factors shown below.
Sample Ages
Cost Increases by Age Male Female
45 4.66% 1.88% 50 5.83% 3.53% 55 5.50% 2.85% 60 5.06% 3.45% 65 3.34% 3.28% 70 1.77% 2.02% 75 1.15% 1.32% 80 0.82% 1.05% 85 -0.27% 0.49% 90 -0.32% 0.03%
Actuarial Methods The individual entry age actuarial cost method was used in determining liabilities and normal cost. Differences between assumed experience and actual experience (“actuarial gains and/or losses”) become part of actuarial accrued liabilities. Unfunded actuarial accrued liabilities are amortized to produce payments (principal & interest) which are a level percent of payroll. Closed bases will be established at each valuation for new unfunded liabilities. If experience produces a gain during a valuation cycle, the new base will be netted against a loss that has not been fully offset. This process substantially reduces volatility as bases are fully amortized.

Hawaii Employer-Union Health Benefits Trust Fund Retiree Health Care Plan
Section G
46
Miscellaneous and Technical Assumptions Actuarial Value of Assets Market Value
Claims Utilization To model the impact of aging on the underlying health care
costs, the valuation relied on the Society of Actuaries’ 2013 Study “Health Care Costs – From Birth to Death”. Chart 1 (2010 Aggregate Commercial Costs) was used to model the impact of aging for ages less than 65 and Table 4 (Development of Plan Specific Medicare Age Curve) was used to model the impact of aging for ages 65 and over.
Marriage Assumption 100% of males and females are assumed to be married for purposes of death-in-service benefits. For future retirees, husbands are assumed to be four years older than wives.
Pay Increase Timing Beginning of (fiscal) year. This is equivalent to assuming that
reported pays represent amounts paid to members during the year ended on the valuation date.
Decrement Timing Except for teachers, decrements of all types are assumed to
occur mid-year. For teachers, the normal retirement, early retirement and termination decrements are assumed to occur at the beginning of the year.
Eligibility Testing Eligibility for benefits is determined based upon the age
nearest birthday and service nearest whole year on the date the decrement is assumed to occur.
Decrement Operation Disability and mortality decrements are added to the
termination decrements during the first 5 years. Disability is added to the retirement decrement during retirement eligibility.
Deferred Age
Terminated employees with vested pension benefits are assumed to commence their benefit at age 62 or their current age if they are older than 62 as of the valuation date.
Incidence of ARC Contributions The ARC is assumed to be received at the middle of the year. Administrative Expenses Administrative expenses are included in the age-rated costs the
premiums. Reliance on Other Actuaries
We have relied on the premiums develop by Segal Consulting for the self-insured PPO prescription drug benefit.

Hawaii Employer-Union Health Benefits Trust Fund Retiree Health Care Plan
Section G
47
Miscellaneous and Technical Assumptions (continued) Excise Tax and Health Care Reform
The excise tax is expected to increase the present value of projected medical and Rx benefits by 3.9% for pre-65 retirees by 1.3% for post-65 retirees. There is no anticipated impact on the liability associated with the employer paid Part B premiums, dental, vision or life insurance benefits. In addition, the employer caps will limit the liability for retirees who receive 75% or 50% of the BMC. The overall impact of the excise tax, after considering the percentage of the OPEB liability attributable to each type of benefit, was determined to be 1.6% of the present value of future benefits. The impact of the excise tax was modeled by increasing the ultimate trend assumption for the healthcare costs by 0.16%.
Assumption/Method Changes
1. Mortality and other demographic assumptions have been updated to match those developed in the June 30, 2015 Hawaii Employees’ Retirement System Experience Study. Taken together, these changes increased the OPEB liability.
2. The inflation rate assumption was lowered from 3.00% to 2.50%. 3. The trend rates were reset to better reflect the plan's anticipated
experience and the new inflation assumption. This change increased the ARC and associated liabilities.
4. The tables used to model the impact of aging on the underlying claims were updated based on the Society of Actuaries’ 2013 Study “Health Care Costs – From Birth to Death.”
5. The percentage of pre-65 retirees assumed to elect retiree + spouse coverage was increased from 45% to 50%. The percentage of pre-65 retirees assumed to elect family coverage was increased from 5% to 10%.

APPENDIX A DEMOGRAPHIC AND CERTAIN ECONOMIC ASSUMPTIONS

Hawaii Employer-Union Health Benefits Trust Fund Retiree Health Care Plan
Appendix A
49
Demographic and Certain Economic Assumptions A. Economic Assumptions
1. Payroll growth rate: 3.50% per annum.
2. Salary increase rate: As shown below
General Employees Teachers
Years of Service
Service-related
Component
Total Rate Including 2.50% Inflation Component and
1.00% Productivity Component
Service-related
Component
Total Rate Including 2.50% Inflation Component and
1.25% Productivity Component
1 3.00% 6.50% 2.00% 5.75% 2 3.00% 6.50% 1.75% 5.50% 3 2.00% 5.50% 1.75% 5.50% 4 1.50% 5.00% 1.50% 5.25% 5 1.50% 5.00% 1.00% 4.75% 6 1.25% 4.75% 1.00% 4.75% 7 1.25% 4.75% 0.75% 4.50% 8 1.00% 4.50% 0.75% 4.50% 9 1.00% 4.50% 0.50% 4.25%
10 1.00% 4.50% 0.50% 4.25% 11 0.75% 4.25% 0.50% 4.25% 12 0.75% 4.25% 0.50% 4.25% 13 0.50% 4.00% 0.25% 4.00% 14 0.50% 4.00% 0.25% 4.00% 15 0.50% 4.00% 0.25% 4.00% 16 0.50% 4.00% 0.25% 4.00% 17 0.50% 4.00% 0.25% 4.00% 18 0.50% 4.00% 0.25% 4.00% 19 0.50% 4.00% 0.25% 4.00% 20 0.25% 3.75% 0.25% 4.00% 21 0.25% 3.75% 0.25% 4.00% 22 0.25% 3.75% 0.25% 4.00% 23 0.25% 3.75% 0.25% 4.00% 24 0.25% 3.75% 0.25% 4.00%
25 or more 0.00% 3.50% 0.00% 3.75%
Hawaii Employer-Union Health Benefits Trust Fund Retiree Health Care Plan
Appendix A
50
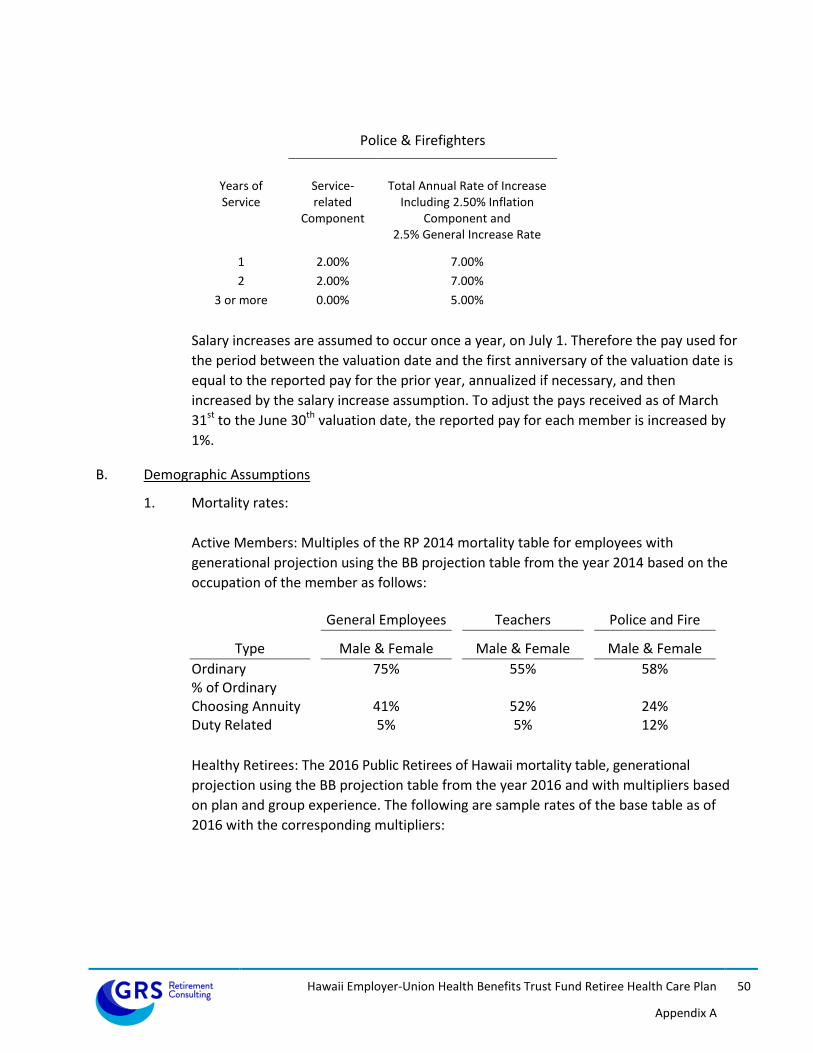
Police & Firefighters
Years of Service
Service-related
Component
Total Annual Rate of Increase Including 2.50% Inflation
Component and 2.5% General Increase Rate
1 2.00% 7.00% 2 2.00% 7.00%
3 or more 0.00% 5.00%
Salary increases are assumed to occur once a year, on July 1. Therefore the pay used for the period between the valuation date and the first anniversary of the valuation date is equal to the reported pay for the prior year, annualized if necessary, and then increased by the salary increase assumption. To adjust the pays received as of March 31st to the June 30th valuation date, the reported pay for each member is increased by 1%.
B. Demographic Assumptions
1. Mortality rates:
Active Members: Multiples of the RP 2014 mortality table for employees with generational projection using the BB projection table from the year 2014 based on the occupation of the member as follows:
General Employees Teachers Police and Fire
Type Male & Female Male & Female Male & Female Ordinary 75% 55% 58% % of Ordinary Choosing Annuity
41%
52%
24%
Duty Related 5% 5% 12% Healthy Retirees: The 2016 Public Retirees of Hawaii mortality table, generational projection using the BB projection table from the year 2016 and with multipliers based on plan and group experience. The following are sample rates of the base table as of 2016 with the corresponding multipliers:

Hawaii Employer-Union Health Benefits Trust Fund Retiree Health Care Plan
Appendix A
51
Healthy Annuitant Mortality Rates Before Projection (Multiplier Applied)
General Employees
Teachers
Police and Fire
Age
Male
Female
Male
Female
Male
Female
50
0.1626%
0.1140%
0.1463%
0.1012%
0.1951%
0.1140% 55
0.3963%
0.1937%
0.3567%
0.1720%
0.4756%
0.1937%
60
0.6301%
0.2735%
0.5671%
0.2428%
0.7561%
0.2735% 65
0.9489%
0.3532%
0.8540%
0.3136%
1.1387%
0.3532%
70
1.3733%
0.7404%
1.2360%
0.6574%
1.6480%
0.7404% 75
2.1071%
1.3116%
1.8964%
1.1645%
2.5285%
1.3116%
80
3.6268%
2.2573%
3.2641%
2.0041%
4.3522%
2.2573% 85
6.6210%
4.1830%
5.9589%
3.7138%
7.9452%
4.1830%
90
12.1005%
8.2371%
10.8905%
7.3133%
14.5206%
8.2371%
Multiplier
100%
107%
90%
95%
120%
107% Setback
0
0
0
0
0
0
The following table provides the life expectancy for individuals retiring in future years based on the assumption with full generational projection:
Life Expectancy for an Age 65 Retiree in Years
Year of Retirement Gender 2020 2025 2030 2035
General Retirees Male 23.2 23.7 24.2 24.7
Female 26.4 26.8 27.2 27.5 Teachers
Male 24.0 24.5 25.0 25.5 Female 27.3 27.7 28.0 28.3
Police and Fire Male 21.8 22.3 22.8 23.3
Female 26.4 26.8 27.2 27.5
Disabled retirees: Base Table for healthy retiree’s occupation, set forward 5 years, generational projection using the BB projection table from the year 2016. Minimum mortality rate of 3.5% for males and 2.5% for females.

Hawaii Employer-Union Health Benefits Trust Fund Retiree Health Care Plan
Appendix A
52
2. Disability rates – The assumed total disability rates at select ages are multiples of the client specific table that follows:
Age Male & Female 25 0.000% 30 0.001% 35 0.008% 40 0.026% 45 0.064% 50 0.146% 55 0.198% 60 0.217%
Note: The disability rates project the percentage of employees at each age that is
assumed to become disabled before retiring. Multiples of the rates above are assumed to be ordinary disability or accidental disability, and varies by employee group as follows:
General Employees Teachers Police and Fire
Type Male & Female Male & Female Male & Female Ordinary 210% 75% 70% Accidental 30% 5% 75%

Hawaii Employer-Union Health Benefits Trust Fund Retiree Health Care Plan
Appendix A
53
3. Termination Rates - Same male and female rates, based solely on the member’s service. Rates reflect terminations for causes other than death, disability or retirement. Employees eligible for retirement are assumed to have no probability of termination. Sample rates are shown below:
Expected Terminations per 1,000 Lives (Male & Female)
Years of Service
General Employees Teachers Police & Fire
0
185.9 243.6 110.0 1
152.5 200.8 95.0
2
124.6 164.7 37.0 3
101.6 134.4 30.1
4
82.9 109.4 26.1 5
67.9 89.0 23.3
6
56.1 72.5 21.0 7
47.0 59.5 19.2
8
40.1 49.4 17.7 9
35.1 41.7 16.4
10
31.5 36.0 15.2 11
29.1 31.9 14.1
12
27.6 29.0 13.2 13
26.6 27.0 12.3
14
25.9 25.7 11.5 15
25.5 24.8 10.8
16
25.1 24.0 10.1 17
24.5 23.2 9.5
18
23.9 22.4 8.9 19
23.0 21.4 8.3
20
22.0 20.2 7.7 21
20.8 18.7 7.2
22
19.5 17.1 6.8 23
18.3 15.4 6.3
24
17.4 13.6 5.8 25
16.8 12.1 0.0
26
16.8 10.9 0.0 27
16.8 10.4 0.0
28
16.8 10.7 0.0 29
16.8 10.0 0.0
30 and more
0.0 0.0 0.0

Hawaii Employer-Union Health Benefits Trust Fund Retiree Health Care Plan
Appendix A
54
4. Retirement rates - Separate male and female rates, based on age. Sample rates are shown below:
Contributory Members
Expected Retirements per 100 Lives
General Employees
Teachers
Police/Fire
Unreduced Retirement
Reduced Retirement
Unreduced Retirement
Reduced Retirement
Unreduced Retirement
Age
Male
Female
Male
Female
Male
Female
Male
Female
Male & Female
45
0
0
0
0
0
0
0
0
12.5 46
0
0
0
0
0
0
0
0
12.5
47
0
0
0
0
0
0
0
0
12.5 48
0
0
0
0
0
0
0
0
12.5
49
0
0
0
0
0
0
0
0
12.5 50
0
0
0
0
0
0
1
0
15.0
51
0
0
2
1
0
0
1
1
15.0 52
0
0
2
1
0
0
1
1
15.0
53
0
0
2
1
0
0
2
2
15.0 54
0
0
3
2
0
0
3
3
15.0
55
25
20
3
2
20
18
20.0 56
25
20
15
16
20.0
57
16
13
15
16
20.0 58
16
13
15
16
22.0
59 13
13
15
16
25.0 60
13
15
14
18
30.0
61
13
15
14
18
30.0 62
28
25
14
25
30.0
63
20
20
14
20
30.0 64
20
20
14
15
30.0
65
20
20
20
25
100.0 66
18
20
15
25
67
18
20
15
20 68
18
20
15
20
69
18
20
15
20 70
20
20
15
20
71
20
20
15
20 72
20
20
15
20
73
20
20
15
20 74
20
20
15
20
75
100
100
100
100

Hawaii Employer-Union Health Benefits Trust Fund Retiree Health Care Plan
Appendix A
55
Noncontributory Members
Expected Retirements per 100 Lives
General Employees
Teachers
Unreduced Retirement
Reduced Retirement
Unreduced Retirement
Reduced Retirement
Age
Male
Female
Male
Female
Male
Female
Male
Female
55
20
11
1
1
10
13
1
2 56
18
11
1
1
10
7
1
2
57
13
11
1
1
10
8
1
2 58
10
11
1
1
10
10
2
2
59 10
11
2
2
10
20
3
3 60
10
14
3
3
10
11
5
5
61
11
18
4
4
10
16
7
5 62
20
20
16
25
63
20
20
12
20 64
12
20
10
15
65
14
20
20
25 66
20
20
15
25
67
20
20
15
25 68
20
20
15
25
69
20
20
15
25 70
20
20
15
25
71
20
20
15
25 72
20
20
15
25
73
20
20
15
25 74
20
20
15
25
75
100
100
100
100
Note: Retirement rates for the 25 & out group age 50-54 are 10% for male and 11% for female.

Hawaii Employer-Union Health Benefits Trust Fund Retiree Health Care Plan
Appendix A
56
Hybrid Members
Expected Retirements per 100 Lives
General Employees
Teachers
Unreduced Retirement
Reduced Retirement
Unreduced Retirement
Reduced Retirement
Age
Male
Female
Male
Female
Male
Female
Male
Female
55
16
18
1
1
20
16
2
2 56
10
13
1
1
13
10
2
2
57
10
13
1
1
13
10
2
2 58
14
13
1
2
13
12
2
2
59 14
13
2
2
13
12
3
3 60
14
13
2
4
14
14
3
5
61
14
15
3
4
14
18
3
10 62
21
20
22
30
63
18
20
14
20 64
18
20
14
20
65
21
20
20
25 66
18
18
15
25
67
18
18
15
25 68
18
18
15
25
69
18
18
15
25 70
20
20
15
25
71
20
20
15
25 72
20
20
15
25
73
20
20
15
25 74
20
20
15
25
75
100
100
100
100
Note: Retirement rates for the 25 & out group age 50-54 are 6% for both male and female.
For members hired after June 30, 2012 the retirement rates for members once they reach unreduced retirement eligibility are increased 10% (multiplicative) for each year the member is beyond the age the member would have been eligible under the Hybrid provisions for members hired prior to June 30, 2012.

APPENDIX B GLOSSARY

Hawaii Employer-Union Health Benefits Trust Fund Retiree Health Care Plan
Appendix B
58
Glossary
Accrued Service. The service credited under the plan which was rendered before the date of the actuarial valuation. Actuarial Accrued Liability. The difference between (i) the actuarial present value of future plan benefits, and (ii) the actuarial present value of future normal cost. Sometimes referred to as "accrued liability" or "past service liability." Actuarial Assumptions. Estimates of future plan experience with respect to rates of mortality, disability, turnover, retirement, rate or rates of investment income and salary increases. Decrement assumptions (rates of mortality, disability, turnover and retirement) are generally based on past experience, often modified for projected changes in conditions. Economic assumptions (salary increases and investment income) consist of an underlying rate in an inflation-free environment plus a provision for a long-term average rate of inflation. Actuarial Cost Method. A mathematical budgeting procedure for allocating the dollar amount of the "actuarial present value of future plan benefits" between the actuarial present value of future normal cost and the actuarial accrued liability. Sometimes referred to as the "actuarial funding method." Actuarial Equivalent. A single amount or series of amounts of equal value to another single amount or series of amounts, computed on the basis of the rate(s) of interest and mortality tables used by the plan. Actuarial Present Value. The amount of funds presently required to provide a payment or series of payments in the future. It is determined by discounting the future payments at a predetermined rate of interest, taking into account the probability of payment. Amortization. Paying off an interest-bearing liability by means of periodic payments of interest and principal, as opposed to paying it off with a lump sum payment. Annual Required Contribution (ARC). The ARC is the normal cost plus the portion of the unfunded actuarial accrued liability to be amortized in the current period. The ARC is an amount that is actuarially determined in accordance with the requirements so that, if paid on an ongoing basis, it would be expected to provide sufficient resources to fund both the normal cost for each year and the amortized unfunded liability.

Hawaii Employer-Union Health Benefits Trust Fund Retiree Health Care Plan
Appendix B
59
Medical Trend Rate (Health Inflation). The increase in the plan’s cost over time. Trend includes all elements that may influence a plan’s cost, assuming that enrollments and the plan benefits do not change. Trend includes such elements as, pure price inflation, changes in utilization, advances in medical technology, and cost shifting. Normal Cost. The annual cost assigned, under the actuarial funding method, to current and subsequent plan years. Sometimes referred to as "current service cost." Any payment toward the unfunded actuarial accrued liability is not part of the normal cost. Other Post-Employment Employee Benefits (OPEB). OPEB are post-employment benefits other than pensions. OPEB generally takes the form of health insurance and dental, vision, prescription drugs or other healthcare benefits. Reserve Account. An account used to indicate that funds have been set aside for a specific purpose and are not generally available for other uses. Unfunded Actuarial Accrued Liability. The difference between the actuarial accrued liability and valuation assets. Sometimes referred to as "unfunded accrued liability." Valuation Assets. The value of current plan assets recognized for valuation purposes.


