
Havasu Falls, Grand Canyon National Park, Arizona ...Havasu Falls, Grand Canyon National Park,...
14
Havasu Falls, Grand Canyon National Park, Arizona pediatric esrd 295
Transcript of Havasu Falls, Grand Canyon National Park, Arizona ...Havasu Falls, Grand Canyon National Park,...

Havasu Falls, Grand Canyon National Park, Arizona
pediatric esrd
295
2012USRDSannualDataRepoRt
volumeESRD
296
pediatric esrd
2
introductionintroduction
Pediatric end-stage renal disease patients pose unique challenges to parents, providers, and the healthcare system, which must address not only the disease
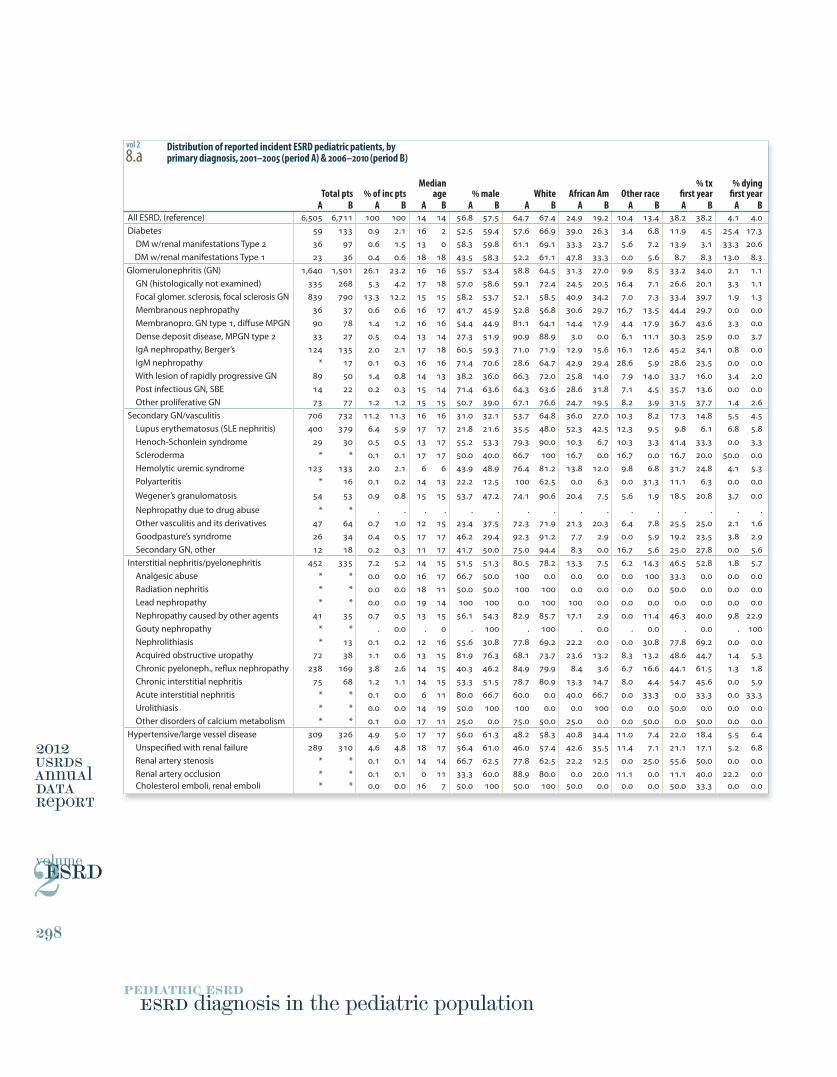
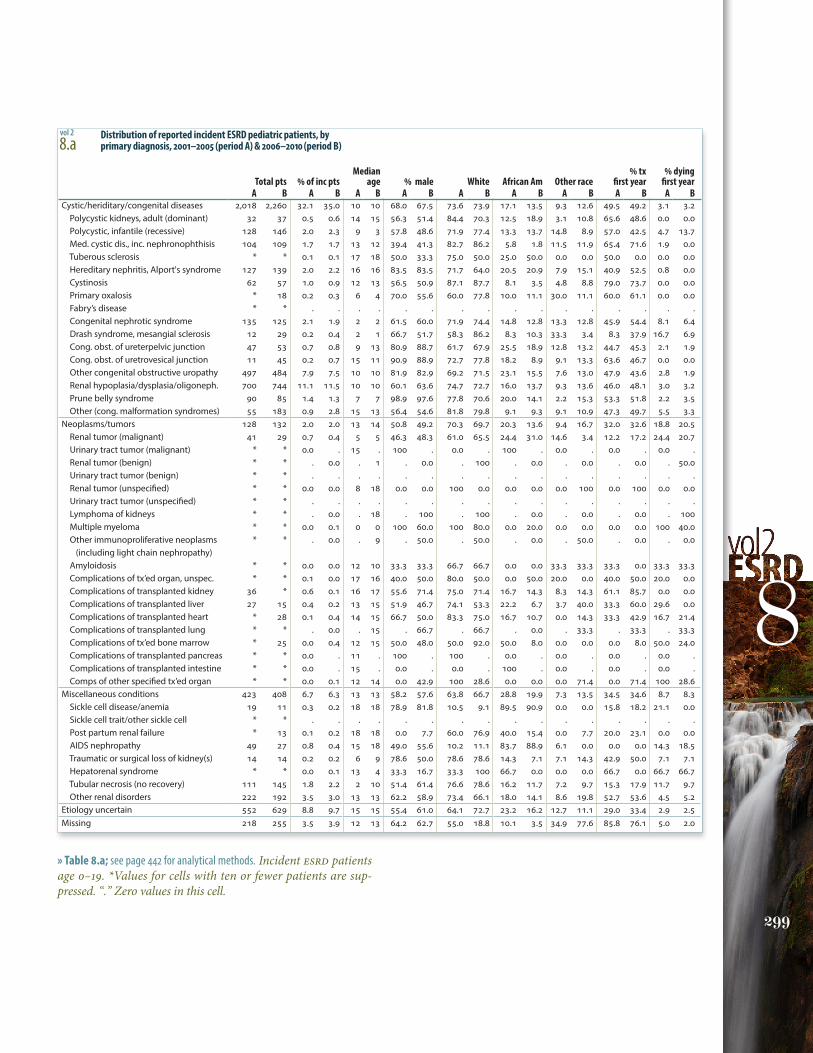
itself, but the many extra-renal manifestations that affect patients’ lives and families. On the next spread we detail the causes of kidney failure in children, using data from the Medical Evidence form (2728). The leading causes are cystic/hereditary and congenital disorders, which account for 32 percent of pediatric ESRD cases, while 26 percent are caused by glomerular diseases, and 11 percent by secondary causes of glomerulonephritis, including vasculitis.
Even more striking are the simplest measures of outcomes in the first year of therapy. Thirty-eight percent of patients receive a transplant in the first year, while 4 percent die; neither of these rates has altered over the past decade. Considerable progress, however, has been made in the first-year mortality rate among patients with primary glomerular diseases, falling from 2.1 to 1.1 percent. But both the transplant and mortality rates among patients with congenital/hereditary/cystic diseases — the most common diagnoses — remain unchanged.
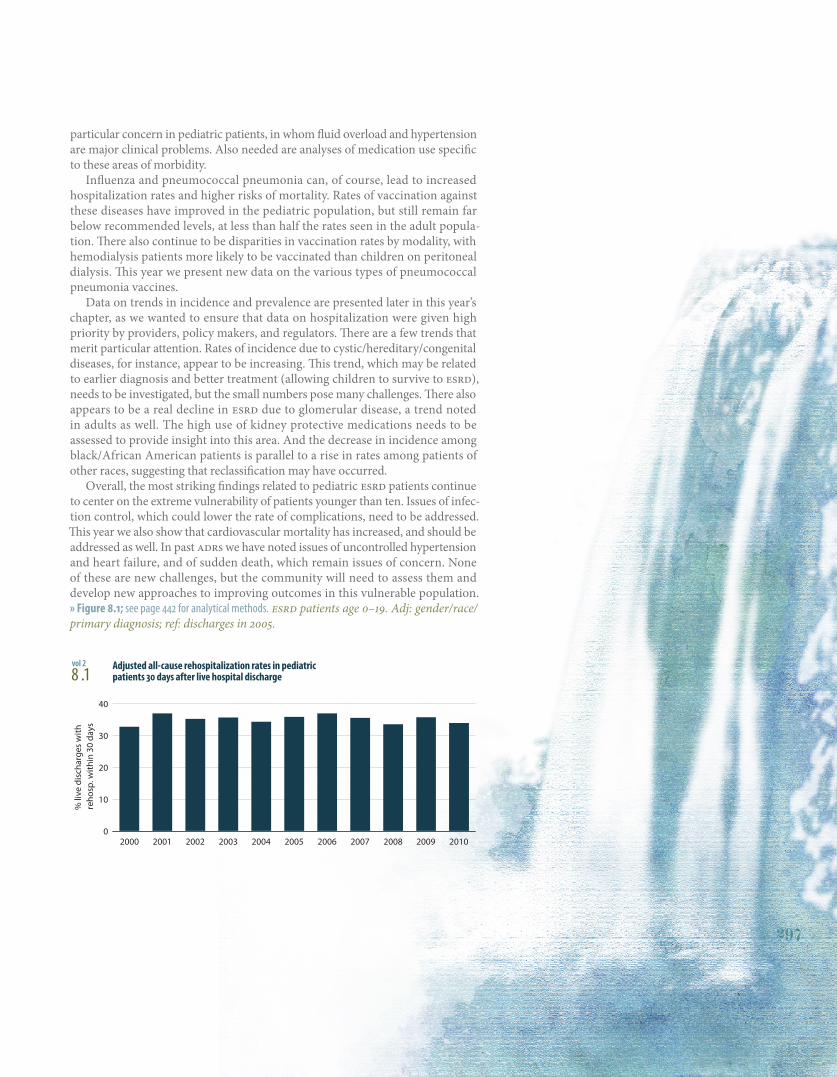
In this chapter we highlight the considerable degree of morbidity in pediat-ric patients, manifested not only in overall hospitalization rates, but in rates of repeated hospitalizations. Almost 35 percent of children with ESRD are rehospi-talized within 30 days of discharge. As with the adult population (discussed in Chapter Three), this rate has not changed in a decade. Rates of hospitalization related to infection are highest in the youngest patients and in those on perito-neal dialysis, while hospitalizations due to bacteremia/sepsis are most frequent in the youngest patients on hemodialysis — an area of major concern. Hospitaliza-tions due to pneumonia are greatest in transplant patients younger than ten, a finding which suggests that the low rates of pneumonia vaccinations may be an area to target.
Next we compare rates over time, allowing us to focus providers’ attention on areas which may need to be prioritized for greater prevention efforts. Between the periods of 2000–2004 and 2005–2010, overall hospitalization rates rose 29 percent for children younger than ten, and 17 percent for those age 15–19; hospitaliza-tions in the hemodialysis and peritoneal dialysis populations rose 18–19 percent. Hospitalizations for cardiovascular causes rose 38 percent in the youngest chil-dren, and 47 percent in the oldest. Cardiovascular hospitalizations have increased the most in patients on hemodialysis and in those with a transplant, rising 49 and 56 percent, respectively, compared to 10 percent among those treated with peritoneal dialysis. And rates of hospitalization due to infection have increased 32 percent among patients younger than 10.
In similar analyses of mortality, adjusted rates show small increases in mor-tality in those younger than ten and those age 15–19, in contrast to a 31 percent decline among those age 10–14. These overall changes, however, are not reflected in rates of cardiovascular mortality, which have increased across all age groups in the hemodialysis population, and risen 17 percent for those on peritoneal dialy-sis; the rate among transplant patients, in contrast, has fallen 24 percent. More detailed analyses need to be developed on the specific causes of hospitalization, including congestive heart failure and arrhythmias. These complications are of
A child’s world is fresh and new
and beautiful, full of wonder and
excitement. It is our misfortune that
for most of us that clear-eyed vision,
that true instinct for what is beautiful
and awe-inspiring, is dimmed and
even lost before we reach adulthood.
If I had influence with the good fairy
who is supposed to preside over the
christening of all children I should ask
that her gift to each child in the world
be a sense of wonder so indestructible
that it would last throughout life, as
an unfailing antidote against the
boredom and disenchantments of later
years, the sterile preoccupation with
things that are artificial, the alienation
from the sources of our strength.
RachEl caRSon,The Sense of Wonder
298 ESRD diagnosis in the pediatric population
300 infections
301 vaccinations
302 hospitalization & mortality
304 pediatric ESRD in the United States & Canada
308 summary
2000 2001 2002 2003 2004 2005 2006 2007 2008 2009 2010
% li
ve d
isch
arge
s w
ith
reho
sp. w
ithin
30
days
0
10
20
30
40
297
particular concern in pediatric patients, in whom fluid overload and hypertension are major clinical problems. Also needed are analyses of medication use specific to these areas of morbidity.
Influenza and pneumococcal pneumonia can, of course, lead to increased hospitalization rates and higher risks of mortality. Rates of vaccination against these diseases have improved in the pediatric population, but still remain far below recommended levels, at less than half the rates seen in the adult popula-tion. There also continue to be disparities in vaccination rates by modality, with hemodialysis patients more likely to be vaccinated than children on peritoneal dialysis. This year we present new data on the various types of pneumococcal pneumonia vaccines.
Data on trends in incidence and prevalence are presented later in this year’s chapter, as we wanted to ensure that data on hospitalization were given high priority by providers, policy makers, and regulators. There are a few trends that merit particular attention. Rates of incidence due to cystic/hereditary/congenital diseases, for instance, appear to be increasing. This trend, which may be related to earlier diagnosis and better treatment (allowing children to survive to ESRD), needs to be investigated, but the small numbers pose many challenges. There also appears to be a real decline in ESRD due to glomerular disease, a trend noted in adults as well. The high use of kidney protective medications needs to be assessed to provide insight into this area. And the decrease in incidence among black/African American patients is parallel to a rise in rates among patients of other races, suggesting that reclassification may have occurred.
Overall, the most striking findings related to pediatric ESRD patients continue to center on the extreme vulnerability of patients younger than ten. Issues of infec-tion control, which could lower the rate of complications, need to be addressed. This year we also show that cardiovascular mortality has increased, and should be addressed as well. In past ADRs we have noted issues of uncontrolled hypertension and heart failure, and of sudden death, which remain issues of concern. None of these are new challenges, but the community will need to assess them and develop new approaches to improving outcomes in this vulnerable population. » Figure 8.1; see page 442 for analytical methods. ESRD patients age 0–19. Adj: gender/race/primary diagnosis; ref: discharges in 2005.
8 .1 Adjusted all-cause rehospitalization rates in pediatric
patients 30 days after live hospital dischargevol 2
pediatric esrd
2
2012USRDSannualDataRepoRt
volumeESRD
298
ESRD diagnosis in the pediatric population
Median % tx % dyingTotal pts % of inc pts age % male White African Am Other race first year first year
A B A B A B A B A B A B A B A B A BAll ESRD, (reference) 6,505 6,711 100 100 14 14 56.8 57.5 64.7 67.4 24.9 19.2 10.4 13.4 38.2 38.2 4.1 4.0Diabetes 59 133 0.9 2.1 16 2 52.5 59.4 57.6 66.9 39.0 26.3 3.4 6.8 11.9 4.5 25.4 17.3 DM w/renal manifestations Type 2 36 97 0.6 1.5 13 0 58.3 59.8 61.1 69.1 33.3 23.7 5.6 7.2 13.9 3.1 33.3 20.6 DM w/renal manifestations Type 1 23 36 0.4 0.6 18 18 43.5 58.3 52.2 61.1 47.8 33.3 0.0 5.6 8.7 8.3 13.0 8.3Glomerulonephritis (GN) 1,640 1,501 26.1 23.2 16 16 55.7 53.4 58.8 64.5 31.3 27.0 9.9 8.5 33.2 34.0 2.1 1.1 GN (histologically not examined) 335 268 5.3 4.2 17 18 57.0 58.6 59.1 72.4 24.5 20.5 16.4 7.1 26.6 20.1 3.3 1.1 Focal glomer. sclerosis, focal sclerosis GN 839 790 13.3 12.2 15 15 58.2 53.7 52.1 58.5 40.9 34.2 7.0 7.3 33.4 39.7 1.9 1.3 Membranous nephropathy 36 37 0.6 0.6 16 17 41.7 45.9 52.8 56.8 30.6 29.7 16.7 13.5 44.4 29.7 0.0 0.0 Membranopro. GN type 1, diffuse MPGN 90 78 1.4 1.2 16 16 54.4 44.9 81.1 64.1 14.4 17.9 4.4 17.9 36.7 43.6 3.3 0.0 Dense deposit disease, MPGN type 2 33 27 0.5 0.4 13 14 27.3 51.9 90.9 88.9 3.0 0.0 6.1 11.1 30.3 25.9 0.0 3.7 IgA nephropathy, Berger’s 124 135 2.0 2.1 17 18 60.5 59.3 71.0 71.9 12.9 15.6 16.1 12.6 45.2 34.1 0.8 0.0 IgM nephropathy * 17 0.1 0.3 16 16 71.4 70.6 28.6 64.7 42.9 29.4 28.6 5.9 28.6 23.5 0.0 0.0 With lesion of rapidly progressive GN 89 50 1.4 0.8 14 13 38.2 36.0 66.3 72.0 25.8 14.0 7.9 14.0 33.7 16.0 3.4 2.0 Post infectious GN, SBE 14 22 0.2 0.3 15 14 71.4 63.6 64.3 63.6 28.6 31.8 7.1 4.5 35.7 13.6 0.0 0.0 Other proliferative GN 73 77 1.2 1.2 15 15 50.7 39.0 67.1 76.6 24.7 19.5 8.2 3.9 31.5 37.7 1.4 2.6Secondary GN/vasculitis 706 732 11.2 11.3 16 16 31.0 32.1 53.7 64.8 36.0 27.0 10.3 8.2 17.3 14.8 5.5 4.5 Lupus erythematosus (SLE nephritis) 400 379 6.4 5.9 17 17 21.8 21.6 35.5 48.0 52.3 42.5 12.3 9.5 9.8 6.1 6.8 5.8 Henoch-Schonlein syndrome 29 30 0.5 0.5 13 17 55.2 53.3 79.3 90.0 10.3 6.7 10.3 3.3 41.4 33.3 0.0 3.3 Scleroderma * * 0.1 0.1 17 17 50.0 40.0 66.7 100 16.7 0.0 16.7 0.0 16.7 20.0 50.0 0.0 Hemolytic uremic syndrome 123 133 2.0 2.1 6 6 43.9 48.9 76.4 81.2 13.8 12.0 9.8 6.8 31.7 24.8 4.1 5.3 Polyarteritis * 16 0.1 0.2 14 13 22.2 12.5 100 62.5 0.0 6.3 0.0 31.3 11.1 6.3 0.0 0.0
Wegener’s granulomatosis 54 53 0.9 0.8 15 15 53.7 47.2 74.1 90.6 20.4 7.5 5.6 1.9 18.5 20.8 3.7 0.0
Nephropathy due to drug abuse * * . . . . . . . . . . . . . . . . Other vasculitis and its derivatives 47 64 0.7 1.0 12 15 23.4 37.5 72.3 71.9 21.3 20.3 6.4 7.8 25.5 25.0 2.1 1.6 Goodpasture’s syndrome 26 34 0.4 0.5 17 17 46.2 29.4 92.3 91.2 7.7 2.9 0.0 5.9 19.2 23.5 3.8 2.9 Secondary GN, other 12 18 0.2 0.3 11 17 41.7 50.0 75.0 94.4 8.3 0.0 16.7 5.6 25.0 27.8 0.0 5.6Interstitial nephritis/pyelonephritis 452 335 7.2 5.2 14 15 51.5 51.3 80.5 78.2 13.3 7.5 6.2 14.3 46.5 52.8 1.8 5.7 Analgesic abuse * * 0.0 0.0 16 17 66.7 50.0 100 0.0 0.0 0.0 0.0 100 33.3 0.0 0.0 0.0 Radiation nephritis * * 0.0 0.0 18 11 50.0 50.0 100 100 0.0 0.0 0.0 0.0 50.0 0.0 0.0 0.0 Lead nephropathy * * 0.0 0.0 19 14 100 100 0.0 100 100 0.0 0.0 0.0 0.0 0.0 0.0 0.0 Nephropathy caused by other agents 41 35 0.7 0.5 13 15 56.1 54.3 82.9 85.7 17.1 2.9 0.0 11.4 46.3 40.0 9.8 22.9 Gouty nephropathy * * . 0.0 . 0 . 100 . 100 . 0.0 . 0.0 . 0.0 . 100 Nephrolithiasis * 13 0.1 0.2 12 16 55.6 30.8 77.8 69.2 22.2 0.0 0.0 30.8 77.8 69.2 0.0 0.0 Acquired obstructive uropathy 72 38 1.1 0.6 13 15 81.9 76.3 68.1 73.7 23.6 13.2 8.3 13.2 48.6 44.7 1.4 5.3 Chronic pyeloneph., reflux nephropathy 238 169 3.8 2.6 14 15 40.3 46.2 84.9 79.9 8.4 3.6 6.7 16.6 44.1 61.5 1.3 1.8 Chronic interstitial nephritis 75 68 1.2 1.1 14 15 53.3 51.5 78.7 80.9 13.3 14.7 8.0 4.4 54.7 45.6 0.0 5.9 Acute interstitial nephritis * * 0.1 0.0 6 11 80.0 66.7 60.0 0.0 40.0 66.7 0.0 33.3 0.0 33.3 0.0 33.3 Urolithiasis * * 0.0 0.0 14 19 50.0 100 100 0.0 0.0 100 0.0 0.0 50.0 0.0 0.0 0.0 Other disorders of calcium metabolism * * 0.1 0.0 17 11 25.0 0.0 75.0 50.0 25.0 0.0 0.0 50.0 0.0 50.0 0.0 0.0Hypertensive/large vessel disease 309 326 4.9 5.0 17 17 56.0 61.3 48.2 58.3 40.8 34.4 11.0 7.4 22.0 18.4 5.5 6.4 Unspecified with renal failure 289 310 4.6 4.8 18 17 56.4 61.0 46.0 57.4 42.6 35.5 11.4 7.1 21.1 17.1 5.2 6.8 Renal artery stenosis * * 0.1 0.1 14 14 66.7 62.5 77.8 62.5 22.2 12.5 0.0 25.0 55.6 50.0 0.0 0.0 Renal artery occlusion * * 0.1 0.1 0 11 33.3 60.0 88.9 80.0 0.0 20.0 11.1 0.0 11.1 40.0 22.2 0.0 Cholesterol emboli, renal emboli * * 0.0 0.0 16 7 50.0 100 50.0 100 50.0 0.0 0.0 0.0 50.0 33.3 0.0 0.0
8.a Distribution of reported incident ESRD pediatric patients, by
primary diagnosis, 2001–2005 (period A) & 2006–2010 (period B)vol 2
1
299
8
Median % tx % dying Total pts % of inc pts age % male White African Am Other race first year first year A B A B A B A B A B A B A B A B A BCystic/heriditary/congenital diseases 2,018 2,260 32.1 35.0 10 10 68.0 67.5 73.6 73.9 17.1 13.5 9.3 12.6 49.5 49.2 3.1 3.2 Polycystic kidneys, adult (dominant) 32 37 0.5 0.6 14 15 56.3 51.4 84.4 70.3 12.5 18.9 3.1 10.8 65.6 48.6 0.0 0.0 Polycystic, infantile (recessive) 128 146 2.0 2.3 9 3 57.8 48.6 71.9 77.4 13.3 13.7 14.8 8.9 57.0 42.5 4.7 13.7 Med. cystic dis., inc. nephronophthisis 104 109 1.7 1.7 13 12 39.4 41.3 82.7 86.2 5.8 1.8 11.5 11.9 65.4 71.6 1.9 0.0 Tuberous sclerosis * * 0.1 0.1 17 18 50.0 33.3 75.0 50.0 25.0 50.0 0.0 0.0 50.0 0.0 0.0 0.0 Hereditary nephritis, Alport's syndrome 127 139 2.0 2.2 16 16 83.5 83.5 71.7 64.0 20.5 20.9 7.9 15.1 40.9 52.5 0.8 0.0 Cystinosis 62 57 1.0 0.9 12 13 56.5 50.9 87.1 87.7 8.1 3.5 4.8 8.8 79.0 73.7 0.0 0.0 Primary oxalosis * 18 0.2 0.3 6 4 70.0 55.6 60.0 77.8 10.0 11.1 30.0 11.1 60.0 61.1 0.0 0.0 Fabry’s disease * * . . . . . . . . . . . . . . . . Congenital nephrotic syndrome 135 125 2.1 1.9 2 2 61.5 60.0 71.9 74.4 14.8 12.8 13.3 12.8 45.9 54.4 8.1 6.4 Drash syndrome, mesangial sclerosis 12 29 0.2 0.4 2 1 66.7 51.7 58.3 86.2 8.3 10.3 33.3 3.4 8.3 37.9 16.7 6.9 Cong. obst. of ureterpelvic junction 47 53 0.7 0.8 9 13 80.9 88.7 61.7 67.9 25.5 18.9 12.8 13.2 44.7 45.3 2.1 1.9 Cong. obst. of uretrovesical junction 11 45 0.2 0.7 15 11 90.9 88.9 72.7 77.8 18.2 8.9 9.1 13.3 63.6 46.7 0.0 0.0 Other congenital obstructive uropathy 497 484 7.9 7.5 10 10 81.9 82.9 69.2 71.5 23.1 15.5 7.6 13.0 47.9 43.6 2.8 1.9 Renal hypoplasia/dysplasia/oligoneph. 700 744 11.1 11.5 10 10 60.1 63.6 74.7 72.7 16.0 13.7 9.3 13.6 46.0 48.1 3.0 3.2 Prune belly syndrome 90 85 1.4 1.3 7 7 98.9 97.6 77.8 70.6 20.0 14.1 2.2 15.3 53.3 51.8 2.2 3.5 Other (cong. malformation syndromes) 55 183 0.9 2.8 15 13 56.4 54.6 81.8 79.8 9.1 9.3 9.1 10.9 47.3 49.7 5.5 3.3Neoplasms/tumors 128 132 2.0 2.0 13 14 50.8 49.2 70.3 69.7 20.3 13.6 9.4 16.7 32.0 32.6 18.8 20.5 Renal tumor (malignant) 41 29 0.7 0.4 5 5 46.3 48.3 61.0 65.5 24.4 31.0 14.6 3.4 12.2 17.2 24.4 20.7 Urinary tract tumor (malignant) * * 0.0 . 15 . 100 . 0.0 . 100 . 0.0 . 0.0 . 0.0 . Renal tumor (benign) * * . 0.0 . 1 . 0.0 . 100 . 0.0 . 0.0 . 0.0 . 50.0 Urinary tract tumor (benign) * * . . . . . . . . . . . . . . . . Renal tumor (unspecified) * * 0.0 0.0 8 18 0.0 0.0 100 0.0 0.0 0.0 0.0 100 0.0 100 0.0 0.0 Urinary tract tumor (unspecified) * * . . . . . . . . . . . . . . . . Lymphoma of kidneys * * . 0.0 . 18 . 100 . 100 . 0.0 . 0.0 . 0.0 . 100 Multiple myeloma * * 0.0 0.1 0 0 100 60.0 100 80.0 0.0 20.0 0.0 0.0 0.0 0.0 100 40.0 Other immunoproliferative neoplasms * * . 0.0 . 9 . 50.0 . 50.0 . 0.0 . 50.0 . 0.0 . 0.0 (including light chain nephropathy) Amyloidosis * * 0.0 0.0 12 10 33.3 33.3 66.7 66.7 0.0 0.0 33.3 33.3 33.3 0.0 33.3 33.3 Complications of tx’ed organ, unspec. * * 0.1 0.0 17 16 40.0 50.0 80.0 50.0 0.0 50.0 20.0 0.0 40.0 50.0 20.0 0.0 Complications of transplanted kidney 36 * 0.6 0.1 16 17 55.6 71.4 75.0 71.4 16.7 14.3 8.3 14.3 61.1 85.7 0.0 0.0 Complications of transplanted liver 27 15 0.4 0.2 13 15 51.9 46.7 74.1 53.3 22.2 6.7 3.7 40.0 33.3 60.0 29.6 0.0 Complications of transplanted heart * 28 0.1 0.4 14 15 66.7 50.0 83.3 75.0 16.7 10.7 0.0 14.3 33.3 42.9 16.7 21.4 Complications of transplanted lung * * . 0.0 . 15 . 66.7 . 66.7 . 0.0 . 33.3 . 33.3 . 33.3 Complications of tx’ed bone marrow * 25 0.0 0.4 12 15 50.0 48.0 50.0 92.0 50.0 8.0 0.0 0.0 0.0 8.0 50.0 24.0 Complications of transplanted pancreas * * 0.0 . 11 . 100 . 100 . 0.0 . 0.0 . 0.0 . 0.0 . Complications of transplanted intestine * * 0.0 . 15 . 0.0 . 0.0 . 100 . 0.0 . 0.0 . 0.0 . Comps of other specified tx’ed organ * * 0.0 0.1 12 14 0.0 42.9 100 28.6 0.0 0.0 0.0 71.4 0.0 71.4 100 28.6Miscellaneous conditions 423 408 6.7 6.3 13 13 58.2 57.6 63.8 66.7 28.8 19.9 7.3 13.5 34.5 34.6 8.7 8.3 Sickle cell disease/anemia 19 11 0.3 0.2 18 18 78.9 81.8 10.5 9.1 89.5 90.9 0.0 0.0 15.8 18.2 21.1 0.0 Sickle cell trait/other sickle cell * * . . . . . . . . . . . . . . . . Post partum renal failure * 13 0.1 0.2 18 18 0.0 7.7 60.0 76.9 40.0 15.4 0.0 7.7 20.0 23.1 0.0 0.0 AIDS nephropathy 49 27 0.8 0.4 15 18 49.0 55.6 10.2 11.1 83.7 88.9 6.1 0.0 0.0 0.0 14.3 18.5 Traumatic or surgical loss of kidney(s) 14 14 0.2 0.2 6 9 78.6 50.0 78.6 78.6 14.3 7.1 7.1 14.3 42.9 50.0 7.1 7.1 Hepatorenal syndrome * * 0.0 0.1 13 4 33.3 16.7 33.3 100 66.7 0.0 0.0 0.0 66.7 0.0 66.7 66.7 Tubular necrosis (no recovery) 111 145 1.8 2.2 2 10 51.4 61.4 76.6 78.6 16.2 11.7 7.2 9.7 15.3 17.9 11.7 9.7 Other renal disorders 222 192 3.5 3.0 13 13 62.2 58.9 73.4 66.1 18.0 14.1 8.6 19.8 52.7 53.6 4.5 5.2Etiology uncertain 552 629 8.8 9.7 15 15 55.4 61.0 64.1 72.7 23.2 16.2 12.7 11.1 29.0 33.4 2.9 2.5Missing 218 255 3.5 3.9 12 13 64.2 62.7 55.0 18.8 10.1 3.5 34.9 77.6 85.8 76.1 5.0 2.0
8.a Distribution of reported incident ESRD pediatric patients, by
primary diagnosis, 2001–2005 (period A) & 2006–2010 (period B)vol 2
» Table 8.a; see page 442 for analytical methods. Incident ESRD patients age 0–19. *Values for cells with ten or fewer patients are sup-pressed. “.” Zero values in this cell.
All HD PD Tx
White Black/African AmericanOther
All HD PD Tx
Adm
issi
ons
per 1
,000
pat
ient
yea
rs
0
200
400
600
800
1,000
1,2000-4 5-9 10-14 15-19
Age Race
All dialysis HD PDAll dialysis HD PD
Adm
issi
ons
per 1
,000
pat
ient
yea
rs
0
200
400
600Age Race
White Black/African AmericanOther
0-4 5-9
10-14 15-19
All HD PD TxAll HD PD Tx0
50
100
150
200Age Race
White Black/African AmericanOther
0-4 5-9 10-14 15-19
Adm
issi
ons
per 1
,000
pat
ient
yea
rs
All HD PD Tx
White Black/Af AmOther
All HD PD Tx
Adm
issi
ons
per 1
,000
pat
ient
yea
rs
0
50
100
150
2000-4 5-9 10-14 15-19
Age Race
AVF/AVG Catheter only
Other combination
Num
ber o
f pat
ient
s
0
50
100
150
200
Total number
Number with VA infection
pediatric esrd
2
2012USRDSannualDataRepoRt
volumeESRD
300
infections | vaccinations
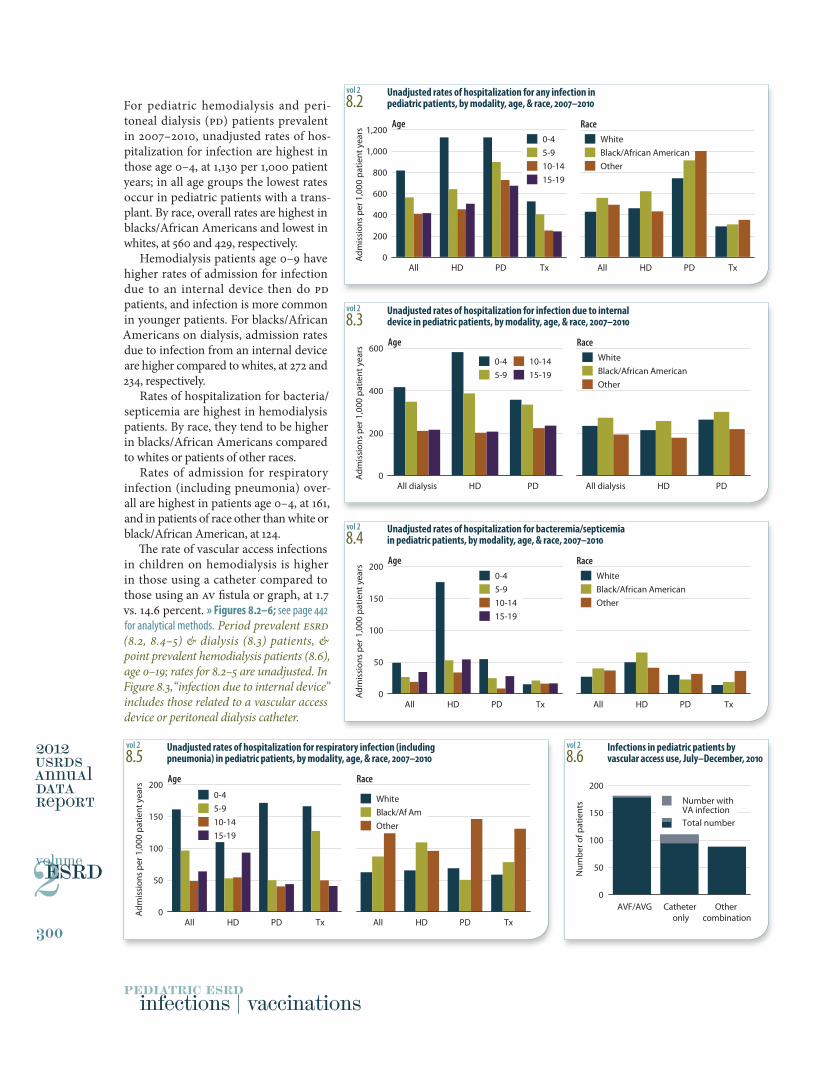
For pediatric hemodialysis and peri-toneal dialysis (PD) patients prevalent in 2007–2010, unadjusted rates of hos-pitalization for infection are highest in those age 0–4, at 1,130 per 1,000 patient years; in all age groups the lowest rates occur in pediatric patients with a trans-plant. By race, overall rates are highest in blacks/African Americans and lowest in whites, at 560 and 429, respectively.
Hemodialysis patients age 0–9 have higher rates of admission for infection due to an internal device then do PD patients, and infection is more common in younger patients. For blacks/African Americans on dialysis, admission rates due to infection from an internal device are higher compared to whites, at 272 and 234, respectively.
Rates of hospitalization for bacteria/ septicemia are highest in hemodialysis patients. By race, they tend to be higher in blacks/African Americans compared to whites or patients of other races.
Rates of admission for respiratory infection (including pneumonia) over-all are highest in patients age 0–4, at 161, and in patients of race other than white or black/African American, at 124.
The rate of vascular access infections in children on hemodialysis is higher in those using a catheter compared to those using an AV fistula or graph, at 1.7 vs. 14.6 percent. » Figures 8.2–6; see page 442 for analytical methods. Period prevalent ESRD (8.2, 8.4–5) & dialysis (8.3) patients, & point prevalent hemodialysis patients (8.6), age 0–19; rates for 8.2–5 are unadjusted. In Figure 8.3,“infection due to internal device” includes those related to a vascular access device or peritoneal dialysis catheter.
8.2 Unadjusted rates of hospitalization for any infection in
pediatric patients, by modality, age, & race, 2007–2010
8.3 Unadjusted rates of hospitalization for infection due to internal
device in pediatric patients, by modality, age, & race, 2007–2010
8.4 Unadjusted rates of hospitalization for bacteremia/septicemia
in pediatric patients, by modality, age, & race, 2007–2010
8.5 Unadjusted rates of hospitalization for respiratory infection (including
pneumonia) in pediatric patients, by modality, age, & race, 2007–2010 8.6 Infections in pediatric patients by
vascular access use, July–December, 2010
vol 2
vol 2
vol 2
vol 2 vol 2
1
All HD PD TxAll HD PD Tx
Perc
ent o
f pat
ient
s vac
cina
ted
0
10
20
30
40
50Age Race
0-4 5-9
10-14 15-19
White Black/Af AmOther
All HD PD Tx
White Black/African AmericanOther
All HD PD Tx
Perc
ent o
f pat
ient
s vac
cina
ted
0
10
20
30
0-4 5-9
10-14 15-19
Age Race
All HD PD Tx
White Black/African AmericanOther
All HD PD Tx
Perc
ent o
f pat
ient
s vac
cina
ted
0
2
4
6
8
10
0-4 5-9 10-14 15-19
Age Race
301
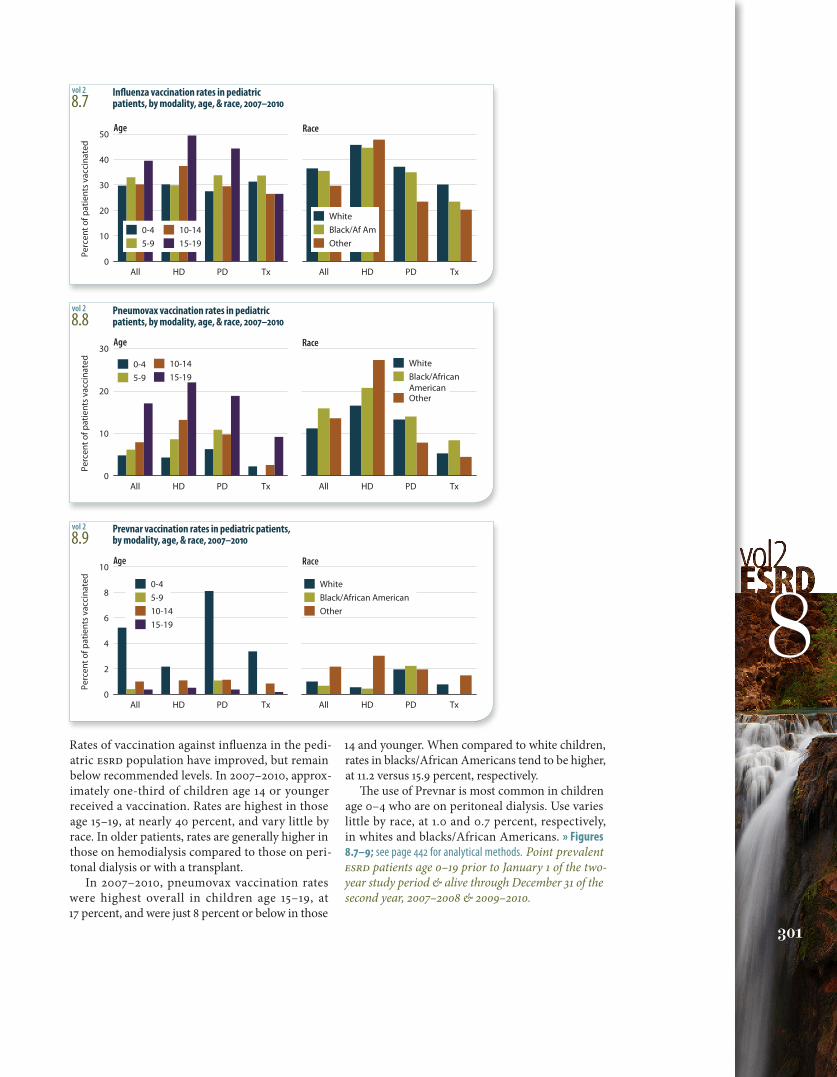
8Rates of vaccination against influenza in the pedi-atric ESRD population have improved, but remain below recommended levels. In 2007–2010, approx-imately one-third of children age 14 or younger received a vaccination. Rates are highest in those age 15–19, at nearly 40 percent, and vary little by race. In older patients, rates are generally higher in those on hemodialysis compared to those on peri-tonal dialysis or with a transplant.
In 2007–2010, pneumovax vaccination rates were highest overall in children age 15–19, at 17 percent, and were just 8 percent or below in those
14 and younger. When compared to white children, rates in blacks/African Americans tend to be higher, at 11.2 versus 15.9 percent, respectively.
The use of Prevnar is most common in children age 0–4 who are on peritoneal dialysis. Use varies little by race, at 1.0 and 0.7 percent, respectively, in whites and blacks/African Americans. » Figures 8.7–9; see page 442 for analytical methods. Point prevalent ESRD patients age 0–19 prior to January 1 of the two-year study period & alive through December 31 of the second year, 2007–2008 & 2009–2010.
8.7 Influenza vaccination rates in pediatric
patients, by modality, age, & race, 2007–2010
8.8 Pneumovax vaccination rates in pediatric
patients, by modality, age, & race, 2007–2010
8.9 Prevnar vaccination rates in pediatric patients,
by modality, age, & race, 2007–2010
vol 2
vol 2
vol 2
2000-2004 2005-2009Adm
issi
ons
per 1
,000
pat
ient
yea
rs
0
500
1,000
1,500
2,000
2,5000-9 10-14 15-19
Age
2000-2004 2005-2009
161 97 49 64 62 87 124
110 53 54 93 65 109 96
171 50 40 44 69 50 146
166 127 50 41 59 78 131
161 97 49 64 62 87 124
110 53 54 93 65 109 96
171 50 40 44 69 50 146
166 127 50 41 59 78 131
HDPD
TxAll
Modality
2000-2004 2005-2009
Adm
issi
ons p
er 1
,000
pt.
year
s
0
100
200
300
400
500Age
2000-2004 2005-2009
Modality
0-9 10-14 15-19
HDPD
TxAll
2000-2004 2005-2009Adm
issi
ons
per 1
,000
pat
ient
yea
rs
0
200
400
600
800
1,000Age
2000-2004 2005-2009
Modality
0-9 10-14 15-19
HDPD
TxAll
pediatric esrd
2
2012USRDSannualDataRepoRt
volumeESRD
302
hospitalization & mortality
8.10 One-year adjusted all-cause hospitalization rates in
pediatric patients (from day 90), by age & modality
8.11 One-year adjusted cardiovascular hospitalization rates
in pediatric patients (from day 90), by age & modality
8.12 One-year adjusted rates of hospitalization for infection
in pediatric patients (from day 90), by age & modality
vol 2
vol 2
vol 2
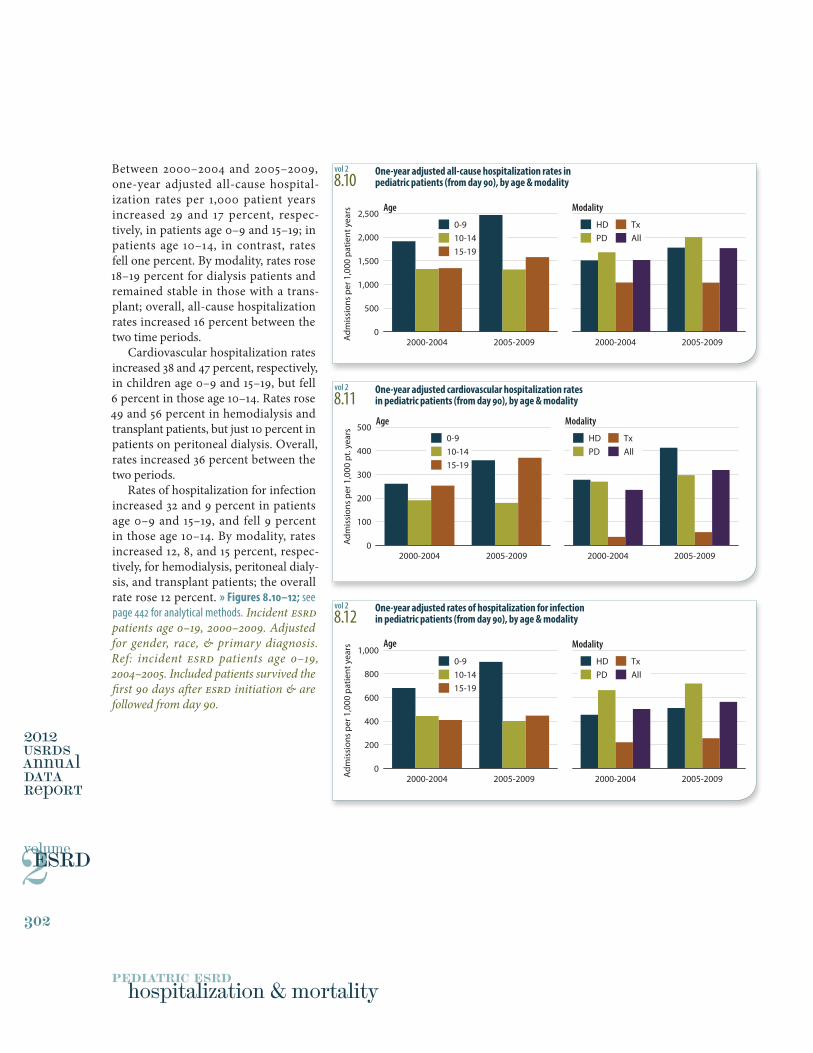
Between 2000–2004 and 2005–2009, one-year adjusted all-cause hospital-ization rates per 1,000 patient years increased 29 and 17 percent, respec-tively, in patients age 0–9 and 15–19; in patients age 10–14, in contrast, rates fell one percent. By modality, rates rose 18–19 percent for dialysis patients and remained stable in those with a trans-plant; overall, all-cause hospitalization rates increased 16 percent between the two time periods.
Cardiovascular hospitalization rates increased 38 and 47 percent, respectively, in children age 0–9 and 15–19, but fell 6 percent in those age 10–14. Rates rose 49 and 56 percent in hemodialysis and transplant patients, but just 10 percent in patients on peritoneal dialysis. Overall, rates increased 36 percent between the two periods.
Rates of hospitalization for infection increased 32 and 9 percent in patients age 0–9 and 15–19, and fell 9 percent in those age 10–14. By modality, rates increased 12, 8, and 15 percent, respec-tively, for hemodialysis, peritoneal dialy-sis, and transplant patients; the overall rate rose 12 percent. » Figures 8.10–12; see page 442 for analytical methods. Incident ESRD patients age 0–19, 2000–2009. Adjusted for gender, race, & primary diagnosis. Ref: incident ESRD patients age 0–19, 2004–2005. Included patients survived the first 90 days after ESRD initiation & are followed from day 90.
1
2000-2004 2005-2009
Mor
talit
y p
er 1
,000
pt y
ears
0
20
40
60
80
1000-9 10-14 15-19
Age
2000-2004 2005-2009
HemodialysisPeritoneal dialysisTransplant All
Modality
2000-2004 2005-2009
Mor
talit
y p
er 1
,000
pt y
ears
0
10
20
30Age
2000-2004 2005-2009
Modality
0-9 10-14 15-19
HemodialysisPeritoneal dialysisTransplant All
2000-2004 2005-2009
Mor
talit
y p
er 1
,000
pt y
ears
0
5
10
15
20Age
2000-2004 2005-2009
Modality
0-9 10-14 15-19
HemodialysisPeritoneal dialysisTransplant All
0 12 24 36 48 60
Surv
ival
pro
babi
lity
0.6
0.7
0.8
0.9
1.0
0-4 5-910-1415-19
Months after initiation0 12 24 36 48 60
HemodialysisPeritoneal dialysisTransplantAll
Age Modality
303
8
8.13 One-year adjusted all-cause mortality rates in
pediatric patients (from day one), by age & modality
8.14 One-year adjusted cardiovascular mortality rates in
pediatric patients (from day one), by age & modality
8.15 One-year adjusted rates of mortality due to infection in
pediatric patients (from day one), by age & modality
8.16 Adjusted five-year survival in pediatric patients
(from day one), by age & modality, 2001–2005
vol 2
vol 2
vol 2
vol 2
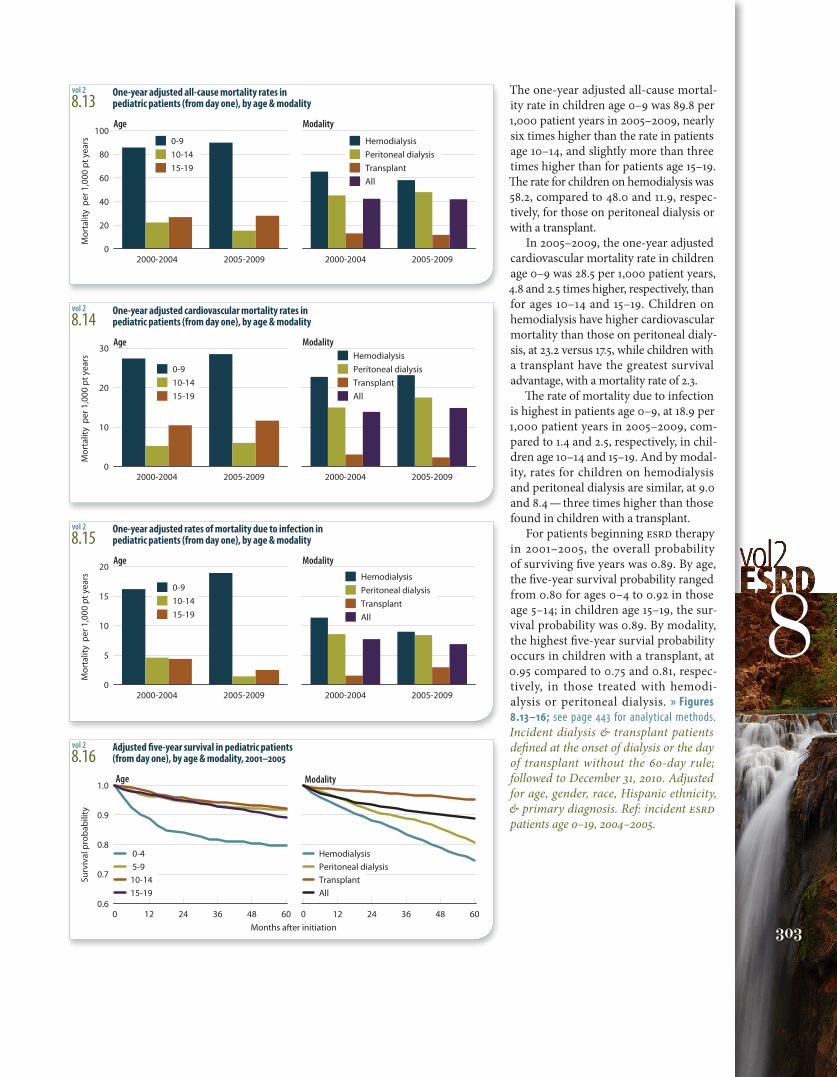
The one-year adjusted all-cause mortal-ity rate in children age 0–9 was 89.8 per 1,000 patient years in 2005–2009, nearly six times higher than the rate in patients age 10–14, and slightly more than three times higher than for patients age 15–19. The rate for children on hemodialysis was 58.2, compared to 48.0 and 11.9, respec-tively, for those on peritoneal dialysis or with a transplant.
In 2005–2009, the one-year adjusted cardiovascular mortality rate in children age 0–9 was 28.5 per 1,000 patient years, 4.8 and 2.5 times higher, respectively, than for ages 10–14 and 15–19. Children on hemodialysis have higher cardiovascular mortality than those on peritoneal dialy-sis, at 23.2 versus 17.5, while children with a transplant have the greatest survival advantage, with a mortality rate of 2.3.
The rate of mortality due to infection is highest in patients age 0–9, at 18.9 per 1,000 patient years in 2005–2009, com-pared to 1.4 and 2.5, respectively, in chil-dren age 10–14 and 15–19. And by modal-ity, rates for children on hemodialysis and peritoneal dialysis are similar, at 9.0 and 8.4 — three times higher than those found in children with a transplant.
For patients beginning ESRD therapy in 2001–2005, the overall probability of surviving five years was 0.89. By age, the five-year survival probability ranged from 0.80 for ages 0–4 to 0.92 in those age 5–14; in children age 15–19, the sur-vival probability was 0.89. By modality, the highest five-year survial probability occurs in children with a transplant, at 0.95 compared to 0.75 and 0.81, respec-tively, in those treated with hemodi-alysis or peritoneal dialysis. » Figures 8.13–16; see page 443 for analytical methods. Incident dialysis & transplant patients defined at the onset of dialysis or the day of transplant without the 60-day rule; followed to December 31, 2010. Adjusted for age, gender, race, Hispanic ethnicity, & primary diagnosis. Ref: incident ESRD patients age 0–19, 2004–2005.
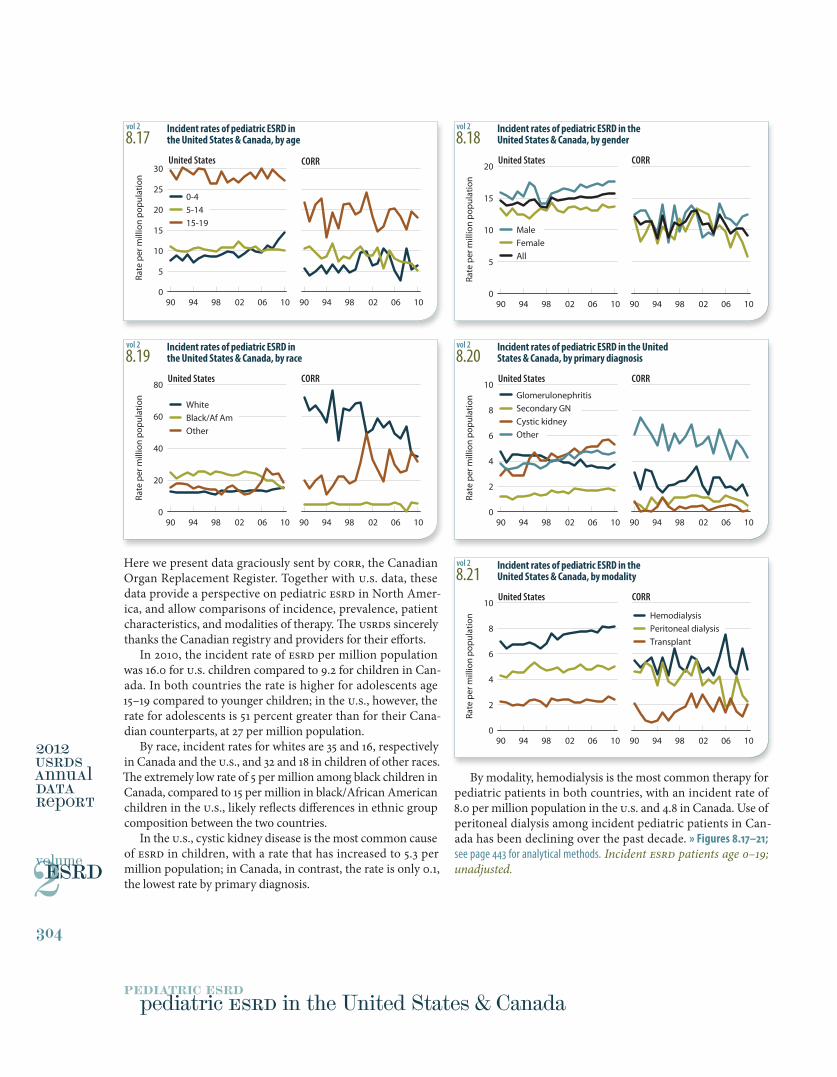
Here we present data graciously sent by CORR, the Canadian Organ Replacement Register. Together with U.S. data, these data provide a perspective on pediatric ESRD in North Amer-ica, and allow comparisons of incidence, prevalence, patient characteristics, and modalities of therapy. The USRDS sincerely thanks the Canadian registry and providers for their efforts.
In 2010, the incident rate of ESRD per million population was 16.0 for U.S. children compared to 9.2 for children in Can-ada. In both countries the rate is higher for adolescents age 15–19 compared to younger children; in the U.S., however, the rate for adolescents is 51 percent greater than for their Cana-dian counterparts, at 27 per million population.
By race, incident rates for whites are 35 and 16, respectively in Canada and the U.S., and 32 and 18 in children of other races. The extremely low rate of 5 per million among black children in Canada, compared to 15 per million in black/African American children in the U.S., likely reflects differences in ethnic group composition between the two countries.
In the U.S., cystic kidney disease is the most common cause of ESRD in children, with a rate that has increased to 5.3 per million population; in Canada, in contrast, the rate is only 0.1, the lowest rate by primary diagnosis.
By modality, hemodialysis is the most common therapy for pediatric patients in both countries, with an incident rate of 8.0 per million population in the U.S. and 4.8 in Canada. Use of peritoneal dialysis among incident pediatric patients in Can-ada has been declining over the past decade. » Figures 8.17–21; see page 443 for analytical methods. Incident ESRD patients age 0–19; unadjusted.
90 94 98 02 06 10
0-4 5-14 15-19
90 94 98 02 06 100
5
10
15
20
25
30United States CORR
Rate
per
mill
ion
popu
latio
n
90 94 98 02 06 1090 94 98 02 06 100
20
40
60
80
White Black/Af Am Other
United States CORR
Rate
per
mill
ion
popu
latio
n
90 94 98 02 06 1090 94 98 02 06 100
2
4
6
8
10Hemodialysis Peritoneal dialysis Transplant
United States CORR
Rate
per
mill
ion
popu
latio
n
90 94 98 02 06 1090 94 98 02 06 100
5
10
15
20
Male Female All
United States CORR
Rate
per
mill
ion
popu
latio
n
90 94 98 02 06 1090 94 98 02 06 100
2
4
6
8
10GlomerulonephritisSecondary GN Cystic kidney Other
United States CORR
Rate
per
mill
ion
popu
latio
n
pediatric esrd
2
2012USRDSannualDataRepoRt
volumeESRD
304
pediatric ESRD in the United States & Canada
8.17 Incident rates of pediatric ESRD in
the United States & Canada, by age
8.19 Incident rates of pediatric ESRD in
the United States & Canada, by race
8.21 Incident rates of pediatric ESRD in the
United States & Canada, by modality
8.18 Incident rates of pediatric ESRD in the
United States & Canada, by gender
8.20 Incident rates of pediatric ESRD in the United
States & Canada, by primary diagnosis
vol 2
vol 2
vol 2
vol 2
vol 2
1
90 94 98 02 06 1090 94 98 02 06 100
20
40
60
80
100
Male Female All
United States CORR
Rate
per
mill
ion
popu
latio
n
90 94 98 02 06 1090 94 98 02 06 100
10
20
30
40GlomerulonephritisSecondary GN Cystic kidney Other
United States CORR
Rate
per
mill
ion
popu
latio
n
1991-19951996-2000
2001-20052006-2010
1991-19951996-2000
2001-20052006-2010
Rate
per
mill
ion
popu
latio
n
0
2
4
6
8Living donor
United StatesCORR
Deceased donor
90 94 98 02 06 1090 94 98 02 06 100
50
100
150
200
0-4 5-14 15-19
United States CORR
Rate
per
mill
ion
popu
latio
n
90 94 98 02 06 1090 94 98 02 06 100
100
200
300
400
500White Black/Af Am Other
United States CORR
Rate
per
mill
ion
popu
latio
n
90 94 98 02 06 1090 94 98 02 06 100
20
40
60
80Hemodialysis Peritoneal dialysis Transplant
United States CORR
Rate
per
mill
ion
popu
latio
n
305
8
8.23 Prevalent rates of pediatric ESRD in
the United States & Canada, by gender
8.25 Prevalent rates of pediatric ESRD in the United
States & Canada, by primary diagnosis
8.27 Pediatric first transplant rates in the
United States & Canada, by donor type
8.22 Prevalent rates of pediatric ESRD in
the United States & Canada, by age
8.24 Prevalent rates of pediatric ESRD in
the United States & Canada, by race
8.26 Prevalent rates of pediatric ESRD in the
United State & Canada, by modality
vol 2
vol 2
vol 2
vol 2
vol 2
vol 2
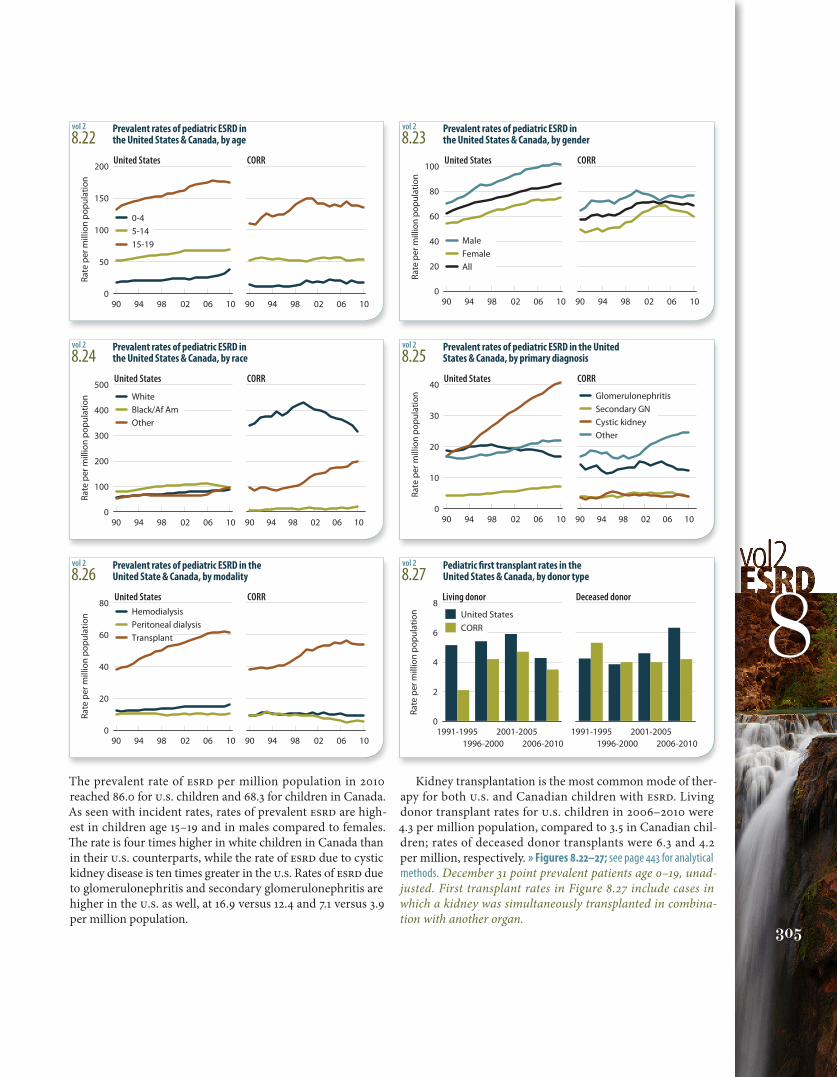
The prevalent rate of ESRD per million population in 2010 reached 86.0 for U.S. children and 68.3 for children in Canada. As seen with incident rates, rates of prevalent ESRD are high-est in children age 15–19 and in males compared to females. The rate is four times higher in white children in Canada than in their U.S. counterparts, while the rate of ESRD due to cystic kidney disease is ten times greater in the U.S. Rates of ESRD due to glomerulonephritis and secondary glomerulonephritis are higher in the U.S. as well, at 16.9 versus 12.4 and 7.1 versus 3.9 per million population.
Kidney transplantation is the most common mode of ther-apy for both U.S. and Canadian children with ESRD. Living donor transplant rates for U.S. children in 2006–2010 were 4.3 per million population, compared to 3.5 in Canadian chil-dren; rates of deceased donor transplants were 6.3 and 4.2 per million, respectively. » Figures 8.22–27; see page 443 for analytical methods. December 31 point prevalent patients age 0–19, unad-justed. First transplant rates in Figure 8.27 include cases in which a kidney was simultaneously transplanted in combina-tion with another organ.
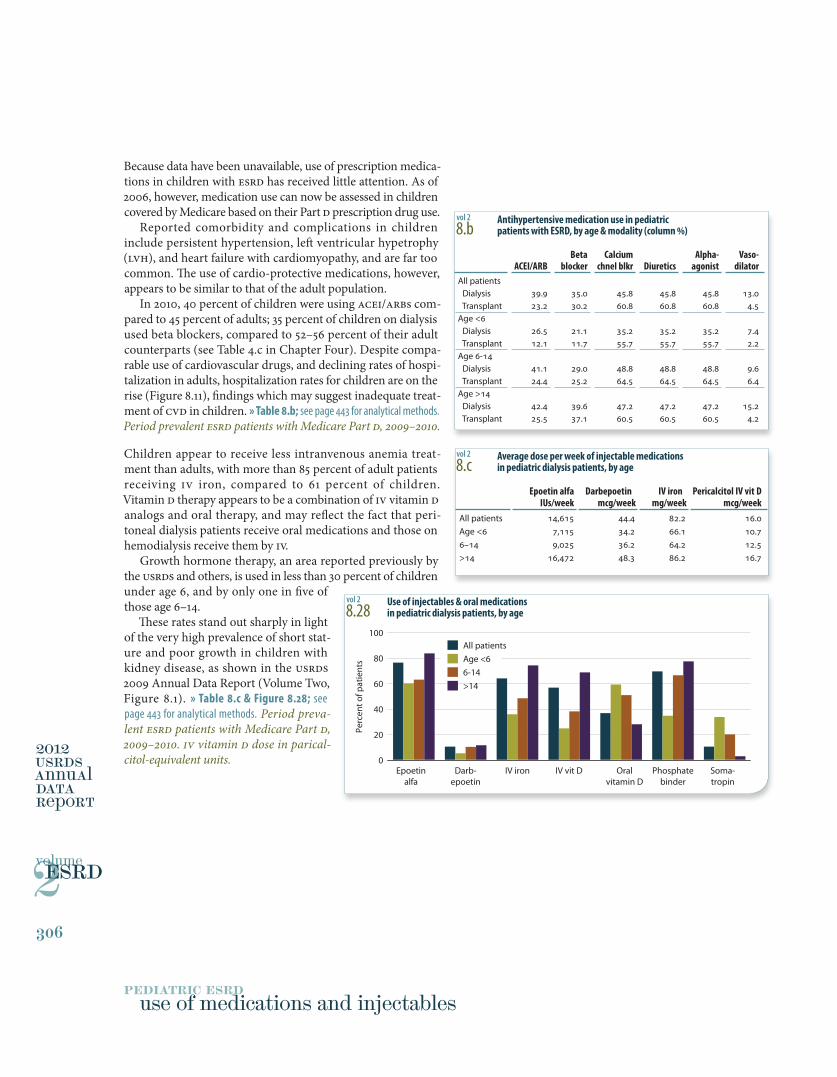
Children appear to receive less intranvenous anemia treat-ment than adults, with more than 85 percent of adult patients receiving IV iron, compared to 61 percent of children. Vitamin D therapy appears to be a combination of IV vitamin D analogs and oral therapy, and may reflect the fact that peri-toneal dialysis patients receive oral medications and those on hemodialysis receive them by IV.
Growth hormone therapy, an area reported previously by the USRDS and others, is used in less than 30 percent of children under age 6, and by only one in five of those age 6–14.
These rates stand out sharply in light of the very high prevalence of short stat-ure and poor growth in children with kidney disease, as shown in the USRDS 2009 Annual Data Report (Volume Two, Figure 8.1). » Table 8.c & Figure 8.28; see page 443 for analytical methods. Period preva-lent ESRD patients with Medicare Part D, 2009–2010. IV vitamin D dose in parical-citol-equivalent units.
Epoetinalfa
Darb-epoetin
IV iron IV vit D Oralvitamin D
Phosphatebinder
Soma-tropin
Perc
ent o
f pat
ient
s
0
20
40
60
80
100All patients Age <6 6-14 >14
pediatric esrd
2
2012USRDSannualDataRepoRt
volumeESRD
306
use of medications and injectables
Beta Calcium Alpha- Vaso- ACEI/ARB blocker chnel blkr Diuretics agonist dilatorAll patients Dialysis 39.9 35.0 45.8 45.8 45.8 13.0 Transplant 23.2 30.2 60.8 60.8 60.8 4.5Age <6 Dialysis 26.5 21.1 35.2 35.2 35.2 7.4 Transplant 12.1 11.7 55.7 55.7 55.7 2.2Age 6-14 Dialysis 41.1 29.0 48.8 48.8 48.8 9.6 Transplant 24.4 25.2 64.5 64.5 64.5 6.4Age >14 Dialysis 42.4 39.6 47.2 47.2 47.2 15.2 Transplant 25.5 37.1 60.5 60.5 60.5 4.2
Epoetin alfa Darbepoetin IV iron Pericalcitol IV vit D IUs/week mcg/week mg/week mcg/week
All patients 14,615 44.4 82.2 16.0Age <6 7,115 34.2 66.1 10.76–14 9,025 36.2 64.2 12.5>14 16,472 48.3 86.2 16.7
8.b Antihypertensive medication use in pediatric
patients with ESRD, by age & modality (column %)
8.c Average dose per week of injectable medications
in pediatric dialysis patients, by age
vol 2
vol 2
8.28 Use of injectables & oral medications
in pediatric dialysis patients, by agevol 2
Because data have been unavailable, use of prescription medica-tions in children with ESRD has received little attention. As of 2006, however, medication use can now be assessed in children covered by Medicare based on their Part D prescription drug use.
Reported comorbidity and complications in children include persistent hypertension, left ventricular hypetrophy (LVH), and heart failure with cardiomyopathy, and are far too common. The use of cardio-protective medications, however, appears to be similar to that of the adult population.
In 2010, 40 percent of children were using ACEI/ARBs com-pared to 45 percent of adults; 35 percent of children on dialysis used beta blockers, compared to 52–56 percent of their adult counterparts (see Table 4.c in Chapter Four). Despite compa-rable use of cardiovascular drugs, and declining rates of hospi-talization in adults, hospitalization rates for children are on the rise (Figure 8.11), findings which may suggest inadequate treat-ment of CVD in children. » Table 8.b; see page 443 for analytical methods. Period prevalent ESRD patients with Medicare Part D, 2009–2010.
1
307
8
8.d Top 25 drugs used in pediatric ESRD patients,
sorted by total days supply, 2009–2010
8.e Top 25 drugs used in pediatric ESRD patients, sorted by
percentage of patients with at least one fill, 2009–2010
vol 2
vol 2
Dialysis Total Transplant TotalGeneric name days supply Generic name days supplySevelamer 121,409 Sulfamethoxazole-Trimethoprim 201,368Amlodipine 96,633 Amlodipine 177,744Calcitriol 77,784 Prednisone or Prednisolone 168,680Cinacalcet 64,755 Valganciclovir 127,089Calcium acetate 62,678 Omeprazole 66,711Clonidine 61,667 Ranitidine 52,745Lisinopril 55,928 Tacrolimus 46,794Nifedipine 39,063 Famotidine 43,731Enalapril 35,938 Atenolol 38,993Labetalol 32,710 Clonidine 36,913Metoprolol 32,571 Labetalol 36,299Somatropin 29,418 Lisinopril 35,639Omeprazole 29,194 Nystatin 35,560Carvedilol 25,898 Nifedipine 34,021Minoxidil 20,827 Lansoprazole 32,106Benzocaine 20,378 Calcitriol 32,023Levetiracetam 20,337 Enalapril 31,971Prednisone 20,145 Mycophenolate 31,618Lansoprazole 19,538 Furosemide 26,174Ranitidine 18,904 Esomeprazole 23,725Atenolol 17,242 Nitrofurantoin 22,730Levothyroxine 16,976 Metoprolol 18,659Sulfamethoxazole-Trimethoprim 16,431 Oxybutynin 17,702Paricalcitol 14,346 Levothyroxine 17,402Metoclopramide 14,058 Metoclopramide 16,270
Dialysis Transplant Generic name Percent Generic name PercentSevelamer (carbonate or hydrochloride) 47.9 Sulfamethoxazole-Trimethoprim 72.5Amlodipine 33.2 Valganciclovir 59.7Calcitriol 31.1 Prednisone or Prednisolone 54.7Calcium acetate 27.7 Amlodipine 50.5Cinacalcet 24.6 Amoxicillin 33.9Amoxicillin 24.3 Nystatin 32.6Hydrocodone-Acetaminophen 23.0 Omeprazole 21.1Lisinopril 20.1 Ranitidine 20.1Clonidine 19.9 Ciprofloxacin 18.8Azithromycin 16.8 Hydrocodone-Acetaminophen 18.6Cephalexin 15.8 Azithromycin 17.0Mupirocin 15.2 Amoxicillin-Potassium clavulanate 16.8Nifedipine 13.6 Cephalexin 15.7Prednisone or Prednisolone 13.2 Famotidine 15.7Enalapril 13.2 Furosemide 15.5Sulfamethoxazole-Trimethoprim 12.6 Clonidine 14.8Omeprazole 12.3 Tacrolimus 13.7Ciprofloxacin 12.2 Nifedipine 13.5Polyethylene glycol 3350 12.1 Calcitriol 13.3Benzocaine-Benzethonium 11.8 Lansoprazole 13.1Sodium polystyrene sulfonate 11.6 Cefdinir 12.9Metoprolol 11.4 Labetalol 12.6Labetalol 11.3 Oseltamivir 12.3Somatropin 10.7 Lisinopril 12.2Oxycodone-Acetaminophen 10.6 Acetaminophen-Codeine 12.0
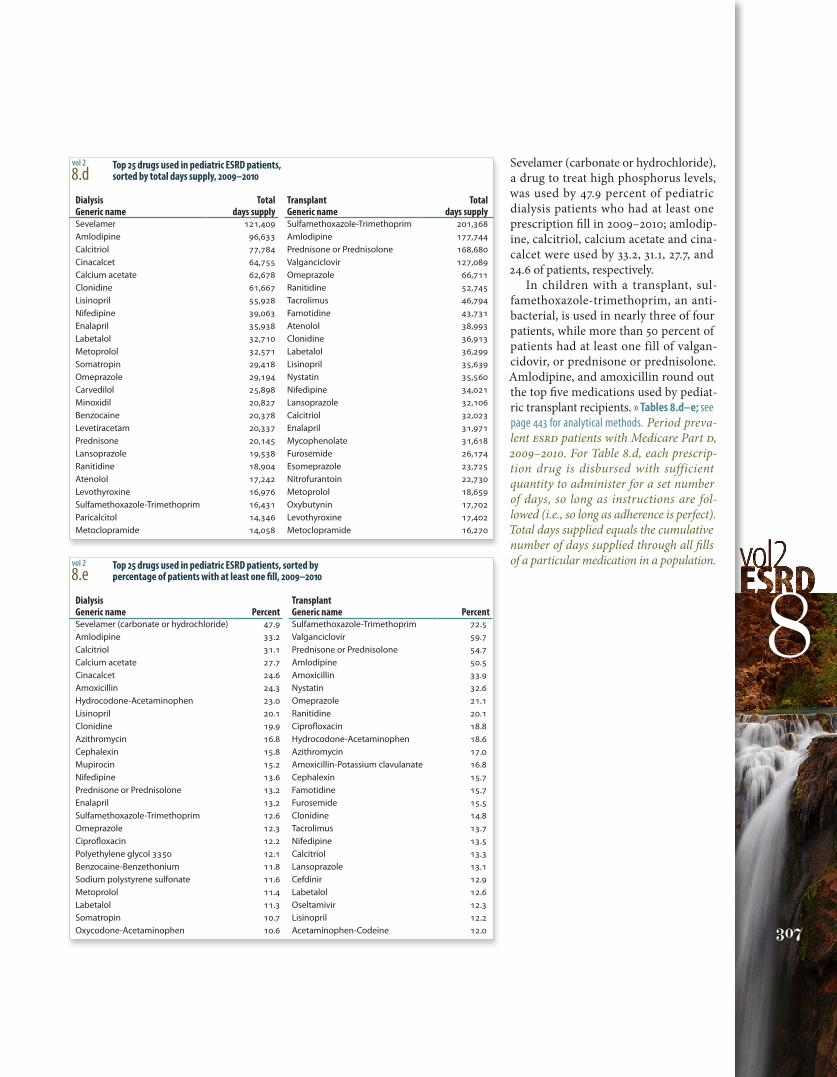
Sevelamer (carbonate or hydrochloride), a drug to treat high phosphorus levels, was used by 47.9 percent of pediatric dialysis patients who had at least one prescription fill in 2009–2010; amlodip-ine, calcitriol, calcium acetate and cina-calcet were used by 33.2, 31.1, 27.7, and 24.6 of patients, respectively.
In children with a transplant, sul-famethoxazole-trimethoprim, an anti-bacterial, is used in nearly three of four patients, while more than 50 percent of patients had at least one fill of valgan-cidovir, or prednisone or prednisolone. Amlodipine, and amoxicillin round out the top five medications used by pediat-ric transplant recipients. » Tables 8.d–e; see page 443 for analytical methods. Period preva-lent ESRD patients with Medicare Part D, 2009–2010. For Table 8.d, each prescrip-tion drug is disbursed with sufficient quantity to administer for a set number of days, so long as instructions are fol-lowed (i.e., so long as adherence is perfect). Total days supplied equals the cumulative number of days supplied through all fills of a particular medication in a population.
2012USRDSannualDataRepoRt
volumeESRD
308
pediatric esrd
2
summary
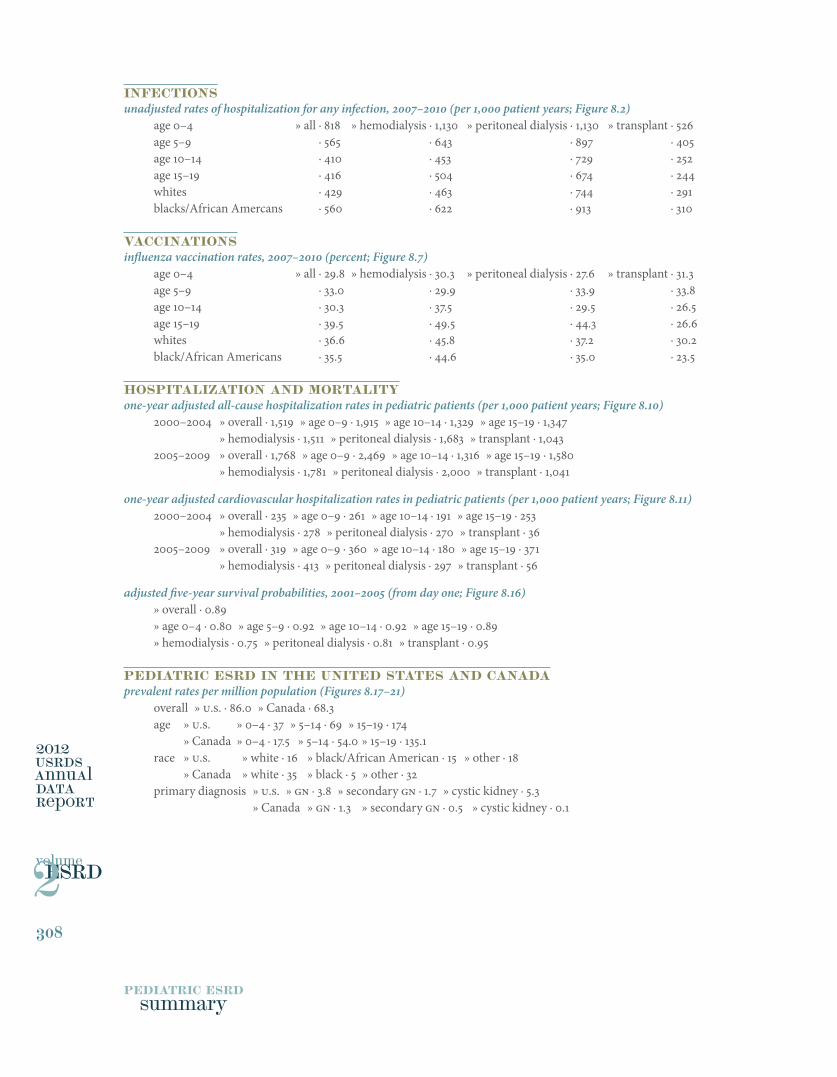
infectionsunadjusted rates of hospitalization for any infection, 2007–2010 (per 1,000 patient years; Figure 8.2)
age 0–4 » all · 818 » hemodialysis · 1,130 » peritoneal dialysis · 1,130 » transplant · 526age 5–9 » all · 565 » hemodialysis · 643 » peritoneal dialysis · 897 » transplant · 405age 10–14 » all · 410 » hemodialysis · 453 » peritoneal dialysis · 729 » transplant · 252age 15–19 » all · 416 » hemodialysis · 504 » peritoneal dialysis · 674 » transplant · 244whites » all · 429 » hemodialysis · 463 » peritoneal dialysis · 744 » transplant · 291blacks/African Amercans » all · 560 » hemodialysis · 622 » peritoneal dialysis · 913 » transplant · 310
Vaccinationsinfluenza vaccination rates, 2007–2010 (percent; Figure 8.7)
age 0–4 » all · 29.8 » hemodialysis · 30.3 » peritoneal dialysis · 27.6 » transplant · 31.3age 5–9 » all · 33.0 » hemodialysis · 29.9 » peritoneal dialysis · 33.9 » transplant · 33.8age 10–14 » all · 30.3 » hemodialysis · 37.5 » peritoneal dialysis · 29.5 » transplant · 26.5age 15–19 » all · 39.5 » hemodialysis · 49.5 » peritoneal dialysis · 44.3 » transplant · 26.6whites » all · 36.6 » hemodialysis · 45.8 » peritoneal dialysis · 37.2 » transplant · 30.2black/African Americans » all · 35.5 » hemodialysis · 44.6 » peritoneal dialysis · 35.0 » transplant · 23.5
hospitalization and mortalityone-year adjusted all-cause hospitalization rates in pediatric patients (per 1,000 patient years; Figure 8.10)
2000–2004 » overall · 1,519 » age 0–9 · 1,915 » age 10–14 · 1,329 » age 15–19 · 1,347 » hemodialysis · 1,511 » peritoneal dialysis · 1,683 » transplant · 1,0432005–2009 » overall · 1,768 » age 0–9 · 2,469 » age 10–14 · 1,316 » age 15–19 · 1,580 » hemodialysis · 1,781 » peritoneal dialysis · 2,000 » transplant · 1,041
one-year adjusted cardiovascular hospitalization rates in pediatric patients (per 1,000 patient years; Figure 8.11)2000–2004 » overall · 235 » age 0–9 · 261 » age 10–14 · 191 » age 15–19 · 253 » hemodialysis · 278 » peritoneal dialysis · 270 » transplant · 362005–2009 » overall · 319 » age 0–9 · 360 » age 10–14 · 180 » age 15–19 · 371 » hemodialysis · 413 » peritoneal dialysis · 297 » transplant · 56
adjusted five-year survival probabilities, 2001–2005 (from day one; Figure 8.16)» overall · 0.89 » age 0–4 · 0.80 » age 5–9 · 0.92 » age 10–14 · 0.92 » age 15–19 · 0.89 » hemodialysis · 0.75 » peritoneal dialysis · 0.81 » transplant · 0.95
pediatric esrd in the united states and canadaprevalent rates per million population (Figures 8.17–21)
overall » U.S. · 86.0 » Canada · 68.3age » U.S. » 0–4 · 37 » 5–14 · 69 » 15–19 · 174 » Canada » 0–4 · 17.5 » 5–14 · 54.0 » 15–19 · 135.1race » U.S. » white · 16 » black/African American · 15 » other · 18 » Canada » white · 35 » black · 5 » other · 32primary diagnosis » U.S. » GN · 3.8 » secondary GN · 1.7 » cystic kidney · 5.3 » Canada » GN · 1.3 » secondary GN · 0.5 » cystic kidney · 0.1