HAUORA WAITAHA I - Canterbury District Health Board - Home
198
HAUORA WAITAHA I Health Profile for Māori in Canterbury Canterbury District Health Board April 2010
Transcript of HAUORA WAITAHA I - Canterbury District Health Board - Home

HAUORA WAITAHA I Health Profile for Māori in Canterbury
Canterbury District Health Board
April 2010

Citation: Reid, M. 2010. Hauora Waitaha I - Health Profile for Māori in
Canterbury. Christchurch: Canterbury District Health Board.
Published in April 2010 by Canterbury District Health Board, PO Box 1600,
Christchurch, New Zealand.
This document is available on the website: www.cdhb.govt.nz
ISBN 978-0-473-16858-2 (electronic)
ISBN 978-0-473-16859-9 (print)

Mihi
Tēnā koutou katoa ngā iwi o Waitaha.
Mokori anō te mihi mō tō koutou āwhina
me tō koutou tautoko i tēnei mahi me ōna
hua hirahira ka puta mai.
Ko te tumanako, he oranga kei roto.
Ko tōna panekiritanga,ko ngā kōrero kua
kohia,ka whakatairanga i te hauora o te iwi.
Kua kohikohia enei whakamōhiotanga, mai
i ngā rauemi katoa mō tenei pūrongo, hei
whakanui ake i ngā mōhio hauora o te iwi
kia nui ake ngā hua ka whiwhi.
Ko te hiahia, ko ngā mōhiotanga kei roto i tēnei
Pūrongo, ka whakaatuhia he mōhiotanga o ngā take
hauora mō ngā iwi o Waitaha. Mā tēnei,ka taea
e ngā iwi o Waitaha me wahi kē hoki, te tū pakari
me te mōhio ki te āhua o tō rātou tūranga hauora, ā, ka
pewhea hoki e whakatutukihia ai.
“Heoti ake, e ngā iwi o Waitaha, ngā mihi me ngā whakau,
Tēnā koutou.”
Greetings to the esteemed people of Canterbury. We congratulate and commend you for
your support and endorsement of this work, and the positive benefits that we hope may
result from it.
The hope is that the information presented will contribute positively to the health of the
people. Information has been gathered from many sources in this report to improve the
knowledge of the health of the people, so that as much benefit as possible can be gained
from its use.

It is hoped that this report will add to the knowledge of the obstacles to health for the
people of Canterbury. In this way the people of Canterbury and elsewhere can be
empowered with understanding of their health status to be better able to work to
overcome those obstacles.
Finally, greetings and salutations to the people of Canterbury.

Acknowledgements
This health profile was prepared for the Canterbury District Health Board by:
Dr Matthew Reid, Community and Public Health, CDHB
With the assistance of:
• Dr Annabel Begg and Dr Ramon Pink, Community and Public Health, CDHB
• Hector Mathews, Executive Director Māori and Pacific Health, CDHB
• Dr Ricci Harris and Gordon Purdie, Te Rōpū Rangahau Hauora a Eru Pōmare,
University of Otago, Wellington
• Dr Ann Richardson, Dr Cheryl Brunton, Ted Mita Te Hae, Susan Bidwell, Chris
Ambrose, and Chivala Hope, Community and Public Health, CDHB
• Alisdair Duncan, Bede Oulaghan, and Dr Greg Hamilton, Planning and Funding,
CDHB
• Dr Martin Lee and Dr. Tule fanakava Misa, Community Dental Services, CDHB
• Dr Elisabeth Wells, Department of General Practice and Public Health, University of
Otago, Christchurch
• Dr Liz Craig, New Zealand Child and Youth Epidemiology Service, Department of
Women’s and Children’s Health, University of Otago, Dunedin
• Janine Paynter, Action on Smoking and Health
• Simon Ross, Information Directorate, Ministry of Health
• Wayne Gough, Statistics New Zealand

7
Table of Contents
List of Tables................................................................................................................................ 11
List of Figures .............................................................................................................................. 15
Executive Summary..................................................................................................................... 19
Demographic, social and risk data........................................................................... 19
Health data .................................................................................................................. 20
1 Introduction .......................................................................................................................... 25
1.1 Scope of this health profile .......................................................................................... 25
1.2 Data sources and methodological issues.................................................................... 27
2 Demographic Profile ........................................................................................................... 29
2.1 Canterbury population characteristics ........................................................................ 29
2.2 Canterbury Māori .......................................................................................................... 30
Māori population characteristics.............................................................................. 30
Births............................................................................................................................ 32
Māori population age and gender distribution....................................................... 33
Population projections .............................................................................................. 37
Iwi................................................................................................................................. 38
3 Social Indicators ................................................................................................................... 41
3.1 Socioeconomic determinants of health ...................................................................... 41
Socioeconomic deprivation ...................................................................................... 41
Social and economic indicators................................................................................ 46
3.2 Māori population geographical distribution .............................................................. 48
4 Risk and Protective Factors ................................................................................................ 53
4.1 Protective factors........................................................................................................... 54
4.2 Risk factors ..................................................................................................................... 55
Tobacco ....................................................................................................................... 57
5 Health Status ......................................................................................................................... 63
5.1 Mortality.......................................................................................................................... 63
All-cause mortality ..................................................................................................... 63
Causes of mortality .................................................................................................... 64
5.2 Hospitalisation ............................................................................................................... 68
Major causes of hospitalisation ................................................................................ 69
5.3 Self-reported health....................................................................................................... 77

8
5.4 Cardiovascular disease .................................................................................................. 78
Cardiovascular disease deaths and hospitalisation ................................................ 79
Ischaemic heart disease ............................................................................................. 80
Stroke ........................................................................................................................... 83
Heart failure ................................................................................................................ 85
Hypertensive disease.................................................................................................. 86
Chronic rheumatic heart disease .............................................................................. 87
5.5 Cancer ............................................................................................................................. 89
Cancer deaths and registrations ............................................................................... 90
Lung cancer................................................................................................................. 92
Colorectal cancer........................................................................................................ 95
Breast cancer............................................................................................................... 96
Screening ..................................................................................................................... 97
5.6 Respiratory disease ...................................................................................................... 101
Respiratory disease deaths and hospitalisation .................................................... 101
Asthma, COPD, pneumonia and bronchiectasis ................................................ 103
5.7 Diabetes ........................................................................................................................ 106
Diabetes prevalence ................................................................................................. 106
Type 2 diabetes mortality and hospitalisation...................................................... 107
Diabetes complications ........................................................................................... 109
Diabetes management ............................................................................................. 110
5.8 Communicable disease................................................................................................ 112
Infectious disease mortality and hospitalisation .................................................. 112
Notifiable communicable diseases......................................................................... 114
Immunisation coverage – children ........................................................................ 117
5.9 Mental health................................................................................................................ 119
Access to services..................................................................................................... 120
Mental health hospitalisations ................................................................................ 121
Alcohol and drug use hospitalisations .................................................................. 123
Suicide mortality....................................................................................................... 125
5.10 Injury ............................................................................................................................. 126
Injury mortality......................................................................................................... 126
Injury morbidity ....................................................................................................... 127
5.11 Oral health .................................................................................................................... 130

9
Oral health status in children ................................................................................. 130
Hospitalisation and treatment for dental disease................................................. 132
5.12 Tamariki / Child and Rangatahi / Youth health .................................................... 134
Preterm birth............................................................................................................. 135
Low birthweight, perinatal mortality and infant mortality ................................. 136
Breastfeeding ............................................................................................................ 137
Hospitalisations ........................................................................................................ 140
5.13 Sexual and reproductive health.................................................................................. 147
Hospitalisations for pregnancy-related conditions.............................................. 147
Birth procedures....................................................................................................... 148
Teenage births .......................................................................................................... 151
Sexually transmitted infections............................................................................... 151
5.14 Kaumatua / Older persons’ health ........................................................................... 153
Facility use................................................................................................................. 153
6 Health Service Utilisation.................................................................................................. 155
6.1 Primary health care...................................................................................................... 155
General practitioner utilisation............................................................................... 155
PHO enrolment........................................................................................................ 157
6.2 Canterbury District Health Board............................................................................. 158
Hospital activity........................................................................................................ 158
6.3 Prescriptions................................................................................................................. 161
6.4 Laboratory tests ........................................................................................................... 162
7 Health System Indicators .................................................................................................. 165
7.1 Avoidable mortality and hospitalisation................................................................... 165
Ambulatory sensitive hospitalisation..................................................................... 167
8 Appendices .......................................................................................................................... 169
Appendix 1 Data sources and methodological issues ...................................................... 169
Data sources.............................................................................................................. 169
Methodological issues.............................................................................................. 173
Appendix 2 Iwi in Canterbury ............................................................................................. 177
Appendix 3 Health status tables .......................................................................................... 180
Cardiovascular disease ............................................................................................. 180
Cancer ........................................................................................................................ 183
Respiratory disease................................................................................................... 184

10
Diabetes ..................................................................................................................... 186
Mental health ............................................................................................................ 187
Avoidable mortality and hospitalisations.............................................................. 188
9 References ........................................................................................................................... 189

11
List of Tables
Table 2.1 Number and proportion of people indicating each ethnic group, by district,
Canterbury and New Zealand, 2006 ................................................................................... 30
Table 2.2 Number and proportion of Māori in each territorial local authority, and inter-
Census increase, Canterbury and New Zealand, 2001 and 2006.................................... 31
Table 2.3 Live births, crude birth rate, and general fertility rate, Canterbury and New
Zealand, 2006 ......................................................................................................................... 32
Table 2.4 Live births, Canterbury and New Zealand, 1999-2008 ........................................ 33
Table 2.5 Age distribution, by life-cycle age group, Canterbury and New Zealand, 200634
Table 2.6 Projected populations, Canterbury and New Zealand, 2006-2026 .................... 37
Table 2.7 Projected age distributions, by life-cycle age group, Canterbury, 2006 and 2021
.................................................................................................................................................. 38
Table 2.8 Iwi affiliation, Canterbury and New Zealand, 2006 ............................................. 39
Table 3.1 Deprivation, by decile, Canterbury and New Zealand, 2006 .............................. 43
Table 3.2 Social and economic indicators, Canterbury and New Zealand, 2006 .............. 47
Table 3.3 Access to home heating, Canterbury and New Zealand, 2006 ........................... 47
Table 4.1 Protective factor prevalence, 15+ years, Canterbury and New Zealand,
2006/07................................................................................................................................... 54
Table 4.2 Risk factor prevalence, 15+ years, Canterbury and New Zealand, 2006/07 .... 56
Table 4.3 Prevalence of medicated risk factors, 15+ years, Canterbury and New Zealand,
2006/07................................................................................................................................... 57
Table 4.4 Current daily smokers, 15+ years, by gender, Canterbury and New Zealand,
2006.......................................................................................................................................... 58
Table 5.1 All-cause mortality, all ages, Canterbury and New Zealand, 2000-2004 ........... 64
Table 5.2 Leading causes of death, all ages, Canterbury and New Zealand, 2000-2004 .. 66
Table 5.3 Five leading causes of death, ranked by mortality rate, Canterbury and New
Zealand, 2000-2004 ............................................................................................................... 67
Table 5.4 Public hospitalisations, all ages, Canterbury and New Zealand, 2003-2005 ..... 69
Table 5.5 Leading causes of public hospitalisation, by major cause of admission, all ages,
Canterbury and New Zealand, 2003-2005 ......................................................................... 75
Table 5.6 Major causes of public hospitalisation, as percentage of total activity, all ages,
Canterbury and New Zealand, 2003-2005 ......................................................................... 76

12
Table 5.7 Prevalence of self-reported excellent or very good health, 15+ years,
Canterbury and New Zealand, 2006/07............................................................................. 77
Table 5.8 Prevalence of self-reported ischaemic heart disease, 15+ years, Canterbury and
New Zealand, 2006/07 ......................................................................................................... 80
Table 5.9 Prevalence of self-reported stroke, 15+ years, Canterbury and New Zealand,
2006/07................................................................................................................................... 84
Table 5.10 Prevalence of self-reported asthma requiring medication and COPD, 15+
years, Canterbury and New Zealand, 2006/07................................................................ 104
Table 5.11 Prevalence of self-reported diabetes, 15+ years, Canterbury and New Zealand,
2006/07................................................................................................................................. 107
Table 5.12 Hospitalisation for long term complications of diabetes, 15+ years,
Canterbury and New Zealand, 2005-07 ........................................................................... 109
Table 5.13 Infectious disease mortality (2000-2004) and hospitalisations (2003-2005), all
ages, Canterbury and New Zealand .................................................................................. 113
Table 5.14 Communicable disease notifications, all ages, Canterbury and New Zealand,
2008........................................................................................................................................ 115
Table 5.15 Notifiable communicable diseases, all ages, Canterbury, 2004-2008 ............. 117
Table 5.16 Mental and behavioural disorder hospitalisations, all ages, Canterbury and
New Zealand, 2003-2005.................................................................................................... 123
Table 5.17 Disorders due to psychoactive substance use, all ages, Canterbury and New
Zealand, 2003-2005 ............................................................................................................. 124
Table 5.18 Deaths from suicide, all ages, Canterbury and New Zealand, 2000-2004..... 125
Table 5.19 External causes of mortality, all ages, Canterbury and New Zealand, 2000-
2004........................................................................................................................................ 127
Table 5.20 Injury morbidity, all ages, Canterbury and New Zealand, 2001-2007 ........... 129
Table 5.21 Oral health status, 5 years and 11-12 years (Year 8), Canterbury and New
Zealand, 2007 ....................................................................................................................... 131
Table 5.22 Severe early childhood dental decay, 5 years, Canterbury, 2008..................... 131
Table 5.23 Hospitalisation for disorders of the teeth and gums, and hospital procedures
for dental disease, all ages, Canterbury and New Zealand, 2003-2005........................ 132
Table 5.24 Dental treatment under general anaesthesia, 0-9 years, Canterbury, 2006-2008
................................................................................................................................................ 133
Table 5.25 Treatment done under general anaesthesia, 0-13 years, Canterbury, 2006-2008
................................................................................................................................................ 133

13
Table 5.26 Low birthweight, perinatal mortality, and infant mortality, rates per 1,000 live
births, Canterbury and New Zealand, 2003-05 ............................................................... 137
Table 5.27 Procedures associated with birth, females, Canterbury and New Zealand,
1999-2008.............................................................................................................................. 150
Table 5.28 Sexually transmitted infection, all ages, Canterbury Sexual Health, Family
Planning and Student and Youth Health Clinics, 2007-2008........................................ 152
Table 5.29 Facility use by older people, Canterbury, 2009 ................................................. 153
Table 6.1 Prevalence of visiting a GP and unmet need for a GP in previous 12 months,
15+ years, Canterbury and New Zealand, 2006/07 ....................................................... 156
Table 6.2 Dispensing through non-hospital pharmacies, all ages, Canterbury, 2005-2009
................................................................................................................................................ 162
Table 6.3 Laboratory testing, all ages, Canterbury, 2005-2009........................................... 163
Table 8.1 Iwi, Canterbury and New Zealand, 2006 (full list).............................................. 177
Table 8.2 Cardiovascular disease deaths (2000-2004) and hospitalisations (2003-2005), all
ages, Canterbury and New Zealand .................................................................................. 180
Table 8.3 Ischaemic heart disease mortality (2000-2004), hospitalisations and hospital
procedures (2003-2005), all ages, Canterbury and New Zealand ................................. 181
Table 8.4 Stroke mortality (2000-2004), hospitalisations and hospital procedures (2003-
2005), all ages, Canterbury and New Zealand ................................................................. 181
Table 8.5 Heart failure mortality (2000-2004), hospitalisations (2003-2005), all ages,
Canterbury and New Zealand............................................................................................ 182
Table 8.6 Hypertensive disease mortality (2000-2004), hospitalisations (2003-2005), all
ages, Canterbury and New Zealand .................................................................................. 182
Table 8.7 Chronic rheumatic heart disease mortality (2000-2004), hospitalisations and
hospital procedures (2003-2005), all ages, Canterbury and New Zealand .................. 182
Table 8.8 Cancer mortality and registrations (2000-2004), all ages, Canterbury and New
Zealand, all sites and top ten sites ranked by mortality for Canterbury Māori........... 183
Table 8.9 Lung cancer deaths and registrations, by gender, all ages, Canterbury and New
Zealand, 2000-2004 ............................................................................................................. 184
Table 8.10 Cervical cancer mortality and registrations (2000-2004), cervical cancer and
cervical carcinoma in situ hospitalisations (2003-2005), females, all ages, Canterbury
and New Zealand................................................................................................................. 184
Table 8.11 Respiratory disease mortality (2000-2004) and hospitalisations (2003-2005), all
ages, Canterbury and New Zealand .................................................................................. 184

14
Table 8.12 Chronic obstructive pulmonary disease mortality (2000-2004) and
hospitalisations (2003-2005), all ages, Canterbury and New Zealand.......................... 185
Table 8.13 Asthma mortality (2000-2004) and hospitalisations (2003-2005), all ages,
Canterbury and New Zealand............................................................................................ 185
Table 8.14 Pneumonia mortality (2000-2004) and hospitalisations (2003-2005), all ages,
Canterbury and New Zealand............................................................................................ 185
Table 8.15 Bronchiectasis mortality (2000-2004) and hospitalisations (2003-2005), all
ages, Canterbury and New Zealand .................................................................................. 186
Table 8.16 Acute bronchitis and bronchiolitis hospitalisations, all ages, Canterbury and
New Zealand, 2003-2005.................................................................................................... 186
Table 8.17 Type 2 diabetes mortality (2000-2004) and hospitalisations (2003-2005), all
ages, Canterbury and New Zealand .................................................................................. 186
Table 8.18 Type 1 diabetes mortality (2000-2004) and hospitalisations (2003-2005), all
ages, Canterbury and New Zealand .................................................................................. 187
Table 8.19 Mental health and behavioural disorder hospitalisation, all ages, Canterbury
and New Zealand, 2003-2005 ............................................................................................ 187
Table 8.20 Avoidable mortality (2003-05) and hospitalisations (2005-07), 0-74 years,
Canterbury and New Zealand............................................................................................ 188

15
List of Figures
Figure 2.1 Age distribution of Canterbury Māori population, males and females, 2006.. 35
Figure 2.2 Age distribution of the Canterbury non-Māori population, males and females,
2006.......................................................................................................................................... 35
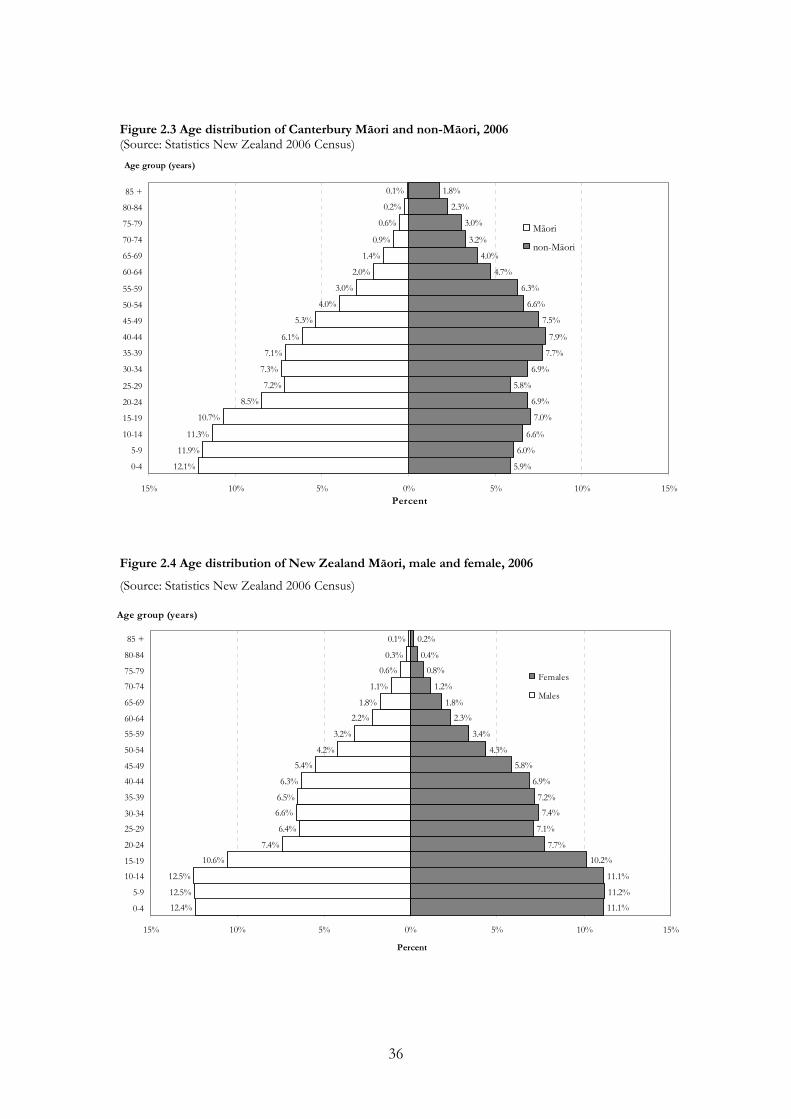
Figure 2.3 Age distribution of Canterbury Māori and non-Māori, 2006 ............................ 36
Figure 2.4 Age distribution of New Zealand Māori, male and female, 2006 ..................... 36
Figure 3.1 Deprivation profile, Canterbury, all ethnicities, 2006 ......................................... 43
Figure 3.2 Deprivation profile, Canterbury, 2006 .................................................................. 44
Figure 3.3 Deprivation profile, Canterbury, by iwi, 2006...................................................... 44
Figure 3.4 Deprivation profile, New Zealand, 2006 .............................................................. 45
Figure 3.5 Deprivation profile for Māori, Canterbury and New Zealand, 2006................ 45
Figure 3.6 Māori population counts, Christchurch and surrounds, 2006........................... 49
Figure 3.7 Māori population counts, Hurunui – Kaikoura, 2006 ........................................ 50
Figure 3.8 Māori population counts, Selwyn – Banks Peninsula – Ashburton, 2006....... 51
Figure 3.9 Māori population counts cartogram Canterbury area, 2006 .............................. 52
Figure 4.1 Current regular smokers, 15+ years, by age group, Canterbury and NZ, 2006
.................................................................................................................................................. 58
Figure 4.2 Current smokers, 14-15 year olds, Canterbury and New Zealand, 2008 ......... 59
Figure 4.3 Daily smokers, 14-15 year olds, Canterbury and New Zealand, 1999-2008.... 60
Figure 4.4 Never smokers, 14-15 year olds, Canterbury and New Zealand, 1999-2008 .. 60
Figure 4.5 Parental smoking in the home, Canterbury and New Zealand, 2001-2008..... 61
Figure 5.1 Cardiovascular disease deaths, all ages, Canterbury and New Zealand, 2000-
2004.......................................................................................................................................... 79
Figure 5.2 Cardiovascular disease hospitalisations, all ages, Canterbury and New Zealand,
2003-2005................................................................................................................................ 80
Figure 5.3 Ischaemic heart disease deaths, all ages, Canterbury and New Zealand, 2000-
2004.......................................................................................................................................... 81
Figure 5.4 Ischaemic heart disease hospitalisations, all ages, Canterbury and New
Zealand, 2003-2005 ............................................................................................................... 82
Figure 5.5 Ischaemic heart disease hospital procedures, all ages, Canterbury and New
Zealand, 2003-2005 ............................................................................................................... 83

16
Figure 5.6 Stroke hospitalisations (2003-2005) and mortality (2000-2004), all ages,
Canterbury and New Zealand.............................................................................................. 84
Figure 5.7 Heart failure hospitalisations, all ages, Canterbury and New Zealand, 2003-
2005.......................................................................................................................................... 85
Figure 5.8 Hypertensive disease hospitalisations (2003-2005) and deaths (2000-2004), all
ages, Canterbury and New Zealand .................................................................................... 86
Figure 5.9 Chronic rheumatic heart disease hospitalisations (2003-2005), mortality (2000-
2004), and valve replacement (2003-2005), all ages, Canterbury and New Zealand.... 88
Figure 5.10 Cancer mortality, all sites, all ages, Canterbury and New Zealand, 2000-2004
.................................................................................................................................................. 90
Figure 5.11 Cancer registrations, all sites, all ages, Canterbury and New Zealand, 2000-
2004.......................................................................................................................................... 92
Figure 5.12 Lung cancer mortality and registrations, all ages, Canterbury and New
Zealand, 2000-2004 ............................................................................................................... 93
Figure 5.13 Lung cancer registrations and deaths, by gender, all ages, Canterbury and
New Zealand, 2000-2004...................................................................................................... 94
Figure 5.14 Colorectal cancer mortality and registrations, all ages, Canterbury and New
Zealand, 2000-2004 ............................................................................................................... 95
Figure 5.15 Breast cancer mortality and registrations, all ages, Canterbury and New
Zealand, 2000-2004 ............................................................................................................... 97
Figure 5.16 Breast screening coverage, Canterbury, 2006/07 and 2008/09 ...................... 98
Figure 5.17 Cervical screening coverage, Canterbury, 2006-2009 ..................................... 100
Figure 5.18 Respiratory disease mortality, all ages, Canterbury and New Zealand, 2000-
2004........................................................................................................................................ 102
Figure 5.19 Respiratory disease hospitalisation, all ages, Canterbury and New Zealand,
2003-2005.............................................................................................................................. 103
Figure 5.20 Asthma, COPD, pneumonia, and bronchiectasis hospitalisations, all ages,
Canterbury and New Zealand, 2003-2005 ....................................................................... 105
Figure 5.21 Type 2 diabetes mortality, all ages, Canterbury and New Zealand, 2000-2004
................................................................................................................................................ 108
Figure 5.22 Type 2 diabetes hospitalisation, Canterbury and New Zealand, 2003-2005 108
Figure 5.23 Diabetes annual reviews, all ages, 2005-2009................................................... 110
Figure 5.24 Diabetes retinal screening, all ages, 2006-2009................................................ 111

17
Figure 5.25 Immunisation coverage, at milestone ages, Canterbury and New Zealand,
2008/09................................................................................................................................. 118
Figure 5.26 Utilisation of mental health treatment and support services, by age group,
Canterbury, 2005-2009........................................................................................................ 121
Figure 5.27 Hospitalisation for mental and behavioural disorders, all ages, Canterbury
and New Zealand, 2003-2005 ............................................................................................ 122
Figure 5.28 Severe early childhood caries, 5 years, Canterbury, 1996-2008 ..................... 132
Figure 5.29 Preterm birth, by ethnicity, Canterbury and New Zealand, 1996-2007 ....... 135
Figure 5.30 Percent of Plunket babies fully / exclusively breastfed at 6 weeks, 3 months
and 6 months, Canterbury and New Zealand, 2008....................................................... 138
Figure 5.31 Proportion of Plunket babies fully or exclusively breastfed at six weeks,
Canterbury, 2005-2009........................................................................................................ 139
Figure 5.32 Proportion of Plunket babies fully or exclusively breastfed at three months,
Canterbury, 2007-2009*...................................................................................................... 139
Figure 5.33 Proportion of Plunket babies fully or exclusively breastfed at six months,
Canterbury, 2005-2009........................................................................................................ 140
Figure 5.34 Upper respiratory tract infection admissions 0-14 years, Canterbury, 1996-
2007........................................................................................................................................ 141
Figure 5.35 Waiting list admissions for tonsillectomy, 0-14 years, Canterbury and New
Zealand, 1996-2007 ............................................................................................................. 141
Figure 5.36 Otitis media admissions and grommets waiting list admissions, 0-14 years,
Canterbury, 1996-2007........................................................................................................ 142
Figure 5.37 Proportion of children failing school entry audiometry tests, 4 years,
Canterbury, 2003-2007........................................................................................................ 143
Figure 5.38 Bronchiolitis admissions, under-1 year olds, Canterbury and New Zealand,
1996-2007.............................................................................................................................. 143
Figure 5.39 Pneumonia admissions, 0-24 years, Canterbury and New Zealand, 1996-2007
................................................................................................................................................ 144
Figure 5.40 Asthma admissions, 0-24 years, Canterbury and New Zealand, 1996-2007 145
Figure 5.41 Severe skin infection admissions, 0-24 years, Canterbury and New Zealand,
1996-2007.............................................................................................................................. 145
Figure 5.42 Gastroenteritis admissions, 0-24 years, Canterbury and New Zealand, 1996-
2007........................................................................................................................................ 146

18
Figure 5.43 Births to teenagers, females, 15-19 years, Canterbury and New Zealand,
1996-2007.............................................................................................................................. 151
Figure 6.1 Enrolment with a PHO, all ages, Canterbury, 2005-2009................................ 158
Figure 6.2 Hospital activity, Māori as percentage of total, all ages, Canterbury, 2005-2009
................................................................................................................................................ 159
Figure 6.3 Average length of stay in hospital, all ages, Canterbury, 2005-2009............... 160
Figure 6.4 Percentage of people attending ED who were admitted, all ages, Canterbury,
2005-2009.............................................................................................................................. 161
Figure 6.5 Percentage of people attending ED who waited less than 4 hours, all ages,
Canterbury, 2005-2009........................................................................................................ 161
Figure 7.1 Avoidable mortality, 0-74 years, Canterbury and New Zealand, 2003-2005. 166
Figure 7.2 Avoidable hospitalisation, 0-74 years, Canterbury and New Zealand, 2005-
2007........................................................................................................................................ 167
Figure 7.3 Ambulatory sensitive hospitalisation, 0-4 years, Canterbury, 1996-2007....... 168

19
Executive Summary
This profile prepared for the Canterbury District Health Board provides the first
comprehensive picture of the health of Māori in Canterbury. It is hoped that it will be
useful for Māori and those working to improve health for Māori in Canterbury. The
profile draws on data from a range of sources. These data are presented in such a way as
to allow comparison of the health of Māori and non-Māori in Canterbury, and the health
of Māori in Canterbury and at the national level.
The overall picture that emerges is that for a number of health indicators, Māori in
Canterbury are in a better position than Māori nationally but in a worse position than
non-Māori in Canterbury. This is the case for: socioeconomic status; smoking; mortality
(including avoidable mortality); avoidable hospitalisation; cardiovascular disease; cancer
(and cancer screening); respiratory disease, diabetes; immunisation; injury mortality; oral
health status (compared to other non-fluoridated areas); and some conditions in
childhood such as bronchiolitis and asthma.
Many of the outcomes listed above for which Māori in Canterbury fare worse than non-
Māori but better than Māori nationally have a strong association with socioeconomic
position, and some of them with smoking. Those associated with smoking include, in
particular, mortality, avoidable hospitalisation, cardiovascular disease, cancer and
respiratory disease (both in adults and in children).
Demographic, social and risk data
Canterbury Māori made up 7.2% of the Canterbury population and 5.9% of the New
Zealand Māori population at the last Census. Ngāi Tahu/Kāi Tahu is the most common
iwi affiliation among Māori, with over 120 other iwi also represented in Canterbury. As
with the national Māori population, Māori in Canterbury are youthful compared to non-
Māori and have a higher fertility rate, meaning that the growth of the Māori population is
faster than that of the non-Māori population.

20
The Canterbury population is less deprived than the New Zealand population. Māori in
Canterbury are relatively more deprived than non-Māori, but relatively less deprived than
Māori nationally.
The prevalence of smoking is higher for Māori in Canterbury than non-Māori, especially
for females and young people, but lower than for Māori nationally. While youth smoking
is decreasing over time, a higher proportion of Māori than non-Māori young people are
exposed to smoke at home. Māori in Canterbury also have a higher prevalence of obesity
than non-Māori.
Health data
All-cause mortality is significantly higher for Māori than non-Māori in Canterbury, but
lower than that for Māori at the national level, where there is a greater difference
between Māori and non-Māori. The overall rate of hospitalisation is lower for Māori than
non-Māori in Canterbury, in contrast to a higher rate for Māori than non-Māori
nationally.
Cardiovascular disease
Māori in Canterbury have a larger burden of cardiovascular disease in terms of mortality
and hospitalisation, but this is smaller than that for Māori nationally. For ischaemic heart
disease, the mortality rate is higher for Māori in Canterbury than non-Māori, but
hospitalisation rates are the same, suggesting an area of unmet need for Māori. In
addition, Canterbury Māori have a lower rate of angioplasty and a higher rate of coronary
artery bypass grafting than non-Māori, which may indicate a higher level of disease
severity among Māori. Stroke mortality and hospitalisation rates are not significantly
different for Māori and non-Māori in Canterbury, but the rates for Māori in Canterbury
are significantly lower than for Māori nationally. Hospitalisation rates for other
cardiovascular disease indicators are higher for Māori in Canterbury than for non-Māori
but similar to or lower than for Māori nationally.
Cancer
Canterbury Māori also have a larger burden of cancer than non-Māori in Canterbury.
Incidence overall for Māori is lower but the mortality rate for Māori is higher than that
for non-Māori. Incidence and mortality from cancer are lower for Māori in Canterbury

21
than nationally. Lung cancer incidence and mortality rates are higher for Māori in
Canterbury than non-Māori. Incidence of colorectal cancer is lower for Māori than non-
Māori in Canterbury, but there is no difference in the mortality rate. Incidence of breast
cancer is the same for Māori and non-Māori in Canterbury but the mortality rate is
higher for Māori. Māori in Canterbury who have different forms of cancer seem
therefore to die more frequently from those cancers than do non-Māori. In keeping with
this, rates of screening coverage for breast and cervical cancer are lower for Māori than
non-Māori in Canterbury and this suggests an area of unmet need for Māori.
Respiratory disease
Respiratory disease mortality and hospitalisation rates are higher for Māori than non-
Māori in Canterbury, but lower than for Māori nationally. Māori are hospitalised more
than non-Māori in Canterbury for asthma, chronic obstructive pulmonary disease and
bronchiectasis, but less than Māori nationally.
Diabetes
Canterbury Māori mortality, hospitalisation and complications rates for diabetes are
much higher than for non-Māori but lower than those for Māori nationally. A lower
proportion of Māori in Canterbury have annual diabetes reviews and retinal screening
than non-Maori, suggesting important unmet need for Māori with diabetes in
Canterbury.
Communicable diseases
Mortality from communicable diseases is similar for Māori and non-Māori in Canterbury,
but Māori are hospitalised less often for these diseases. Notification and hospitalisation
for intestinal infections are less frequent for Māori than for non-Māori in Canterbury,
while notification for invasive pneumococcal disease and tuberculosis, and hospitalisation
for viral hepatitis, are higher for Māori than non-Māori in Canterbury. Immunisation
coverage is lower for Māori in Canterbury than for non-Māori, but higher than for Māori
nationally.
Mental health
Māori in Canterbury access mental health services more than non-Māori, but at a level
lower than the target set by the Mental Health Commission. The rates of hospitalisation
for schizophrenia, manic episodes, bipolar disorder and psychoactive substance use
22
disorders are higher for Māori than for non-Māori in Canterbury. The overall rate of
hospitalisation for Māori for mental health problems is similar in Canterbury and
nationally, although lower for schizophrenia and higher for psychoactive substance use
and depression.
Injury
Mortality from external causes of injury is higher for Māori in Canterbury than non-
Māori, particularly for deaths due to drowning, fires, and accidental poisoning. However,
the rate of hospitalisation for injuries is lower for Māori in Canterbury than non-Māori
and lower than for Māori nationally.
Oral health
Māori children in Canterbury have poorer oral health status than non-Māori in
Canterbury, and poorer oral health status than Māori living in fluoridated areas of New
Zealand. However, their oral health status is better than that of Māori living in other
non-fluoridated areas nationally.
Children and youth
In children’s health, the rates of preterm birth, low birthweight and infant mortality
appear higher for Māori than Europeans, while the rate of breastfeeding is lower. This
suggests a relationship between higher risk (preterm birth and low birth weight) and
lower protective (breastfeeding) factors for infants, and worse outcomes in terms of
mortality. Māori children and young people in Canterbury have lower rates of admission
for upper respiratory tract infection, tonsillectomy, and gastroenteritis than Europeans,
but higher rates of admission for bronchiolitis and asthma. The rate of hearing test
failure at school entry is higher for Māori children than Others in Canterbury, and the
rate of admission for grommets insertion is also higher.
Sexual and reproductive health
In sexual and reproductive health, the rate of hospitalisation is higher for Māori than
non-Māori in Canterbury, but admissions per live birth are lower for Māori. The rate of
teenage pregnancy is much higher for Māori than for Europeans in Canterbury.
Canterbury Māori have higher rates of manually assisted deliveries than non-Māori and
lower rates of procedures related to delivery such as caesarean section (emergency and
elective), and instrumental deliveries. Attendance at sexual health, family planning and

23
student and youth clinics for sexually transmitted infections is higher for Māori in
Canterbury than for Europeans.
Health service utilisation and performance
In terms of health service utilisation, a lower proportion of older Māori than Others in
Canterbury are in aged care facilities. Māori are more likely to have had an unmet need
for a general practitioner than European/Others. PHO enrolment is lower for Māori in
Canterbury than for Others. Māori in Canterbury are under-represented in hospital
activity and in spending per capita on prescriptions and laboratory testing. In terms of
indicators of health system performance, avoidable mortality and hospitalisation are
higher for Māori in Canterbury than for European/Others, but lower than for Māori
nationally.

24

25
1 Introduction This section describes the scope of the profile, placing it in the context of a larger
process of planning for Māori health in the Canterbury District Health Board (CDHB),
and noting the sources of data and some pertinent methodological issues.
1.1 Scope of this health profile
This health profile for Māori in Canterbury may be considered the first stage of a process
that will result in a health needs assessment for Māori in Canterbury. Health needs
assessment is defined by Coster (2000) as the “assessment of the population’s capacity to
benefit from health care services prioritised according to effectiveness, including cost-
effectiveness, and funded within available resources.”
As a description of the Māori population in Canterbury and a portrait of its health status,
this profile involves the use of routinely collected data from as wide a range of sources as
possible. It does not involve generation of new data solely for the purposes of the
profile; collection of healthcare user or provider views on services; consultation with the
community; or a stocktake or cost analysis of the available services. The information the
profile contains is intended to inform further consideration of Māori health priorities and
fuller engagement with Māori to identify unmet health and healthcare needs. Subsequent
stages of health needs assessment for Māori in Canterbury may include using the data in
this profile alongside information about health services from the wider Māori community
and health providers.
This profile was requested and guided by Hector Matthews, Executive Director of Māori
and Pacific Health for CDHB and Dr Ramon Pink, Medical Officer of Health for
Canterbury, CDHB. It contributes to fulfilling objectives of the CDHB Whakamahere
Hauora Māori Ki Waitaha – Māori Health Plan (Canterbury District Health Board 2006).
The importance of the principles of the Treaty of Waitangi – partnership, participation
and protection – in determining and addressing health priorities for Māori are recognised
in this profile. These principles are described in He Korowai Oranga: Māori Health
Strategy (Minister of Health and Associate Minister of Health 2002) as underpinning the

26
relationship between the government and Māori. This profile is intended to contribute to
the understanding of Māori health by CDHB and Māori in Canterbury, in order to
facilitate partnership between CDHB and Māori in developing strategies for Māori health
gain. It is intended to inform Māori participation in decision-making and planning for
Māori health. It is also intended to ensure that understanding of Māori health status in
Canterbury leads to the protection of Māori health and to the reduction of health
inequalities between Māori and non-Māori.
He Korowai Oranga: Māori Health Strategy (Minister of Health and Associate Minister
of Health 2002) and Whakatātaka Tuarua: Māori Health Action Plan 2006–2011
(Minister of Health and Associate Minister of Health 2006) also describe whānau ora as
fundamental to Māori health and wellbeing individually and collectively. This profile is
intended to contribute to the CDHB applying equitable resources to realise Māori health
gain, reduce health inequalities and achieve whānau ora (Ministry of Health 2008), and to
contribute to the vision of ‘Whānau Ora Ki Waitaha’ expressed in Whakamahere Hauora
Māori Ki Waitaha – Māori Health Plan (Canterbury District Health Board 2006).
Documents similar to this profile have been produced around New Zealand comparing
Māori and non-Māori health status, and these have informed the structure and scope of
this profile. These documents include:
• Hauora: Māori Standards of Health IV. A study of the years 2000–2005 (Robson and
Harris 2007), which is the fourth of a series of reports on Māori health and uses
national data;
• Tatau Kahukura: Māori Health Chart Book (Ministry of Health 2006), which also
uses national data;
• West Coast – Te Tai O Poutini Māori Health Profile (Begg 2008), for the West Coast
DHB;
• Health Needs Assessment for Maori. Waitemata District Health Board 2009 (Loring
and Ratima 2009), for the Waitemata DHB.

27
1.2 Data sources and methodological issues
The data presented in this profile were sourced from a range of organisations:
• Statistics New Zealand;
• the Health and Disability Information Unit, Ministry of Health;
• Ngāi Tahu Development;
• Action on Smoking and Health;
• Te Rōpū Rangahau Hauora a Eru Pōmare;
• the Information Directorate, Ministry of Health;
• the Institute of Environmental Science and Research;
• the Injury Prevention Unit, University of Otago, Dunedin;
• the New Zealand Child and Youth Epidemiology Service, University of Otago,
Dunedin;
• the Royal New Zealand Plunket Society;
• the National Immunisation Register;
• BreastScreen Aotearoa;
• the National Cervical Screening Programme; and
• the Canterbury District Health Board.
A detailed discussion of the data sources and methodological considerations is presented
in Appendix 1. A brief overview of issues that should be kept in mind in considering the
data is presented below:
• A limited range of years of data were available for consideration in this profile,
for example:
o for Statistics New Zealand data, those that were collected in the Census
are restricted to the years in which the Censuses were held (2001 and
2006 were the last two Census years);
o for data on health status the most recent year for data that had been
released and processed at the time of writing the profile was 2005.
• Data have been processed in order to allow comparison of the health of Māori
and non-Māori, for example:
o data have been adjusted to take into account differential classification of
ethnicity in hospital records;

28
o data have been age-standardised to take into account the different age
structures of the Māori and non-Māori populations;
o estimations have been made for New Zealand Health Survey data at the
Canterbury level by using national figures to adjust local data.
• Ethnicity data are presented as either total response or prioritised. If ethnicity is
reported as ‘total response’ it means the individual is recorded in each ethnic
group they specify. If ethnicity is reported as prioritised, each individual is
allocated to a single ethnic group by priority (Māori > Pacific > Asian >
European/Other).
29
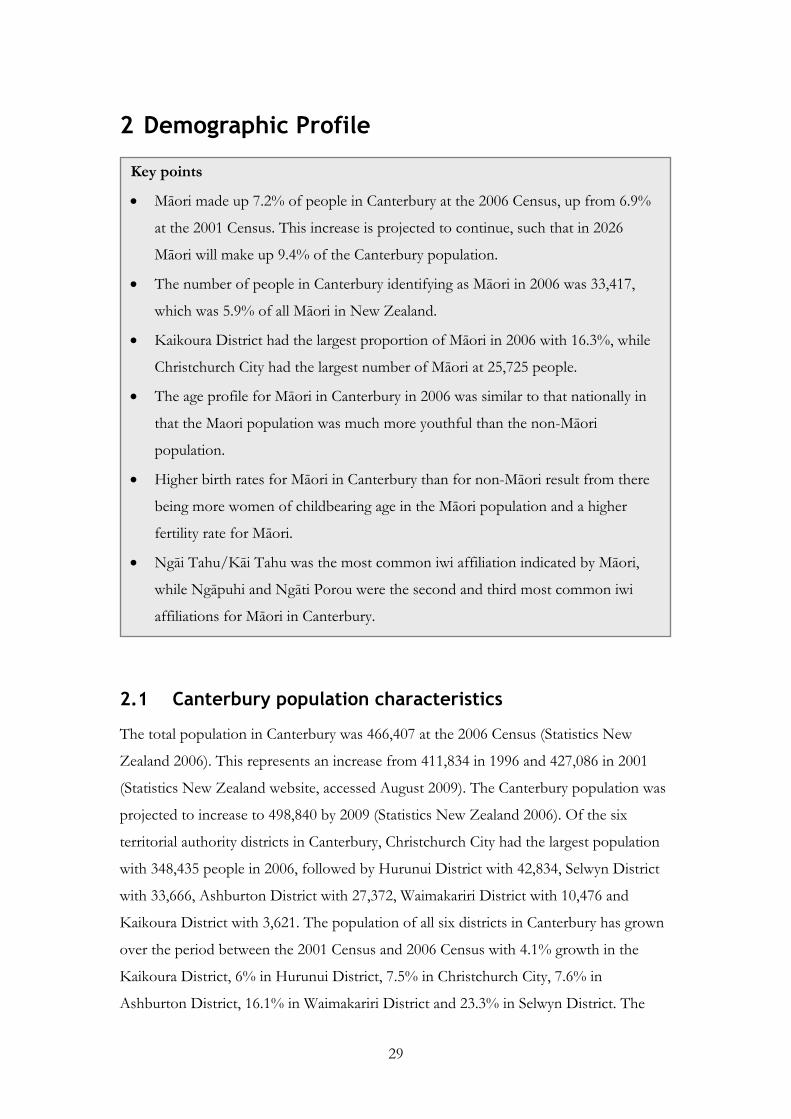
2 Demographic Profile
2.1 Canterbury population characteristics
The total population in Canterbury was 466,407 at the 2006 Census (Statistics New
Zealand 2006). This represents an increase from 411,834 in 1996 and 427,086 in 2001
(Statistics New Zealand website, accessed August 2009). The Canterbury population was
projected to increase to 498,840 by 2009 (Statistics New Zealand 2006). Of the six
territorial authority districts in Canterbury, Christchurch City had the largest population
with 348,435 people in 2006, followed by Hurunui District with 42,834, Selwyn District
with 33,666, Ashburton District with 27,372, Waimakariri District with 10,476 and
Kaikoura District with 3,621. The population of all six districts in Canterbury has grown
over the period between the 2001 Census and 2006 Census with 4.1% growth in the
Kaikoura District, 6% in Hurunui District, 7.5% in Christchurch City, 7.6% in
Ashburton District, 16.1% in Waimakariri District and 23.3% in Selwyn District. The
Key points
• Māori made up 7.2% of people in Canterbury at the 2006 Census, up from 6.9%
at the 2001 Census. This increase is projected to continue, such that in 2026
Māori will make up 9.4% of the Canterbury population.
• The number of people in Canterbury identifying as Māori in 2006 was 33,417,
which was 5.9% of all Māori in New Zealand.
• Kaikoura District had the largest proportion of Māori in 2006 with 16.3%, while
Christchurch City had the largest number of Māori at 25,725 people.
• The age profile for Māori in Canterbury in 2006 was similar to that nationally in
that the Maori population was much more youthful than the non-Māori
population.
• Higher birth rates for Māori in Canterbury than for non-Māori result from there
being more women of childbearing age in the Māori population and a higher
fertility rate for Māori.
• Ngāi Tahu/Kāi Tahu was the most common iwi affiliation indicated by Māori,
while Ngāpuhi and Ngāti Porou were the second and third most common iwi
affiliations for Māori in Canterbury.

30
Canterbury DHB area has seen population growth of 9.2% overall, compared to 7.8%
growth for all of New Zealand from 2001 to 2006.
Table 2.1 presents the ethnicity distribution for each district, all Canterbury, and all New
Zealand at the 2006 Census. The European ethnic group is the largest in each territorial
authority, followed by Māori in all areas except Christchurch City, where the Asian ethnic
group is slightly larger than the Māori ethnic group. The Asian ethnic group is the third
largest ethnic group in all areas other than Christchurch City (Statistics New Zealand
2006).
Table 2.1 Number and proportion of people indicating each ethnic group, by district, Canterbury and New Zealand, 2006 (Source: Statistics New Zealand 2006 Census)
Area Ethnicity
Kaikoura District
Hurunui District
Waimakariri District
Christchurch City
Selwyn District
Ashburton District
Canterbury New
Zealand
Māori 591 591 2,856 25,725 2,010 1,641 33,417 565,329 16.3% 5.6% 6.7% 7.4% 6.0% 6.0% 7.2% 14.0% European* 2,793 9,357 38,238 275,985 29,667 24,669 380,706 2,693,820 77.1% 89.4% 89.3% 79.2% 88.1% 90.1% 81.6% 66.9% Asian 48 66 408 26,019 747 348 27,636 340,812 1.3% 0.6% 1.0% 7.5% 2.2% 1.3% 5.9% 8.5% Pacific 12 33 213 8,223 228 279 8,991 226,293 0.3% 0.3% 0.5% 2.4% 0.7% 1.0% 1.9% 5.6% Others** 177 429 1,119 12,483 1,014 435 15,657 201,693 4.9% 4.1% 2.6% 3.6% 3.0% 1.6% 3.4% 5.0%
Total 3,621 42,834 10,476 348,435 33,666 27,372 466,407 4,027,947
* Includes ‘New Zealanders’ ** Includes ‘Others’, ‘Not elsewhere included’ and ‘MELAA’ (Middle Eastern, Latin American, African)
2.2 Canterbury Māori
Māori population characteristics
In Canterbury there were 33,417 (7.2%) people identifying as Māori at the 2006 Census.
This group is composed of 13,629 people who indicated only Māori ethnicity and 19,788
who indicated Māori ethnicity among others, compared to 41,766 who indicated Māori
descent. The non-Māori population in 2006 was 432,990 (92.8%).

31
Table 2.1 shows that the territorial authority with the highest proportion of people
indicating Māori ethnicity in 2006 was Kaikoura District with 16.3%, followed by
Christchurch City with 7.4%, Waimakariri District with 6.7%, Ashburton District and
Selwyn District each with 6%, and Hurunui District with the lowest proportion at 5.6%.
This compares to 14.0% of people indicating Māori ethnicity in New Zealand as a whole.
The proportion of people indicating Māori ethnicity has increased from 2001 to 2006 in
all the territorial authorities in Canterbury, as shown in Table 2.2. This represents a faster
rate of growth for Māori than that for the general population. The number of people
indicating Māori ethnicity in Canterbury in 2006 increased by 4,689 from 28,728 in 2001.
This represents a 16% increase in the size of the Māori ethnic group over the five-year
period (average annual growth of 3.3%), with the proportion of people indicating Māori
ethnicity in the total Canterbury population increasing from 6.7% to 7.2%. The relative
increase in the size of the Māori ethnic group between the 2001 Census and the 2006
Census ranged from Hurunui District with the smallest increase at 13.9% (average annual
growth of 2.8%) to Ashburton District with the largest increase at 39.2% (average annual
growth of 7.8%).
Table 2.2 Number and proportion of Māori in each territorial local authority, and inter-Census increase, Canterbury and New Zealand, 2001 and 2006 (Source: Statistics New Zealand)
2001 Census 2006 Census Māori inter-Census popn increase
Territorial authority No. of Māori
Total popn
Māori as % of total
No. of Māori
Total popn Māori as
% of total
No. % Average
per annum
Kaikoura District 495 3,480 14.2% 591 3,621 16.3% 96 19.4% 3.9%
Hurunui District 519 9,885 5.2% 591 10,476 5.6% 72 13.9% 2.8%
Waimakariri District 2,433 36,903 6.6% 2,856 42,834 6.7% 423 17.4% 3.5%
Selwyn District 1,572 27,312 5.8% 2,010 33,666 6.0% 438 27.9% 5.6%
Christchurch City 22,533 324,057 7.0% 25,725 348,435 7.4% 3,192 14.2% 2.8%
Ashburton District 1,179 25,446 4.6% 1,641 27,372 6.0% 462 39.2% 7.8%
Total Canterbury DHB 28,728 427,083 6.7% 33,417 466,407 7.2% 4,689 16.3% 3.3%
Total New Zealand 526,281 3,737,280 14.1% 565,329 4,027,947 14.0% 39,048 7.4% 1.5%
32
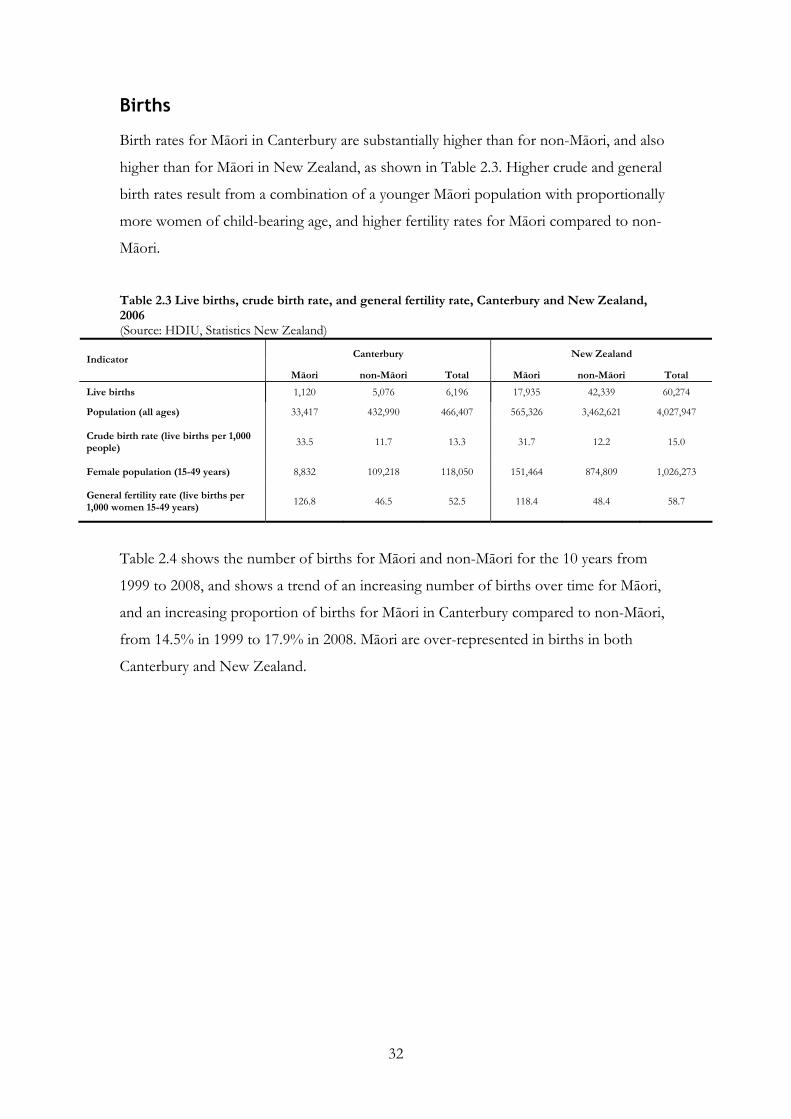
Births
Birth rates for Māori in Canterbury are substantially higher than for non-Māori, and also
higher than for Māori in New Zealand, as shown in Table 2.3. Higher crude and general
birth rates result from a combination of a younger Māori population with proportionally
more women of child-bearing age, and higher fertility rates for Māori compared to non-
Māori.
Table 2.3 Live births, crude birth rate, and general fertility rate, Canterbury and New Zealand, 2006 (Source: HDIU, Statistics New Zealand)
Canterbury New Zealand Indicator
Māori non-Māori Total Māori non-Māori Total
Live births 1,120 5,076 6,196 17,935 42,339 60,274
Population (all ages) 33,417 432,990 466,407 565,326 3,462,621 4,027,947
Crude birth rate (live births per 1,000 people)
33.5 11.7 13.3 31.7 12.2 15.0
Female population (15-49 years) 8,832 109,218 118,050 151,464 874,809 1,026,273
General fertility rate (live births per 1,000 women 15-49 years)
126.8 46.5 52.5 118.4 48.4 58.7
Table 2.4 shows the number of births for Māori and non-Māori for the 10 years from
1999 to 2008, and shows a trend of an increasing number of births over time for Māori,
and an increasing proportion of births for Māori in Canterbury compared to non-Māori,
from 14.5% in 1999 to 17.9% in 2008. Māori are over-represented in births in both
Canterbury and New Zealand.

33
Table 2.4 Live births, Canterbury and New Zealand, 1999-2008 (Source: HDIU)
Canterbury New Zealand Year Māori
(%) non-Māori
(%) Total Māori
(%) non-Māori
(%) Total
1999 805 4,754 5,559 16,027 41,394 57,421 (14.5%) (85.5%) (27.9%) (72.1%)
2000 874 4,658 5,532 15,867 41,127 56,994 (15.8%) (84.2%) (27.8%) (72.2%)
2001 820 4,823 5,643 15,869 40,355 56,224 (14.5%) (85.5%) (28.2%) (71.8%)
2002 862 4,470 5,332 14,905 39,610 54,515 (16.2%) (83.8%) (27.3%) (72.7%)
2003 856 4,793 5,649 15,682 40,894 56,576 (15.2%) (84.8%) (27.7%) (72.3%)
2004 1,067 4,995 6,062 16,520 42,203 58,723 (17.6%) (82.4%) (28.1%) (71.9%)
2005 937 5,104 6,041 17,004 41,723 58,727 (15.5%) (84.5%) (29.0%) (71.0%)
2006 1,120 5,076 6,196 17,935 42,339 60,274 (18.1%) (81.9%) (29.8%) (70.2%)
2007 1,256 5,637 6,893 19,338 45,783 65,121 (18.2%) (81.8%) (29.7%) (70.3%)
2008 1,191 5,467 6,658 19,452 45,881 65,333 (17.9%) (82.1%) (29.8%) (70.2%)
Māori population age and gender distribution
Table 2.5 presents the age profile of Māori and non-Māori in Canterbury and in New
Zealand. At the 2006 Census, the Māori population of Canterbury was composed of
16,854 males (50.4%) and 16,563 females (49.6%). The comparable proportions for non-
Māori in Canterbury and Māori nationally were 48.6% males and 51.4% females, and for
non-Māori in New Zealand were 48.8% males and 51.2% females.
Children under 15 years of age made up 35.4% of the Māori population in Canterbury
with the same age group making up 35.4% of Māori in New Zealand, 18% of non-Māori
in Canterbury, and 19.3% of non-Māori in New Zealand. This illustrates the youthful age
structure of the Māori population of Canterbury and New Zealand compared to the non-
Māori population.
Older adults aged over 65 years of age made up only 3.2% of the Māori population in
Canterbury whereas the same age group was 4.1% of Māori in New Zealand, 14.2% of
non-Māori in Canterbury, and 13.6% of non-Māori in New Zealand. Thus the older adult
population is relatively small among Māori, particularly in Canterbury.

34
Table 2.5 Age distribution, by life-cycle age group, Canterbury and New Zealand, 2006 (Source: Statistics New Zealand 2006 Census)
Canterbury New Zealand
Māori non-Māori Māori non-Māori Age group (years)
Male Female Total
(%) Male FemaleTotal
(%) Male FemaleTotal
(%) Male Female Total
(%)
0-14 6,024 5,802 11,820 40,623 39,237 79,869 102,645 97,275 199,920 341,385 326,271 667,653 (35.4%) (18.4%) (35.4%) (19.3%)
15-24 3,198 3,210 6,411 30,957 29,142 60,096 49,374 51,933 101,304 238,152 231,720 469,872 (19.2%) (13.9%) (17.9%) (13.6%)
25-44 4,530 4,761 9,291 58,923 63,453 122,376 70,824 82,605 153,432 471,180 509,646 980,820 (27.8%) (28.3%) (27.1%) (28.3%)
45-64 2,568 2,256 4,821 53,382 55,641 109,032 41,541 45,999 87,546 429,381 442,416 871,791 (14.4%) (25.2%) (15.5%) (25.2%)
65+ 537 540 1,074 26,706 34,908 61,617 10,476 12,651 23,127 210,666 261,816 472,479 (3.2%) (14.2%) (4.1%) (13.6%)
Total 16,854 16,563 210,597 222,390 274,860 290,469 1,690,758 1,771,857 (%) (50.4%) (49.6%)
33,417 (48.6%) (51.4%)
432,990 (48.6%) (51.4%)
565,326 (48.8%) (51.2%)
3,462,621
Figures 2.1 and 2.2 present the age and sex distribution for Māori and non-Māori in
Canterbury, respectively. Figure 2.3 presents the age distribution for Māori and non-
Māori in Canterbury together. These figures show the markedly different age-structure of
the Māori and non-Māori populations. The triangular shape of the pyramid for Māori,
indicates a large proportion of the population in younger age groups and steadily
diminishing proportion of the population in the older age groups, with very few in the 85
years and older age group (approximately 36 people, 24 female, 12 male, in 2006).
This contrasts with the more pear-shaped pyramid for non-Māori, which is due to
relatively small younger age groups and large older age groups. Both the Māori and non-
Māori populations are under-represented in the 25- to 29-year old age group, possibly
representing outward migration of this age group. Figure 2.4 presents the age and sex
distribution of the Māori population in New Zealand, which is similar to the age and sex
distribution of Māori in Canterbury.

35
Figure 2.1 Age distribution of Canterbury Māori population, males and females, 2006 (Source: Statistics New Zealand 2006 Census)
Figure 2.2 Age distribution of the Canterbury non-Māori population, males and females, 2006 (Source: Statistics New Zealand 2006 Census)
12.2%
12.0%
11.6%
10.6%
8.4%
6.9%
7.0%
7.0%
6.0%
5.5%
4.4%
3.2%
2.2%
1.5%
0.9%
0.5%
0.2%
0.1%
12.1%
11.8%
11.1%
10.8%
8.5%
7.5%
7.7%
7.2%
6.3%
5.2%
3.6%
2.9%
1.9%
1.4%
0.9%
0.6%
0.3%
0.1%
15% 10% 5% 0% 5% 10% 15%
0-4
5-9
10-14
15-19
20-24
25-29
30-34
35-39
40-44
45-49
50-54
55-59
60-64
65-69
70-74
75-79
80-84
85 +
Age group (years)
Percent
Females
Males
6.1%
6.3%
6.9%
7.5%
7.2%
5.9%
6.7%
7.6%
7.8%
7.6%
6.7%
6.3%
4.8%
3.9%
3.1%
2.7%
1.8%
1.1%
5.7%
5.7%
6.2%
6.6%
6.5%
5.8%
7.1%
7.8%
7.9%
7.5%
6.6%
6.3%
4.7%
4.0%
3.4%
3.3%
2.7%
2.4%
15% 10% 5% 0% 5% 10% 15%
0-4
5-9
10-14
15-19
20-24
25-29
30-34
35-39
40-44
45-49
50-54
55-59
60-64
65-69
70-74
75-79
80-84
85 +
Age group (years)
Percent
Females
Males
36
Figure 2.3 Age distribution of Canterbury Māori and non-Māori, 2006 (Source: Statistics New Zealand 2006 Census)
Figure 2.4 Age distribution of New Zealand Māori, male and female, 2006
(Source: Statistics New Zealand 2006 Census)
5.9%
6.0%
6.6%
7.0%
6.9%
5.8%
6.9%
7.7%
7.9%
7.5%
6.6%
6.3%
4.7%
4.0%
3.2%
3.0%
2.3%
1.8%
12.1%
11.9%
11.3%
10.7%
8.5%
7.2%
7.3%
7.1%
6.1%
5.3%
4.0%
3.0%
2.0%
1.4%
0.9%
0.6%
0.2%
0.1%
15% 10% 5% 0% 5% 10% 15%
0-4
5-9
10-14
15-19
20-24
25-29
30-34
35-39
40-44
45-49
50-54
55-59
60-64
65-69
70-74
75-79
80-84
85 +
Age group (years)
Percent
Māori
non-Māori
12.4%
12.5%
12.5%
10.6%
7.4%
6.4%
6.6%
6.5%
6.3%
5.4%
4.2%
3.2%
2.2%
1.8%
1.1%
0.6%
0.3%
0.1%
11.1%
11.2%
11.1%
10.2%
7.7%
7.1%
7.4%
7.2%
6.9%
5.8%
4.3%
3.4%
2.3%
1.8%
1.2%
0.8%
0.4%
0.2%
15% 10% 5% 0% 5% 10% 15%
0-4
5-9
10-14
15-19
20-24
25-29
30-34
35-39
40-44
45-49
50-54
55-59
60-64
65-69
70-74
75-79
80-84
85 +
Age group (years)
Percent
Females
Males

37
Population projections
The Māori ethnic group in Canterbury is projected to increase over the coming years1.
The estimate2 of the Māori population used for population projections was 36,560 in
2006. This is predicted to increase to 53,100 by 2026, as shown in Table 2.6, an average
growth rate of 9.8% per five-year period. The rate of growth is projected to slow
gradually, from an 11.5% increase in the five years from 2006 to 2011 to 8.7% in the five
years from 2021 to 2026. In New Zealand, the Māori population is projected to increase
to 810,730 by 2026, an average increase of 6.8% per five-year period from 2006 to 2026.
The proportion of the population that identifies as Māori is also projected to increase in
Canterbury and in New Zealand, because the growth of the non-Māori population is
projected to be slower, at 3.4% increase per five-year period in Canterbury and 3.8%
increase per five-year period in New Zealand. The proportion of Māori in the Canterbury
population is projected to increase from 7.6% in 2006 to 9.4% in 2026. In New Zealand
the proportion of the population identifying as Māori is projected to increase from
14.9% in 2006 to 16.4% in 2026.
Table 2.6 Projected populations, Canterbury and New Zealand, 2006-2026 (Source: HDIU)
Canterbury New Zealand
Māori non-Māori Māori non-Māori Year
No. % No. % Total
No. % No. % Total
2006 36,560 7.6% 446,760 92.4% 483,320 624,280 14.9% 3,559,815 85.1% 4,184,095 2011 40,780 8.0% 468,660 92.0% 509,440 672,220 15.3% 3,729,240 84.7% 4,401,460 2016 44,790 8.5% 484,360 91.5% 529,150 717,800 15.6% 3,873,235 84.4% 4,591,035
2021 48,850 8.9% 498,350 91.1% 547,200 763,780 16.0% 4,007,615 84.0% 4,771,395
2026 53,100 9.4% 510,840 90.6% 563,940 810,730 16.4% 4,129,120 83.6% 4,939,850
The age structure of the Māori population is projected to change by 2021. Using the
population projection estimates, in 2006 the proportions of the Māori population under
1 Statistics New Zealand based the projections on assumptions of medium fertility, mortality, migration
and inter-ethnic mobility for Māori and other populations. 2 Whereas Census data are a count of people who completed the Census forms at the time of the Census,
population projections use the Census count as a base, but also take into account those absent overseas at
the time of the Census, non-response on Census night, and those who did not fill out a form (undercount).
In addition, population projections are estimated approximately four months after the Census count and
take into account population change due to births, deaths and net migration over the intervening period.

38
15 years and over 65 years were 34.3% and 3.3% respectively, as shown in Table 2.7. In
2021 the respective proportions are projected to be 36.1% and 6.6%, which represents a
small increase in the younger age group and a doubling of the older age group.
Table 2.7 Projected age distributions, by life-cycle age group, Canterbury, 2006 and 2021 (Source: Statistics New Zealand)
Māori non-Māori Age group (years) 2006 2021 2006 2021
0-14 34.3% 36.1% 18.2% 16.1% 15-24 19.9% 16.5% 14.0% 13.1% 25-44 28.0% 23.5% 28.3% 23.7% 45-64 14.6% 17.2% 25.3% 27.4%
65+ 3.3% 6.6% 14.2% 19.7%
Iwi
Table 2.8 presents the number of people in Canterbury and New Zealand indicating
affiliation with each iwi at the 2006 Census. Ngāi Tahu/Kāi Tahu was the most common
affiliation in Canterbury with 29% of people of Māori descent indicating an affiliation
with this iwi. Ngāpuhi (11.1%) and Ngāti Porou (8.9%) were the next most common iwi
affiliations. Out of all those who indicated an affiliation with Ngāi Tahu/Kāi Tahu in
New Zealand, 24.6% were in Canterbury.

39
Table 2.8 Iwi affiliation, Canterbury and New Zealand, 2006 (Source: Statistics New Zealand 2006 Census)
Iwi* Canterbury New Zealand
Ngāi Tahu/Kāi Tahu 12,093 49,185 Ngāpuhi 4,626 122,214 Ngāti Porou 3,708 71,907 Ngāti Tūwharetoa 1,620 34,674 Waikato 1,242 33,429 Tūhoe 1,185 32,670 Te Arawa 1,170 23,316 Ngāti Maniapoto 1,161 33,627 Ngāti Kahungunu ki Te Wairoa 1,161 20,982 Ngāti Kahungunu, region unspecified 984 18,462 Te Atiawa (Taranaki) 747 12,852 Tainui 696 14,070 Kāti Māmoe 558 2,880 Ngāti Raukawa (Horowhenua/Manawatū) 525 13,233 Ngāti Awa 489 15,258 Te Ati Haunui-a-Pāpārangi 468 10,437 Ngaiterangi 444 12,201 Ngāti Mutunga (Wharekauri/Chatham Islands) 441 1,392 Ngāti Whātua 393 14,721 Whakatōhea 372 12,069 Te Whānau-a-Apanui 369 11,808 Ngāti Kahungunu ki Wairarapa 363 7,440 Ngāti Ruanui 357 7,035 Ngāti Kahungunu ki Heretaunga 351 9,525 Te Rarawa 303 14,892 Ngāti Raukawa, region unspecified 297 8,022 Te Aupōuri 291 9,333 Hapū Affiliated to More Than One Iwi 282 11,964 Ngāti Raukawa (Waikato) 276 8,166 Ngāti Mutunga (Taranaki) 273 2,094 Te Atiawa (Te Waipounamu/South Island) 255 2,433 Te Atiawa, region unspecified 255 4,644
Not Elsewhere Included 10,293 131,694
*Iwi (total responses) for the Census usually resident population count of people with Māori descent, restricted to iwi with 250 or more responses (for the full list of iwi with any responses see Appendix 2 Iwi in Canterbury). As ‘total responses’ count individuals in each iwi they indicate, the sum of all response will exceed the total number of people indicating an iwi affiliation.

40

41
3 Social Indicators
3.1 Socioeconomic determinants of health
Health services provide care when people are unwell and help restore people to good
health, but the contribution they make towards health status is restricted. For example,
the contribution of health services to gains in life expectancy may be up to only 30%
(Ministry of Health 2005). Greater impacts on health status are made by socio-economic
factors including income, education, employment and housing (Ministry of Health 2002;
Public Health Advisory Committee 2004). Unequal distribution of these socio-economic
determinants contributes to differences in the health status of Māori and non-Māori
(Ministry of Health and University of Otago 2006).
Socioeconomic deprivation
Socio-economic status is an important determinant of health. The New Zealand
deprivation index, NZDep2006, is a measure of socioeconomic deprivation for small
Key points
In 2006:
• A larger proportion of Māori than non-Māori in Canterbury lived in more
deprived areas, and a smaller proportion lived in less deprived areas.
• Nationally, there was a steep gradient of socioeconomic deprivation (as measured
by NZDep) for Māori, with more Māori living in areas with higher deprivation.
While there was also a gradient for Māori in Canterbury the deprivation profile
was less steep than that seen nationally.
• Māori in Canterbury, when compared to non-Māori (in a non-age-standardised
analysis):
− Were more likely to have lower income, be on a benefit and be unemployed
− Were less likely to have a qualification beyond NCEA level 2
− Were less likely to own their home, or have access to a car or telephone
− Were more likely to live in an over-crowded house
− Were less likely to heat their home.

42
geographical areas (meshblocks) based on nine socio-economic variables measured in the
2006 Census. A weighted sum of these variables is calculated for all of New Zealand. The
variables, in order of weighting, are: receiving a means tested benefit, living in a
household with a low income, not owning the home lived in, living in a single parent
family, unemployment, being without school qualifications, living in a crowded
household, having no access to a telephone and having no access to a car (Salmond,
Crampton et al. 2007). Areas are distributed into ten deciles with decile 1 being the 10%
least deprived and decile 10 being the 10% most deprived. The deprivation of different
populations, for example geographical populations (Canterbury) or ethnic groups (Māori
and non-Māori), can be assigned based on the area in which the individuals that make up
that population live. Populations can then be compared to the national figures, or to each
other.
Table 3.1 lists the number and proportion of people in each NZDep decile for Māori
and non-Māori in Canterbury and New Zealand3 in 2006. The information in the table is
presented in more detail in the following figures, but it can be seen from Table 3.1 that
fewer Māori lived in lower decile, less deprived areas than non-Māori in Canterbury, but
Māori in Canterbury lived in relatively lower decile areas than Māori nationally.
Conversely, there were higher proportions of Māori in Canterbury living in higher decile,
more deprived areas than non-Māori.
3 The totals presented have been aggregated from Census meshblock counts, in order to compile
populations at the same level of aggregation as NZDep2006 deciles, which are calculated at meshblock
level. Due to unit enumeration, round-off, and privacy data suppressions at meshblock level, the ethnicity
responses presented undercount totals for ethnicity compiled at higher levels of aggregation, such as
Canterbury, or New Zealand.

43
Table 3.1 Deprivation, by decile, Canterbury and New Zealand, 2006 (Source: Statistics New Zealand 2006 Census)
Canterbury New Zealand Decile Māori non-Māori Māori non-Māori
1 2,262 6.8% 67,626 15.1% 19,020 3.42% 407,637 11.18% 2 2,358 7.1% 55,119 12.3% 24,435 4.39% 396,924 10.89% 3 2,622 7.9% 50,592 11.3% 28,830 5.18% 391,833 10.75% 4 3,255 9.8% 51,003 11.4% 33,096 5.95% 382,407 10.49% 5 3,204 9.7% 47,385 10.6% 39,366 7.07% 373,137 10.24% 6 4,080 12.3% 47,982 10.7% 49,350 8.87% 368,670 10.12% 7 3,573 10.8% 37,644 8.4% 57,879 10.40% 358,503 9.84% 8 3,948 11.9% 37,473 8.4% 72,459 13.02% 345,585 9.48% 9 4,416 13.3% 33,831 7.6% 97,323 17.49% 329,961 9.05% 10 3,471 10.5% 19,110 4.3% 134,616 24.19% 285,990 7.85%
Unknown 15 0% 171 0.03% 4,068 0.11%
Total 33,189 100% 447,765 100% 556,545 100% 3,644,715 100%
Note: Ethnicity is based on total grouped responses. As ‘total responses’ count individuals in each ethnicity they indicate, the sum of all response will exceed the total number of people indicating an ethnicity. As Figure 3.1 shows, the NZDep data from 2006 for the Canterbury population as a
whole suggest that people in the CDHB region live in areas with relatively less deprived
NZDep scores compared to all New Zeal
and (for whom all deciles, by design, equal approximately 10%). There are lower
proportions in the two most deprived deciles (12.2%) compared to the two least
deprived deciles (27.0%).
Figure 3.1 Deprivation profile, Canterbury, all ethnicities, 2006 (Source: Statistics New Zealand 2006 Census)
14.8
12.211.2 11.3
10.6 10.8
8.5 8.57.7
4.5
0
5
10
15
20
25
1 2 3 4 5 6 7 8 9 10NZDep decile
Per
cent
Figure 3.2 presents data from Table 3.1, comparing Māori to non-Māori in Canterbury
and shows that while non-Māori follow a similar pattern to all ethnicities in Canterbury
(of being relatively less deprived), Māori are more likely to live in areas with more

44
deprived NZDep scores. The deprivation profile for Māori in Canterbury is somewhat
skewed toward higher deprivation with 23.8% of Māori living in areas with the two most
deprived scores (deciles 9 and 10), compared to 13.9% in the two least deprived areas
(deciles 1 and 2).
Figure 3.2 Deprivation profile, Canterbury, 2006 (Source: Statistics New Zealand 2006 Census)
0
5
10
15
20
25
1 2 3 4 5 6 7 8 9 10NZDep decile
Per
cent
Māori
non-Māori
Māori who specified their iwi as Ngāi Tahu/Kāi Tahu (as their only iwi affiliation or
among other iwi affiliations) in Canterbury live in areas with slightly less deprived
NZDep scores than Māori of other iwi or Māori who did not specify an affiliation with
an iwi, as can be seen in Figure 3.3.
Figure 3.3 Deprivation profile, Canterbury, by iwi, 2006 (Source: Statistics New Zealand 2006 Census)
0
5
10
15
20
25
1 2 3 4 5 6 7 8 9 10NZDep decile
Per
cen
t
Ngāi Tahu / Kāi Tahu
Other iwi / not elsewhere included

45
Figure 3.4 presents data from Table 3.1 for New Zealand, for Māori and non-Māori.
Figure 3.4 Deprivation profile, New Zealand, 2006 (Source: Statistics New Zealand 2006 Census)
0
5
10
15
20
25
1 2 3 4 5 6 7 8 9 10NZDep decile
Per
cent
Māori
non-Maori
Comparing the situation for Māori in Canterbury to all of New Zealand in Figure 3.5 we
can see that Māori in Canterbury live in areas with relatively less deprived NZDep scores
than Māori in all New Zealand. Nationally, 41.7% of Māori live in areas with the two
most deprived scores (deciles 9 and 10), compared to 7.8% in areas with the two least
deprived scores (deciles 1 and 2).
Figure 3.5 Deprivation profile for Māori, Canterbury and New Zealand, 2006 (Source: Statistics New Zealand 2006 Census)
0
5
10
15
20
25
1 2 3 4 5 6 7 8 9 10NZDep decile
Per
cent
New Zealand
Canterbury

46
Social and economic indicators
Table 3.2 summarises some of the elements that make up the NZDep scores, and which
are important indicators of socio-economic status. These indicators are presented
without age-sex standardisation, which limits the direct comparisons that can be made
between ethnic groups. For example, an indicator that is associated with younger age will
be artificially increased for the Māori population due to its younger age structure.
However, overall, the pattern is that for all the indicators Māori are disadvantaged
compared to non-Māori.
With respect to these indicators from the 2006 Census:
• Income is used as a measure of socioeconomic position, is related to other measures
such as education and employment (Blakely, Tobias et al. 2007) and is therefore an
important determinant of health. In Canterbury, a higher proportion of Māori than
non-Māori aged over 15 years had an annual income less than $10,000. Additionally,
more than twice as many Māori as non-Māori were receiving a government benefit.
• Home ownership is an indicator of income and the quality of housing, which is
related to health (Rose 1992; Howden-Chapman and Wilson 2000). Almost twice as
many Māori as non-Māori in Canterbury did not own their own home.
• Unemployment and occupational status are related to health (Ministry of Health and
University of Otago 2006). The rate of unemployment in Canterbury for Māori over
15 year olds was more than double the rate for non-Māori, although it was lower
than for Māori in New Zealand4.
• Higher levels of educational attainment are related to improved health outcomes
(Wilkinson and Marmot 2006). A lower proportion of Māori over 15 years in
Canterbury had attained NCEA Level 2 or a higher qualification compared to non-
Māori.
• Household overcrowding indicates lower socio-economic status, and is associated
with poor health (Baker, Zhang et al. 2006), particularly from infectious diseases
(Baker, Milosevic et al. 2004). Almost three times as many Māori as non-Māori lived
4 This indicator gives an example of the potential confounding by the different age structures in the Māori
and non-Māori populations as the Māori population has a younger age structure and young people in
general have a higher rate of unemployment (Department of Labour 2006).

47
in a dwelling where there were insufficient bedrooms for the number of people living
in the house.
• More than three times as many Māori as non-Māori in Canterbury did not have
access to a phone.
• More Māori than non-Māori in Canterbury did not have access to a motor vehicle.
Table 3.2 Social and economic indicators, Canterbury and New Zealand, 2006 (Source: Statistics New Zealand 2006 Census)
Canterbury New Zealand Indicator*
Māori non-Māori Māori non-Māori
Total personal income less than $10,000§, 15+ years 21.5% 18.7% 22.0% 18.6%
Receiving government benefit†, 15+ years 24.2% 10.9% 27.6% 10.5%
Not living in own home, 15+ years 49.0% 26.5% 50.1% 27.7%
Unemployed, 15+ years 5.8% 2.5% 7.6% 2.8%
NCEA Level 2 or higher, 15+ years 41.5% 51.8% 37.9% 50.7%
Household crowding‡, all ages 14.2% 4.9% 22.1% 7.8%
Living in household with no access to a telephone or cellphone, 15+ years 2.8% 0.8% 4.9% 1.1%
Living in household with no access to a motor vehicle, 15+ years 7.7% 4.6% 8.9% 4.8%
*Note: Proportions are not age or sex standardised §This indicator includes those who made a loss or had zero income. †Includes unemployment, sickness, domestic purposes, and invalids benefits, student allowance and other government benefits and payments. ‡Household crowding is based on the Canadian Household Crowding index. The number of bedrooms required (based on the age, sex, and number of people living in the house) is compared with the actual number of bedrooms – where the required number exceeds the actual number, a household is considered crowded.
Access to heating
Inadequate household heating can have negative health consequences for the occupants
(Howden-Chapman, Signal et al. 1999; Howden-Chapman and Wilson 2000). Table 3.3
presents access to home heating in Canterbury and New Zealand and shows that at the
2006 Census more Māori than non-Māori in Canterbury did not heat their homes.
Table 3.3 Access to home heating, Canterbury and New Zealand, 2006 (Source: Statistics New Zealand)
Canterbury New Zealand Fuel type Māori non-Māori Māori non-Māori
No Heating Fuels Used 1.0% 0.6% 3.2% 2.2%
Note: Proportions are not age or sex standardised

48
3.2 Māori population geographical distribution
Figures 3.6, 3.7 and 3.8 present the distribution of Māori in Canterbury at the 2006
Census, by census area unit. They indicate that the largest number of Māori lived in
Aranui (936 people), Bexley (600), Hornby South (579) and Sydenham (576). Outside
Christchurch City the areas with the largest numbers of Māori were Kaiapoi North (in
Waimakariri District, 447 people), Kaikoura Township (in Kaikoura District, 393 people)
and Burnham Military Camp (in Selwyn District, 342 people). Figure 3.9 presents the
relative number of Māori in each census area unit, with the size of each census area unit
adjusted to correspond to the number of Māori living within that area.

49
Figure 3.6 Māori population counts, Christchurch and surrounds, 2006 (Source: Community and Public Health, CDHB)

50
Figure 3.7 Māori population counts, Hurunui – Kaikoura, 2006 (Source: Community and Public Health, CDHB)

51
Figure 3.8 Māori population counts, Selwyn – Banks Peninsula – Ashburton, 2006 (Source: Community and Public Health, CDHB)

52
Figure 3.9 Māori population counts cartogram Canterbury area, 2006 (Source: Community and Public Health, CDHB)

53
4 Risk and Protective Factors
Sources of data for many risk and protective factors are limited, with the main data for
many of them available only through the New Zealand Health Survey (NZHS) (Ministry
of Health 2008). Other than the NZHS5, data on smoking were collected in the Census
2006, and are also available from Action on Smoking in Health who survey Year 10
students at schools throughout New Zealand every year.
5 See ‘Appendix 1 Data sources and methodological issues’ for a discussion of the synthetic estimates in
the NZHS and the limitations of the interpretation of NZHS data at the CDHB level.
Key points
• In 2006, the prevalence of smoking in those over 15 years was higher for Māori
in Canterbury than non-Māori, especially for females and for those aged 15 to 24
years. The prevalence of smoking was lower for Māori in Canterbury than
nationally.
• In 2008, the prevalence of youth smoking (Year 10 students) was over four times
as high for Māori than for non-Māori. The prevalence was higher and the
difference between Māori and non-Māori was larger, for girls compared to boys.
There has been a reduction in prevalence of Māori youth smoking over 1999 to
2008, but this reduction has been relatively less than that seen for non-Māori.
• In 2008, a higher proportion of Māori youth was exposed to smoking at home
than non-Māori, but, like non-Māori, this proportion is decreasing over time.
• In 2006/07, the prevalence of obesity in those over 15 years was significantly
higher for Māori than non-Māori in Canterbury
• In 2006/07, although differences were not significant, for those over 15 years:
− Among protective factors, the prevalence of healthy nutrition was lower for
Māori than non-Māori in Canterbury and the rate of physical activity higher
− Among risk factors, the prevalence of being overweight was lower for Māori
than non- Māori in Canterbury and the rates of hazardous drinking and
marijuana smoking were higher.

54
4.1 Protective factors
Protective factors are health behaviours that promote the attainment or maintenance of
an individual’s wellbeing by supporting good health and preventing illness. Table 4.1
presents data about protective factors for Canterbury and New Zealand for 2006/07
from the NZHS.
In Canterbury the prevalence of healthy nutrition behaviours (having three or more
servings of vegetables or two or more servings of fruit a day) appeared to be lower for
Māori than European/Others, but this was not a significant difference (95% CIs for the
rates overlapped). The prevalence rate for Māori of doing regular physical activity
appeared higher, but again this was not a significant difference.
Table 4.1 Protective factor prevalence, 15+ years, Canterbury and New Zealand, 2006/07 (Source: HDIU/New Zealand Health Survey 2006/07)
Canterbury New Zealand
Indicator
Māori
Rate (95% CI)
European/Other
Rate (95% CI)
Māori
Rate (95% CI)
European/Other
Rate (95% CI)
61.9 69.6 58.8 66.0 Total
(56.8–66.8) (64.8–74.0) (56.1–61.4) (64.2–67.8)
56.1 62.5 53.2 59.3 Male
(50.2–61.8) (57.6–67.2) (49.3–57.2) (57.1–61.5)
67.0 76.1 63.5 72.3
Having 3+ servings of vegetables/day
Female(61.3–72.3) (71.1–80.7) (60.1–66.9) (70.0–74.4)
54.3 59.6 54.7 60.0 Total
(49.3–59.2) (55.0–64.0) (51.8–57.5) (58.0–62.0)
45.8 49.8 46.1 50.2 Male
(40.0–51.7) (45.1–54.5) (42.0–50.4) (47.7–52.6)
61.6 68.6 62.1 69.1
Having 2+ servings of fruit/day
Female(56.4–66.7) (63.8–73.2) (58.8–65.3) (66.7–71.5)
56.7 53.7 55.6 52.6 Total
(51.4–61.9) (48.7–58.6) (52.9–58.2) (50.5–54.7)
62.0 56.7 60.7 55.6 Male
(56.1–67.6) (51.6–61.8) (57.1–64.2) (53.1–58.0)
52.2 50.8 51.1 49.8
Doing regular physical activity
Female(46.5–57.9) (45.7–56.0) (47.7–54.6) (47.4–52.3)
Note: Rates are age-standardised (using the WHO population) prevalence rates for adults aged over 15 years. European/Other are non-Māori, non-Pacific, non-Asian.

55
4.2 Risk factors
Risk factors are states or activities that increase an individual’s likelihood of becoming
unwell or getting a disease. Table 4.2 presents data about risk factors for Canterbury and
New Zealand for 2006/07 from the NZHS.
The prevalence of obesity6 was significantly higher for Māori in Canterbury than
European/Others, although there was a lower (but non-significantly different, as the
95% CIs for the rates overlapped) prevalence of being overweight for Māori. There was a
slightly higher prevalence of combined overweight and obesity among Māori men than
Māori women.
The prevalence of current daily smoking was significantly higher for Māori in Canterbury
than for European/Others, with a higher prevalence among Māori women than Māori
men. More detailed data about smoking are presented in the following section.
The prevalence rates of hazardous drinking7 and marijuana smoking8 appeared to be
higher for Māori in Canterbury, but these were not significant differences.
6 For obesity and overweight, participants in the NZHS were weighed and had their height measured. The
body mass index (BMI) was calculated from these measurements for each participant. Participants could
then be classified as obese or overweight if their BMI was above internationally defined levels. 7 Hazardous drinking, which is associated with a high risk of damage to physical or mental health, is
defined as a score of eight or more out of ten on the Alcohol Use Disorders Identification Test (AUDIT),
which was developed by the WHO. The test was completed by those adults in the NZHS who had had an
alcoholic drink in the previous year. The test’s questions cover participants’ alcohol consumption and
drinking behaviour, and problems related to drinking. 8 Data about marijuana smoking were drawn from the 2002/03 NZHS.

56
Table 4.2 Risk factor prevalence, 15+ years, Canterbury and New Zealand, 2006/07 (Source: HDIU/New Zealand Health Survey 2006/07 & 2002/03)
Canterbury New Zealand
Indicator
Māori Rate
(95% CI)
European/Other Rate
(95% CI)
Māori Rate
(95% CI)
European/Other Rate
(95% CI)
29.0 35.2 30.2 36.6 Total
(24.6–33.6) (31.1–39.4) (27.9–32.5) (35.2–38.1)
31.1 40.5 32.4 42.2 Male
(25.9–36.6) (36.2–44.9) (28.8–36.1) (40.1–44.2)
27.0 29.9 28.1 31.1
Overweight
Female(22.2–32.2) (25.7–34.3) (25.1–31.4) (29.3–33.0)
35.2 20.4 40.1 23.3 Total
(31.8–38.6) (17.5–23.6) (37.9–42.4) (21.8–24.9)
34.8 20.1 39.7 22.9 Male
(30.4–39.4) (17.0–23.5) (36.1–43.4) (21.0–25.0)
35.5 20.8 40.5 23.7
Obesity
Female (31.4–39.7) (17.6–24.2) (37.3–43.7) (21.7–25.8)
37.4 16.2 41.5 17.9 Total
(33.5–41.4) (13.0–19.8) (39.0–44.0) (16.5–19.4)
34.5 16.9 38.3 18.8 Male
(29.5–39.7) (13.6–20.7) (34.3–42.4) (17.1–20.6)
39.9 15.5 44.2 17.1
Current daily smokers
Female(35.3–44.5) (12.2–19.2) (40.8–47.6) (15.5–18.9)
29.0 22.1 30.9 20.6 Total
(19.6–38.4) (17.6–26.7) (29.0–32.8) (19.3–21.9)
34.9 33.2 40.9 29.2 Male
(20.8–49.0) (27.3–39.0) (37.7–44.2) (27.0–31.3)
22.4 11.7 22.2 12.7
Hazardous drinking
Female(9.1–41.8) (5.8–17.7) (20.1–24.3) (11.2–14.1)
35.3 16.8 27.3 16.9 Marijuana use in previous 12 months (2002/03 NZHS)
Total (15.9–58.9) (13.0–20.7) (24.3–30.4) (15.6–18.2)
Note: Rates are age-standardised (using the WHO population) prevalence rates for adults aged over 15 years. European/Other are non-Māori, non-Pacific, non-Asian.
Table 4.3 presents the prevalence of high cholesterol and high blood pressure for which
medication was taken, from the NZNHS 2006/07. The prevalence of both risk factors
was reported as lower for Māori in Canterbury than for European/Others and lower
than for Māori in New Zealand, but none of these differences were statistically
significant (95% CIs for the rates overlapped). At the national level, Māori were
significantly less likely to have medicated high cholesterol and hypertension. This may be
due to lack of diagnosis rather than a truly lower burden of disease from these risk
factors.

57
Table 4.3 Prevalence of medicated risk factors, 15+ years, Canterbury and New Zealand, 2006/07 (Source: HDIU/New Zealand Health Survey 2006/07)
Canterbury New Zealand
Indicator
Māori Rate
(95% CI)
European/Other Rate
(95% CI)
Māori Rate
(95% CI)
European/Other Rate
(95% CI)
3.8 6.0 4.4 7.1 Total
(2.4–5.6) (4.7–7.5) (3.4–5.7) (6.2–8.0)
4.5 6.8 5.3 8.1 Male
(2.7–6.9) (5.4–8.5) (3.7–7.2) (7.0–9.3)
3.2 5.2 3.7 6.1
Self-reported medicated high cholesterol
Female(1.7–5.3) (3.9–6.8) (2.5–5.3) (5.2–7.2)
7.4 10.3 8.2 11.4 Total
(5.6–9.7) (8.6–12.2) (7.0–9.6) (10.5–12.3)
7.5 9.7 8.3 10.7 Male
(5.2–10.4) (7.8–11.9) (6.4–10.4) (9.5–12.0)
7.4 10.8 8.2 12.0
Self-reported medicated high blood pressure
Female(5.4–9.9) (9.0–12.9) (6.7–9.9) (10.8–13.1)
Note: Rates are age-standardised (using the WHO population) prevalence rates for adults aged over 15 years. European/Other are non-Māori, non-Pacific, non-Asian.
Tobacco
Exposure to tobacco smoke is a well established risk factor for health problems, both for
the smoker and those exposed to environmental tobacco smoke. These health problems
include cancers of the lung, larynx, pancreas, kidney, mouth oesophagus, stomach,
cervix, and bladder; ischaemic heart disease, peripheral vascular disease and stroke;
chronic obstructive pulmonary disease (COPD); and reproductive and childhood effects
such as preterm delivery, stillbirth, low birth weight and sudden infant death syndrome
(SIDS) (Woodward and Laugesen 2001; U.S. Department of Health and Human Services
2004).
Smoking prevalence
In the 2006 Census a smaller proportion of Māori aged over 15 years in Canterbury was
current daily smokers (38%) compared to Māori in New Zealand (40.1%), as shown in
Table 4.4. However, the rate of smoking in Māori in Canterbury was more than double
that for non-Māori (18.4%). More Māori women in Canterbury smoked daily (40.4%)
than men (35.6%), which was consistent with the national picture for Māori, but was in
contrast to the picture for non-Māori, among whom men smoked more than women.
The prevalence of smoking among respondents in a Ngāi Tahu survey, Mō Tātou
(Ahuriri-Driscoll, Cram et al. 2004) conducted in 2003/04 was 25.9%. This was lower

58
than the prevalence for all Māori from the Census, although the Mō Tātou prevalence
was not age-standardised.
Table 4.4 Current daily smokers, 15+ years, by gender, Canterbury and New Zealand, 2006 (Source: Statistics New Zealand Census 2006)
Canterbury New Zealand
Māori non-Māori Māori non-Māori
Males 35.6% 19.9% 36.2% 19.9% Females 40.4% 16.9% 43.5% 16.4%
Total 38.0% 18.4% 40.1% 18.1%
Note: Rates are age-standardised to the 2001 Māori population
The pattern of regular smoking by age group in Canterbury and New Zealand at the 2006
Census, as shown in Figure 4.1, was that the highest rates were in those in the 25-34 and
35-44 year age groups. Those in the 15-24 year age group were slightly less likely to be
regular smokers, and the rates declined in the age groups older than 45 years, with the
lowest rates being among those over 65 years. Across the age groups, the age-specific
rates for Māori were around double those for non-Māori, both nationally and in
Canterbury.
Figure 4.1 Current regular smokers, 15+ years, by age group, Canterbury and NZ, 2006 (Source: Statistics New Zealand Census 2006)
39.3%
42.9%41.2%
36.9%
28.0%
39.4%
45.2% 44.9%
39.9%
30.1%
15.5%14.2%
6.8%
13.9%17.3%
19.4%21.4%
18.0%
6.5%
13.5%
16.7%19.3%
22.1%18.8%
0%
5%
10%
15%
20%
25%
30%
35%
40%
45%
50%
15-24 25-34 35-44 45-54 55-64 65 + 15-24 25-34 35-44 45-54 55-64 65 +
Canterbury New Zealand
Age group (years)
Per
cen
t
Māori
non-Māori

59
Youth smoking
There were marked differences over the period from 1999 to 2008 in the rates of
smoking among Māori and non-Māori Year 10 students in Canterbury, as shown in
Figure 4.2. In the 2008 Year 10 survey conducted by Action on Smoking in Health
(ASH), more than four times as many Māori Year 10 students smoked daily (17.9%) than
non-Māori (4.2%), and this difference was statistically significant. The rate of daily
smoking among female Māori Year 10 students (20.4%) was higher than that for males
(14.9%), although the rates were not significantly different (95% CIs for the rates
overlapped). However, this female:male difference did mirror a difference found for all
of New Zealand, where the difference was statistically significant (non-overlapping 95%
CIs for the rates).
Figure 4.2 Current smokers, 14-15 year olds, Canterbury and New Zealand, 2008
(Source: Action on Smoking and Health Year 10 Survey)
17.3%
21.6%
12.6%
17.9%
14.9%
20.4%
4.4%4.6%4.2%4.2%4.5%3.7%
0%
5%
10%
15%
20%
25%
30%
Male Female Total Male Female Total
Canterbury New Zealand
Per
cen
t
Māori
non-Māori
The trends over time for Year 10 students who were daily smokers and who had never
smoked are shown in Figures 4.3 and 4.4, respectively. These show that there was an
important decline in the prevalence of daily smokers and increase in never smokers
among Year 10 students in the ten years from 1999 to 2008. The rate of smoking in
Māori Year 10 students in Canterbury decreased in the period from 1999 to 2008 from
35.7% to 17.9%, a fall of 17.8 percentage points, or almost 50%. The absolute reduction

60
was less in non-Māori Year 10 students, at 10.1 percentage points, from 14.3% to 4.2%,
but this was a greater relative reduction, of over 70%.
Figure 4.3 Daily smokers, 14-15 year olds, Canterbury and New Zealand, 1999-2008 (Source: Action on Smoking and Health Year 10 Survey)
0%
5%
10%
15%
20%
25%
30%
35%
40%
45%
50%
1999 2000 2001 2002 2003 2004 2005 2006 2007 2008Year of survey
Per
cen
t in
eac
h c
ateg
ory
Māori CanterburyMāori NZnon-Māori Canterburynon-Māori NZ
Figure 4.4 Never smokers, 14-15 year olds, Canterbury and New Zealand, 1999-2008 (Source: Action on Smoking and Health Year 10 Survey)
0%
10%
20%
30%
40%
50%
60%
70%
80%
1999 2000 2001 2002 2003 2004 2005 2006 2007 2008Year of survey
Per
cen
t in
eac
h c
ateg
ory
Māori NZMāori Canterburynon-Māori NZnon-Māori Canterbury
Figure 4.5 presents the percentage of homes of Year 10 students where one or both
parents smoked, over the period from 2001 to 2008. The proportion of Year 10 students
in Canterbury exposed to tobacco smoke at home was greater for Māori than non-Māori,

61
although the difference was smaller than for Māori and non-Māori in New Zealand.
Over half of Māori Year 10 students were exposed to health risks from exposure to
environmental tobacco smoke, regardless of whether they smoked themselves. These
risks include higher rates of a range of diseases (DiFranza, Aligne et al. 2004) and
increased likelihood of young people becoming smokers themselves (Darling and Reeder
2003; Vink, Willemsen et al. 2003).
Figure 4.5 Parental smoking in the home, Canterbury and New Zealand, 2001-2008 (Source: Action for Smoking and Health Year 10 Survey)
0%
10%
20%
30%
40%
50%
60%
70%
80%
2001 2002 2003 2004 2005 2006 2007 2008 2001 2002 2003 2004 2005 2006 2007 2008
Canterbury New ZealandYear of survey
Per
cen
t
Māori
non-Māori

62

63
5 Health Status
This chapter presents mortality and public hospitalisation data, followed by a
discussion of health and health problems under the categories of general health status,
cardiovascular disease, cancer, respiratory disease, diabetes, communicable disease,
mental health, injury, oral health, child and youth health, sexual and reproductive
health, and older persons’ health.
5.1 Mortality
This section presents the number of deaths and the age-sex-standardised mortality rates
for all causes and then by specific cause in Canterbury and New Zealand for Māori and
non-Māori from 2000 to 2004.
All-cause mortality
Table 5.1 presents the number of deaths from all causes and mortality rates for
Canterbury and New Zealand for Māori and non-Māori. Rate ratios are presented giving
the risk of death from all causes for Māori relative to non-Māori.
There was an average of 97 deaths a year for Canterbury Māori over the period from
2000 to 2004. The all-cause mortality rate was higher for Māori than non-Māori in
Canterbury (RR 1.45, 95% CI 1.32-1.59). However, the all-cause mortality rate for Māori
Key points
From 2000 to 2004:
• Age-standardised all-cause mortality was significantly higher for Māori than non-
Māori in Canterbury.
• The difference between the all-cause mortality rates for Māori and non-Māori in
Canterbury was not as great as it was nationally.
• The leading causes of death for Māori in Canterbury were ischaemic heart
disease, lung cancer, chronic obstructive pulmonary disease, type 2 diabetes and
transport accidents.

64
was lower in Canterbury than in New Zealand (RR 0.72) 9, and the disparity between
Māori and non-Māori in Canterbury (RR 1.45, 95% CI 1.32-1.59) was lower than that for
New Zealand (RR2.04, 95% CI 2.00-2.03).
Table 5.1 All-cause mortality, all ages, Canterbury and New Zealand, 2000-2004 (Source: Te Rōpū Rangahau Hauora a Eru Pōmare)
Canterbury New Zealand
Māori non-Māori Māori non-Māori
No. Rate
(95% CI) No. Rate
(95% CI)
Rate ratio (95% CI)
No. Rate
(95% CI) No. Rate
(95% CI)
Rate ratio (95% CI)
485 312.5 16,320 215.5 1.45 13,254 434.3 126,658 213.1 2.04 (285.6-342.0) (210.8-220.3) (1.32-1.59) (426.9-441.8) (211.3-214.8) (2.00-2.08)
Note: Rates are calculated per 100,000, age-sex standardised to the 2001 Māori population.
Due to small numbers, age-specific mortality rates have not been presented, except those
that will be presented in later chapters for children and young people (see section 5.12).
Sex-specific rates are included where appropriate in the sections for each disease.
Causes of mortality
Table 5.2 presents the leading causes of death from 2000 to 2004, which are ranked in
the table according to the rate for Māori in Canterbury. Several of the categories of
causes of mortality are described in more detail in later sections of this profile, and are
therefore not dealt with extensively in this section.
The leading causes of death for Māori in Canterbury were circulatory system diseases,
cancer, accidents, respiratory diseases, and endocrine, nutritional and metabolic diseases
(consisting mostly of type 2 diabetes). For all five of these categories of cause of death,
the mortality rate for Māori was significantly higher than for non-Māori in Canterbury.
Among these causes the highest rate ratio was for endocrine, nutritional and metabolic
diseases at 3.56 (95% CI 2.43-5.23), indicating that deaths among Canterbury Māori for
this group of causes were three and a half times more common than for non-Māori. 9 Throughout this section and those following rate ratios comparing Māori in Canterbury and New
Zealand are calculated by dividing the rate for Māori in Canterbury by the rate for Māori in New Zealand.
These are presented in the text but are not included in the tables for reasons of clarity (whereas rate ratios
comparing Māori and non-Māori in Canterbury and Māori and non-Māori nationally are presented in the
tables). Ninety-five percent confidence intervals have not been calculated for these rate ratios, although the
95% CIs for the rates themselves can be compared to see whether or not they overlap.

65
Although the rate ratio was lower for cardiovascular disease, at 1.50 (95% CI 1.27-1.77),
indicating that Māori were 50% more likely to die from this cause, cardiovascular disease
had the biggest rate difference10 with around 32 more deaths per 100,000 for Māori than
for non-Māori.
For other causes of death, including suicide, digestive system disease, mental disorders,
unknown causes and homicide, the rates appeared higher in Māori but the confidence
interval for the rate ratio included 1. In keeping with this, the 95% confidence intervals
for the rates for Māori and non-Māori overlapped, indicating a non-statistically
significant difference. For nervous system disease, congenital anomalies, perinatal
conditions and genito-urinary system disease the rates in Māori appeared lower but again
these were not statistically significant differences. Small numbers for some of the causes
of death may preclude detection of real differences as small numbers are associated with
wide confidence intervals.
The rates of the top five causes of death for Māori in Canterbury were lower than for
Māori nationally, and the 95% confidence intervals for the rates for Māori in Canterbury
and New Zealand did not overlap, indicating that these differences were statistically
significant. The difference between the rates for Māori in Canterbury and New Zealand
varied, with the rate ratio for Māori in Canterbury compared to nationally being 0.59 for
endocrine, nutritional and metabolic diseases (meaning Māori in Canterbury were at
around 41% lower risk of dying from these causes than Māori nationally), for respiratory
diseases 0.62, cardiovascular disease 0.68, cancer 0.79, and accidents 0.89 (with non-
overlapping 95% CIs for the rates except for accidents).
10 The rate difference is calculated by subtracting the rate for non-Māori from that for Māori: 95.2 - 63.3 =
31.9. Cardiovascular disease has the biggest rate difference because it is the most prevalent cause of death
and because the rate ratio is relatively high.

66
Table 5.2 Leading causes of death, all ages, Canterbury and New Zealand, 2000-2004 (Source: Te Rōpū Rangahau Hauora a Eru Pōmare)
Canterbury New Zealand
Māori non-Māori Māori non-Māori Cause of death
No. Rate
(95% CI) No.
Rate
(95% CI)
Rate ratio
(95%CI) No. Rate
(95% CI) No.
Rate
(95% CI)
Rate ratio
(95%CI)
Circulatory system disease 148 95.2 6,865 63.3 1.50 4,316 139.8 51,805 61.2 2.29 (80.9-112.1) (63.3-61.5) (1.27-1.77) (135.7-144.1) (61.2-60.5) (2.21–2.36)
Cancer 141 93.7 4,740 69.3 1.35 3,640 119.2 36,372 67.3 1.77 (79.2-110.8) (66.9-71.7) (1.14-1.60) (115.4-123.2) (66.5-68.2) (1.71-1.83)
Accidents 51 30.7 502 15.8 1.94 1,030 34.6 4,521 17.8 1.94 (23.3-40.5) (14.2-17.7) (1.44-2.61) (32.5-36.8) (17.2-18.5) (1.81-2.08)
Respiratory diseases 32 21.0 1,311 13.2 1.59 1,037 33.8 10,658 13.1 2.59 (14.8-29.9) (12.3-14.2) (1.11-2.28) (31.8-36.0) (12.8-13.4) (2.42-2.76)
Endocrine, nutritional, metabolic 30 20.9 457 5.9 3.56 1,082 35.4 4,069 6.8 5.20 (14.5-30.0) (5.2-6.6) (2.43-5.23) (33.4-37.6) (6.5-7.1) (4.83-5.59)
Suicide 22 12.7 295 11.4 1.11 437 14.8 2,004 10.0 1.49 (8.4-19.3) (10.1-12.9) (0.72-1.72) (13.5-16.2) (9.5-10.4) (1.34-1.65)
Digestive system disease 11 7.4 474 5.1 1.45 235 7.6 3,568 4.7 1.61 (4.1-13.4) (4.5-5.7) (0.79-2.67) (6.7-8.7) (4.5-5.0) (1.40-1.84)
Nervous system diseases 8 5.2 548 7.9 0.65 183 5.9 4,290 7.1 0.83 (2.6-10.3) (7.0-9.0) (0.32-1.32) (5.1-6.8) (6.8-7.5) (0.71-0.97)
Mental disorders 8 4.8 479 4.3 1.10 103 3.3 3,434 3.1 1.06 (2.4-9.6) (3.8-4.9) (0.54-2.25) (2.7-4.0) (3.0-3.3) (0.86-1.30)
Congenital anomalies 8 4.8 88 5.3 0.90 161 5.4 761 6.0 0.91 (2.4-9.6) (4.2-6.8) (0.43-1.88) (4.7-6.3) (5.5-6.5) (0.76-1.08)
Perinatal conditions 7 4.3 59 6.1 0.71 224 7.6 517 6.4 1.19 (2.1-9.1) (4.8-7.9) (0.32-1.54) (6.7-8.7) (5.9-7.0) (1.01-1.39)
Unknown causes 6 3.7 14 1.1 3.52 212 7.2 168 1.4 5.14 (1.7-8.3) (0.6-1.9) (1.31-9.43) (6.3-8.3) (1.2-1.7) (4.13-6.40)
Certain infectious diseases 4 2.7 75 1.5 1.79 137 4.5 665 2 2.22 (1.0-7.3) (1.0-2.2) (0.62-5.15) (3.8-5.3) (1.8-2.3) (1.82-2.72)
Homicide 2 1.4 15 0.6 2.33 109 3.6 175 1.0 3.52 (0.3-5.7) (0.3-1.0) (0.52-10.54) (3.0-4.4) (0.9-1.2) (2.74-4.52)
Genitourinary system disease 2 1.2 183 1.7 0.69 174 5.7 1,685 1.8 3.19 (0.3-4.8) (1.4-2.1) (0.17-2.80) (4.9-6.6) (1.7-1.9) (2.71-3.76)
Note: Rates are calculated per 100,000, age-sex-standardised to the 2001 Māori population. The ranking of this table is by the rate for Māori in Canterbury

67
Table 5.3 shows the leading causes of death for Māori and non-Māori in Canterbury and
New Zealand over the period from 2000 to 2004, with ischaemic heart disease having
been the major cause of death for all groups. The second most common cause of death
among Māori in Canterbury was lung cancer, followed by chronic obstructive pulmonary
disease (COPD), type 2 diabetes, and transport accidents. Lung cancer was also among
the leading causes for non-Māori in Canterbury, but was third after stroke, and followed
by suicide and colorectal cancer. Stroke replaced transport accidents as one of the five
leading causes of death among Māori in New Zealand compared to Māori in Canterbury.
Table 5.3 Five leading causes of death, ranked by mortality rate, Canterbury and New Zealand, 2000-2004 (Source: Te Rōpū Rangahau Hauora a Eru Pōmare)
Māori non-Māori
Ischemic heart disease Ischemic heart disease
Lung cancer Stroke
COPD Lung cancer
Type 2 diabetes Suicide
Canterbury
Transport accidents Colorectal cancer
Ischemic heart disease Ischemic heart disease Lung cancer Stroke Type 2 diabetes Breast cancer in women COPD Lung cancer
New Zealand
Stroke Transport accidents
Note: The ranking in this table is according to the mortality rates after age-sex-standardisation to the 2001 Māori population.

68
5.2 Hospitalisation
This section examines the public hospitalisations in Canterbury and New Zealand for
Māori and non-Māori over the period from 2003 to 2005. The number of
hospitalisations and the age-sex-standardised rates are presented (except for sex-specific
conditions, where the rates are age-standardised only).
Over the period from 2003 to 2005 there were an average of around 5,400 public
hospitalisations per year for Māori in Canterbury and around 82,350 a year for non-
Māori.
The total number and rate of all hospitalisations per 100,000 population in Canterbury
and New Zealand are shown in Table 5.4. These data indicate that Māori were
hospitalised significantly less often overall than non-Māori in Canterbury, with a rate
ratio of 0.89 (95% CI 0.87-0.91), indicating that Māori in Canterbury had an 11% lower
rate of hospital admission than non-Māori. As Māori also had a higher rate of admission
for pregnancy, childbirth and puerperium (as will be discussed below), the difference in
rates of hospitalisation for morbidity (as opposed to hospitalisation only for childbirth)
was greater still.
Key points
From 2000 to 2005:
• The overall rate of hospitalisation was lower for Māori than non-Māori in
Canterbury, in contrast to a higher rate for Māori than non-Māori nationally.
• Māori in Canterbury also had lower rates of hospitalisation than Māori nationally,
both overall and for every major cause.
• Among the leading specific major causes of hospitalisation:
− The rates of hospitalisation for pregnancy and childbirth, respiratory disease,
mental and behavioural disorders and circulatory diseases were higher for
Māori than non-Māori in Canterbury.
− The rates of hospitalisation for injury and poisoning, and digestive system
disease were lower for Māori than non-Māori in Canterbury.

69
The rate of hospitalisation for Māori in Canterbury was also significantly less than that
for Māori nationally, with a rate ratio for hospital admission for Māori in Canterbury
compared to Māori in New Zealand of 0.67 (95% CIs for the rates did not overlap). This
indicates that Māori in Canterbury had a 33% lower rate of admission than Māori
nationally.
The difference between the rates of hospitalisation for Māori and non-Māori in
Canterbury and New Zealand was quite marked. In Canterbury there was a lower overall
rate of hospitalisation for Māori than for non-Māori (RR 0.89, 95% CI 0.87-0.91), but in
contrast, nationally there was a significantly higher rate of hospitalisation for Māori than
non-Māori. The rate ratio for hospital admission for Māori compared to non-Māori in
New Zealand was 1.32 (95% CI 1.31-1.33), indicating that Māori had a 32% higher rate
of hospitalisation than non-Māori nationally.
Table 5.4 Public hospitalisations, all ages, Canterbury and New Zealand, 2003-2005 (Source: Te Rōpū Rangahau Hauora a Eru Pōmare)
Canterbury New Zealand
Māori non-Māori Māori non-Māori
No. Rate
(95% CI) No.
Rate (95% CI)
Rate ratio (95% CI) No.
Rate (95% CI)
No. Rate
(95% CI)
Rate ratio (95% CI)
16,189 15,635.7 247,062 17,553.3 0.89 443,800 23,442.0 2,968,301 17,781.9 1.32 (15,363.2-15,913.1) (17,455.2-17,652.0) (0.87-0.91) (23,373.1-23,511.1) (17,761.7-17,802.14) (1.31-1.33)
Note: Rates are calculated per 100,000, age-sex-standardised to the 2001 Māori population
Major causes of hospitalisation
The leading causes of hospitalisation are presented in Table 5.5. This table ranks causes
of hospitalisation according to the number of admissions for Māori in Canterbury.
Several of the categories of causes of hospitalisation are described in more detail in later
sections of this profile, and are therefore not dealt with extensively in this section.
The most common category of hospitalisation for Māori in Canterbury was ‘Factors
influencing health status and contact with health services’ (16.2% of all admissions), as it
was for non-Māori in Canterbury (15.8%), and Māori (21.4%) and non-Māori (14.2%)
nationally (see Table 5.6). Māori in Canterbury were significantly less likely than non-
Māori to be admitted under this category, which covers admissions that are not for
conditions listed in other International Classification of Disease (ICD) chapters, such as

70
births (for the baby) and admissions for procedures and other services. Of admissions
under this category, 38.6% for Māori in Canterbury were for live births, compared to
25.4% for non-Māori, reflecting the higher fertility and birth rates among Māori. Another
19.9% of admissions for Māori in Canterbury, and 35% for non-Māori, were admissions
for specific procedures. While 19.1% of admissions for non-Māori under this category
were for rehabilitative services, admission for these services made up only 4.6% of
hospitalisations for Māori, although the rates were similar for Māori and non-Māori (RR
1.04, 95% CI 0.86-1.26). The different age profiles of the Māori and non-Māori
populations are likely to have contributed to this, with fewer Māori among the older age
group which is more likely to require rehabilitative services.
The rate of hospitalisation for ‘Factors influencing health status and contact with health
services’ for Māori in Canterbury was significantly lower than the rate for Māori
nationally (RR 0.51, non-overlapping 95% CIs for the rates). The difference in the rates
between Māori and non-Māori varied markedly between Canterbury (RR 0.67, 95% CI
0.64-0.70), and New Zealand (RR 1.46, 95% CI 1.44-1.48). That is, in Canterbury Māori
were hospitalised under this category 33% less frequently than non-Māori, whereas
nationally Māori were hospitalised under this category 46% more frequently than non-
Māori.
Admissions related to pregnancy and childbirth were the second most frequent cause of
admission for Māori in Canterbury, making up 16% of all hospitalisations and 26.8% of
hospitalisations for females. By comparison, this category accounted for 10.2% of
admissions for non-Māori in Canterbury (17.5% of hospitalisations for females), and
Māori were significantly more likely to be admitted for this cause than non-Māori in
Canterbury (RR 1.13, 95% CI 1.09-1.18). The rate of admission for Māori in Canterbury
was significantly lower than that for Māori nationally (RR 0.73, non-overlapping 95% CIs
for the rates). The difference in the rates between Māori and non-Māori was less in
Canterbury (RR 1.13, 95% CI 1.09-1.18) than in New Zealand (RR 1.41, 95% CI 1.40-
1.43). Pregnancy and childbirth are examined further in section 5.13 Sexual and
reproductive health.
The third most frequent cause of hospital admission for Māori in Canterbury was
respiratory disease, making up 10.9% of hospitalisations. In comparison this was the

71
cause of 6.7% of non-Māori hospitalisations in Canterbury (the seventh most frequent
cause) and 9.5% of hospitalisations for Māori nationally (fourth most frequent cause).
The rate of admission for Māori in Canterbury was significantly lower than that for
Māori nationally (RR 0.78, non-overlapping 95% CIs for the rates). The difference in the
rates between Māori and non-Māori was less in Canterbury (RR 1.29, 95% CI 1.23-1.37)
than nationally (RR 1.65, 95% CI 1.62-1.68). Respiratory disease is examined further in
section 5.6.
Injury and poisoning was the fourth most frequent cause of admission for Māori in
Canterbury (9.1% of the total) and the third most frequent cause both for non-Māori in
Canterbury (9.4% of the total) and for Māori nationally (9.7% of the total). The rate of
admission for injury and poisoning for Māori in Canterbury was significantly lower than
that for Māori nationally (RR 0.61, non-overlapping 95% CIs for the rates). The
difference in the rates between Māori and non-Māori varied between Canterbury (RR
0.89, 95% CI 0.84-0.94) and New Zealand (RR 1.27, 95% CI 1.25-1.28). Injury and
poisoning are examined further in section 5.10 Injury.
The fifth most frequent cause of hospital admission for Māori in Canterbury was
digestive system disease (5.2% of the total), as it was for non-Māori in Canterbury
(7.4%). The rate of admission for Māori in Canterbury was significantly lower than that
for Māori nationally (RR 0.53, non-overlapping 95% CIs for the rates). The difference in
the rates between Māori and non-Māori varied between Canterbury (RR 0.73, 95% CI
0.68-0.79) and New Zealand (RR 1.20, 95% CI 1.18-1.22). A greater proportion of
admissions under this category for Māori in Canterbury were for dental problems
(18.4%) compared to non-Māori (6.6%), although the rates of admission were similar,
and not significantly different (RR 0.93, 95% CI 0.78-1.11). This may be influenced by
the younger age profile of the Māori population, with younger people more likely to need
admission for teeth and gum problems, which require hospitalisation for anaesthetic to
carry out dental procedures. Dental problems are examined further in section 5.11 Oral
health.
The next most frequent category of hospitalisation for Māori in Canterbury was
‘Symptoms and signs’ (5.2% of the total). Admissions under this category include
symptoms, signs and abnormal clinical and laboratory findings that are not classified

72
under other ICD chapters. The rate of admission for Māori in Canterbury was
significantly lower than for Māori nationally (RR 0.64, non-overlapping 95% CIs for the
rates). The difference in the rates between Māori and non-Māori varied between
Canterbury (RR 0.81, 95% CI 0.75-0.87) and New Zealand (RR 1.13, 95% CI 1.12-1.15).
Genitourinary system disease was the seventh most frequent category of hospital
admission for Māori in Canterbury (4.8% of the total) and the tenth most frequent for
non-Māori in Canterbury (4.7%). The rate of admission for Māori in Canterbury was
significantly lower than for Māori nationally (RR 0.81, non-overlapping 95% CIs for the
rates). The difference in the rates between Māori and non-Māori was not significant in
Canterbury (RR 1.05, 95% CI 0.97-1.13), but there was a significant difference nationally
(1.25, 95% CI 1.23-1.27). Although the proportion of admissions under this category that
was for renal failure was similar for Māori (3.5%) and non-Māori (3.6%) in Canterbury,
the rate of renal failure hospitalisation was significantly higher for Māori (RR 1.85, 95%
CI 1.21-2.82). Renal failure is examined again in section 5.7 Diabetes.
Mental and behavioural disorders were the eighth most frequent cause of admission for
Māori in Canterbury (4.4% of the total). The rates of hospitalisation for Māori in
Canterbury and in New Zealand were not statistically different (RR 1.01, overlapping
95% CIs for the rates). The difference in the rates between Māori and non-Māori was
smaller in Canterbury (RR 1.29, 95% CI 1.19-1.40) than nationally (RR 1.81, 95% CI
1.77-1.85). Mental and behavioural disorders are examined further in section 5.9 Mental
health.
The ninth most frequent cause of hospitalisation for Māori in Canterbury was circulatory
system disease (4.2% of the total), although it was the fourth most frequent cause for
non-Māori (8.4% of the total). The rate of admission for Māori in Canterbury was
significantly lower than for Māori nationally (RR 0.60, non-overlapping 95% CIs for the
rates). The difference in the rates between Māori and non-Māori was smaller in
Canterbury (RR 1.22, 95% CI 1.13-1.32) than nationally (RR 1.74, 95% CI 1.71-1.77).
Circulatory system disease is examined further in section 5.4 Cardiovascular disease.
Cancers were the tenth most frequent cause of admission for Māori in Canterbury
(3.7%), but the eighth most frequent cause for non-Māori (6.4%). The rate of admission

73
for Māori in Canterbury was significantly lower than for Māori nationally (RR 0.81, non-
overlapping 95% CIs for the rates). The difference in the rates between Māori and non-
Māori was not significant in Canterbury (RR 0.96, 95% CI 0.88-1.05), but there was a
relatively small significant difference nationally (RR 1.07, 95% CI 1.05-1.09). Cancer is
examined further in section 5.5.
Among the other categories of hospitalisation, the rates of admission for Māori
compared to non-Māori in Canterbury were significantly different (95% CIs for the rate
ratios did not include 1) as follows:
• Lower rates for perinatal conditions, musculoskeletal disease, infectious and parasitic
diseases, nervous system disease, and congenital anomalies;
• Higher rates for ear diseases and skin diseases.
There were non-significant differences (95% CIs for rate ratios included 1) between rates
for Māori and non-Māori for endocrine, nutritional and metabolic diseases, diseases of
the blood, and diseases of the eye.
The rates of hospitalisation for Māori in Canterbury were lower than for Māori in New
Zealand for all of the categories listed in the previous paragraph, except for nervous
system diseases, congenital anomalies and diseases of the blood. For these categories of
disease the rate ratios for Māori in Canterbury compared to Māori nationally were less
than one, but the 95% confidence intervals for the rates overlapped, and the rates were
therefore not significantly different.
Noteworthy among the remaining causes of hospitalisation were:
• Much lower rates of hospitalisation for Māori in Canterbury than for non-Māori for
perinatal conditions, with statistically significant lower rates for prematurity (RR 0.51,
95% CI 0.40-0.64), birth trauma (RR 0.18, 95% CI 0.11-0.32), perinatal respiratory
and cardiovascular disorders (RR 0.47, 95% CI 0.41-0.55) and perinatal infections
(RR 0.47, 95% CI 0.26-0.84), but a non-significantly lower rate for slow foetal growth
and maturation (RR 0.75, 95% CI 0.49-1.15).
• Among musculoskeletal diseases, a significantly higher rate for Māori in Canterbury
than non-Māori for gout (RR 3.46, 95% CI 2.06-5.82), but a lower rate of other
causes under this category.

74
• Among infectious and parasitic infections, a higher rate for Māori in Canterbury than
non-Māori for viral hepatitis (RR 3.09, 95% CI 2.15-4.45), a lower rate for intestinal
infectious diseases (RR 0.59, 95% CI 0.49-0.70), and non-significant differences for
other causes. This is examined further in section 5.8 Communicable disease.
• Among ear diseases, almost the same rate for suppurative otitis media for Māori and
non-Māori in Canterbury (RR 0.99, 95% CI 0.77-1.28), but higher rates for Māori in
Canterbury than non-Māori for non-suppurative otitis media (glue ear) (RR 1.27,
95% CI 1.11-1.46), and perforation of the ear drum (RR 2.17, 95% CI 1.52-3.06).
• Among skin diseases, higher rates for Māori in Canterbury compared to non-Māori
for skin infections (RR 1.28, 95% CI 1.10-1.49).
• A much lower rate of admission for congenital anomalies for Māori in Canterbury
than non-Māori (RR 0.67, 95% CI 0.58-0.77).
• Among endocrine, nutritional and metabolic diseases higher rates for Māori in
Canterbury than non-Māori for type 2 diabetes (RR 2.64, 95% CI 2.14-3.27) (diabetes
is examined further in section 5.7) and disorders of the thyroid (RR 3.15, 95% CI
2.07-4.78), but lower rates for Māori in Canterbury than non-Māori for type 1
diabetes (RR 0.56, 95% CI 0.40-0.78).

75
Table 5.5 Leading causes of public hospitalisation, by major cause of admission, all ages, Canterbury and New Zealand, 2003-2005 (Source: Te Rōpū Rangahau Hauora a Eru Pōmare)
Canterbury New Zealand
Māori non-Māori Māori non-Māori ICD Chapter
No. Rate
(95% CI) No.
Rate (95% CI)
Rate ratio
(95% CI) No. Rate
(95% CI) No.
Rate (95% CI)
Rate ratio
(95% CI)
Factors influencing health status 2,624 2,578.5 39,107 3,842.1 0.67 94,974 5,038.1 293,773 3,456.3 1.46 (2,471.9-2,689.7) (3,791.7-3,893.2) (0.64-0.70) (4,983.3-5,093.5) (3,431.3-3,481.5) (1.44-1.48)
Pregnancy, childbirth & puerperium* 2,586 4,698.4 25,127 4,146.3 1.13 60,832 6,423.6 213,596 4,544.1 1.41 (4,511.7-4,892.8) (4,088.7-4,204.6) (1.09-1.18) (6,349.8-6,498.3) (4,516.4-4,572.0) (1.40-1.43)
Respiratory disease 1,768 1,755.5 16,592 1,356.4 1.29 42,182 2,249.8 138,034 1,367.2 1.65 (1,670.5-1,844.9) (1,325.8-1,387.8) (1.23-1.37) (2,217.9-2,282.2) (1,351.8-1,382.8) (1.62-1.68)
Injury and poisoning 1,471 1,408.5 23,242 1,581.6 0.89 43,091 2,311.1 206,887 1,822.3 1.27 (1,335.8-1,485.2) (1,554.1-1,609.5) (0.84-0.94) (2,286.3-2,336.2) (1,809.7-1,835.1) (1.25-1.28)
Digestive system disease 840 820.8 18,317 1,119.3 0.73 29,428 1,556.3 173,892 1,299.4 1.20 (765.2-880.4) (1,096.9-1,142.2) (0.68-0.79) (1,536.4-1,576.4) (1,289.2-1,309.8) (1.18-1.22)
Symptoms and signs 840 816.1 16,938 1,006.4 0.81 24,723 1,284.5 157,645 1,133.9 1.13 (760.8-875.4) (985.4-1,027.9) (0.75-0.87) (1,267.2-1,302.1) (1,125.0-1,142.9) (1.12-1.15)
Genitourinary system disease 775 745.0 11,629 711.7 1.05 17,940 922.8 97,348 738.1 1.25 (692.8-801.1) (695.2-728.6) (0.97-1.13) (908.4-937.3) (731.2-745.0) (1.23-1.27)
Mental and behavioural disorders 705 663.1 8,429 512.9 1.29 12,376 658.1 49,373 364.0 1.81 (614.5-715.4) (499.1-527.1) (1.19-1.40) (645.9-670.5) (359.1-368.9) (1.77-1.85)
Circulatory system disease 684 667.5 20,685 547.1 1.22 22,326 1,119.9 183,516 643.2 1.74 (617.3-721.9) (536.6-557.7) (1.13-1.32) (1,104.1-1,135.8) (638.5-647.9) (1.71-1.77)
Cancers 593 580.1 15,716 604.8 0.96 14,209 720.4 148,405 671.7 1.07 (533.6-630.6) (591.0-618.9) (0.88-1.05) (708.0-733.1) (666.3-677.0) (1.05-1.09)
Perinatal conditions 511 513.0 6,443 1,085.5 0.47 10,432 582.9 44,278 923.1 0.63 (467.5-562.9) (1,057.2-1,114.5) (0.43-0.52) (565.8-600.6) (911.7-934.8) (0.61-0.65)
Musculoskeletal diseases 498 479.6 13,694 703.9 0.68 11,874 617.7 88,137 532.4 1.16 (438.0-525.2) (688.5-719.6) (0.62-0.75) (606.1-629.5) (526.9-538.0) (1.14-1.19)
Infectious & parasitic diseases 462 456.9 5,563 594.9 0.77 11,430 620.8 48,370 636.9 0.97 (415.6-502.4) (575.4-615.1) (0.69-0.85) (607.3-634.5) (628.4-645.6) (0.95-1.00)
Ear diseases 459 460.7 2,723 360.1 1.28 9,463 522.3 23,367 367.6 1.42 (418.7-506.8) (343.2-377.8) (1.15-1.42) (510.1-534.7) (360.2-375.1) (1.38-1.47)
Nervous system diseases 343 330.2 6,884 390.1 0.85 7,158 374.7 44,408 314.4 1.19 (295.9-368.4) (377.5-403.2) (0.75-0.95) (365.7-383.9) (309.8-319.1) (1.16-1.23)
Skin diseases 331 321.6 3,740 252.8 1.27 12,445 664.8 47,132 395.2 1.68 (287.7-359.5) (241.3-264.9) (1.13-1.44) (652.2-677.5) (389.0-401.6) (1.64-1.72)
Congenital anomalies 233 233.1 2,364 350.0 0.67 4,690 259.7 18,660 340.7 0.76 (203.9-266.5) (334.1-366.5) (0.58-0.77) (250.9-268.7) (334.3-347.4) (0.73-0.79)
Endocrine, nutritional & metabolic 219 212.5 3,825 199.8 1.06 7,007 356.3 31,030 188.5 1.89 (185.3-243.8) (191.0-209.1) (0.92-1.23) (347.7-365.2) (185.1-191.9) (1.83-1.95)
Diseases of the blood 148 145.8 3,041 140.2 1.04 3,269 168.9 25,251 148.0 1.14 (123.4-172.4) (132.3-148.5) (0.87-1.24) (163.0-175.1) (145.0-151.1) (1.10-1.19)
Diseases of the eye 98 97.9 3,004 120.5 0.81 3,867 196.5 34,896 164.3 1.20 (79.7-120.3) (113.6-127.8) (0.66-1.01) (190.1-203.2) (161.2-167.4) (1.15-1.24)
Note: Rates are calculated per 100,000 and are age-sex-standardised (except * which is sex-specific and therefore only age-standardised) to the 2001 Māori population. The ranking in this table is according to the number of hospitalisations for Māori in Canterbury.

76
Table 5.6 Major causes of public hospitalisation, as percentage of total activity, all ages, Canterbury and New Zealand, 2003-2005 (Source: Te Rōpū Rangahau Hauora a Eru Pōmare)
Canterbury New Zealand ICD Chapter Māori non-Māori Māori non-Māori
Factors influencing health status 16.2% 15.8% 21.4% 14.2% Pregnancy, childbirth and puerperium* 16.0% (26.8%) 10.2% (17.5%) 13.7% (24.4%) 10.3% (18.5%) Respiratory disease 10.9% 6.7% 9.5% 6.7% Injury and poisoning 9.1% 9.4% 9.7% 10.0% Digestive system disease 5.2% 7.4% 6.6% 8.4% Symptoms and signs 5.2% 6.9% 5.6% 7.6% Genitourinary system disease 4.8% 4.7% 4.0% 4.7% Mental and behavioural disorders 4.4% 3.4% 2.8% 2.4% Circulatory system disease 4.2% 8.4% 5.0% 8.9% Cancers 3.7% 6.4% 3.2% 7.2% Perinatal conditions 3.2% 2.6% 2.4% 2.1% Musculoskeletal diseases 3.1% 5.5% 2.7% 4.3% Infectious and parasitic diseases 2.9% 2.3% 2.6% 2.3% Ear diseases 2.8% 1.1% 2.1% 1.1% Nervous system diseases 2.1% 2.8% 1.6% 2.1% Skin diseases 2.0% 1.5% 2.8% 2.3% Congenital anomalies 1.4% 1.0% 1.1% 0.9% Endocrine, nutritional and metabolic 1.4% 1.5% 1.6% 1.5% Diseases of the blood 0.9% 1.2% 0.7% 1.2% Diseases of the eye 0.6% 1.2% 0.9% 1.7%
Note: All figures are percentages of total activity except for * where the figure in brackets is for female-specific activity

77
5.3 Self-reported health
Table 5.7 presents the prevalence of self-reports of general health status as excellent or
very good, from the NZHS 2006/07. The prevalence of excellent or very good health
was significantly lower for Māori in Canterbury than for European/Others (non-
overlapping 95% CIs for the rates). The prevalence appeared to be higher for Māori in
Canterbury than nationally, but this difference was not statistically significant
(overlapping 95% CIs for the rates).
Table 5.7 Prevalence of self-reported excellent or very good health, 15+ years, Canterbury and New Zealand, 2006/07 (Source: HDIU/New Zealand Health Survey 2006/07)
Canterbury New Zealand
Indicator
Māori Rate
(95% CI)
European/Other Rate
(95% CI)
Māori Rate
(95% CI)
European/Other Rate
(95% CI)
53.7 65.0 52.0 63.0 Total
(48.7–58.5) (60.5–69.3) (49.0–55.0) (60.9–65.1)
54.2 62.8 52.5 60.9 Male
(48.1–60.1) (58.0–67.3) (48.0–57.1) (58.3–63.4)
53.2 67.1 51.6 65.1
Self-reported excellent or very good health
Female (48.0–58.3) (62.4–71.5) (48.3–55.0) (62.7–67.3)
Note: Rates are age-standardised (using the WHO population) prevalence rates for adults aged over 15 years. European/Other are non-Māori, non-Pacific, non-Asian.
Key point
• Māori in Canterbury reported worse health status than European/Others in
2006/07.

78
5.4 Cardiovascular disease
Cardiovascular disease is a leading cause of death in New Zealand and Māori have worse
outcomes for cardiovascular disease than non-Māori in New Zealand (Ajwani, Blakely et
al. 2003; Bramley, Riddell et al. 2004). This section examines cardiovascular disease, and
includes discussion about ischaemic heart disease, stroke, heart failure, hypertensive
disease and rheumatic heart disease.
Key points
From 2000 to 2005:
• Cardiovascular disease mortality and hospitalisation rates for Māori were higher
than for non-Māori in Canterbury, but lower than for Māori nationally.
• The ischaemic heart disease mortality rate was higher for Māori in Canterbury
than non-Māori, but there was no difference in the rate of hospitalisation.
This may suggest an important area of unmet need in the treatment of ischaemic
heart disease for Māori.
• Rates of angiography were the same for Māori and non-Māori in Canterbury, but
Māori had a lower rate of angioplasty and a higher rate of coronary artery bypass
grafting.
This may suggest Māori in Canterbury were treated with more severe coronary artery
disease than non-Māori.
• Rates of stroke mortality and hospitalisation were similar for Māori and non-
Māori in Canterbury, but the rates for Māori in Canterbury were about half those
for Māori nationally.
• The rate of hospitalisation for heart failure for Māori in Canterbury was higher
than for non-Māori in Canterbury, but lower than for Māori nationally.
• The rate of hospitalisation for hypertensive disease for Māori in Canterbury was
three times higher than for non-Māori in Canterbury, and similar to that for
Māori nationally.
• Hospitalisation and mortality rates for chronic rheumatic heart disease were
higher for Māori in Canterbury than for non-Māori, but there was no difference
in the rate of valve replacement.

79
Data presented in this chapter are also presented in Tables 8.2 to 8.7 in Appendix 3
Health status tables.
Cardiovascular disease deaths and hospitalisation
Figures 5.1 and 5.2 present data about cardiovascular disease mortality from 2000 to
2004 and hospitalisation from 2003 to 2005, respectively, for Canterbury and New
Zealand. Cardiovascular disease was a significantly greater cause of death for Māori than
non-Māori in Canterbury and nationally during this period, for both males and females.
The rates of cardiovascular mortality for Māori in Canterbury were lower than for Māori
nationally. Similarly, the disparity in mortality rates in Canterbury (RR 1.50, 95% CI 1.27-
1.77) was not as marked as it was nationally (RR 2.29, 95% CI 2.21–2.36).
The rates of hospitalisation for cardiovascular disease were higher for Māori in
Canterbury than for non-Māori (RR 1.22, 95% CI 1.13-1.32), but the difference in
hospitalisation rates was smaller than that for mortality (RR 2.29, 95% CI 2.21–2.36).
The rates of hospitalisation for Māori compared to non-Māori were more different
nationally (RR 1.74, 95% CI 1.71–1.77) than in Canterbury (RR 1.22, 95% CI 1.13-1.32),
but again the difference for hospitalisation was smaller than the difference in rates for
mortality between Māori and non-Māori.
Figure 5.1 Cardiovascular disease deaths, all ages, Canterbury and New Zealand, 2000-2004 (Source: Te Rōpū Rangahau Hauora a Eru Pōmare)
0
20
40
60
80
100
120
140
160
180
200
Male Female Total Male Female Total
Canterbury New Zealand
Rat
e /
100,
000
Māori
non-Māori
Note: Rates are calculated per 100,000. Sex-specific rates are age-standardised, total rates are age-sex-standardised to the 2001 Māori population

80
Figure 5.2 Cardiovascular disease hospitalisations, all ages, Canterbury and New Zealand, 2003-2005 (Source: Te Rōpū Rangahau Hauora a Eru Pōmare)
0
200
400
600
800
1,000
1,200
1,400
Male Female Total Male Female Total
Canterbury New Zealand
Rat
e /
100,
000
Māori
non-Māori
Note: Rates are calculated per 100,000. Sex-specific rates are age-standardised, total rates are age-sex-standardised to the 2001 Māori population
Ischaemic heart disease
Table 5.8 presents the prevalence of self-reported ischaemic heart disease for Canterbury
and New Zealand from the NZHS 2006/07. The prevalence of self-reported ischaemic
heart disease appeared to be lower for Māori in Canterbury than for European/Others
and higher than for Māori nationally, but none of these differences were statistically
significant.
Table 5.8 Prevalence of self-reported ischaemic heart disease, 15+ years, Canterbury and New Zealand, 2006/07 (Source: HDIU/New Zealand Health Survey 2006/07)
Canterbury New Zealand
Indicator
Māori Rate
(95% CI)
European/Other Rate
(95% CI)
Māori Rate
(95% CI)
European/Other Rate
(95% CI)
3.9 4.6 3.6 4.2 Total
(2.7–5.5) (3.5–5.9) (2.7–4.7) (3.6–4.9)
3.5 5.6 3.2 5.1 Male
(2.1–5.4) (4.3–7.0) (2.2–4.7) (4.3–6.1)
4.2 3.7 3.9 3.4
Self-reported ischaemic heart disease
Female (2.8–6.2) (2.5–5.2) (2.7–5.4) (2.6–4.3)
Note: Rates are age-standardised (using the WHO population) prevalence rates for adults aged over 15 years. European/Other are non-Māori, non-Pacific, non-Asian.

81
Figures 5.3, 5.4, and 5.5 present data about ischaemic heart disease mortality (2000-2004),
hospitalisation (2003-2005), and procedures (2003-2005), respectively, for Canterbury
and New Zealand.
The rates of mortality from ischaemic heart disease were significantly higher for Māori in
Canterbury than for non-Māori (RR 1.65, 95% CI 1.34-2.03), for both males (RR 1.73,
95% CI 1.35-2.21) and females (RR 1.51, 95% CI 1.03-2.21), as can be seen in Figure 5.3.
The mortality rate for Māori in Canterbury was significantly lower than that for Māori
nationally (RR 0.76, non-overlapping 95% CIs for the rates). The disparity in rates
between Māori and non-Māori in Canterbury (RR 1.65, 95% CI 1.34-2.03) was smaller
than that for New Zealand (RR 2.25, 95% CI 2.16–2.35).
Figure 5.3 Ischaemic heart disease deaths, all ages, Canterbury and New Zealand, 2000-2004 (Source: Te Rōpū Rangahau Hauora a Eru Pōmare)
0
20
40
60
80
100
120
Male Female Total Male Female Total
Canterbury New Zealand
Rat
e /
100,
000
Māori
non-Māori
Note: Rates are calculated per 100,000. Sex-specific rates are age-standardised, total rates are age-sex-standardised to the 2001 Māori population
There was no significant difference in the rates for hospitalisation for Māori and non-
Māori in Canterbury (RR 1.12, 95% CI 0.98-1.29), as can be seen in Figure 5.4. Broken
down by sex, there was a significant difference for Māori females compared to non-
Māori (RR 1.28, 95% CI 1.01-1.62), but not for males (RR 1.05, 95% CI 0.88-1.24). The
lack of statistically significant difference in the rate of hospitalisation for Māori in
Canterbury compared to non-Māori was in contrast to the significantly higher mortality
rate: Māori in Canterbury were no more likely to be admitted to hospital for ischaemic
heart disease than non-Māori, but their rate of ischaemic heart disease mortality was 65%
higher.

82
The rate of hospitalisation for ischaemic heart disease for Māori in Canterbury was
significantly lower than for Māori in New Zealand (RR 0.66, non-overlapping 95% CIs
for the rates), and there was a significant difference in the rates between Māori and non-
Māori nationally (RR 1.43, 95% CI 1.40–1.47). Nationally, as in Canterbury, the
hospitalisation rate for Māori was disproportionately low compared to the mortality rate
when compared to the corresponding rates for non-Māori.
Figure 5.4 Ischaemic heart disease hospitalisations, all ages, Canterbury and New Zealand, 2003-2005 (Source: Te Rōpū Rangahau Hauora a Eru Pōmare)
0
50
100
150
200
250
300
350
400
450
Male Female Total Male Female Total
Canterbury New Zealand
Rat
e /
100,
000
Māori
non-Māori
Note: Rates are calculated per 100,000. Sex-specific rates are age-standardised, total rates are age-sex-standardised to the 2001 Māori population
The rates of angiography (a diagnostic radiological procedure to assess narrowing of the
coronary arteries), angioplasty (a therapeutic procedure that uses a balloon or stents to
widen narrowed coronary arteries) and coronary artery by-pass grafting (CABG, a
surgical procedure in which blood vessels, often from the patient’s legs, are grafted to the
coronary arteries to by-pass narrowing) are shown in Figure 5.5. There was no significant
difference between the rates of coronary angiography for Māori and non-Māori in
Canterbury (RR 1.15, 95% CI 1.00-1.33). The rate of angioplasty was, however,
significantly lower for Māori in Canterbury than for non-Māori (RR 0.62, 95% CI 0.45-
0.85), while the rate of CABG (RR 1.74, 95% CI 1.34-2.25) was significantly higher. As
CABG is likely to be done for more severe coronary artery disease (Serruys, Morice et al.
2009), it may be that the higher rate of CABG than angioplasty for Māori in Canterbury
was due to more severe disease among Māori (Tukuitonga and Bindman 2002).

83
The rate of angiography for Māori in Canterbury was significantly lower than for Māori
in New Zealand (RR 0.77, non-overlapping 95% CIs for the rates), and nationally there
was a significant difference between the rates for Māori and non-Māori (RR 1.36, 95%
CI 1.32–1.41). Similarly to the case for hospitalisation for ischaemic heart disease, the
rate of angiography for Māori was disproportionately low compared to the rate of
ischaemic heart disease mortality when compared to the corresponding rates for non-
Māori.
Figure 5.5 Ischaemic heart disease hospital procedures, all ages, Canterbury and New Zealand, 2003-2005 (Source: Te Rōpū Rangahau Hauora a Eru Pōmare)
0
50
100
150
200
250
300
Angiography Angioplasty CABG Angiography Angioplasty CABG
Canterbury New Zealand
Rat
e /
100,
000
Māori
non-Māori
Note: Rates are calculated per 100,000 and are age-sex-standardised to the 2001 Māori population
Stroke
Table 5.9 presents prevalence of self-reported stroke for Canterbury and New Zealand
from the NZHS 2006/07. The prevalence of self-reported stroke appeared to be lower
for Māori in Canterbury than for European/Others and higher than for Māori nationally,
but none of these differences were statistically significant.

84
Table 5.9 Prevalence of self-reported stroke, 15+ years, Canterbury and New Zealand, 2006/07 (Source: HDIU/New Zealand Health Survey 2006/07)
Canterbury New Zealand
Māori European/Other Māori European/Other Indicator
Rate
(95% CI) Rate
(95% CI) Rate
(95% CI) Rate
(95% CI) 1.7 1.9 1.4 1.5
Total (0.9–3.0) (1.1–2.8) (0.8–2.2) (1.1–1.8)
1.8 1.9 1.4 1.4 Male
(0.8–3.5) (1.1–2.9) (0.6–2.8) (1.0–2.0)
1.7 1.9 1.3 1.5
Self-reported stroke
Female (0.9–3.0) (1.1–2.9) (0.7–2.2) (1.1–2.0)
Note: Rates are age-standardised (using the WHO population) prevalence rates for adults aged over 15 years. European/Other are non-Māori, non-Pacific, non-Asian.
Figure 5.6 presents stroke hospitalisation (2003-2005) and mortality (2000-2004) data for
Canterbury and New Zealand. The rates of stroke hospitalisation and mortality were
slightly lower for Māori in Canterbury than for non-Māori, but not significantly different
(hospitalisation: RR 0.96, 95% CI 0.73-1.26; mortality: RR 0.77, 95% CI 0.48-1.24). The
rates of hospitalisation and mortality for Māori in Canterbury were about half those for
Māori in New Zealand, and these differences were statistically significant (RRs 0.49 and
0.52, respectively, non-overlapping 95% CIs for the rates for both). The rates for Māori
nationally were significantly higher than for non-Māori (hospitalisation: RR 1.84, 95% CI
1.75–1.92; mortality: RR 1.61, 95% CI 1.49–1.74).
Figure 5.6 Stroke hospitalisations (2003-2005) and mortality (2000-2004), all ages, Canterbury and New Zealand (Source: Te Rōpū Rangahau Hauora a Eru Pōmare)
0
20
40
60
80
100
120
140
Hospitalisation Deaths Hospitalisation Deaths
Canterbury New Zealand
Rat
e /
100
,000
Māori
non-Māori
Note: Rates are calculated per 100,000 and are age-sex-standardised to the 2001 Māori population

85
Heart failure
Figure 5.7 presents heart failure hospitalisations for Canterbury and New Zealand from
2003 to 2005 (the numbers of heart failure deaths from 2000 to 2004 were too small to
present in the figure, but the rates can be found in Table 8.5 in Appendix 3 Health status
tables). The rates of hospitalisation were higher for Māori in Canterbury and in New
Zealand than for non-Māori (Canterbury: RR 2.73, 95% CI 2.19-3.41; NZ: RR 4.64, 95%
CI 4.43–4.86). The rate for Māori in Canterbury was about half that for Māori nationally
and this difference was statistically significant (RR 0.49, non-overlapping 95% CIs for the
rates).
Figure 5.7 Heart failure hospitalisations, all ages, Canterbury and New Zealand, 2003-2005 (Source: Te Rōpū Rangahau Hauora a Eru Pōmare)
0
20
40
60
80
100
120
140
160
180
200
Canterbury New Zealand
Rat
e /
100,
000
Māori
non-Māori
Note: Rates are calculated per 100,000 and are age-sex-standardised to the 2001 Māori population

86
Hypertensive disease
Figure 5.8 presents data about hospitalisation (2003-2005) and mortality (2000-2004) for
hypertensive disease for Canterbury and New Zealand. The numbers of hospitalisations
and deaths due to hypertensive disease were small, and 95% confidence intervals
relatively wide, so caution should be taken with comparison of rates.
The rate of hospitalisation for hypertensive disease for Māori in Canterbury was more
than three times higher than for non-Māori (RR 3.31, 95% CI 2.06-5.33). The mortality
rate was also higher, but not significantly so (RR 2.44, 95% CI 0.76-7.89). The rate of
hospitalisation for Māori in Canterbury was about the same as that for Māori nationally
(RR 0.97, overlapping 95% CIs for the rates), and although the mortality rate was lower
for Māori in Canterbury than nationally this was not a significant difference (RR 0.41,
overlapping 95% CIs for the rates).
The difference in the rates of hospitalisation in Canterbury (RR 3.31, 95% CI 2.06-5.33)
was greater than that nationally (RR 2.48, 95% CI 2.20–2.80). The difference in the rates
of mortality between Māori and non-Māori was significant nationally (RR 4.87, 95% CI
4.08–5.81) but non-significant in Canterbury (RR 2.44, 95% CI 0.76-7.89). However, for
both mortality and hospitalisation, as the 95% CIs for the rate ratios for Canterbury and
New Zealand overlapped these were not significant differences.
Figure 5.8 Hypertensive disease hospitalisations (2003-2005) and deaths (2000-2004), all ages, Canterbury and New Zealand (Source: Te Rōpū Rangahau Hauora a Eru Pōmare)
0
5
10
15
20
25
30
35
40
Hospitalisation Deaths Hospitalisation Deaths
Canterbury New Zealand
Rat
e /
100,
000
Māori
non-Māori
Note: Rates are calculated per 100,000 and are age-sex-standardised to the 2001 Māori population

87
Chronic rheumatic heart disease
Figure 5.9 presents data relating to hospitalisation (2003-2005), mortality (2000-2004)
and procedures (2003-2005) for chronic rheumatic heart disease11 for Canterbury and
New Zealand. The numbers of hospitalisations and deaths due to chronic rheumatic
heart disease were small and 95% confidence intervals relatively wide, so caution should
be taken with comparison of rates.
The rate of hospitalisation for chronic rheumatic heart disease for Māori in Canterbury
was more than five times higher than for non-Māori (RR 5.83, 95% CI 3.01-11.31). The
rate for deaths was five times higher (RR 5.01, 95% CI 1.94-12.96), whereas the rate of
valve replacement was higher but not significantly so (RR 1.49, 95% CI 0.92-2.76).
The rate of hospitalisation for Māori in Canterbury was lower but not significantly
different from that for Māori nationally (RR 0.59, overlapping 95% CIs for the rates),
and, similarly, for mortality (RR0.53, overlapping 95% CIs for the rates). The difference
in the rates of hospitalisation between Māori and non-Māori in Canterbury (RR 5.83,
95% CI 3.01-11.31) was greater than that nationally (RR 4.62, 95% CI 3.95–5.39). For
mortality, the rate ratio was higher nationally (RR 7.46, 95% CI 6.19–9.00) than in
Canterbury (RR 5.01, 95% CI 1.94-12.96). Nationally, Māori had a significantly higher
rate of valve replacement than non-Māori (RR 2.10, 95% CI 1.85–2.38), which was
greater than the non-significant difference between Māori and non-Māori in Canterbury
(RR 1.49, 95% CI 0.92-2.76).
Similarly to the picture for ischaemic heart disease, there was a disproportionately low
rate of procedures to treat chronic rheumatic heart disease for Māori. The rate of valve
replacement for Māori was low relative to the rates of hospitalisation and death from
chronic rheumatic fever, when compared to the corresponding rates for non-Māori.
11 There were very few hospital admissions for acute rheumatic heart disease in Canterbury from 2003 to
2005 and no deaths from 2000 to 2004.

88
Figure 5.9 Chronic rheumatic heart disease hospitalisations (2003-2005), mortality (2000-2004), and valve replacement (2003-2005), all ages, Canterbury and New Zealand (Source: Te Rōpū Rangahau Hauora a Eru Pōmare)
0
5
10
15
20
25
30
Hospitalisation Deaths Valve replacement Hospitalisation Deaths Valve replacement
Canterbury New Zealand
Rat
e /
100,
000
Māori
non-Māori
Note: Rates are calculated per 100,000 and are age-sex-standardised to the 2001 Māori population

89
5.5 Cancer
Cancer is a significant cause of death in New Zealand and Māori have a higher incidence
and worse outcomes for cancer than non-Māori (Ajwani, Blakely et al. 2003; Robson,
Purdie et al. 2006). This section examines cancer as a whole, and includes discussion
about lung, colorectal and breast cancer and screening for breast and cervical cancer.
Data presented in this chapter are also summarised in Tables 8.8 to 8.10 in Appendix 3
Health status tables.
Key points
From 2000 to 2005:
• The incidence of cancer for Māori in Canterbury was lower than for non-Māori,
but the mortality rate was higher for Māori.
• Cancer incidence and mortality rates for Māori in Canterbury were lower than for
Māori nationally.
• The incidence and mortality rates for lung cancer were higher for Māori in
Canterbury than for non-Māori. The difference between Māori and non-Māori
was larger for females than males.
• The incidence of colorectal cancer was lower for Māori than non-Māori in
Canterbury, but there was no difference in the mortality rate.
• The incidence of breast cancer was the same for Māori and non-Māori in
Canterbury but the mortality rate was higher for Māori.
• These results suggest poorer cancer outcomes for Māori than non-Māori in
Canterbury.
From 2006 to 2009:
• Rates of screening coverage for breast and cervical cancer were lower for Māori
than non-Māori.
In light of the poorer cancer outcomes for Māori, priority areas include improving
Māori breast and cervical screening coverage, implementing colorectal screening well
for Māori, and concentrating on detection and prevention of lung and other cancers
for Māori.

90
Cancer deaths and registrations
Figures 5.10 and 5.11 present data for the period from 2000 to 2004 for all-site mortality
and registrations, respectively, for Canterbury and New Zealand.
The rate of cancer mortality was higher for Māori in Canterbury than for non-Māori (RR
1.35, 95% CI 1.14-1.60). For females, the difference in rates between Māori and non-
Māori in Canterbury (RR 1.72, 95% CI 1.35-2.19) was more than that for males, for
whom the difference in rates was non-significant (RR 1.08, 95% CI 0.85-1.38).
The mortality rate was lower for Māori in Canterbury than for Māori nationally (RR 0.79,
non-overlapping 95% CIs for the rates). The difference in the mortality rates between
Māori and non-Māori in Canterbury (RR 1.35, 95% CI 1.14-1.60) was smaller than that in
New Zealand (RR 1.77, 95% CI 1.71-1.83). Nationally there were significant differences
between Māori and non-Māori rates for both males (RR 1.66, 95% CI 1.59-1.74) and
females (RR 1.92, 95% CI 1.82-2.01).
Figure 5.10 Cancer mortality, all sites, all ages, Canterbury and New Zealand, 2000-2004 (Source: Te Rōpū Rangahau Hauora a Eru Pōmare)
0
20
40
60
80
100
120
140
Male Female Total Male Female Total
Canterbury New Zealand
Rat
e /
100,
000
Māori
non-Māori
Note: Rates are calculated per 100,000. Sex-specific rates are age-standardised, total rates are age-sex-standardised to the 2001 Māori population
The rate of cancer registration was significantly lower for Māori in Canterbury than for
non-Māori (RR 0.79, 95% CI 0.69-0.91). The rate of cancer registrations for males was
significantly lower for Māori than non-Māori in Canterbury (RR 0.58, 95% CI 0.47-0.71),

91
and lower than that for females, for whom the difference between Māori and non-Māori
rates was not significant (RR 1.03, 95% CI 0.86-1.23).
The rate of cancer registration was lower for Māori in Canterbury than for Māori
nationally (RR 0.73, non-overlapping 95% CIs for the rates). The lower rate of
registration for Māori than non-Māori in Canterbury (RR 0.79, 95% CI 0.69-0.91) was in
contrast to the picture for New Zealand, where Māori had a slightly higher registration
rate than non-Māori (RR 1.09, 95% CI 1.06-1.12). Nationally, the difference between
Māori and non-Māori rates was significant for females (RR 1.17, 95% CI 1.13-1.22), but
not significant for males (RR 1.02, 95% CI 0.98-1.06).
Comparing registration to mortality for cancer there was a sharp contrast between the
lower incidence (indicated by the registration rate) for Māori than non-Māori in
Canterbury and the higher mortality rate. For females, the incidence for Māori in
Canterbury was not significantly different from non-Māori, but the Māori mortality rate
was significantly higher. For males there was a significantly lower incidence for Māori in
Canterbury relative to non-Māori, but mortality was not significantly different. The
implication for Māori females in Canterbury was that their cancers were just as likely to
be detected, but they were around 72% more likely to die from those cancers than non-
Māori. Similarly, cancers in Māori males were much less likely to be detected (42% less),
but they were as likely to die from those cancers as non-Māori.
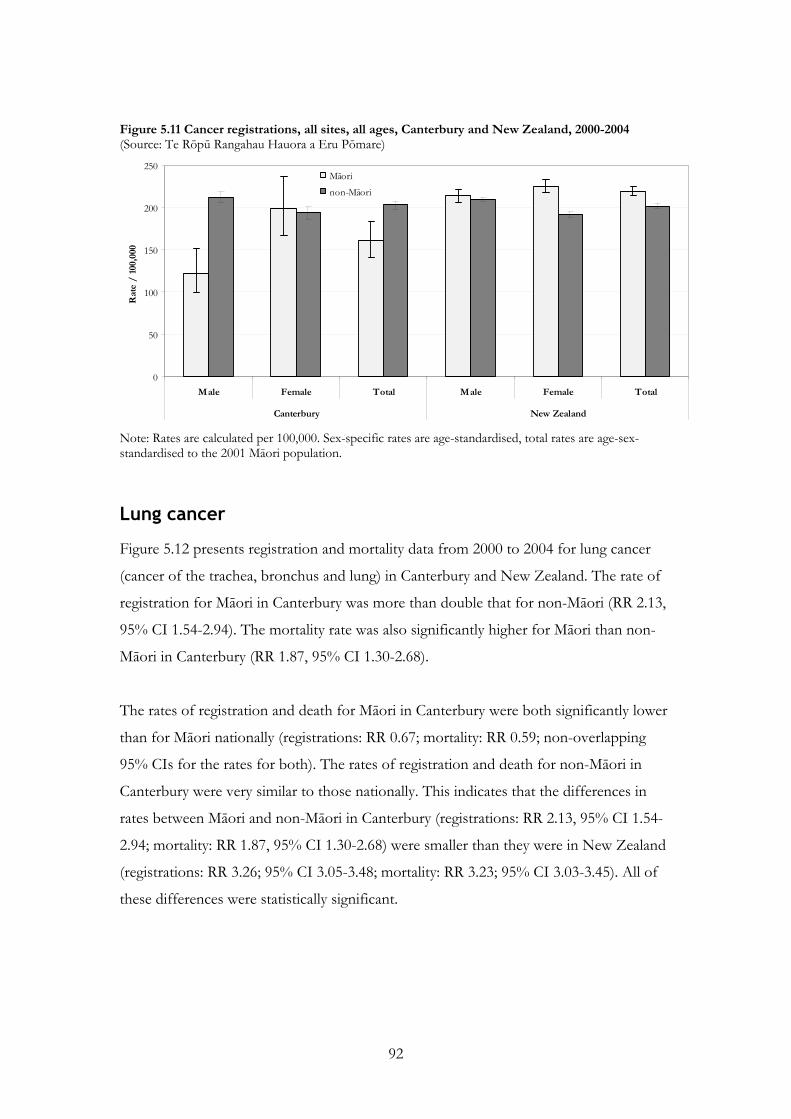
92
Figure 5.11 Cancer registrations, all sites, all ages, Canterbury and New Zealand, 2000-2004 (Source: Te Rōpū Rangahau Hauora a Eru Pōmare)
0
50
100
150
200
250
Male Female Total Male Female Total
Canterbury New Zealand
Rat
e /
100,
000
Māori
non-Māori
Note: Rates are calculated per 100,000. Sex-specific rates are age-standardised, total rates are age-sex-standardised to the 2001 Māori population.
Lung cancer
Figure 5.12 presents registration and mortality data from 2000 to 2004 for lung cancer
(cancer of the trachea, bronchus and lung) in Canterbury and New Zealand. The rate of
registration for Māori in Canterbury was more than double that for non-Māori (RR 2.13,
95% CI 1.54-2.94). The mortality rate was also significantly higher for Māori than non-
Māori in Canterbury (RR 1.87, 95% CI 1.30-2.68).
The rates of registration and death for Māori in Canterbury were both significantly lower
than for Māori nationally (registrations: RR 0.67; mortality: RR 0.59; non-overlapping
95% CIs for the rates for both). The rates of registration and death for non-Māori in
Canterbury were very similar to those nationally. This indicates that the differences in
rates between Māori and non-Māori in Canterbury (registrations: RR 2.13, 95% CI 1.54-
2.94; mortality: RR 1.87, 95% CI 1.30-2.68) were smaller than they were in New Zealand
(registrations: RR 3.26; 95% CI 3.05-3.48; mortality: RR 3.23; 95% CI 3.03-3.45). All of
these differences were statistically significant.

93
Figure 5.12 Lung cancer mortality and registrations, all ages, Canterbury and New Zealand, 2000-2004 (Source: Te Rōpū Rangahau Hauora a Eru Pōmare)
0
5
10
15
20
25
30
35
40
45
50
Registrations Deaths Registrations Deaths
Canterbury New Zealand
Rat
e /
100,
000
Māori
non-Māori
Note: Rates are calculated per 1000,000 and are age-sex-standardised to the 2001 Māori population
Figure 5.13 presents lung cancer registrations and deaths by gender, and shows that the
disparity in rates between Māori and non-Māori in Canterbury and New Zealand was
larger for females than for males. The rate ratios for Māori and non-Māori for lung
cancer registration and deaths in Canterbury for females were 3.14 (95% CI 1.98-4.99)
and 2.81 (95% CI 1.66-4.75), respectively, and for males 1.50 (95% CI 0.95-2.36) and
1.36 (95% CI 0.83-2.22), respectively. As can be seen from the 95% CI, for males these
were non-significant differences. The disparities were greater nationally, where the
Māori/non-Māori rate ratios were, respectively, for females 4.04 (95% CI 3.67-4.45) for
registrations and 4.24 (95% CI 3.86-4.66) for deaths, and for males 2.75 (95% CI 2.51-
3.01) for registrations and 2.64 (95% CI 2.41-2.89) for deaths.

94
Figure 5.13 Lung cancer registrations and deaths, by gender, all ages, Canterbury and New Zealand, 2000-2004 (Source: Te Rōpū Rangahau Hauora a Eru Pōmare)
0
10
20
30
40
50
60
Male Female Male Female Male Female Male Female
Registrations Deaths Registrations Deaths
Canterbury New Zealand
Rat
e /
100
,000
Māori
non-Māori
Note: Rates are calculated per 1000,000 and are age-sex-standardised to the 2001 Māori population
As shown in Chapter 4 Risk and protective factors, the prevalence of smoking is
considerably higher among Māori than non-Māori, particularly among Māori females.
This will have contributed to the higher incidence rates for lung cancer for Māori, and
especially Maori females. Other risk factors for lung cancer include exposure to
environmental tobacco smoke, marijuana smoking, occupational exposure to
carcinogens, and dietary and socioeconomic factors (Harwood, Aldington et al. 2005).
However, disparities in diagnosis and treatment are also likely to have contributed to the
higher mortality rates. A study in Auckland and Northland found Māori are more likely
to be diagnosed with advanced than localised lung cancer, less likely to receive curative
(rather than palliative) treatment, and subsequent to diagnosis experience more delays
before receiving treatment (Stevens, Stevens et al. 2008). Nationally, it has been found
that Māori have lung cancer diagnosed at a more advanced stage on average and, after
taking stage into account, there is a disparity in survival after diagnosis between Māori
and non-Māori (Robson, Purdie et al. 2006).

95
Colorectal cancer
Figure 5.14 presents registration and mortality data for colorectal cancer from 2000 to
2004 for Canterbury and New Zealand. The rate of registration for Māori in Canterbury
was about half that for non-Māori (RR 0.51, 95% CI 0.32-0.82). However, the mortality
rates were not significantly different for Māori and non-Māori in Canterbury (RR 1.22,
95% CI 0.75-1.96). This indicates that there is an excess in mortality for Māori in
Canterbury relative to incidence, compared to non-Māori. That is, Māori are less likely to
be diagnosed with colorectal cancers but no less likely to die from them than non-Māori.
The rates of registration and death for Māori in Canterbury were not significantly
different from those for Māori nationally (registrations RR 0.88, mortality RR 1.51,
overlapping 95% CIs for the rates for both).
Figure 5.14 Colorectal cancer mortality and registrations, all ages, Canterbury and New Zealand, 2000-2004 (Source: Te Rōpū Rangahau Hauora a Eru Pōmare)
0
5
10
15
20
25
30
Registrations Deaths Registrations Deaths
Canterbury New Zealand
Rat
e /
100,
000
Māori
non-Māori
Note: Rates are calculated per 1000,000 and are age-sex-standardised to the 2001 Māori population
The lower incidence but similar mortality for Māori compared to non-Māori may be due
to several factors. It has been found nationally that survival disparities may be due to
later, more advanced stage at diagnosis but that disparities in survival are also present
between Māori and non-Māori with similar stage of disease spread at diagnosis (Robson,
Purdie et al. 2006). Hill, Sarfati et al. (2010) found the most important factors explaining
poorer colon cancer survival for Māori nationally were higher co-morbidity and smoking,

96
and poorer access and quality of healthcare for Māori than non-Maori. Health system
factors may also play a part, such as different surgical treatment, and less and more
delayed chemotherapy (Hill, Sarfati et al. 2009). There is potential for the planned
national colorectal cancer screening programme to reduce stage at diagnosis as a source
of disparity, if the programme is designed to optimise Māori participation (Shaw,
Cunningham et al. 2008). However, other reasons for differences in outcomes between
Māori and non-Māori also need to be identified and addressed (Robson, Purdie et al.
2006).
Breast cancer
Figure 5.15 presents registration and mortality data from 2000 to 2004 for breast cancer
for females in Canterbury and New Zealand. The rate of registration for Māori in
Canterbury was not significantly different from that for non-Māori (RR 0.93, 95% CI
0.67-1.29). However, the rate of death was higher for Māori than non-Māori in
Canterbury (RR 1.77, 95% CI 1.08-2.90). The rates of registration and death for Māori in
Canterbury did not differ significantly from those for Māori nationally (registrations: RR
0.84; mortality: RR 1.08; 95% CIs overlapping for the rates for both).
The disparity between the similar rate of registration but higher mortality for Māori
compared to non-Māori has also been described nationally. It has been established that
Māori women are diagnosed with more advanced disease spread (Curtis, Wright et al.
2005), but also that survival disparities between Māori and non-Māori remain when stage
at diagnosis is taken into account (Robson, Purdie et al. 2006).

97
Figure 5.15 Breast cancer mortality and registrations, all ages, Canterbury and New Zealand, 2000-2004 (Source: Te Rōpū Rangahau Hauora a Eru Pōmare)
0
10
20
30
40
50
60
70
80
90
Registrations Deaths Registrations Deaths
Canterbury New Zealand
Rat
e /
100
,000
Māori
non-Māori
Note: Rates are calculated per 1000,000 and are age-standardised to the 2001 Māori population
Screening
Breast screening
Breast cancer is the most common cancer diagnosed in Māori (and non-Māori) women
in New Zealand, and this is also true for Canterbury, where there is an age-standardised
rate of breast cancer of 56.2/100,000 person-years (see Table 8.8). Screening for breast
cancer is intended to detect lesions early, at a time when they may be more easily treated.
As stated above, there is a disparity between the mortality rates for breast cancer for
Māori women in Canterbury and those for non-Māori women, despite registration rates
being similar, and some of this is related to stage at diagnosis. If screening can detect
tumours early this may help improve breast cancer outcomes for Māori women.
Māori women had lower breast screening coverage rates than non-Māori women
nationally, although BreastScreen South (the provider of breast screening services in
Canterbury but covering all the South Island) did meet its target of 70% breast screening
coverage within the last 24 month period for Māori women from 2004 to 2006.
BreastScreen South had increased coverage for Māori women from 2002 to 2004, in part
by using mobile units. Nationally, a monitoring report of BreastScreen Aotearoa for the

98
period from 2004 to 2006 found Māori women were more likely than non-Māori women,
among indicators of the quality of screening, to:
• have more than four films taken;
• have technical problems with films, necessitating recall to the screening unit;
• be referred for assessment;
• have a false positive screening.
Māori women were also more likely than non-Māori women to have cancer detected and
for these to be more invasive, indicating that when cancers were detected they were at a
more advanced stage (Simmonds and Robson 2008).
Figure 5.16 presents breast screening coverage data for Canterbury in 2006/07 and
2008/09. It shows that Māori women had lower coverage rates than Other women
(which refers to non-Māori, non-Pacific women) and that coverage for Māori women
improved slightly between the two time periods. Both of the rates for Māori in 2006/07
and 2008/09 fell slightly below the national target coverage rate of 70%, whereas the rate
for Other women in both periods exceeded that target.
Figure 5.16 Breast screening coverage, Canterbury, 2006/07 and 2008/09 (Source: BreastScreen Aotearoa)
69.0% 69.9%
82.0% 82.0%
0%
10%
20%
30%
40%
50%
60%
70%
80%
90%
100%
2006/07 2008/09 2006/07 2008/09
Māori Other
Per
cent
of e
ligib
le s
cree
ned
Note: Breast cancer screening coverage is defined as the proportion of women in eligible age range (45-69 years) who have had a screening mammogram in the preceding two years. The target for breast cancer screening coverage is >70%.

99
Cervical screening
At the national level, cervical cancer affects Māori disproportionately compared to non-
Māori, with almost twice the incidence and three times the mortality for Māori women
than for non-Māori in 2000 to 2004 (Cormack, Purdie et al. 2007). Numbers for Māori in
Canterbury are too small to reliably detect differences in mortality or registration rates
between Māori and non-Māori. For both mortality (RR 1.92, 95% CI 0.45-8.21) and
registration (RR 1.44, 95% CI 0.66-3.18) the rates for Māori appeared higher than for
non-Māori in Canterbury but were not significantly different, as shown in Table 8.10.
The rate of hospitalisation for cervical cancer for Māori was significantly higher than for
non-Māori (RR 2.69, 95% CI 1.35-5.39). Registration rates for cervical carcinoma in situ
(a precursor to cervical cancer) were lower for Māori, but this was not a significant
difference (RR 0.85, 95% CI 0.67-1.07), and may not reflect the true situation as
carcinoma in situ is not compulsorily notified.
Screening for cervical abnormalities, similarly to breast screening, is intended to detect
lesions early when they may be more amenable to treatment. However, Māori are under-
represented for enrolment in the National Cervical Screening Programme, both
nationally and in Canterbury. While 94.8% of all women in Canterbury were enrolled in
the programme in 2007, only 64.9% of Māori women were enrolled (63.1% in 2006 and
61.0% in 2005). This compares to national figures of 78.3% of Māori and 95.5% of all
women enrolled (Brewer, McKenzie et al. 2008).
Figure 5.17 presents screening coverage data for Canterbury from 2006 to 2009, and
shows that while coverage rates for Māori women in Canterbury improved over the time
period, they remained substantially lower than Other (non-Māori, non-Pacific) women.
At 43.5% in 2006/07 and 46.0% in 2007/08, the screening coverage rate for Māori
women in Canterbury fell well below the screening coverage target of 75%, and was
lower than the national rate for Māori women in 2007, which was 48.2% (Brewer,
McKenzie et al. 2008).

100
Figure 5.17 Cervical screening coverage, Canterbury, 2006-2009 (Source: National Cervical Screening Programme)
46.0% 47.0%
75.0% 77.0% 77.0%
43.5%
0%
10%
20%
30%
40%
50%
60%
70%
80%
90%
100%
06/07 07/08 08/09 (6m) 06/07 07/08 08/09 (6m)
Māori Other
Per
cent
of e
ligib
le s
cree
ned
Note: Cervical screening coverage is defined as the proportion of women aged 20-69 years who have had a smear in the preceding three years. The cervical screening coverage target is >75%.

101
5.6 Respiratory disease
Several respiratory diseases disproportionately affect Māori, including chronic obstructive
pulmonary disease (COPD), asthma, and bronchiectasis (Ellison-Loschmann, Cheng et
al. 2002; Twiss, Metcalfe et al. 2005; Blakely, Tobias et al. 2007). Disparities have been
identified between Māori and non-Māori in both hospitalisation and mortality data
(Crengle, Pink et al. 2007).
Data presented in this chapter are also summarised in Tables 8.11 to 8.16 in Appendix 3
Health status tables.
Respiratory disease deaths and hospitalisation
Figure 5.18 presents data on respiratory disease mortality from 2000 to 2004 for
Canterbury and New Zealand. The mortality rate was significantly higher for Māori in
Canterbury and nationally than for non-Māori (Canterbury: RR 1.59, 95% CI 1.11-2.28;
NZ RR 2.59, 95% CI 2.42-2.76). The rate for Māori in Canterbury was significantly lower
than that for Māori nationally (RR 0.62, non-overlapping 95% CIs for the rates), and the
disparity in rates between Māori and non-Māori was smaller in Canterbury than that seen
nationally.
Key points
From 2000 to 2005:
• Respiratory disease mortality and hospitalisation rates for Māori in Canterbury
were higher than for non-Māori in Canterbury, but lower than for Māori
nationally.
• Rates of hospitalisation for asthma, chronic obstructive pulmonary disease and
bronchiectasis were higher for Māori than non-Māori in Canterbury, whereas
there was no difference for pneumonia.
• The rates of hospitalisation for asthma and bronchiectasis were similar for Māori
in Canterbury to those for Māori nationally, whereas the rates for chronic
obstructive pulmonary disease and pneumonia were lower for Māori in
Canterbury.
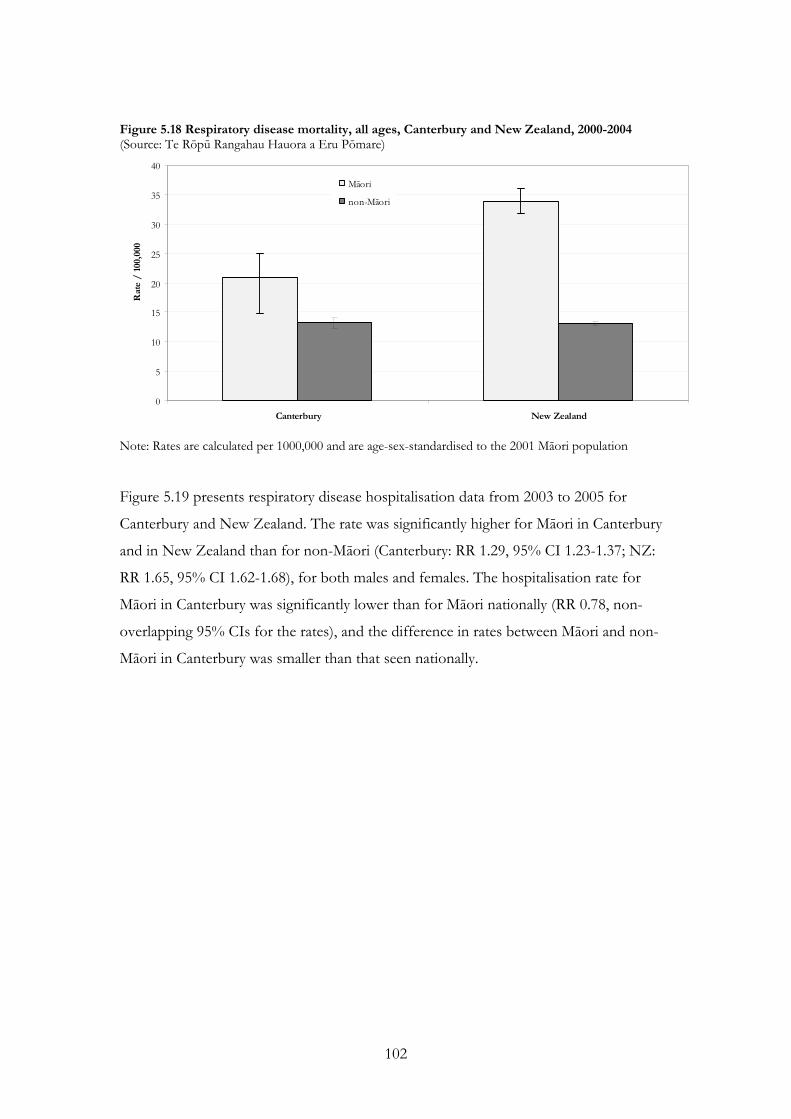
102
Figure 5.18 Respiratory disease mortality, all ages, Canterbury and New Zealand, 2000-2004 (Source: Te Rōpū Rangahau Hauora a Eru Pōmare)
0
5
10
15
20
25
30
35
40
Canterbury New Zealand
Rat
e /
100,
000
Māori
non-Māori
Note: Rates are calculated per 1000,000 and are age-sex-standardised to the 2001 Māori population
Figure 5.19 presents respiratory disease hospitalisation data from 2003 to 2005 for
Canterbury and New Zealand. The rate was significantly higher for Māori in Canterbury
and in New Zealand than for non-Māori (Canterbury: RR 1.29, 95% CI 1.23-1.37; NZ:
RR 1.65, 95% CI 1.62-1.68), for both males and females. The hospitalisation rate for
Māori in Canterbury was significantly lower than for Māori nationally (RR 0.78, non-
overlapping 95% CIs for the rates), and the difference in rates between Māori and non-
Māori in Canterbury was smaller than that seen nationally.

103
Figure 5.19 Respiratory disease hospitalisation, all ages, Canterbury and New Zealand, 2003-2005 (Source: Te Rōpū Rangahau Hauora a Eru Pōmare)
0
500
1,000
1,500
2,000
2,500
Male Female Total Male Female Total
Canterbury New Zealand
Rat
e /
100,
000
Māori
non-Māori
Note: Rates are calculated per 100,000. Sex-specific rates are age-standardised, total rates are age-sex-standardised to the 2001 Māori population.
Asthma, COPD, pneumonia and bronchiectasis
Table 5.10 presents prevalence of self-reported asthma requiring medication and COPD
for Canterbury and New Zealand from the NZHS 2006/07. The prevalence of self-
reported medicated asthma appeared to be higher for Māori in Canterbury than for
European/Others and similar to the prevalence for Māori nationally, but these
differences were not statistically significant. The prevalence of self-reported COPD
appeared to be much higher for Māori in Canterbury than for European/Others and
higher than for Māori nationally, but again these differences were not statistically
significant.

104
Table 5.10 Prevalence of self-reported asthma requiring medication and COPD, 15+ years,
Canterbury and New Zealand, 2006/07
(Source: HDIU/New Zealand Health Survey 2006/07) Canterbury New Zealand
Indicator Māori Rate
(95% CI)
European/Other Rate
(95% CI)
Māori Rate
(95% CI)
European/Other Rate
(95% CI)
15.5 11.9 15.8 12.1 Self-reported medicated asthma
(12.8–18.5) (9.6–14.5) (14.0–17.7) (10.9–13.3)
18.7 6.2 12.8 6.5 Self-reported COPD
(5.4–41.2) (4.0–8.4) (9.2–16.3) (5.7–7.3)
Note: Rates are age-standardised (using the WHO population) prevalence rates for adults aged over 15 years. European/Other are non-Māori, non-Pacific, non-Asian.
Figure 5.20 presents hospitalisation data for selected respiratory diseases for 2003 to
2005. For asthma, the rate of hospitalisation was significantly higher for Māori in
Canterbury than for non-Māori (RR 1.72, 95% CI 1.53-1.93). The rate for Māori in
Canterbury was slightly lower than that for Māori nationally, but this was not a significant
difference (RR 0.89, overlapping 95% CIs for the rates) and the difference in rates
between Māori and non-Māori in Canterbury (RR 1.72, 95% CI 1.53-1.93) and New
Zealand (RR 1.86, 95% CI 1.80–1.93) were comparable.
For chronic obstructive pulmonary disease (COPD) the rate of hospitalisation for Māori
in Canterbury was over twice that for non-Māori (RR 2.18, 95% CI 1.84-2.57). The rate
for Māori in Canterbury was significantly lower than that for Māori nationally (RR 0.64,
non-overlapping 95% CIs for the rates). The difference in rates between Māori and non-
Māori in Canterbury (RR 2.18, 95% CI 1.84-2.57) was smaller than that for New
Zealand, where the rate for Māori was three and a half times that for non-Māori (RR
3.54, 95% CI 3.42–3.67).
For pneumonia there was no significant difference between the rate of hospitalisation for
Māori and non-Māori in Canterbury (RR 1.20, overlapping 95% CIs for the rates). This
was in contrast to the national picture where Māori (and non-Māori) had a significantly
higher rate of pneumonia (RR 0.48, non-overlapping 95% CIs for the rates) and there
was a larger difference between the rates for Māori and non-Māori (RR 1.65, 95% CI
1.59–1.71).

105
Numbers of bronchiectasis hospitalisations were small, but differences between the rates
for Māori and non-Māori, both in Canterbury (RR 5.11, 95% CI 3.32-7.84), and
nationally (RR 3.60, 95% CI 3.19–4.08), were large. The rate for Māori in Canterbury was
lower, but not significantly different from that for Māori nationally (RR 0.73, overlapping
95% CIs for the rates).
Figure 5.20 Asthma, COPD, pneumonia, and bronchiectasis hospitalisations, all ages, Canterbury and New Zealand, 2003-2005 (Source: Te Rōpū Rangahau Hauora a Eru Pōmare)
0
50
100
150
200
250
300
350
400
450
500
Asthma COPD Pneumonia Bronchi-ectasis
Asthma COPD Pneumonia Bronchi-ectasis
Canterbury New Zealand
Rat
e /
100
,000
Māori
non-Māori
Note: Rates are calculated per 1000,000 and are age-sex-standardised to the 2001 Māori population
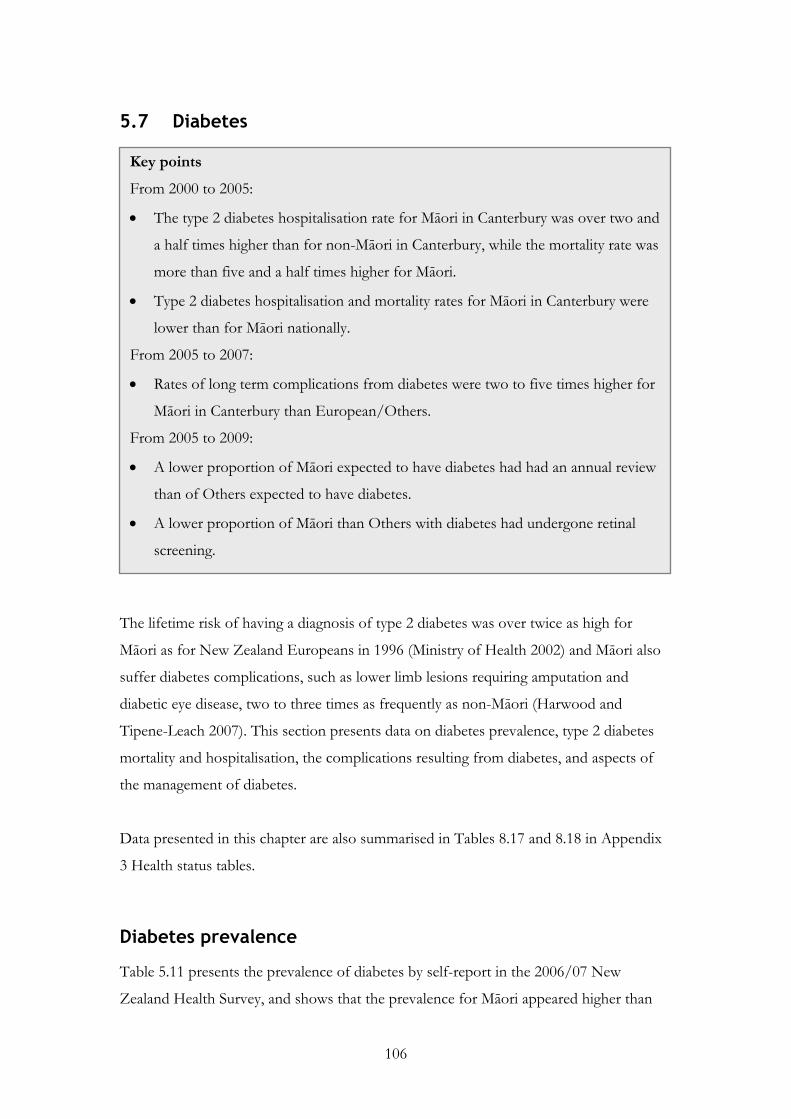
106
5.7 Diabetes
The lifetime risk of having a diagnosis of type 2 diabetes was over twice as high for
Māori as for New Zealand Europeans in 1996 (Ministry of Health 2002) and Māori also
suffer diabetes complications, such as lower limb lesions requiring amputation and
diabetic eye disease, two to three times as frequently as non-Māori (Harwood and
Tipene-Leach 2007). This section presents data on diabetes prevalence, type 2 diabetes
mortality and hospitalisation, the complications resulting from diabetes, and aspects of
the management of diabetes.
Data presented in this chapter are also summarised in Tables 8.17 and 8.18 in Appendix
3 Health status tables.
Diabetes prevalence
Table 5.11 presents the prevalence of diabetes by self-report in the 2006/07 New
Zealand Health Survey, and shows that the prevalence for Māori appeared higher than
Key points
From 2000 to 2005:
• The type 2 diabetes hospitalisation rate for Māori in Canterbury was over two and
a half times higher than for non-Māori in Canterbury, while the mortality rate was
more than five and a half times higher for Māori.
• Type 2 diabetes hospitalisation and mortality rates for Māori in Canterbury were
lower than for Māori nationally.
From 2005 to 2007:
• Rates of long term complications from diabetes were two to five times higher for
Māori in Canterbury than European/Others.
From 2005 to 2009:
• A lower proportion of Māori expected to have diabetes had had an annual review
than of Others expected to have diabetes.
• A lower proportion of Māori than Others with diabetes had undergone retinal
screening.

107
for non-Māori in Canterbury, although this was not a significant difference (overlapping
95% confidence intervals). As the data presented are synthetic estimates comparison
between Māori and European/Others in Canterbury and between Māori in Canterbury
and nationally should be made with caution.
Table 5.11 Prevalence of self-reported diabetes, 15+ years, Canterbury and New Zealand, 2006/07 (Source: HDIU/New Zealand Health Survey 2006/07)
Canterbury New Zealand
Indicator
Māori Rate
(95% CI)
European/Other Rate
(95% CI)
Māori Rate
(95% CI)
European/Other Rate
(95% CI)
Total 4.2 3.1 4.8 3.6 (2.7–6.2) (1.8–4.9) (3.9–5.9) (3.0–4.2)
Male 4.9 3.3 5.7 3.9 (3.1–7.3) (2.0–5.3) (4.3–7.4) (3.1–4.7)
Female 3.5 2.8 4.1 3.3
Self-reported diabetes
(2.0–5.8) (1.5–4.8) (3.0–5.4) (2.6–4.1)
Note: Rates are age-standardised (using the WHO population) prevalence rates for adults aged over 15 years. European/Other are non-Māori, non-Pacific, non-Asian.
Type 2 diabetes mortality and hospitalisation
Diabetes mortality was much higher for Māori in Canterbury than non-Māori, as shown
in Figure 5.21. The mortality rate was over five times higher for Māori in Canterbury (RR
5.69, 95% CI 3.55-9.14) and more so for Māori females (for whom the rate was almost
seven times higher than for non-Māori, RR 6.94, 95% CI 3.50-13.75) than for males (RR
4.86, 95% CI 2.53-9.33). However, the rate of hospitalisation, shown in Figure 5.22,
while higher, was not above the non-Māori rate to an extent that is proportional to
mortality. That is, given their higher mortality it would be expected that Māori would
have an even higher hospitalisation rate. The hospitalisation rate for Māori was two and a
half times higher overall (RR 2.64, 95% CI 2.14-3.27), approaching four times higher for
men (RR 3.84, 95% CI 3.00-4.89) but not significantly different from non-Māori for
females (RR 1.28, 95% CI 0.81-2.00). Māori males and females had similar mortality
rates, but males were over three times more likely to be hospitalised.
The rates of mortality and hospitalisation for Māori in Canterbury were significantly
lower than the rates for Māori nationally, both overall (mortality: RR 0.53;
hospitalisation: RR 0.53; non-overlapping 95% CIs for the rates for both), and for males
(mortality: RR 0.46; hospitalisation: RR 0.71, non-overlapping 95% CIs for the rates for
both) and females. The difference was not, however, significant for mortality for females

108
(RR 0.64, overlapping 95% CIs for the rates), although it was for hospitalisation (RR
0.28, non-overlapping 95% CIs for the rates).
Figure 5.21 Type 2 diabetes mortality, all ages, Canterbury and New Zealand, 2000-2004 (Source: Te Rōpū Rangahau Hauora a Eru Pōmare)
0
5
10
15
20
25
30
35
40
Male Female Total Male Female Total
Canterbury New Zealand
Rat
e /
100,
000
Māori
non-Māori
Note: Rates are calculated per 100,000. Sex-specific rates are age-standardised, total rates are age-sex-standardised to the 2001 Māori population. Figure 5.22 Type 2 diabetes hospitalisation, Canterbury and New Zealand, 2003-2005 (Source: Te Rōpū Rangahau Hauora a Eru Pōmare)
0
50
100
150
200
250
Male Female Total Male Female Total
Canterbury New Zealand
Rat
e /
100,
000
Māori
non-Māori
Note: Rates are calculated per 100,000. Sex-specific rates are age-standardised, total rates are age-sex-standardised to the 2001 Māori population.
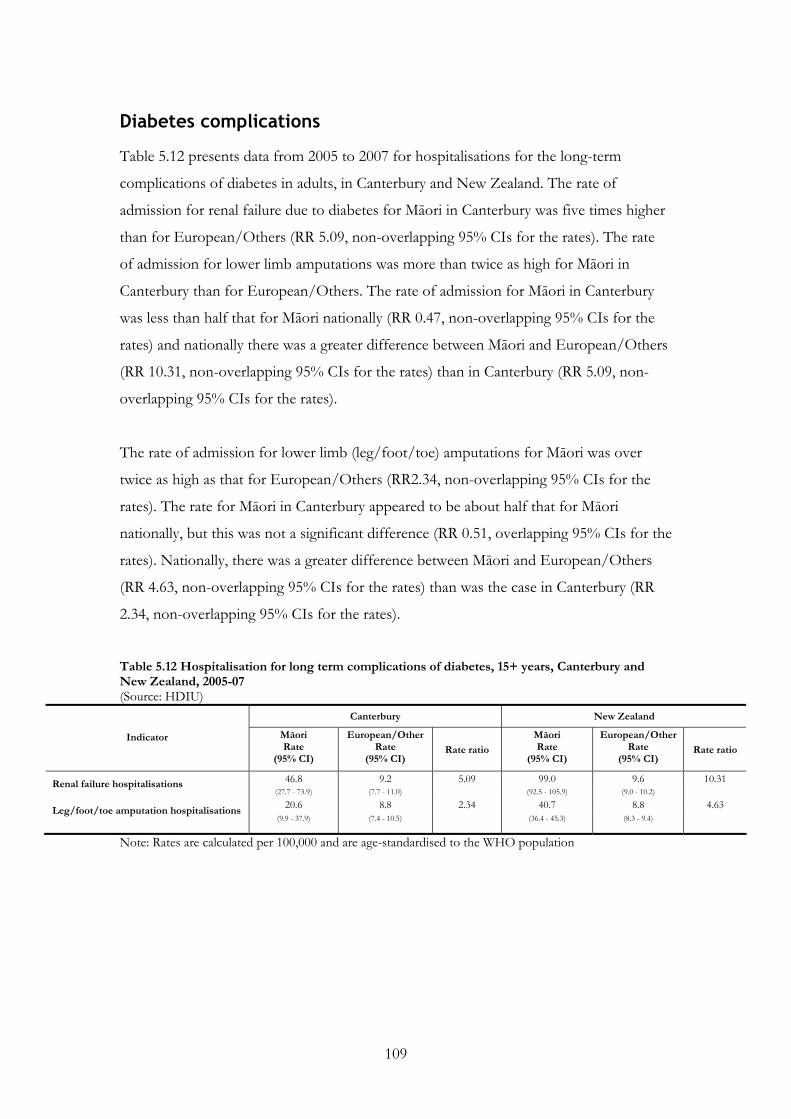
109
Diabetes complications
Table 5.12 presents data from 2005 to 2007 for hospitalisations for the long-term
complications of diabetes in adults, in Canterbury and New Zealand. The rate of
admission for renal failure due to diabetes for Māori in Canterbury was five times higher
than for European/Others (RR 5.09, non-overlapping 95% CIs for the rates). The rate
of admission for lower limb amputations was more than twice as high for Māori in
Canterbury than for European/Others. The rate of admission for Māori in Canterbury
was less than half that for Māori nationally (RR 0.47, non-overlapping 95% CIs for the
rates) and nationally there was a greater difference between Māori and European/Others
(RR 10.31, non-overlapping 95% CIs for the rates) than in Canterbury (RR 5.09, non-
overlapping 95% CIs for the rates).
The rate of admission for lower limb (leg/foot/toe) amputations for Māori was over
twice as high as that for European/Others (RR2.34, non-overlapping 95% CIs for the
rates). The rate for Māori in Canterbury appeared to be about half that for Māori
nationally, but this was not a significant difference (RR 0.51, overlapping 95% CIs for the
rates). Nationally, there was a greater difference between Māori and European/Others
(RR 4.63, non-overlapping 95% CIs for the rates) than was the case in Canterbury (RR
2.34, non-overlapping 95% CIs for the rates).
Table 5.12 Hospitalisation for long term complications of diabetes, 15+ years, Canterbury and New Zealand, 2005-07 (Source: HDIU)
Canterbury New Zealand
Indicator Māori Rate
(95% CI)
European/Other Rate
(95% CI) Rate ratio
Māori Rate
(95% CI)
European/Other Rate
(95% CI) Rate ratio
46.8 9.2 5.09 99.0 9.6 10.31 Renal failure hospitalisations (27.7 - 73.9) (7.7 - 11.0) (92.5 - 105.9) (9.0 - 10.2)
20.6 8.8 2.34 40.7 8.8 4.63 Leg/foot/toe amputation hospitalisations (9.9 - 37.9) (7.4 - 10.5) (36.4 - 45.3) (8.3 - 9.4)
Note: Rates are calculated per 100,000 and are age-standardised to the WHO population

110
Diabetes management
Figure 5.23 presents the proportion of people who received a diabetes review out of
those expected to have diabetes in the population (calculated by the Ministry of Health,
based on population profile and incidence rates). The proportion of Māori expected to
have diabetes who had had a review did not show major improvement from 2005
(24.5%) to 2008/09 (30.7%), and was lower than for Others (52% in 2005, 38.3% in
2008/09), although the rate for Others fell sharply in 2008/09 to be closer to the Māori
rate. The national target in 2008/09 for diabetes annual reviews was not met for Māori
(33% of eligible having a review) or for Others (44% of eligible having a review). The
Ministry of Health definition of the expected number of diabetics was broadened in
2008/09, which may partly explain the drop-off in the proportion of eligible receiving a
review in 2008/09, especially for Others.
Figure 5.23 Diabetes annual reviews, all ages, 2005-2009 (Source: CDHB Local Diabetes Team/Canterbury PHOs)
24.5%
32.5%
28.8%
35.1%
30.7%
52.0%
61.1%
63.7%
69.1%
38.3%
0%
10%
20%
30%
40%
50%
60%
70%
80%
90%
100%
2005 2006 2007 2007/08 2008/09 2005 2006 2007 2007/08 2008/09
Māori Other
Per
cent
of e
ligib
le h
avin
g r
evie
w
Note: The period of data collection changed after 2007 and 2007/08 was a Ministry of Health estimate

111
Figure 5.24 presents the proportion of people having a review who then had a retinal
screening examination. Both Māori and Others had increasing rates over the period 2006
to 2008/09, with Māori having a larger increase, from 44% to 62.2%, to be closer to the
figure for Others which was 65.4%.
Figure 5.24 Diabetes retinal screening, all ages, 2006-2009 (Source: CDHB Local Diabetes Team/Canterbury PHOs)
47.8%
62.2%
56.0%
65.4%
44.0%
53.8% 54.5% 56.0%
0%
10%
20%
30%
40%
50%
60%
70%
80%
90%
100%
2006 2007 2007/08 2008/09 2006 2007 2007/08 2008/09
Māori Other
Per
cent
of
elig
ible
hav
ing
retin
al s
cree
nin
g
Note: The period of data collection changed after 2007 and 2007/08 was a Ministry of Health estimate.

112
5.8 Communicable disease
Infectious disease mortality and hospitalisation
Table 5.13 presents mortality (from 2000 to 2004) and hospitalisations (from 2003 to
2005) from communicable diseases for Māori and non-Māori in Canterbury and New
Zealand. Mortality appeared higher for Māori than non-Māori in Canterbury, but this
was not a significant difference (RR 1.79, 95% CI 0.62-5.15). There was a lower rate of
hospitalisation for Māori than non-Māori in Canterbury (RR 0.77, 95% CI 0.69-0.85),
whereas there was no significant difference between Māori and non-Māori nationally (RR
0.97, 95% CI 0.95-1.00). The rate of hospitalisation for Māori in Canterbury was
significantly lower than for Māori nationally (RR 0.74, non-overlapping 95% CIs for the
rates).
The rate of admissions for intestinal infectious disease was also lower for Māori than
non-Māori in Canterbury (RR 0.59, 95% CI 0.49-0.70). This was consistent with the
pattern nationally (RR 0.80, 95% CI 0.77-0.84), although the rate for Māori in Canterbury
Key points
• From 2000 to 2005, the rate of mortality from communicable diseases was not
significantly different for Māori and non-Māori in Canterbury, but the rate of
hospitalisation was lower for Māori.
• The rate of hospitalisation (from 2003 to 2005) and notification (from 2004 to
2008) for intestinal infections was lower for Māori than for non-Māori in
Canterbury.
From 2004 to 2008:
• The rate of viral hepatitis hospitalisation was three times higher for Māori than
for non-Māori in Canterbury.
• Notifications for invasive pneumococcal disease and tuberculosis disease were
significantly higher for Māori than non-Māori in Canterbury.
In 2008/09:
• National immunisation register data indicate lower immunisation coverage for
Māori in Canterbury than for non-Māori, but higher than for Māori nationally.

113
was significantly lower than for Māori nationally (RR 0.73, non-overlapping 95% CIs for
the rates). The rate of admissions for tuberculosis also appeared lower for Māori than
non-Māori in Canterbury but this was not a significant difference (RR 0.77, 95% CI 0.18-
3.25), with small numbers in Canterbury precluding further analysis of differences in
rates.
Meningococcal infection hospitalisations appeared higher for Māori than non-Māori in
Canterbury but this was not a significant difference (RR 1.51, 95% CI 0.78-2.94), whereas
nationally hospitalisation for meningococcal infection was higher for Māori than non-
Māori (RR1.52, 95% CI 1.31-1.77). The rate for Māori in Canterbury appeared lower but
was not significantly different from that for Māori nationally (RR 0.59, overlapping 95%
CIs for the rates).
The rate of admission for viral hepatitis was three times higher for Māori than non-Māori
in Canterbury (RR 3.09, 95% CI 2.15-4.45). Nationally, the rate was also higher for Māori
than non-Māori, but the difference was smaller (RR1.39, 95% CI 1.24-1.57). The rate for
Māori in Canterbury was significantly higher than for Māori nationally (RR1.80, non-
overlapping 95% CIs for the rates).
Table 5.13 Infectious disease mortality (2000-2004) and hospitalisations (2003-2005), all ages, Canterbury and New Zealand (Source: Te Rōpū Rangahau Hauora a Eru Pōmare)
Canterbury New Zealand
Māori non-Māori Māori non-Māori Certain infectious and parasitic diseases
No. Rate
(95% CI) No.
Rate (95% CI)
Rate ratio (95% CI)
No. Rate
(95% CI) No.
Rate (95% CI)
Rate ratio (95% CI)
Mortality * 2.7 75 1.5 1.79 137 4.5 665 2.0 2.22 (1.0-7.3) (1.0-2.2) (0.62-5.15) (3.8-5.3) (1.8-2.3) (1.82-2.72)
Hospitalisation Total 462 456.9 5,563 594.9 0.77 11,430 620.8 48,370 636.9 0.97 (415.6-502.4) (575.4-615.1) (0.69-0.85) (607.3-634.5) (628.4-645.6) (0.95-1.00) Intestinal infectious diseases 137 137.2 115 234.2 0.59 3,423 188.8 15,229 235.8 0.80 (115.4-163.3) (221.8-247.2) (0.49-0.70) (181.8-196.1) (230.6-241.2) (0.77-0.84) Viral hepatitis 40 37.4 198 12.1 3.09 393 20.8 1,915 14.9 1.39
(27.2-51.4) (10.1-14.4) (2.15-4.45) (18.7-23.0) (14.1-15.8) (1.24-1.57) Meningococcal infection 12 11.9 72 7.9 1.51 365 20.2 846 13.2 1.52 (6.6-21.5) (5.8-10.6) (0.78-2.94) (18.1-22.4) (11.9-14.7) (1.31-1.77) Tuberculosis * 2.0 0 2.6 0.77 226 11.7 1,227 10.9 1.07 (0.5-7.9) (1.7-3.8) (0.18-3.25) (10.2-13.4) (10.1-11.7) (0.92-1.25)
Note: Rates are calculated per 100,000 and are age-sex-standardised to the 2001 Māori population * indicates number less than five

114
Notifiable communicable diseases
Crude data for notifications of communicable diseases from 2008 are presented in Table
5.14. This table allows comparison between Canterbury and New Zealand, and compares
Māori and New Zealand Europeans (rather than Māori and non-Māori) because of a
large proportion of Unknown ethnic group in the data (in some cases representing over
10% of the total for a disease). These data are not age-standardised and therefore do not
take into account the differences in age structure between the two populations. The
number of cases for many diseases is small so caution should be taken with comparisons.
However, of note, these data suggest Māori may be relatively over-represented in
Canterbury for tuberculosis notifications compared to non-Māori. This is inconsistent
with the apparently lower (but non-significantly different) rate of hospitalisation for
tuberculosis.
Māori in Canterbury appeared to be under-represented in the intestinal infection
notifiable diseases such as campylobacteriosis, cryptosporidiosis, gastroenteritis,
giardiasis, salmonellosis and yersiniosis. This correlates with the lower rate of admission
for intestinal infection for Māori in Canterbury compared to non-Māori.

115
Table 5.14 Communicable disease notifications, all ages, Canterbury and New Zealand, 2008 (Source: ESR (Institute of Environmental Science and Research Limited 2009) and Episurv)
Canterbury New Zealand
Māori NZ European Māori NZ European Disease
(% of total) (% of total) Total
(% of total) (% of total) Total
Campylobacteriosis 27 (4.6%) 469 (79.1%) 593 348 (5.2%) 3,570 (53.3%) 6693 Cryptosporidiosis * (0.9%) 97 (89.0%) 109 56 (7.3%) 589 (77.1%) 764 Gastroenteritis 3 (2.6%) 106 (90.6%) 117 32 (4.6%) 441 (63.9%) 690 Giardiasis 6 (3.2%) 145 (78.4%) 185 62 (3.7%) 861 (51.8%) 1662 Haemophilus influenzae type b * (100%) - 2 6 (66.7%) - 9 Hepatitis A - - 4 14 (15.4%) 33 (36.3%) 91 Hepatitis B - 5 (71.4%) 7 4 (10.3%) 18 (46.2%) 39 Hepatitis C * (33.3%) - 3 5 (21.7%) 15 (65.2%) 23 Legionellosis * (8.3%) 11 (91.7%) 12 3 (3.9%) 59 (77.6%) 76 Leptospirosis - 6 (85.7%) 7 26 (21.5%) 78 (64.5%) 121 Listeriosis - 3 (100%) 3 - 20 (74.1%) 27 Measles * (14.3%) 6 (85.7%) 7 - 9 (75.0%) 12 Meningococcal disease * (11.1%) 6 (66.7%) 9 40 (32.8%) 52 (42.6%) 122 Mumps - 10 (76.9%) 13 16 (20.5%) 33 (42.3%) 78 Pertussis 4 (4.5%) 79 (89.8%) 88 61 (14.1%) 324 (74.8%) 433 Rheumatic fever - - 1 99 (65.1%) 10 (6.6%) 152 Rubella - - 1 - 7 (77.8%) 9 Salmonellosis 10 (5.8%) 133 (77.3%) 172 108 (8.0%) 820 (60.9%) 1346 Shigellosis - 6 (100%) 6 4 (3.5%) 53 (46.9%) 113 Tuberculosis disease 4 (16.7%) 3 (12.5%) 24 48 (15.9%) 35 (11.6%) 302 VTEC/STEC infection * (10.0%) 17 (85.0%) 20 12 (9.8%) 88 (71.5%) 123
Yersiniosis * (2.1%) 67 (71.3%) 94 26 (5.1%) 273 (53.6%) 509
Note: * represents a number less than 3

116
Table 5.15 presents aggregate data for Māori and New Zealand Europeans in Canterbury
for the five-year period from 2004 to 2008, which have been age-standardised. Māori are
significantly over-represented in notifications for invasive pneumococcal disease and
tuberculosis disease. The number of cases for several other diseases is small so caution
should be taken with comparison of rates, although Māori appear to have higher rates
(but not significantly so) for Haemophilus influenzae type b, hepatitis C, measles,
meningococcal disease, rheumatic fever, and latent tuberculosis.
Māori are significantly under-represented in total notifications, and in notifications for
campylobacteriosis, cryptosporidiosis, gastroenteritis, giardiasis, salmonellosis, yersiniosis,
and pertussis. Rates for Māori were lower (but not significantly so) for VTEC/STEC
(Verotoxin or Shiga toxin producing E. coli), hepatitis A and B, legionellosis,
leptospirosis, and mumps, although the number of cases is small, suggesting caution is
needed with interpretation of differences in rates.
The lower rates of notification for some infectious diseases may be due to a number of
factors including a lower incidence of disease among Māori or undercounting of Māori
due to, for example, misclassification or non-classification (i.e. classification as
Unknown) of Māori. Differential presentation of Māori to health services may also be a
factor – it is worth noting that diseases likely to be more severe and treated in a
secondary care setting are those for which Māori are over-represented, such as invasive
pneumococcal disease and tuberculosis. This may be due to better recording of ethnicity
in secondary care compared to primary care, to the greater likelihood of direct
involvement of Public Health Unit staff, or to greater inequality of access to primary care
(where there are costs associated with treatment), compared to secondary care.

117
Table 5.15 Notifiable communicable diseases, all ages, Canterbury, 2004-2008 (Source: ESR, Episurv database)
Māori NZ European Communicable notifiable
diseases No.
Rate (95% CI)
No. Rate
(95% CI)
Rate ratio
Total 556 335.3 10,984 639.9 0.52 (308.0-364.4) (626.1-654.0) Campylobacteriosis 289 173.1 6,304 343.8 0.50 (153.7-194.3) (334.0-353.9) Cryptosporidiosis 17 10.3 400 32.0 0.32 (6.0-16.5) (28.7-35.6) Gastroenteritis 17 10.2 529 25.5 0.40 (5.9-16.3) (22.9-28.2) Giardiasis 23 14.2 575 33.7 0.42 (9.0-21.3) (30.6-37.0) Haemophilus influenzae type b 3 1.8 2 0.2 11.26 (0.4-5.2) (0.0-0.6) Hepatitis A * 1.2 30 1.8 0.67 (0.1-4.5) (1.1-2.8) Hepatitis B * 0.6 25 1.1 0.56 (0.0-3.4) (0.7-1.6)
Hepatitis C 5 3.1 37 2.1 1.49 (1.0-7.2) (1.4-2.9) Invasive pneumococcal disease 3 1.8 11 0.1 13.50 (0.4-5.3) (0.0-0.3) Legionellosis * 0.6 55 1.0 0.64 (0.0-3.5) (0.7-1.4) Leptospirosis * 0.6 26 1.3 0.48 (0.0-3.4) (0.8-1.9) Listeriosis - - 4 0.0 - (0.0-0.1) Measles 6 3.7 18 2.0 1.80 (1.3-8.0) (1.2-3.2) Meningococcal disease 11 6.8 63 5.1 1.34 (3.4-12.2) (3.8-6.6) Mumps * 0.5 27 2.3 0.23 (0.0-2.9) (1.4-3.4) Pertussis 116 70.4 1,775 118.2 0.60 (58.2-84.5) (112.0-124.6) Rheumatic fever * 0.6 3 0.3 2.14 (0.0-3.5) (0.1-0.9) Rubella - - 3 0.4 - (0.1-1.0) Salmonellosis 32 19.4 647 45.1 0.43 (13.3-27.5) (41.2-49.2) Shigellosis - - 53 2.7 - (1.9-3.7) Tuberculosis - latent 5 3.0 16 1.2 2.41 (1.0-7.0) (0.6-2.1) Tuberculosis disease 9 5.2 16 0.7 8.03 (2.4-10.0) (0.3-1.1) VTEC/STEC 5 3.2 59 4.9 0.65 (1.0-7.4) (3.6-6.4) Yersiniosis 6 3.7 292 13.9 0.26 (1.3-8.1) (12.0-16.1)
Note: Rates are calculated per 100,000 and are age-standardised to the 2001 Māori population * represents a number less than 3
Immunisation coverage – children
Immunisation coverage is recorded by the National Immunisation Register for the
milestone age groups of 6, 12, 18 and 24 months. Completed age-appropriate
immunisations are reported for each child turning the milestone age in the reporting
period. Figure 5.25 shows immunisation coverage for the period from April 2008 to
March 2009. Māori in Canterbury had lower coverage rates for immunisation than non-
Māori across all the milestone ages, particularly at 6 months, before which children

118
should have been immunised for diphtheria, tetanus, pertussis, polio, Haemophilus
influenzae type b and hepatitis B. However, the rates for Māori in Canterbury are higher
than for Māori nationally.
Figure 5.25 Immunisation coverage, at milestone ages, Canterbury and New Zealand, 2008/09 (Source: National Immunisation Register)
0%
10%
20%
30%
40%
50%
60%
70%
80%
90%
100%
6m 12m 18m 24mMilestone age
Per
cent
of
elig
ible
im
mu
nise
d
Canterbury Māori Canterbury non-Māori
New Zealand Māori New Zealand non-Māori

119
5.9 Mental health
Māori have been shown in Te Rau Hinengaro: The New Zealand Mental Health Survey
(Oakley Browne, Wells et al. 2006) to have a relatively high prevalence of mental health
disorders, with 50.7% of Māori in New Zealand having met criteria for a DSM-IV12
mental disorder in their life (compared to 39.5% for non-Māori/non-Pacific) and 29.5%
in the last 12 months (20.7% for non-Māori/non-Pacific). The prevalence of mental
disorder within the last 12 months did not vary significantly according to region, and for
Māori in the South Island the 12 month prevalence was 32.3%. The rates did, however,
12 Diagnostic and Statistical Manual IV, published by the American Psychiatric Association, providing
diagnostic criteria for mental disorders.
Key points
• From 2005 to the beginning of 2009, the proportion of Māori in Canterbury
accessing mental health services was higher than non-Māori, and increasing, but
below the target set by the Mental Health Commission.
For 2000 to 2005:
• The rate of hospitalisation for mental and behavioural disorders for Māori males
was higher than for non-Māori, but there was no difference in the rate for Māori
females compared to non-Māori.
• The rate of hospitalisation for schizophrenia and similar disorders was twice as
high for Māori than for non-Māori in Canterbury. It was also higher for Māori for
manic episodes and bipolar disorder and psychoactive substance use, but lower
for Māori for personality and behavioural disorders.
• The rate of hospitalisation for Māori for schizophrenia was lower in Canterbury
than nationally, but higher for depression.
• In hospitalisations for disorders due to psychoactive substance use the rate for
Māori in Canterbury was higher than for non-Māori for use of cannabinoids and
opioids. The rate of hospitalisation for Māori in Canterbury was much higher
than for Māori nationally.
• The mortality rate from suicide was not significantly different for Māori and non-
Māori in Canterbury.

120
vary according to socioeconomic status with higher prevalence in Māori living in areas
with the two most deprived NZDep13 scores (32.5%) compared to those living in areas
with the two least deprived NZDep scores (14.1%). As shown in section 3.1
Socioeconomic determinants of health, Māori in Canterbury have a different
socioeconomic profile from Māori in New Zealand, so it cannot be assumed that the
rates of mental disorder will necessarily be similar between Canterbury and New
Zealand14.
Access to services
Figure 5.26 presents the proportion of people accessing secondary mental health
treatment and support services in Canterbury from 2005 to 2009, for Māori and non-
Māori. The proportion of Māori aged 20 to 64 years accessing services increased over the
period to 4.2% in the first six months of the 2008/09 year, but still remained below the
6% access target set by the Mental Health Commission in its Blueprint for Mental Health
Services in New Zealand (Mental Health Commission 1998). This compares to 2.3% for
non-Māori, which was proportionately closer to the 3% target set for the total
population.
The level of access for Māori nationally was 2.0% in the first six months of 2006 (Mental
Health Commission 2007). In the 2005/06 year in Canterbury the corresponding figure
was 1.3%, but the following year it was 3.5%, as shown in Figure 5.26, making
comparison uncertain.
13 NZDep2001 was used in Te Rau Hinengaro, which was based on the 2001 Census, whereas
NZDep2006 has been used for this profile. 14 For the reasons outlined in the Introduction this profile has not drawn Canterbury data from Te Rau
Hinengaro: The New Zealand Mental Health Survey.

121
Figure 5.26 Utilisation of mental health treatment and support services, by age group, Canterbury, 2005-2009 (Source: Planning and Funding, CDHB)
1.6%1.9%
2.2%
1.0%
0.6%
1.3%
0.4%
2.3%
2.0%
3.5%
1.4%
3.5%
2.3%
1.9%
4.2%
1.6%
0.0%
0.5%
1.0%
1.5%
2.0%
2.5%
3.0%
3.5%
4.0%
4.5%
0-19 20-64 0-19 20-64
Māori non-MāoriAge group (years)
Per
cent
05/06 06/07 07/08 08/09 (6m)
Mental health hospitalisations
Figure 5.27 presents data about hospitalisation for mental and behavioural disorders for
Māori and non-Māori in Canterbury and New Zealand from 2003 to 2005 (the data
presented in this figure are also summarised in Table 8.19 in Appendix 3 Health status
tables).
Māori men in Canterbury were hospitalised for mental health problems more frequently
than non-Māori men (RR 1.67, 95% CI 1.49-1.86), whereas Māori and non-Māori
women in Canterbury had similar hospitalisation rates (RR 1.01, 95% CI 0.89-1.14).
Overall, the rate ratio between Māori and non-Māori in Canterbury for hospitalisations
for mental health problems was 1.29 (95% CI 1.19-1.40). Māori men in Canterbury had
significantly higher mental hospitalisation rates than Māori women (RR 1.26, non-
overlapping 95% CIs for the rates), which was in contrast to the pattern for non-Māori
men and women (RR 0.76, non-overlapping 95% CIs for the rates). The rate of
hospitalisation for mental and behavioural disorders for Māori men in Canterbury was
similar to that for Māori men nationally (RR 0.99, overlapping 95% CIs for the rates).
The difference between the rates for Māori and non-Māori men was less in Canterbury
(RR 1.67, 95% CI 1.49-1.86) than nationally (RR 2.14, 95% CI 2.07-2.21). Māori women
in Canterbury had similar hospitalisation rates to Māori women nationally (RR 1.03,
overlapping 95% CIs for the rates), but the higher rate of hospitalisation for Māori

122
women compared to non-Māori seen nationally (RR 1.51, 95% CI 1.46-1.56) was not
seen in Canterbury, where female Māori and non-Māori hospitalisation rates were not
significantly different (RR 1.01, 95% CI 0.89-1.14).
Figure 5.27 Hospitalisation for mental and behavioural disorders, all ages, Canterbury and New Zealand, 2003-2005 (Source: Te Rōpū Rangahau Hauora a Eru Pōmare)
0
100
200
300
400
500
600
700
800
900
Male Female Total Male Female Total
Canterbury New Zealand
Rat
e /
100,
000
Māori
non-Māori
Note: Rates are calculated per 100,000. Sex-specific rates are age-standardised, total rates are age-sex-standardised to the 2001 Māori population.
As shown in Table 5.16, rates of hospitalisation for Māori were higher than those for
non-Māori for all mental and behavioural disorder causes apart from personality
disorders and depressive disorders. The hospitalisation rate for Māori for personality
disorders was significantly lower than for non-Māori (RR 0.36, 95% CI 0.23-0.55).
Although the rate appeared also to be lower for depressive disorders, this was not a
significant difference (RR 0.82, 5% CI 0.66-1.03). Numbers were too small to present the
rates of hospitalisation for eating disorders.
The greatest differences between Māori and non-Māori in Canterbury for the rates of
hospitalisation for mental and behavioural disorders were for schizophrenia and bipolar
disorder, mirroring the situation seen nationally. Canterbury Māori were more than twice
as likely as non-Māori to be hospitalised for ‘Schizophrenia, schizotypal and delusional
disorders’ (RR 2.15, 95% CI 1.84-2.51) and over 80% more likely to be hospitalised for
bipolar disorder (RR 1.82, 95% CI 1.50-2.21). Māori in Canterbury were also 66% more
likely to be hospitalised for organic disorders, (RR 1.66 95% CI 1.17-2.36) although this
was less often for dementia than other organic causes, and 46% more likely (RR1.46,

123
95% CI 1.21-1.75) to be admitted for disorders related to psychoactive substance use (see
next section).
Māori in Canterbury were significantly less likely than Māori nationally to be hospitalised
for schizophrenia (RR 0.61, non-overlapping 95% CIs for the rates), but significantly
more likely to be admitted for disorders associated with substance use (RR 1.83, non-
overlapping 95% CIs for the rates) and depressive disorders (RR1.74, non-overlapping
95% CIs for the rates). Nationally, the disparities between rates for Māori and non-Māori
of schizophrenia (RR 3.51, 95% CI 3.37-3.66) and bipolar disorder (RR 2.41, 95% CI
2.27-2.56) were significantly larger than those in Canterbury (schizophrenia: RR 2.15,
95% CI 1.84-2.51; bipolar disorder: RR 1.82, 95% CI 1.50-2.21).
Table 5.16 Mental and behavioural disorder hospitalisations, all ages, Canterbury and New Zealand, 2003-2005 (Source: Te Rōpū Rangahau Hauora a Eru Pōmare)
Canterbury New Zealand
Māori non-Māori Māori non-Māori Mental health and behavioural disorder hospitalisations
No. Rate
(95% CI) No.
Rate (95% CI)
Rate ratio (95% CI) No.
Rate (95% CI)
No. Rate
(95% CI)
Rate ratio (95% CI)
209 194.7 1,318 90.6 2.15 5,924 319.6 10,717 91.0 3.51 Schizophrenia, schizotypal and delusional disorders (169.4-223.9) (84.6-97.0) (1.84-2.51) (311.1-328.2) (88.2-94.0) (3.37-3.66)
135 128.3 1,290 88.1 1.46 1,309 70.2 6,318 55.0 1.28 Disorders due to psychoactive substance use (107.9-152.5) (82.4-94.2) (1.21-1.75) (66.3-74.2) (53.2-56.9) (1.20-1.36)
126 120.4 1,174 66.2 1.82 1,996 103.5 5,940 42.9 2.41 Manic episode and bipolar affective disorder (100.6-144.1) (61.6-71.2) (1.50-2.21) (98.9-108.3) (41.3-44.6) (2.27-2.56)
90 84.9 1,836 103.0 0.82 933 48.9 9,020 61.9 0.79 Depressive episode and persistent mood disorders (68.7-104.9) (97.2-109.2) (0.66-1.03) (45.7-52.2) (60.2-63.6) (0.73-0.85)
37 35.0 986 21.1 1.66 532 26.9 7,022 19.2 1.40 Organic disorder (25.1-48.8) (18.8-23.6) (1.17-2.36) (24.6-29.4) (18.4-20.1) (1.27-1.55)
22 20.4 720 57.1 0.36 262 13.9 2,343 21.8 0.64 Disorders of adult personality and behaviour (13.3-31.4) (52.8-61.7) (0.23-0.55) (12.2-15.7) (20.8-22.9) (0.56-0.73)
Note: Rates are calculated per 100,000 and are age-sex-standardised to the 2001 Māori population
Alcohol and drug use hospitalisations
Patterns of alcohol use differ between Māori and non-Māori (Bramley, Broad et al. 2003).
Alcohol has harmful effects on health and these are known to disproportionately affect
Māori (Alcohol Advisory Council of New Zealand 2005). Use of other drugs also has
harmful health effects, and Māori are known to be significantly more likely to use several
types of recreational drugs (Ministry of Health 2007).

124
Mental health hospitalisations due to alcohol and drug use are presented in Table 5.17.
These do not include hospitalisations for other harm caused or contributed to by alcohol
and drug use. The rate of hospitalisations will only reflect the risks related to alcohol and
drug use at the most severe end of the spectrum, with only a proportion of those with
substance use disorders making contact with treatment services (Wells, Baxter et al.
2007), and fewer again requiring hospitalisation. Differences in rates between groups may
be due to factors other than differences in alcohol and other drug use, for example,
differential management such as a lower or higher threshold for admission. Table 5.17
shows similar rates of hospitalisation due to alcohol use from 2003 to 2005 for Māori
and non-Māori in Canterbury, but a significantly higher rate of hospitalisation due to
canabinoid use and opioid use in Māori. The rate of hospitalisation in Canterbury
exceeded that for New Zealand for Māori and non-Māori, especially hospitalisations due
to opioid use (RR 9.45, non-overlapping 95% CIs for the rates). This is likely to have
been partly due to different admission practices in Canterbury and nationally, rather than
solely representing differences in prevalence of substance use.
Table 5.17 Disorders due to psychoactive substance use, all ages, Canterbury and New Zealand, 2003-2005 (Source: Te Rōpū Rangahau Hauora a Eru Pōmare)
Canterbury New Zealand
Māori non-Māori Māori non-Māori Alcohol and drug use hospitalisations
No. Rate
(95% CI) No.
Rate (95% CI)
Rate ratio (95%CI) No.
Rate (95% CI)
No. Rate
(95% CI)
Rate ratio (95%CI)
Alcohol 67 63.6 950 61.5 1.03 654 34.5 4,887 40.6 0.85 (49.7-81.3) (56.9-66.5) (0.80-1.34) (31.9-37.4) (39.2-42.2) (0.78-0.93)
Opioids 32 31.2 218 17.3 1.81 62 3.3 438 4.3 0.77 (21.9-44.4) (14.8-20.1) (1.23-2.65) (2.6-4.3) (3.8-4.8) (0.59-1.02)
Cannabinoids 14 12.6 33 2.8 4.51 128 6.9 211 2.3 3.07 (7.3-21.7) (1.7-4.5) (2.18-9.32) (5.8-8.3) (1.8-2.8) (2.34-4.04)
Note: Rates are calculated per 100,000 and are age-sex-standardised to the 2001 Māori population.

125
Suicide mortality
Table 5.18 presents the number and rate of suicides from 2000 to 2004 in Canterbury
and New Zealand. The rates of death from suicide in Māori and non-Māori in
Canterbury were not significantly different, whereas there was a statistically significant
difference at the national level, which has also been found in other national data
(Ministry of Health 2006). Suicide was more common among males for Māori in
Canterbury (male:female ratio of 4.5:1). This was also the case for Māori in New Zealand
and non-Māori in Canterbury and New Zealand (Baxter 2007).
Table 5.18 Deaths from suicide, all ages, Canterbury and New Zealand, 2000-2004 (Source: Te Rōpū Rangahau Hauora a Eru Pōmare)
Canterbury New Zealand
Māori non-Māori Māori non-Māori Suicide
No. Rate
(95% CI) No.
Rate (95% CI)
Rate ratio (95% CI) No.
Rate (95% CI)
No. Rate
(95% CI)
Rate ratio (95% CI)
Mortality 22 12.7 295 11.4 1.11 437 14.8 2,004 10 1.49 (8.4-19.3) (10.1-12.9) (0.72-1.72) (13.5-16.2) (9.5-10.4) (1.34-1.65)
Note: Rates are calculated per 100,000 and are age-sex-standardised to the 2001 Māori population

126
5.10 Injury
Injury mortality
Māori have been shown to suffer disproportionately from mortality due to injury
(Blakely, Tobias et al. 2007). From 2000 to 2004, Māori rates for external causes15 of
mortality were significantly higher (60%) than non-Māori in Canterbury, as shown in
Table 5.19. The rate of transport accidents (most of which are motor vehicle related)
appeared higher in Māori, but was not significantly different from the rate for non-Māori.
The rate for other causes of accidental injury was significantly higher (RR 2.73, 95% CI
1.79-4.15) for Māori than non-Māori. The number of deaths was small for several other
causes of death from injury, so caution should be taken with comparison of rates.
However, among ‘Other causes of accidental injury’, fire (RR 7.58, 95% CI 2.26-25.43),
poisoning (RR 3.78, 95% CI 1.39-10.29), and drowning (RR 3.15, 95% CI 1.10-9.06) as
causes of death were significantly more common among Māori than non-Māori in
Canterbury.
Rates of death from injuries for Māori in Canterbury did not vary significantly from
those for Māori nationally, although transport accidents appeared to be less frequent as a
cause of death, and fires and poisoning more frequent.
15 External causes are the category of casues of medical conditions that are associated with an object or
process outside the body.
Key points
• From 2000 to 2004, the mortality rate for deaths from external causes (injuries
and poisoning) was higher for Māori in Canterbury than for non-Māori. Within
this category the mortality rates for deaths due to drowning, fires, and accidental
poisoning were significantly higher for Māori in Canterbury than non-Māori.
• From 2001 to 2007, the non-age-standardised rate of hospitalisation for injuries
was lower for Māori in Canterbury than non-Māori and lower than for Māori
nationally.

127
Table 5.19 External causes of mortality, all ages, Canterbury and New Zealand, 2000-2004 (Source: Te Rōpū Rangahau Hauora a Eru Pōmare)
Canterbury New Zealand
Māori non-Māori Māori non-Māori External causes
No. Rate
(95% CI) No.
Rate (95% CI)
Rate ratio (95% CI)
No. Rate
(95% CI) No.
Rate (95% CI)
Rate ratio (95% CI)
External causes 76 45.5 826 28.3 1.61 1,616 54.4 6,865 29.6 1.83 (36.3-57.1) (26.1-30.7) (1.26-2.04) (51.8-57.1) (28.8-30.5) (1.73-1.94)
Transport accidents 24 14.0 229 9.7 1.44 642 21.5 2,166 11.4 1.89 (9.4-20.9) (8.4-11.2) (0.94-2.21) (19.9-23.3) (10.9-12.0) (1.72-2.06)
Other causes of accidental injury 27 16.7 273 6.1 2.73 388 13 2,355 6.4 2.04 (11.5-24.5) (5.1-7.3) (1.79-4.15) (11.8-14.4) (6.0-6.8) (1.81-2.29)
Falls 4 2.3 167 1.8 1.28 82 2.7 1453 2 1.38 (0.9-6.3) (1.5-2.3) (0.47-3.51) (2.2-3.4) (1.8-2.1) (1.10-1.75)
Exposure to mechanical forces 3 2.0 17 0.7 2.78 46 1.5 135 0.6 2.44 (0.6-6.4) (0.4-1.2) (0.79-9.83) (1.1-2.0) (0.5-0.8) (1.72-3.46)
Drowning 5 3.0 16 1.0 3.15 83 2.8 215 1.3 2.15 (1.3-7.3) (0.5-1.7) (1.10-9.06) (2.3-3.5) (1.1-1.5) (1.65-2.79)
Accidental threats to breathing 4 2.5 18 0.9 2.68 56 1.9 127 0.8 2.48 (0.9-6.6) (0.5-1.7) (0.86-8.37) (1.5-2.5) (0.6-1.0) (1.76-3.49)
Fires 4 2.6 11 0.3 7.58 40 1.4 74 0.4 3.87 (1.0-6.9) (0.2-0.7) (2.26-25.43) (1.0-1.9) (0.3-0.5) (2.52-5.96)
Accidental poisoning 5 3.0 18 0.8 3.78 56 1.9 142 0.8 2.4 (1.2-7.2) (0.5-1.3) (1.39-10.29) (1.4-2.4) (0.7-0.9) (1.74-3.29)
Homicide * 1.4 15 0.6 2.33 109 3.6 175 1 3.52 (0.3-5.7) (0.3-1.0) (0.52-10.54) (3.0-4.4) (0.9-1.2) (2.74-4.52)
Note: Rates are calculated per 100,000 and are age-standardised to the 2001 Māori population * represents a number less than 3
Injury morbidity
Table 5.20 presents the number and rates of hospitalisation, by mechanism of injury, for
Canterbury and New Zealand aggregated for the period from 2001 to 2007. The rates are
calculated using the average of counts in the 2001 and 2006 Censuses as the
denominator, and are not adjusted or standardised. The rate of hospitalised injury for
Māori was lower than that for non-Māori, with a rate ratio of 0.73 (non-overlapping 95%
CIs for the rates). The rates were higher (with a statistically significant difference because
the 95% CIs of the rates did not overlap) for Māori for the following mechanisms of
injury: firearm (RR 2.80), struck by or against (RR 1.24), and unspecified (RR 1.42). The
rates were significantly lower (with non-overlapping 95% CIs for the rates) for the
following mechanisms of injury: falls (RR 0.46), other land transport (trains and others)
(RR 0.38), overexertion (RR 0.62), and poisoning (RR 0.81).

128
Canterbury Māori had significantly lower rates than Māori nationally for the following
mechanisms of injury: cut/pierce (RR 0.53), falls (RR 0.61), fire/hot object or substance
(RR 0.42), motor vehicle traffic (RR 0.55), natural/environmental (RR 0.70), other land
transport (RR 0.44), other specified (RR 0.70), pedal cyclist (RR 0.65), and struck by or
against (RR 0.60). The rates of injuries caused by firearms and other transport were
higher for Māori in Canterbury than nationally, but not significantly so. The rate of injury
overall (all types of injury) was significantly lower for Māori in Canterbury than nationally
(RR 0.64, non-overlapping 95% CIs for the rates).
Nationally, Māori had a higher rate of injury overall (all types of injury) than non-Māori
(RR 1.20, non-overlapping 95% CIs for the rates). Māori nationally had a higher rate of
injury than non-Māori and the disparity in rates between Māori and non-Māori was larger
at the national level than it was in Canterbury for all of the following mechanisms:
cut/pierce, fire/hot object or substance, machinery, motor vehicle traffic,
natural/environmental, other specified, pedal cyclist, pedestrian, poisoning, struck by or
against and suffocation.
Because these injury morbidity data are not age-standardised, several of the differences
described may be at least partly explained by the different age structure of the Māori and
non-Māori populations. For example, as falls are common in the elderly (Coggan,
Hooper et al. 2002), this may explain why the rate of hospitalisation for falls was much
lower in the more youthful Māori population.

129
Table 5.20 Injury morbidity, all ages, Canterbury and New Zealand, 2001-2007 (Source: Injury Prevention Research Unit)
Canterbury New Zealand
Māori non-Māori Māori non-Māori
Rate Rate Rate Rate Mechanism of injury
No. (95% CI)
No. (95% CI)
Rate ratio No.
(95% CI) No.
(95% CI)
Rate ratio
Adverse Effects 11 32.4 241 53.0 0.61 210 34.7 1,771 46.6 0.74 (17.9-58.4) (46.7-60.1) (30.3-39.7) (44.5-48.9)
Cut/Pierce 180 529.4 2,026 445.5 1.19 6,024 995.5 19,050 501.7 1.98 (457.5-612.7) (426.5-465.3) (970.7-1,201.0) (494.7-508.9)
Drowning * - 31 6.8 - 118 19.5 360 9.5 2.06 (4.8-9.7) (16.3-23.4) (8.6-10.5)
Fall 485 1,426.5 13,958 3,069.3 0.46 14,230 2,351.7 109,169 2,875.2 0.82 (1,305.0-1,559.2) (3,018.8-3120.7) (2,313.4-2,390.6) (2,858.2-2,892.3)
Fire/Hot object or substance 31 91.2 417 91.7 0.99 1,300 214.8 3,620 95.3 2.25 (64.1-129.6) (83.3-100.9) (203.5-226.8) (92.3-98.5)
Firearm 9 26.5 43 9.5 2.80 122 20.2 355 9.3 2.16 (13.8-50.9) (7.0-12.7) (16.9-24.1) (8.4-10.4)
Machinery 40 117.6 700 153.9 0.76 937 154.9 5,149 135.6 1.14 (86.3-160.4) (142.9-165.8) (145.2-165.1) (132.0-139.4)
Motor Vehicle Traffic 173 508.8 2,717 597.5 0.85 5,569 920.3 23,359 615.2 1.50 (438.4-590.6) (575.4-620.4) (896.5-944.8) (607.4-623.2)
Natural/Environmental 49 144.1 678 149.1 0.97 1,254 207.2 5,701 150.1 1.38 (108.9-190.7) (138.3-160.7) (196.1-219.0) (146.3-154.1)
Other Land Transport 33 97.1 1,149 252.7 0.38 1,350 223.1 10,488 276.2 0.81 (69.0-136.5) (238.5-267.7) (211.5-235.3) (271.0-281.6)
Other Specified 109 320.6 1,238 272.2 1.18 2,777 458.9 10,555 278.0 1.65 (265.7-386.8) (257.5-287.8) (442.2-476.3) (272.7-283.3)
Other Transport 13 38.2 140 30.8 1.24 163 26.9 1,614 42.5 0.63 (22.2-65.8) (26.1-36.3) (23.1-31.4) (40.5-44.6)
Overexertion 85 250.0 1,823 400.9 0.62 1,527 252.4 10,263 270.3 0.93 (202.1-309.2) (382.9-419.7) (240.0-265.3) (265.1-275.6)
Pedal Cyclist 41 120.6 791 173.9 0.69 1,126 186.1 6,026 158.7 1.17 (88.8-163.8) (162..2-186.5) (175.5-197.3) (154.8-162.8)
Pedestrian 9 26.5 129 28.4 0.93 300 49.6 1,047 27.6 1.80 (13.8-50.9) (23.9-33.7) (44.3-55.5) (26.0-29.3)
Poisoning 203 597.1 3,358 738.4 0.81 3,889 642.7 21,021 553.6 1.16 (520.3-685.1) (713.9-763.8) (622.8-663.2) (546.2-561.2)
Struck by or against 219 644.1 2,368 520.7 1.24 6,514 1,076.5 19,666 517.9 2.08 (564.2-735.3) (500.2-542.1) (1,050.7-1,103.0) (510.8-525.2)
Suffocation 11 32.4 122 26.8 1.21 244 40.3 900 23.7 1.70 (17.9-58.4) (22.5-32.0) (35.6-45.7) (22.2-25.3)
Unspecified 68 200.0 647 142.3 1.41 1,391 229.9 5,918 155.9 1.47 (157.7-253.7) (131.7-153.7) (218.1-242.3) (151.9-159.9)
Total 1,770 5,205.9 32,576 7,163.4 0.73 49,045 8,105.3 256,032 6,743.2 1.20 (4,968.9-5,454.1) (7,086.0-7,241.6) (8,033.9-8,177.3) (6,717.1-6769.4)
Note: Rates are calculated per 100,000 but are not age or sex standardised. Readmissions and admissions for which the length of stay was less than one day have been excluded. * represents a number less than 3

130
5.11 Oral health
Oral health status in children
Table 5.21 presents data on oral health in Canterbury and fluoridated and non-
fluoridated areas in New Zealand, reported by the School Dental Service, for 2007.
Canterbury is almost completely non-fluoridated, with only Methven and Burnham
Military Camp having fluoridated water supplies, and therefore data are not given for
fluoridated areas of Canterbury (Ashburton also had a fluoridated water supply in the
past, but this was stopped in 2002).
The mean dmft score16 and proportion of children who did not have caries (tooth decay)
for five year olds and Year 8 students (11 to 12 year olds) show that Māori children in
Canterbury had higher rates of decayed, missing or filled teeth and around half the rate
of being decay-free of non-Māori. The mean dmft scores and percent caries-free for
Māori children in Canterbury fell between the rates for Māori in New Zealand in
fluoridated and non-fluoridated areas. This suggests that while Māori children in
Canterbury had healthier teeth than Māori living in similarly non-fluoridated areas of
New Zealand, there would be potential to improve their oral health further if they had
access to fluoridated water supplies. 16 dmft is a score derived from the number of decayed, missing, or filled deciduous teeth
Key points
From 1996 to 2008:
• Māori children in Canterbury had worse oral health status than non-Māori in
Canterbury, and worse oral health status than Māori living in fluoridated areas of
New Zealand.
• Māori children in Canterbury had better oral health status than Māori living in
other non-fluoridated areas nationally.
From 2003 to 2008:
• The rates of hospitalisation for forceps extraction of teeth (all ages) and general
anaesthesia for dental procedures on children were higher for Māori in
Canterbury than non-Māori.

131
Table 5.21 Oral health status, 5 years and 11-12 years (Year 8), Canterbury and New Zealand, 2007 (Source: Ministry of Health, School Dental Service)
New Zealand Canterbury Fluoridated Non-fluoridated Indicator
Māori non-Māori Māori non-Māori Māori non-Māori
Mean dmft * 3.51 1.67 3.05 1.68 4.23 1.99 5 years old Percent caries-free (dmft = 0) 35.6% 60.5% 35.1% 58.7% 22.8% 57.8%
Mean DMFT * 2.41 1.49 1.93 1.14 2.63 1.55 Year 8
Percent caries-free (dmft = 0) 29.4% 60.5% 35.1% 55.3% 27.0% 44.8% * dmft is a score derived from the number of decayed, missing, or filled deciduous teeth; DMFT is a score derived from decayed, missing, or filled permanent teeth
Table 5.22 presents data regarding levels of severe tooth decay in Canterbury collected by
the School Dental Service for 2008. Both measures of severe early tooth decay indicate
that Māori in Canterbury were more than twice as likely to suffer from severe tooth
decay from a young age. The age of onset of this pattern of decay is usually under three
years old. Severe early tooth decay is associated with lack of access to fluoridated water,
less use of fluoride toothpaste, and consumption of sugary foods, in particular sweet
drinks.
Table 5.22 Severe early childhood dental decay, 5 years, Canterbury, 2008 (Source: CDHB School Dental Health Service)
Indicator Māori non-Māori
Percent with S-ECC * 15.0% 6.9%
Percent with dmft ≥ 6 ** 23.5% 9.4% * S-ECC (severe early childhood caries) is a marker of early and aggressive tooth decay and is defined here by having at least one deciduous maxillary incisor affected by decay ** dmft ≥ 6 at age 5 is the current American Academy of Pediatrics definition for S-ECC
Māori nationally are more likely to live in rural areas without reticulated water supplies
where fluoride is less likely to be available, making access to other forms of fluoride
important (Koopu and Keefe-Ormsby 2007). In Canterbury, Māori are more urban, with
only 11.7% of the Māori population living in rural areas17 compared to 14.9% of non-
Māori.
Figure 5.28 shows the rates of severe early childhood caries (measured by a dmft score
greater than six) over time from 1996 to 2008, indicating that there is a consistent
disparity between Māori and non-Māori in Canterbury. The rates for both Māori and 17 This is based on Statistics New Zealand’s 2006 Urban Area descriptor - a Census Area Unit with no
town / city in it is defined as rural.
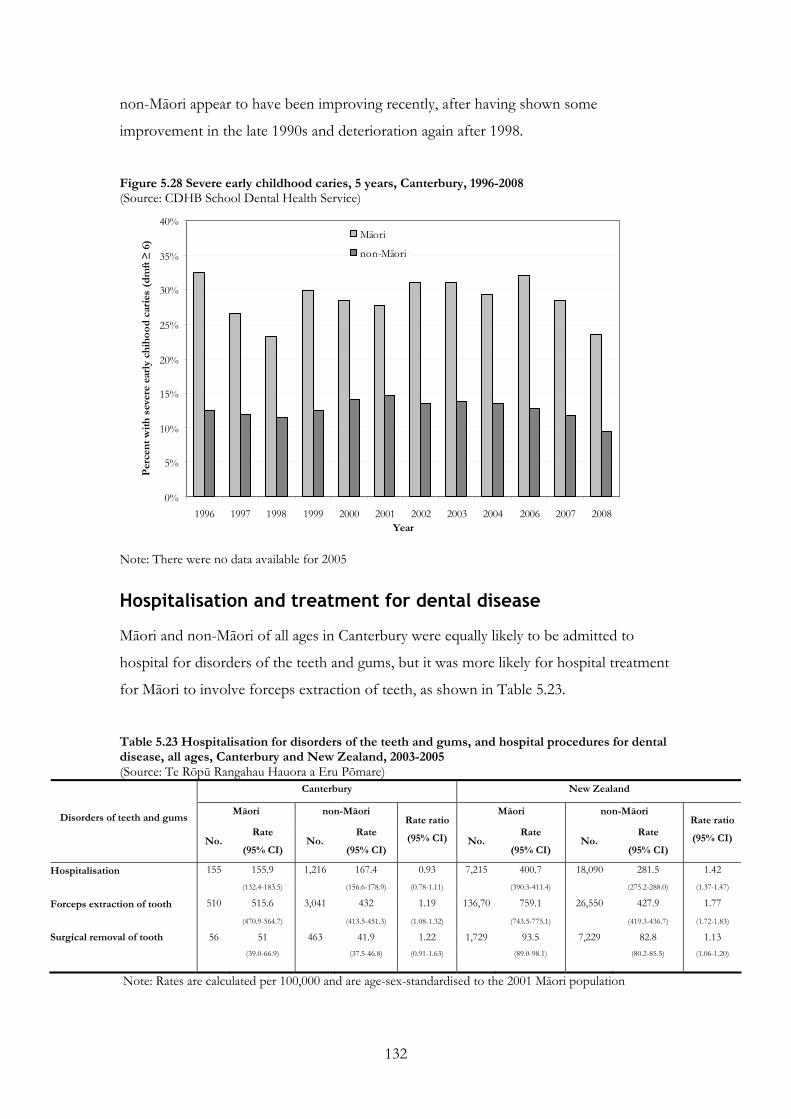
132
non-Māori appear to have been improving recently, after having shown some
improvement in the late 1990s and deterioration again after 1998.
Figure 5.28 Severe early childhood caries, 5 years, Canterbury, 1996-2008 (Source: CDHB School Dental Health Service)
0%
5%
10%
15%
20%
25%
30%
35%
40%
1996 1997 1998 1999 2000 2001 2002 2003 2004 2006 2007 2008Year
Per
cent
with
sev
ere
earl
y ch
ihoo
d ca
ries
(dm
ft ≥
6)
Māori
non-Māori
Note: There were no data available for 2005
Hospitalisation and treatment for dental disease
Māori and non-Māori of all ages in Canterbury were equally likely to be admitted to
hospital for disorders of the teeth and gums, but it was more likely for hospital treatment
for Māori to involve forceps extraction of teeth, as shown in Table 5.23.
Table 5.23 Hospitalisation for disorders of the teeth and gums, and hospital procedures for dental disease, all ages, Canterbury and New Zealand, 2003-2005 (Source: Te Rōpū Rangahau Hauora a Eru Pōmare)
Canterbury New Zealand
Māori non-Māori Māori non-Māori Disorders of teeth and gums
No. Rate
(95% CI) No.
Rate
(95% CI)
Rate ratio
(95% CI) No. Rate
(95% CI) No.
Rate
(95% CI)
Rate ratio
(95% CI)
Hospitalisation 155 155.9 1,216 167.4 0.93 7,215 400.7 18,090 281.5 1.42 (132.4-183.5) (156.6-178.9) (0.78-1.11) (390.3-411.4) (275.2-288.0) (1.37-1.47)
Forceps extraction of tooth 510 515.6 3,041 432 1.19 136,70 759.1 26,550 427.9 1.77
(470.9-564.7) (413.5-451.3) (1.08-1.32) (743.5-775.1) (419.3-436.7) (1.72-1.83)
Surgical removal of tooth 56 51 463 41.9 1.22 1,729 93.5 7,229 82.8 1.13 (39.0-66.9) (37.5-46.8) (0.91-1.63) (89.0-98.1) (80.2-85.5) (1.06-1.20)
Note: Rates are calculated per 100,000 and are age-sex-standardised to the 2001 Māori population

133
Table 5.24 presents the number of children under ten in Canterbury who had dental
treatment under anaesthesia from 2006 to 2008, and the age-standardised rate of such
treatment. This shows that Māori children were more likely to have a general anaesthetic
for management of dental problems (RR 1.22, non-overlapping 95% CIs for the rates).
Table 5.24 Dental treatment under general anaesthesia, 0-9 years, Canterbury, 2006-2008 (Source: CDHB Hospital Dental Service)
Māori non-Māori
No.
Rate
(95% CI) No.
Rate
(95% CI)
Rate ratio
240 253.0 1,266 207.1 1.22 Dental treatment under anaesthesia
(222.9-287.1) (196.0-218.9)
Note: Rates are calculated per 100,000 and are age-standardised to the 2001 Māori population
Table 5.25 presents the type of treatment done under general anaesthetic to children
under 14 years old. More Māori children having treatment under anaesthesia had
extractions, fillings, and root canal treatment than non-Māori, who were more often
having preventative treatment. This may indicate that Māori children were more likely to
be having a general anaesthetic because of severe disease rather than for the other main
indication, which is anxiety, or other reasons to manage dental problems under general
anaesthetic.
Table 5.25 Treatment done under general anaesthesia, 0-13 years, Canterbury, 2006-2008 (Source: CDHB Hospital Dental Service)
Māori non-Māori Indicator (% for ethnic group) (% for ethnic group)
Extraction 108 (43.4%) 523 (39.4%) Filling 118 (47.4%) 619 (46.6%) Prevention * 16 (6.4%) 155 (11.7%) Root canal 7 (2.8%) 32 (2.4%)
Total 249 1329 * Prevention includes fissure sealants and topical application of fluoride

134
5.12 Tamariki / Child and Rangatahi / Youth health
Key points
From 1996 to 2007:
• Māori in Canterbury had higher rates of preterm birth than European/Others.
From 2003 to 2005:
• Although the differences were not statistically significant, Māori appeared to have
a higher rate of low birthweight and a higher infant mortality rate than
European/Others.
From 2005 to 2008:
• Rates of breastfeeding were lower for Māori than for European/Others. There
was little or no improvement in breastfeeding rates for Māori in Canterbury
across the six-week, three-month and six-month age groups, and those rates fell
below national targets.
Collectively, these data may suggest a relationship between higher risk (preterm birth
and low birth weight) and lower protective (breastfeeding) factors for infants, and
worse outcomes in terms of infant mortality.
From 1996 to 2007:
• Māori children and young people in Canterbury had lower rates of admission for
upper respiratory tract infection, tonsillectomy, and gastroenteritis than
Europeans.
• Māori infants had a higher rate of admission for bronchiolitis than Europeans.
• The rate of admission for Māori children and young people compared to
Europeans was slightly higher for pneumonia and substantially higher for asthma,
particularly later in the period; the rates of admission for Māori and European
children and young people for severe skin infections did not differ.
From 2003 to 2007:
• There was a higher audiometry failure rate for Māori children than Others in
Canterbury, and the rate for Māori worsened over the period.
From 2000 to 2007:
• The rate of admission for grommets insertion was higher for Māori than
European children in Canterbury.

135
This sections presents data on child (0-14 years) and youth (15-24 years) health. It covers
data on early childhood health including: preterm birth; low birthweight and perinatal
and infant mortality; breastfeeding; and data on hospitalisations and other health
problems for children and young people.
Preterm birth
Preterm birth is defined as birth at less than 37 completed weeks of gestation. It can be
caused by a decision to electively deliver in the interests of maternal or foetal health, or
can occur spontaneously either with or without prior rupture of membranes. Preterm
birth, especially if it occurs before 34 weeks gestation, is a major cause of neonatal
mortality and long-term health consequences for children, including neurological,
developmental and respiratory problems (Goldenberg, Culhane et al. 2008). Māori
women have higher rates of preterm birth than other ethnic groups (Mantell, Craig et al.
2004).
Figure 5.29 shows preterm births as a proportion of all live births for the period from
1996 to 2007. It indicates that the rate of preterm birth for Māori in Canterbury,
although it fluctuated to some extent over the period, was higher than that for
Europeans. This was also the case nationally. The rate for Māori in Canterbury was
similar to the national rate for Māori, and the difference between Māori and European
rates was also similar in Canterbury and nationally.
Figure 5.29 Preterm birth, by ethnicity, Canterbury and New Zealand, 1996-2007 (Source: Craig, Anderson et al. 2008)
0%
1%
2%
3%
4%
5%
6%
7%
8%
9%
10%
1996-97 1998-99 2000-01 2002-03 2004-05 2006-07 1996-97 1998-99 2000-01 2002-03 2004-05 2006-07
Canterbury New Zealand
Per
cent
of l
ive
birt
hs
European Māori

136
Low birthweight, perinatal mortality and infant mortality
Table 5.26 presents data regarding low birthweight and perinatal and infant mortality in
the period from 2003 to 2005, for Canterbury and New Zealand.
Low birthweight is defined as birthweight less than 2,500 grams and results either from
preterm birth or intrauterine growth restriction. It is associated with worse foetal and
neonatal health, poorer growth and cognitive development in childhood, and potentially
with chronic diseases, such as type 2 diabetes and cardiovascular disease, later in life
(United Nations Children’s Fund and World Health Organization 2004). At the national
level, Māori have disproportionately high rates of low birth weight (New Zealand Health
Information Service 2007). Māori in Canterbury appeared to have a higher rate of low
birthweight than European/Others from 2003 to 2005, but this was not a significant
difference (RR 1.15, overlapping 95% CIs for the rates), although the difference that
existed between Māori and European/Others nationally was significant (RR 1.22, non-
overlapping 95% CIs for the rates).
Perinatal mortality is defined as death during the period from 20 weeks gestation to
seven days of age. It has been found to be higher in Māori than Europeans in New
Zealand (Perinatal and Maternal Mortality Review Committee 2009). In Canterbury, the
perinatal mortality rate for Māori from 2003 to 2005 was slightly lower than but not
significantly different from that for European/Others (RR 0.97, overlapping 95% CIs for
the rates).
Infant mortality measures deaths from birth to one year of age and has been found to be
higher for Māori than non-Māori nationally (Ministry of Health 2006; Robson and Purdie
2007). The rate for Māori in Canterbury from 2003 to 2005 was higher than for
European/Others, but this was not a significant difference (RR 1.11, overlapping 95%
CIs for the rates), although nationally the difference that existed (and was greater than in
Canterbury) between Māori and European/Others was significant (RR 1.67, non-
overlapping 95% CIs for the rates). The rate for Māori in Canterbury appeared to be
lower than for Māori nationally, but this was not a significant difference (RR 0.54,
overlapping 95% CIs for the rates).

137
Table 5.26 Low birthweight, perinatal mortality, and infant mortality, rates per 1,000 live births, Canterbury and New Zealand, 2003-05 (Source : HDIU)
Canterbury New Zealand
Indicator Māori Rate
(95% CI)
European/Other Rate
(95% CI) Rate ratio
Māori Rate
(95% CI)
European/Other Rate
(95% CI) Rate ratio
64.2 55.8 1.15 69.8 57.2 1.22 Low birth weight (55.2–74.2) (51.8–60.0) (67.4–72.1) (55.6–58.8)
9.8 10.1 0.97 9.7 9.5 1.02 Perinatal mortality (6.5–14.1) (8.4–11.9) (8.9–10.6) (8.9–10.1)
3.9 3.5 1.11 7.2 4.3 1.67 Infant mortality (1.9–6.9) (2.5–4.6) (6.5–8.0) (3.8–4.7)
Note: European/Other is non-Māori, non-Pacific, non-Asian
Breastfeeding
Exclusive breastfeeding is recommended for the first six months of life (World Health
Organisation 2002) and has positive effects including:
• For the child: optimal nutrition for infants (Ministry of Health 2008); protection
against infectious diseases (such as diarrhoea, respiratory infections, otitis media,
bacterial meningitis, urinary tract infection); reduced sudden infant death syndrome;
reduced rates of diabetes, asthma, overweight and obesity, high cholesterol, and some
cancers; and neuro-developmental benefits (American Academy of Pediatrics 2005).
• For the mother: improved recovery from birth (such as reduced post-partum
bleeding); decreased risk of breast and ovarian cancer; decreased risk of osteoporosis
and hip fracture later in life (American Academy of Pediatrics 2005); and other
emotional and psychosocial benefits (National Breastfeeding Advisory Committee
2008).
Rates of breastfeeding for Māori are lower than for non-Māori nationally. Barriers to
breastfeeding include poor initiation, perceived inadequate supply, maternal smoking,
lower socioeconomic status and educational attainment, need to return to work for
economic reasons, lack of workplace support, and lack of appropriate community
facilities (Ministry of Health 2002).
Figure 5.30 presents rates of exclusive/full breastfeeding at six weeks, three months, and
six months for Māori and European/Others in Canterbury and New Zealand in 2008

138
and shows lower rates for Māori at every age. The rates for Māori in Canterbury were
slightly higher at three and six months than national rates for Māori.
Figures 5.31, 5.32 and 5.33 present rates of exclusive/full breastfeeding in Canterbury
over the period from 2005/06 to 2008/09, for Māori and Others. They show that rates
did not improve substantially for Māori (or Others) for any age group, except possibly
for the three months’ time-point (for which only two years’ data are available). There
may have been deterioration in the rates of breastfeeding at six months for Māori over
the period. Rates for Māori also fell below breastfeeding targets set by the Ministry of
Health of 74% at 6 weeks, 57% at 3 months and 27% at 6 months (except for 2005/06).
Figure 5.30 Percent of Plunket babies fully / exclusively breastfed at 6 weeks, 3 months and 6 months, Canterbury and New Zealand, 2008 (Source: Craig, Anderson et al. 2008)
56.0%
45.3%
20.1%
56.8%
43.8%
17.9%
69.0%
56.2%
32.4%
69.3%
58.4%
29.1%
0%
10%
20%
30%
40%
50%
60%
70%
80%
<6 weeks 3 months 6 months <6 weeks 3 months 6 months
Canterbury New Zealand
Per
cent
exc
lusi
vely
/ fu
lly b
reas
tfed
Māori European/Other
Note: European/Other is non-Māori, non-Pacific, non-Asian

139
Figure 5.31 Proportion of Plunket babies fully or exclusively breastfed at six weeks, Canterbury, 2005-2009 (Source: Plunket)
60%
69%66% 67%
56%
69%
61%
69%
0%
10%
20%
30%
40%
50%
60%
70%
80%
90%
100%
Māori Other
Per
cent
05/06 06/07 07/08 08/09
Note: Other is non-Māori, non-Pacific
Figure 5.32 Proportion of Plunket babies fully or exclusively breastfed at three months, Canterbury, 2007-2009* (Source: Plunket)
45%
57%51%
58%
0%
10%
20%
30%
40%
50%
60%
70%
80%
90%
100%
Māori Other
Per
cent
05/06 06/07 07/08 08/09
*Note: Data for 2005/06 and 2006/07 were not available Other is non-Māori, non-Pacific

140
Figure 5.33 Proportion of Plunket babies fully or exclusively breastfed at six months, Canterbury, 2005-2009 (Source: Plunket)
27%33%
23%
40%
20%
32%
21%
31%
0%
10%
20%
30%
40%
50%
60%
70%
80%
90%
100%
Māori Other
Per
cent
05/06 06/07 07/08 08/09
Note: Other is non-Māori, non-Pacific
Hospitalisations
Figures 5.34 to 5.42 present admissions for various conditions or procedures in children
and young people.
Upper respiratory tract
Figure 5.34 presents upper respiratory tract infection (URTI) hospitalisations from 1996
to 2007 in Canterbury. Rates of URTI (both croup and other acute URTIs) admissions
were generally higher in Europeans than Māori, although there may have been some
convergence over the period from 2004/05, especially for acute URTI excluding croup.
Figure 5.35 presents rates of waiting list admission for tonsillectomy. The rates were
higher earlier in the period for Europeans than Māori, but the rates converged from
2002/03 onwards. The rate for Māori in Canterbury increased above the national rate for
Māori from 2004/05. The difference between the rates for Māori and Europeans was
greater nationally than in Canterbury.

141
Figure 5.34 Upper respiratory tract infection admissions 0-14 years, Canterbury, 1996-2007 (Source: Craig, Anderson et al. 2008)
0
1
2
3
4
5
6
7
8
9
1996-97 1998-99 2000-01 2002-03 2004-05 2006-07 1996-97 1998-99 2000-01 2002-03 2004-05 2006-07
Croup/Laryngitis/Tracheitis Acute URTI excluding Croup
Adm
issi
ons
per
1,00
0
European Māori
Figure 5.35 Waiting list admissions for tonsillectomy, 0-14 years, Canterbury and New Zealand, 1996-2007 (Source: Craig, Anderson et al. 2008)
0
1
1
2
2
3
3
4
4
5
5
1996-97 1998-99 2000-01 2002-03 2004-05 2006-07 1996-97 1998-99 2000-01 2002-03 2004-05 2006-07
Canterbury New Zealand
Ad
mis
sion
s p
er 1
,000
European Māori
Otitis media and hearing
Figure 5.36 presents otitis media acute and arranged admissions and waiting list
admissions for insertion of grommets (ventilation tubes placed in the ear drum to release
fluid in the middle ear and return hearing to normal) from 1996 to 2007. The rate of
otitis media admissions was very similar for Māori and Europeans in Canterbury. In
contrast, the rate of waiting list admissions for grommets was higher for Māori than for
Europeans from 2000/01 onwards. However, hearing tests at school entry by audiometry
show higher failure rates for Māori children than Others (non-Māori, non-Pacific) over

142
the period from 2003 to 2007, as shown in Figure 5.37. Audiometry failure rates for
Māori in Canterbury worsened over the period, while the rate for Others remained lower
and stable.
These data suggest that Māori have worse outcomes than Others for otitis media in
terms of hearing test failure rates. This is to some extent reflected in higher rates of
grommets insertion for Māori children. However, while the proportion of Māori children
failing hearing tests continued to increase up to 2007, the rate of grommets insertion for
Māori children declined, and the rate of admissions for otitis media was the same as for
Māori and European/Others. This suggests that the greater burden for Māori children
from otitis media and consequent hearing problems is an area of unmet need.
Figure 5.36 Otitis media admissions and grommets waiting list admissions, 0-14 years, Canterbury, 1996-2007 (Source: Craig, Anderson et al. 2008)
0
2
4
6
8
10
12
14
1996-97 1998-99 2000-01 2002-03 2004-05 2006-07
Ad
mis
sion
s pe
r 1,
000
Grommets European Grommets Māori
Otitis Media European Otitis Media Māori

143
Figure 5.37 Proportion of children failing school entry audiometry tests, 4 years, Canterbury, 2003-2007 (Source: Hearing and Vision Service, CDHB)
4.3% 4.5%
11.2%
6.8%
8.4%
8.6%
4.4% 4.6%
0%
2%
4%
6%
8%
10%
12%
14%
03/04 04/05 05/06 06/07 03/04 04/05 05/06 06/07
Māori Other
Per
cent
of c
hild
ren
faili
ng s
cho
ol e
ntry
hea
ring
test
s
Lower respiratory tract illness
Figure 5.38 shows that rates of hospitalisation for bronchiolitis for Māori children less
than one year old in Canterbury were slightly higher than for Europeans from 1996 to
2007. This is in contrast to the national picture, where rates for Māori were almost three
times those for Europeans. While the rate for Europeans in Canterbury was higher than
nationally, the rate for Māori was lower in Canterbury than nationally.
Figure 5.38 Bronchiolitis admissions, under-1 year olds, Canterbury and New Zealand, 1996-2007 (Source: Craig, Anderson et al. 2008)
0
20
40
60
80
100
120
140
1996-97 1998-99 2000-01 2002-03 2004-05 2006-07 1996-97 1998-99 2000-01 2002-03 2004-05 2006-07
Canterbury New Zealand
Ad
mis
sion
s p
er 1
,000
European Māori

144
Figure 5.39 presents admissions for viral or bacterial pneumonia in children and young
people, and shows that while rates for Māori and Europeans in Canterbury were similar
over the period from 1996 to 2007, there was a large disparity in hospitalisation rates
nationally. Rates for Māori in Canterbury were much lower than those for Māori
nationally, and appeared to have reduced over the period in a similar pattern to the rates
for Europeans. The differences in rates between Māori and European children and
young people reflected the picture for all ages as presented in section 5.6 Respiratory
disease.
Figure 5.39 Pneumonia admissions, 0-24 years, Canterbury and New Zealand, 1996-2007 (Source: Craig, Anderson et al. 2008)
0.0
0.5
1.0
1.5
2.0
2.5
3.0
3.5
4.0
4.5
5.0
1996-97 1998-99 2000-01 2002-03 2004-05 2006-07 1996-97 1998-99 2000-01 2002-03 2004-05 2006-07
Canterbury New Zealand
Ad
mis
sio
ns p
er 1
,000
European Māori
Figure 5.40 presents admissions for asthma in children and young people from 1996 to
2007. It shows that while the rates in Canterbury for both Māori and Europeans
decreased over the period, the rate for Māori decreased less than that for Europeans. The
effect was that the difference in rates grew from a similar rate of admission for Māori
and non-Māori in 1996/97 to a rate about 70% higher for Māori for 2006/07. Over the
same period, the difference between the rates for Māori and Europeans nationally started
larger than that in Canterbury and grew to around two and a half times higher for Māori
than Europeans.

145
Figure 5.40 Asthma admissions, 0-24 years, Canterbury and New Zealand, 1996-2007 (Source: Craig, Anderson et al. 2008)
0
1
2
3
4
5
6
7
8
1996-97 1998-99 2000-01 2002-03 2004-05 2006-07 1996-97 1998-99 2000-01 2002-03 2004-05 2006-07
Canterbury New Zealand
Adm
issi
ons
per
1,0
00
European Māori
Skin infections
Figure 5.41 presents admissions for serious skin infections (cellulitis and abscesses) in
children and young people from 1996 to 2007. The lack of a difference in the rates for
Māori and Europeans in Canterbury was in contrast to the significant difference
nationally, where the rate for Māori was more than double that for Europeans over the
period.
Figure 5.41 Severe skin infection admissions, 0-24 years, Canterbury and New Zealand, 1996-2007 (Source: Craig, Anderson et al. 2008)
0
1
2
3
4
5
6
1996-97 1998-99 2000-01 2002-03 2004-05 2006-07 1996-97 1998-99 2000-01 2002-03 2004-05 2006-07
Canterbury New Zealand
Adm
issi
ons
per
1,0
00
European Māori

146
Gastroenteritis
Figure 5.42 presents admissions for gastroenteritis (viral, bacterial, and parasitic) for
children and young people, and shows that rates for Māori were lower than those for
Europeans, although they rose sharply in 2006/07. The rates for Māori in Canterbury
were generally lower than those for Māori nationally over the period from 1996 to 2007.
The rate for Māori nationally rose over the period, but the rate for Māori in Canterbury
rose more quickly than for Māori nationally in 2006/07.
Figure 5.42 Gastroenteritis admissions, 0-24 years, Canterbury and New Zealand, 1996-2007 (Source: Craig, Anderson et al. 2008)
0.0
0.5
1.0
1.5
2.0
2.5
3.0
3.5
4.0
4.5
5.0
1996-97 1998-99 2000-01 2002-03 2004-05 2006-07 1996-97 1998-99 2000-01 2002-03 2004-05 2006-07
Canterbury New Zealand
Adm
issi
ons
per
1,00
0
European Māori

147
5.13 Sexual and reproductive health
This section presents data on hospitalisation and procedures done during childbirth, and
examines teenage pregnancy and sexually transmitted infection.
Hospitalisations for pregnancy-related conditions
In the period from 2003 to 2005 there were 27,713 admissions for pregnancy, childbirth
and puerperium in Canterbury, or around 9,240 per annum. Of these, 2,586 admissions
were for Māori and 25,127 for non-Māori, meaning that Māori admissions for pregnancy
and childbirth represented 9.3% of the total. This compares to 2,860 live births among
Māori and 14,892 among non-Māori from 2003 to 2005 (as presented in Table 2.4 in
Chapter 2 Demographic profile) making the proportion of live births among Māori
16.1% of the total. Combining the data for admissions and live births, there were 0.90
admissions for Māori in Canterbury for each live birth and 1.69 admissions for non-
Māori per live birth.
This suggests that although admissions for pregnancy, childbirth and puerperium were
more common for Māori in Canterbury than non-Māori (RR 1.13, 95% CI 1.09-1.18) the
rate of admission per pregnancy was lower, i.e. Māori were over-represented among
births but under-represented among admissions. The reasons for this difference between
Key points
• From 2003 to 2005, the rate of hospitalisation per live birth was lower for Māori
than for non-Māori in Canterbury.
• From 1999 to 2008, the rate of manual deliveries was higher for Māori in
Canterbury than for non-Māori, but the rates of procedures related to delivery –
for example, caesarean section (emergency and elective), most inductions,
vacuum and forceps extractions – were lower for Māori.
• From 1996 to 2007, the rate of teenage pregnancy was three to four times higher
for Māori than for Europeans in Canterbury.
• In 2007 and 2008, attendance at sexual health, family planning and student and
youth clinics was higher for Māori than Europeans for chlamydia and
gonorrhoea , but lower for non-specific urethritis.

148
Māori and non-Māori are likely to be multifactorial, but may include differential access to
services, differences in risk necessitating admission or differences in clinical factors such
as parity.
Birth procedures
Rates of obstetric intervention differ between Māori and non-Māori, including lower
rates of induction and operative vaginal delivery (Sadler, McCowan et al. 2002), and
caesarean section (Harris, Robson et al. 2007).
Table 5.27 presents data on hospital procedures associated with birth, aggregated for the
ten years from 1999 to 2008 and age-standardised to the 2001 Māori population, for
Canterbury and New Zealand. These data have not been adjusted for factors other than
age, such as parity or maternal risk factors.
The rate of manually assisted deliveries (births requiring assistance but not further
intervention) was significantly higher for Māori in Canterbury than for non-Māori (RR
1.14, non-overlapping 95% CIs for the rates), although the rate in Māori women in
Canterbury was significantly lower than nationally (RR 0.59, non-overlapping 95% CIs
for the rates ). The rate of emergency caesarean sections was significantly lower for
Māori in Canterbury than non-Māori (RR 0.71, non-overlapping 95% CIs for the rates),
but there was a larger difference between Māori and non-Māori in Canterbury for
elective caesarean sections (RR 0.59, non-overlapping 95% CIs for the rates). The rate of
emergency caesarean sections for Māori in Canterbury was also lower than for Māori
nationally (RR 0.74, non-overlapping 95% CIs for the rates), for whom the rate was
closer to, but still significantly lower than, that for non-Māori nationally (RR 0.95, non-
overlapping 95% CIs for the rates).
For elective caesarean sections, the rates for Māori in Canterbury and nationally were
almost the same (RR 1.00, overlapping 95% CIs for the rates), but the rate for non-Māori
in Canterbury was considerably higher than the non-Māori rate nationally. This resulted
in a greater difference between Māori and non-Māori in Canterbury (RR 0.59, non-
overlapping 95% CIs for the rates) than in New Zealand as a whole (RR 0.76, non-
overlapping 95% CIs for the rates).

149
Several other procedures were significantly less common (RR lower than 1 and non-
overlapping 95% CIs for the rates) among Māori than non-Māori in Canterbury,
including the following procedures:
• several methods of induction of labour (prostaglandin or cervagem induction: RR
0.88; induction by artificial rupture of membranes: RR 0.81; other medical induction:
RR 0.80);
• episiotomy (RR 0.46);
• methods of instrumentally assisting delivery such as vacuum extraction (RR 0.52) and
forceps (mid forceps operation: RR 0.65; low forceps operation: RR 0.61);
• manual rotation of the foetal head (RR 0.57).
There were no statistically significant differences (overlapping 95% CIs for the rates)
between the rates for Māori and non-Māori in Canterbury for the following procedures:
• artificial rupture of membranes (RR 1.02, overlapping 95% CIs for the rates);
• partial breech extraction (RR 1.59, overlapping 95% CIs for the rates);
• syntocinon induction (RR 1.14, overlapping 95% CIs for the rates).
Overall, after age has been taken into account, Māori were less likely than non-Māori to
have interventions during childbirth once they were in hospital. Nationally, Māori
women have been found to be significantly less likely than non-Māori to have a
Caesarean section, and this persists after controlling for age, deprivation and various
clinical factors (including parity, fetal presentation and gestation, multiple birth, maternal
hypertension and diabetes, and antepartum haemorrhage, but excluding maternal weight
or other co-morbidities, smoking, lead maternity carer type and baby’s birthweight)
(Harris, Robson et al. 2007). The potential sources of differences in rates of Caesarean
section, and possibly other interventions, include: differential distribution of the wider
determinants of health that affect individuals’ risk and access to care and information;
factors such as the structural influences of the healthcare system; provider practices and
interactions with patients; and differential management (Harris, Robson et al. 2007).

150
Table 5.27 Procedures associated with birth, females, Canterbury and New Zealand, 1999-2008 (Source: Ministry of Health, Information Directorate)
Canterbury New Zealand
Māori non-Māori Māori non-Māori Birth procedures
No. Rate
(95% CI) No.
Rate (95% CI)
Rate ratio No.
Rate (95% CI)
No. Rate
(95% CI)
Rate ratio
Manually assisted delivery 3,047 1,925.1 30,338 1,693.4 1.14 87,884 3,271.5 288,386 1,977.2 1.65 (1,857.2-1,994.7) (1,693.4-1,712.7) (3,249.9-3293.3) (1,969.9-1,984.5)
Artificial rupture of membranes 1,084 679.1 11,897 667.0 1.02 31,736 1,177.9 109,900 758.7 1.55 (639.2-720.8) (654.9-679.2) (1,165.0-191.0) (754.2-763.2)
Emergency lower segment caesarean section 500 315.3 8,048 441.7 0.71 11,544 427.9 67,237 449.3 0.95 (288.2-344.2) (432.0-451.6) (420.2-435.8) (445.8-452.7)
Prostaglandin or cervagem induction 432 272.6 6,098 338.8 0.80 7,140 265.0 37,959 256.9 1.03 (247.5-299.6) (330.2-347.5) (258.9-271.2) (254.3-259.5)
371 235.9 5,284 291.5 0.81 9,542 354.8 50,194 337.2 1.05 Induction of labour by artificial rupture of membranes (212.5-261.2) (283.6-299.5) (347.7-362.0) (334.2-340.1)
Elective lower segment caesarean section 328 211.0 6,837 358.5 0.59 5,652 212.0 44,134 280.7 0.76 (188.8-235.2) (350.0-367.2) (206.5-217.6) (278.0-83.3)
Episiotomy 334 208.2 8,065 449.3 0.46 4,814 176.8 51,975 354.8 0.50 (186.4-231.8) (439.5-459.4) (171.8-181.9) (351.8-357.9)
Vacuum extraction 256 159.5 5,458 305.8 0.52 3,999 147.3 32,754 223.3 0.66 (140.5-180.3) (297.6-314.1) (142.8-152.0) (220.8-225.7)
Other medical induction 199 124.9 2,780 155.2 0.80 5,433 201.2 30,899 210.2 0.96 (108.1-143.5) (149.4-161.1) (195.9-206.6) (207.8-212.6)
Mid forceps operation 126 79.0 2,171 121.4 0.65 943 34.8 9,588 64.7 0.54 (65.8-94.1) (116.3-126.7) (32.6-37.1) (63.4-66.1)
Low forceps operation 31 19.1 547 31.4 0.61 911 33.5 7,369 50.2 0.67 (13.0-27.2) (28.2-34.2) (31.4-35.8) (49.0-51.3)
Partial breech extraction 23 14.7 169 9.3 1.59 293 10.9 1,183 7.9 1.38 (9.3-22.1) (7.9-10.8) (9.7-12.3) (7.5-8.4)
Syntocinon induction 22 13.7 218 12.0 1.14 1,777 66.0 7,725 51.9 1.27 (8.6-20.8) (10.4-13.7) (63.0-69.2) (50.8-53.1)
Manual rotation of foetal head 22 13.7 429 23.8 0.57 233 8.6 2,358 15.8 0.55 (8.5-20.7) (21.6-26.2) (7.5-98) (15.1-16.4)
Note: Rates are calculated per 100,000 women and age-standardised to the 2001 Māori population. More than one procedure could have been performed for each birth, and therefore there are more procedures than the total number of births.

151
Teenage births
Figure 5.43 presents births in 15 to 19 year olds, and shows rates for Māori in Canterbury
were three to four times higher than for Europeans over the period from 1996 to 2007.
The rate for Māori nationally was four and a half to five times higher than the European
rate. The rate for Europeans nationally was similar to that in Canterbury.
Figure 5.43 Births to teenagers, females, 15-19 years, Canterbury and New Zealand, 1996-2007 (Source: Craig, Anderson et al. 2008)
0
10
20
30
40
50
60
70
80
90
100
1996-97 1998-99 2000-01 2002-03 2004-05 2006-07 1996-97 1998-99 2000-01 2002-03 2004-05 2006-07
Canterbury New Zealand
Bir
ths
per
1,00
0 w
omen
15-
19 y
ears
European Māori
Sexually transmitted infections
The Institute of Environmental Science and Research (ESR) conduct surveillance of
sexually transmitted infections (STIs) by collecting data from sexual health clinics, family
planning clinics, and student and youth health clinics, based on voluntary reporting. In
Canterbury there are sexual health clinics in Christchurch and Ashburton, and several
family planning clinics (Christchurch, Hornby, Rangiora and Ashburton) and student and
youth health clinics (the 198 Youth Health Centre in Christchurch, Canterbury and
Lincoln Universities, and CPIT). Comparisons by ethnicity must be made with caution
as attendance at these clinics may be different for different age and ethnic groups, the
clinics have no specific catchment areas, and other health providers such as general
practitioners also diagnose and treat STIs. In addition, the denominator used in
calculating disease rates for this method of surveillance is the total number of clinic visits,
which may not necessarily be for STIs, rather than a population based figure.

152
ESR also collects data from laboratories on specimens taken to diagnose STIs, but the
coverage of this data collection is only complete in parts of the North Island.
Table 5.28 presents the data for STIs collected in Canterbury. The rates for Māori
appeared higher for chlamydia and gonorrhoea and lower for non-specific urethritis.
Table 5.28 Sexually transmitted infection, all ages, Canterbury Sexual Health, Family Planning and Student and Youth Health Clinics, 2007-2008 (Source: Institute of Environmental Science and Research Limited)
Total no. cases 2007-2008 Rate per 100 visits Sexually Transmitted Infection Māori European Māori European
Chlamydia 202 1,174 3.8 1.9 Gonorrhoea 34 176 0.6 0.3 Genital Herpes 22 217 0.4 0.3 Genital Warts 73 764 1.4 1.2
Non specific urethritis (males only) 8 147 0.6 1.1 Note: Rate per 100 visits = (total no. cases/total no. clinic visits) x 100. Chlamydia and gonorrhoea are confirmed cases; genital herpes and genital warts are first presentations only.

153
5.14 Kaumatua / Older persons’ health
Facility use
Table 5.29 presents the number and proportion of older people resident in various
facilities. The percentages have not been age or sex standardised. The small proportion
of Māori in facility-based care compared to non-Māori was contributed to by the small
proportion of the Māori population remaining alive at this age (typically over 65 years)
and potentially by older Māori being cared for by whānau rather than being in facilities. If
all those in facilities are over 65 years then the proportion of Māori in that age group
being cared for in facilities (using the number of Māori over 65 years at the Census 2006
as the denominator) was 3.4% (36/1,074). For non-Māori, the proportion of people of
65 years in facility-based care was 6.2% (3,814/61,617).
A higher proportion of older Māori in dementia care (over other types of care) may
reflect the difficulty of caring for people with dementia in the community, although this
is not supported by the absence of Māori in psychogeriatric care.
Table 5.29 Facility use by older people, Canterbury, 2009 (Source: CDHB Planning and Funding)
Māori non-Māori Facility (% of total people) (% of total people)
Rest home care 12 (0.6%) 1,851 (99.4%) Dementia care 10 (1.9%) 527 (98.1%) Hospital level care 14 (1.1%) 1,288 (98.9%) Psychogeriatric care 0 148 (100%)
Total 36 (0.9%) 3,814 (99.1%) Note: Rates have not been age or sex standardised
Key points
• A lower proportion of Māori (and of Māori over 65 years) in Canterbury was in
aged care facilities.

154

155
6 Health Service Utilisation
6.1 Primary health care
General practitioner utilisation
Table 6.1 presents data about the use of general practitioner (GP) services from the
NZHS 2006/07. The prevalence of having visited a GP in the previous 12 months
appeared to be lower for Māori than European/Others in Canterbury, but this was not a
significant difference (overlapping 95% CIs for the rates). The prevalence of having
visited a GP in the previous 12 months among respondents (aged 16 years and over) in
Mō Tātou, a Ngāi Tahu survey (Ahuriri-Driscoll, Cram et al. 2004), was 83.2% in
2003/04. The prevalence was 79.2% for males and 86.7% for females. These prevalence
rates were higher than the prevalence for all Māori in Canterbury from the NZHS,
although the Mō Tātou rates were not age-standardised. The prevalence for Ngāi Tahu
from Mō Tātou more closely approximates the rates for European/Others in the NZHS.
Key points
In 2006/07:
• Māori were significantly more likely than European/Others to have had an unmet
need for a general practitioner.
Between 2005 and the beginning of 2009, in non-age-standardised analyses:
• PHO enrolment was lower for Māori in Canterbury than for Others.
• Māori in Canterbury were under-represented in hospital activity including bed
days, discharges and average length of stay.
• Spending per capita on prescriptions and laboratory testing was lower for Māori
than for Others.
• These data are at odds with the higher burden of disease carried by Māori, as
described in Chapter 5 Health Status.

156
Māori in Canterbury were significantly more likely than non-Māori to have had an unmet
need for a GP18, as shown in Table 6.1. The difference between Māori and
European/Others in the prevalence of unmet need for a GP was higher for women (for
whom it was a statistically significant difference) than it was for men (for whom the
difference was not significant).
Table 6.1 Prevalence of visiting a GP and unmet need for a GP in previous 12 months, 15+ years, Canterbury and New Zealand, 2006/07 (Source: HDIU/New Zealand Health Survey 2006/07)
Canterbury New Zealand
Indicator
Māori Rate
(95% CI)
European/Other Rate
(95% CI)
Māori Rate
(95% CI)
European/Other Rate
(95% CI)
79.5 83.2 77.9 81.6 Total
(75.6–83.0) (79.8–86.2) (75.5–80.1) (80.0–83.0)
75.0 79.6 73.5 78.1 Male
(70.5–79.2) (76.0–82.9) (70.1–76.7) (76.1–80.0)
83.3 86.5 81.7 84.8
Visit to GP in last 12 months
Female (79.3–86.9) (82.9–89.6) (79.1–84.1) (83.1–86.4)
7.8 3.6 13.0 6.0 Total
(5.8–10.2) (2.2–5.6) (11.4–14.7) (5.2–6.9)
5.7 3.2 9.6 5.3 Male
(3.4–8.9) (1.7–5.3) (7.5–12.0) (4.4–6.4)
9.6 4.0 16.0 6.6
Unmet need for GP in past 12 months
Female (7.0–12.6) (2.5–6.0) (13.7–18.5) (5.7–7.6)
Note: Rates are age-standardised (using the WHO population) prevalence rates for adults aged over 15 years. European/Other are non-Māori, non-Pacific, non-Asian.
Nationally, according to the NZHS, Māori were significantly more likely than the total
population to have given cost as the reason for an unmet need for a GP. This was
despite Māori being significantly more likely than the total population to report that their
last GP visit was free (Ministry of Health 2008). If this national picture is reflected for
Maori in Canterbury, then the cost of attending a GP appointment may be one of the
barriers for Māori obtaining primary health care. Other reasons may include indirect cost
barriers such as having to take time off work and the cost of transport, and the cultural
appropriateness of care (Ministry of Health 1999; Baxter 2002; Ellison-Loschmann and
Pearce 2006).
18 Unmet need for a GP meant that the person needed to see a GP in the previous 12 months but was
unable to for any reason.

157
PHO enrolment
The five Primary Health Organisations (PHOs) in Canterbury are:
• Canterbury Community PHO
• Christchurch PHO
• Hurunui Kaikoura PHO
• Partnership Health Canterbury - Te Kei o Te Waka PHO
• Rural Canterbury PHO
All PHOs have had a Māori Health Plan agreed with CDHB since 2007/08 (three have
had them from 2006/07). Each PHO has a Whānau Ora programme aimed at
management of chronic conditions among Māori, with tagged additional services funding
from CDHB.
Figure 6.1 presents the proportion of Māori and Others (non-Māori, non-Pacific) who
were enrolled with a PHO in Canterbury over the period 2005/06 to the first nine
months of 2008/09. It shows that Māori enrolment was lower than that for Others, and
there was a slight improvement in Māori enrolment over the period. The denominators
used for each ethnic group were based on Ministry of Health estimates and in 2005/06
were based on the 2001 Census figure, whereas from 2006/07 onwards they were based
on the 2006 Census. This may explain the small drop in the proportion enrolled for
Māori and Others from 2005/06 to 2006/07.

158
Figure 6.1 Enrolment with a PHO, all ages, Canterbury, 2005-2009
(Source: CDHB Planning and Funding / PHO enrolment registers)
72.0%75.5%
95.6% 96.8%
73.5% 74.3%
94.8% 97.5%
0%
10%
20%
30%
40%
50%
60%
70%
80%
90%
100%
05/06 06/07 07/08 08/09 (9m) 05/06 06/07 07/08 08/09 (9m)
Māori Other
Per
cent
en
rolle
d w
ith P
HO
Note: Population estimates are made by the Ministry of Health. In 2005/06 the estimated population was based on the 2001 Census and from 2006/07 onwards it was based on the 2006 Census. Others are non-Māori, non-Pacific.
6.2 Canterbury District Health Board
Hospital activity
Figure 6.2 presents the proportion of hospital activity for Māori over the period from
2005/06 to the first nine months of 2008/09. The proportions of discharges, case
weighted discharges and bed days that were for Māori are presented. These can be
compared to the estimated proportion of the population identifying as Māori, which is
also shown. Definitions for the types of hospital activity shown are as follows:
• Discharges: the number of discharges from hospital for each period;
• Case-weighted discharges: the number of discharges adjusted to take into account
the relative complexity of the treatment during an admission (for example, an
admission involving a hip operation will have a higher case-weight than one
involving a cataract operation);
• Bed days are the number of days of admission.

159
Each of these types of activity is shown for Māori as a percentage of the total for all
ethnicities. These data are not adjusted for age, sex or other aspects such as
socioeconomic status or clinical factors.
Figure 6.2 shows Māori are under-represented in each of the indicators of hospital
activity. For example, in 2007/08 the proportion of the population identifying as Māori
was 7.7%, but the proportion of discharges for Māori was 6.7%, case-weighted
discharges 5.9%, and bed days 5.7%. As the probability of admission to hospital
increases with age, and similarly the complexity and duration of admission are likely to be
higher with increasing age, the more youthful age distribution of the Māori population
may explain some of this apparent under-representation in hospital activity for Māori.
Figure 6.2 Hospital activity, Māori as percentage of total, all ages, Canterbury, 2005-2009
(Source: Planning and Funding, CDHB)
0%
1%
2%
3%
4%
5%
6%
7%
8%
9%
10%
05/06 06/07 07/08 08/09 (9m)
Per
cent
Proportion of population
Discharges
Case weighted discharges
Bed days
Note: Population estimates are made by the Ministry of Health. In 2005/06 the estimated population was based on the 2001 Census and from 2006/07 onwards it was based on the 2006 Census.
Figure 6.3 presents the average length of stay in hospital for admissions for Māori and
Others over the period from 2005/06 to the first nine months of 2008/09. These data
are not adjusted for age, sex or other aspects such as socioeconomic status or clinical
factors. Figure 6.3 shows that both Māori and Others on average had declining lengths of
stay in hospital over the period and that Māori had shorter lengths of stay than Others,

160
although the difference between Māori and Others decreased from 0.7 days in 2005/06
to 0.4 days in the first nine months of the 2008/09 year.
Figure 6.3 Average length of stay in hospital, all ages, Canterbury, 2005-2009
(Source: Planning and Funding, CDHB)
2.62.5
3.3
3.0
2.62.4
3.1
2.8
0.0
0.5
1.0
1.5
2.0
2.5
3.0
3.5
4.0
05/06 06/07 07/08 08/09 (9m) 05/06 06/07 07/08 08/09 (9m)
Maori Other
Ave
rage
leng
th o
f sta
y (d
ays)
Note: Population estimates are made by the Ministry of Health. In 2005/06 the estimated population was based on the 2001 Census and from 2006/07 onwards it was based on the 2006 Census. Others are non-Māori, non-Pacific.
Presentations to emergency department
Figures 6.4 and 6.5 present activity in the emergency department (ED), with the
proportion of those attending ED who were admitted and the proportion of those
attending ED who waited less than four hours, respectively, over the period from
2005/06 to the first nine months of the 2008/09 year. These data have not been adjusted
for age, sex or other clinical or socioeconomic factors.
A lower proportion of Māori were admitted from ED over the period and a higher
proportion waited less than four hours.
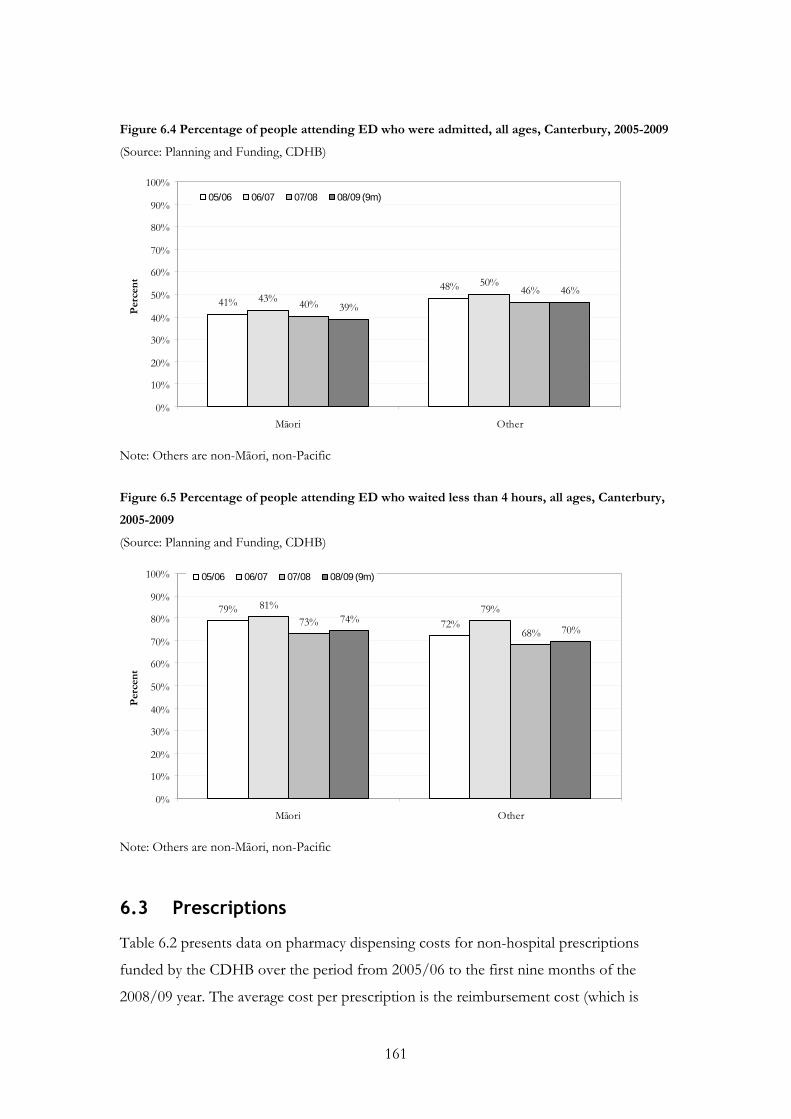
161
Figure 6.4 Percentage of people attending ED who were admitted, all ages, Canterbury, 2005-2009
(Source: Planning and Funding, CDHB)
41%48%
43%50%
40%46%
39%46%
0%
10%
20%
30%
40%
50%
60%
70%
80%
90%
100%
Māori Other
Per
cent
05/06 06/07 07/08 08/09 (9m)
Note: Others are non-Māori, non-Pacific Figure 6.5 Percentage of people attending ED who waited less than 4 hours, all ages, Canterbury,
2005-2009
(Source: Planning and Funding, CDHB)
79%72%
81% 79%73%
68%74%
70%
0%
10%
20%
30%
40%
50%
60%
70%
80%
90%
100%
Māori Other
Per
cent
05/06 06/07 07/08 08/09 (9m)
Note: Others are non-Māori, non-Pacific
6.3 Prescriptions
Table 6.2 presents data on pharmacy dispensing costs for non-hospital prescriptions
funded by the CDHB over the period from 2005/06 to the first nine months of the
2008/09 year. The average cost per prescription is the reimbursement cost (which is

162
exclusive of GST) divided by the number of prescriptions. The cost per capita is the
reimbursement cost divided by the estimated population for each ethnic group. These
data have not been adjusted for age, sex or other clinical or socioeconomic factors.
The average cost per prescription is slightly higher for Māori over the period, while the
cost per capita was substantially lower for Māori compared to Others. The cost per
prescription and cost per capita rose overall over the period for both Māori and Others.
The relative increase in cost per capita was higher for Māori (98% increase) compared to
Others (45% increase). These data indicate that the gap in prescription spending between
Māori and Others has decreased.
These data suggest that Māori received fewer prescriptions than Others. Those
prescriptions they do receive are of a similar cost. This is despite the higher disease
burden carried by Māori as detailed in Chapter 5 Health Status. Nationally, it has been
found that while the average number of prescription items was higher for Māori than for
non-Māori, there was differential prescribing of drugs for some conditions. For example,
for patients with COPD, fewer Māori than non-Maori received a prescription for a
respiratory drug (Crengle, Lay-Yee et al. 2005).
Table 6.2 Dispensing through non-hospital pharmacies, all ages, Canterbury, 2005-2009
(Source: Planning and Funding, CDHB)
Year Ethnic group Number of
prescriptions Reimbursement
cost
Average cost per
prescription
Cost per capita
2005/06 Māori 89,552 $2,874,633 $32.10 $83.26 Other 2,808,518 $87,577,882 $31.18 $203.34 2006/07 Māori 111,857 $3,749,459 $33.52 $108.60 Other 3,390,019 $103,054,710 $30.40 $239.27 2007/08 Māori 133,703 $4,439,911 $33.21 $128.60 Other 3,731,842 $109,324,952 $29.30 $253.83 2008/09 (9m) Māori 120,878 $4,271,327 $35.34 $164.96
Other 2,944,645 $94,971,612 $32.25 $294.00
Note: Population estimates are made by the Ministry of Health. In 2005/06 the estimated population was based on the 2001 Census and from 2006/07 onwards it was based on the 2006 Census. Others are non-Māori, non-Pacific.
6.4 Laboratory tests
Table 6.3 presents cost data for laboratory tests included on the laboratory schedule that
were funded by CDHB and done by Canterbury Health Laboratories, Medlab South, and
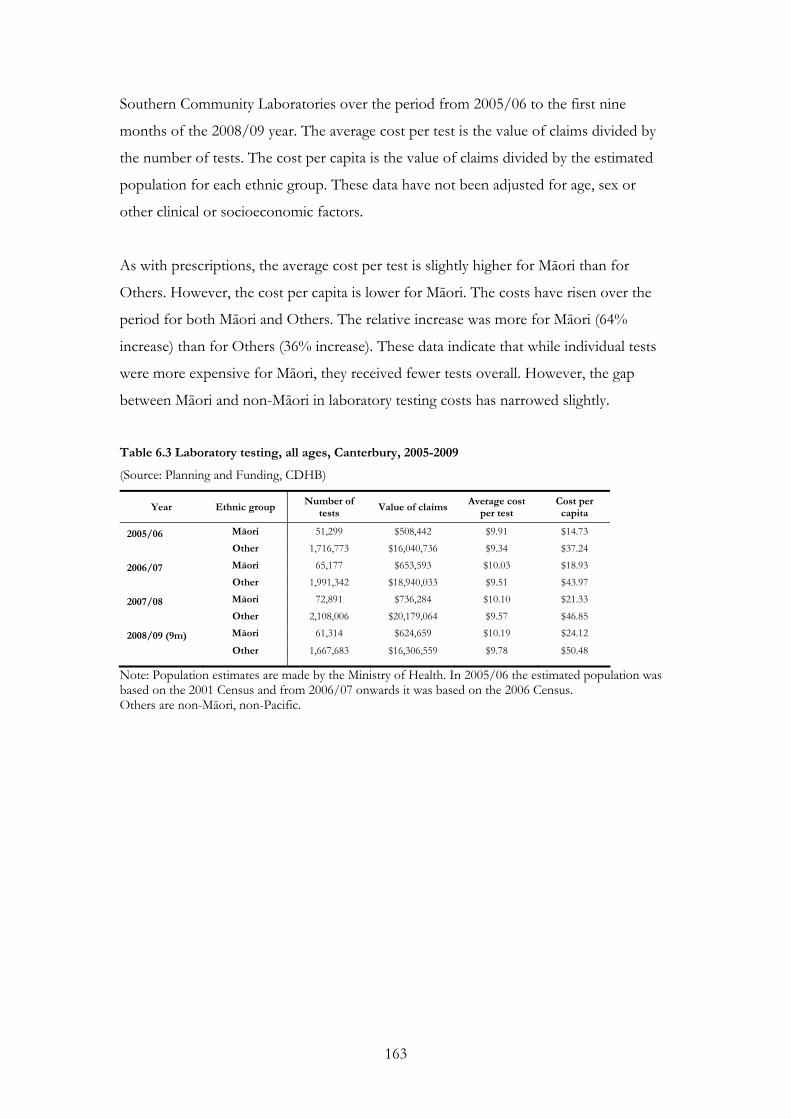
163
Southern Community Laboratories over the period from 2005/06 to the first nine
months of the 2008/09 year. The average cost per test is the value of claims divided by
the number of tests. The cost per capita is the value of claims divided by the estimated
population for each ethnic group. These data have not been adjusted for age, sex or
other clinical or socioeconomic factors.
As with prescriptions, the average cost per test is slightly higher for Māori than for
Others. However, the cost per capita is lower for Māori. The costs have risen over the
period for both Māori and Others. The relative increase was more for Māori (64%
increase) than for Others (36% increase). These data indicate that while individual tests
were more expensive for Māori, they received fewer tests overall. However, the gap
between Māori and non-Māori in laboratory testing costs has narrowed slightly.
Table 6.3 Laboratory testing, all ages, Canterbury, 2005-2009
(Source: Planning and Funding, CDHB)
Year Ethnic group Number of
tests Value of claims
Average cost per test
Cost per capita
2005/06 Māori 51,299 $508,442 $9.91 $14.73
Other 1,716,773 $16,040,736 $9.34 $37.24
2006/07 Māori 65,177 $653,593 $10.03 $18.93
Other 1,991,342 $18,940,033 $9.51 $43.97
2007/08 Māori 72,891 $736,284 $10.10 $21.33
Other 2,108,006 $20,179,064 $9.57 $46.85
2008/09 (9m) Māori 61,314 $624,659 $10.19 $24.12
Other 1,667,683 $16,306,559 $9.78 $50.48
Note: Population estimates are made by the Ministry of Health. In 2005/06 the estimated population was based on the 2001 Census and from 2006/07 onwards it was based on the 2006 Census. Others are non-Māori, non-Pacific.

164

165
7 Health System Indicators
The performance of elements of the health system with respect to different populations
can be assessed by reference to deaths and hospital admissions that could have been
prevented. The concepts of avoidable hospitalisation and avoidable mortality have been
proposed as means of identifying admissions and premature mortality that theoretically
could have been prevented by timely and effective healthcare. They are based on a list of
conditions that could have been identified and treated by either public health or primary
health interventions (Sheerin, Allen et al. 2006).
7.1 Avoidable mortality and hospitalisation
Figure 7.1 presents rates of avoidable mortality aggregated for the period from 2003 to
2005, for Canterbury and New Zealand. The rate of avoidable mortality for Māori in
Canterbury was over twice as high as that for European/Others (RR 2.15, non-
overlapping 95% CIs for the rates). The rate for males appeared to be higher for Māori
males than females, but this was not a significant difference. The rate for Māori in
Canterbury was significantly lower than that for Māori nationally (RR 0.78, non-
overlapping 95% CIs for the rates). Nationally the difference between the rate for Māori
and for European/Others (RR 2.77, non-overlapping 95% CIs for the rates) was
Key points
From 2003 to 2005:
• Avoidable mortality was twice as high for Māori in Canterbury than for
European/Others, but lower than for Māori nationally.
• Avoidable hospitalisation was higher for Māori in Canterbury than for
European/Others, but lower than for Māori nationally.
From 1996 to 2007:
• The rate of ambulatory sensitive hospitalisation for Māori under-five year olds in
Canterbury started lower than that for Europeans and rose, while the rate for
Europeans fell. By 2007, the rate for Māori had become higher than that for
Europeans.

166
significantly greater than that in Canterbury (RR 2.15, non-overlapping 95% CIs for the
rates).
Figure 7.1 Avoidable mortality, 0-74 years, Canterbury and New Zealand, 2003-2005 (Source: HDIU)
0
100
200
300
400
500
600
Male Female Total Male Female Total
Canterbury New Zealand
Rat
e /
100
,000
Māori
European/Other
Note: Rates are calculated per 100,000 and are age-standardised using the WHO population for people aged less than 75 years. European/Other are non-Māori, non-Pacific, non-Asian.
Figure 7.2 presents rates of avoidable hospitalisations aggregated for the period from
2005 to 2007, for Canterbury and New Zealand. The rate of avoidable hospitalisation for
Māori in Canterbury was higher than that for European/Others (RR 1.20, non-
overlapping 95% CIs for the rates). The rate appeared to be higher for Māori females
than males, but this was not a significant difference (overlapping 95% CIs for the rates).
The rate for Māori in Canterbury was significantly lower than that for Māori nationally
(RR 0.72, non-overlapping 95% CIs for the rates). Nationally the difference between the
rate for Māori and for European/Others (RR 1.72, non-overlapping 95% CIs for the
rates) was greater than that in Canterbury (RR 1.20, non-overlapping 95% CIs for the
rates).

167
Figure 7.2 Avoidable hospitalisation, 0-74 years, Canterbury and New Zealand, 2005-2007 (Source: HDIU)
0
1,000
2,000
3,000
4,000
5,000
6,000
Male Female Total Male Female Total
Canterbury New Zealand
Rat
e /
100,
000
Māori
European/Other
The higher rates of avoidable mortality and hospitalisation for Māori than for
European/Others indicate Māori are relatively under-served by health interventions
aimed at preventable causes of death and hospital admission. The data presented in
Figures 7.1 and 7.2 are also summarised in Table 8.20 in Appendix 3 Health status tables.
Ambulatory sensitive hospitalisation
Ambulatory sensitive hospitalisations (ASH) are a subset of avoidable hospitalisations
that are admissions considered to be preventable by access to effective interventions
delivered in primary health services (Jackson and Tobias 2001). Ambulatory sensitive
conditions include infections (e.g. vaccine-preventable infections such as measles;
gastroenteritis; respiratory infections; sexually transmitted infections), some chronic
diseases (e.g. diabetes, angina and congestive heart failure, asthma, epilepsy), and some
cancers (e.g. breast cancer, skin cancers). High ASH rates imply that high numbers of
people were admitted to hospital with conditions that should have been avoided by
preventive interventions or effective management by primary health care.
Figure 7.3 presents ASH rates over the period from 1996/97 to 2006/07, calculated by a
method that takes into account characteristics of hospitalisation in the paediatric

168
population19 (Craig, Anderson et al. 2008). It shows that Māori under-five year olds in
Canterbury had a lower ASH rate than Europeans prior to 2004/05, when the rates were
similar, but that in 2006/07 the Māori ASH rate had increased to exceed that for
Europeans.
Figure 7.3 Ambulatory sensitive hospitalisation, 0-4 years, Canterbury, 1996-2007 (Source: Craig, Anderson et al. 2008)
0
10
20
30
40
50
60
70
80
90
1996-97 1998-99 2000-01 2002-03 2004-05 2006-07
Rat
e pe
r 1,
000
European Māori
Note: ASH calculated as rate per 1,000 children 0-4 years
19 The New Zealand Child and Youth Epidemiology Service paediatric ASH codes exclude conditions that
are present in the all-age ASH codes, but are of little relevance to the paediatric population, for example
angina, and colorectal and cervical cancer,. The paediatric ASH codes also take into account that some
conditions may be managed differently in primary care for adults than for children, such as seizures, which
may be preventable in primary care for adults but may require admission to hospital for children.

169
8 Appendices
Appendix 1 Data sources and methodological issues
Data sources
The sources of data include the following:
Statistics New Zealand
Data from the 2001 and 2006 Censuses were requested for use in the demographic
profile; to provide social and economic information that describe some of the factors
that influence health; to provide smoking data; and to provide denominator data for use
in calculating population rates of cancer registration, communicable disease notification,
hospitalisation and mortality. Population projections were also obtained for the years
following 2006, based on assumptions of medium fertility, mortality, migration, and
inter-ethnic mobility.
Statistics New Zealand Security Statement: Access to the data used in this study was
provided by Statistics New Zealand under conditions designed to give effect to the
security and confidentiality provisions of the Statistics Act 1975. The results presented in
this study are the work of the authors, not Statistics New Zealand.
Health and Disability Information Unit, Ministry of Health
The Health and Disability Information Unit (HDIU) produced the Canterbury DHB
Health Needs Assessment (Health and Disability Intelligence Unit 2008). That report
analysed data from the New Zealand Health Survey, which have been used throughout
this profile. The Canterbury DHB Health Needs Assessment also presented rates of
diabetes complications, and low birthweight, perinatal and infant mortality, which are
used in Chapter 5 Health Status, in addition to rates of avoidable mortality and
hospitalisations which are used in Chapter 7 Health System Indicators.
Ngāi Tahu Development
Data from Mō Tātou (Ahuriri-Driscoll, Cram et al. 2004), a survey of Ngāi Tahu
members aged 16 years and older in 2003/04 were used for prevalence of smoking and
general practitioner visits.

170
Action on Smoking and Health
Year 10 smoking survey report data were used, including smoking among 14 to 15 year
olds and young people exposed to smoking in the home.
Te Rōpū Rangahau Hauora a Eru Pōmare
Much of the data regarding mortality, hospitalisation, cancer registration and procedures
used in this profile were made available by Te Rōpū Rangahau Hauora a Eru Pōmare.
These data were obtained by Te Rōpū Rangahau Hauora a Eru Pōmare from the New
Zealand Health Information Service (for mortality, and public hospital discharges), the
New Zealand Cancer Registry (for cancer registrations) and Statistics New Zealand for
population denominators. They have been reported on at the national level in Hauroa:
Māori Standards of Health IV (Robson B, Harris R 2007).
The data provided by Te Rōpū Rangahau Hauora a Eru Pōmare at the DHB level were
processed in the same way as is described in Hauora IV (see Appendix 1: Methods
(Robson and Purdie 2007)) to adjust for undercounting of Māori and to age-standardise
them to the 2001 Māori population. A brief description follows of the processing of data
done by Te Rōpū Rangahau Hauora a Eru Pōmare:
• Adjustment was made to take into account the undercounting in ethnicity
classification for Māori, particularly for hospitalisations and cancer registrations
(mortality records are more accurate (Fawcett, Atkinson et al. 2008)). For these data
an estimate of undercounting was made by linkage to other data sets (death
registrations, New Zealand Housing Corporation tenant information and Ministry of
Health national surveys) that have more reliable ethnicity classification. Information
created from the analysis of the linked data sets generated adjusters that were applied
to hospital and cancer registration data, increasing Māori hospitalisation figures by 5-
15% (differing by age group) and Māori cancer registrations by 2-15% (see Appendix
3: Estimating Māori hospitalisations and cancer registrations (Harris, Purdie et al.
2007)).
The adjustment described above was made for national data. It could be argued that
undercounting in ethnicity classification of Māori may vary by DHB, and therefore
not be valid for data at the DHB level. There is evidence that undercounting may be
greater in South Island DHBs (Fawcett, Atkinson et al. 2008; Shaw, Atkinson et al.
171
2009), indicating, if anything, that adjustment for undercounting in CDHB may be
conservative (Harris 2009).
• Rates for mortality, hospitalisation, cancer registration and procedures were directly
age-standardised to the 2001 Māori population to take account of the different age
structures of the Māori and non-Māori populations (see Appendix 4: Standard
populations (Robson and Harris 2007)).
• Ninety-five percent confidence intervals (95% CIs) were determined for rates for
Māori and non-Māori in New Zealand and by DHB. Rate ratios (RR) were calculated
to represent the differences between Māori and non-Māori rates, and 95%
confidence intervals for the rate ratios determined.
• Mortality data from death registrations were aggregated over five years from 2000 to
2004.
• Hospitalisation data included the primary diagnosis from publicly-funded hospital
discharges (not private hospitalisations) and were aggregated over three years from
2003 to 2005. Hospital procedures were aggregated over the same period and
included data on all procedures, which may be multiple for each hospitalisation.
External causes of injury (e-codes) were analysed for all hospitalisations where injury
was the principal diagnosis, and where an external cause was the cause of death.
• Cancer registrations from the New Zealand Cancer Registry were aggregated for the
five years from 2000 to 2004, excluding in situ tumours and multiple registrations.
Information Directorate, Ministry of Health (formerly the New Zealand
Health Information Service (NZHIS))
Data were provided on births and birth procedures.
Institute of Environmental Science and Research
Notifiable disease surveillance data (from Episurv) and sexually transmitted infection
surveillance data were provided.
Injury Prevention and Research Unit, University of Otago, Dunedin
Data were provided on morbidity from injury.

172
New Zealand Child and Youth Epidemiology Service, University of Otago,
Dunedin
The New Zealand Child and Youth Epidemiology Service (NZCYES) produced The
Health Status of Children and Young People in Canterbury (Craig, Anderson et al. 2008),
which was the source of much of the data for the section on tamariki/child and
rangatahi/youth health in Chapter 5 Health Status. For the parts of that document
reproduced in this profile, NZCYES used data from the National Minimum Dataset and
the National Mortality Collection, which are managed by NZHIS, and the Birth
Registration Dataset from the Department of Internal Affairs. For further information
on data and methodological issues in those data sets see Appendices 1, 4, 5 and 6 in The
Health Status of Children and Young People in Canterbury (Craig, Anderson et al. 2008).
Royal New Zealand Plunket Society
Data were provided on breastfeeding rates.
National Immunisation Register
Data were provided on immunisation coverage.
BreastScreen Aotearoa
Data were provided on breast cancer screening coverage.
National Cervical Screening Programme
Data were provided on cervical screening coverage.
Canterbury District Health Board
The Planning and Funding Division of the CDHB provided much of the data on health
service utilisation, diabetes management and access to mental health services.
Data were obtained from Community and Public Health for NZDep profiles and
geographical analyses.
The Community Dental Service provided much of the data for the section on oral health.
The Vision and Hearing Service provided audiometry failure data.

173
Methodological issues
Data presentation
Data are presented in this profile in tables (either in the body of the document or in
Appendix 3 Health status tables) or represented in figures as:
• numbers of individual cases;
• percentages of the total population or rates, which were age- and/or sex-standardised
where possible (depending on how data were provided, see below), and generally
calculated per 100,000;
• rate ratios;
• 95% CIs for rates and rate ratios (depending on how data were provided).
Rate ratios are calculated by dividing one rate by another – the rate for Māori by the rate
for non-Māori (or European / Other) in Canterbury or in New Zealand, or the rate for
Māori in Canterbury by the rate for Māori in New Zealand.
Ninety-five percent confidence intervals give an indication of the uncertainty of an
estimate, i.e. the range of values around an estimate within which there is a 95%
probability of the true population value falling. If a 95% CI of a rate ratio does not
include 1 then the probability of the rates on which the ratio is based not being different
is less than 5% (less than 5% chance of an apparent difference being due to chance). If a
95% CI for a rate ratio does not include 1 then the difference between the rates is
considered statistically significant. Another use of 95% CIs is when looking at two rates –
if the 95% CIs do not overlap the difference between those rates is considered
statistically significant and there is a less than 5% probability that the difference in rates is
due to chance (Robson and Purdie 2007).
Small numbers of cases in Canterbury for some data meant that data had to be
aggregated over years, and that in some instances resulted in wide 95% CIs, as the width
is partly determined by the number of observations.
‘Canterbury’
Throughout this profile when ‘Canterbury’ is used it means the CDHB area rather than
the Canterbury region, which includes areas that are under the South Canterbury DHB.

174
Ethnicity data
Ethnicity information can be reported either as ‘total response’ or ‘prioritised’. If
ethnicity is reported as ‘total response’ it means the individual is recorded in each ethnic
group they specify. The result of this is that the total of all responses by ethnic group
summed will exceed the total number of individuals to the extent that those individuals
selected multiple ethnicities.
If ethnicity is reported as prioritised, each individual is allocated to a single ethnic group
by priority. If an individual responds to an ethnicity question with multiple responses
they will be reported in the following prioritisation order: Māori > Pacific > Asian >
European/Other (Ministry of Health 2004; Ministry of Health 2008). In this profile the
system used is ‘prioritised’ unless otherwise specifically stated. The comparison ethnic
group (non-Māori, European, European/Other, Other) used in this profile varies
depending on the format of the data provided.
Age standardisation
As health outcomes vary by age, comparisons between groups require the use of
techniques that adjust for variation in the age structure of those groups. Age-
standardisation takes into account the younger age structure of the Māori population (as
can be seen in Chapter 2 Demography) and similarly the higher proportion of elderly
people in the non-Māori (and European) population.
In this profile, where age or age group data were available, age-standardisation was done.
Where age-standardisation was done on raw data provided, the 2001 Māori population
was used as the standard. This standard population was used as it represents the real rate
among Māori more closely than if another standard population (such as WHO or Segi)
were used (Robson, Purdie et al. 2007).
Some data were provided with age-standardisation already completed. This was the case
for data provided by Te Rōpū Rangahau Hauora a Eru Pōmare (Robson and Harris
2007), which also age-standardised to the 2001 Māori population. Age-standardisation
was also already completed for data provided in the Canterbury DHB Health Needs
Assessment (Health and Disability Intelligence Unit 2008), which age-standardised using
the WHO population. As the WHO population is somewhat older than the 2001 Māori

175
population its use is likely to have produced rates for Māori that are lower, and have
reduced the difference in rates between Māori and the comparison population
(European/Others) than if the 2001 Māori population had been used (Robson, Purdie et
al. 2007).
New Zealand Health Survey data – synthetic estimates
The New Zealand Health Survey (NZHS, last conducted in 2006/07) includes questions
on eating habits (3+ vegetables and 2+ fruit per day), physical activity, cigarette smoking,
hazardous drinking, marijuana use (in the 2002/03 survey), overweight and obesity, and a
range of other information regarding individuals’ health. These data differ from Census
data and routinely collected information, which have almost complete coverage of
populations and provide actual counts, rather than estimates. Surveys, such as the
NZHS, do not have large samples for each DHB and the numbers of respondents in
subgroups, such as Māori, are smaller still20. Even national estimates are still estimates,
with errors due to sampling (as indicated by confidence intervals) and possible bias due
to non-response (about 30% for the NZHS). For sub-populations such as individual
DHBs, especially sub-groups (such as Māori) within a DHB, there are problems because
the number of respondents is small, making estimates based on these numbers difficult
to interpret (Wells 2009).
One approach to the problem this presents is to provide estimates based only on the
respondents in the sub-group. However, confidence intervals will be very wide, often so
wide as to be meaningless. It is for this reason that this profile has not drawn Canterbury
data from Te Rau Hinengaro: The New Zealand Mental Health Survey for section 5.9
Mental health. Another solution is to use data from the rest of the survey to improve on
the estimates.
20 The New Zealand Health Survey collected information on 4,921 children aged 0 to 14 years and 12,488
adults aged 15 years and over, making a total of 17,409 people. The survey included 5,143 Māori or around
30% of the sample. In Canterbury, the sample included 328 children and 1,019 adults (Ministry of Health
2008). If around 30% of the sample in Canterbury were Māori, as for the whole country, then about 100
Māori children and 300 Māori adults would have been included. Māori had an overall response rate of
67.5%. If this were true for Māori in Canterbury then around 65 Māori children and around 200 Māori
adults would have responded. At the 2006 Census there were 11,820 Māori children aged 0 to 14 years and
21,597 Māori adults aged 15 years and over in Canterbury.

176
Data from the NZHS presented in this profile have been produced by the Health and
Disability Information Directorate of the Ministry of Health (Health and Disability
Intelligence Unit 2008). To overcome the problem of small numbers of Māori as a sub-
group in a DHB, use has been made of ‘synthetic estimates’. These are appropriate to use
for planning purposes, but not for other uses such as evaluating health programmes
targeted at Māori.
The method used to produce synthetic estimates at the DHB level utilises data from the
rest of NZHS. The synthetic estimates for Māori within a DHB are produced by taking
the estimated rate for the DHB and multiplying it by the ratio of the national rate for
Māori to the overall national population prevalence rate. The synthetic estimates give a
likely prevalence rate for Māori (and other sub-groups) living in the DHB. The synthetic
estimate is derived from the overall regional prevalence rate (for the whole population)
by assuming that the relationships between subgroups (Māori and others) at the national
level, as observed in the NZHS, are also reflected in the DHB region. Because of the use
of this modelling technique the comparison of rate ratios between sub-groups within a
DHB and between DHB and national sub-groups is not appropriate.

177
Appendix 2 Iwi in Canterbury
Table 8.1 Iwi, Canterbury and New Zealand, 2006 (full list) (Source: Statistics New Zealand 2006 Census)
Iwi Canterbury New Zealand
Ngāi Tahu / Kāi Tahu 12,093 49,185 Ngāpuhi 4,626 122,214 Ngāti Porou 3,708 71,907 Ngāti Tūwharetoa 1,620 34,674 Waikato 1,242 33,429 Tūhoe 1,185 32,670 Te Arawa 1,170 23,316 Ngāti Maniapoto 1,161 33,627 Ngāti Kahungunu ki Te Wairoa 1,161 20,982 Ngāti Kahungunu, region unspecified 984 18,462 Te Atiawa (Taranaki) 747 12,852 Tainui 696 14,070 Kāti Māmoe 558 2,880 Ngāti Raukawa (Horowhenua/Manawatū) 525 13,233 Ngāti Awa 489 15,258 Te Ati Haunui-a-Pāpārangi 468 10,437 Ngaiterangi 444 12,201 Ngāti Mutunga (Wharekauri/Chatham Islands) 441 1,392 Ngāti Whātua 393 14,721 Whakatōhea 372 12,069 Te Whānau-a-Apanui 369 11,808 Ngāti Kahungunu ki Wairarapa 363 7,440 Ngāti Ruanui 357 7,035 Ngāti Kahungunu ki Heretaunga 351 9,525 Te Rarawa 303 14,892 Ngāti Raukawa, region unspecified 297 8,022 Te Aupōuri 291 9,333 Hapū Affiliated to More Than One Iwi 282 11,964 Ngāti Raukawa (Waikato) 276 8,166 Ngāti Mutunga (Taranaki) 273 2,094 Te Atiawa (Te Waipounamu/South Island) 255 2,433 Te Atiawa, region unspecified 255 4,644 Ngā Rauru 228 4,047 Ngāti Ranginui 225 7,644 Ngāti Kahu 213 8,313 Ngāti Pikiao (Te Arawa) 207 7,386 Waitaha (Te Waipounamu/South Island) 201 972 Taranaki 198 5,352 Rongowhakaata 189 4,710 Ngāti Kurī 186 5,757 Te Aitanga-a-Māhaki 165 5,874 Rongomaiwahine (Te Māhia) 165 4,254 Moriori 162 945 Ngāti Whakaue (Te Arawa) 156 7,311 Ngāti Haua (Waikato) 150 4,923 Ngāti Toarangatira (Te Whanganui-a-Tara/Wellington) 150 3,462 Ngāti Tahu-Ngāti Whaoa (Te Arawa) 138 1,488

178
Waitaha, region unspecified 132 771 Te Waipounamu/Wharekauri (South Island/Chatham Islands) Region, not further defined 120 696 Ngāti Kuia 120 1,551 Ngāti Mutunga, region unspecified 120 732 Ngāti Paoa 114 3,375 Muaūpoko 114 2,499 Rangitāne (Te Waipounamu/South Island) 114 966 Ngā Ruahine 111 3,726 Ngāti Apa ki Te Rā Tō 111 741 Rangitāne, region unspecified 108 1,569 Ngāti Wai 96 4,866 Ngāti Apa (Rangitī kei) 96 2,388 Ngāti Rārua 96 951 Ngāti Toa, region unspecified 90 1,290 Ngāti Maru (Marutuahu) 81 3,375 Te Arawa/Taupō (Rotorua/Taupō) Region, not further defined 78 2,142 Te Atiawa (Te Whanganui-a-Tara/Wellington) 78 1,728 Ngāti Tamaterā 75 2,457 Ngāti Kahungunu ki Te Whanganui-a-Orotu 75 1,674 Rangitāne (Manawatū) 72 1,281 Ngāti Rangiwewehi (Te Arawa) 69 2,346 Ngāi Tai (Tauranga Moana/Mātaatua) 63 2,313 Te Tai Tokerau/Tāmaki-makaurau (Northland/Auckland) Region, not further defined 57 2,565 Ngāti Hako 57 1,377 Ngāpuhi ki Whaingaroa-Ngāti Kahu ki Whaingaroa 54 1,746 Ngāti Pāhauwera 54 1,761 Ngāti Rangitihi (Te Arawa) 51 1,536 Ngāi Tāmanuhiri 51 1,662 Ngāti Tama (Taranaki) 51 1,167 Ngāti Maru, region unspecified 51 1,326 Ngāti Apa, area unspecified 51 1,026 Tūhourangi (Te Arawa) 48 2,277 Ngāti Pūkenga 48 1,785 Ngāti Manawa 48 1,941 Ngāti Tama (Te Waipounamu/South Island) 48 384 Ngāti Porou ki Harataunga ki Mataora 45 1,173 Ngāti Rākaipaaka 45 1,488 Ngāti Koata 45 1,062 Ngāti Tama, region unspecified 45 609 Ngāti Whare 39 1,281 Te Tai Rāwhiti (East Coast) Region, not further defined 36 915 Tapuika (Te Arawa) 33 1,383 Rangitāne (Te Matau-a-Māui/Hawke's Bay/Wairarapa) 33 1,566 Ngāti Hauiti 33 1,041 Ngāti Haua, region unspecified 33 1,530 Ngāti Maru (Taranaki) 30 732 Waikato/Te Rohe Pōtae (Waikato/King Country) Region, not further defined 27 1,086 Ngāti Kahungunu ki Tamatea 27 720 Waitaha (Te Arawa) 24 732 Te Atiawa ki Whakarongotai 24 615 Ngāti Toarangatira (Te Waipounamu/South Island) 24 183 Ngāti Hei 21 558 Ngāti Haua (Taumarunui) 18 822 Tauranga Moana 18 450

179
Ngāi Takoto 15 771 Te Uri-o-Hau 15 1,074 Ngāti Whanaunga 15 588 Tauranga Moana/Mātaatua (Bay of Plenty) Region, not further defined 15 162 Ngāti Tama ki Te Upoko o Te Ika (Te Whanganui-a-Tara/Wellington) 15 210 Ngāti Pūkenga ki Waiau 12 480 Tarāwhai (Te Arawa) 12 243 Ngāti Kahungunu ki Tamakinui a Rua 12 423 Manawatū/Horowhenua/Te Whanganui-a-Tara (Manawatū/Horowhenua/Wellington) Region, not further defined 12 324 Hauraki / Pare Hauraki 12 309 Ngāti Rangiteaorere (Te Arawa) 9 456 Te Matau-a-Māui/Wairarapa (Hawke's Bay/Wairarapa) Region, not further defined 9 279 Tangāhoe 9 231 Te Tauihu o Te Waka a Māui 9 111 Te Roroa 6 1,167 Ngāti Rāhiri Tumutumu 6 195 Ngāi Tai (Hauraki) 6 339 Uenuku-Kōpako (Te Arawa) 6 429 Taranaki (Taranaki) Region, not further defined 6 108 Pakakohi 6 327 Mātaatua 6 366 Hauraki (Coromandel) Region, not further defined 3 90 Ngāti Tara Tokanui 3 492 Aotea 3 51
Not Elsewhere Included 10,293 131,694
Note: *Iwi (total responses) for the Census usually resident population count of people with Māori descent. Statistics New Zealand uses a confidentiality assurance technique of randomly rounding figures to base three. Under the random rounding process zero counts and counts which are already multiples of three are left unchanged and other counts are rounded to one of the nearest multiples of three.

180
Appendix 3 Health status tables
The majority of these data are presented in Figures and/or in the text of the body of the
document in Chapter 5 Health Status and Chapter 7 Health System Indicators.
Cardiovascular disease
Table 8.2 Cardiovascular disease deaths (2000-2004) and hospitalisations (2003-2005), all ages, Canterbury and New Zealand (Source: Te Rōpū Rangahau Hauora a Eru Pōmare)
Canterbury New Zealand
Māori non-Māori Māori non-Māori Cardiovascular disease
No. Rate
(95% CI) No.
Rate (95% CI)
Rate ratio (95% CI) No.
Rate (95% CI)
No. Rate
(95% CI)
Rate ratio (95% CI)
Mortality Total 148 95.2 6,865 63.3 1.50 4,316 139.8 51,805 61.2 2.29 (80.9-112.1) (61.5-65.2) (1.27-1.77) (135.7-144.1) (60.5-61.9) (2.21–2.36)
Male 95 115.1 3,078 75.5 1.52 2,420 170.0 24,462 78.2 2.18 (93.8-141.1) (72.5-78.7) (1.24-1.88) (163.4-176.9) (77.0-79.3) (2.08-2.27)
Female 53 75.3 3,787 51.2 1.47 1,896 109.7 27,343 44.2 2.48 (57.5-98.7) (49.1-53.3) (1.12-1.94) (104.8-114.7) (43.4-44.9) (2.37-2.61)
Hospitalisation Total 684 667.5 20,685 547.1 1.22 22,326 1,119.9 183,516 643.2 1.74 (617.3-721.9) (536.6-557.7) (1.13-1.32) (1,1104.1-1,135.8) (638.5-647.9) (1.71–1.77)
Male 410 762.4 11,230 672.7 1.13 11,820 1,252.9 103,206 805.5 1.56 (689.1-843.5) (656.4-689.4) (1.02-1.26) (1,228.7-1,277.5) (798.2-812.8) (1.52-1.59)
Female 274 572.7 9,455 421.5 1.36 10,506 986.8 80,310 480.9 2.05 (506.2-647.8) (408.5-434.9) (1.20-1.54) (966.7-1,007.4) (475.0-486.9) (2.00-2.10)
Note: Rates are calculated per 100,000, sex-specific rates are age-standardised, total rates are age-sex-standardised to the 2001 Māori population
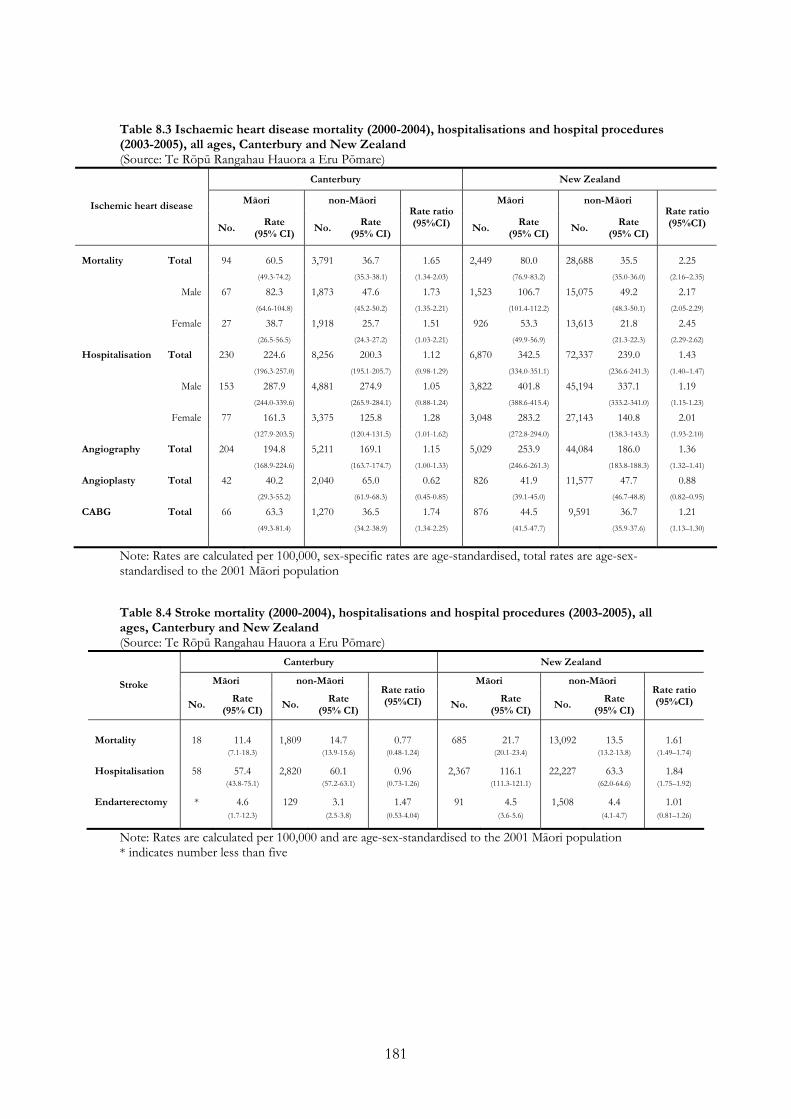
181
Table 8.3 Ischaemic heart disease mortality (2000-2004), hospitalisations and hospital procedures (2003-2005), all ages, Canterbury and New Zealand (Source: Te Rōpū Rangahau Hauora a Eru Pōmare)
Canterbury New Zealand
Māori non-Māori Māori non-Māori Ischemic heart disease
No. Rate
(95% CI) No.
Rate (95% CI)
Rate ratio (95%CI) No.
Rate (95% CI)
No. Rate
(95% CI)
Rate ratio (95%CI)
Mortality Total 94 60.5 3,791 36.7 1.65 2,449 80.0 28,688 35.5 2.25 (49.3-74.2) (35.3-38.1) (1.34-2.03) (76.9-83.2) (35.0-36.0) (2.16–2.35)
Male 67 82.3 1,873 47.6 1.73 1,523 106.7 15,075 49.2 2.17 (64.6-104.8) (45.2-50.2) (1.35-2.21) (101.4-112.2) (48.3-50.1) (2.05-2.29)
Female 27 38.7 1,918 25.7 1.51 926 53.3 13,613 21.8 2.45 (26.5-56.5) (24.3-27.2) (1.03-2.21) (49.9-56.9) (21.3-22.3) (2.29-2.62)
Hospitalisation Total 230 224.6 8,256 200.3 1.12 6,870 342.5 72,337 239.0 1.43 (196.3-257.0) (195.1-205.7) (0.98-1.29) (334.0-351.1) (236.6-241.3) (1.40–1.47)
Male 153 287.9 4,881 274.9 1.05 3,822 401.8 45,194 337.1 1.19 (244.0-339.6) (265.9-284.1) (0.88-1.24) (388.6-415.4) (333.2-341.0) (1.15-1.23)
Female 77 161.3 3,375 125.8 1.28 3,048 283.2 27,143 140.8 2.01 (127.9-203.5) (120.4-131.5) (1.01-1.62) (272.8-294.0) (138.3-143.3) (1.93-2.10)
Angiography Total 204 194.8 5,211 169.1 1.15 5,029 253.9 44,084 186.0 1.36 (168.9-224.6) (163.7-174.7) (1.00-1.33) (246.6-261.3) (183.8-188.3) (1.32–1.41)
Angioplasty Total 42 40.2 2,040 65.0 0.62 826 41.9 11,577 47.7 0.88 (29.3-55.2) (61.9-68.3) (0.45-0.85) (39.1-45.0) (46.7-48.8) (0.82–0.95)
CABG Total 66 63.3 1,270 36.5 1.74 876 44.5 9,591 36.7 1.21 (49.3-81.4) (34.2-38.9) (1.34-2.25) (41.5-47.7) (35.9-37.6) (1.13–1.30)
Note: Rates are calculated per 100,000, sex-specific rates are age-standardised, total rates are age-sex-standardised to the 2001 Māori population Table 8.4 Stroke mortality (2000-2004), hospitalisations and hospital procedures (2003-2005), all ages, Canterbury and New Zealand (Source: Te Rōpū Rangahau Hauora a Eru Pōmare)
Canterbury New Zealand
Māori non-Māori Māori non-Māori Stroke
No. Rate
(95% CI) No.
Rate (95% CI)
Rate ratio (95%CI) No.
Rate (95% CI)
No. Rate
(95% CI)
Rate ratio (95%CI)
Mortality 18 11.4 1,809 14.7 0.77 685 21.7 13,092 13.5 1.61 (7.1-18.3) (13.9-15.6) (0.48-1.24) (20.1-23.4) (13.2-13.8) (1.49–1.74)
Hospitalisation 58 57.4 2,820 60.1 0.96 2,367 116.1 22,227 63.3 1.84 (43.8-75.1) (57.2-63.1) (0.73-1.26) (111.3-121.1) (62.0-64.6) (1.75–1.92)
Endarterectomy * 4.6 129 3.1 1.47 91 4.5 1,508 4.4 1.01 (1.7-12.3) (2.5-3.8) (0.53-4.04) (3.6-5.6) (4.1-4.7) (0.81–1.26)
Note: Rates are calculated per 100,000 and are age-sex-standardised to the 2001 Māori population * indicates number less than five
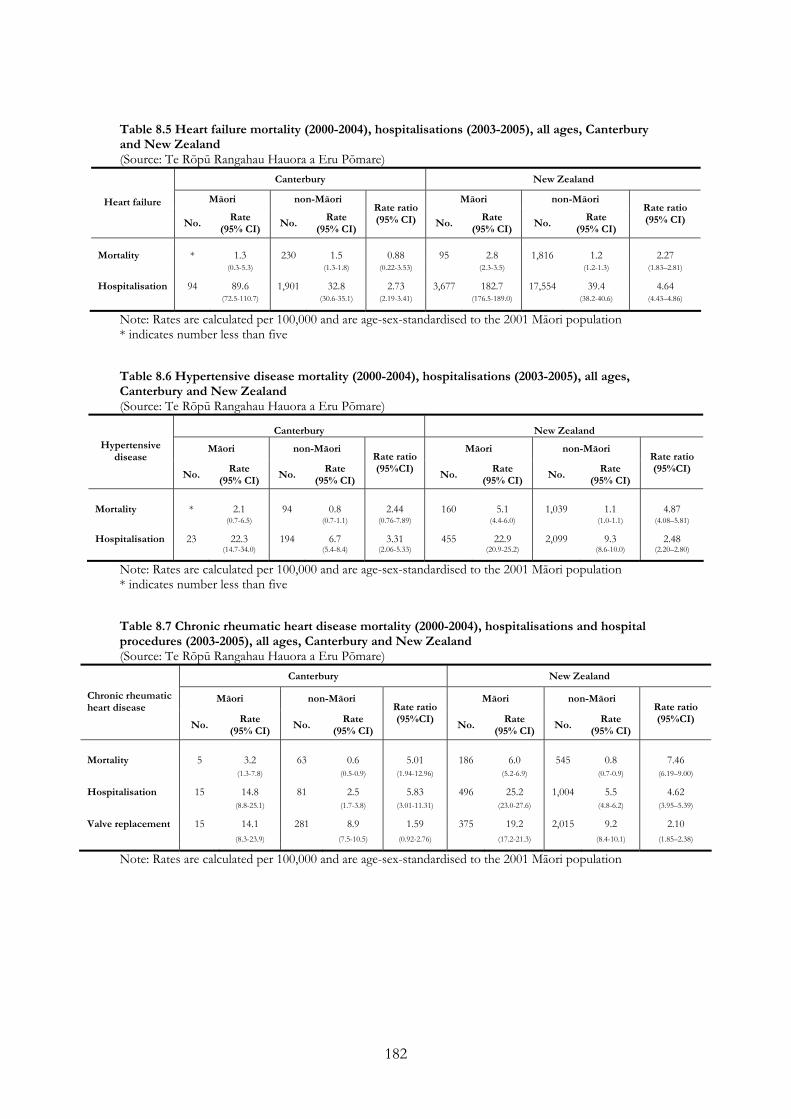
182
Table 8.5 Heart failure mortality (2000-2004), hospitalisations (2003-2005), all ages, Canterbury and New Zealand (Source: Te Rōpū Rangahau Hauora a Eru Pōmare)
Canterbury New Zealand
Māori non-Māori Māori non-Māori Heart failure
No. Rate
(95% CI) No.
Rate (95% CI)
Rate ratio (95% CI) No.
Rate (95% CI)
No. Rate
(95% CI)
Rate ratio (95% CI)
Mortality * 1.3 230 1.5 0.88 95 2.8 1,816 1.2 2.27 (0.3-5.3) (1.3-1.8) (0.22-3.53) (2.3-3.5) (1.2-1.3) (1.83–2.81)
Hospitalisation 94 89.6 1,901 32.8 2.73 3,677 182.7 17,554 39.4 4.64 (72.5-110.7) (30.6-35.1) (2.19-3.41) (176.5-189.0) (38.2-40.6) (4.43–4.86)
Note: Rates are calculated per 100,000 and are age-sex-standardised to the 2001 Māori population * indicates number less than five Table 8.6 Hypertensive disease mortality (2000-2004), hospitalisations (2003-2005), all ages, Canterbury and New Zealand (Source: Te Rōpū Rangahau Hauora a Eru Pōmare)
Canterbury New Zealand
Māori non-Māori Māori non-Māori Hypertensive disease
No. Rate
(95% CI) No.
Rate (95% CI)
Rate ratio (95%CI)
No. Rate
(95% CI) No.
Rate (95% CI)
Rate ratio (95%CI)
Mortality * 2.1 94 0.8 2.44 160 5.1 1,039 1.1 4.87 (0.7-6.5) (0.7-1.1) (0.76-7.89) (4.4-6.0) (1.0-1.1) (4.08–5.81)
Hospitalisation 23 22.3 194 6.7 3.31 455 22.9 2,099 9.3 2.48 (14.7-34.0) (5.4-8.4) (2.06-5.33) (20.9-25.2) (8.6-10.0) (2.20–2.80)
Note: Rates are calculated per 100,000 and are age-sex-standardised to the 2001 Māori population * indicates number less than five Table 8.7 Chronic rheumatic heart disease mortality (2000-2004), hospitalisations and hospital procedures (2003-2005), all ages, Canterbury and New Zealand (Source: Te Rōpū Rangahau Hauora a Eru Pōmare)
Canterbury New Zealand
Māori non-Māori Māori non-Māori Chronic rheumatic heart disease
No. Rate
(95% CI) No.
Rate (95% CI)
Rate ratio (95%CI)
No. Rate
(95% CI) No.
Rate (95% CI)
Rate ratio (95%CI)
Mortality 5 3.2 63 0.6 5.01 186 6.0 545 0.8 7.46 (1.3-7.8) (0.5-0.9) (1.94-12.96) (5.2-6.9) (0.7-0.9) (6.19–9.00)
Hospitalisation 15 14.8 81 2.5 5.83 496 25.2 1,004 5.5 4.62 (8.8-25.1) (1.7-3.8) (3.01-11.31) (23.0-27.6) (4.8-6.2) (3.95–5.39)
Valve replacement 15 14.1 281 8.9 1.59 375 19.2 2,015 9.2 2.10 (8.3-23.9) (7.5-10.5) (0.92-2.76) (17.2-21.3) (8.4-10.1) (1.85–2.38)
Note: Rates are calculated per 100,000 and are age-sex-standardised to the 2001 Māori population

183
Cancer
Table 8.8 Cancer mortality and registrations (2000-2004), all ages, Canterbury and New Zealand, all sites and top ten sites ranked by mortality for Canterbury Māori (Source: Te Rōpū Rangahau Hauora a Eru Pōmare)
Canterbury New Zealand
Māori non-Māori Māori non-Māori Cancer
No. Rate
(95% CI) No.
Rate (95% CI)
Rate ratio (95% CI)
No. Rate
(95% CI) No.
Rate (95% CI)
Rate ratio (95% CI)
All sites Deaths Total 141 93.7 4,740 69.3 1.35 3,640 119.2 36,372 67.3 1.77 (79.2-110.8) (66.9-71.7) (1.14-1.60) (115.4-123.2) (66.5-68.2) (1.71-1.83) Male § 70 85.9 2,557.0 79.5 1.08 1,790 125.2 19,463.0 75.6 1.66 (67.6-109.1) (76.0-83.2) (0.85-1.38) (119.5-131.2) (74.4-76.9) (1.59-1.74) Female § 71 101.5 2,183.0 59.0 1.72 1,850 113.2 16,909.0 59.1 1.92 (80.3-128.3) (55.9-62.3) (1.35-2.19) (108.1-118.5) (57.9-60.2) (1.82-2.01) Registrations Total 243 160.6 10,758 203 0.79 6,697 219.0 83,926 200.6 1.09 (140.6-183.5) (198.1-207.9) (0.69-0.91) (213.4-224.7) (198.7-204.4) (1.06-1.12) Male § 100 122.2 5,674 212.2 0.58 3,071 213.4 44,887 209.7 1.02 (99.2-150.6) (205.5-219.1) (0.47-0.71) (205.5-221.7) (207.1-212.2) (0.98-1.06) Female § 143 198.9 5,084 193.7 1.03 3,626 224.6 39,039 191.5 1.17 (167.4-236.4) (186.7-200.9) (0.86-1.23) (216.9-232.5) (188.8-194.2) (1.13-1.22) Lung Deaths 32 21.9 832 11.7 1.87 1,127 36.8 6,206 11.4 3.23
(15.4-31.1) (10.8-12.7) (1.30-2.68) (34.7-39.0) (11.1-11.7) (3.03-3.45) Registrations 45 29.9 952 14.1 2.13 1,366 44.6 7,079 13.7 3.26 (21.9-41.0) (13.0 -15.2) (1.54-2.94) (42.1-47.2) (13.2-14.1) (3.05-3.48) Colorectal Deaths 18 12.7 737 10.4 1.22 254 8.4 5,481 9.4 0.89 (7.9-20.3) (9.6-11.4) (0.75-1.96) (7.4-9.5) (9.1-9.7) (0.78-1.01) Registrations 20 13.6 1,739 26.7 0.51 469 15.4 12,710 24.8 0.62 (8.5-21.8) (25.3-28.3) (0.32-0.82) (14.0-16.9) (24.3-25.3) (0.56-0.68) Breast: female § Deaths 17 23.1 379 13.1 1.77 344 21.3 2,806 12.4 1.71 (14.3-37.3) (11.6-14.7) (1.08-2.90) (19.1-23.7) (11.9-13.0) (1.53-1.92) Registrations 41 56.2 1,386 60.2 0.93 1,069 66.8 10,587 58.4 1.14 (40.8-77.4) (56.5-64.1) (0.67-1.29) (62.7-71.1) (57.0-59.9) (1.07-1.22) Pancreas Deaths 9 6.3 204 2.7 2.33 128 4.1 1,433 2.5 1.68
(3.3-12.2) (2.3-3.2) (1.18-4.60) (3.5-4.9) (2.3-2.6) (1.40-2.02) Registrations 9 6.2 221 3.1 1.98 149 4.8 1,521 2.7 1.76 (3.1-12.4) (2.6-3.7) (0.97-4.05) (4.0-5.7) (2.5-2.9) (1.46-2.11) Ill-defined sites Deaths 8 5.3 276 3.2 1.69 223 7.3 2,170 3.5 2.10 (2.6-10.7) (2.7-3.6) (0.82-3.46) (6.4-8.4) (3.3-3.7) (1.82-2.42) Registrations 5 3.8 310 4.0 0.94 281 9.2 2,499 4.4 2.07 (1.6-9.3) (3.5-4.7) (0.38-2.31) (8.1-10.4) (4.2-4.7) (1.80-2.37) Kidney Deaths 7 4.1 111 1.7 2.41 65 2.2 707 1.4 1.55 (2.0-8.7) (1.4-2.1) (1.11-5.23) (1.7-2.8) (1.3-1.5) (1.20-2.01) Registrations 12 7.8 253 5.3 1.45 138 4.6 1,642 4.3 1.08 (4.3-14.1) (4.5-6.4) (0.78-2.72) (3.8-5.4) (4.0-4.6) (0.89-1.30) Non-Hodgkin lymphoma Deaths 6 3.9 164 2.6 1.50 105 3.4 1,364 2.6 1.31 (1.7-8.8) (2.2-3.1) (0.65-3.48) (2.8-4.1) (2.4-2.8) (1.07-1.61) Registrations 8 5.6 386 7.6 0.74 201 6.6 2,887 7.2 0.92 (2.6-11.8) (6.7-8.6) (0.35-1.58) (5.7-7.6) (6.8-7.5) (0.79-1.07) Liver Deaths 5 3.2 88 1.3 2.52 141 4.7 599 1.2 3.81 (1.3-7.8) (1.0-1.6) (1.00-6.32) (4.0-5.6) (1.1-1.4) (3.14-4.61) Registrations 7 4.4 93 1.4 3.19 186 6.2 633 1.5 4.21 (1.9-9.9) (1.0-1.8) (1.35-7.54) (5.3-7.2) (1.3-1.7) (3.45-5.13) Ovary § Deaths * 2.9 113 3.5 0.84 63 3.9 817 3.2 1.22 (0.7-11.7) (2.8-4.4) (0.21-3.41) (3.0-5.0) (2.9-3.5) (0.94-1.58) Registrations 5 7.6 197 8.6 0.89 135 8.4 1,366 7.5 1.13 (3.2-18.3) (7.2-10.2) (0.36-2.17) (7.1-10.1) (6.9-8.0) (0.93-1.37) Uterus § Deaths * 2.7 34 0.9 2.92 47 2.9 368 1.3 2.29 (0.7-10.9) (0.6-1.4) (0.69-12.33) (2.2-3.8) (1.1-1.4) (1.68-3.13) Registrations 14 19.4 152 5.7 3.42 169 10.5 1,400 6.7 1.58 (11.2-33.4) (4.6-6.9) (1.91-6.13) (9.0-12.3) (6.2-7.2) (1.33-1.87)
Note: Rates are calculated per 100,000 and are age-sex-standardised (except § which are age-standardised) to the 2001 Māori population * indicates number less than five

184
Table 8.9 Lung cancer deaths and registrations, by gender, all ages, Canterbury and New Zealand, 2000-2004 (Source: Te Rōpū Rangahau Hauora a Eru Pōmare)
Canterbury New Zealand Māori non-Māori Māori non-Māori Lung cancer
No. Rate
(95% CI) No.
Rate (95% CI)
Rate ratio (95% CI) No.
Rate (95% CI)
No. Rate
(95% CI)
Rate ratio (95% CI)
Deaths Male 17 21.4 523 15.7 1.36 542 37.8 3802 14.3 2.64 (13.2-34.6) (14.3-17.3) (0.83-2.22) (34.7-41.1) (13.8-14.8) (2.41-2.89) Female 15 22.4 316 8 2.81 585 35.8 2404 8.4 4.24 (13.5-37.3) (7.0-9.1) (1.66-4.75) (33.0-38.9) (8.1-8.9) (3.86-4.66) Registrations Male 22 27.3 586 18.2 1.5 653 45.4 4248 16.5 2.75 (17.5-42.6) (16.5-20.0) (0.95-2.36) (41.8-49.2) (15.9-17.2) (2.51-3.01) Female 22 32.6 377 10.4 3.14 713 43.8 2831 10.8 4.04
(21.0-50.7) (9.1-11.9) (1.98-4.99) (40.5-47.3) (10.2-11.5) (3.67-4.45)
Note: Rates are calculated per 100,000 and are age-standardised to the 2001 Māori population
Table 8.10 Cervical cancer mortality and registrations (2000-2004), cervical cancer and cervical carcinoma in situ hospitalisations (2003-2005), females, all ages, Canterbury and New Zealand (Source: Te Rōpū Rangahau Hauora a Eru Pōmare)
Canterbury New Zealand
Māori non-Māori Māori non-Māori Cervical
No. Rate
(95% CI) No.
Rate (95% CI)
Rate ratio (95% CI) No.
Rate (95% CI)
No. Rate
(95% CI)
Rate ratio (95% CI)
Cervical cancer Deaths * 2.5 31 1.3 1.92 65 4.0 258 1.3 3.10 (0.6-10.0) (0.8-2.0) (0.45-8.21) (3.1-5.1) (1.1-1.5) (2.33-4.11)
Registrations 7 8.9 90 6.1 1.44 174 10.9 731 5.8 1.89 (4.2-18.7) (4.7-7.9) (0.66-3.18) (9.4-12.7) (5.2-6.4) (1.58-2.27)
Hospitalisation 10 20.2 75 7.5 2.69 214 20.9 834 9.7 2.15 (10.9-37.5) (5.5-10.2) (1.35-5.39) (18.2-24.0) (8.8-10.7) (1.81-2.54)
Registrations 80 95.4 1,157 112.3 0.85 1,705 109.4 9,681 118.1 0.93 Carcinoma in situ of cervix (76.3-119.2) (105.5-119.6) (0.67-1.07) (104.1-114.9) (115.3-120.9) (0.88-0.98)
Note: Rates are calculated per 100,000 and are age-standardised to the 2001 Māori population * indicates number less than five
Respiratory disease
Table 8.11 Respiratory disease mortality (2000-2004) and hospitalisations (2003-2005), all ages, Canterbury and New Zealand (Source: Te Rōpū Rangahau Hauora a Eru Pōmare)
Canterbury New Zealand
Māori non-Māori Māori non-Māori Respiratory disease
No. Rate
(95% CI) No.
Rate (95% CI)
Rate ratio (95% CI) No.
Rate (95% CI)
No. Rate
(95% CI)
Rate ratio (95% CI)
Mortality Total 32 21.0 1,311 13.2 1.59 1,037 33.8 10,658 13.1 2.59 (14.8-29.9) (12.3-14.2) (1.11-2.28) (31.8-36.0) (12.8-13.4) (2.42-2.76)
Hospitalisation Total 1,768 1,755.5 16,592 1,356.4 1.29 42,182 2,249.8 138,034 1,367.2 1.65 (1,670.5-1,844.9) (1,325.8-1,387.8) (1.23-1.37) (2,217.9-2,282.2) (1,351.8-1,382.8) (1.62–1.68)
Male 882 1,732.2 8,674 1,466.2 1.18 21,215 2,294.9 71,784 1,470.7 1.56 (1,613.9-1,859.2) (1,421.7-1,512.1) (1.09-1.28) (2,246.8-2,344.0) (1,447.5-1,494.3) (1.52-1.60)
Female 886 1,778.9 7,918 1,246.6 1.43 20,967 2,204.7 66,250 1,263.7 1.74 (1,659.2-1,907.2) (1,205.0-1,289.7) (1.32-1.54) (2,163.0-2,247.2) (1,243.4-1,284.3) (1.70-1.79)
Note: Rates are calculated per 100,000, sex-specific rates are age-standardised, total rates are age-sex-standardised to the 2001 Māori population
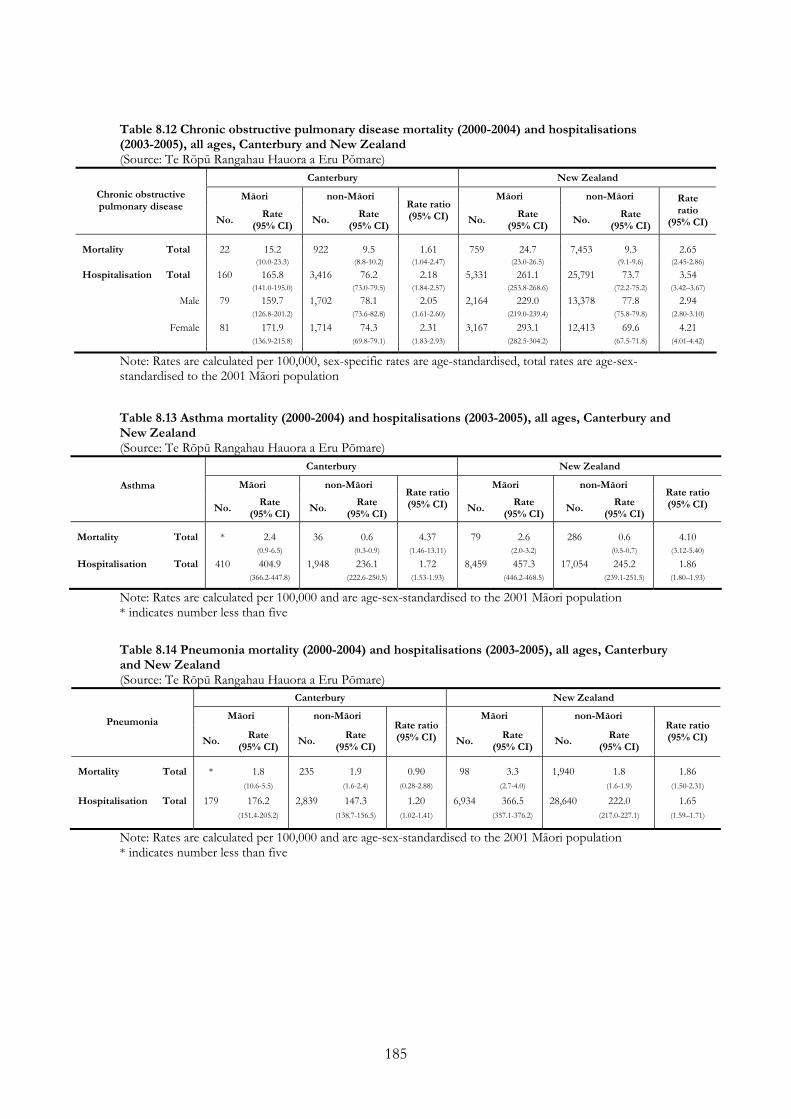
185
Table 8.12 Chronic obstructive pulmonary disease mortality (2000-2004) and hospitalisations (2003-2005), all ages, Canterbury and New Zealand (Source: Te Rōpū Rangahau Hauora a Eru Pōmare)
Canterbury New Zealand
Māori non-Māori Māori non-Māori Chronic obstructive pulmonary disease
No. Rate
(95% CI) No.
Rate (95% CI)
Rate ratio (95% CI) No.
Rate (95% CI)
No. Rate
(95% CI)
Rate ratio
(95% CI)
Mortality Total 22 15.2 922 9.5 1.61 759 24.7 7,453 9.3 2.65 (10.0-23.3) (8.8-10.2) (1.04-2.47) (23.0-26.5) (9.1-9.6) (2.45-2.86)
Hospitalisation Total 160 165.8 3,416 76.2 2.18 5,331 261.1 25,791 73.7 3.54 (141.0-195.0) (73.0-79.5) (1.84-2.57) (253.8-268.6) (72.2-75.2) (3.42–3.67)
Male 79 159.7 1,702 78.1 2.05 2,164 229.0 13,378 77.8 2.94 (126.8-201.2) (73.6-82.8) (1.61-2.60) (219.0-239.4) (75.8-79.8) (2.80-3.10)
Female 81 171.9 1,714 74.3 2.31 3,167 293.1 12,413 69.6 4.21 (136.9-215.8) (69.8-79.1) (1.83-2.93) (282.5-304.2) (67.5-71.8) (4.01-4.42)
Note: Rates are calculated per 100,000, sex-specific rates are age-standardised, total rates are age-sex-standardised to the 2001 Māori population Table 8.13 Asthma mortality (2000-2004) and hospitalisations (2003-2005), all ages, Canterbury and New Zealand (Source: Te Rōpū Rangahau Hauora a Eru Pōmare)
Canterbury New Zealand
Māori non-Māori Māori non-Māori Asthma
No. Rate
(95% CI) No.
Rate (95% CI)
Rate ratio (95% CI) No.
Rate (95% CI)
No. Rate
(95% CI)
Rate ratio (95% CI)
Mortality Total * 2.4 36 0.6 4.37 79 2.6 286 0.6 4.10 (0.9-6.5) (0.3-0.9) (1.46-13.11) (2.0-3.2) (0.5-0.7) (3.12-5.40)
Hospitalisation Total 410 404.9 1,948 236.1 1.72 8,459 457.3 17,054 245.2 1.86 (366.2-447.8) (222.6-250.5) (1.53-1.93) (446.2-468.5) (239.1-251.5) (1.80–1.93)
Note: Rates are calculated per 100,000 and are age-sex-standardised to the 2001 Māori population * indicates number less than five
Table 8.14 Pneumonia mortality (2000-2004) and hospitalisations (2003-2005), all ages, Canterbury and New Zealand (Source: Te Rōpū Rangahau Hauora a Eru Pōmare)
Canterbury New Zealand
Māori non-Māori Māori non-Māori Pneumonia
No. Rate
(95% CI) No.
Rate (95% CI)
Rate ratio (95% CI) No.
Rate (95% CI)
No. Rate
(95% CI)
Rate ratio (95% CI)
Mortality Total * 1.8 235 1.9 0.90 98 3.3 1,940 1.8 1.86 (10.6-5.5) (1.6-2.4) (0.28-2.88) (2.7-4.0) (1.6-1.9) (1.50-2.31)
Hospitalisation Total 179 176.2 2,839 147.3 1.20 6,934 366.5 28,640 222.0 1.65 (151.4-205.2) (138.7-156.5) (1.02-1.41) (357.1-376.2) (217.0-227.1) (1.59–1.71)
Note: Rates are calculated per 100,000 and are age-sex-standardised to the 2001 Māori population * indicates number less than five

186
Table 8.15 Bronchiectasis mortality (2000-2004) and hospitalisations (2003-2005), all ages, Canterbury and New Zealand (Source: Te Rōpū Rangahau Hauora a Eru Pōmare)
Canterbury New Zealand
Māori non-Māori Māori non-Māori Bronchiectasis
No. Rate
(95% CI) No.
Rate (95% CI)
Rate ratio (95% CI) No.
Rate (95% CI)
No. Rate
(95% CI)
Rate ratio (95% CI)
Mortality Total * 0.6 30 0.3 1.68 64 2.1 193 0.3 6.70 (0.1-4.0) (0.2-0.5) (0.22-12.62) (1.6-2.7) (0.3-0.4) (4.88-9.21)
Hospitalisation Total 34 30.5 164 6.0 5.11 812 41.7 1,722 11.6 3.60 (21.5-43.2) (4.7-7.7) (3.32-7.84) (38.8-44.8) (10.5-12.8) (3.19–4.08)
Note: Rates are calculated per 100,000 and are age-sex-standardised to the 2001 Māori population * indicates number less than five Table 8.16 Acute bronchitis and bronchiolitis hospitalisations, all ages, Canterbury and New Zealand, 2003-2005 (Source: Te Rōpū Rangahau Hauora a Eru Pōmare)
Canterbury New Zealand
Māori non-Māori Māori non-Māori Acute bronchitis & bronchiolitis
No. Rate
(95% CI) No.
Rate (95% CI)
Rate ratio (95% CI) No.
Rate (95% CI)
No. Rate
(95% CI)
Rate ratio (95% CI)
Hospitalisation Total 205 205.3 890 139.3 1.47 6,907 383.6 8,395 157.9 2.43 (177.8-237.0) (128.2-151.4) (1.25-1.74) (371.3-396.3) (151.3-164.7) (2.30-2.56)
Note: Rates are calculated per 100,000 and are age-sex-standardised to the 2001 Māori population
Diabetes
Table 8.17 Type 2 diabetes mortality (2000-2004) and hospitalisations (2003-2005), all ages, Canterbury and New Zealand (Source: Te Rōpū Rangahau Hauora a Eru Pōmare)
Canterbury New Zealand
Māori non-Māori Māori non-Māori Rate ratio (95% CI) Type 2 diabetes
No. Rate
(95% CI) No.
Rate (95% CI)
Rate ratio (95% CI)
No. Rate
(95% CI) No.
Rate (95% CI)
Mortality Total 19 14.4 271 2.5 5.69 825 27.0 2,738 3.6 7.40 (9.2-22.6) (2.2-2.9) (3.55-9.14) (25.2-28.9) (3.5-3.8) (6.81-8.03)
Male 10 14.7 131 1.5 9.64 456 31.9 1,387 4.5 7.17 (7.9-27.5) (1.1-2.1) (4.78-19.42) (29.1-35.0) (4.2-4.7) (6.42-8.00)
Female 9 14.1 140 0.9 15.33 369 22.0 1,351 2.8 7.76 (7.3-27.1) (0.6-1.3) (7.21-32.62) (19.9-24.4) (2.6-3.0) (6.86-8.78)
Hospitalisation Total 104 101.9 1,585 38.5 2.64 3,854 193.4 13,389 44.4 4.36 (83.4-124.5) (36.0-41.2) (2.14-3.27) (187.1-199.9) (43.1-45.7) (4.17–4.55)
Male 82 158.1 769 41.3 3.83 2,110 222.8 7,245 51.6 4.32 (126.3-198.0) (37.4-45.6) (3.00-4.89) (213.0-232.9) (49.7-53.6) (4.07-4.58)
Female 22 45.6 816 35.8 1.28 1,743 164.1 6,145 37.2 4.42 (29.4-70.9) (32.6-39.2) (0.81-2.00) (156.2-172.4) (35.5-38.8) (4.13-4.72)
Note: Rates are calculated per 100,000, sex-specific rates are age-standardised, total rates are age-sex-standardised to the 2001 Māori population

187
Table 8.18 Type 1 diabetes mortality (2000-2004) and hospitalisations (2003-2005), all ages, Canterbury and New Zealand (Source: Te Rōpū Rangahau Hauora a Eru Pōmare)
Canterbury New Zealand Māori non-Māori Māori non-Māori Type 1 diabetes
No. Rate
(95% CI) No.
Rate (95% CI)
Rate ratio (95% CI) No.
Rate (95% CI)
No. Rate
(95% CI)
Rate ratio (95% CI)
Mortality Total 6 3.4 64 1.1 3.04 80 2.6 436 0.9 2.88 (1.5-7.6) (0.8-1.5) (1.28-7.21) (2.1-3.2) (0.8-1.0) (2.24-3.69)
Hospitalisation Total 40 37.3 739 66.3 0.56 863 45.9 5,131 55.3 0.83 (27.1-51.3) (61.0-72.0) (0.40-0.78) (42.9-49.2) (53.3-57.3) (0.77-0.90)
Male 28 53.5 302 52.4 1.02 340 37.1 2,476 50.5 0.73 (36.7-78.1) (45.9-60.0) (0.68-1.52) (33.3-41.4) (48.1-53.1) (0.65-0.83)
Female 12 21.0 437 80.1 0.26 523 54.7 2,655 60.0 0.91 (11.6-38.0) (72.0-89.1) (0.14-0.48) (50.1-59.8) (57.0-63.0) (0.82-1.01)
Note: Rates are calculated per 100,000, sex-specific rates are age-standardised, total rates are age-sex-standardised to the 2001 Māori population
Mental health
Table 8.19 Mental health and behavioural disorder hospitalisation, all ages, Canterbury and New Zealand, 2003-2005 (Source: Te Rōpū Rangahau Hauora a Eru Pōmare)
Canterbury New Zealand
Māori non-Māori Māori non-Māori Mental health and behavioural disorders
No.Rate
(95% CI) No.
Rate (95% CI)
Rate ratio (95% CI) No.
Rate (95% CI)
No. Rate
(95% CI)
Rate ratio (95% CI)
Hospitalisation Total 705 663.1 8,429 512.9 1.29 12,376 658.1 49,373 364.0 1.81 (614.5-715.4) (499.1-527.1) (1.19-1.40) (645.9-670.5) (359.1-368.9) (1.77-1.85)
Male 398 740.2 3,475 444.3 1.67 6,746 745.4 22,311 348.7 2.14 (669.0-818.9) (425.6-463.8) (1.49-1.86) (726.8-764.5) (341.7-356.0) (2.07-2.21)
Female 307 585.9 4,954 581.6 1.01 5,630 570.8 27,062 379.2 1.51 (522.2-657.5) (561.4-602.5) (0.89-1.14) (555.3-586.7) (372.5-386.0) (1.46-1.56)
Note: Rates are calculated per 100,000, sex-specific rates are age-standardised, total rates are age-sex-standardised to the 2001 Māori population

188
Avoidable mortality and hospitalisations
Table 8.20 Avoidable mortality (2003-05) and hospitalisations (2005-07), 0-74 years, Canterbury and New Zealand (Source: HDIU)
Canterbury New Zealand
Indicator
Māori Rate
(95% CI)
European/Other Rate
(95% CI) Rate ratio
Māori Rate
(95% CI)
European/Other Rate
(95% CI) Rate ratio
323.3 150.6 2.15 416.3 150.3 2.77 Total (280.7–370.6) (144.4–156.9) (404.9–428.0) (148.1–152.6)
376.3 186.4 2.02 491.9 185.9 2.65 Male(313.7–447.8) (176.6–196.6) (474.0–510.2) (182.3–189.5)
265.5 116.9 2.27 348.0 116.2 2.99
Avoidable mortality
Female(210.2–330.9) (109.5–124.8) (333.4–363.0) (113.5–119.0)
3,931.1 3,285.2 1.20 5,427.9 3,147.1 1.72 Total (3,805.3 - 4,059.9) (3,251.9 - 3,318.7) (5,391.7 - 5,464.3) (3,128.2 - 3,159.0)
3,843.5 3,461.6 1.11 5,446.4 3,412.8 1.60 Male(3,670.4 - 4022.7) (3,413.1 – 3,510.6) (5,394.7 - 5,498.5) (3,392.3 - 3,430.2)
4,001.9 3,112.6 1.29 5,398.0 2,886.6 1.87
Avoidable hospitalisations
Female(3,821.3 - 4,188.8) (3,067.0 - 3,158.7) (5,347.3 – 5,449.0) (2,869.2 – 2,902.6)
Note: Rates are calculated per 100,000 and are age-standardised using the WHO population for people aged under 75 years. European/Other are non-Māori, non-Pacific, non-Asian.

189
9 References
Ahuriri-Driscoll, A., F. Cram, et al. (2004). Mō Tātou. Christchurch, Ngāi Tahu
Development.
Ajwani, S., T. Blakely, et al. (2003). Decades of Disparity: Ethnic mortality trends in New
Zealand 1980-1999. Wellington, Ministry of Health and University of Otago.
Alcohol Advisory Council of New Zealand (2005). The Burden of Death, Disease and
Disability Due to Alcohol in New Zealand. Wellington, Alcohol Advisory Council
of New Zealand.
American Academy of Pediatrics (2005). "Breastfeeding and the Use of Human Milk."
Pediatrics 115(2): 496-506.
Baker, M., J. Milosevic, et al. (2004). Housing, crowding and health. Housing and Health.
P. Howden-Chapman and P. Carroll. Wellington, Department of Public Health,
Wellington School of Medicine and Health Sciences.
Baker, M., J. Zhang, et al. (2006). Housing, Crowding and Health Study: Characteristics
of cohort members and their hospitalisations February 2003 to June 2005. Interim
Report. Wellington, He Kainga Oranga / Housing and Health Research
Programme, Wellington School of Medicine & Health Sciences.
Baxter, J. (2002). Barriers to Health Care for Māori With Known Diabetes: A Literature
Review and Summary of Issues. Wellington, New Zealand National Working
Group on Diabetes.
Baxter, J. (2007). Mental Health: Psychiatric Disorder and Suicide. Hauora: Māori
Standards of Health IV. A study of the years 2000–2005. B. Robson and R. Harris.
Wellington, Te Rōpū Rangahau Hauora a Eru Pōmare: 121-138.
Begg, A. (2008). West Coast – Te Tai O Poutini Māori Health Profile. Greymouth, West
Coast District Health Board

190
Blakely, T., M. Tobias, et al. (2007). Tracking Disparity: Trends in ethnic and
socioeconomic inequalities in mortality, 1981–2004. Wellington, Ministry of
Health.
Bramley, D., J. Broad, et al. (2003). "Differences in patterns of alcohol consumption
between Māori and non-Māori in Aotearoa (New Zealand)." New Zealand Medical
Journal 116(1184).
Bramley, D., T. Riddell, et al. (2004). "A call to action on Māori cardiovascular health."
New Zealand Medical Journal 117(1197).
Brewer, N., F. McKenzie, et al. (2008). Annual Monitoring Report 2007, National
Cervical Screening Programme. Wellington, Centre for Public Health Research,
Massey University.
Canterbury District Health Board (2006). Te Whakamahere Hauora Māori Ki Waitaha.
Māori Health Plan 2007-2011. Christchurch, Canterbury District Health Board.
Coggan, C., R. Hooper, et al. (2002). "Self-reported injury rates in New Zealand." New
Zealand Medical Journal 115(1161): U167.
Cormack, D., G. Purdie, et al. (2007). Cancer. Hauora: Māori Standards of Health IV. A
study of the years 2000–2005. B. Robson and R. Harris. Wellington, Te Rōpū
Rangahau Hauora a Eru Pōmare: 103-119.
Coster, G. (2000). Health Needs Assessment for New Zealand: Background paper and
literature review. Wellington, Ministry of Health.
Craig, E., P. Anderson, et al. (2008). The Health Status of Children and Young People in
Canterbury. Auckland, New Zealand Child and Youth Epidemiology Service.
Crengle, S., R. Lay-Yee, et al. (2005). A Comparison of Māori and Non-Māori Patient
Visits to Doctors: The National Primary Medical Care Survey (NatMedCa):
2001/02. Report 6. Wellington, Ministry of Health.
Crengle, S., R. Pink, et al. (2007). Respiratory disease. Hauora: Māori Standards of Health
IV. A study of the years 2000–2005. B. Robson and R. Harris. Wellington, Te
Rōpū Rangahau Hauora a Eru Pōmare: 169-179.

191
Curtis, E., C. Wright, et al. (2005). "The epidemiology of breast cancer in Māori women
in Aotearoa New Zealand: implications for screening and treatment." New Zealand
Medical Journal 118(1209).
Darling, H. and A. Reeder (2003). "Is exposure to secondhand tobacco smoke in the
home related to daily smoking among youth?" Australian and New Zealand Journal
of Public Health 27(6): 655-656.
Department of Labour (2006). Household Labour Force Survey December 2006
Quarter. Wellington, Department of Labour.
DiFranza, J., C. Aligne, et al. (2004). "Prenatal and postnatal environmental tobacco
smoke exposure and children's health." Pediatrics 113(4 Suppl): 1007–15.
Ellison-Loschmann, L., S. Cheng, et al. (2002). "Time trends and seasonal patterns of
asthma deaths and hospitalisations among Māori and non-Māori." New Zealand
Medical Journal 115(1146): 6-9.
Ellison-Loschmann, L. and N. Pearce (2006). "Improving Access to Health Care Among
New Zealand's Māori Population." American Journal of Public Health 96(4): 612-
617.
Fawcett, J., J. Atkinson, et al. (2008). Record linkage of census and mortality 2001-04
records: New Zealand Census-Mortality Study Technical Report No. 6. Wellington,
Health Inequalities Research Programme, University of Otago, Wellington.
Goldenberg, R. L., J. F. Culhane, et al. (2008). "Epidemiology and causes of preterm
birth." The Lancet 371(9606): 75-84.
Harris, R. (2009). Personal communication.
Harris, R., G. Purdie, et al. (2007). Appendix 3: Estimating Māori hospitalisations and
cancer registrations. Hauora: Māori Standards of Health IV. A study of the years
2000–2005. B. Robson and R. Harris. Wellington, Te Rōpū Rangahau Hauora a
Eru Pōmare: 249-259.
Harris, R., B. Robson, et al. (2007). "Māori and non-Māori differences in caesarean
section rates: a national review." New Zealand Medical Journal 120(1249).

192
Harwood, M., S. Aldington, et al. (2005). "Lung cancer in Māori: a neglected priority."
New Zealand Medical Journal 118(1213).
Harwood, M. and D. Tipene-Leach (2007). Diabetes. Hauora: Māori Standards of Health
IV. A study of the years 2000–2005. B. Robson and R. Harris. Wellington, Te
Rōpū Rangahau Hauora a Eru Pōmare: 103-119.
Health and Disability Intelligence Unit (2008). Canterbury DHB Health Needs
Assessment. Wellington, Health & Disability Intelligence Unit, Health & Disability
Systems Strategy Directorate, Ministry of Health.
Hill, S., D. Sarfati, et al. (2009). "Ethnicity and cancer treatment in New Zealand: do
Māori patients get a worse deal?" Journal of Epidemiology and Community Health
63(Suppl II): A5-A6.
Hill, S., D. Sarfati, et al. (2010). "Survival disparities in Indigenous and non-Indigenous
New Zealanders with colon cancer: the role of patient comorbidity, treatment and
health service factors." Journal of Epidemiology and Community Health 64(2):
117-123.
Howden-Chapman, P., L. Signal, et al. (1999). "Housing and health in older people:
ageing in place." Social Policy Journal of New Zealand 13: 14-30.
Howden-Chapman, P. and N. Wilson (2000). Housing and health. Social Inequalities in
Health: New Zealand 1999. P. Howden-Chapman and M. Tobias. Wellington,
Ministry of Health: 133-145.
Institute of Environmental Science and Research Limited (2009). Notifiable and Other
Diseases in New Zealand. 2008 Annual Surveillance Report. Wellington,
Population and Environmental Health Group, Institute of Environmental Science
and Research Limited.
Jackson, G. and M. Tobias (2001). "Potentially avoidable hospitalisations in New
Zealand, 1989-98." Australian and New Zealand Journal of Public Health 25(3):
212-221.

193
Koopu, P. and V. Keefe-Ormsby (2007). Oral health - Oranga niho. Hauora: Māori
Standards of Health IV. A study of the years 2000–2005. B. Robson and R. Harris.
Wellington, Te Rōpū Rangahau Hauora a Eru Pōmare: 181-187.
Loring, B. and M. Ratima (2009). Health Needs Assessment for Māori. Waitemata
District Health Board 2009. North Shore City, Waitemata District Health Board.
Mantell, C. D., E. Craig, et al. (2004). "Ethnicity and birth outcome: New Zealand trends
1980-2001: Part 2. Pregnancy outcomes for Maori women." Australian and New
Zealand Journal of Obstetrics and Gynaecology 44(6): 537-540.
Mental Health Commission (1998). Blueprint for Mental Health Services in New
Zealand. Wellington, Mental Health Commission.
Mental Health Commission (2007). Access to Mental Health Services 2005/06.
Wellington, Mental Health Commission.
Minister of Health and Associate Minister of Health (2002). He Korowai Oranga - Māori
Health Strategy. Wellington, Ministry of Health.
Minister of Health and Associate Minister of Health (2006). Whakatātaka Tuarua: Māori
Health Action Plan 2006–2011. Wellington, Ministry of Health.
Ministry of Health (1999). Our Health, Our Future: Hauora Pakari, Koiora Roa. The
Health of New Zealanders 1999. Wellington, Ministry of Health.
Ministry of Health (2002). Breastfeeding: A Guide to Action. Wellington, Ministry of
Health.
Ministry of Health (2002). Modelling Diabetes: A summary. Public Health Intelligence
Occasional Bulletin No 11. Wellington, Ministry of Health.
Ministry of Health (2002). Reducing Inequalities in Health. Wellington, Ministry of
Health.
Ministry of Health (2004). Ethnicity Data Protocols for the Health and Disability Sector.
Wellington, Ministry of Health.

194
Ministry of Health (2005). Health and Participation: an active agenda. Advice to
Incoming Minister of Health. Wellington, Ministry of Health.
Ministry of Health (2006). The Annual Report 2005/06 including The Health and
Independence Report: Annual Report for the year ended 30 June 2006: Director-
General of Health’s Annual Report on the State of Public Health 2006. Wellington,
Ministry of Health.
Ministry of Health (2006). New Zealand Suicide Trends: Mortality 1921–2003,
hospitalisations for intentional self-harm 1978–2004. Monitoring Report No 10.
Wellington, Ministry of Health.
Ministry of Health (2006). Tatau Kahukura: Māori Health Chart Book. Public Health
Intelligence Monitoring Report No 5. Wellington, Ministry of Health.
Ministry of Health (2007). Drug Use in New Zealand: Analysis of the 2003 New Zealand
Health Behaviours Survey – Drug Use. Wellington, Ministry of Health.
Ministry of Health (2008). Food and Nutrition Guidelines for Healthy Infants and
Toddlers (Aged 0–2): A background paper (4th Ed). Wellington, Ministry of
Health.
Ministry of Health (2008). A Portrait of Health. Key Results of the 2006/07 New
Zealand Health Survey. Wellington, Ministry of Health.
Ministry of Health (2008). Presenting Ethnicity: Comparing prioritised and total response
ethnicity in descriptive analyses of New Zealand Health Monitor surveys.
Wellington, Ministry of Health.
Ministry of Health (2008). The Whānau Ora Tool. Wellington, Ministry of Health.
Ministry of Health and University of Otago (2006). Decades of Disparity III: Ethnic and
socioeconomic inequalities in mortality, New Zealand 1981–1999. Wellington,
Ministry of Health.
National Breastfeeding Advisory Committee (2008). Background report. Protecting,
Promoting and Supporting Breastfeeding in New Zealand: A review of the context

195
of breastfeeding in New Zealand and of the evidence for successful interventions
supporting breastfeeding. Wellington, Ministry of Health.
New Zealand Health Information Service (2007). Report on Maternity: Maternal and
Newborn Information 2004. Wellington, Ministry of Health.
Oakley Browne, M., J. Wells, et al. (2006). Te Rau Hinengaro: The New Zealand Mental
Health Survey. Wellington, Ministry of Health.
Perinatal and Maternal Mortality Review Committee (2009). Perinatal and maternal
mortality in New Zealand 2006: Second report to the Minister of Health. June
2007 to June 2008. Wellington, Ministry of Health.
Public Health Advisory Committee (2004). The Health of People and Communities. A
Way Forward: Public policy and the economic determinants of health. .
Wellington, Public Health Advisory Committee.
Robson, B. and R. Harris, Eds. (2007). Hauora: Māori Standards of Health IV. A study
of the years 2000–2005. Wellington, Te Rōpū Rangahau Hauora a Eru Pōmare.
Robson, B. and G. Purdie (2007). Appendix 1: Methods. Hauora: Māori Standards of
Health IV. A study of the years 2000–2005. B. Robson and R. Harris. Wellington,
Te Rōpū Rangahau Hauora a Eru Pōmare: 229-239.
Robson, B. and G. Purdie (2007). Mortality. Hauora: Māori Standards of Health IV. A
study of the years 2000–2005. B. Robson and R. Harris. Wellington, Te Rōpū
Rangahau Hauora a Eru Pōmare: 33-61.
Robson, B., G. Purdie, et al. (2006). Unequal Impact: Māori and Non-Māori Cancer
Statistics 1996–2001. Wellington, Ministry of Health.
Robson, B., G. Purdie, et al. (2007). "Age standardisation - an indigenous standard?"
Emerging Themes in Epidemiology 4(3).
Rose, G. (1992). The Strategy of Preventive Medicine. Oxford, Oxford University Press.
Sadler, L., L. McCowan, et al. (2002). "Associations between ethnicity and obstetric
intervention in New Zealand." New Zealand Medical Journal 114(1147): 36–39.

196
Salmond, C., P. Crampton, et al. (2007). NZDep2006 Index of Deprivation. Wellington,
University of Otago.
Serruys, P. W., M.-C. Morice, et al. (2009). "Percutaneous Coronary Intervention versus
Coronary-Artery Bypass Grafting for Severe Coronary Artery Disease." New
England Journal of Medicine 360(10): 961-972.
Shaw, C., J. Atkinson, et al. (2009). "(Mis)classification of ethnicity on the New Zealand
Cancer Registry: 1981–2004." New Zealand Medical Journal 122(1294).
Shaw, C., R. Cunningham, et al. (2008). Next Steps Towards a Feasibility Study for
Colorectal Cancer Screening in New Zealand: Report for the Ministry of Health.
Wellington, University of Otago.
Sheerin, I., G. Allen, et al. (2006). "Avoidable hospitalisations: potential for primary and
public health initiatives in Canterbury, New Zealand." New Zealand Medical
Journal 119(1236).
Simmonds, S. and B. Robson (2008). Independent Māori Monitoring Report 1.
BreastScreen Aotearoa July 2004 to June 2006. 50–64 years. Wellington, University
of Otago, Te Rōpū Rangahau Hauora a Eru Pōmare (Eru Pōmare Māori Health
Research Centre).
Statistics New Zealand (2006). DHB Population projections. Wellington, Statistics New
Zealand.
Stevens, W., G. Stevens, et al. (2008). "Ethnic differences in the management of lung
cancer in New Zealand." Journal of Thoracic Oncology 3(3): 237-244.
Tukuitonga, C. and A. Bindman (2002). "Ethnic and gender differences in the use of
coronary artery revascularisation procedures in New Zealand." New Zealand
Medical Journal 115(1152): 179-82.
Twiss, J., R. Metcalfe, et al. (2005). "New Zealand national incidence of bronchiectasis
"too high" for a developed country." Archives of Diseases in Childhood 90(7):
737-740.

197
U.S. Department of Health and Human Services (2004). The Health Consequences of
Smoking: A Report of the Surgeon General. Atlanta, GA, U.S. Department of
Health and Human Services, Centers for Disease Control and Prevention, National
Center for Chronic Disease Prevention and Health Promotion, Office on Smoking
and Health.
United Nations Children’s Fund and World Health Organization (2004). Low
Birthweight: Country, regional and global estimates. New York, UNICEF.
Vink, J., G. Willemsen, et al. (2003). "The association of current smoking behavior with
the smoking behavior of parents, siblings, friends and spouses." Addiction 98: 923-
31.
Wells, J. E. (2009). Personal communication.
Wells, J. E., J. Baxter, et al. (2007). Substance use disorders in Te Rau Hinengaro: The
New Zealand Mental Health Survey. Wellington, Alcohol Advisory Council of
New Zealand.
Wilkinson, R. and M. Marmot, Eds. (2006). Social Determinants of Health. Oxford,
Oxford University Press.
Woodward, A. and M. Laugesen (2001). Morbidity attributable to second hand cigarette
smoke in New Zealand. Wellington, Ministry of Health.
World Health Organisation (2002). The Optimal Duration of Exclusive Breastfeeding.
Report of the Expert Consultation. Geneva, World Health Organisation.

198
ISBN 978-0-473-16858-2 (electronic)
ISBN 978-0-473-16859-9 (print)