Harvey Nash / KPMG CIO Survey 2017 - Full U.S. report€¦ · HARVEY NASH / KPMG CIO SURVEY 2017...
62
+ HARVEY NASH / KPMG CIO SURVEY 2017
Transcript of Harvey Nash / KPMG CIO Survey 2017 - Full U.S. report€¦ · HARVEY NASH / KPMG CIO SURVEY 2017...

+
H A RV E Y N A S H / K P M G C I O S U RV E Y 2 0 1 7

2HARVEY NASH / KPMG CIO SURVEY 2017
About the Survey
The 2017 Harvey Nash/KPMG CIO Survey is the largest IT leadership survey in the world in terms of number of respondents. The survey of 4,498 CIOs and technology leaders was conducted between 19 December 2016 and 3 April 2017, across 86 countries.
Bob MianoPresident & CEOHarvey Nash USAPAC
Denis BerryKPMG PrincipalU.S. CIO Advisory Leader
Navigating uncertaintyCIOs are used to change. The technology sector has been busily reinventing itself on a regular basis since the first commercial computers were launched in the 1950s, each time bringing a new opportunity or challenge. Often in equal measure.
But in this year's CIO Survey, technology leaders are telling us that change has reached unprecedented levels, and increasingly it is coming from unexpected corners.
Few would have predicted the amount of energy to be spent discussing and evaluating the recent political change in many Western countries and how it is and potentially could impact business. Few would have predicted how competitors are now co-operating in ‘business ecosystems’ and the astonishing advances that have been made in data analytics, cloud, or – as this year’s survey reveals – automation.
While many things remain uncertain, what is certain is the steadfast focus by many technology executives on helping their organizations become more nimble and digital, to navigate through unpredictable change, and to thrive in an uncertain world. Whether that’s taking calculated bets on new innovation, or finding new skills or talent in unexpected places, this year’s survey shines a light on important changes being embraced today by CIOs.
Proudly presenting the views of 4,500 technology executives, this year’s Harvey Nash/KPMG CIO Survey is the largest IT leadership survey ever undertaken. From board priorities to business relationships to careers, the CIO Survey provides critical insights and guidance about how to succeed in this fast-changing environment.
We hope the unique insights this CIO Survey brings will help you navigate your organization, and your career, through an uncertain world.

3HARVEY NASH / KPMG CIO SURVEY 2017
The CIO Survey Infographic
Key data from this year’s report.
Navigating Uncertainty
How IT leaders are helping their organisations through uncharted territory.
Executive Summary
Dr Jonathan Mitchell, Harvey Nash, gives his perspective on the survey.
Contents
The Harvey Nash / KPMG CIO Survey is the world’s largest IT leadership survey. For almost two decades it has been covering
the issues that matter to technology leaders: from board priorities, to technology strategy, to careers.
www.hnkpmgciosurvey.com
GLOBAL RESULTS
CIO operational prioritiesTurbulent times call for IT leaders to increase focus on delivering consistency and stability. And their influence grows.
People, skills and talentThe skills shortage continues, and growth in female IT leaders stalls.
Dealing with digitalMore organisations have digital strategies than ever before, but how successful are organisations being with digital?
Managing the technology functionFrom automation to robotics, from outsourcing to cloud, how are technology functions changing?
CIO careersWhat are the career plans and aspirations from IT leaders across the world? And just how happy are IT leaders?
Special report:
Are you a digital leader? KPMG
Regional league tables
We compare 28 countries across key data from the CIO Survey. How does your country compare?
Special report:
Digital ecosystem business models are consolidating – move quickly! MIT CISR
04 06
12
20
24
33
45
5331
57
08
Marc E. Snyder, Technology Global Center of Excellence, KPMG in the US, highlights what characterises a digital leader, using the survey’s findings.
Stephanie L. Woerner and Peter Weill, from the Massachusetts Institute of Technology Center for Information Systems Research, describe four business models for the digital economy.

DEALING WITH DIGITAL
MANAGING IT
CIO CAREERS
CIO PRIORITIESMANAGING CHANGE
TOP RESPONSES TO POLITICAL/BUSINESS/ECONOMIC CHANGE:
say the political, business and economic environment is becoming more unpredictable.
Creating a more nimble technology
platform52%
Working with restrictedbudgets 49%
Investingin cybersecurity 45%
Increasingly, uncertain times seem to be correlated with shifting IT leadership priorities:
INCREASINGLY important compared with last year:
Delivering consistent and stable IT performance – UP 21%
Developing innovative new products and services – UP 21%
Saving costs – UP 8%
Increasing operational e�ciencies – UP 7%
DECREASINGLY important compared with last year:
Better engagement with customers/prospects – DOWN 18%
Improving the success rate of projects – DOWN 11%
PEOPLE, SKILLS AND TALENT
Six in ten consistentlyreport technology skills shortage2017 (62%), 2016 (65%), 2015 (59%), 2014 (60%)
SKILLS THAT ARE MOST SCARCE:Big Data/Analytics (42%) – most in demand by large employers Business Analysis (34%) – most in demand by smaller employersEnterprise Architecture (34%) – fastest growing – up 26% compared with last year
No progress on women in IT leadership
2017
Yet 35% of organisations have a formal diversity initiative in placeThis varies greatly by organisational size:(28%) smaller(51%) mid-sized(72%) larger organisationsDespite slow progress:more women had salary rises than men (42% versus 32%)
9% of senior IT leadership are women, same as last year
TOP TACTICS TO FOSTER DIGITAL INNOVATION ARE TO:
The majority of CIOs (58%) can expect to be in the job for five years or less:
28% of CIOs at larger firms more likely to move job this yearvs 20% at smaller organisations
CIOs most likely to move job this year are in Charity/Non-Profit34% want to change role
CIO job satisfaction has risen by 18%since 2015 and is at a three-year high(39% rate themselves ‘very fulfilled’):
44% of CIOs who sit on their executive management team record the highest levels of job satisfaction
Non-Profit CIOs see 12% drop in fulfilment(likely linked to career restlessness)
33% of CIOs benefited from an increase in base salary last year,62% of salaries were unchanged
Total number of respondents:
4,49864%
APAC
68%Latin America 64%
Europe 63%North America
56%
Skills shortage is unequal across the world:
Proportion of organisations with enterprise-wide digital strategy is up by 52% in three years: 2017 41%, 2016 35%, 2015 27%
A quarter of organisations (25%) now employ a Chief Digital O�cer: 2017 25%, 2016 18%, 2015 17%, 2014 7%
1Dedicate
more time for innovation
54%
2Partner with innovative
organisations e.g. academic
institutions 52%
3Ring-fencing innovation budgets
31%a distant third
TOP WAYS IT LEADERS ARE LOOKING TO IMPROVE AGILITY AND RESPONSIVENESS:
1Implementing
agilemethodologies
28%
2Buying more
solutions‘as a service’
19%
3Taking di�erent approaches with multi-mode IT
15%
Biggest impediment to digital success is resistance to change 43%.Only 25% saw lack of budgetas a major issue.
34% OF IT LEADERS ARE ALREADY INVESTING OR ARE PLANNING TO INVEST IN DIGITAL LABOUR IN 2017:
62% of respondents from larger organisations are investing,compared with 27% of peers in smaller firms
27% believe digital labour is most e�ective at improving quality, ahead of 24% whovalue e�ciency
Relentless rise of organisations being subject to ‘major’ cyber attacks during past four years:2017 32%, 2016 28%, 2015 25%, 2014 22%
IT BUDGETS ARE GROWING:79% have seen budgets upheld or increased this yearOnly one in five IT leaders (21%) have seen IT budgets cut
1 2 3
4HARVEY NASH / KPMG CIO SURVEY 2017

DEALING WITH DIGITAL
MANAGING IT
CIO CAREERS
CIO PRIORITIESMANAGING CHANGE
TOP RESPONSES TO POLITICAL/BUSINESS/ECONOMIC CHANGE:
say the political, business and economic environment is becoming more unpredictable.
Creating a more nimble technology
platform52%
Working with restrictedbudgets 49%
Investingin cybersecurity 45%
Increasingly, uncertain times seem to be correlated with shifting IT leadership priorities:
INCREASINGLY important compared with last year:
Delivering consistent and stable IT performance – UP 21%
Developing innovative new products and services – UP 21%
Saving costs – UP 8%
Increasing operational e�ciencies – UP 7%
DECREASINGLY important compared with last year:
Better engagement with customers/prospects – DOWN 18%
Improving the success rate of projects – DOWN 11%
PEOPLE, SKILLS AND TALENT
Six in ten consistentlyreport technology skills shortage2017 (62%), 2016 (65%), 2015 (59%), 2014 (60%)
SKILLS THAT ARE MOST SCARCE:Big Data/Analytics (42%) – most in demand by large employers Business Analysis (34%) – most in demand by smaller employersEnterprise Architecture (34%) – fastest growing – up 26% compared with last year
No progress on women in IT leadership
2017
Yet 35% of organisations have a formal diversity initiative in placeThis varies greatly by organisational size:(28%) smaller(51%) mid-sized(72%) larger organisationsDespite slow progress:more women had salary rises than men (42% versus 32%)
9% of senior IT leadership are women, same as last year
TOP TACTICS TO FOSTER DIGITAL INNOVATION ARE TO:
The majority of CIOs (58%) can expect to be in the job for five years or less:
28% of CIOs at larger firms more likely to move job this yearvs 20% at smaller organisations
CIOs most likely to move job this year are in Charity/Non-Profit34% want to change role
CIO job satisfaction has risen by 18%since 2015 and is at a three-year high(39% rate themselves ‘very fulfilled’):
44% of CIOs who sit on their executive management team record the highest levels of job satisfaction
Non-Profit CIOs see 12% drop in fulfilment(likely linked to career restlessness)
33% of CIOs benefited from an increase in base salary last year,62% of salaries were unchanged
Total number of respondents:
4,49864%
APAC
68%Latin America 64%
Europe 63%North America
56%
Skills shortage is unequal across the world:
Proportion of organisations with enterprise-wide digital strategy is up by 52% in three years: 2017 41%, 2016 35%, 2015 27%
A quarter of organisations (25%) now employ a Chief Digital O�cer: 2017 25%, 2016 18%, 2015 17%, 2014 7%
1Dedicate
more time for innovation
54%
2Partner with innovative
organisations e.g. academic
institutions 52%
3Ring-fencing innovation budgets
31%a distant third
TOP WAYS IT LEADERS ARE LOOKING TO IMPROVE AGILITY AND RESPONSIVENESS:
1Implementing
agilemethodologies
28%
2Buying more
solutions‘as a service’
19%
3Taking di�erent approaches with multi-mode IT
15%
Biggest impediment to digital success is resistance to change 43%.Only 25% saw lack of budgetas a major issue.
34% OF IT LEADERS ARE ALREADY INVESTING OR ARE PLANNING TO INVEST IN DIGITAL LABOUR IN 2017:
62% of respondents from larger organisations are investing,compared with 27% of peers in smaller firms
27% believe digital labour is most e�ective at improving quality, ahead of 24% whovalue e�ciency
Relentless rise of organisations being subject to ‘major’ cyber attacks during past four years:2017 32%, 2016 28%, 2015 25%, 2014 22%
IT BUDGETS ARE GROWING:79% have seen budgets upheld or increased this yearOnly one in five IT leaders (21%) have seen IT budgets cut
1 2 3
5HARVEY NASH / KPMG CIO SURVEY 2017

6HARVEY NASH / KPMG CIO SURVEY 2017
Executive summary
Times are changing?Last year, many predicted that the slow, steady recovery after the Great Recession would continue and we all rather hoped that economic growth would accelerate. Few saw seismic change on the horizon. How wrong we were. How did CIOs respond? Did we see panic? Not a bit of it. CIOs
are no strangers to rapidly changing environments and perhaps the odd crisis or two. They responded with measured calmness. Our survey results suggest that many decided to wait and see, while they made careful preparations behind the scenes. More than half our respondents told us they are creating more nimble technology platforms to deal with unpredictable circumstances. Also, in times of change it seems that relationships are everything. Many respondents said that they are planning to do more work with familiar long-term partners whom they can trust.
Stability is back on the agendaAs far as operational priorities are concerned, consistent and stable IT rocketed to the top of the priority list. Smaller companies place particular priority on this area. There were, however, interesting differences across sectors. While the Financial Services, Government, Utilities and Retail sectors all placed stability at the top of their priority list, the Manufacturing, Construction and Education sectors all rated business process improvements at the top of theirs. For the Broadcast and Media sector, however, digital disruption appears to have prompted substantial changes for their businesses. Developing new products and services, and driving revenue growth, are now their highest priorities.
CIO strategic influence continues its relentless growthIn recent years, the CIO has progressively become more influential. This year, that trend has continued apace with more than seven in ten respondents telling us that CIO influence is increasing. More
CIOs are also taking a seat at the top table. In 2005, barely 38 per cent of CIOs sat on their executive committee; today that figure has risen to 62 per cent. IT leaders are also increasingly working at board level. More than three-quarters attended a board meeting within the last 12 months. Popular board topics include IT strategy, technology investments, digital transformation and, of course, the ever-present challenge of cyber security. This increased exposure may have led many CIOs to take leading roles in innovating in their organisations.
Projects are as difficult as everLast year, we reported that the success rate of projects was falling. A backdrop of increasing complexity and the drive to rapidly implement innovative digital projects may be to blame. This year, we asked about the problem areas. Weak ownership, over-optimism and unclear objectives topped the list; while lack of talent, poor governance and complexity formed a second tranche of challenges. But there was good news for suppliers. A mere 7 per cent of our respondents blamed their failures on their IT supply chains.
Skills shortages as usualIn each of the last four years, around 60 per cent of respondents have reported skills shortages. This is very different to the heady days before the Great Recession when four out of five respondents persistently complained about this problem. Is this the new normal? Big data/analytics, business analysis and enterprise architecture are the most in-demand skills. This year, architecture staged a comeback after several years of decline. Could this demand be related to the increasingly complex project landscape that many organisations find themselves grappling with? In terms of gender diversity, progress remains slow. The improvement we saw last year seems to have petered out. While a third of IT leaders have diversity initiatives in place, there has been little, if any, movement in the last five years. Barely 10 per cent of IT leaders are female.
CDOs are on the march againA quarter of organisations now have a Chief Digital Officer (CDO). After something of a lull last year, CDO roles are being filled in ever-greater numbers. There are now three times as many CDOs around as there were three years ago. Broadcasting and
7HARVEY NASH / KPMG CIO SURVEY 2017
Media together with the Advertising sector lead the charge, while the Manufacturing, Energy, Utilities and Education sectors are least populated with CDOs. There is also variation with company size. More than half of the largest companies now have a CDO in place while only a fifth of those with IT budgets of less than $50m have taken the plunge.
More than just a silver lining?Cloud technology has received very positive feedback this year. There seems to be something here for everyone. Larger organisations are more likely to report the benefit of cost savings and the improved responsiveness from cloud technologies. Smaller companies are more likely to tell us that they love stability and simplicity, and value the scalability of their cloud solutions. We think that the cloud model has been a good example of the increasing maturity of the industry. Suppliers are providing robust, flexible solutions, while customers are much less ‘prima donna’ about the uniqueness of their estate, clearing the way for the exploitation of cloud technology.
Dealing with the cyber-crime waveConfidence in cyber security is at an all-time low. Today, only one in five respondents feel that they are very well prepared to respond to cyber attacks. The relative ease with which hackers seem to be able to ghost their way into apparently well-protected systems creates sleepless nights for any IT leader. Last year, we looked at where the attacks were coming from. Respondents told us that organised cyber crime was their top concern, followed by the amateur hackers. This year, the profile is unchanged although more people are reporting trouble from ‘insiders’. Overall, just under a third of respondents reported that they had been subject to a major security incident in the past 24 months. However, larger companies seem to be more at risk. More than half tell us that they have suffered recent attacks. Utilities and Government organisations seem to receive the most attention from hackers, followed by the Education, Telecoms and Pharmaceuticals sectors.
Are the robots coming?This year, we asked some questions about robotics and digital labour. We learned that IT leaders are starting to make significant investments in this area. The convergence of robotics, machine learning and advanced analytics is certainly a good way of dealing with the challenge of ‘big data’. A quarter of respondents are seeing very effective results. Technologies such as cognitive automation, together with both basic and advanced robotic process automation, seem to be areas where increasing numbers of organisations are investing. The robots, it seems, are certainly on their way.
Outsourcing intent unchangedOutsourcing remains high on everyone’s agenda. As in previous years, around half of our respondents are planning to increase their outsourcing commitment while around four in ten are looking to do more offshoring – a trend that has been largely unchanged in recent years. IT leaders tell us that they want to free up their own resources, gain access to new skills and save themselves some money. Hot outsourcing areas include application development, followed by infrastructure and software maintenance.
CIOs love their jobs!CIOs who told us that they are ‘very fulfilled’ in their role is at a three-year high. Over the last few years, respondents have gradually been upgrading their preference from ‘quite fulfilling’ to ‘very fulfilling’. And there are plenty of good reasons for this. More than eight out of ten IT leaders are seeing stable or growing budgets. And those on the executive committee seem to be the happiest of them all. We’re not sure whether money can buy you happiness, but strategic influence certainly seems to help. In terms of sector differences, this year the happiest CIOs are to be found in the Energy, Professional Services and Education sectors, where nearly nine out of ten tell us that they are having a ball. Happy days!
Dr Jonathan Mitchell Non-Executive Chair, Global CIO Practice, Harvey Nash

8HARVEY NASH / KPMG CIO SURVEY 2017
A changing world
64% say the political, business and economic
environment is becoming more unpredictable
Increased complexity
61% say projects more complex, and 58% say more ambitious, than
5 years ago
No ‘blueprint’ for digital
88% feel their business has yet to fully benefit
from their digital strategy
Rising cyber threat
45% rise in major cyber attacks over
past four years (22% to 32%)
Less visibility
25% say they are reducing
longer-term planning (3 years+)

9HARVEY NASH / KPMG CIO SURVEY 2017
Fostering innovation
54% dedicating people and time to deliver innovation
Getting to grips with digital
52% increase in organisations with an enterprise-wide digital strategy in past 2 years
(27% to 41%)
The ‘navigator’ CIO
71% say strategic influence of the CIO is
growing. 68% attended a main board meeting
in last quarter
Increasing agility
52% creating a more nimble platform to respond to change
A focus on stability
63% are focusing on the basics: delivering a
stable IT platform

10HARVEY NASH / KPMG CIO SURVEY 2017

11HARVEY NASH / KPMG CIO SURVEY 2017
1. Global results

1. Global results
12HARVEY NASH / KPMG CIO SURVEY 2017
Turbulent times call for IT leaders to increase focus on delivering consistency and stability
2013 2014 2015 2016 2017Change past 12 months
Delivering consistent and stable IT performance to the business 70% 59% 57% 52% 63% 21%
Increasing operational efficiencies 68% 63% 61% 58% 62% 7%
Improving business processes 60% 60% 58% 57% 59% 3%
Saving costs 71% 57% 54% 50% 54% 8%
Developing innovative new products and services 51% 41% 41% 42% 51% 21%
Delivering business intelligence/analytics 48% 41% 47% 46% 46% 0%
Enabling business change 53% 51% 48% 43% 42% -2%
Driving revenue growth 42% 45% 42% 40% 40% 0%
Cyber security NEW IN 2016 41% 40% -2%
Managing operational risk and compliance 41% 40% 39% 36% 34% -6%
Better engagement with customers/prospects 33% 36% 38% 38% 31% -18%
Improving the success rate of projects 36% 30% 29% 26% 23% -11%
Improving time to market 31% 29% 30% 26% 23% -11%
Outperforming competitors with new business models 26% 23% 24% 24% 22% -8%
Enabling mobile commerce 33% 24% 22% 19% 19% 0%
Driving synergies from mergers & acquisitions 17% 17% 15% 13% 11% -15%
Investing in social media platforms N/A 10% 9% 7% 7% 0%
Achieving sustainable/green IT 9% 9% 8% 7% 6% -14%
Reputation management via social media technology 14% 8% 9% 7% 5% -29%
Table 1: What are the key business issues that your management board is looking for IT to address?
1.1 Operational prioritiesHindsight is a wonderful thing. Few could have predicted the extraordinary political, economic and technology changes that have occurred in recent years, and these increasingly uncertain times seem to be correlated with shifting IT leadership priorities. Last year, stable IT performance had dropped down the rankings. Customer engagement seemed to be an increasing priority, suggesting that IT leaders had cracked the difficult task of managing a complex operational environment. But, this year, stable IT
performance has rocketed back to the top of the list along with a similar increase for the need to develop innovative new products and services. These priorities illustrate the difficult landscape in which IT leaders not only have to take risks in implementing business process change with unprecedented levels of technical innovation, but they also have to make sure that these new systems are rock-solid in terms of performance and reliability: a real headache.
Chart 8: Does the skills shortage prevent your organisation from keeping up with the pace of change? 2005 - 2014
Cyber security and the risk it poses to enterprise are increasingly worrisome, especially as technology becomes more global and is the “secret sauce” differentiating many companies. Cyber attackers only have to be lucky once to have a serious impact.
At the same time as we are experiencing double-digit growth, we are also transforming the IT model to have it completely focused on our users’ and clients’ digital experiences. The challenge requires a new mind-set, from the IT team to vendors and business areas. The transition requires careful steps when shifting to the new model as both will coexist for some time until the move is irreversible and contagious.
Creating the right environment and the optimal set of conditions to fuel amazing technology talent to deliver business value over the next 10+ years. I personally have a vision of a world where diverse talent is truly recognised and nurtured, where individuals can manage their individual needs (home and work) and where what you deliver and how you do it is far more important than where or when you do it.
What is the single biggest thing keeping you awake at night?
Triona O’Keeffe, CIO, Direct Line Group, UK
Christian H A Reis,CIO, VLI Multimodal S/A, Brazil
Fidelma Russo, CTO, Iron Mountain, USA

1. Global results
HARVEY NASH / KPMG CIO SURVEY 201713
HARVEY NASH / KPMG CIO SURVEY 2017
37%
63%
Operational priorities related to organisation sizeIT leaders at smaller and mid-sized organisations are spending more time delivering consistent and stable IT performance compared with respondents at larger organisations, who perhaps have more insulation against changeable political and economic environments. IT leaders at larger organisations seem to be more focused on ‘business as usual’ IT – saving money and improving efficiencies – rather than on stable systems, while respondents at mid-sized organisations are more focused on enabling business change.
Priorities at larger organisations are evidently different in 2017 compared with smaller organisations
Ranking #
IT budgetSmaller <$50m
IT budgetMid $50m to $250m
IT budgetLarger $250m+
1Consistent and stable IT (63%)
Consistent and stable IT (68%)
Saving costs (65%)
2Increasing operational
efficiencies (63%)Increasing operational
efficiencies (63%)Increasing operational
efficiencies (60%)
3Improving business
processes (62%)Saving costs (61%) Consistent and stable IT (57%)
4 Saving costs (52%)New products and
services (56%)New products and services
(53%)
5New products and
services (50%)Enabling business change (53%)
Business intelligence analytics (47%)
Table 2: What are the key business issues that your management board is looking for IT to address? By size of IT budget.
When we looked into the differences between sectors, we saw some things we expected, but also others that we did not. We were not surprised that Financial Services, Government IT departments, Utilities and Retail businesses all rate stable IT services at the top of their list. Similarly, the presence of analytics in the Healthcare sector as a priority makes perfect sense; this sector has been one of the leading proponents in this area for a decade or more. But there are surprises: the Broadcast and Media sector seems to have completely broken free from its peers in terms of priorities, with a headlong rush into revenue-linked innovation, probably a consequence of digital disruption. The priority in this sector seems to be to generate money and to do it cheaply.
Many sectors share similar top IT priorities, with Media and Tech sectors considered outliers
#1 Ranked Priority #2 Ranked Priority #3 Ranked Priority
Advertising Operational efficiencies Business processes New products & services
Broadcast/Media New products & services Driving revenue growth Saving costs
Charity/Non-Profit Operational efficiencies Business processes Consistent and stable IT
Construction/Engineering Business processes Consistent and stable IT Operational efficiencies
Education Business processes Consistent and stable IT Operational efficiencies
Energy Operational efficiencies Saving costs Business processes
Financial Services Consistent and stable IT Saving costs New products & services
Government Consistent and stable IT Operational efficiencies Business processes
Healthcare Operational efficiencies Consistent and stable IT Business intelligence/analytics
Leisure Consistent and stable IT Operational efficiencies Business intelligence/analytics
Manufacturing Business processes Operational efficiencies Consistent and stable IT
Pharmaceuticals Operational efficiencies Business processes Consistent and stable IT
Professional Services Operational efficiencies Business processes New products & services
Retail Consistent and stable IT Operational efficiencies Business processes
Technology New product & services Consistent and stable IT Driving revenue growth
Telecommunications Saving costs Consistent and stable IT New product & services
Utilities Consistent and stable IT Saving costs Operational efficiencies
Table 3: What are the key business issues that your management board is looking for IT to address? By sector.

1. Global results
14HARVEY NASH / KPMG CIO SURVEY 2017
Almost two-thirds of IT leaders are adapting technology plans due to growing unpredictability
Most IT leaders across all sectors are actively revising plans to succeed in unpredictable times
Chart 1: Agree or disagree: The wider/global political, business and economic environment has become more unpredictable, and as a result I have had to adapt my technology strategy and plans.
Chart 2: Agree or disagree: The wider/global political, business and economic environment has become more unpredictable, and as a result I have had to adapt my technology strategy and plans. Agree.
Managing changeAlmost two-thirds of respondents (64 per cent) say the wider political, business and economic environment has become more unpredictable, and as a result they are adapting their technology strategy and plans. Clearly then, Brexit, Trump and a new era of unpredictability are having an impact on IT leaders. However, as we will see later on, respondents appear quite sanguine about the unpredictable environment in 2017.
In both Asia Pacific (68 per cent) and Latin America (87 per cent), more respondents are actively changing plans to adapt to a more volatile global political, business and economic environment, compared with the global average. Where we have followed up with some IT leaders, they tell us that macro-economic conditions guide their thinking more than domestic political changes; and, despite greater unpredictability, there seems to be cautious optimism about the future.
Energy 69%Pharceuticals 69%Professional Services 69%Financial Services 66%Advertising 65%Government 65%Construction / Engineering 63%GLOBAL AVERAGE 64%Healthcare 63%Transport 63%Broadcast / Media 62%Retail / Leisure 62%Education 61%Technology 61%Utilities 61%Manufacturing 60%Charity / Non Profit 52%
2017North America 59%Europe 61%GLOBAL AVERAGE 64%Asia Pacific 68%Latin America 87%
69% 69% 69% 66% 65% 65% 63% 64% 63% 63% 62% 62% 61% 61% 61% 60% 52%
0% 10% 20% 30% 40% 50% 60% 70% 80%
59% 61% 64%68%
87%
0%
10%
20%
30%
40%
50%
60%
70%
80%
90%
100%
North America Europe GLOBAL AVERAGE Asia Pacific Latin America
64%
36%
Chart Title
Agree
DisagreeEnergy 69%Pharceuticals 69%Professional Services 69%Financial Services 66%Advertising 65%Government 65%Construction / Engineering 63%GLOBAL AVERAGE 64%Healthcare 63%Transport 63%Broadcast / Media 62%Retail / Leisure 62%Education 61%Technology 61%Utilities 61%Manufacturing 60%Charity / Non Profit 52%
2017North America 59%Europe 61%GLOBAL AVERAGE 64%Asia Pacific 68%Latin America 87%
69% 69% 69% 66% 65% 65% 63% 64% 63% 63% 62% 62% 61% 61% 61% 60% 52%
0% 10% 20% 30% 40% 50% 60% 70% 80%
59%
61%
64%
68%
87%
0% 20% 40% 60% 80% 100%
North America
Europe
GLOBAL AVERAGE
Asia Pacific
Latin America
64%
36%
Chart Title
Agree
Disagree

1. Global results
HARVEY NASH / KPMG CIO SURVEY 201715
HARVEY NASH / KPMG CIO SURVEY 2017
Changeable times require more nimble technology
Chart 3: How have you adapted your technology plans to deal with uncertainty?
Ways to manage changeThe single most popular response by IT leaders adapting their technology in response to change was to create a more nimble technology platform (52 per cent). It seems that CIOs are addressing uncertainty head on, and the focus is on the end-to-end platform.
Unpredictability is also having an impact on budget planning for almost half of respondents (49 per cent) and driving further investment in cyber security (45 per cent). During unpredictable times, the winners appear to be partners/suppliers with existing long-term relationships with CIOs. Almost four in ten IT leaders plan to do more work with ‘trusted’ partners this year and have fewer plans to work with new vendors.
13. How have you adapted your technology plans to deal with uncertainty (select up to 3)?
Moving offshore resources onshore 8%Restricting investment on innovation 11%Reducing longer-term (3+ years) planning 26%Working more with trusted partners 39%Investing more in cyber security 45%Finding a way to work with restricted budgets 49%Creating a more nimble technology platform 52%
8%
11%
26%
39%
45%
49%
52%
0% 10% 20% 30% 40% 50% 60%
Moving offshore resources onshore
Restricting investment on innovation
Reducing longer-term (3+ years) planning
Working more with trusted partners
Investing more in cyber security
Finding a way to work with restricted budgets
Creating a more nimble technology platform
CIOs at larger organisations are far more likely to invest in cyber security and reposition offshore resources closer to home in response to growing uncertainty, compared with peers at smaller organisations. These represent the most significant differences in approach based on organisation size (see table below), but there is still a strong sense of ‘wait and see’ by many IT leaders.
CIOs at larger organisations (with resources) can be proactive when responding to change
IT budget less than
$50m
IT budget $50m to $250m
IT budget more than
$250m
Creating a more nimble technology platform to deal with unpredictable circumstances
52% 56% 54%
Finding a way to work with restricted budgets 51% 46% 44%
Investing more in cyber security 43% 55% 53%
Working more with trusted suppliers and partners (fewer new/unknown vendors)
39% 36% 37%
Reducing the amount of longer-term (3+ years) planning 27% 26% 21%
Restricting investment on innovation 12% 8% 13%
Moving offshore resources onshore 7% 8% 15%
Table 4: How have you adapted your technology plans to deal with uncertainty? By size of IT budget.

1. Global results
16HARVEY NASH / KPMG CIO SURVEY 2017
Strategic influenceIn unpredictable times, the strategic influence of the CIO continues to grow. For the first time in a decade, more than seven in ten respondents (71 per cent) believe that the CIO role in their organisation is becoming more strategic. This aligns with the growing proportion of IT leaders who sit on the operational board/executive management team. More than six in ten respondents now do this, the highest level we have recorded and up 9 per cent on last year.
The vast majority of IT leaders have frequent access to the main board. Two-thirds (68 per cent) attended a board meeting within the last quarter, while 85 per cent joined a board meeting within the past 12 months. Only 11 per cent of IT leaders have never been involved in a meeting with the main board.
IT's strategic influence hits new heights as executive board participation continues to grow
Large majority of IT leaders have frequent access to board members to exert strategic influence
Chart 4: Is the CIO on the executive committee? / Do you believe the CIO influence is growing?
Chart 5: When was the last time you were involved in a meeting with the main board of your organisation?
Year 2005 2006 2007 2008 2009 2010 2011CIOs on Exec Board 38% 44% 45% 46% 46% 42% 50%CIO Strategic Influence 67% 75% 61% 56% 64% 64% 69%
38%
44% 45% 46% 46%42%
50% 52% 54%50% 51%
57%62%
67%
75%
61%56%
64% 64%69% 68% 68% 66% 68% 67%
71%
0%
10%
20%
30%
40%
50%
60%
70%
80%
2005 2006 2007 2008 2009 2010 2011 2012 2013 2014 2015 2016 2017
IT Leaders on Exec Board CIO Strategic Influence
15. When was the last time you were involved in a meeting with the main board of your organization (e.g. involving the chairman, non-executives, trustees, CEO etc. or the public sector equivalent )?In the last quarter 68%In the last 6 months 11%In the last 12 months 6%In the last 2 years 2%2+ years ago 2%Never 11%TotalSystem
68%
11%
6%
2%2% 11%
Chart Title
In the last quarter
In the last 6 months
In the last 12 months
In the last 2 years
2+ years ago
Never

1. Global results
HARVEY NASH / KPMG CIO SURVEY 201717
HARVEY NASH / KPMG CIO SURVEY 2017
IT leaders at larger organisations (with annual IT budgets over $250m) can expect less direct access to the board and are less likely to report to the CEO when compared with their counterparts at small and mid-sized organisations. Under a fifth (17 per cent) of IT leaders report directly to the CEO in large organisations, compared with nearly half (45 per cent) of IT leaders at smaller organisations. IT leaders at smaller organisations also have more direct access to board members compared with peers at larger organisations. Nearly three-quarters of IT leaders (72 per cent) at organisations with an annual IT budget of $50m or less attended a meeting last quarter, compared with only 45 per cent of respondents at larger organisations.
While many IT leaders have been members of executive management teams for a number of years, there is a trend towards greater involvement with their boards in more recent times. This is hardly surprising given the increasing strategic influence of the IT leader reported by respondents. Non-executive directors of public companies represent the interests of shareholders, and so will be particularly concerned about the strategic direction of IT together with how major risk areas such as cyber security are being dealt with.
1. Global results
Access to board members is most frequent for IT leaders at smaller organisations
Majority of IT leaders influence strategy and investment decisions during board attendance
Chart 6: Reporting lines and boardroom attendance, by IT budget
Chart 7: What topics did you address at your most recent board meeting?
IT Budget Less Than $50MIT Budget $50M-$250MIT Budget More Than $250M!""#$%&'()*%&+$&,)-"&./)*"#* 72% 65% 45%Report to CEO 45% 27% 17%
72%
65%
45%
45%
27%
17%
0% 10% 20% 30% 40% 50% 60% 70% 80%
IT budget less than $50M
IT budget $50M-$250M
IT budget more than $250M Report to CEO
Attend Board in last quarter
16. What topics did you address at that board meeting (select all that apply)?Percent
Explain a major technology issue that occurred 15%Cyber security 34%Discuss digital transformation and disruption strategy 37%General technology update 41%Discuss a major technology investment 45%IT strategy update 63%
15%
34%
37%
41%
45%
63%
0% 10% 20% 30% 40% 50% 60% 70%
Explain a major technology issue that occurred
Cyber security
Discuss digital transformation and disruption strategy
General technology update
Discuss a major technology investment
IT strategy update

1. Global results
18HARVEY NASH / KPMG CIO SURVEY 2017
Leading innovationCIOs are fast becoming strategic innovators in their business. At present, only one in four respondents (26 per cent) report that the CIO is currently leading innovation in their organisations, whereas six in ten respondents (60 per cent) believe that the CIO should be taking a greater leadership role in this area.
“Today we are going to innovate”: this always looks good in corporate mission statements, but it is much harder to execute. While some organisations have managed mega-disruptive ‘out of the box’ thinking, it is relatively rare in our experience. Survey responses in recent years suggest that many organisations may be embarking on a voyage of experimental discovery, with technical innovations on a relatively small scale.
When filtering responses based on whether partipicants are CIOs or non-CIOs, non-CIOs also agree that the CIO should be taking a stronger leadership role on innovation. That said, they are slightly less enthusiastic about this than the CIOs themselves (55 per cent versus 67 per cent).
Respondents believe that the CIO should be taking an increasing leadership role in innovation
Colleagues and peers are less keen for CIOs to take on innovation leadership role in future
Chart 8: Which of the following do you think best describes the role your organisation’s CIO is currently playing, and should be playing, in promoting innovation?
Chart 9: Which of the following do you think best describes the role your organisation’s CIO is currently playing, and should be playing, in promoting innovation?
31. Which of the following do you think best describes the role your organization's CIO is currently playing, and should be playing, in promoting innovation?
Currently Should beSupporting innovation only when asked 12% 6%Not leading, but actively supporting 17% 11%Leading innovation in technical/IT matters 44% 24%Leading innovation across the business 26% 60%
12%
17%
44%
26%
6%
11%
24%
60%
0% 10% 20% 30% 40% 50% 60% 70%
Supporting innovation only when asked
Not leading, but actively supporting
Leading innovation in technical/IT matters
Leading innovation across the business
Should be
Currently
31. Which of the following do you think best describes the role your organization's CIO is currently playing, and should be playing, in promoting innovation?
CIO Non CIOCurrently 28% 25%Should be 67% 55%
28%
25%
67%
55%
0% 10% 20% 30% 40% 50% 60% 70% 80%
CIO
Non CIO
Should be
Currently

HARVEY NASH / KPMG CIO SURVEY 201719
HARVEY NASH / KPMG CIO SURVEY 2017
1. Global results
Project performanceDespite the rather dubious track record of IT-enabled change projects over the years, it seems that boundless over-optimism still plagues the industry. According to respondents, the responsibility for project failure rests primarily with ‘weak ownership’. Strong credibility at executive level, and projects led by highly disciplined and perhaps even persistently pessimistic project managers, are essential antidotes for any CIO facing these issues.
A drive towards complex, digital solutions that modify and disrupt core business models often results more in bewildering changes in scope as the project evolves, rather than the revolutionary outcome that sponsors had anticipated. CIOs need to be judicious about how they approach these projects, mixing agile and more disciplined waterfall methods to suit the circumstances. Traditionally, IT functions used one outsourcing partner for their project work. Now there are many more specialised ‘boutique’ providers with specific skills. The trade-off between adding partners to access expertise versus the problems of managing an increasingly complex project landscape will be a continuing headache for IT leaders for the foreseeable future.
Project failure is due to lack of ownership or clear objectives, rather than lack of project talent
Projects are likely to be increasingly complex and ambitious compared with five years ago
Chart 10: What are the main reasons IT projects fail in your organisation?
Chart 11: Compared with five years ago, are the projects today more or less likely to have the following characteristics? ‘More’.
34. What are the main reasons IT projects fail in your organization? (select up to three)Percent
Poor IT supply chain 7%Poor methodologies 7%External changes 17%Lack of budget 18%Overly complex 22%Poor governance 25%Lack of talent / people 27%Unclear objectives 40%Over-optimistic expectations 40%Weak ownership 46%
7%
7%
17%
18%
22%
25%
27%
40%
40%
46%
0% 10% 20% 30% 40% 50%
Poor IT supply chain
Poor methodologies
External changes
Lack of budget
Overly complex
Poor governance
Lack of talent / people
Unclear objectives
Over-optimistic expectations
Weak ownership
36. Comparing projects today with projects five years ago, are the projects today more or less likely to have the following characteristics - ComplexCancelledSuccessfulInvolve multiple partnersSponsored by the CEOChanging in scopeUse outsourcing suppliersAmbitiousComplex
11%
35%
38%
39%
43%
44%
58%
61%
0% 10% 20% 30% 40% 50% 60% 70%
Cancelled
Successful
Involve multiple partners
Sponsored by the CEO
Changing in scope
Use outsourcing suppliers
Ambitious
Complex

1. Global results
20HARVEY NASH / KPMG CIO SURVEY 2017
Women in IT leadership rolesThe proportion of women in IT leadership remains broadly the same this year, suggesting that any progress seen in previous years appears to have stalled. In smaller organisations, there are fewer women in IT leadership (8 per cent), compared with mid-sized organisations (11 per cent). Women in large organisations make up to 10 per cent of the leadership in the IT function, in line with the 10 per cent global average rate of women in IT.
IT as an industry is short of skills, and IT leaders constantly bemoan the challenges of finding and retaining skilled personnel. Yet, one entire half of the population is chronically under-represented in the industry. Despite efforts on many fronts, this situation is not changing quickly. Almost half of respondents (44 per cent, Chart 13) are ‘happy’ with their diversity mix, even though female representation remains poor. Access to diversity programmes varies dramatically by organisation size. Women employed by organisations with an IT budget greater than $250m are almost three times more likely to have access to formal diversity initiatives compared with peers at smaller organisations (with an IT budget of less than $50m, Chart 14).
.
Growth of women in IT leadership roles is slow
Only one-third of organisations have diversity initiatives in place
Larger organisations far more likely to have diversity initiatives
Chart 12: What is your gender? Female.
Chart 14: Organisations with formal diversity initiatives in place, by IT budget.
1.2 People, skills and talent
!"#$%&#!'(!&#%)#*+,#-./*!"#$%&#!'(!&#%)#*+!01'23!1(23!1423!56!(#78!*/&#+9:;<: => =>:;<? @> A>:;<B => C>:;<D A> C>:;<C <<> @>:;<= <;> @>
Small <$25M 8%Mid-sized $25M-$250M 11%Large >$250M 10%
7%
9%
7%8%
11%10%
7%8%
6% 6%
9% 9%
4%
6%
8%
10%
12%
2012 2013 2014 2015 2016 2017
Female IT leaders Senior Female IT leaders (CIO, CTO, CDO, VP Tech roles)
Answer %Yes, we have formal initiatives in place 35%No, but we plan to put formal initiatives in place 21%No, we're happy with our mix 44%Total 100%
Yes, we have formal initiatives in place (by Org IT Budget)Less than $50m 28%$50m to $250m 51%
More than $250m 72%
35%
21%
44%
Chart Title
Yes, we have formal initiatives in place
No, but we plan to put formal initiatives in place
No, we're happy with our mix
28%
51%
72%
0% 20% 40% 60% 80%
Less than $50m
$50m to $250m
More than $250m
Chart 13: Are you formally promoting a more diverse team?
Chart 8: Does the skills shortage prevent your organisation from keeping up with the pace of change? 2005 - 2014
We have a lot of work to do within the Tech industry to bust myths, change biases and showcase the types of skills and careers we offer in order to address our skills shortage. We need to take active hold of our skills pipeline and work better with governments around education standards to build a smart, innovative, and productive Australia. We need to work with universities around enterprise-ready skills and the private sector overall around sponsoring initiatives with impact.
Experience and technical skills are important in the short term, but what we look for most is the ability to collaborate with stakeholders inside and outside the company, especially as so much of our work is outsourced. It is important that the company's vision and common competencies for all employees are widely understood to ensure the clarity of hiring criteria.
Technical skills don’t matter in many roles as they can be taught. The right people often aren't technology people but instead those most curious and passionate about positive change. If you build teams with diverse groups of people having skills across industries, they will often find interesting solutions to challenges. Foster diversity, hire cross-industry, produce results.
Agree or disagree: hiring managers are too focused on assessing technical skills, and overlook good people as a result
Robyn Randell,Vice President IT, Burberry Asia Limited, Hong Kong
Shinya Suda, Corporate Vice President, Information Systems, Astellas Pharma Inc., Japan
Anastasia Cammaroto, CIO Consumer Bank, Westpac Group, Australia

1. Global results
HARVEY NASH / KPMG CIO SURVEY 201721
HARVEY NASH / KPMG CIO SURVEY 2017
Six in ten respondents report IT skills shortage – after four years, is this level the new normal?
Chart 15: 2005–2017: Proportion of CIOs reporting technology skills shortage.
Technology skills shortagesOnce again, around 60 per cent of respondents are reporting skills shortages. Does this now represent the new normal? In the heady times of the run-up to the Great Recession, nearly nine out of ten IT leaders were reporting skills shortages. This is now long past. However, in an industry constantly evolving, so too are the skills needed. Looking back at the past 12 years, there have only been three occasions where less than half of IT leaders were reporting skills shortages, suggesting that finding appropriately skilled talent has become a perennial concern in the sector.
Behind the headlines, there is some asymmetry. In the past few years, organisations based in the Asia Pacific and Latin America reported the most significant shortages. Previously, there appeared to be weaker skills demand in the eurozone compared with the USA. This year, Europe is broadly similar to previous years, but demand in North America seems to be weakening at a faster rate. This might be the beginnings of a real trend, or it may perhaps be related to uncertainty as a result of the the political changes in the USA in recent months.
North America shows significant drop in respondents reporting technology skills shortage
Chart 16: 2016–2017: Does a skills shortage prevent your organisation from keeping up with the pace of change? By region.
2017 62%2016 65%2015 59%2014 60%2013 45%2012 47%2011 42%2010 58%2009 54%2008 71%2007 85%2006 78%2005 73%
Small <$50M 60%Mid-sized $50M-$250M 66%Large >$250M 63%
62%65%59%60%
45%47%42%
58%54%
71%
85%78%
73%
0%
10%
20%
30%
40%
50%
60%
70%
80%
90%
2005 2006 2007 2008 2009 2010 2011 2012 2013 2014 2015 2016 2017
2016 2017North America 64% 56%GLOBAL AV. 65% 62%Europe 64% 63%Latin America 72% 64%Asia Pacific 68% 68%
64%
65%
64%
72%
68%
56%
62%
63%
64%
68%
0% 20% 40% 60% 80%
North America
GLOBAL AV.
Europe
Latin America
Asia Pacific
2017
2016

1. Global results
22HARVEY NASH / KPMG CIO SURVEY 2017
2015 2016 2017 % change 2014Outsourcing 9% 8% 5% 8% 24%Social media 13% 12% 8% 17% 33%Compliance 10% 9% 10% 26% 34%ERP 12% 13% 11% 19% 32%Service management 17% 12% 11% 4% 22%Testing 21% 17% 14% -19% 33%Mobile solutions 24% 23% 16% -7% 26%Business relationship management 20% 18% 18% -4% 21%Infrastructure / operations 17% 17% 18% -12% 25%Digital 19% 23% 21% -9% N/AChange management 27% 25% 22% 0% 21%IT strategy 22% 24% 23% 6% N/ADevelopment 27% 27% 25% -30% 27%Project management 34% 32% 26% -18% 20%Security and resilience 23% 27% 28% -15% 12%Technical architecture 24% 27% 32% -8% 17%Business analysis 29% 29% 34% 11% 11%Enterprise architecture 27% 27% 34% -33% 16%Big data / analytics 36% 39% 42% -37% 9%
27%
34%
23%
24%
29%
27%
36%
27%
32%
27%
27%
29%
27%
39%
25%
26%
28%
32%
34%
34%
42%
0% 10% 20% 30% 40% 50%
Development
Project management
Security and resilience
Technical architecture
Business analysis
Enterprise architecture
Big data / analytics
2017
2016
2015
Less than $50m $50m to $250m More than $250mDevelopment 26% 20% 22%Project management 26% 27% 20%Security and resilience 27% 36% 33%Technical architecture 30% 39% 34%Enterprise architecture 32% 49% 41%Business analysis 36% 35% 25%Big data / analytics 41% 48% 49%
FULL LIST AND RANKED TABLE BELOW (NOT USED IN REPORT)
2017 Av. Less than $50m $50m to $250m More than $250mBig data / analytics 42% 41% 48% 49%Business analysis 34% 36% 35% 25%Enterprise architecture 34% 32% 49% 41%Technical architecture 32% 30% 39% 34%Security and resilience 28% 27% 36% 33%Project management 26% 26% 27% 20%Development 25% 26% 20% 22%IT strategy 23% 21% 29% 24%Change management 22% 22% 23% 18%Digital 21% 19% 34% 34%Infrastructure / Operations 18% 18% 18% 16%Business relationship management 18% 17% 22% 21%Mobile solutions 16% 16% 18% 16%Testing 14% 15% 14% 9%ERP 11% 13% 10% 5%Service management 11% 11% 9% 9%Compliance 10% 10% 8% 9%Social media 8% 8% 8% 8%Outsourcing 5% 5% 5% 8%
Less than $50m $50m to $250m More than $250m
#1 Ranked SkillBig data / analytics (41%) Enterprise architecture
(49%0Big data / analytics (49%)
#2 Ranked Skill Business analysis (36%) Big data / analytics (48%0 Enterprise architecture (41%)
26%
26%
27%
30%
32%
36%
41%
20%
27%
36%
39%
49%
35%
48%
22%
20%
33%
34%
41%
25%
49%
0% 10% 20% 30% 40% 50% 60%
Development
Project management
Security and resilience
Technical architecture
Enterprise architecture
Business analysis
Big data / analytics
More than $250m
$50m to $250m
Less than $50m
Technology skill demandsBig data/analytics remains the most in-demand skill, cited by 42 per cent of respondents, an increase of 8 per cent in the past 12 months. However, the fastest-growing technology skill this year is enterprise architecture, up a massive 26 per cent compared with last year.
It is a great time to be an architect or an analytics specialist! In recent years, architects have had something of a hard time. Three years ago, demand was dropping and some were whispering that the days of the architects were over. But after a slight recovery in 2016, they are well and truly back. This makes sense given that respondents are telling us that the new digital innovations make for a more complex portfolio landscape and would imply that many organisations are in the process of re-architecting. As for big data, it remains a real hot-spot. Demand for skills varies significantly by organisational size. Mid-sized and larger organisations are experiencing greater skills shortages in digital, security and enterprise architecture, whereas IT leaders at smaller organisations are prioritising skills in business analysis and project management compared with peers at larger organisations.
Data analytic skills remain most in-demand skill for third year in a row
Greater demand for data analytics, digital and enterprise architecture skills exists at large organisations
Chart 17: Which functions do you feel suffer from a skills shortage? 2015–2017.
Chart 18: Which functions do you feel suffer from a skills shortage? By IT budget.

1. Global results
HARVEY NASH / KPMG CIO SURVEY 201723
HARVEY NASH / KPMG CIO SURVEY 2017
Full-time employees are preferred over contingent staff for more than 70 per cent of roles
CIOs continue positive trend in technology recruitment intent
Chart 20: What proportion of your IT department is flexible/contingent labour? 2015–2017.
Chart 19: 2011–2017: Over the next year how do you expect your IT/Technology headcount to change?
HeadcountIT departments seem to be getting bigger. Hiring intent remains broadly positive and, in line with previous years, more than four in ten respondents (44 per cent) plan to increase their technology headcount in 2017, essentially unchanged since 2015. This continues the positive hiring progress that has continued for the past seven years.
Most IT leaders prefer hiring full-time employees. For 72 per cent of respondents their contingent staff make up less than 25 per cent of hires – and for the largest proportion of organisations (43 per cent) flexible workers account for less than one in ten staff. We believe contingent hires are mostly used to satisfy ‘burst’ demand.
However, there is a small group of IT leaders who continue to invest heavily in flexible contingent labour for more than half of their technology team. During the past three years, the size of this group has remained almost entirely unchanged at a significant 12 per cent of all respondents.
2015 2016 201776%-100% 3% 4% 4%51%-75% 8% 8% 8%26%-50% 19% 18% 17%11%-25% 28% 30% 29%0-10% 42% 41% 43%
3%
8%
19%
28%
42%
4%
8%
18%
30%
41%
4%
8%
17%
29%
43%
0% 10% 20% 30% 40% 50%
76%-100%
51%-75%
26%-50%
11%-25%
0-10%
201720162015
2011 2012 2013 2014 2015 2016 2017Stay the same 43% 41% 39% 37% 38% 39% 40%Decrease 16% 19% 19% 20% 17% 17% 16%Increase 41% 40% 41% 43% 44% 44% 44%
43%
41%
39%
37%
38%
39%
40%
16%
19%
19%
20%
17%
17%
16%
41%
40%
41%
43%
44%
44%
44%
0% 20% 40% 60%
2011
2012
2013
2014
2015
2016
2017
Increase
Decrease
Stay the same

1. Global results
24HARVEY NASH / KPMG CIO SURVEY 2017
Digital strategyMany more organisations are addressing digital at a strategic level. In the past 24 months, there has been a 52 per cent increase in the proportion of organisations with an enterprise-wide digital strategy in place. Four in ten respondents take a leading role in this activity and many present digital strategies to the main organisational board. A further one in five respondents have digital plans for individual business units. IT leaders at smaller organisations are less likely to have implemented an enterprise-wide digital strategy – 39 per cent have done so – compared with peers at mid-sized (42 per cent) and large (53 per cent) organisations.
Significant ongoing progress by IT leaders deploying digital strategies enterprise-wide in 2017
Chart 21: Does your organisation have a clear digital business vision and strategy?
1.3 Dealing with digital2015 2016 2017
No 16% 13% 10%Yes, within individual business units 26% 24% 22%No, but we are currently working on one 31% 29% 27%Yes, enterprise-wide 27% 35% 41%
16%
26%
31%
27%
13%
24%
29%
35%
10%
22%
27%
41%
0% 5% 10% 15% 20% 25% 30% 35% 40% 45%
No
Yes, within individual business units
No, but we are currently working on one
Yes, enterprise-wide
201720162015
Chart 8: Does the skills shortage prevent your organisation from keeping up with the pace of change? 2005 - 2014
Most organisations are not going to create the next Space-X rocket or electric car, but companies that create an ‘atmosphere of innovation’ in their workforce, with a laser focus on their business strategy, will become the disruptors - not the disrupted.
The challenge is not how do you innovate, if you innovate or if you bring disruptive thinking to your business. It’s, “What if you don’t?” Give people space to innovate whether you call it ‘innovation’ or not. Test ‘bright ideas’…in low-cost and low-risk ways. Challenge politics, evolve established practices and find future-facing internal leaders to partner with.
Within the IT team we have run hackathons and similar initiatives as well as providing time to research emerging technology and how that might help support the work we do. Using examples of disruption or innovation in different sectors has been useful in encouraging others to innovate.
How do you promote innovation in your organisation?
Karl Hoods, Save the Children,UK
Robyn Randell,Vice President IT, Burberry Asia Limited, Hong Kong
Yuri Aguiar, Global Director of Innovation and Transformation, Ogilvy & Mather Worldwide, USA

1. Global results
HARVEY NASH / KPMG CIO SURVEY 201725
HARVEY NASH / KPMG CIO SURVEY 2017
Almost all sectors show growing adoption of enterprise-wide digital strategy
Chart 22: Does your organisation have a clear digital business vision and strategy? Yes, enterprise-wide.This year we changed some of the sector categorisations. Year-on-year comparisons are not always possible.
2016 2017 % ChangeManufacturing 20% 26% 30%Utilities 26% 30% 15%Construction / Engineering 22% 30% 36%Energy 26% 31% 19%Charity / Non Profit 27% 32% 19%Pharmaceuticals 37% 32% -14%Education 18% 33% 83%Retail 28% 38% 36%Government 40% 39% -3%Financial Services 37% 41% 11%GLOBAL AVERAGE 35% 41% 17%Healthcare 32% 41% 28%Leisure 44%Professional Services 37% 46% 24%Advertising 52% 47% -10%Telecommunications 52%Broadcast / Media 49% 56% 14%Technology 48% 56% 17%
This year we made changes to some sector categorisations,so year on year comparison is not possible
20%
26%
22%
26%
27%
37%
18%
40%
37%
35%
32%
37%
52%
49%
26%
30%
30%
31%
32%
32%
33%
38%
39%
41%
41%
41%
44%
46%
47%
52%
56%
56%
0% 10% 20% 30% 40% 50% 60%
Manufacturing
Utilities
Construction / Engineering
Energy
Charity / Non Profit
Pharmaceuticals
Education
Retail
Government
Financial Services
GLOBAL AVERAGE
Healthcare
Leisure
Professional Services
Advertising
Telecommunications
Broadcast / Media
Technology
2017
2016
Broadcasting/Media, Technology and Telecommunications companies are outliers when it comes to the creation and implementation of company-wide digital strategies. There is clear blue water between them and the rest of the pack. We might have expected the Manufacturing, Utilities and Construction sectors to be slower to respond, as indeed they have. The pressures on their businesses are rather different. But there are some interesting anomalies in the data. Enterprise-wise digital strategies in the Education sector have nearly doubled since last year. Such marked increases are very rare in our experience. We followed up with some CIOs in the Higher Education sector. They tell us that their leaders are pushing hard to improve the student experience and are demanding innovation in this area.

1. Global results
26HARVEY NASH / KPMG CIO SURVEY 2017
The proportion of respondents (18 per cent) who believe their organisation is ‘very effective’ in using digital technologies to advance their business strategies is modest, both in absolute terms and compared with the other capabilities on which we measured digital effectiveness. This suggests that digital incorporation is relatively immature for most organisations, with lots of opportunity ahead to learn and improve.
The larger the organisation, the more bullish respondents are about their effective use of digital to advance business strategy. IT leaders at small and mid-sized organisations are slightly less likely than the global average to believe that their organisation is ‘very effective’ at using digital to influence business strategy.
The Chief Digital OfficerOne in four respondents now report that their organisation has hired a Chief Digital Officer (CDO) or someone serving in that capacity. Given the extent of enterprise-wide digital planning, it is likely that, in addition to increased hiring of the CDO, a range of technology leaders may now also be responsible for digital. This also reflects the large proportion of the almost 70 per cent of organisations who report not yet having a CDO currently in place, with no immediate plans to hire into the role.
Less than one in five ‘very’ effective in using digital technology to advance business strategy
Chart 23: How effective has your organisation been in using digital technologies to advance its business strategy?
Chart 25: Does your organisation have a Chief Digital Officer or someone serving in that capacity?
CIOs at large organisations are much more assured on ‘very effective’ digital abilities
Chart 24: How effective has your organisation been in using digital technologies to advance its business strategy? Very. By IT budget
27. How effective has your organization been in using digital technologies to advance its business strategy?
Not effective 19%Moderately effective 63%Very effective 18%
19%
63%
18%
Chart Title
Not effective
Moderately effective
Very effective
17%
15%
18%
24%
0% 5% 10% 15% 20% 25% 30%
IT budget less than $50m
IT budget $50m to $250m
Global average
IT budget more than $250m
28. Does your organization have a Chief Digital Officer or someone serving in that capacity?
Yes 25%No 69%No, but planning to have one6%
2014 7%2015 17%2016 18%2017 25%
25%
69%
6%
Chart Title
Yes
No
No, but planning to have one
7%
17% 18%
25%
0%5%
10%15%20%25%30%
2014 2015 2016 2017
Three-quarters of organisations have not yet hired a Chief Digital Officer

1. Global results
HARVEY NASH / KPMG CIO SURVEY 201727
HARVEY NASH / KPMG CIO SURVEY 2017
The year 2017 has emerged as another ‘big-leap’ year for the Chief Digital Officer. The proportion of organisations with a CDO in place has more than tripled in three years, suggesting a positive correlation between CDOs, the adoption of enterprise-wide digital strategy, and very effective digital capabilities reported in 2017. After exploding onto the scene in 2014/15, the pace of CDO appointments levelled out somewhat in 2016, but the speed of CDO hiring has picked up again, with a 39 per cent growth compared with last year.
More than half of large companies have a CDO in post. This is more than twice the global average and is growing at the fastest pace compared with organisations of other sizes. We think that large organisations recognise the need to co-ordinate digital activities across the enterprise to avoid duplication, leverage skills and experience, and exploit synergies. Smaller companies, on the other hand, are much less formalised in their approach. Barely one in five have appointed a CDO. We suspect that they rely on their inherent nimbleness to address their digital challenges.
A wide range of industry sectors have witnessed rapid growth in Chief Digital Officer hiring during the past 12 months. Even in the sectors where absolute CDO numbers are relatively low, there have been big year-on-year jumps – Utilities, Education, Energy and Manufacturing all increased their CDO hires by over 50 per cent. The Government sector did not see movement in CDO hiring in 2017, possibly because they were ahead of the CDO hiring curve in 2016.
One anomaly is Advertising, which has seen a decline in CDOs. In this sector, where digital is both a product and source of disruption, it is possible that the role of the CDO is evolving differently.
Proportion of organisations with Chief Digital Officer has tripled in two years: now one in four
Half of all large firms now have a Chief Digital Officer in role, and fastest pace of hiring CDOs
CDO appointments grow, but spread unevenly across sectors
Chart 26: Does your organisation have a Chief Digital Officer or someone serving in that capacity? Yes.
Chart 27: Does your organisation have a Chief Digital Officer or someone serving in that capacity? Yes – by size of IT budget.
Table 5: Does your organisation have a Chief Digital Officer or someone serving in that capacity? Yes.This year we changed some of the sector categorisations. Year-on-year comparisons are not always possible.
28. Does your organization have a Chief Digital Officer or someone serving in that capacity?
Yes 25%No 69%No, but planning to have one6%
2014 7%2015 17%2016 18%2017 25%
25%
69%
6%
Chart Title
Yes
No
No, but planning to have one
7%
17% 18%
25%
0%5%
10%15%20%25%30%
2014 2015 2016 2017
2016 2017!"#$%&'()#*(++#",-.#/012 16% 20%GLOBAL AVERAGE 19% 25%!"#$%&'()#/012#)3#/4012 23% 32%!"#$%&'()#536(#",-.#/4012 36% 51%
16%
19%
23%
36%
20%
25%
32%
51%
0% 10% 20% 30% 40% 50% 60%
IT budget less than $50m
Global average
IT budget $50m to $250m
IT budget more than $250m
2017
2016
2016 2017Broadcast / Media 30% 46%Advertising 43% 35%Retail - 32%Telecommunicatons - 31%
Financial Services 25% 28%Professional Services 20% 26%Technology 19% 26%Pharmaceuticals 27% 25%Global average 18% 25%Government 24% 24%Leisure - 23%Construction / Engineering 17% 21%Healthcare 17% 19%Charity / Non Profit 20% 18%Manufacturing 11% 18%Energy 11% 18%Education 9% 18%Utilities 11% 16%

1. Global results
28HARVEY NASH / KPMG CIO SURVEY 2017
Time and relationships more important than money and hiring for digital innovation
Chart 28: In which of the following ways is your organisation fostering innovation?
Chart 29: In which of the following ways is your organisation fostering innovation?
Fostering digital innovationFor more than half of our respondents, the top two most popular methods to help foster digital innovation are to dedicate more time for innovation (54 per cent) and to partner with innovative organisations such as academic institutions (52 per cent). Ring-fencing innovation budgets is a distant third option used by three in ten (31 per cent), while hiring a Chief Innovation Officer is a strategy adopted by only one in ten organisations (12 per cent).
Larger organisations are increasingly using their networks and their relationships with academic partners to foster innovation; perhaps mindful of the notion that large is often considered cumbersome, they may feel they need to place their bets in a number of areas. The smaller organisations, on the other hand, rely heavily on making time for innovation. Their workforce are likely to feel much closer to their customers and their products or services, as they do not have to carry the large people-infrastructures of multinational corporations.
IT leaders at smaller organisations spend more time – and less money – to help foster innovation
!"#$%&$'()*($+,$-(.$,+//+')&0$'123$)3$2+45$+501&)61-)+&$,+3-.5)&0$)&&+71-)+&8$9:./.*-$1//$-(1-$1;;/2<!"#$"%&
'(#(%)*+*,-(".*/%%01+&(0%*2..($"#*30#*"45(1+6"%&7 89:'06;(%)*(%%01+&(0%*$0%&"<&< 9=:,#"+&(%)*+%*(%$5>+&(0%*6+> 9?:@"A+#+&"6B*.5%;(%)*(%%01+&(0% C8:!+#&%"#(%)*D(&-*0&-"#*0#)+%(E+&(0%<F*"G)GF*+$+;"H($*(%<&(&5&(0%< I9:J";($+&(%)*&(H"*.0#*(%%01+&(0% I=:
12%
24%
27%
31%
52%
54%
0% 20% 40% 60%
Hiring a Chief Innovation Officer (or equivalent)
Holding innovation contests
Creating an incubation lab
Separately funding innovation
Partnering with other organisations, e.g., academic institutions
Dedicating time for innovation
IT Budget Less Than $50mInnovation hiring 10%Innovation contests 20%Incubation lab 21%Separate funding 27%Partnering 49%Dedicating time 54%
IT Budget $50m to $250mInnovation hiring 17%Innovation contests 36%Incubation lab 39%Separate funding 41%Dedicating time 56%Partnering 59%
IT Budget More Than $250mInnovation hiring 26%Dedicating time 50%Innovation contests 52%Separate funding 54%Incubation lab 57%Partnering 69%
10%
20%
21%
27%
49%
54%
Innovation hiring
Innovation contests
Incubation lab
Separate funding
Partnering
Dedicating time
17%
36%
39%
41%
56%
59%
Innovation hiring
Innovation contests
Incubation lab
Separate funding
Dedicating time
Partnering
26%
50%
52%
54%
57%
69%
Innovation hiring
Dedicating time
Innovation contests
Separate funding
Incubation lab
Partnering
IT budget less than
$50m
IT budget $50m to $250m
IT budget more than
$250m

1. Global results
HARVEY NASH / KPMG CIO SURVEY 201729
HARVEY NASH / KPMG CIO SURVEY 2017
Digital innovation challengesCultural resistance to change has been a perennial problem for IT leaders. Unlike other enterprise-wide functions such as HR or Finance, IT affects the business in a unique way. New processes and computer systems can radically alter core business processes.
Overcoming resistance to change (43 per cent) is almost twice as likely to prevent respondents achieving innovation success compared with securing financial resources (25 per cent). While there is a ‘burning platform’ of sorts where business leaders want to innovate quickly, workforces generally do not like change and certainly do not like it when it affects them adversely.
Even if IT organisations can get past this hurdle, new technologies seem to be as difficult to implement as they always have been. It is difficult enough to innovate without having to surmount these very real obstacles.
Culture, not capital, is the biggest impediment to digital success
Chart 30: Which of the following represent the greatest challenges to your organisation’s successful implementation of digital capabilities?
28%
48%
42%
40%
33%
33%
31%
20%
25%
!"#$%&'(&$)*$+&,$*)--).'/0$1,21,3,/+$+&,$01,4+,3+$(&4--,/0,3$+)$5)61$)104/'74+')/83$36((,33*6-$'92-,9,/+4+')/$)*$:'0'+4-$(424;'-'+',3<$=>-,43,$3,-,(+$62$+)$+&1,,?!"#$%&'&()"*+#&%,-&''".+&/,*)."+0! 15%12)%)%(+"3"#/,)4"5'"4"'+*6&%*&-*$)6 20%'"(2'+2%.+-"(/'2,&-7+#&86')2%#"+)**/"* 23%9-)42#7+2%.+*"#/-),7+-":/)-"8"%,* 25%;"#/-)%(+<)%2%#)2'+-"*&/-#"* 25%=,,-2#,)%(+,$"+-)($,+,2'"%, 31%=#$)"4)%(+-",/-%+&%+)%4"*,8"%,+>?@0A 36%B2*)'7+)86'"8"%,+%"C+,"#$%&'&()"* 39%@4"-#&8)%(+-"*)*,2%#"+,&+#$2%(" 43%
15%
20%
23%
25%
25%
31%
36%
39%
43%
0% 10% 20% 30% 40% 50%
Technologies controlled outside IT
Gaining executive-level sponsorship
Legal and regulatory compliance issues
Privacy and security requirements
Securing financial resources
Attracting the right talent
Achieving return on investment (ROI)
Easily implement new technologies
Overcoming resistance to change
NAV I G ATI N GU N C E RTA I NTY
www.hnkpmgciosurvey.com
The online home of the Harvey Nash / KPMG CIO Survey
Events Find out about our launch
events across the world
CIO viewpoints
Read the opinions of CIOs across the world
DownloadGet hold of the digital version
of the report
DataPlay with interactive charts

31HARVEY NASH / KPMG CIO SURVEY 2017
Special Report: Are you a digital leader? KPMG
Gone are the days when digital disruption was something you read about or planned for. Now, it’s here. Digital transformation has become a strategic imperative for
most organisations and a matter of survival for some. KPMG professionals’ experience shows that digital transformation starts with a board-driven, enterprise-wide digital vision and strategy and requires substantial technology enablement to bring it to fruition. Yes, short-term gains can be achieved with point solutions like mobile apps or social media engagement, but sustainable competitive advantage only comes when organisations go beyond restructuring operations in customer-facing functions and fully integrate across the front, middle and back offices to create a truly digital enterprise. CIOs and the IT function need to play a key role in delivering technology-enabled innovation. However, data from this year’s survey reveals that many CIOs need to take a more aggressive approach to engage business stakeholders to enable it to happen.
In line with this, the results are surprising when asking about the key business issues that the management board is looking for IT to address. When asked to rank the issues based on importance, those directly correlated with being a leader in digital transformation did not move to the top of the list. Instead, the top spots are taken up with issues that drive traditional priorities and investments for IT, i.e. delivering consistent and stable IT performance to the business, increasing operational efficiencies, improving business processes, and saving costs.
The evidence is clear, then, that many organisations have a way to go if they are to successfully implement digital transformation. The good news though is that, through asking additional questions related to digital transformation execution and effectiveness, we have been able to identify 18 per cent of respondents as organisations that are digital leaders. We give a snapshot of what KPMG professionals believe characterises a digital leader here – so that organisations can assess where they are against these attributes.
The early survey findings indicate that digital leaders appear to be:
Better at aligning IT and business strategyOne of the perennial challenges for CIOs is to work closely with business stakeholders to ensure that IT strategy is closely aligned with business strategy. This is even more critical when it comes to digital transformation where business strategies are driving new digital business models, new avenues to connect with customers and employees, and new ways to drive a step change in the cost of business operations. It’s no surprise that firms identified as digital leaders are more than twice as likely as the others to be very effective at aligning IT and business strategy.
Focused on innovation and growthWhen it comes to key business issues, digital leaders are more focused on innovation and growth. For them, developing innovative new products and services is the number one priority. When addressing a board meeting they are most likely to be discussing digital transformation and disruption strategy – rather than just providing an ‘IT strategy update’. And, as might be expected, they are more than twice as likely to have an enterprise-wide digital business vision and strategy.
Digital business is all about innovation, whether that’s on-demand business models, digital streaming services, or engaging customers with social media or mobile apps. All of this innovation requires some form of technology enablement. With a deep understanding of technology and internal business processes, coupled with a cross-enterprise perspective, CIOs can play a key role in driving such innovation – as is borne out in the survey data where CIOs and digital leaders are almost twice as likely to be leading innovation across the business.
Making aggressive investments in disruptive digital technologiesCloud serves as the underpinning foundation for much digital disruption because of its quick time to provision, scalability, resilience and favourable economics. As you might expect, digital leaders are currently making significant investments in cloud across all three delivery models (IaaS, PaaS and SaaS) at rates that are two to three times higher than others; and they can be expected to maintain their investment lead over the next one to three years as

32HARVEY NASH / KPMG CIO SURVEY 2017
others try to catch up. Another area where digital leaders are making aggressive investments is in automating processes across the enterprise – what KPMG calls digital labour. For example, using robotic process automation (RPA), they are automating repetitive manual processes, like claims processing and data entry, as well as more advanced knowledge-based implementations using cognitive automation (CA), such as personal shopping assistants. According to the survey results, digital leaders are currently investing at four times the rate of others. What’s more, they are also implementing digital labour solutions across the enterprise, in some cases at twice the rate of everyone else, and are more effective at realising benefits including optimising processes, improving quality and reducing costs.
More likely to see IT budget growthWhen it comes to technology budgets, digital leaders are spending more. Almost half of digital leaders’ CIOs have enjoyed a budget increase over the last year versus only a third of other companies. They are also more optimistic about the next 12 months, with significantly more digital leaders expecting their budgets to increase than their counterparts. At the same time, digital leaders are controlling or managing more of the technology spend outside the IT organisation, indicating that the business is more involved in making decisions and investing in digital capabilities.
More attractive for CIOsCIOs and digital leaders are playing key roles driving innovation and technology enablement to transform
their organisations into digital businesses and in return are finding more fulfilment and staying in their jobs longer than others. As digital leaders, twice as many respondents find their current role very fulfilling and more than four in ten plan on staying with their current employer for five or more years – versus less than a quarter for everyone else.
While digital leaders are more likely to have a CDO or someone acting in that capacity than non-leaders, they still remain a minority. So the opportunity is there for CIOs as non-leaders to take a more active role helping their organisations become one.
The bottom line is that the survey shows a clear divergence between organisations that are effective at digital transformation and those that are not. Digital leaders have more closely aligned IT and business strategies, are more focused on innovation and growth, and are investing more in digital technologies.
In the coming months, we will take a still deeper dive into the data and identify in more detail what KPMG specialists believe constitutes a digital leader, the implications for CIOs and recommendations on leading practices. In the meantime, as a CIO are you doing your part to understand and communicate the opportunities, challenges and digital capabilities needed to help your organisation get there?
Marc E. Snyder Technology Global Center of Excellence KPMG in the US

1. Global results
HARVEY NASH / KPMG CIO SURVEY 201733
HARVEY NASH / KPMG CIO SURVEY 2017
IT leaders remain open to best approach for achieving agility and responsiveness
Chart 31: What is the most important step you are taking to become more agile and responsive in the development and delivery of IT services?
Agility and responsivenessSome organisations have struggled to implement large-scale, complex cultural and process change initiatives through rapid prototyping, while others have steadfastly stuck to their rigid industrial methodologies and comprehensively failed to deliver small apps quickly in a fast-moving environment. Many IT leaders are feeling their way with DevOps. Some value the swiftness by which apps can be enhanced and deployed globally, while others fret about changes setting off a chain reaction that could ripple through their complex inter-related application estate.
Multi-mode IT and DevOps are internal approaches, often preferred by larger organisations that can manage these processes in-house. The use of partnerships, contracting external resources and buying Software as a Service (SaaS) solutions are used most by smaller organisations, probably because these approaches require fewer internal resources and are less expensive (certainly in the short term) than other options.
IT leaders at smaller organisations buy in support, compared with building in-house
1.4 Managing the technology function!"#$%&'($)*$(&+$,-*($),.-/('0($*(+.$1-2$'/+$('3)04$(-$5+6-,+$,-/+$'4)7+$'08$/+*.-0*)9+$)0$(&+$8+9+7-.,+0($:$8+7)9+/1$-;$<=$*+/9)6+*>!"#$%&'$(#)*+"%,*,-$,%#&.*%,/"0%',/1+2.,+,#$(#)*3,452/3,4,."2(#)*/$%&$,)('*2&%$#,%/6(2/7&8(#)*9(::,%,#$*&22%"&'6,/*$"*9,4,."2(#)*"0%*;&'8<,#9*	*'0/$"+,%*:&'(#)*)%"02/*=+0.$(<+"9,*17>?0@(#)*+"%,*/".0$("#/*=(#'.09(#)*A&&A>*%&$6,%*$6&#*;0(.9(#)1+2.,+,#$(#)*&)(.,*+,$6"9".")(,/
NOTE, BECAUSE WE CHANGED FORMAT FROM MULTIPLE CHOICE TO SINGLE CHOICE, THESE ARE SO DIFFERENT FROM 2016/2017 THAT I HAVE NOT COMPARED THEM2016Implementing agile methodologiesBuying more solutions (including SaaS) rather than buildingDeveloping strategic partnershipsImplementing DevOpsTaking multi-mode IT to developing internal vs externalContracting more external resources
8%
12%
14%
16%
19%
28%
0% 5% 10% 15% 20% 25% 30%
Contracting more external resources
Implementing DevOps
Developing strategic partnerships
Taking different approaches to developing our back-end and customer-facing groups (multi-mode IT)
Buying more solutions (including SaaS) rather than building
Implementing agile methodologies
!"#$%&'$(#)*+"%,*,-$,%#&.*%,/"0%',/1,2,."3(#)*/$%&$,)('*3&%$#,%/4(3/5+3.,+,#$(#)*1,263/70.$(8+"9,*5:;0<(#)*+"%,*/".0$("#/*=(#'.09(#)*>&&>?5+3.,+,#$(#)*&)(.,*+,$4"9".")(,/
9%
15%
10%
15%
21%
27%
6%
11%
16%
19%
18%
27%
5%
9%
16%
18%
14%
33%
Contracting more external resources
Developing strategic partnerships
Implementing DevOps
Multi-mode IT
Buying more solutions (including SaaS)
Implementing agile methodologies
Less than $50m $50m to $250m More than $250m
64%
65%
64%
72%
68%
56%
62%
63%
64%
68%
0% 10% 20% 30% 40% 50% 60% 70% 80%
North America
GLOBAL AV.
Europe
Latin America
Asia Pacific
2017
2016
Chart 32: Most important step you are taking to become more agile and responsive – by size of IT budget.
Chart 8: Does the skills shortage prevent your organisation from keeping up with the pace of change? 2005 - 2014
The role of the CIO is to extract value for the business, its customers and shareholders. Increasing IT investment must directly relate to increasing value and this is where it should be spent. We must stop talking budgets and start thinking returns.
Unless it was to deliver a specific piece of costed work, I would give 95% back. Some of the best results come from challenging teams on budgets and resources. Spending double the money never produces double the results. I’d take 5% and challenge a small group of people to find completely new ways to do IT by learning from start-ups and other industries.
Accelerating our blockchain pilots through to operation, embedding DevOps and increasing the team so we can deliver more of our demand pipeline and ultimately have a greater impact for children.
If your technology budget was doubled, what would you spend it on?
Karl Hoods, CIO, Save the Children, UK
Robyn Randell,Vice President IT, Burberry Asia Limited, Hong Kong
William Payne,CIO, Boral, Australia

1. Global results
34HARVEY NASH / KPMG CIO SURVEY 2017
EffectivenessThe highs and lows of the effectiveness chart are unlikely to surprise most people. IT leaders would expect their organisations to be well-aligned with the business strategy and to pick the right technology for the enterprise. The surprising data point is the confidence in executing projects, which seems at odds with the success rates of IT-enabled projects. Both historical feedback from this survey and academic research suggest that successful project delivery is rather more elusive than IT leaders might like to think.
IT leaders are most comfortable with core systems, most concerned about data and digital
Chart 33: How effective is your IT organisation in each of the following capabilities?
Not effectiveFacilitating the use of data and analytics 32%Fostering innovation 29%Integrating core business systems with newer digital solutions 25%Using the right governance model 24%Developing the right culture and talent 22%Using partnerships 23%Managing risk and security 12%Executing projects 11%Aligning IT and business strategy 8%Selecting the most appropriate technologies and architectures 9%
32%
29%
25%
24%
22%
23%
12%
11%
8%
9%
52%
55%
56%
56%
56%
52%
56%
55%
57%
55%
16%
16%
18%
20%
21%
25%
32%
34%
35%
36%
0% 20% 40% 60% 80% 100%
Facilitating the use of dataand analytics
Fostering innovation
Integrating core business systemswith newer digital solutions
Using the right governance model
Developing the right cultureand talent
Using partnerships
Managing risk and security
Executing projects
Aligning IT and business strategy
Selecting the most appropriatetechnologies and architectures
Not effective Moderately effective Very effective
It appears that respondents are pursuing a reasonably restrained approach when investing in the ‘as a Service’ model in 2017. There is an increase in ‘Moderate investment’ and a decrease in ‘Minimal/No investment’ compared with last year, but the proportion of ‘Significant investment’ is relatively unchanged.
IT leaders continue to invest in the 'as a service' model
2016 2017
Minimal / No Investment
Moderate Investment
Significant Investment
Minimal / No Investment
Moderate Investment
Significant Investment
Current year investment Infrastructure as a Service (IaaS)
46% 30% 23% 38% 39% 23%
Current year investment Platform as a Service (PaaS)
53% 29% 18% 44% 41% 16%
Current year investment Software as a Service (SaaS)
32% 38% 30% 23% 50% 27%
Next 1–3 years investment Infrastructure as a Service (IaaS)
28% 36% 36% 17% 45% 38%
Next 1–3 years Investment Platform as a Service (PaaS)
31% 36% 33% 18% 49% 33%
Next 1–3 years investment Software as a Service (SaaS)
18% 36% 46% 9% 42% 49%
Table 6: Innovation investment plans ‘as a service’ models for current year and next 1 to 3 years

1. Global results
HARVEY NASH / KPMG CIO SURVEY 201735
HARVEY NASH / KPMG CIO SURVEY 2017
!"#$%&$'()$*+,$-)++,./0'$1.2,3/1.4$1.$-0()56$78*/$*+,$'()+$/(9$/8+,,$+,*3(.3$:90,*3,$3,0,-/$)9$/($/8+,,;<2016 2017
Attract talent 1% 1%Improve aligment with customers 11% 10%Support global shared services 13% 12%Data center mondernization 19% 18%Better enable the mobile workforce 19% 19%Shift CapEx to OpEx 21% 21%Simplfied management 21% 26%Save money 33% 28%Best solution available 27% 31%Accelerate product innovation 34% 34%Improve agility and responsiveness 40% 39%Improve availability and resiliency 40% 41%
1%
11%
13%
19%
19%
21%
21%
33%
27%
34%
40%
40%
1%
10%
12%
18%
19%
21%
26%
28%
31%
34%
39%
41%
0% 5% 10% 15% 20% 25% 30% 35% 40% 45%
Attract talent
Improve aligment with customers
Support global shared services
Data center modernisation
Better enable the mobile workforce
Shift CapEx to OpEx
Simplfied management
Save money
Best solution available
Accelerate product innovation
Improve agility and responsiveness
Improve availability and resiliency
2017
2016
Cloud technologyCloud computing has been something of a bright spot in recent years. This trend has continued during the past year, with respondents investing in cloud less to save money, and more because IT leaders value the reliability, agility and responsiveness that these services bring.
IT leaders continue to prioritise cloud resiliency and responsiveness
Chart 34: If you are currently investing in cloud, what are your top three reasons?
Many smaller organisations are turning to the cloud in order to access enhanced stability and resilience compared with in-house operations. Larger organisations, however, more often see the cloud as a means of performance enhancement to improve their agility and responsiveness.
Resiliency is a priority for smaller organisations, responsiveness preferred by mid and larger organisations
IT budget less
than $50mIT budget $50m
to $250mIT budget more
than $250m
Improve availability and resiliency 43% 37% 31%
Improve agility and responsiveness 37% 50% 47%
Best solution available 32% 29% 28%
Accelerate product development/innovation 32% 41% 42%
Simplified management 29% 17% 13%
Save money 28% 30% 33%
Support global shared services 11% 14% 13%
Shift CapEx to OpEx 21% 19% 25%
Better enable the mobile workforce 20% 14% 14%
Data centre modernisation/legacy renewal 17% 23% 25%
Improve alignment with customers/partners 10% 8% 12%
Attract talent 2% 1% 1%
Table 7: If you are currently investing in cloud, what are your top three reasons? By size of IT budget.

1. Global results
36HARVEY NASH / KPMG CIO SURVEY 2017
Intelligent automationMore than a third of all respondents (34 per cent) are already investing in, or are planning to invest in, digital labour, including robotic process automation and cognitive automation. This proportion increases to more than six in ten respondents at larger organisations (62 per cent), and half of respondents at mid-sized organisations (52 per cent) are already investing or planning to invest.
IT leaders in the Manufacturing sector are most likely to be investing or planning to invest in robotic process and cognitive automation. More than four in ten respondents (45 per cent) will do so. Higher proportions of respondents within process-orientated sectors like Utilities, Transport, Telecommunications and Pharmaceuticals are leading innovation in this area, while respondents in Financial Services, Broadcast/Media, Professional Services and Technology have an above-average propensity to invest. At this stage, less than one in five IT leaders in Education (12 per cent), Charity/Non-Profit (17 per cent) and Leisure (14 per cent) are experimenting with digital labour.
A third of all respondents are already exploring robotics and automation
Chart 36: Is your organisation currently investing in, or planning to invest in, digital labour?
Manufacturing leads the way, with almost 50 per cent currently investing or planning to invest in digital labour
Chart 37: Is your organisation currently investing in, or planning to invest in, digital labour? By sector.
39. Is your organization current investing in, or planning to invest in digital labor, cognitive automation or robotic process automation?Yes 34%No 66%
34%
66%
Chart Title
Yes No
!"#$%&$'()*$(*+,-./,0.(-$1)**2-0$.-32&0.-+$.-4$(*$56,--.-+$0($.-32&0$.-$7.+.0,6$6,8(*4$1(+-.0.32$,)0(9,0.(-$(*$*(8(0.1$5*(12&&$,)0(9,0.(-:!"#$%&'()#*(++#",-.#/012!"#$%&'()#/012#)3#/4012!"#$%&'()#536(#",-.#/4012
Yes 27% 52% 62%No 73% 48% 38%
27%
52%
62%
0% 10% 20% 30% 40% 50% 60% 70%
IT budget less than $50m
IT budget $50m to $250m
IT budget more than $250m
Education 12%Leisure 14%Charity / Non Profit 17%Government 21%Advertising 22%Construction / Engineering 24%Energy 29%Healthcare 30%Retail 32%GLOBAL AVERAGE 34%Broadcast / Media 35%Professional Services 36%Technology 36%Pharmaceuticals 38%Telecommunications 38%Financial Services 41%Transport 41%Utilities 43%Manufacturing 45%
12%14%
17%21%
22%24%
29%30%
32%34%
35%36%36%
38%38%
41%41%
43%45%
0% 10% 20% 30% 40% 50%
EducationLeisure
Charity / Non ProfitGovernmentAdvertising
Construction / EngineeringEnergy
HealthcareRetail
GLOBAL AVERAGEBroadcast / Media
Professional ServicesTechnology
PharmaceuticalsTelecommunications
Financial ServicesTransport
UtilitiesManufacturing
Chart 35: Is your organisation currently investing in, or planning to invest in, digital labour?
Majority of respondents at large and mid-sized organisations are already investing or planning to invest in digital labour

1. Global results
HARVEY NASH / KPMG CIO SURVEY 201737
HARVEY NASH / KPMG CIO SURVEY 2017
Most CIOs currently making ‘minimal’ or ‘moderate’ bets on automation
Within three years, large growth is expected in IT leaders planning to make ‘significant’ investments
Chart 38: Investment current year – only respondents who are investing in, or plan to invest in, robotics/automation.
Chart 39: Investment plans next 1–3 years – only respondents who are investing in, or plan to invest in, robotics/automation.
The growth in cognitive automation should not be a revelation. The convergence of robotic, machine learning and advanced analytics would seem to be a natural consequence of the rise in demand for ‘big data’.
Just looking at those respondents who are investing in, or plan to invest in, robotics/automation, it is remarkable to see the anticipated investment growth planned for the next three years. Currently, most of these respondents are making ‘minimal’ or ‘moderate’ investments in automation. That pattern dramatically alters when looking one to three years ahead, with nearly four in ten respondents expecting to be making ‘significant’ investments in cognitive automation and basic robotic process automation.
Widespread media coverage of automation innovation, such as the installation of automated ordering kiosks in fast food outlets, is contributing to greater awareness of this issue. What is certain is that IT leaders need to keep up with this fast-moving area and how it could deliver value for their organisation.
!"#$%&''()*$+),(-*.()*
Basic robotic process automation (RPA)!"#"$%&'(#)*+,$*#, 39%!-.*/%,*'(#)*+,$*#, 46%0"1#"2"3%#,'(#)*+,$*#, 15%
39%
60%
59%
46%
30%
30%
15%
10%
11%
Basic robotic process automation (RPA)
Enhanced robotic process automation (EPA)
Cognitive automation (CA)
Minimal Investment Moderate Investment Significant Investment
13%
19%
19%
49%
49%
43%
38%
31%
38%
Basic robotic process automation (RPA)
Enhanced robotic process automation (EPA)
Cognitive automation (CA)
Minimal Investment Moderate Investment Significant Investment

1. Global results
38HARVEY NASH / KPMG CIO SURVEY 2017
Digital labour effectivenessIT leaders believe that digital labour is most effective at improving quality. More than one in four respondents have seen ‘very effective’ results in this area, as well as scaling more efficiently and reducing cost. For such a nascent technology, these success rates seem high and are actually similar to traditional IT project success rates.
However, one area where success rates are less good is in increasing morale through the elimination of mundane tasks. In jobs where automation can be both a benefit and a threat to employees, clearly more needs to be done to position and develop this technology.
IT leaders at smaller organisations report more ‘very effective’ results from digital labour projects compared with peers in mid-sized and larger organisations. Certainly, smaller organisations may be implementing on a smaller scale, and are likely to be working off a lower base level of performance so have more room to improve. The most value appears to be generated by improving quality and scaling more efficiently for all IT leaders but especially for those at smaller organisations.
Processes rather than people are early winners in digital labour projects
Chart 40: Taken as a whole, how effective have your digital labour projects been in delivering the following benefits? Only respondents who are investing in, or plan to invest in, robotics/automation.
Digital labour produces outsize results for IT leaders at smaller organisations
Chart 41: How effective have your digital labour projects been in delivering the following benefits? ‘Very effective’ - only respondents who are investing in, or plan to invest in, robotics/automation.
31%
14%
20%
18%
17%
53%
64%
58%
58%
56%
16%
22%
22%
24%
27%
Increasing employee moralethrough elimination of mundane tasks
Optimizing processes
Reducing cost
Scaling (up/down) more efficiently
Improving quality
Not effective Moderately effective Very effective
!"#$%&'()#*(++#",-.#/012
18%24%24%26%29%
18%
24%
24%
26%
29%
12%
18%
19%
22%
24%
13%
21%
22%
22%
22%
0% 5% 10% 15% 20% 25% 30% 35%
Increasing employee morale through elimination of mundane
tasks
Optimising processes
Reducing cost
Improving quality
IT budget more than $250m
IT budget $50m to $250m
IT budget less than $50m

1. Global results
HARVEY NASH / KPMG CIO SURVEY 201739
HARVEY NASH / KPMG CIO SURVEY 2017
IT leaders are awakening to threat of cyber attack by insiders, but still concerned by external factors
Proportion of IT leaders ‘very well’ prepared to respond to cyber attack continues to fall
Chart 42: Which types of threat give you most cause for concern in terms of a cyber attack?
Chart 43: To what extent do you feel your organisation is positioned to identify and deal with current and near future IT security/cyber attacks? Very well.
Cyber securityEveryone is talking about cyber security. Organisational leaders are fretting while hackers seem to be able to ghost their way effortlessly into their systems to steal emails and secrets. Over the last few years, we have seen confidence steadily decline as the number of serious attacks increases. On the positive side, executive boards have been very supportive to IT leaders struggling to keep their gateways secure and resources are being made available.
However, this heightened state of awareness is not translating into preparedness, which remains stubbornly low. Only one in five IT leaders (21 per cent) commit to being ‘very well’ positioned to identify and deal with a current or near future cyber attack. This is down 4 per cent on last year, and down 28 per cent in the past four years.
!!"#$%&'%#()*+#,-#(%.+/(0#1&2+#),3#4,0(#'/30+#-,.#',5'+.5#&5#(+.40#,-#/#')6+.7/((/'89#:#0+;+'(#/;;#(%/(#/**;)<
2016 !"#$ % Change%&'()*+*&,- 16% #./ 19%0&,)+1234&5),- 27% !6/ 4%7(8''),- 37% 9./ 5%:2-+;),- 40% <6/ 20%='8*)>,3%?@),3%,+'+28A- 48% B!/ 8%C,182+D);3%?@),3%,+') 69% $#/ 3%
16%
27%
37%
40%
48%
69%
19%
28%
39%
48%
52%
71%
0% 20% 40% 60% 80%
Competitors
Foreign powers
Spammers
Insiders
Amateur cyber criminals
Organised cyber crime
2017
2016
2014 2015 2016 2017Very well positioned 29% 23% 22% 21%
Quite well 61% 66% 66% 66%Not well 10% 12% 12% 13%
29%
23%
22%
21%
0% 5% 10% 15% 20% 25% 30% 35%
2014
2015
2016
2017

1. Global results
40HARVEY NASH / KPMG CIO SURVEY 2017
Relentless rise of organisations being subjected to ‘major’ cyber attacks during past two years
More than half of large organisations have been subjected to cyber attack in past two years
Cyber attacks in high-target sectors show Utilities and Government most at risk
Chart 45: Has your organisation been subjected to any major IT security or cyber attacks in the past two years? By IT budget.
Chart 44: Has your organisation been subjected to any major IT security or cyber attacksin the past two years?
Chart 46: Has your organisation been subjected to any major IT security or cyber attacks in the past two years? By sector.
Almost a third of respondents (32 per cent) reported that their organisation had been subject to a major IT security incident or cyber attack during the past 24 months, representing a 14 per cent increase compared with the previous year, and up 45 per cent in the last four years. In this environment, awareness may not be enough to prevent real and reputational damage to organisations, brands, and personal reputations.
Large organisations seem to be particularly at risk. More than half tell us that they have suffered a serious attack in the past two years. Smaller organisations may be less vigilant, or less adept at detecting attacks. Worryingly, the Government and Utilities sectors report the highest levels of attack, which may suggest a degree of state involvement rather than the attention of common cyber criminals. Least affected are the Charity and Advertising sectors, but even here more than one in five reported a major incident in the past two years.
45. Has your organization been subjected to any major IT security or cyber attacks in the last 2 years? YES
2014 22%2015 25%2016 28%2017 32%
22%
25%
28%
32%
0% 5% 10% 15% 20% 25% 30% 35%
2014
2015
2016
2017
IT Budget Less Than $50m IT Budget $50m to $250m IT Budget More Than $250m30% 41% 53%
30%
41%
53%
0% 10% 20% 30% 40% 50% 60%
IT Budget Less Than $50m
IT Budget $50m to $250m
IT Budget More Than $250m
Advertising 21%Charity / Non Profit 23%Technology 27%Energy 29%Professional Services 29%Financial Services 30%Manufacturing 30%Healthcare 31%Retail 32%GLOBAL AVERAGE 32%Construction / Engineering 35%Broadcast / Media 35%Transport 37%Pharmaceuticals 39%Telecommunications 39%Telecomm 40%Education 42%Leisure 42%Utilities 44%Government 44%
21%23%
27%29%29%
30%30%
31%32%32%
35%35%
37%39%39%
40%42%42%
44%44%
0% 10% 20% 30% 40% 50%
AdvertisingCharity / Non Profit
TechnologyEnergy
Professional ServicesFinancial Services
ManufacturingHealthcare
RetailGLOBAL AVERAGE
Construction / EngineeringBroadcast / Media
TransportPharmaceuticals
TelecommunicationsTelecommEducation
LeisureUtilities
Government

1. Global results
HARVEY NASH / KPMG CIO SURVEY 201741
HARVEY NASH / KPMG CIO SURVEY 2017
IT budgetIT budgets are growing. With nearly half of departments predicting an increase next year and less than one in five fearing a decrease, IT investment is on the up. Eight in ten (79 per cent) IT leaders have seen budgets upheld or increased this year, and only one in five (21 per cent) have seen IT budgets cut. This positive trend looks likely to continue, with a similar proportion of respondents (46 per cent) anticipating IT budget increases in 2018.
Shadow IT, where costs are controlled outside the IT function, is a small but growing part of the spending landscape. This reflects an ongoing trend witnessed during the past four years where IT leaders have – willingly or unwillingly – given up a proportion of IT budget decision-making to other leaders within the organisation. In response, IT leaders have indicated in previous reports a growing importance placed on skills associated with effective relationship management to continue influencing budgets not directly under their control.
IT budget growth remains stable, with eight in ten respondents enjoying stable or growing finances
IT spend is increasingly being controlled by influencers outside the IT function
Chart 47: 2005–2017: Over the last year, please indicate if your IT budget has: increased, stayed the same.
Chart 48: 2014–2017: What proportion of the overall spend on IT is controlled/managed outside the IT organisation/department? More than 10%.
Year 2005 2006 2007 2008 2009 2010 2011 2012Increased 43% 47% 42% 36% 25% 28% 39% 43%Decreased 23% 19% 16% 20% 42% 43% 30% 28%Stayed the same34% 34% 42% 44% 33% 29% 31% 29%
Year 2005 2006 2007 2008 2009 2010 2011 2012Increased 43% 47% 42% 36% 25% 28% 39% 43%
Stayed the same 34% 34% 42% 44% 33% 29% 31% 29%
43% 47% 42% 36%25% 28%
39% 43% 42% 46% 44% 45% 46%
34% 34% 42%44%
33% 29%
31% 29% 30%31% 32% 33% 33%
0%
10%
20%
30%
40%
50%
60%
70%
80%
90%
2005 2006 2007 2008 2009 2010 2011 2012 2013 2014 2015 2016 2017
2014 2015 2016 2017Less than 5% 46% 46% 41% 37%5 – 10% 23% 19% 20% 23%11 – 25% 17% 15% 18% 19%26 – 50% 9% 11% 10% 11%More than 50% 6% 8% 10% 10%
Where more than 10% IT budget controlled outside IT2014 32%2015 34%2016 38%2017 40%
46%
23% 17%
46%
19% 15%
41%
20%
37%
23%
0% 5%
10% 15% 20% 25% 30% 35% 40% 45% 50%
Lessthan5% 5 – 10% 11
2014 2015
32%
34%
38%
40%
0% 10% 20% 30% 40% 50%
2014
2015
2016
2017
stayed the same
increased

1. Global results
42HARVEY NASH / KPMG CIO SURVEY 2017
IT leaders at bigger organisations are most cautious about future budget growth
Not all IT budgets will grow equally, with Leisure, Healthcare and Technology sectors the most bullish
Chart 50: Over the next 12 months, do you expect your IT budget to increase, decrease, or stay the same? By sector.
IT leaders remain bullish about future budget growth, with 46 per cent of respondents globally anticipating an increase next year. Respondents from smaller organisations should be most optimistic; almost half (48 per cent) of respondents with IT budgets less than $50m predict future budget growth, compared with 40 per cent of respondents at mid-sized organisations and only 29 per cent of peers at larger organisations. Approximately one in five (18 per cent) organisations are preparing to operate with lower IT budgets in 2018. However, twice as many respondents at larger organisations (37 per cent) expect budgets to decrease in the year ahead.
Public sector organisations continue to feel the squeeze on spending and this is likely to continue at least for a while. Leisure, Technology, Healthcare and Professional Services top the list for optimism in this area. Seeing the Retail sector near the top is particularly interesting. Perhaps this suggests that those companies see improvements in consumer confidence and are gearing up to respond to it?
Chart 49: Over the next 12 months, do you expect your IT budget to increase, decrease, or stay the same? By IT budget.
Increase Stay the same Decrease!"#$%&'()#*(++#",-.#/012 48% 36% 15%!"#$%&'()#/012#)3#/4012 40% 37% 23%!"#$%&'()#536(#",-.#/4012 29% 34% 37%Global Average 46% 36% 18%
48%
40%
29%
46%
36%
37%
34%
36%
15%
23%
37%
18%
0% 10% 20% 30% 40% 50% 60%
IT budget less than $50m
IT budget $50m to $250m
IT budget more than $250m
Global Average
Decrease
Stay the same
Increase
Education 38%Telecommunications 38%Energy 39%Broadcast / Media 41%Pharmaceuticals 42%Charity / Non Profit 43%Government 43%Advertising 43%Construction / Engineering 44%Manufacturing 44%Financial Services 45%Transport 46%GLOBAL AVERAGE 46%Retail 47%Utilities 47%Professional Services 49%Healthcare 50%Technology 51%Leisure 56%
38%38%39%
41%42%43%43%43%44%44%45%46%46%47%47%
49%50%51%
56%
0% 10% 20% 30% 40% 50% 60%
EducationTelecommunications
EnergyBroadcast / Media
PharmaceuticalsCharity / Non Profit
GovernmentAdvertising
Construction / EngineeringManufacturing
Financial ServicesTransport
GLOBAL AVERAGERetail
UtilitiesProfessional Services
HealthcareTechnology
Leisure

1. Global results
HARVEY NASH / KPMG CIO SURVEY 201743
HARVEY NASH / KPMG CIO SURVEY 2017
OutsourcingThe proportion of IT leaders planning to increase future outsourcing and offshoring has fallen slightly, although still remains broadly in line with recent years. The proportion of respondents planning to increase investment in outsourced activity is down by 4 per cent, while IT leaders planning to increase offshore work is down by 9 per cent compared with last year.
Increased unpredictability in the wider business environment is also shifting the reasons to outsource. While most respondents still outsource primarily to free up resources for core business (49 per cent), this priority has fallen by 4 per cent compared with last year, whereas reasons more closely linked to managing an unpredictable environment are growing in importance. Improving ‘flexibility’ is up 11 per cent compared to last year and ‘saving money’ is up 7 per cent. Over four in ten IT leaders continue to outsource in order to augment skills not available in-house, but this is essentially flat compared with last year, similar to the demand for skills generally.
Intent to outsource and offshore both anticipated to drop in coming year
Improved flexibility for unpredictable time is fastest growing reason to outsource
Chart 51: How do you expect your spend on outsourcing and offshoring to change over the next 12 months? 2005–2017.
Chart 52: What are the two main reasons you choose to outsource? 2016 vs 2017.
23%
Year 2005 2006 2007 2008 2009 2010 2011 2012 2013 2014 2015 2016Outsourcing to Increase 45% 48% 53% 53% 33% 36% 45% 45% 43% 49% 46% 50%Offshoring to Increase 31% 43% 49% 41% 28% 31% 50% 45% 44% 34% 41% 44%
45%48%
53% 53%
33%36%
45% 45%43%
49%46%
50%48%
31%
43%
49%
41%
28%31%
50%
45%44%
34%
41%44%
40%
0%
10%
20%
30%
40%
50%
60%
2005 2006 2007 2008 2009 2010 2011 2012 2013 2014 2015 2016 2017
Outsourcing to Increase Offshoring to Increase
57. What are the two main reasons you choose to outsource? (choose up to two)2016 2017
Improves our ability to innovate 15% 15%Improves flexibility in use of resources 35% 39%Saves money 42% 45%Provides access to skills not available in-house 45% 46%Frees up resources to focus on core business 51% 49%
15%
35%
42%
45%
51%
15%
39%
45%
46%
49%
0% 20% 40% 60%
Improves our ability to innovate
Improves flexibility in use of resources
Saves money
Provides access to skills not available in-house
Frees up resources to focus on core business
2017
2016

1. Global results
44HARVEY NASH / KPMG CIO SURVEY 2017
Software development, application maintenance and data centres remain the most favoured outsourcing tasks by respondents who outsource or offshore at least one IT function. Just under a third of respondents (32 per cent) who are actively outsourcing or offshoring are prioritising service desk/help desk functions, while three in ten (29 per cent) have outsourced systems integration projects.
This year, we took a sectoral look at outsourcing. The leadership from the Pharmaceuticals sector came as something of a surprise. Many organisations in this sector are large and have sufficient scale to run their own operations. We are actively planning to explore this trend further with Pharmaceuticals IT leaders at our report launch events around the world to find out more, but it is recognised that many core business units (e.g. clinical trials functions) are heavily outsourced and it might be that this is a natural way of doing business for those companies. Software support has long been an area that many would consider as the prime area for outsourcing, so we were interested to see the dominance of software application development. In follow-ups, it is clear that many are using offshore companies for their agile and small-scale developments.
Most demand for software development and data centres by respondents actively outsourcing
Education is the only sector where less than half of respondents are currently outsourcing
Chart 53: What functions do you outsource or offshore?
Chart 54: Do you currently outsource or offshore? Yes – by sector.
!"#$%&'($)*+,(-.+/$0.$1.*$.*(/.*2,3$.2$.))/&.234$ !"#$"%&'!()*'%+,-"./")!#+$"00)(1&0+1#$2%/3 4567)8"9:#&;"%& <=567)>!( <=5?@)>!( <=5AB0&";0)6%&"/#:&2+% =C5D"&,+#E0 =C5A"#F2$")8"0E)G)?"-9)8"0E H=567)6%I#:0$&1#" H=58:&:)J"%&"#0 KL5A+I&,:#")M99-2$:&2+%)N:2%&"%:%$" O<5A+I&,:#")M99-2$:&2+%)8"F"-+9;"%& 4K5
6%12%12%12%
29%29%
32%32%
40%51%
64%
0% 10% 20% 30% 40% 50% 60% 70%
KPO (Knowledge Process Outsourcing)IT department
IT BPOHR BPO
Systems integrationNetworks
Service desk / help deskIT infrastructure
Data centresSoftware application maintenanceSoftware application development
Education 39%Healthcare 50%Construction 53%Charity / Non Profit 57%Leisure 58%Professional Services 59%Technology 59%Energy 61%Government 61%Utilities 62%GLOBAL AVERAGE 63%Manufacturing 65%Advertising 66%Broadcast / Media 67%Financial Services 71%Transport 71%Retail 71%Telecommunications 72%Pharmaceuticals 82%
39%
50%
53%
57%
58%
59%
59%
61%
61%
62%
63%
65%
66%
67%
71%
71%
71%
72%
82%
0% 20% 40% 60% 80% 100%
Education
Healthcare
Construction
Charity / Non Profit
Leisure
Professional Services
Technology
Energy
Government
Utilities
GLOBAL AVERAGE
Manufacturing
Advertising
Broadcast / Media
Financial Services
Transport
Retail
Telecommunications
Pharmaceuticals

1. Global results
HARVEY NASH / KPMG CIO SURVEY 201745
HARVEY NASH / KPMG CIO SURVEY 2017
CIO life spanThe majority of IT leaders (58 per cent) can expect to be in the job for five years or less. This short life expectancy of the CIO should be a continuing concern for aspiring IT leaders, especially given that the data shows that IT leaders want to stay in post longer than this typical life span. Our experience in the recruiting industry, together with external research, suggests that if a CIO wants to extend their shelf life, then it is critical that they pay close attention to their stakeholder relations together with the performance of their major projects. Hygiene factors such as maintaining stable and reliable services are also vital. Nobody wants to talk about strategy when basic IT services are erratic.
The proportion of IT leaders who want to stay in their current role more than five years has increased from 24 per cent in 2015 to 28 per cent in 2017. This perhaps reflects the increasing importance of the CIO role, and that influence is translating into job satisfaction, which – as you will see – is also increasing.
The shelf life of an IT leader is likely to be five years or less
Growing proportion of IT leaders yearning to stay in role longer than five years
Chart 55: 2015–2017: How long have you worked for your current employer?
Chart 56: How long, from this point onwards, do you expect to stay with your current employer? 2015–2017.
1.5 CIO careers
2015 2016 2017More than 10 years 19% 21% 23% 15 - 10 years 22% 20% 19% 22 - 5 years 29% 28% 26% 31 - 2 years 17% 16% 17% 4Less than 1 year 12% 15% 15% 5
19%
22%
29%
17%
12%
21%
20%
28%
16%
15%
23%
19%
26%
17%
15%
0% 10% 20% 30% 40%
More than 10 years
5 - 10 years
2 - 5 years
1 - 2 years
Less than 1 year
2017
2016
2015
2015 2016 2017More than 10 years 9% 10% 11% 55 - 10 years 12% 14% 17% 42 - 5 years 31% 32% 31% 31 - 2 years 24% 22% 20% 2Less than 1 year 24% 22% 21% 1
11%
17%
31%
20%
21%
10%
14%
32%
22%
22%
9%
12%
31%
24%
24%
0% 10% 20% 30% 40%
More than 10 years
5 - 10 years
2 - 5 years
1 - 2 years
Less than 1 year
2015
2016
2017
Chart 8: Does the skills shortage prevent your organisation from keeping up with the pace of change? 2005 - 2014
The traditional CIO role is already extinct – commoditised infrastructure, apps and specialised delivery platforms as-a-service have become a mainstay for many industries. Today’s CIOs must be leaders that can influence the revenue stream and tie their business strategies to solutions in the most secure and cost-effective manner and in the shortest possible time-to-market. Good execution will always be a measure of a successful CIO.
The role will be reshaped by highly resilient transparent technology as reliable as electricity. IT at least for brand organisations will no longer be about wires, boxes or speeds but about on-demand capabilities driving competitive advantage. The CIO will finally deploy and manage relevant services at the actual speed of business with far smaller teams.
By 2030, I anticipate "business" and "technology" will be virtually indistinguishable, similar to how "life" and "technology" have blended in so many ways over the past decade. CIO roles will still exist, but there will be much fewer of them and they will be working in less fast-moving businesses or where a CIO is needed to decommission "legacy" technology. Meanwhile, there will be a huge surge of opportunity for ex-CIOs who can use their transferable skillset to be true business leaders. I'm looking forward to it!
Imagine it’s 2030. Will the CIO role be extinct?
Triona O’Keeffe,CIO, Direct Line Group, UK
Robyn Randell,Vice President IT, Burberry Asia Limited, Hong Kong
Yuri Aguiar,Global Director of Innovation and Transformation, Ogilvy & Mather Worldwide, USA
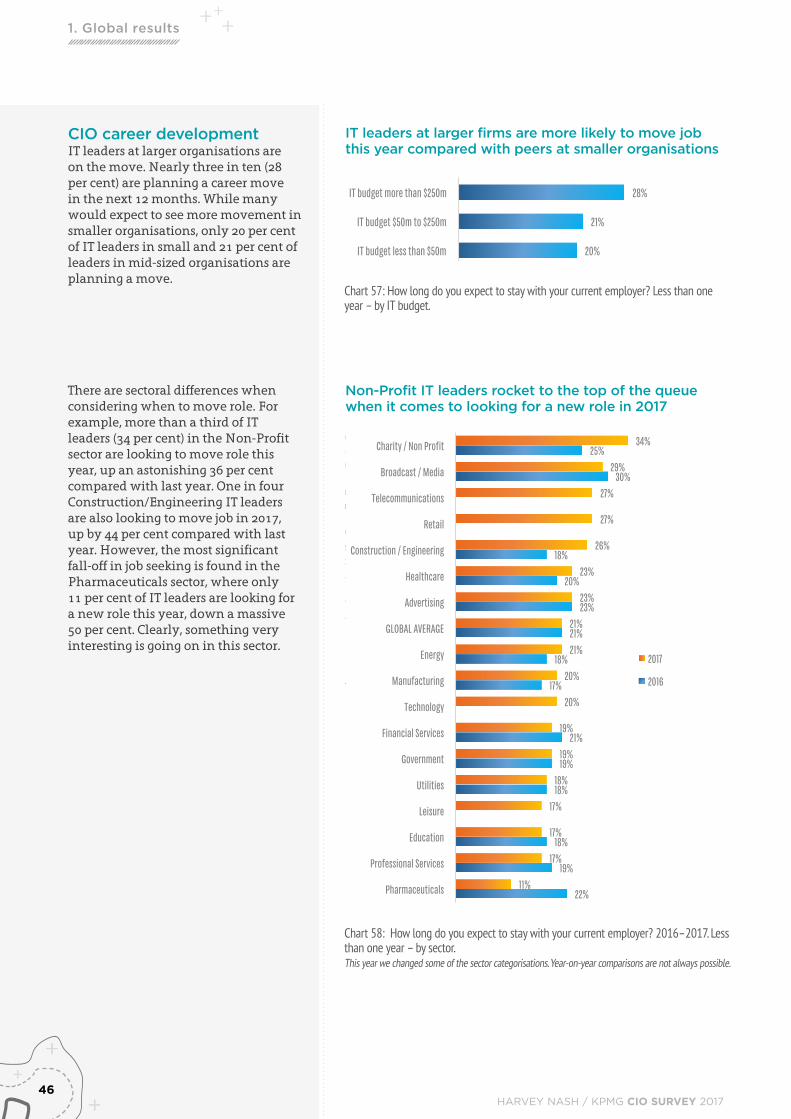
1. Global results
46HARVEY NASH / KPMG CIO SURVEY 2017
CIO career developmentIT leaders at larger organisations are on the move. Nearly three in ten (28 per cent) are planning a career move in the next 12 months. While many would expect to see more movement in smaller organisations, only 20 per cent of IT leaders in small and 21 per cent of leaders in mid-sized organisations are planning a move.
There are sectoral differences when considering when to move role. For example, more than a third of IT leaders (34 per cent) in the Non-Profit sector are looking to move role this year, up an astonishing 36 per cent compared with last year. One in four Construction/Engineering IT leaders are also looking to move job in 2017, up by 44 per cent compared with last year. However, the most significant fall-off in job seeking is found in the Pharmaceuticals sector, where only 11 per cent of IT leaders are looking for a new role this year, down a massive 50 per cent. Clearly, something very interesting is going on in this sector.
IT leaders at larger firms are more likely to move job this year compared with peers at smaller organisations
Chart 57: How long do you expect to stay with your current employer? Less than one year – by IT budget.
Non-Profit IT leaders rocket to the top of the queue when it comes to looking for a new role in 2017
Chart 58: How long do you expect to stay with your current employer? 2016–2017. Less than one year – by sector.This year we changed some of the sector categorisations. Year-on-year comparisons are not always possible.
!"#$%&'()#*(++#",-.#/012!"#$%&'()#/012#)3#/4012!"#$%&'()#536(#",-.#/4012Less than 1 year 20% 21% 28%
20%
21%
28%
0% 5% 10% 15% 20% 25% 30%
IT budget less than $50m
IT budget $50m to $250m
IT budget more than $250m
2016 2017Pharmaceuticals 22% 11%Professional Services 19% 17%Education 18% 17%Leisure 17%Utilities 18% 18%Government 19% 19%Financial Services 21% 19%Technology 26% 20%Manufacturing 17% 20%Energy 18% 21%GLOBAL AVERAGE 21% 21%Advertising 23% 23%Healthcare 20% 23%Construction / Engineering 18% 26%Retail 23% 27%Telecommunications 27%Broadcast / Media 30% 29%Charity / Non Profit 25% 34%
This year we made changes to some sector categorisations,so year on year comparison is not possible.
22%
19%
18%
18%
19%
21%
17%
18%
21%
23%
20%
18%
30%
25%
11%
17%
17%
17%
18%
19%
19%
20%
20%
21%
21%
23%
23%
26%
27%
27%
29%
34%
0% 5% 10% 15% 20% 25% 30% 35% 40%
Pharmaceuticals
Professional Services
Education
Leisure
Utilities
Government
Financial Services
Technology
Manufacturing
Energy
GLOBAL AVERAGE
Advertising
Healthcare
Construction / Engineering
Retail
Telecommunications
Broadcast / Media
Charity / Non Profit
2017
2016

1. Global results
HARVEY NASH / KPMG CIO SURVEY 201747
HARVEY NASH / KPMG CIO SURVEY 2017
An overwhelming majority of IT leaders continue to report being fulfilled in their role
IT leaders with strategic influence remain happiest
Chart 59: How fulfilling do you find your current role? 2015–2017.
Chart 60: How fulfilling do you find your current role? Very. 2015-2017.
CIO job satisfactionIT leaders, it seems, love their jobs. The proportion of IT leaders who report that they are ‘very fulfilled’ in their role is at a three-year high and has risen by 18 per cent since 2015. During this time, we have seen a steady increase in respondents who have changed their preference from ‘quite fulfilling’ to ‘very fulfilling’. Clearly, despite all the trials and tribulations of IT leadership, the CIO career landscape is improving!
Unsurprisingly, IT leaders who sit on their executive committee (ExCo) record the highest levels of job satisfaction: 44 per cent have rated themselves ‘very fulfilled’ for the past two years. IT leaders who report to the CEO also report high levels of fulfilment, but IT leaders who report to the CFO have shown faster increases in happiness in the past three years, up 12 per cent. IT leaders at smaller firms are more fulfilled in their role than IT leaders at larger firms.
2015 2016 2017Not at all fulfilling 4% 3% 4% 4Not very fulfilling 17% 13% 14% 3Quite fulfilling 47% 47% 43% 2Very fulfilling 33% 37% 39% 1
4%
17%
47%
33%
3%
13%
47%
37%
4%
14%
43%
39%
0% 10% 20% 30% 40% 50%
Not at all fulfilling
Not very fulfilling
Quite fulfilling
Very fulfilling
201720162015
VERY FULFILLED ONLY
2015 2016 2017Ex. Co Member 42% 44% 44% 7CEO Report 41% 42% 42% 6CFO Report 34% 36% 38% 5Mid-Sized 35% 37% 40% 4Global Av. 33% 37% 39% 3Smaller 29% 38% 39% 2Larger 29% 31% 35% 1
42%
41%
34%
35%
33%
29%
29%
44%
42%
36%
37%
37%
38%
31%
44%
42%
38%
40%
39%
39%
35%
0% 10% 20% 30% 40% 50%
Ex. Co Member
CEO Report
CFO Report
Mid-Sized
Global Av.
Smaller
Larger
2017
2016
2015

1. Global results
48HARVEY NASH / KPMG CIO SURVEY 2017
Energy sector IT leaders become happiest; Non-Profit CIOs lose their zeal, dropping 12 per cent
The increasing proportion of IT leaders ‘very fulfilled’ in their jobs reported this year came as something of a surprise to us, because combining the results of ‘very’ and ‘quite’ fulfilled IT leaders together (Chart 61) shows there has actually been a minor dip in satisfaction across IT leaders in most sectors. The relatively short life expectancy of the role, together with demands for highly complex, game-changing digital projects – not to mention the need to keep an increasingly IT-savvy digital workforce happy – means that succeeding in a CIO role is probably harder than it has ever been. However, the top IT leaders appear to be up for the job, perhaps even relishing their increasing ability to exert their influence across the enterprise as their departments become a force for strategic change.
IT leaders have become marginally less active in their approach to finding their next role. The proportion who are actively seeking and applying for roles has fallen by 10 per cent compared with last year, although those who would take a call from a headhunter is up 6 per cent.
2016 2017Broadcast / Media 83% 70%Utilities 82% 78%Telecommunications 78%Construction / Engineering 87% 79%Pharmaceuticals 82% 80%Retail 88% 80%Financial Services 84% 80%Leisure 80%Advertising 81% 81%Charity / Non Profit 91% 81%GLOBAL AVERAGE 84% 82%Healthcare 82% 83%Technology 82% 83%Government 86% 84%Manufacturing 81% 84%Professional Services 88% 85%Education 86% 86%Energy 82% 90%
This year we made changes to some sector categorisations,so year on year comparison is not possible
83%
82%
87%
82%
84%
81%
91%
84%
82%
86%
81%
88%
86%
82%
70%
78%
78%
79%
80%
80%
80%
80%
81%
81%
82%
83%
83%
84%
84%
85%
86%
90%
0% 20% 40% 60% 80% 100%
Broadcast / Media
Utilities
Telecommunications
Construction / Engineering
Pharmaceuticals
Retail
Financial Services
Leisure
Advertising
Charity / Non Profit
GLOBAL AVERAGE
Healthcare
Technology
Government
Manufacturing
Professional Services
Education
Energy
2017
2016
Chart 62: 2015–2017: How active are you in looking for a new role at present?
Chart 61: How fulfilling do you find your current role? Very and Quite. By sectorThis year we changed some of the sector categorisations. Year-on-year comparisons are not always possible.
2015 2016 2017Would not consider any roles presented 11% 15% 16% 4Keeping an eye on the market 30% 31% 30% 3Would take call from head hunter 38% 34% 36% 2Actively seeking & applying 22% 20% 18% 1
11%
30%
38%
22%
15%
31%
34%
20%
16%
30%
36%
18%
0% 20% 40%
Would not consider any roles presented
Keeping an eye on the market
Would take call from headhunter
Actively seeking & applying
2017
2016
2015
Over half of IT leaders would consider a new role or are actively looking

1. Global results
HARVEY NASH / KPMG CIO SURVEY 201749
HARVEY NASH / KPMG CIO SURVEY 2017
A third of IT leaders enjoy pay increase while six in ten are unchanged
Government respondents are least likely to experience salary increase; Retail and Leisure are doing best
Chart 63: How has your base salary changed compared with last year? 2015–2017.
Chart 64: How has your base salary changed compared with last year? Increased 2016–2017, by sector.This year we changed some of the sector categorisations. Year-on-year comparisons are not always possible.
Salaries In line with previous years, a third of respondents (33 per cent) enjoyed an increase in base salary last year. For the majority of IT leaders (62 per cent), their salary stayed the same, while there is a (very minor) rise in respondents reporting a decrease in salary.
Many more respondents in the Leisure and Retail sectors are enjoying a salary increase. Another sector performing well in terms of salary growth is the Energy sector. Three in ten received an increase, up by 38 per cent on last year, the most progress of any sector. This perhaps explains the increasing levels of fulfilment seen in the Energy sector in the previous section. Maybe money does buy some happiness?! By contrast, considerably fewer IT leaders in Advertising are experiencing salary growth, although this is down from a historical high last year. Despite this, more than three in ten IT leaders will still see salary inflation in 2017.
2015 2016 2017Decreased 3% 3% 5% 3Stayed the same 62% 57% 62% 2Increased 31% 34% 33% 1
3%
62%
31%
3%
57%
34%
5%
62%
33%
0% 20% 40% 60% 80%
Decreased
Stayed the same
Increased
2017
2016
2015
2016 2017Leisure 48%Retail 34% 41%Professional Services 35% 38%Technology 41% 36%Construction / Engineering 36% 36%Manufacturing 33% 36%Financial Services 37% 34%Advertising 50% 33%Pharmaceuticals 35% 33%GLOBAL AVERAGE 34% 33%Healthcare 31% 32%Broadcast / Media 29% 31%Energy 21% 29%Education 30% 28%Charity / Non Profit 32% 25%Telecommunications 25%Government 27% 20%
This year we made changes to some sector categorisations,so year on year comparison is not possible.
35%
36%
33%
37%
50%
35%
34%
31%
29%
21%
30%
32%
27%
48%
41%
38%
36%
36%
36%
34%
33%
33%
33%
32%
31%
29%
28%
25%
25%
20%
0 0.1 0.2 0.3 0.4 0.5 0.6
Leisure
Retail
Professional Services
Technology
Construction / Engineering
Manufacturing
Financial Services
Advertising
Pharmaceuticals
GLOBAL AVERAGE
Healthcare
Broadcast / Media
Energy
Education
Charity / Non Profit
Telecommunications
Government
2017
2016

1. Global results
50HARVEY NASH / KPMG CIO SURVEY 2017
Being large does not necessarily lead to large salary increases. This year, IT leaders at larger organisations are the least likely to receive a salary increase, compared with their peers in small and mid-sized organisations. However, fewer respondents at small organisations saw a salary increase last year compared with the previous year. Respondents at mid-sized organisations were marginally more likely to experience salary rises. The news is not good in the large corporate world, with 12 per cent fewer IT leaders of large companies recording a salary increase last year.
Possibly unsurprisingly, IT leaders who report to the CEO are more likely to have received a salary increase in the past 24 months compared with IT leaders who report to the CFO. IT leaders who sit on the executive management board remain more likely than average to receive a pay rise, with 35 per cent reporting an increase. IT leaders who have been in their role for less than five years are more likely to receive a salary increase than long-term occupants of their job. And in a striking development, female respondents are far more likely to have received a salary increase compared with their male peers: clear evidence perhaps that traditional gender salary inequalities may be starting to be addressed? We will explore this more at our report launch events.
!"#$%&'()#*(++#",-.#/012!"#$%&'()#/012#)3#/4012!"#$%&'()#536(#",-.#/4012
2016 35% 33% 32%2017 33% 35% 28%
35%
33%
32%
33%
35%
28%
0% 10% 20% 30% 40%
IT budget less than $50m
IT budget $50m to $250m
IT budget more than $250m
2017
2016
Chart 65: How has your base salary changed compared with last year? Increased 2016–2017, by IT budget.
Chart 66: How has your base salary changed compared with last year? Increased 2016–2017 – by reporting, time in role, gender.
IT leaders at smaller organisations continue to be more likely to receive a salary increase
Salary increases favour female IT leaders, in the role less than five years, who report to the CEO
CEO Report CFO Report Exec Board Member In Role <5yrs In Role 5yrs+ Female Male 2016 36% 28% 39% 36% 30% 33% 34%2017 36% 32% 35% 35% 31% 42% 32%
36%
28%
39%
36%
30%
33%
34%
36%
32%
35%
35%
31%
42%
32%
0% 10% 20% 30% 40% 50%
CEO Report
CFO Report
Exec Board Member
In Role <5yrs
In Role 5yrs+
Female
Male
2017
2016

1. Global results
HARVEY NASH / KPMG CIO SURVEY 201751
HARVEY NASH / KPMG CIO SURVEY 2017
Chart 67: What bonus have you received in the last 12 months? 2015–2017.
Chart 68: What bonus have you received in the last 12 months? By sector.This year we changed some of the sector categorisations. Year-on-year comparisons are not always possible.
Seven per cent increase in the number of IT leaders who did not receive a bonus last year
Decline in number of IT leaders receiving bonuses in Pharmaceuticals and Financial Services
Bonuses and benefitsBonus rates for IT leaders remain broadly in line with previous years. Slightly more respondents are going without a bonus, but this remains approximately three in ten IT leaders on average. The most significant change in bonus rates affects respondents who traditionally generate a bonus worth 20 per cent of their annual salary. This group declined by 20 per cent compared with last year, and most of these IT leaders seem to reappear in the lower or zero bonus categories, rather than in the higher bonus levels.
With the notable exceptions of the Government, Non-Profit and Education sectors, the large majority of IT leaders receive a bonus as part of their annual remuneration. However, in a number of sectors, the proportion of respondents to receive a bonus is dropping compared with last year: Pharmaceuticals (17 per cent decline)and Financial Services (7 per cent decline) are examples of this trend.
2015 2016 2017No bonus 28% 28% 30%Less than 10% 12% 12% 13%10% 15% 13% 12%20% 19% 20% 16%30% 11% 11% 11%40% 6% 6% 5%50% 3% 4% 4%60%-100% 6% 3% 5%More than 100% 2% 2% 3%
28%
12%
15%
19%
11%
6%
3%
6%
2%
28%
12%
13%
20%
11%
6%
4%
3%
2%
30%
13%
12%
16%
11%
5%
4%
5%
3%
0% 10% 20% 30% 40%
No bonus
Less than 10%
10%
20%
30%
40%
50%
60%-100%
More than 100%
2017
2016
2015
2016 2017Charity / Non Profit 31% 32%Education 37% 33%Government 24% 35%Technology 76% 66%Healthcare 62% 68%GLOBAL AVERAGE 72% 70%Professional Services 67% 70%Energy 82% 73%Pharmaceuticals 90% 75%Retail 77% 75%Leisure 76%Financial Services 84% 78%Broadcast / Media 77% 80%Telecommunications 81%Construction / Engineering 83% 82%Advertising 86% 84%Manufacturing 81% 84%
This year we made changes to some sector categorisations,so year on year comparison is not possible.
31%
37%
24%
62%
72%
67%
82%
90%
84%
77%
83%
86%
81%
32%
33%
35%
66%
68%
70%
70%
73%
75%
75%
76%
78%
80%
81%
82%
84%
84%
0% 20% 40% 60% 80% 100%
Charity / Non Profit
Education
Government
Technology
Healthcare
GLOBAL AVERAGE
Professional Services
Energy
Pharmaceuticals
Retail
Leisure
Financial Services
Broadcast / Media
Telecommunications
Construction / Engineering
Advertising
Manufacturing
2017
2016

1. Global results
52HARVEY NASH / KPMG CIO SURVEY 2017
The value of other benefits – including car, short-term and long-term incentive plans (LTIPs), shares or equity – continue to add significant value to IT leaders’ remuneration. The proportion of respondents who receive no additional benefits is static at just under three in ten (28 per cent). A majority continue to receive benefits valued between 10 per cent and 30 per cent of their annual base salary. The proportion receiving mega-benefits (valued at more than 100 per cent of annual base salary) also remains stable (6 per cent of all IT leaders this year).
Chart 69: What is the value of the benefits you receive, including car, LTIPs, shares or equity (as a percentage of your base salary)? 2015–2017.
Majority of respondents value their benefits package at 10 per cent to 30 per cent of their annual base salary
Estimated value on benefits in relation to annual base salary 2015 2016 20170% 28% 27% 28%10% 31% 33% 32%20% 16% 18% 17%30% 10% 10% 9%40% 4% 2% 3%50% 4% 4% 4%75% 2% 1% 2%100% 2% 1% 3%150% 1% 1% 1%>200% 2% 1% 2%
28%
31%
16%
10%
4%
4%
2%
2%
1%
2%
27%
33%
18%
10%
2%
4%
1%
1%
1%
1%
28%
32%
17%
9%
3%
4%
2%
3%
1%
2%
0% 10% 20% 30% 40%
0%
10%
20%
30%
40%
50%
75%
100%
150%
>200%
2017
2016
2015

53HARVEY NASH / KPMG CIO SURVEY 2017
At MIT CISR, as we study how enterprises are transforming themselves with digital technologies, we are beginning to see industry consolidation. There is an emerging consensus among economists that two likely key causes of consolidation – mergers and technology – are significantly weakening competition in two-thirds of industries. As your enterprise reinvents itself in the digital era, often by pursuing a different business model, we think you need to make investments in your business that quickly create opportunities, because it seems there is a significant first mover advantage for enterprises that are transforming. In this piece, we will describe four business models for the digital economy. Using the 2017 Harvey Nash / KPMG CIO Survey data, we show the current distribution of business models (and compare it with the distribution in 2013) and glean insights about the capabilities that each business model needs to be successful.
Options for the next-generation enterpriseTo understand the impact of digitisation on the next-generation enterprise, we talked to 144 senior executives and asked them to describe their most important digitally enabled breakthrough projects. We found that leaders had to make two choices as they design the next-generation enterprise – the business design and their relationship with the end customer (see Figure 1).
The horizontal axis of the 2x2 is the business design, with value chain and ecosystem as the options. Value chain models, popularised by Michael Porter in the 1980s, were implemented successfully by many enterprises, including Walmart, Procter & Gamble, ExxonMobil and most banks and retailers. Digitisation is enabling a different kind of model that we call a digital business ecosystem. We think of a digital
Digital ecosystem business models are consolidating – move quickly!
Over 600 respondents to the Harvey Nash / KPMG CIO Survey provided additional information, including company name, to take part in further analysis by Massachusetts Institute of Technology Center for Information Systems Research. MIT CISR is one of the world’s leading IT research organisations.
Figure 1. Options for the next-generation enterprise
EcosystemValueChain
Figure1:Optionsforthenext-generationenterprise
BusinessDesignWho controls key decisions like brand, contracts, price,
quality, participants, IP & data ownership, regulation
Know
ledg
eofYou
rEnd
Customer
Know
:identity,purchasehistorywith
you
rcom
pany
&otherfirm
s,and
con
sumergoals Complete
Partial
P.Weill&S.L.Woerner,“ThrivinginanIncreasinglyDigitalEcosystem”,MITSloanManagementReview,Summer2015,Vol.56,No.4,pp.27-34,16June2015.P.Weill&S.L.Woerner,TheNextGenerationEnterprise:TransformingforaDigitalEconomy, HarvardBusinessSchoolPress,forthcoming2017.
SUPPLIER• Sellthroughotherenterprises• Potentialforlossofpower• Coreskills:low-costproducer,incrementalinnovation
Insuranceviaagent,electronicsproducerviaretailer,mutualfundviabroker
OMNI-CHANNEL• ‘Own’customerrelationship• Createmulti-productcustomerexperience
toaddresslifeevents• Customerchooseschannels• Integratedvaluechain
Banks,retail,energycompanies
MODULAR PRODUCER• Plug-and-playproduct/service• Abletoadapttoanyecosystem• Constantinnovationofproduct/service
PayPal
ECOSYSTEM DRIVER• Becomethe destinationinyourspace• Addcomplementaryandpossiblycompetitorproducts• Ensuregreatcustomerexperience• Customerdatafromallinteractions• Matchcustomerneedswithproviders• Extract‘rents’
Amazon,Fidelity,Aetna

54HARVEY NASH / KPMG CIO SURVEY 2017
business ecosystem as a co-ordinated network of enterprises, devices and customers that creates value for all participants. There is typically a single enterprise in a particular space – such as shopping (Amazon), healthcare (Aetna), technology (Microsoft), industrial internet (GE) and wealth management (Fidelity) – driving the ecosystem and attracting customers.
The vertical axis is the depth of knowledge of your end customer. Deep knowledge of the end customer enables your enterprise to make more attractive offers and increase customer engagement. For example, how well do you know your end customer and their key life events? Can you make offers to help customers negotiate those life events? For B2C customers, life events include moving house, buying a car, getting married, having a child and saving for retirement. For B2B customers, life events include opening a new store, launching a new product and conducting a major advertising campaign.
The combination of the two dimensions leads to four possible business models. We observe all four as viable business models today, each with distinct opportunities and challenges. Many firms have revenues from several of the models.
• Suppliers have at best a partial knowledge of their end customer, and typically operate in the value chain of another, more powerful, enterprise. A company like Procter & Gamble is an example of a supplier (selling through retailers rather than direct to the customer, thus not collecting end customer data), though P&G is taking steps – through B2C websites like pampers.com, sentiment analysis and
test-and-learn initiatives – to learn more about, and increase engagement with, its end customers.
• Omni-channel businesses provide customers access to their products across multiple channels, including physical and digital channels, allowing the customer to move seamlessly across channels while providing a superior customer experience. We see many banks, telecommunications companies and retail enterprises working hard towards this model.
• Modular producers provide plug-and-play products or services that can adapt to any number of ecosystems. To survive, they have to be one of the best service providers of their core activity (like payments). To thrive, they must constantly innovate their products and services, ensuring they’re among the best options available and at the right price. PayPal is an example of a modular producer – its payment system can be used by almost any enterprise and individual, globally.
• Ecosystem drivers want to become the destination for a subset of their customers in their space. They provide a platform for the participants to do business that can be more (e.g. Google) or less (e.g. Apple) open. They leverage their brand to attract participants, ensure a great customer experience and offer one-stop shopping providing their own products, complementary products and sometimes competitor products. An ecosystem driver is typically the only enterprise in the ecosystem that sees all the data and uses the insights to make the destination increasingly attractive.
Figure 2. Percentage of companies by dominant model
EcosystemValueChain
Complete
Partial
P.Weill&S.Woerner,“ThrivinginanIncreasinglyDigitalEcosystem,”MITSloanManagementReview,Summer2015,Vol.56,No.4,pp.27-34,16June2015.P.Weill&S.Woerner,TheNextGenerationEnterprise:TransformingforaDigitalEconomy.HarvardBusinessSchoolPress,forthcoming2017.
OMNI-CHANNEL ECOSYSTEMDRIVER
SUPPLIER MODULARPRODUCER
21% 37% 20% 9%
42% 46% 18% 8%
Figure2:Percentageofcompaniesbydominantmodel
Whocontrolskeydecisions:brand,contracts,price,quality,participants,IP&dataownership,regulation
BusinessDesign
Know
ledg
eofYou
rEnd
Customer
Know
identity,purchasehistorywith
you
rcom
pany
&otherfirm
s&con
sumergoals
2012
2017
2013
2017

55HARVEY NASH / KPMG CIO SURVEY 2017
How the competitive landscaped has evolvedIn 2013, we measured the distribution of firms’ dominant models (calculated by source of revenue and depth of customer knowledge) across the four business models. We found suppliers were 42 per cent, omni-channel 21 per cent, modular producers 18 per cent and ecosystem drivers 20 per cent of enterprises (see Figure 2). Customers had many choices as to which enterprise was their go-to company for banking, travel, shopping, entertainment, etc. And over half of these ecosystem drivers were small enterprises, often start-ups, trying to create a blockbuster business.
In the intervening five years, we have seen a consolidation (i.e. a Darwinian shaking out) of ecosystem drivers and modular producers, the successful ones growing rapidly and the others failing and often disappearing (or being acquired). These two ecosystem business models – which rely on having great platforms – have decreased to 9 per cent (ecosystem drivers) and 8 per cent (modular producers). The other enterprises are focusing on learning about their end customers as the number of omni-channel businesses has increased to 37 per cent (from 21 per cent). The percentage of suppliers is up a little to 46 per cent.
Customers are voting with their mobile devices and are choosing from a handful of dominant ecosystem drivers for each domain in their lives – which, in turn, increases those ecosystem driver enterprises’ power in the marketplace. An example of this consolidation is the continuing rise of Amazon. Amazon accounted
for 43 per cent of all online retail revenue last year and 20 per cent of all US consumers are Prime members.1 Even more telling, 55 per cent of US consumers begin their product searches at Amazon.2 Amazon has supplied Dash buttons that can be put anywhere in the house so customers can make one-click purchases of products they are running out of without going online. Alexa, the Amazon voice-activated assistant, can tell you the weather, stream music and take orders for products, and that’s just a start. And Amazon is even experimenting with physical stores and perfecting the technology. Its Amazon Go store allows customers with the app to go in, pick up food and leave, paying electronically and never having to queue for the cashier.
Capabilities to developIn addition to customers frequenting a smaller number of dominant players, there’s another factor at work. Becoming a successful ecosystem driver isn’t easy and requires a long list of world-class capabilities. We analysed the survey data to understand which capabilities were needed for each business model (see Figure 3). Suppliers, because they sell through other enterprises, must be skilled at managing costs as price is a key factor for success in a world where search is easy. Robotics and automation are a key capability for keeping costs down.
Omni-channel businesses must continue to learn about their customers, create a seamless customer experience and maintain a stream of new products and
Figure3:Whichcapabilitiesarekeyforthemodels?
*Analysisissignificantatthep<0.1level,allotheranalysesaresignificantatthep<0.05level.
Supplier Omni-channel
Modularproducer
Ecosystemdriver
Fostering innovation ✔
Aligninggovernance ✔
Selectingappropriate architecture* ✔ ✔
Managing riskandsecurity ✔
Usingdataandanalyticseffectively ✔
Usingpartnerships* ✔ ✔ ✔
Integratingnew digitalsolutionswithcorebusiness ✔ ✔
Usingdigitaltoadvancebusinessstrategy ✔
Leveragingtest-and-learn(quickaboutshutting downprojects)* ✔ ✔
InvestinginPlatformasaService ✔
Investinginrobotic automation ✔
Figure 3. Which capabilities are key for the models?
1. www.businessinsider.com/amazon-accounts-for-43-of-us-online-retail-sales-2017-2
2. https://www.bloomberg.com/news/articles/2016-09-27/more-than-50-of-shoppers-turn-first-to-amazon-in-product-search

56HARVEY NASH / KPMG CIO SURVEY 2017
Stephanie L. Woerner Research Scientist, MIT Sloan School of Management’s Center for Information Systems Research.
Peter Weill Chairman and Senior Research Scientist, MIT Sloan School of Management’s Center for Information Systems Research.
services to keep customers engaged. In an increasingly digital economy, test-and-learn capabilities like A/B testing, figuring out which offers will work best, are key to learning about customers. Architecture matters when customers expect to use one channel just as easily as another or even move between channels during a single transaction. Easily integrating new digital solutions is key to maintaining customer engagement and buzz.
A modular producer needs to be able to plug into any enterprise’s platform to succeed and investing in partnerships, often consummated digitally, is the primary way to access new opportunities. For example, having an easy-to-use, easily accessible API set is an important component to building a successful partnership. Modular producers also have to constantly innovate to add capabilities in order to stay ahead of what often becomes a commodity business. Test-and-learn capabilities become critical to deciding which new offers are worthwhile and will extend reach.
Becoming an ecosystem driver requires being good at a wide variety of capabilities, almost everything that modular producers and omni-channel businesses have to do and more. Perhaps this is why consolidation has occurred so quickly. Building a platform that customers want to interact with, and partners and suppliers want to do business on, is the most important capability. Platform as a Service is one way for an enterprise to get up and running as an ecosystem driver. But it’s not enough. An ecosystem driver has to have great customer data and the ability to protect that data. Digital capabilities are key to its strategy and success, and there is a need for constant innovation to engage
customers and partners. An ecosystem driver model has a lot of moving parts so a robust digital governance model that continually enhances, rather than fragments, the platform is key.
The CIO plays a key role in creating and reusing all these key capabilities. The survey results show that the CIO is becoming more strategic, no matter which model(s) the enterprise uses. Effective CIOs are increasingly partnering with other executives and influencing the executive committee, often helping choose which model(s) are best for the enterprise, particularly around the decision of what is realistic. CIOs in all of the models are meeting regularly with their boards – somewhere between every three and six months – with discussions focused in areas such as strategy (i.e. which model), reporting (i.e. progress being made) and defensive (i.e. cyber, privacy and compliance).
If the trend we have identified here continues, we will see customers identifying the go-to enterprise in each of their life spaces (like healthcare, education, entertainment, etc.). This will lead to further technology-enabled consolidations as a few firms will become very powerful ecosystem drivers – effectively intermediating between the end customer and the service provider. We think this consolidation has so far largely been a consequence of first mover advantage. How will you compete in this environment? Which model(s) are you today? And how do you start building capabilities now to move to another model? This is a fundamental conversation for the CIO to lead among his or her enterprise’s management team. And the sooner the better.

57HARVEY NASH / KPMG CIO SURVEY 2017
GROWTH ORIENTATED EXPERIENCING UNPREDICTABILITY
% CIOs operating with IT budget increase % CIOs agree political, business and economic environment has become more unpredictable
1 France 72%
2 Colombia 68%
3 Austria 62%
4 Venezuela 59%
5 Denmark 54%
6 Vietnam 51%
7 Ireland 51%
8 Canada 51%
9 Mexico 48%
10 United Kingdom 48%
11 Germany 48%
12 United States 47%
13 Panama 47%
14 GLOBAL AVERAGE 46%
15 Hong Kong 42%
16 China 39%
17 Portugal 39%
18 The Netherlands 39%
19 Belgium 38%
20 Australia 38%
21 Italy 37%
22 Poland 37%
23 India 36%
24 Sweden 35%
25 Switzerland 32%
26 Barbados 32%
27 Brazil 28%
28 Japan 27%
1 Venezuela 97%
2 Panama 95%
3 Mexico 94%
4 Portugal 93%
5 India 93%
6 Brazil 87%
7 Italy 80%
8 China 78%
9 Vietnam 76%
10 Colombia 75%
11 Barbados 73%
12 France 72%
13 Hong Kong 69%
14 Canada 66%
15 Switzerland 66%
16 Germany 63%
17 Japan 63%
18 Belgium 63%
19 GLOBAL AVERAGE 63%
20 The Netherlands 63%
21 Australia 62%
22 Sweden 62%
23 Poland 61%
24 United States 59%
25 United Kingdom 58%
26 Ireland 57%
27 Denmark 52%
28 Austria 48%
Regional League Tables

58HARVEY NASH / KPMG CIO SURVEY 2017
IMPORTANCE OF OUTSOURCING SAFEST FROM CYBER ATTACK
% CIOs planning to increase outsourcing spend % CIOs faced major security incident in past two years
1 Austria 80%
2 France 79%
3 Colombia 71%
4 Vietnam 67%
5 Canada 62%
6 Portugal 60%
7 Venezuela 60%
8 Switzerland 58%
9 Ireland 57%
10 China 56%
11 Japan 55%
12 Belgium 53%
13 Denmark 52%
14 Panama 52%
15 GLOBAL AVERAGE 48%
16 The Netherlands 48%
17 Hong Kong 48%
18 Mexico 48%
19 Sweden 47%
20 Brazil 46%
21 Poland 46%
22 United States 45%
23 United Kingdom 44%
24 Germany 44%
25 Australia 43%
26 India 38%
27 Italy 30%
28 Barbados 25%
1 India 18%
2 Panama 21%
3 Venezuela 21%
4 Barbados 25%
5 China 25%
6 Brazil 25%
7 United States 27%
8 Colombia 27%
9 Ireland 29%
10 Hong Kong 30%
11 Australia 31%
12 GLOBAL AVERAGE 32%
13 France 32%
14 Portugal 32%
15 Poland 32%
16 Italy 33%
17 United Kingdom 33%
18 Sweden 34%
19 Germany 37%
20 Canada 37%
21 Mexico 40%
22 Belgium 42%
23 Denmark 42%
24 Vietnam 45%
25 Austria 45%
26 The Netherlands 51%
27 Switzerland 54%
28 Japan 55%

59HARVEY NASH / KPMG CIO SURVEY 2017
EMBRACING DIGITAL LEADERSHIP AUTOMATION
% Organisations with Chief Digital Officer% Currently investing in digital labour,
cognitive automation or robotic process automation
1 Hong Kong 48%
2 Italy 39%
3 France 38%
4 Poland 38%
5 Venezuela 38%
6 Sweden 37%
7 Belgium 36%
8 Mexico 35%
9 India 33%
10 Switzerland 31%
11 Japan 31%
12 Ireland 29%
13 Australia 28%
14 The Netherlands 27%
15 United Kingdom 27%
16 GLOBAL AVERAGE 25%
17 Germany 25%
18 Denmark 23%
19 United States 21%
20 Austria 21%
21 Portugal 20%
22 Barbados 17%
23 Colombia 16%
24 Vietnam 15%
25 China 13%
26 Canada 12%
27 Panama 12%
28 Brazil 7%
1 France 61%
2 Austria 59%
3 India 55%
4 Vietnam 51%
5 Denmark 50%
6 Japan 48%
7 Poland 47%
8 Brazil 47%
9 Hong Kong 46%
10 Portugal 46%
11 Switzerland 45%
12 The Netherlands 43%
13 Australia 43%
14 Belgium 42%
15 Sweden 38%
16 Italy 37%
17 Ireland 37%
18 Mexico 35%
19 GLOBAL AVERAGE 34%
20 Germany 33%
21 Colombia 32%
22 United Kingdom 30%
23 China 30%
24 Venezuela 29%
25 United States 29%
26 Canada 28%
27 Panama 14%
28 Barbados 8%

60HARVEY NASH / KPMG CIO SURVEY 2017
CAREER PLANNING SALARY INFLATION
% CIOs moved job in past year % CIOs reporting pay increase in past year
1 Sweden 23%
2 Denmark 23%
3 United Kingdom 23%
4 Germany 18%
5 Japan 16%
6 GLOBAL AVERAGE 15%
7 United States 15%
8 Austria 14%
9 India 14%
10 Venezuela 14%
11 Portugal 14%
12 Ireland 13%
13 Poland 13%
14 Australia 13%
15 France 12%
16 Italy 11%
17 Canada 10%
18 Colombia 10%
19 China 8%
20 Belgium 8%
21 Hong Kong 8%
22 Switzerland 8%
23 Barbados 7%
24 Vietnam 7%
25 The Netherlands 6%
26 Brazil 4%
27 Mexico 3%
1 China 71%
2 Vietnam 68%
3 Poland 50%
4 Brazil 49%
5 Japan 44%
6 France 36%
7 Germany 36%
8 Portugal 36%
9 Hong Kong 35%
10 Ireland 34%
11 Italy 33%
12 United States 33%
13 GLOBAL AVERAGE 33%
14 Australia 32%
15 Barbados 32%
16 Belgium 32%
17 Canada 32%
18 United Kingdom 30%
19 Panama 29%
20 Austria 27%
21 Mexico 27%
22 Sweden 24%
23 The Netherlands 18%
24 Switzerland 14%

61HARVEY NASH / KPMG CIO SURVEY 2017
www.hnkpmgciosurvey.com
The online home of the Harvey Nash / KPMG CIO Survey
NAV I G ATI N GU N C E RTA I NTY
Events Find out about our launch
events across the world
DownloadGet hold of the digital version
of the report
CIO viewpoints
Read the opinions of CIOs across the world
DataPlay with interactive charts