Hartlepool: A Case Study in Burglary Reduction
55
Hartlepool: A Case Study in Burglary Reduction Louise Sturgeon-Adams, Sue Adamson and Norman Davidson. Centre for Criminology and Criminal Justice, University of Hull January 2005 University of Hull
Transcript of Hartlepool: A Case Study in Burglary Reduction

Hartlepool: A Case Study in BurglaryReduction
Louise Sturgeon-Adams, Sue Adamson and NormanDavidson.
Centre for Criminology and Criminal Justice, University of Hull
January 2005
University of Hull

Page jj Hartlepod: A Case Study in Burglary Reduction
Acknowledgements
This research would not have been possible without the time and assistance provided by those
involved with the Hartlepool Strategic Development Project - we would therefore like to
extend our thanks to them. Special thanks should go to Alison Mawson, Hartlepool's
Community Safety Strategy Officer, and Sgt Lynn Beeston, Community Safety Officer with
Cleveland Police,
We should also like to thank David Wain of Cleveland Police Headquarters who provided the
crime data and Keith Elliott of the Tees Valley Strategy Unit who was involved in the
cleaning up of the burglary data.
The cost effectiveness analysis was based on the work carried out by Matrix, MHA Research
and Consultancy for the Northern Consortium evaluation of the Reducing Burglary Initiative,
Northern Region.
We should also like to acknowledge the contribution of Lucy Edwards who was the
fieldworker responsible for the majority of data collection in Hartlepool.
ISBN 1 903704 27 8
Published by:
Centre for Criminology and Criminal Justice
University of Hull
Hull
HU6 7RXTel 01482 465779

Hartlepool: A Case Study in Burglary Reduction page iii
Contents
Executive Summary 1
1 Introduction 5
2 Setting the Scene 6
3 Pattern of Burglary Before Project 8
4 The interventions proposed and carried out 8
4.1 Alleygating 9
4.2 Target Hardening 10
4.3 Property Marking 11
4.4 Diversionary Schemes for Young People 12
4.5 Supervision/Treatment of Offenders - Fairbridge Programme 14
4.6 Education and Awareness 16
4.7 Community Development 17
5 Impact of the proj ect 19
5.1 Data Issues and Methodology 19
5.2 Changes in Patterns of Burglary 21
5.3 Interventions 25
5.3.1 The Effects of Alleygating on Protected properties 25
5.3.2 The Effects of Alleygating on Nearby Properties 26
5.3.3 MO in Alleygated Areas 27
5.3.4 Overall Effects of Alleygates 27
5.3.5 The Effects of Target Hardening 27
5.3.6 The Effects of Plug-In Timers 28
5.4 Reduction of Repeat Victimisation 29
5.5 Other Crime Outcomes 30

Pageiv Hartlepool: A Case Study in Burglary Reduction
6 Assessment of Achievements 31
7 Cost Effectiveness of the project 33
8 Key Strengths of the Project 34
9 Key Benefits of the Project 36
10 Main Problems Encountered 37
11 Conclusions 38
Addendum Contents
1. Introduction 40
2. Burglary reduction 40
3. Changes in patterns of burglary 42
4. Reduction of repeat victimization 44
5. The effects of alleygating 45
6. The effects of target hardening 47
7. Summary and conclusion 48

Hartlepool: A Case Study in Burglary Reduction pagev
List of Figures
Figure 1 Location map of SDP
Figure 2 Total Crime Increase at July 1999
Figure 3 Burglaries Before and After the SDP Start
Figure 4 Burglary Hotspots Before and After the SDP start
Figure 5 Repeats - Last Offence Within 90 Days by Quarter
6
19
21
22
30
Addendum Figures
Figure 1 Burglary hotspots
Figure 2 Repeat victimization
43
44
List of Tables
Table 1 MO of Burglaries 7
Table 2 Measures of Burglary Pattern Before and After SDP start .. 22
Table 3 Yearly Burglary in SDP 23
Table 4 Burglary Outcomes 23
Table 5 Breakdown of Hartlepool SDP Outcomes 24
Table 6 Gross Burglary Figures April to September 25
Table 7 Houses Protected by Alleygates 26
Table 8 Area Near to Alleygates 27
Table 9 MO in Alleygated Areas 27
Table 10 Households Offered Target Hardening 28
Table 11 Houses with Plug-In Timers: Before and After Burglary Rates 29
Table 12 Repeat Burglary Addresses Two Years Before/ Two Years After 30
Table 13 Crime Other than Burglary Dwelling Before and After SDP Start 31
Table 14 Crude and Modelled Input Costs and Breakeven Outcomes 34
Addendum Tables
Table 1 Yearly burglary in SDP
Table 2 Burglary outcomes
Table 3 Breakdown of Hartlepool SDP outcomes
Table 4 Measures of burglary pattern before and after SDP start
40
41
42
43

Page vi Hartlepool: A Case Study in Burglary Reduction
Table 5 Repeat burglary addresses
Table 6 Houses protected by alleygates
Table 7 Area near to alleygates
Table 8 MO in alleygated areas
Table 9 Repeat victimized households offered target hardening
Table 10 Houses with plug-in timers
Table 11 Reduction in burglary - plug-in timers
44
45
45
46
47
47
47

Hartlepool: A Case Study in Burglary Reduction page 1
Hartlepool: A Case Study in Burglary Reduction
Executive Summary
• Hartlepool SDP was developed to combat the particular burglaiy problems of the
Belle Vue and Rift House East areas of South Hartlepool.
• The project was founded on good pre-existing relations with the community in Belle
Vue. However, attitudes in Rift House East were much less encouraging to
interventions.
• The project was well planned and had, from the outset, the support of a Steering
Group that engaged the various partners in finding solutions that matched the
problem in the area.
• The aim of the project was to develop interventions that would not only be effective
in their own right but enhance and strengthen each other. These included:
- Alleygating: to protect the rear of properties
Target hardening: to protect repeat victims, hot spots of burglary and end terrace
properties.
- Property marking: extend existing scheme (covering 1000 households) to
remaining area of 2500 households.
- Diversionary schemes for young people: engage young people generally in
structured programmes focussed on the Sports Centre.
Supervision of offenders: engage young offenders in personal development
programme.
Education and awareness: promotion of good crime prevention within the
community.
- Community development: increasing the capacity of the community to respond to
the problem of crime.
• The achievements of the scheme include:
- 14 alleygates protecting 185 properties
- 24 repeat victims identified, 15 of which had their properties target hardened

Page 2 Hartlepool: A Case Study in Burglary Reduction
- 839 homes were property marked
- Over 200 young people attended evening sessions
- Over 50 young people attended outdoor activities
- 5 young offenders attended personal development course
- Family Fun Day (crime prevention theme), Crime Prevention Week, Community
Newsletter and visits of crime prevention officers to schools
- 2000 community safety packs distributed to residents
- Employment of local people to coordinate anti-burglary activities
• Problems encountered:
legal difficulties and resistance to al ley gates
low take-up of property marking due to lack of interest
- bad publicity wrecked the offender programme and caused the key person in the
youth engagement work to withdraw
• Reduction in burglary, comparing two years before and after project started:
- 25% reduction in overall burglaries reported
- compared to 9% reduction in local police division and 12% in Cleveland Police
Force Area
total savings over two years of 55 burglaries
• Impact of interventions:
- no burglaries had been committed in houses protected by the early phase of
alleygates
although less marked, there was also a reduction in burglaries of houses near the
alleygating schemes
- only 2 of 24 repeat victims suffered further burglary
- plug-in timers reduced the burglary rate by 37%
- repeat victimisation within 90 days was reduced by 26%
- other crimes rate of change always lower for SDP than BCU or PFA
• Hartlepool SDP inputs had total cash value of £79,000.

Hartlepool: A Case Study in Burglary Reduction page.3
• Total modelled costs had a value of £54,000 (that is after adjustment for life of
project etc). Value of burglaries saved was £118,030 giving a cost benefit ratio of
2.19 (and net benefits of £64,000).
• To break even on cost, Hartlepool SDP would have needed to save 23 burglaries. It in
fact saved 55.
• Main strengths of the project:
- utilisation of existing resources gave the project a sound platform
- carefully selected and achievable targets maintained momentum
- project management was strong but not authoritarian
- anti-burglary coordinators provided a crucial link with residents
- a strong Steering Committee ensured regular review and monitoring of progress
community backing throughout the project
• Key benefits of the project:
- improved feelings of safety and security have contributed to a more positive
reputation for the area - a turn around in desirability of the area
enhanced support for police in area
more positive views of youth involvement in area, though volatility of public
opinion is a problem
- community involvement in bidding for funds e.g. New Deal
- specific lessons about alleygating - successful use depends on a positive attitude to
the use of the space, for example, as play area as well as improved security
• Problems encountered:
- a degree of apathy among residents hampered property marking
- volunteers were able to walk away when problems arose
- volatile public opinion resulted in withdrawal of support and resources at a crucial
stage in offender intervention.
Addendum
Further reduction in burglary to 4 years after project start

Page 4 Hartlepool: A Case Study in Burglary Reduction
- Total reduction after 4 years 28%
- Compared to 13% reduction in local police division and 8% in Cleveland police
Force Area.
- Total savings over 4 years of 138 burglaries
• Continued impact of interventions
- Repeat victimization within 90 days reduced by 33% after 4 years
- Burglary in SDP alleygate areas still less than pre-installation
- Addresses with plug in timers still 4% less monthly burglary rate than whole SDP
after 4 years
• Community relations a likely contributory factor in sustainability

Hartlepool: A Case Study in Burglary Reduction page 5
1. INTRODUCTION
In 1998 the Home Office launched the Crime Reduction Programme which consisted of a
range of initiatives aimed at tackling crime. A significant part of this programme was the
Reducing Burglary Initiative (RBI) which was specifically aimed at reduction of burglary
rates through funding of a variety of projects on a nationwide basis. Phase One of the RBI
provided funding for 63 Strategic Development Projects (SDPs) throughout the country, all of
which had a burglary rate of at least twice the national average. Each project consisted of a
number of interventions aimed at reducing burglary rates, ranging from improvements in
household security to working with offenders on an individual basis. The success of these
projects is being separately evaluated for the North, Midlands and South of England. The
consortium which undertook the evaluation of the 21 projects in the North of England
consisted of research groups from Hull, Huddersfield and Liverpool Universities. The full
evaluation will be published in due course but will be, by the very nature and scale of the
evaluation, limited in the amount of detailed information it can provide concerning each
individual project.
The aim of this case study is to examine the Hartlepool SDP in order to describe and
understand processes and outcomes, whilst grounding them in the specific local context (i.e.
within the framework of realistic evaluation - see Pawson and Tilley, 1997). In order to do
this, the case study will examine the pre-existing burglary problem, detail the work that was
undertaken in terms of interventions, examine how the work was undertaken (including
problems encountered and solutions that were developed), assess the extent to which the
project can claim success (especially with regard to burglary outcomes and its stated aims and
objectives), and summarise key messages and lessons learned. Hartlepool has been chosen for
this examination as it incorporated a variety of interventions and, as will be shown, is able to
demonstrate success both in terms of burglary outcomes and of achieving its aims and
objectives.
Some work has already been carried out by the evaluators at Liverpool University to
demonstrate the detailed level of analysis that can be undertaken within the framework of
crime reduction when disaggregate level data (i.e. data concerning individual crimes) are
available (Johnson, Bowers and Hirschfield, forthcoming). Their case study of Liverpool SDP
demonstrates a variety of techniques for analysing changes in burglary rates, repeat

Page 6 Hartlepool: A Case Study in Burglaiy Reduction
victimisation, displacement, and looking at the effectiveness of individual interventions. The
present case study will demonstrate a number of alternative techniques which can be used in
order to analyse and detail the outcomes of the burglary reduction initiative within the
Hartlepool SDP. This will be contextualised by an analysis of the operation of the project
which will seek to demonstrate the importance of local conditions and resources. In summary,
the case study will demonstrate the importance of the local context to the success/failure of
burglary reduction initiatives as a whole, and also its importance when considering particular
types of intervention. It will also underline the crucial role played by personnel in both
management terms and in the implementation of schemes.
2. SETTING THE SCENE
The Hartlepool SDP lies to the south of Hartlepool town centre and consists of approximately
3500 households. The SDP divides naturally into two distinct areas which are separated by a
main road. Before the introduction of the RBI each area had its own separate identity. Belle
Vue Estate lies to the east side of the SDP and was perceived as problematic in terms of anti-
social behaviour of some residents and the high incidence of criminality and drug use within
the area. Rift House East Estate, on the west side of the SDP, was considered to be less
problematic than Belle Vue, although was by no means problem free. Burglary was a
sigmficant issue for the residents of Belle Vue and a number of them were in the process of
trying to take some action against crime on the estate when the RBI began. A group of
residents had already formed an association (in 1997) in the face of a good deal of opposition
and intimidation from anti-social members of the local community, and were trying to
improve conditions for local people. This group of residents became involved with the RBI at
the stage of planning and bidding for funds. The scheme was, therefore, able to access a level
of commitment and enthusiasm from the local community at the earliest stages of the project.
Young people in the area were seen as a particular problem as it was felt that a relatively
small number of young people on the estate were responsible for a significant proportion of
the estate's difficulties in terms of crime and anti-social behaviour. Drug use was thought to
be a particular problem as well as the attendant difficulties of crimes commissioned in order
to fund habits. 'Sneak-in' burglaries were thought to be common, as was forced entry at the
rear of properties. Prior to the RBI, attitudes towards the police varied across the SDP, with
residents in Belle Vue being willing to work with the police whilst those in Rift House East
were unwilling to do so, despite efforts from the police to encourage exchange of
information. The location of the SDP is shown in Figure 1.

Hartlepool: A Case Study in Burglary Reduction page 7
O Crown Copyriofitntataljaae right 2O(yy) «i OrrJnance SurveyKDatacantre) supplied service
Figure 1 Location Map of SDP
The project itself began promptly in April 1999, following the planning phase which began in
December 1998 and was managed by the Community Safety Strategy Officer from Hartlepool
Borough Council and the Community Safety Officer from Cleveland Police. Throughout the
life of the project the managers were supported by the Steering Group which consisted of
representatives of partner agencies. These included: an SRB funded community safety
organisation; a voluntary alarms project; several social landlords/housing associations; Belle
Vue Sports Centre; Belle Vue Residents' Association; local councillors; local residents;

Page 8 Hartlepool: A Case Study in Burglary Reduction
Neighbourhood Watch Co-ordinator; Crime Prevention Officer; and Community Police
Officers. The interventions which were chosen by the project team attempted to match
problems to solutions following crime pattern analysis and consultation with the local
community* mainly in the form of Belle Vue Residents' Association.
3. PATTERN OF BURGLARY BEFORE PROJECT
Analysis of burglary figures shows that there was an average of 61 burglaries per 1000
households per year, in the two years before the start of the SDP, compared with 45 in
Hartlepool 1 Police District, and an average monthly SDP burglary count of 17.5. Slightly
less than half of the burglaries occurred in Belle Vue and slightly more than half in Rift
House East, which is the reverse of the perceived problem referred to earlier. More burglaries
took place in whiter and autumn than in spring and summer. The highest numbers of
burglaries occurred on Sundays and the lowest numbers mid week. Because of the inexact
way the date and time fields have been completed in the data provided by Cleveland Police, it
has not been possible to generate information on time of day. Table 1 provides infonnation on
MO although it must be noted that this information was only available for 75% of burglaries.
The problem of rear entry highlighted earlier is confirmed but there is no evidence from the
burglary data of a 'sneak-in' burglary problem.
Table 1 MO of Burglaries
Approach via alley
Burglaries by deception
Entry at rear
Entry at front
% Burglaries
15.5
0.5
41.9
9.5
4. THE INTERVENTIONS PROPOSED AND CARRIED OUT
The aim of the Hartlepool project team was to develop a set of interventions which would all
be of use in and of themselves, but which would also enhance and strengthen each other.
Seven separate interventions were developed, planned and implemented. They were
supported by the employment of two part-time burglary reduction coordinators who were

Hartkpool: A Case Study in Burglary Reduction page 9
responsible for overseeing aspects of certain interventions. Their main responsibility was to
undertake community development within the area. Although they cannot be considered as an
intervention in themselves, their role certainly cut across several of the interventions.
4.1 Alleygating
Possible sites for locating alleygates were identified following crime pattern analysis. This
revealed that some streets were subject to high levels of burglary and that access was often
gained via the rear of the property. This access was provided by rear alleyways which also
provided cover and means of escape for those undertaking burglaries. Following
identification of these possible sites, they were visited by highway engineers from Hartlepool
Borough Council who surveyed the sites for feasibility of erecting gates. An important issue
that had to be considered was the sheer size of gates, given that these alleyways provided
vehicular as well as pedestrian access. A 'gate within a gate' design was chosen, so that the
entire gate could be opened in order to allow vehicles to enter the alley, or the smaller section
could be opened by those on foot. Following these decisions, a number of difficulties were
encountered, the most problematic of which was the legal status of blocking off alleyways
and this caused considerable delays in the implementation of the intervention. Various types
of order had different implications for residents who were concerned about taking on sole
responsibility for the upkeep of the alleyways. Eventually, it was decided that Prohibition of
Access orders were appropriate given that responsibility for the alleys wouW remain with the
local council. These orders, however, can only be made on a temporary basis and need to be
renewed after 18 months, when the effectiveness of the gates will need to be reviewed.
As well as encountering difficulties of a legal nature, the SDP staff found a level of resistance
from some of the residents who had concerns about the gates. Some were concerned that it
would become more difficult to take out dustbins for refuse removal and access to keys
became an issue given that a number of properties in the area were privately rented.
Ultimately, it took a good deal of time and effort to persuade residents that the gates would
protect them and that the benefits would outweigh the difficulties. A core group of residents
were eventually convinced of this after the SDP staff arranged for them to visit gates in
Middlesbrough and discuss with residents how burglary in the area had reduced.

Page 10 Hartlepool: A Case Study in Burglary Reduction
Following resolution of the difficulties the first gates were installed in September 2000, much
later than had originally been anticipated. These gates were situated in Charterhouse Street
and Marlborough Street and protected 47 properties by closing off back access. At the same
time 6 gates were erected on Kent Avenue, but these were rather smaller gates and closed off
back access to 15 properties where pedestrian alleyways ran between the houses. A further set
of large gates was installed in May 2001, following further analysis, and these protected a
total of 123 properties on Patterdale Street, Borrowdale Street and Brenda Road. The RBI
therefore funded a total of 14 alleygates which protected 185 properties. In addition to these
gates, and due to their eventual popularity with residents (once they had been convinced of
the benefits) a further 10 gates were installed in the SDP area using early wins funding from
the New Deal for Communities. These gates were installed in April 2001 and their effects
will be examined alongside the effects of the gates funded by the RBI, due to the fact that
they were installed during the same period and within the SDP area.
4.2 Target Hardening
The aim of the target hardening intervention was to reduce the number of properties subject to
repeat victimisation. This intervention began promptly on 14* April, 1999 when the first
repeat victim was identified. Victims that had been burgled on more than one occasion were
identified by the crime analyst and the local Crime Prevention Officer would then offer to
undertake a crime prevention survey. Following the survey, recommendations were made as
to suitable security upgrades. A local volunteer agency was paid by the project to fit the
appropriate security measures (such as new locks on doors and windows, security lights etc),
general crime prevention advice was given and victims were issued with community safety
packs.
This intervention proved somewhat disappointing in terms of take-up. In the first instance,
only 24 repeat victims were identified throughout the life of the project. It may be seen as a
positive benefit that demand for this service was lower than expected. Of the 24 properties
identified, only 15 were in fact target hardened and the others were not for a variety of
reasons, some of which are listed below: the Crime Prevention Officer found that three of the
properties were no longer occupied when he called; three residents failed to respond to
repeated attempts to contact them; one resident had fitted his own security devices; one did
not want the officer in his house and one said that the police could not tell him anything he
did not already know about crime prevention.

Hartlepool: A Case Study in Burglary Reduction page 11
The second aim of this intervention was to identify areas suffering from clusters of burglaries
and provide the residents with security upgrades. In the event, this issue was partly addressed
by means of alleygates. Those fitted in Kent Avenue protected 15 properties that had been
subject to a cluster of burglaries. Those fitted in Borrowdale Street and Brenda Road closed
off access to 40 properties that had been subject to a cluster of burglaries. In addition to this,
street lighting was improved in a number of streets and 64 households were offered door
chimes due to the high incidence of'walk-in1 burglaries.
The intervention had a third and final aim, which was to improve security in end of terrace
properties. However, there were no funds left to carry this out after cluster sites had been
protected by means of alleygates (a more expensive option than individual security upgrades).
In addition to the target hardening discussed above, 364 subsidised plug-in timers were sold
at the launch of the SDP on 24th July 1999 and during the Crime Prevention Week (18th
October 1999 onwards). These were sold as part of the Education and Awareness campaign
but can be seen as a form of target hardening device.
4.3 Property Marking
Prior to the inception of the RBI, Belle Vue Estate had been offered property marking and
there had been a take-up rate of 62%. Under the RBI, all properties in Rift House East were to
be offered property marking using Selectamark. This was carried out by personnel from a
voluntary agency and entailed marking 5 items of property at each household. The marking
was carried out in four phases, the first of which began in September 1999 and resulted in
marking at 261 addresses, from a possible 534. Phase two began in November 1999 and
resulted in marking at 100 addresses, from a possible 348. Phase three took place between
January and March 2000 and resulted in marking at 134 addresses, from a possible 576. Phase
four took place between April and June 2000 and resulted in marking at 344 addresses, from a
possible 1031.
All of those involved with this intervention were disappointed with the low take-up rate. It
would seem that this was partly due to the approach adopted by the voluntary organisation at
the start of the intervention. Volunteers would leave a letter at the address stating that they
would return the next day to undertake marking. They would visit the next day, but it seems

Page 12 Hartlepool: A Case Study in Burglary Reduction
that they visited during working hours and consequently a lot of people were out. They
eventually had to make visits between 6 and 8pm and found they had a little more success. It
would seem that the fact that they were from a voluntary organisation did not help their cause.
The approach to property marking that had been adopted previously on the Belle Vue Estate
had employed the services of police officers to knock on doors and tell people about the
benefits of marking their property. It would seem that such an 'official' face to a scheme
increases the take-up rate. A large number of people either had no interest, or were actively
opposed to property marking, stating that if their property was stolen it would be replaced by
the insurance, others stated that they might sell the property and so did not wish for it to be
marked, others did not own the property anyway, but rented it and others still stated that the
property was not insured and they seemed to think that this negated the need for marking. It
seems that perhaps the benefits of marking were not explained sufficiently to some people.
Whatever reasons were given for not taking up the offer of property marking, it is clear that
there are lessons to be learned from this experience. In the first instance, it is clear that it was
not necessary to purchase over 2500 marking kits before the popularity of the scheme had
been established, hi the end, a number of kits were given to Oxford Road East Residents'
Association to distribute amongst those that wanted them, but no records were kept of how
many of these kits were eventually put to use. It is clear, also, that issues arise from using
volunteers to carry out interventions. In this instance, it would seem that lessons that had
already been learned from the success of the scheme undertaken in Belle Vue were not passed
on for the benefit of the new scheme. It is also clear that it is not always possible to control
volunteers in the ways that might be hoped for, nor to keep them enthused when they are
experiencing difficulties. Problems with this intervention clearly demonstrate the view that
central aspects of interventions can be better served by contracting an organisation for a
particular piece of work given that volunteers can, and do, walk away from difficulties when
they become disheartened. The voluntary organisation lost a number of volunteers directly as
a result of the lack of interest in this intervention, and the intervention itself eventually ran out
of volunteers.
4.4 Diversionary Schemes for Young people
The diversionary schemes for young people consisted of i) structured evening sessions and ii)
outdoor activities. These events used the Sports Centre as a focal point, given that it was
already being accessed by a number of young people. The intervention aimed to occupy the
young people in a constructive way, as well as supplying them with positive messages

Hartlepool: A Case Study in Burglary Reduction page 13
regarding crime, crime prevention and good citizenship. The first young people targeted were
those already using the Sports Centre. The Police Community Safety Officer and a supervisor
from the Sports Centre then made visits to schools (as part of the Education and Awareness
Intervention) and this created further interest in the activities. Interest then grew via word of
mouth once the young people began to attend sessions.
A programme of evening sessions for young people aged 12-17 years was held between 29
April and 7 June 1999. Total attendance was 91, averaging 15 at each session. The sessions
included input from the police, fire service, youth service, prison service and a Durham based
Youth Action Group. A structured programme for 8-11 years was held from 16 September to
28 October 1999. There was an average of 19 young people at each session. Five sessions
were held and these covered good citizenship, fire awareness, prisons, crime prevention and
drugs awareness. Due to the popularity of the sessions a second programme for the older age
group was held from 3 March until 12 April 2000. These sessions covered bullying, truancy,
drugs awareness, crime prevention and prisons. Young people who successfully completed
the courses were presented with certificates at an awards ceremony at which the local press
was in attendance, thus generating good publicity for the area's young people.
Diversionary activities took place during the summer of 1999 and early 2000 and these
included the following:
•Six climbing and mountain biking sessions - some of which were full days and some
of which were evenings only - 48 youngsters attended.
•Formation of a football team consisting of offenders and non-offenders from the SDP
area - training and 'friendly' matches included - average of 20 youngsters attended.
•15 youngsters attended Wet 'n' Wild as a reward for attendance at structured
programmes.
•14 of the older age group were taken on a visit to Durham Prison.
•Arising from this intervention was the formation of a Youth Action Group.
•2 day kayaking course and an overnight stay at a youth hostel near Whitby.
•Learning archery at the Sports Centre.
•17 young people spent a day paintballing.

Page 14 Hartlepool: A Case Study in Burglary Reduction
This intervention is viewed by the SDP staff as the real success story of the project. They feel
it went incredibly well and were impressed by the interest shown by the young people, the
levels of participation reached and the ongoing effects in the area, which suggest that the
intervention may well have longer-term benefits for the local community. Local people have
stated that they feel the behaviour of young people in the area has improved and the local
police believe that levels of disorder have reduced. It is also clear that relationships have been
built between young people and the police, relationships which the police are keen to foster
and maintain by remaining involved with the young people.
It would seem that the key to the success of this intervention was the way in which it tapped
into existing local resources. It did this in two ways: firstly, by focussing on the Sports Centre
which was a space already used by a number of young people. There was already a pool of
young people who could be encouraged to undertake new activities. Secondly, much of the
work with the young people was undertaken by a Supervisor at the Sports Centre who already
had a relationship with the young people having been employed at the centre for 14 years. He
was in a position to encourage the young people to try new things, already being trusted by
them. It is clear that this intervention would not have been such a success, in terms of interest
and participation, had it not been for the work of this individual. The success of this
intervention clearly illustrates the need to access resources that already exist in a local
community and to use them to best advantage. It also illustrates the central importance of
local people, and the effect that their skills and knowledge can have if put to good use.
4.5 Supervision/Treatment of Offenders - Fairbridge Programme
Analysis of burglary data, prior to the start of the project, revealed that there was a
considerable problem with a number of young people in the area. It emerged that a significant
number of burglaries in the target area had been committed by a relatively small group of 23
young people. For this reason it was deemed appropriate to target one of the interventions
specifically at these troublesome offenders. The SDP managers realised that this would not be
an easy task, but felt that it was worth a serious attempt. A partnership was formed whereby
the Fairbridge organisation in Middlesbrough was paid in exchange for providing places for
12 young offenders on their personal development course. The aim of the course is to
encourage active learning in order to raise awareness and challenge attitudes, values and
behaviour. Fairbridge works with disadvantaged young people from 14 to 25 years of age.
Following completion of the course each young person is entitled to access a range of further
courses and obtain support from Fairbridge until the age of 25. It was clear that a good deal of

Hartlepool: A Case Study in Burglary Reduction page 15
work would be required in order to recruit young offenders onto the course and, once again,
the project utilised the skills and experience of the Sports Centre Supervisor, who was
contracted at an hourly rate to undertake outreach work with the young people in his spare
time (a list was drawn up by the police in order that prolific young offenders could be
targeted).
Despite the difficulties of engaging with and recruiting young offenders on to the scheme,
which the SDP managers had anticipated as a potential problem, this intervention began
remarkably well. By the end of June 1999, five young offenders had been recruited, attended
and successfully completed Fairbridge's personal development course. Three young people
successfully completed Fairbridge between 19-26 May 1999 and two from 20-30 June 1999
which was seen as a major accomplishment. The course is of 8 days duration and works
towards improving self-esteem and developing the skills necessary for adult life by means of
challenging outdoor activities and ongoing training and support. Young people attend for 6
hours on 6 days and visit the Lake District on a residential basis for two days.
A limited amount of follow-up data are available concerning the five attendees (up to
February 2001). Following completion of the course one of the young people had no further
contact with Fairbridge. Two applied to undertake a variety of other courses (e.g. Health and
Safety, First Aid) but did not attend. On a more positive note, the two remaining young
people applied for places on the Spirit of Fairbridge training ship based in Scotland and were
accepted onto a ten-day course to learn sailing skills and working closely within a team.
Unfortunately, the two young people concerned were found to be smoking cannabis and had
to leave the ship. This incident attracted some very negative press attention from the
Hartlepool Mail where the young people were branded 'a disgrace to Hartlepool1. The actions
of the young men cannot be condoned, having broken the rules, to say nothing of the law and
yet the condemnation can be seen as rather harsh given that the young men had shown
themselves to be open to the idea of change by taking part in the Fairbridge course. What is
also clear is that these young men had previously been heroin users and had, at that time,
stopped using heroin, an action which must be viewed as positive.
In October 1999, following this incident, the intervention suffered a fatal setback when the
Sports Centre Supervisor was forced to withdraw from undertaking any further outreach
work. This was partly as a result of events described above and partly because he was being

p a g e 16 Hartlepool: A Case Study in Burglary Reduction
accused by the local community of 'helping offenders' who were perceived as being rewarded
for bad behaviour. As we have seen with regard to other interventions, problems arise when
volunteers (albeit ones who are paid for their time) are the sole providers of essential roles. In
the case of this intervention it meant that no further young offenders were recruited. Damage
would also have been done by the negative press reaction to the young people described
above.
These events were obviously deeply unfortunate for the project and resulted in the collapse of
the intervention. This was distressing for the SDP managers and outreach worker who had
invested so much time and effort in the intervention. However, there was early success, in
terms of participation, which shows that interventions like this can work under the right
circumstances. What we do not have is information regarding the behaviour of the young
people following their participation in the scheme. Any change would, in any case, tend to
occur over the longer term and would be unlikely to have a drastic effect upon short-term
burglary rates. The important lessons of this intervention will be discussed in section 10
below.
4.6 Education and Awareness
The aim of this intervention was to mount a campaign to raise awareness of crime prevention
and to educate local residents as to the measures they could take in order to reduce the
likelihood of becoming victims of crime. All residents in the SDP were targeted by this
campaign which consisted of a number of elements:
•A Family Fun Day was held at Belle Vue Sports Centre during July 1999 - this had a
crime prevention theme.
•Community Safety Police Officers visited all three primary schools in the SDP and
gave crime prevention presentations to over 1,000 pupils.
•A Crime Prevention Week was held in October 1999. Cleveland Police Force's crime
prevention caravan was located in several different spots in the SDP, providing
information on crime and community safety.
•Presentations were given to a variety of local groups by the RBI coordinators (senior
citizens, PTAs, Townswomen's Guild, residents association) and aimed to provide basic
advice about crime prevention.
•A Community Newsletter was produced by the RBI coordinators and delivered to all
3400 households on 4 occasions. This gave common-sense advice about community

Hartlepool: A Case Study in Burglary Reduction page 17
safety e.g. to lock doors and windows at all times. It also gave information regarding the
other interventions to encourage residents to use them e.g. the property marking service.
•2000 Community Safety information packs were handed out by the RBI coordinators -
these contained a number of leaflets giving advice about protection against crime of
various types.
•A number of articles appeared in the local press publicising the project. In the main,
these were very positive and provided information about the various interventions.
This intervention was concerned with raising awareness of crime issues and educating
residents regarding taking measures to prevent crime. Children were seen as being central to
delivering the crime prevention message to parents and were given pencil cases printed with a
simple message 'Lock your doors, even when you're in. Leave a light on, even when you're
out.1 It was felt that young children tend to take such messages seriously and would pass them
on to parents and family members. Children were even told to nag their parents to convey the
message that protection against burglary can be simply a matter of locking doors and
windows.
The programme of education and awareness linked in closely with the other interventions and
was used as a vehicle to publicise and promote them, as well as focusing on community
safety advice itself. It particularly linked with the Community Development intervention,
within which two part-time RBI coordinators were employed. As well as being responsible
for community development on the project the two coordinators carried out a large proportion
of the educational work.
4.7 Community Development
The aim of this intervention was to work with the community in order to increase the capacity
of local people to respond to and prevent burglary. To achieve this aim, two RBI coordinators
were employed. The project coordinators were both employed on a part-time basis (20 hours
per week each) and had complementary employment histories. One was a long-term local
resident and the other had experience of community development. The local residents were
involved in interviewing and selecting the coordinators. Once employed, they were based in
the Belle Vue Sports Centre, which acted, in practice, almost as a community centre.

Page 18 Hartlepool: A Case Study in Burglary Reduction
The project managers believe that the employment of the burglary coordinators was a key to
success for the project as a whole. The coordinators integrated well with the local community
and this was partly due to their informal and relaxed attitude towards their role. They were
independent of the local authority and were therefore not considered 'official' by the local
residents. Furthermore, they were employed by Belle Vue Residents Association, line-
managed by the Council's Commumty Safety Officer and paid through the Sports Centre.
They reported to the Steering Group and they fed back information from that group to other
members of the community. The coordinators were approachable and the fact that they were
employed by the residents association gave the community a sense of ownership of the
project.
The anti-burglary coordinators decided to work together on the project, rather than to divide
their roles geographically between the two distinct areas of the SDP. They made this decision
for several reasons: in order to be assured of their personal safety; they felt that residents may
be reluctant to open their doors to a lone male; and they felt that it was necessary to plan their
work and carry it out together for the sake of consistency and flow of information.
The anti-burglary coordinators were able to encourage and assist local people in forming 7
new Neighbourhood Watch groups. Due to difficulties with setting up such groups in the past
(i.e. lack of interest) the coordinators chose to concentrate on small clusters of about six
houses. In Rift House East some roads are quite long, making it impractical to try and include
the whole street. The coordinators raised interest within the community by giving
presentations to various groups within the community regarding crime prevention,
community safety and personal safety. The coordinators chose to deliver the Newsletter
themselves. This was an expensive use of their time but enabled them to interact with the
local people and afforded them the opportunity to give common-sense advice, especially
about the high number of opportunist burglaries. The coordinators also supported the
formation of, and attended meetings held by Young Belle Vue in Action in order to support
the young people, but they attended these fortnightly meetings alternately as they had no wish
to impose adult views upon the young people concerned. A Fear of Crime survey was carried
out by the coordinators, and the Belle Vue Residents Association delivered it to 500 homes
that had had improved street lighting. The response to this survey was disappointing at only
12%. The coordinators succeeded, however, in establishing the Oxford Road East Residents'
Association , which was one of the central aims of the project. Forty residents attended the
first meeting and the establishment of this association was a major success.

Hartlepool: A Case Study in Burglary Reduction page 19
The project coordinators took on a level of community development work beyond their remit
as anti-burglary coordinators. For example, in October 1999, they became involved with a
petition against drugs on the Belle Vue Estate. They felt it was appropriate to support this
petition due to the links between drug use and crime (especially burglary). The petition
coincided with a campaign in the Hartlepool Mail called 'Stop the Pushers' which provided a
telephone number on which residents could give information on drug use/dealing to the police
who then used the information to disrupt and target offenders. Although this campaign was
Hartlepool-wide, it would seem likely that a number of those ultimately arrested and charged
may have been committing burglaries within the SDP area. However, there are no data
available to confirm or deny this view.
5. IMPACT OF THE PROJECT
5.1 Data Issues and Methodology
The following section outlines the nature of the data used for analysis (including problems
with the data) as well as the methodology used to examine the effectiveness of various
aspects of the project. Disaggregate crime data, for the period April 1997 - September 2001,
were obtained from Cleveland Police. Since Hartlepool SDP was said to equate to a RAS area
(or police beat), burglaries for the SDP were selected by RAS code. However for other parts
of the analysis, (such as the areas near to alleygates, the division between Belle Vue and Rift
House East and the buffer analysis), it was necessary to use GIS and the grid references of the
offences to make the selection as described below.
Some problems were encountered in the disaggregate data supplied by Cleveland Police.
Firstly there were problems relating to the poor reliability of the geographic coding of crime
in the period before July 1999 when Cleveland Police improved their computer systems. For
burglary the data were cleaned up to post-July 1999 standards, but this was not possible for
other crime data. This means that reliable before and after data are available only for burglary.
Figure 2 shows total crime in the SDP and in Hartlepool District 1 (HI) indexed to 100 at
April 1997 in order to make the two areas comparable. It can be seen that in both areas there
is an abrupt rise in crime other than burglary dwelling in July 1999 showing the extent of the
pre-July 1999 undercounting. For this reason no crime shift analysis for Hartlepool SDP is
possible.

Page 20 Haitlepool: A Case Study in Burglary Reduction
Figure 2 Total Crime Increase at July 1999
The second problem relates to the beat coding of the pre-July 1999 data. Burglaries for the
SDP were selected by beat while the more detailed analysis used geographic coordinates. As a
result some minor anomalies have occurred.
The third issue is that the outcome figures in this report do not accord with those for
Hartlepool in the Northern Consortium Report on the 21 SDPs. This is because, in order to
maintain consistency with the other areas, the figures for the Cleveland PFA in this report
have been aggregated from the disaggregate data supplied by Cleveland Police, while the
main report uses figures supplied centrally by the Home Office.
The hot spots maps were produced using the disaggregate data and the Kemal Density
Interpolation tool in the Crimestat programme, National Institute of Justice, Washington D.C.
The main analysis of outcomes uses burglary and other crime figures aggregated from the
disaggregate data and compares the SDP with Cleveland Police Force Area (PFA), Hartlepool
1 Police District (Basic Command Unit or BCU) and with a comparison area. The latter was
chosen due to its similarity to the SDP in terms of socioeconomic composition. It lies to the
north of the town centre. In addition, a buffer zone was constructed between 0 and 600m
around the SDP boundary. 600m was chosen to give approximately equal numbers of
burglaries in the buffer and the SDP itself.
For target-specific interventions - alleygates, target hardening and plug-in timers - lists were
drawn up of addresses protected and in close proximity. These were cross-matched with
addresses of burglaries in the before and after periods. For repeat victimisation, repeats were

Hartlepool: A Case Study in Burglaiy Reduction page 21
identified on the basis of repeat identical addresses. It was not generally considered whether
the victims were the same. However a problem was found with multi-occupied dwellings.
Where identical addresses were burgled more than once on the same day, it was found that
these were different victims, an assumption made that the address was a multi-occupied
dwelling and the burglary counted as one offence. There was, however, no way of identifying
separate victims with identical multi-occupied addresses where the interval between
burglaries was longer. Time from last repeat in days was calculated using the date reported.
It would have been interesting to undertake further analysis of the interventions involving
young people, education and awareness and community development in order to assess the
behavioural changes achieved. However this has proved impossible for a number of reasons,
not least of which is the detailed level of data required in order to undertake such a task.
5.2 Changes in Patterns of Burglary
Figure 3 shows the more dispersed burglary pattern for the period 2 years after the SDP start,
compared with the two years before, resulting from the reduction in burglary.
Figure 3 Burglaries Before and After the SDP Start (Base maps © Crown Copyright/databaseright 20(yy). An Ordnance Survey (Datacentre) supplied service)
V.
After
- ^ .-. - v \
• . /»
• ' V. >- .
-
*• • /• /

Page 22 Hartlepool: A Case Study in Burglary Reduction
Table 2 confirms that the density of the burglary pattern has reduced and the mean distance
between burglary locations has increased. Although there is a slightly smaller nearest
neighbour index in the after period, the difference between the before and after periods is not
significant at the 95% level. Therefore clustering in the SDP as a whole has not reduced.
Table 2 Measures of Burglary Pattern Before and After SDP start
Before After
Sample size
Density of burglary per sq km
Mean nearest neighbour distance
Nearest neighbour index
Standard error
423 319
429 324
16.44m 18.10m
0.6817 0.6518
0.61m 0.81m
However Figure 4 shows that some concentrations of burglary have changed. The Oxford
Road/Cornwall Street hotspot in the north west of the area has disappeared while the hotspot
in the south east of the area appears to have moved westwards. A new hotspot has appeared at
the southern end of Stockton Road. This is the result of 10 burglaries at one address which
appears to be a block of flats owned by a housing association. The burglaries are spread over
the whole two year "after" period and continue with 2 further incidents before September
2001.
Figure 4. Burglary Hotspots Before and After the SDP start
Table 3 outlines total burglaries for the two years before the scheme and the two years after.

Hartlepool: A Case Study in Burglary Reduction page 23
Table 3 Yearly Burglary in SDP
_____ ~"Burglary!n the SDP
April 97 - March 98
April 98 - March 99
April 99 - March 00
April00-March01
223
197
154
162
Table 4 gives a comparative view on burglary outcomes. We use mean monthly burglaries to
assess the relative significance of changes in the Hartlepool SDP in relation to the comparison
area and buffer zone, the local BCU and the whole of Cleveland Police Force Area. We also
use the variability of the monthly figures to estimate high and low limits to the difference
between the before and after means. Thus in Hartlepool SDP there was an average of 17.5
burglaries per month in the two years before its start and 13.2 in the two years after. The
difference, or gross change, was a reduction of 4 burglaries per month (ignoring rounding
errors), which was a significant reduction at the 95% confidence level. The accumulated gross
reduction in burglaries over the two years was 104. Removing the effect of the overall
reduction of 11.6% in Cleveland's burglary rate lowers Hartlepool SDP's gross percentage
Table 4 Burglary Outcomes
** Monthsbefore/after
Cleveland PFAHartlepool Div 1Buffer 0-600mHartlepool SDPComparison Ares
-
24
2424
2424
Before
704134161819
After
622121
12
13.217
Diff
-82
-12-3-4-2
** Evaluation perioc24 =
2-yr+ =
Apr 997-
Mean monthly burglarieGross change
Highest
-39-2
-1
-11
Mar 2001
-
Lowest
-124
-23
-6
-8
-5
Sig
= reduction over first2yearsncrease,- = saving/reduction
Sig
HRRRns
•ns
- -
2-yr
-1959-294-83
-104
Di
ff
0
3-2-20
Sig increase
Net change
Hig Lowhest est Sig
32 -32 ns11 -4 ns2 -5 ns1 -5 ns3 -3 ns
2-yr
+0+78-39-55+3
Percentagechange
Gross
-11.6-9.2-22.1-24.8-10.9
at 95% confidence levelNo sig changeSig reduction at 95% confidence :
-- -
evel
-
Net
+0.0+2.4-10.5-13.2+0.7

Page 24 Hartlepool: A Case Study in Burglary Reduction
reduction of 24.8% to a net reduction of 13.2%. This is equivalent to 2 burglaries less per
month, or 55 less in total over the two years.
The comparison area in the north of the town fared less well. There the gross decrease was
10.9%, less than the Cleveland average and giving a net increase in burglary of 0.7% over the
two years. There were therefore no savings in burglaries in the comparison area.
The buffer zone, on the other hand, had reductions in burglary similar to the SDP itself. If the
primary impact of the interventions in the SDP was to displace burglary, then an increase in
the buffer zone would be expected. That this is clearly not the case does not rule out
displacement effects but does suggest that, at the very, least diffusion of benefits dominates
the impact on surrounding areas. Table 5 takes this analysis a step further. It assumes that
SDP and buffer zone are a closed system in which there are no other explanations for their
differences. In this closed system, Hartlepool SDP had a gross reduction in burglary of 104.
Of this, 49 were accounted for by Cleveland's overall reduction in burglary, leaving 55 to be
explained by the SDP's interventions. The relative change between SDP and buffer, all other
Table 5 Breakdown of Hartlepool SDP Outcomes
Gross OutcomeNet OutcomeDeterrence within SDPDisplacement to buffer zone
No of burglaries savedFirst Second over 2year year years
-56 -48 -104-38 -17 -55
. -40 -4 -442 -13 -11
things being equal, suggests a maximum of 11 burglaries displaced to the buffer zone, leaving
44 to be explained by the deterrent effect of interventions. In reality, such a closed system
does not exist, so the figures must be seen as indicative.
Tables 5 and 6 also show that the impact of the interventions was greater during the first year
after the scheme started - 38 net burglaries were saved compared to 17 in the second year.
The first year saw an emphasis on deterrence within the SDP, and by corollary, diffusion of
benefits, compared to the second year when displacement became more important. This
connects well with the fact that, with the exception of some alleygates and youth diversionary
work, most SDP activity was finished by December 2000. Indeed, the gross burglary figures
for April to September 2001 seem to show an increase compared with previous years, perhaps
indicating that the effects of the SDP have not been sustainable.

Hartlepool: A Case Study in Burglary Reduction page 25
Table 6 Gross Burglary Figures April to September - Hartlepool SDP
1997
1998
1999
2000
2001
Gross Burglaries
84
106
54
60
91
In terms of the impact on burglary figures, Hartlepool SDP has been very successful.
Burglaries have been reduced by more than the Cleveland average, and the impacts have been
to the benefit of not just residents of the SDP but also of the surrounding area as well.
However the proximity of Hartlepooi's New Deal for Communities project in space as well as
time makes a definitive attribution of benefits to SDP interventions much harder to claim.
53 Interventions
Where effects on burglary outcomes of individual interventions have been measurable, these
are discussed below. For some interventions such as property marking, this was not possible
because of incomplete information on the location of properties marked.
5.5.7 The Effects ofAtteygating on Protected Properties
Table 7 shows that the three groups of alleygates had different effects upon burglary rates in
their local areas. The SDP gates installed in September 2000 stopped burglary altogether for
the whole of the period for which we have data (up to September 2001). However, for the
houses protected by the April New Deal alleygates and May 2001 SDP the situation is less
clear. Closer examination of the burglary pattern for the September alleygates shows that in
fact there were no burglaries to the properties in question after December 1999, even though
the gates were not installed until September 2000. It is thought that the reduction can be
attributed to the alleygating scheme given that the gates were first publicised in January 2000.
It therefore seems that even the announcement of such a scheme can have an impact on
burglary rates.
Page 26 Hartlepool: A Case Study in Burglary Reduction
Table 7 Houses Protected by Alleygates
Before Gates
Burglaries per
Month
0.5
0.4
1.3
After Gates
Burglaries per
Month
0
0.2
2.0
Gates
installed in:
Sept 2000
April 2001
May 2001
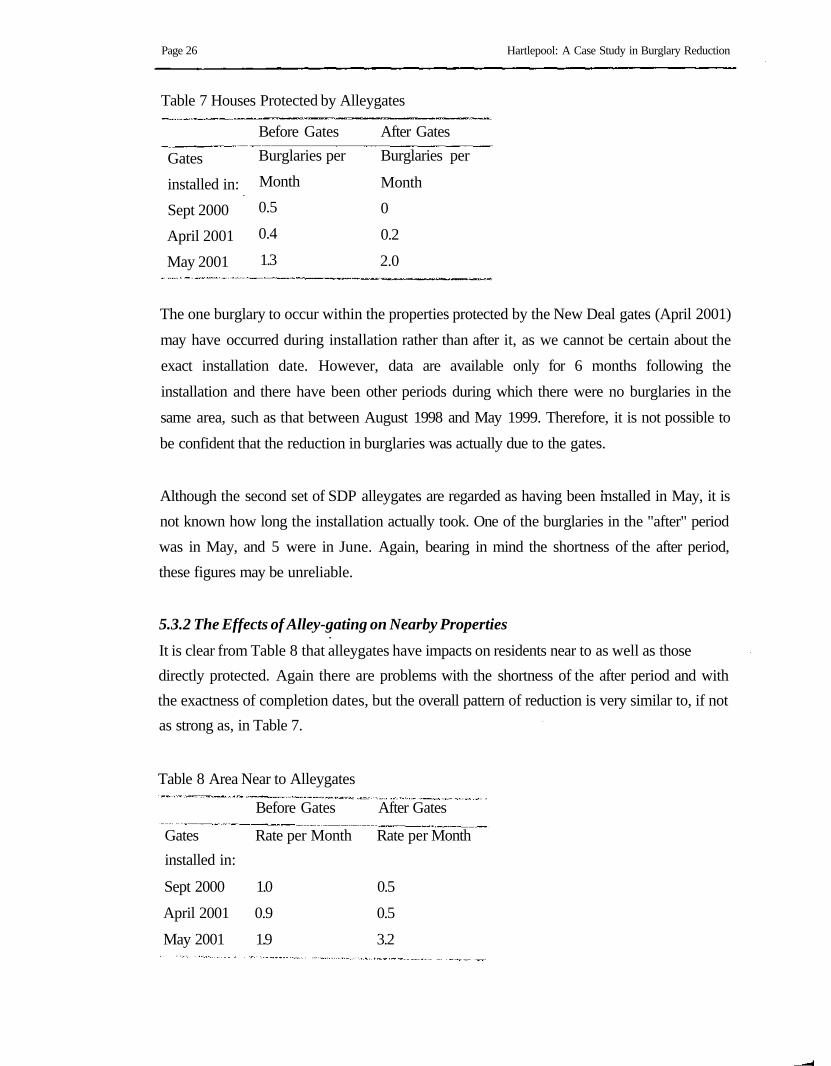
The one burglary to occur within the properties protected by the New Deal gates (April 2001)
may have occurred during installation rather than after it, as we cannot be certain about the
exact installation date. However, data are available only for 6 months following the
installation and there have been other periods during which there were no burglaries in the
same area, such as that between August 1998 and May 1999. Therefore, it is not possible to
be confident that the reduction in burglaries was actually due to the gates.
Although the second set of SDP alleygates are regarded as having been mstalled in May, it is
not known how long the installation actually took. One of the burglaries in the "after" period
was in May, and 5 were in June. Again, bearing in mind the shortness of the after period,
these figures may be unreliable.
5.3.2 The Effects of Alley-gating on Nearby Properties
It is clear from Table 8 that alleygates have impacts on residents near to as well as those
directly protected. Again there are problems with the shortness of the after period and with
the exactness of completion dates, but the overall pattern of reduction is very similar to, if not
as strong as, in Table 7.
Table 8 Area Near to Alleygates
Before Gates After Gates
Gates Rate per Month Rate per Month
installed in:
Sept 2000 1.0 0.5
April 2001 0.9 0.5
May 2001 1.9 3.2

Hartlepool: A Case Study in Burglary Reduction page 27
5.3.3 MO in Alley gated Areas
Before the areas were alleygated, between 50 and 75% of burglaries were undertaken
following entry by the rear of properties. The proportion of burglaries indicating approach by
an alley ranged from under a quarter to one third. Table 9 shows the monthly average MO
figures before and after the installation of the alleygates. After the alleygates were installed,
rear entry became less frequent but continued to be the MO for 70% of those burglaries which
did occur after the September and April alleygates. For the May alleygates the percentage was
only 40%. However, four of the burglaries occurring after May were where the approach was
via the yard, which still implies a rear entry. Following installation of the gates, approach by
alley was generally less common.
Table 9 MO in Alleygated Areas
Sept 2000 Protected
Sept 2000 Near
April 2001 Protected
April 2001 Near
May 2001 Protected
May 2001 Near
Rear Entry
Before
0.3
0.5
0.3
0.6
1.0
1.3
Monthly average
Approach by Alley
After Before
0 0.1
0.2 0.2
0.2 0.1
0.5
0.8
1.2
0.2
0.4
0.6
After
0
0
0.2
0.2
0.2
0.4
5.3.4 Overall Effects of Alleygates
It can be seen from the above that, although the effect on burglary is not always clear, there
were definite benefits from the alleygates intervention. The disappearance of the hotspotf in
the Oxford Road/Cornwall Street area noted at paragraph 5.2 can be attributed to the
September alleygates. From the September alleygates protected houses alone there has been a
saving of 6 burglaries, which is one quarter the number that the SDP as a whole needed to
save to break even on cost (see Section 7 below). If the properties near to the September
alleygates are included, another 3 burglaries were saved.
5.3.5 The Effects of Target Hardening
Target hardening was to be offered to residents of the SDP on the basis of repeat
victimisation. However, as Table 10 shows, it was also offered to a household that had been

Page 28 Hartlepool: A Case Study in Burglary Reduction
victimised once and to a household that had not been burgled at all. There is no reason given
for these offers having been made. Of the remainder of offers there appears to be no clear
relationship between the number of repeat victimisations and take up of the offer of target
hardening.
The houses which were offered target hardening but were either unoccupied, not contactable
or refused it did not suffer burglary after the offer date. However, two of the 15 repeat
Table 10 Households Offered Target Hardening
No contact/refused Implemented
Not victimized prior to offer 0 1
Victimised once prior to offer 1 0
Victimised twice prior to offer 7 13
Victimised three times prior to offer 2 2
Victimised twice between offer and implementation 0 1
Victimised after implementation 0 2
victims which accepted the target hardening were burgled after the implementation date. Both
had been victims 3 times prior to the offer date and one also suffered two burglaries between
the offer date and the implementation. This would seem to suggest that the target hardening
programme was not successful in preventing repeat burglary, even for the limited number of
properties which took it up. However it could be argued that the fact that only two of the 24
repeat victims suffered further burglary was an achievement. Publicity would advertise
protection being given to repeat victims but burglars would not be aware of which victims
took up the offer, or when, and would therefore avoid returning to the same address. In effect
there would be a diffusion of benefits to all victims whether or not they accepted the offer of
target hardening. This is supported by the reduction in repeat victimization described in
section 5.4.
5.3.6 The Effects of Plug-In Timers
Table 11 below suggests a measure of success for the plug in timers in that the reduction in
burglary to houses with timers was more than 1.5 times that of the SDP generally. In the 14
months after the issue of the timers a total of 5 burglaries were saved, contributing to the 23
required for the project to break even on cost (see Section 7 below).

Hartlepool: A Case Study in Burglaiy Reduction page 29
Table 11 Houses with Plug In Timers: Before and After Burglary Rates
Before Rate per After Rate per % Reduction
Month Month (numbers)
Addresses with 1.7 1.3 37
Timers
Whole SDP 15.2 13.9 22
5.4 Reduction of Repeat Victimisation
One of the targets of the SDP was to reduce repeat victimisation. The burglary data were
examined using the method previously described to assess the success of this aim. However,
use of victimisation of repeat addresses will inevitably emphasise the later period, since the
after period provides a longer timescale for calculation of repeats. As the known patterns of
repeat burglary show that revictimisation is more likely within a short period of the first
offence, we can control the length of time for repeats to 90 days. Table 12 shows that, in
terms of the SDP, these decreased by a larger percentage than for Hartlepool Police District 1,
indicating some success for the SDP in meeting this target.
Table 12 Repeat Burglary Addresses Two Years Before/Two Years After
SDP Repeats (last offence
within 90 days)
BCU-SDP Repeats (last offence
within 90 days)
Average per Quarter
Two Years Before
4.75
27.1
Two Years After
3.5
23.0
% Change
-26.3
-15.2
Figure 5 shows the pattern of repeats in which the previous offence was within 90 days. It is
apparent that there are considerable fluctuations, in both the BCU and the SDP but
particularly in the latter. Apart from the high figure in the quarter ending December 1999,
repeat victimization is generally low in the active period of the SDP but there is evidence of
higher levels in later months, possibly indicating that the effect of the SDP has been short
lived.

Page 30 Hartlepool: A Case Study in Burglary Reduction
repe
ats
Inde
xed
150
100
50
0i
\l
nc3-> D
ec
Repeats - Last Offence within 90 days
CDO>
Jun-
Aooo>
Dec
-vlL ,
O) ro oO> O) Oc u e3 (p 3
/
/ • /
oo
Dec
-
Ioc
—•—SDP
-m— BCU-SDP
Figure 5. Repeats - Last Offence Within 90 Days by Quarter
5.5 Other Crime Outcomes
Crime generally has increased between the two years before and after the SDP start. This is
mainly a reflection of the data problems with other crime data explained elsewhere in this
report rather than a real increase in crime. However, it distorts the results for most categories
of crime. Therefore it is only meaningful to consider the changes in the SDP relative to those
in the other areas. As can be seen in Table 13 the SDP shows reductions in burglary other and
shoptheft while the other areas show increases. For all crime other than burglary dwelling,
theft from vehicle and theft from person the SDP shows a smaller increase than the other
areas. This suggests that although primarily targeted at burglary the SDP is having a
beneficial effect in reducing crime generally in the area.
The community development side of the project - new Neighbourhood Watch groups and the
project coordinators - and the education and awareness intervention may have contributed to
this. The burglary other offences were examined to see if the reduction could be attributed to
a drop in burglary of sheds and garages resulting from alleygates. However it was found that
while burglary other at private addresses fell by 37%, the decrease for commercial addresses
was 52%. Whilst the project was aimed at private addresses, it is also likely to have had
benefits for the commercial sector as well.

Hartlepool: A Case Study in Burglary Reduction page 31
All Crime Less Burglary DwellingSDP
Comparison
BCU-SDP
PFA-SDP
Burglary OtherSDP
Comparison
BCU-SDP
PFA-SDP
Theft from PersonSDP
Comparison
BCU-SDP
PFA-SDP
Theft from VehicleSDP
Comparison
BCU-SDP
PFA-SDP
Theft from ShopSDP
Comparison
BCU-SDP
PFA-SDP
Before
681
625
6229
33289
223
143
1596
9239
2
3
4
27
114
134
1190
7560
228
152
2169
8358
After
1211
1774
16798
104804
131
173
2084
15186
6
24
163
1226
134
285
2622
16518
211
184
2675
12085
% Change
+78
+184
+170
+124
-41
+21
+31
+64
+200
+700
+3975
+4441
+18
+113
+120
+118
-7
+21
+23
+45
Table 13 Crimes Other than Burglary Dwelling Before and After SDP Start: SDP Comparedto Other Areas
6. ASSESSMENT OF ACHIEVEMENTS
At the beginning of the project in Hartlepool the managers set a number of goals by which
they would measure the success of the project. The goals and an assessment of the outcomes
are outlined below.
i) To produce a 25% reduction in burglary of dwellings:

Page 32 Hartlepool: A Case Study in Burglary Reduction
The project resulted in a 24.76% gross reduction in burglary when comparing the two
years before the project with the two years after.
ii) To increase the membership of the existing Belle Vue Residents' Association by ten:
This was achieved during the life of the project - there is, however, no specific date
because the number attending meetings fluctuates. The Chair believes at least ten new
members attend most meetings.
iii) To establish a new Residents Association in the Rift House Area:
This was achieved in April 2000.
iv) To increase the number of Neighbourhood Watch Schemes in the target area by five:
This was achieved during the life of the project - 5 new schemes were set up during
December 1999 and 2 more began between April and June 2000 (4 of these in were
Belle Vue and 3 in Rift House East).
v) To send up to 12 young offenders on the Fairbridge Scheme:
This was partially achieved - 5 young people completed the scheme during May and
June 1999.
vi) To promote good citizenship and an awareness of crime among young people living in
Belle Vue and Rift House East:
A variety of activities took place during the life of the project which worked towards
this aim - presentations in schools; evening sessions with young people (8-12 years
and 13-17 years) on crime awareness/good citizenship theme; activity events for
young people (organised by the police and the supervisor from the Sports Centre);
formation of Young Belle Vue in Action.
vii) To raise awareness of crime prevention among residents in the target area:
A number of aspects of the project worked towards this aim - four issues of the
Community newsletter were delivered to every home in the SDP; Crime Prevention
Fun Day was held; Crime Prevention Week was held; presentations on community
safety were given to local groups; 2000 leaflet packs were distributed; RBI
coordinators were employed to work with the local community.

Hartlepool: A Case Study in Burglary Reduction page 33
7. COST EFFECTIVENESS OF THE PROJECT
The Hartlepool SDP inputs had a total cash value of £78,953. Table 14 summarises the
breakdown of these costs by intervention into crude input costs, modelled costs and number
of burglaries to be saved in order for each intervention to break even2. In terms of crude input
costs, alleygating and diversionary youth work were the most costly interventions (each
accounting for 26%), followed by property marking and target hardening (accounting for 15%
and 12% respectively). Education and awareness, community development and Fairbridge
accounted for 9%, 7% and 5% of the costs. Once these costs were modelled it became
apparent that the diversionary youth work was the most costly intervention (34%), due to the
high running costs in terms of personnel and overheads. Property marking accounted for 14%
of costs, due to the expense of purchasing the kits themselves and the personnel-intensive
nature of running the intervention. Target hardening and alleygates each accounted for 11% of
modelled costs due to the fact that the equipment will be in use long after the end of the
Table 14 Crude and Modelled Input Costs and Breakeven Outcomes
Intervention
Bid Preparation
Alleygating
Target Hardening
Property Marking
Diversionary Schemes
Supervision of Offenders
Education and Awareness
Community Development
Total
Crude Input Costs
£2,450
£20,345
£8,990
£11,412
£19,908
£3,751
£6,887
£5,209
£78,953
Modelled Costs
£2,379
£5,797
£5,844
£7,505
£18,230
£3,553
£5,641
£4,826
£53,776
Breakeven
Outcomes
0
3
2
8
2
2
3
3
23
Modelled costs account for a) changes in costs by using net costs at April 1999 prices and b) the expected lifeof the assets by using an amortised value and the time period of the intervention.
2 The point at which the value of modelled costs equals the value of burglaries prevented.

Page 34 Hartlepool: A Case Study in Burglary Reduction
project. Education and awareness and community development accounted for 11% and 9% of
modelled costs. The Fairbridge Scheme was the least costly intervention (7%) due to the fact
that it was an existing scheme and therefore no set-up costs were incurred.
The total modelled costs have a value of £53,776. If it is assumed that each burglary costs an
average of £2,300 (Brand and Price, 2000) the Hartlepool SDP needed to save a total of 23
burglaries in order to break even on modelled costs. In fact, the SDP saved 55 burglaries
which have a cash value of £118,030. This means that the SDP covered not only its modelled
costs, but also its crude input costs and produced net benefits of £64,254. As we have already
seen, alleygating needed to save 3 burglaries to break even. In fact it saved 9, and therefore
produced net benefits of 6 saved burglaries. Similarly, target hardening needed to save 2
burglaries and the plug-in timers alone saved 5, producing net benefits of 3 saved burglaries.
It is therefore clear that Hartlepool, (with a cost benefit ratio of 2.19) was very cost beneficial.
8. KEY STRENGTHS OF THE PROJECT
• Utilization of existing resources
Belle Vue Residents' Association was involved from the start of the project which
meant that the local community had a sense of ownership of the project from the
beginning; the Belle Vue Sports Centre already existed as a focal point for some of the
young people in the area - this was encouraged and utilised as part of the interventions
targeting young people and diverting them away from crime; recognition was given
early in the project to the fact that people are resources e.g. the Sports Centre
Supervisor was recognised as being an important figure in the local community in
terms of encouraging young people to take up worthy pursuits - using him as a
resource resulted in the success of the diversionary activities for young people and the
early success of the Fairbridge Programme although this later came to a halt due to
adverse publicity. Utilization of existing resources is also important when considering
the costs of an intervention. For example, the cost of the Fairbridge Scheme was
relatively low given that the project made use of an existing service, thereby avoiding
the considerable set-up costs of providing a new scheme.
• Carefully selected and achievable targets
The targets selected were appropriate to the amount of investment made within the
SDP. They were also appropriate to the needs of the area and were neither overly-

Hartlepool: A Case Study in Burglary Reduction page 35
ambitious nor overly simplistic. They attempted to deal with the burglary problem
from a variety of angles and approaches.
• Project management
The two SDP managers developed a very strong working relationship and remained
closely involved with the interventions throughout the life of the project. They
provided strong but non-authoritarian leadership, but could not have done so without
the investment of a great deal of time and energy. They were prepared to invest this
amount of time and energy for the project, although it had to be alongside other duties.
In turn, the lessons learned from this project have been carried forward onto bids for
further funds.
• Anti-burglary coordinators
The two project employees worked together well and had a range of complementary
skills. A crucial part of their accessibility was that they were based at the Sports
Centre which acted almost as a community centre or drop-in centre, where they could
be visited by local residents. Both workers were accessible and approachable on an
informal basis. Those involved with the project felt that this role could have been
given more weight had there been a dedicated project manager on the team who would
have had sole responsibility for running the project. There were insufficient funds
available for such a role on this particular project.
• Steering committee
There was a strong Steering Committee that met every 6 weeks to review and monitor
progress of the project. It was seen as a crucial element of this monitoring process that
information gathered and decisions made should be fed back into the local community
via the anti-burglary coordinators.
• Involvement of the local community
Throughout this project it was seen as crucially important to have the backing of the
local community. This was possible, in the first instance, due to the fact that one
residents association already existed and so could be involved in planning the
interventions. Considerable work was then undertaken in order to develop a further
residents association in an area where no such interest had previously been shown.

page 36 Hartlepool: A Case Study in Burglary Reduction
9. KEY BENEFITS OF THE PROJECT
The Belle Vue Estate, and to a lesser extent, Rift House East, were high burglary areas. They
were frequently high priority areas for the police and used up a good deal of police time and
resources. Following the RBI, the SDP is no longer viewed as a high priority area in terms of
burglary and other areas of Hartlepool give more cause for concern. Levels of disorder have
also reduced and local people feel that the behaviour of some of the area's young people has
improved. This may be as a result of the work that was undertaken with young people. Local
police certainly feel that the work with young people was beneficial and are continuing to
remain involved with them via activities wherever possible, although this is necessarily more
limited given that the RBI funding has been exhausted. Ideas developed on the RBI will,
however, be taken forward where new funding opportunities become available.
The improvements in feelings of safety and security on the Belle Vue Estate have resulted in
improvements in the reputation of the area. Prior to the RBI, Belle Vue was seen as an area in
which nobody wished to live and consequently the housing associations had some difficulty
finding tenants for empty houses. Following the RBI the area is seen as very much improved.
Housing associations now have no empty properties and there is actually a waiting list to
obtain a house in the area as it is seen as a desirable place to live.
The RBI project encouraged active interest from the local community in an area where this
was previously not possible. The anti-burglary coordinators worked hard with the residents of
Rift House East to establish a new residents association. This association was established in
April 2000 and has resulted in much closer working with the police in order to exchange
information and reduce crime in the area. This new association has already had positive spin-
offs in that the members were able to have close involvement with bidding for funds from the
New Deal for Communities.
Several lessons were learned regarding the installation of alleygates. Residents seemed to like
them due to increased feelings of safety and security, however, they do pose problems for the
local council. In terms of legal issues, the gates in Hartlepool were erected after obtaining
orders to close the alleys temporarily. Such orders need to be renewed after 18 months if the
residents wish the gates to remain. The use of such orders means that the alleys remain part of
the highway and the council still has responsibility for them. Had permanent orders been
obtained, the residents would have become liable for the alleys, an idea which proved to be
unpopular amongst the residents. It would seem that some of the gates in Hartlepool posed

Hartlepool: A Case Study in Burglary Reduction page 37
more problems than they have elsewhere due to the fact that the alleyways provide vehicular
as well as pedestrian access, making the issues more complex than those pertaining to
ordinary walk-through alleys. Successful use of the alleys following gating seems to depend
upon how residents view the space. If they view the space positively then they will use it
constructively e.g. as a safe area in which children can play. If they view the space negatively,
then it can simply become a dumping ground for rubbish and can cause difficulties for the
local council. Experiences in Hartlepool have been varied, but on the whole, the gates have
been viewed positively once teething problems have been ironed out (e.g. problems over who
should be responsible for issuing keys, who had entitlement to keys etc).
10. MAIN PROBLEMS ENCOUNTERED
The main problem encountered on the project was that of disinterest and apathy amongst a
section of the local residents which led to disappointing outcomes for some of the
interventions. Key groups of residents were very keen on becoming involved with the project
and maximising its benefits, but others could not be engaged. There was an assumption made
at the start of the project that residents who were offered free security upgrades and/or
property marking would automatically accept it. This proved not to be the case regarding both
property marking (offered to all properties in Rift House East) and target hardening (offered
to repeat burglary victims) which proved disappointing interventions in terms of take-up.
This lack of interest links in with the second key problem encountered, the use of volunteers
to carry out essential project work. In terms of property marking, the service was carried out
by a volunteer group who encountered an enormous amount of disinterest on the doorstep and
eventually became disheartened. The fact that they were volunteers meant that they were able
to walk away from the project, which was deeply unfortunate both for the project itself, and
for the organisation to which they belonged. Had these volunteers been contracted by the
project they would have had to remain with the intervention and perhaps try other methods of
gaining people's interest and encouraging them to take advantage of the service on offer. This
problem also applies to the Fairbridge Programme for offenders, the outreach work for which
was carried out by a Supervisor from the Sports Centre on a voluntary basis. This work was
originally very successful and five young people were recruited onto the scheme. However,
both adverse publicity in the newspaper and adverse reactions to the young people from some
of the local residents resulted in the outreach worker withdrawing his services which meant

Page 38 Hartlepool: A Case Study in Burglary Reduction
that no further young people were recruited. Had this work been carried out by a contracted
worker, it is possible that the intervention may have continued. However, even a contracted
worker may have found it impossible to continue in the face of such adverse reactions.
There is a tendency to think of 'the local community' as a homogeneous group, with similar
interests and similar problems, simply by virtue of the fact that they live in the same area.
What is clear from the experiences of those involved with this project is that residents of a
locality cannot be grouped together in such a way as there can be sets of competing interests
acting in any locality. This particular project undoubtedly made progress in terms of
community cohesion and this is evidenced by the fact that a new residents association was
formed, as well as a group for young people and several new Neighbourhood Watch schemes.
However, the project also left some of the residents of Belle Vue feeling less than happy.
They felt that because they had existed as a group before the start of the project, less time and
effort had gone into working with them than with the residents of Rift House East. This was
exacerbated by the fact that they had been included in the planning and bidding stage of the
project and therefore expectations had been raised. They felt particularly let-down by the RBI
coordinators, whom they had been involved in interviewing and employing. It is clearly
important for such schemes to access groups of residents and foster a sense of community, but
it is also vital to work with the reality in such areas and appreciate that there may be groups of
residents with competing interests. An understanding of the dynamics in any given
community is an essential precursor if such projects are to have any success.
11. CONCLUSIONS j
i
Hartlepool is in many ways an exemplary project. It was well-planned and implemented. |i
Targets were carefully selected and appropriate to the area's needs. There was strong but not j
authoritarian leadership, backed by a supportive steering group with good community |
involvement. Effort was made to overcome difficulties and set-backs and the lessons learned |
have been carried forward into successor activities. The project was successful in meeting its |
own target to reduce burglary by 25%. It more than achieved a break-even in terms of benefits $
versus costs, indeed benefits were more than double costs. The apparent modesty of it aims j
conceals the extent of its achievements. i

Hartlepool: A Case Study in Burglary Reduction page 39
References
Brand, S. and Price, R. (2000) The Economic and Social Costs of Crime Home Office
Research Study 217.
Johnson, S., Bowers, K. and Hirschfield, A. (Forthcoming) Pushing Back the Boundaries:
New Techniques for Assessing the Impact of Burglary Schemes London: Home Office.
Pawson, R. and Tilley, N. (1997) Realistic Evaluation London: Sage.

Page 40 Hartlepool: A Case Study in Burglary Reduction - Addendum
Hartlepool Case Study - Addendum
1. Introduction
The Hartlepool Case Study was carried out under the evaluation of the Reducing Burglary
Initiative and was completed by the end of that evaluation using data to September 2001.
Publication of the Case Study was delayed until after that of the more general findings of the
RBI with the result that it has been possible to revisit the study and examine the progress of
the SDP area a further two years down the line. Although it would have been interesting to
revisit the effects of interventions involving young people, education and awareness and
community development in order to assess the behavioural changes achieved, various reasons
including lack of resources made this impossible. The effect on burglary in the area is,
however, assessed by quantitative analysis of a further two years of burglary data supplied by
Cleveland Police to September 2003 for the police Basic Command Unit (BCU) in which the
project is situated. The data permit examination of further changes in burglary in the SDP as a
whole, of these changes in relation to the wider context and detailed analysis of patterns in
relation to some of the individual interventions.
2. Burglary Reduction
The data show clearly that the reduction in the raw burglary figures in the area continued in
the further two years as shown in Table 1. The numbers of burglaries in the SDP reduce from
around 200 in the two years before the project start to 145 in the most recent complete year
for which data are available.
Table 1 Yearly Burglary in SDP
Burglary in the SDP
April 97 - March 98 223
April 98 - March 99 197
April 99 - March 00 154
April 00-March01 162
April 01 -March 02 159
April 02 - March 03 145
Table 2 repeats the comparative analysis of burglary outcomes carried out for the case study,
assessing the relative significance of changes in Hartlepool SDP in relation to the comparison
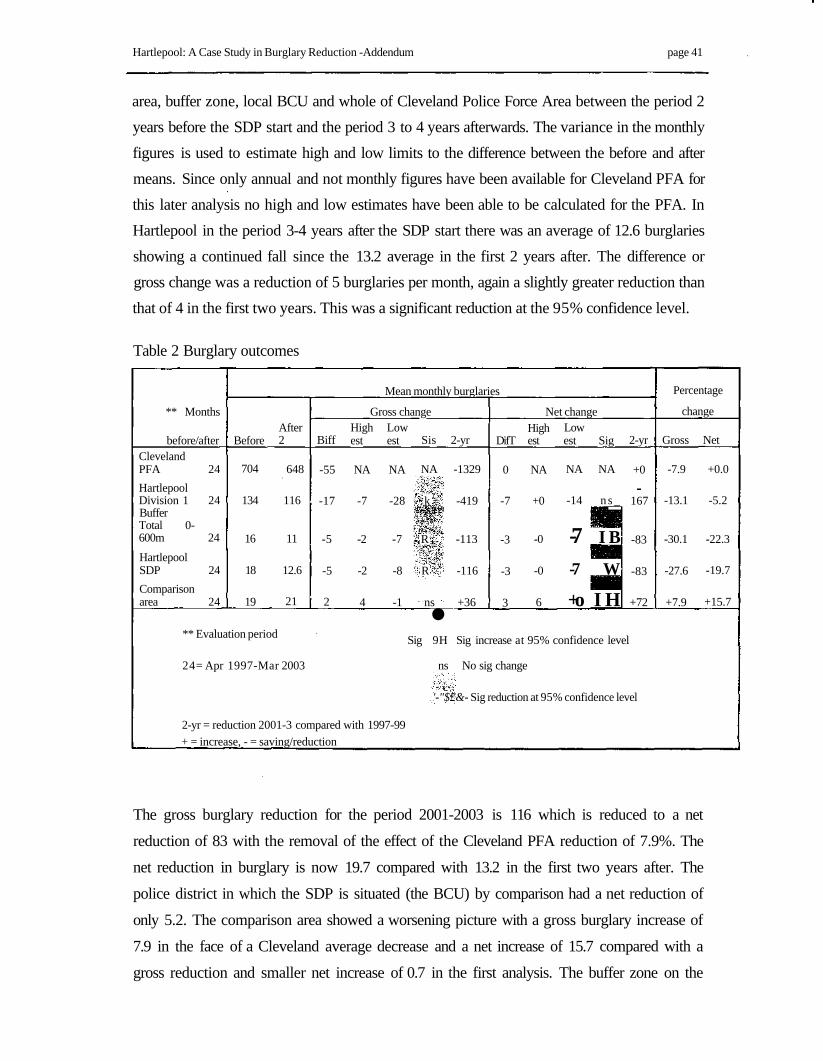
Hartlepool: A Case Study in Burglary Reduction -Addendum page 41
area, buffer zone, local BCU and whole of Cleveland Police Force Area between the period 2
years before the SDP start and the period 3 to 4 years afterwards. The variance in the monthly
figures is used to estimate high and low limits to the difference between the before and after
means. Since only annual and not monthly figures have been available for Cleveland PFA for
this later analysis no high and low estimates have been able to be calculated for the PFA. In
Hartlepool in the period 3-4 years after the SDP start there was an average of 12.6 burglaries
showing a continued fall since the 13.2 average in the first 2 years after. The difference or
gross change was a reduction of 5 burglaries per month, again a slightly greater reduction than
that of 4 in the first two years. This was a significant reduction at the 95% confidence level.
Table 2 Burglary outcomes
** Months
before/afterClevelandPFA 24
HartlepoolDivision 1 24BufferTotal 0-600m 24
HartlepoolSDP 24
Comparisonarea 24
Before
704
134
16
18
19
After2
648
116
11
12.6
21
** Evaluation period
24= Apr 1997-Mar 2003
Biff
-55
-17
-5
-5
2
Mean monthly burglaries
Gross changeHighest
NA
-7
-2
-2
4
Lowest
NA
-28
-7
-8
-1
Sis 2-yr
NA -1329
k -419
R -113
R -116
ns +36
DifT
0
-7
-3
-3
3
Net changeHighest
NA
+0
-0
-0
6
Lowest Sig
NA NA
-14 n s _
-7 I B
-7 W
+o I H
2-yr
+0
167
-83
-83
+72•Sig 9H Sig increase at 95% confidence level
2-yr = reduction 2001-3 compared with 1997-99
+ = increase, - = saving/reduction
ns No sig change
'-"$£&- Sig reduction at 95% confidence level
Percentage
change
Gross
-7.9
-13.1
-30.1
-27.6
+7.9
Net
+0.0
-5.2
-22.3
-19.7
+15.7
The gross burglary reduction for the period 2001-2003 is 116 which is reduced to a net
reduction of 83 with the removal of the effect of the Cleveland PFA reduction of 7.9%. The
net reduction in burglary is now 19.7 compared with 13.2 in the first two years after. The
police district in which the SDP is situated (the BCU) by comparison had a net reduction of
only 5.2. The comparison area showed a worsening picture with a gross burglary increase of
7.9 in the face of a Cleveland average decrease and a net increase of 15.7 compared with a
gross reduction and smaller net increase of 0.7 in the first analysis. The buffer zone on the

Page 42 Hartlepool: A Case Study in Burglary Reduction - Addendum
other hand had reductions in burglary slightly better than the SDP indicating that diffusion of
benefits is still more important than displacement in effect on the surrounding area. In the
hypothetical closed SDP system with no other explanations for burglary differences, Table 3
shows that the gross reduction of 104 in the first 2 year period has increased to 220 over the 4
years since the SDP start. Of the 220, 82 were accounted for by the Cleveland PFA reduction
leaving 138 to be explained by the SDP interventions. The relative change between the SDP
and the buffer is after four years zero, so that the 138 may all be attributed to the effect of the
interventions. However this can only be indicative as it is very likely that there have been
other activities in the area especially in the time which has now elapsed.
Table 3 Breakdown of Hartlepool SDP Outcomes
Gross outcome
Net outcome
Deterrence withinSDPDisplacement tobuffer zone
First year
-56
-38
-40
2
-48
-17
-4
-13
Number of burglaries savedyear Over first 3rd year
2 years
-104
-55
-44
-11
-51
-46
-64
+18
4th year
-65
-37
-30
-7
Over 4
years
-220
-138
-138
0
Table 3 also shows that the falling off of the effect of SDP interventions after the initial large
reduction in the first has not continued and that the doubts about the sustainability of SDP
effects felt at the time of the first analysis have not been justified. The third and fourth years
showed reductions larger or of the same order as the first year. There was a particularly large
diffusion of benefits to the buffer zone in the third year.
3. Changes in Patterns of burglary
Table 4 shows that the density of the burglary pattern has continued to reduce and the mean
distance between burglary locations to increase. The reduction in the nearest neighbour index
in the first 2 years after the SDP start has reverted although these changes are not significant
at the 95% level. Clustering in the SDP as a whole has not therefore changed.
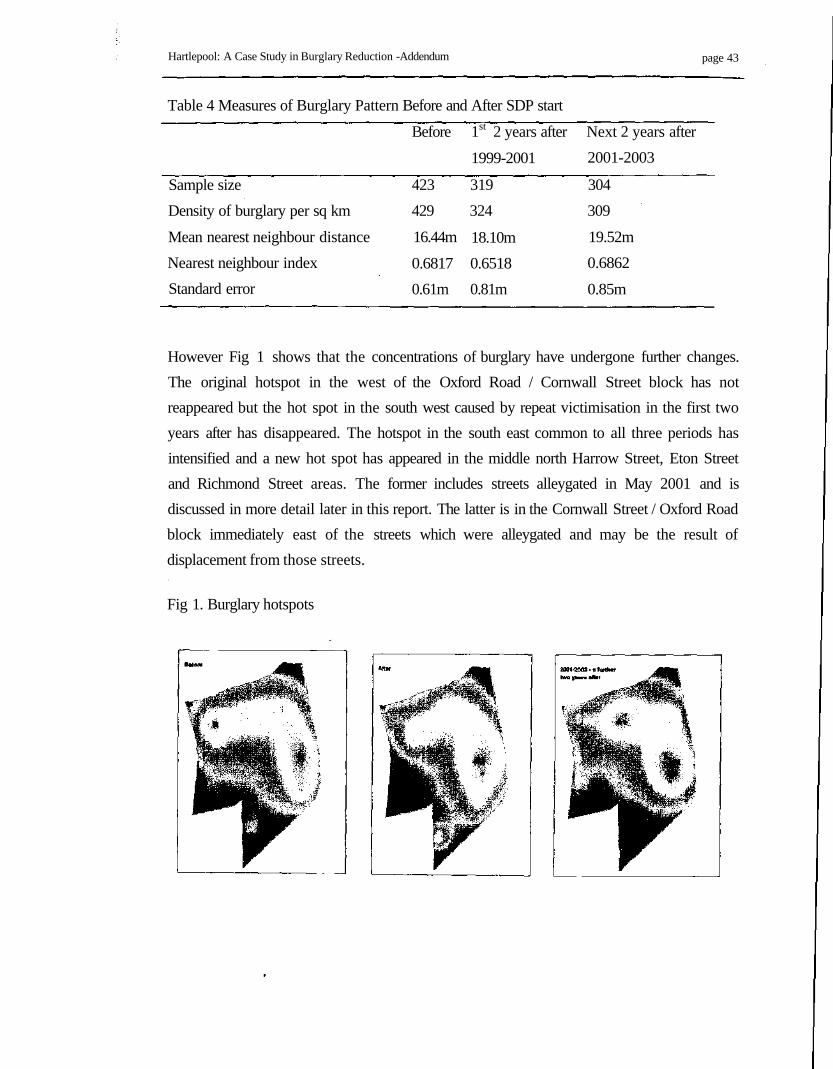
Hartlepool: A Case Study in Burglary Reduction -Addendum page 43
Table 4 Measures of Burglary Pattern Before and After SDP start
Sample size
Density of burglary per sq km
Mean nearest neighbour distance
Nearest neighbour index
Standard error
Before
423
429
16.44m
0.6817
0.61m
1st 2 years after
1999-2001
319
324
18.10m
0.6518
0.81m
Next 2 years after
2001-2003
304
309
19.52m
0.6862
0.85m
However Fig 1 shows that the concentrations of burglary have undergone further changes.
The original hotspot in the west of the Oxford Road / Cornwall Street block has not
reappeared but the hot spot in the south west caused by repeat victimisation in the first two
years after has disappeared. The hotspot in the south east common to all three periods has
intensified and a new hot spot has appeared in the middle north Harrow Street, Eton Street
and Richmond Street areas. The former includes streets alleygated in May 2001 and is
discussed in more detail later in this report. The latter is in the Cornwall Street / Oxford Road
block immediately east of the streets which were alleygated and may be the result of
displacement from those streets.
Fig 1. Burglary hotspots

Page 44 Hartlepoo): A Case Study in Burglary Reduction - Addendum
4. Reduction of repeat victimisation
Table 5 shows that repeat victimisation within a 90 day period has continued to decrease in
the SDP which showed a lesser rate in the second two year period after the SDP start even
than the first. Hartlepool Police District 1 on the other hand has shown a slight rise hi repeat
victimisation in the second period. Over the entire four year period since the SDP start, repeat
victimisation has been reduced in the SDP by two and a half times the amount of the BCU.
Table 5. Repeat burglary addresses
SDPwithin
Repeats (last offence90 days)
AverageQuarterTwoYearsBefore
4.75
per
TwoYearsAfter
3.5
%Change
-26.3
AveragequarterNext 2years
2.9
per
Whole4 years
3.2
%Change4 years
-32.9
BCU-SDP Repeats (last 27.1offence within 90 days)
23.0 -15.2 24.5 23.9 -12.8
Figure 2 shows that fluctuations continue in repeat victimisation but makes clear that the
trend is much more favourable in the SDP that in the BCU.
Figure 2 Repeat victimisation
250
200
5 150
S 100
Repeats - Last Offence within 90 days
—* SDP
- * — BCU-SDP
- - • Lrnear (SDP)
- - •• Linear (BCU-SDF)

Hartlepool: A Case Study in Burglary Reduction -Addendum page 45
5. The effects of Alley gating
Table 6 shows that the alleygates installed in September 2000 have continued to be effective
in preventing burglary to protected properties. Although the complete prevention in year 1 has
not been maintained, burglary levels are still less than pre installation. The alleygates installed
in May 2001 showed no reduction in the first year but thereafter a gradual improvement.
Taking into account a possible seasonal effect, burglaries for the equivalent May to
September periods in these protected properties show a fall in from 10 in the first year,
through 7 in the second and 3 in the third. The New Deal alleygates installed in April 2001
appear to have been less successful, reducing burglary initially but with a large increase in
year 3. The first six months of year 1 and year 2 show only one burglary each but in the first 6
months of year 3 there were 8 burglaries. Comment from the NDC Community Safety
Manager has suggested that the reason for the comparative lack of success of these alleygates
may be that this early win scheme, unlike the SDP alleygates, was not based on prior analysis
of the burglary problem but to show the potential of New Deal funding. The areas near to the
alleygates show a similar pattern to the protected properties with areas near to both September
and May NDC alleygates showing evidence of a diffusion of benefits (Table 7). The New
Deal alleygates area shows a large increase in year three like the protected properties.
Table 6 Houses protected by alleygates
Gates installed in:Sept 2000April 2001May 2001
Before0.50.41.3
Burglaries per month1st year after 2nd year after00.11.3
0.10.20.8
3rd year after0.31.3*0.6**
* 6 months only** 5 months only
Table 7 Area near to alleygates
Average burglaries per monthIs year afterGates installed in: Before
alleygates2n year after 3 year after
Sept 2000April 2001May 2001
1.00.91.9
0.50.32.5
0.20.21.8
0.71.7*1.2**
* 6 months only** 5 months only

Page 46 Hartlepool: A Case Study in Burglary Reduction - Addendum
Table 8 shows the monthly averages of rear entry and approach by alley for burglaries of
properties protected by or near to the alleygates. Where burglaries do occur in these
properties, rear entry and approach by alley are still important. One explanation is that, as
stated by the Hartlepool Community Safety Manager in interview, there is evidence that
burglaries are being committed by local residents who have access through the alleygates and
that some fluctuations in rear entry can be related to offenders' confinement in and release
from prison. Rear entry increased in protected properties from 48% before installation to 59%
over the whole after period and approach by alley from 20% to 28%. However the May
alleygates properties, which account for 67% of the rear entry in protected properties, are
showing a year on year improvement.
Table 8 MO in Alleygated areas
Sept 2000 Protected
Sept 2000 Near
April 2001 Protected
April 2001 Near
May 2001 Protected
May 2001 Near
* 3 year after period isX <K Till •ra*li« nttfl*' **A***n.-f *
Rear Entry
before
0.3
0.5
0.3
0.6
1.0
1.3
1st
year
after
0
0.3
0.1
0.3
0.8
1.3
only 6 months
'jnd
year
after
0
0
0.2
0.2
0.6
1
Monthly average
3rd
year
after
0.2
0.5
0.3*
0.4*
0.4**
0.8**
Approach by Alley
before
0.1
0.2
0.1
0.2
0.4
0.6
1st
year
after
0
0
0.1
0.1
0.3
0.7
2nd
year
after
0
0
0.2
0.2
0.3
0.3
3 rd year
after
0.2
0.4
0.2*
0.3*
0**
0**
The benefits of the alleygates have continued to be felt in the SDP. Considering the properties
protected by September alleygates over three years 9 burglaries have been saved with a
further 20 in nearby properties. This intervention alone therefore covers the cost of the whole
SDP after 3 years, hi the two complete years for which data is held, the May alleygates have
saved 6 burglaries in protected properties although the nearby area has suffered 5 additional
burglaries.
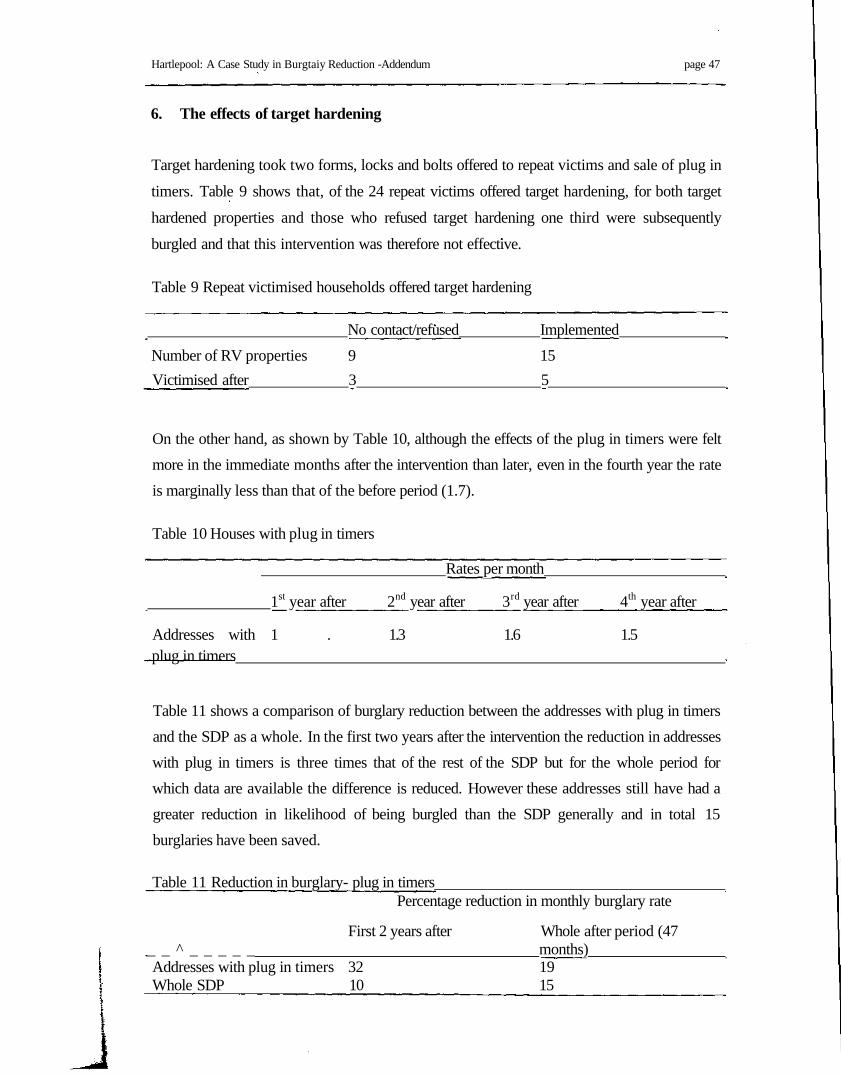
Hartlepool: A Case Study in Burgtaiy Reduction -Addendum page 47
6. The effects of target hardening
Target hardening took two forms, locks and bolts offered to repeat victims and sale of plug in
timers. Table 9 shows that, of the 24 repeat victims offered target hardening, for both target
hardened properties and those who refused target hardening one third were subsequently
burgled and that this intervention was therefore not effective.
Table 9 Repeat victimised households offered target hardening
No contact/refused Implemented
Number of RV properties 9 15
Victimised after 3 5
On the other hand, as shown by Table 10, although the effects of the plug in timers were felt
more in the immediate months after the intervention than later, even in the fourth year the rate
is marginally less than that of the before period (1.7).
Table 10 Houses with plug in timers
Rates per month
1st year after 2nd year after 3rd year after 4th year after
Addresses with 1 . 1.3 1.6 1.5plug in timers
Table 11 shows a comparison of burglary reduction between the addresses with plug in timers
and the SDP as a whole. In the first two years after the intervention the reduction in addresses
with plug in timers is three times that of the rest of the SDP but for the whole period for
which data are available the difference is reduced. However these addresses still have had a
greater reduction in likelihood of being burgled than the SDP generally and in total 15
burglaries have been saved.
Table 11 Reduction in burglary- plug in timersPercentage reduction in monthly burglary rate
First 2 years after Whole after period (47_ _ ^ _ _ _ _ _ months)Addresses with plug in timers 32 19Whole SDP 10 15

Page 48 Hartlepool: A Case Study in Burglaiy Reduction - Addendum
7. Summary and Conclusion
Hartlepool SDP can show evidence of continuation of its initial success, reducing burglary
within the area by more than the Cleveland average and by three times the reduction in the
BCU. The immediate surroundings also have benefited. Inevitably, in the time since the SDP
start there have been other crime reduction activities in Hartlepool, both generally and in the
immediate area. For example, there is now a police burglary reduction officer whose sole
purpose is burglary work. Hartlepool Council has been responsible for alleygating 120 streets
in the town centre as well as certain streets elsewhere including at least one in the SDP area.
New Deal for Communities began towards the end of the first two year after period in an area
overlapping the part of the SDP with the highest burglary problem and also the comparison
area. New Deal has funded a wide range of interventions including large numbers of
alleygates, a Dordrecht project, drugs outreach, anti-social behaviour project, wardens and
youth diversionary activities as well as a major housing revival scheme. However most of
these are recent and are likely to have contributed to the SDP burglary reduction only in the
final year of the extended analysis period. Apart from early wins alleygates in April 2001,
NDC interventions were not in place until the financial year 2002/3 and figures for the whole
NDC area show a burglary reduction only in 2003/4. It seems likely therefore that NDC
activity will not have materially impacted on the continued reduction in burglary and that it is
at least in part a long term effect of the RBI.
So why did Hartlepool not only succeed in reducing burglary where other SDPs did not but
also sustain that reduction? One clear contributing factor may be the Community
Development intervention which effectively began partnership working with the community
by strengthening the Belle Vue Community Centre, developing the pre existing residents
association, starting a second one, and starting Neighbourhood Watch Groups. This provided
a valuable basis on which New Deal for Communities, itself a very community based
programme, could build. The Hartlepool Community Safety Manager said
"I think the RBI assisted in developing it. Because I think that when I came, just before
we were putting the bid in for the RBI, I didn't think there was so much involvement with
residents and the partnership working involving residents. The RBI sparked that, we
thought that if we were going to go into the area we needed involvement from the
residents. And I think having seen how it worked and the fact that the NDC came along
and continued that."

Hartlepool: A Case Study in Burglary Reduction -Addendum page 49
There has also been a certain amount of stability in the area in terms of personnel. The
Hartlepool Community Safety Manager is for example still the same and the same two
individuals still work at the Belle Vue Community Centre. There has been a willingness to
learn from the RBI experience. For example the alleygates implemented in three small areas
under RBI have become a widespread alleygating scheme towards the end of the analysis
period. The lesson of basing alleygates interventions on analysis rather than just installing
them anywhere has been applied to all the more recent schemes. Not all the interventions
have continued. Although the Fairbridge scheme had collapsed before the end of the RBI, no
attempt has been made to run something similar, this kind of work being left to the YOT. The
Selectamark scheme which was also unsuccessful has never been reattempted, the lesson of
its labour intensive nature being the main reason. However recently consideration is being
made of a different type of property marking scheme, Smartwater. The evidence of the
success of the plug in timers above may provide another future avenue for low cost burglary
prevention. Finally the advent of NDC in the area has provided both the resources and a focus
to build on what the RBI achieved. Although the NDC interventions were not in place until
the last year of the analysis period, planning was taking place from 2001 and could therefore
maintain interest and impetus. The NDC has reported that since the end of the period which
this report covers, burglary in the NDC area which includes the SDP has decreased relative to
Hartlepool as a whole.
Community relations may be seen to be involved in crime reduction in two ways. Firstly the
crime reduction initiative supports the community in what it wants to do. In Hartlepool, SDP
and later NDC funding have provided the opportunity for this support. Close partnership
working with the community has ensured that the interventions are in tune with the
community's priorities. Secondly this same partnership and the good relations thus generated
have assisted in gaining the support of the community for the interventions, and therefore
improved chances of successful implementation.
This addendum shows clearly how the early reductions in burglary have been sustained
through four years after the inception of the project. The reductions are apparent both for the
general rate of burglary in relation to other areas and for many of the specific interventions
undertaken. What can only be more tentatively concluded at this stage is that community
relations are an important feature in the sustainability of the reduction.