Harnessing Solar Power in Madhya Pradesh - 31 Oct...
76
Harnessing Solar Power in Madhya Pradesh The Journey from 2 MW to 2 GW S R Mohanty Additional Chief Secretary, Government of MP
Transcript of Harnessing Solar Power in Madhya Pradesh - 31 Oct...

Harnessing Solar Power in Madhya Pradesh
The Journey from 2 MW to 2 GW
S R Mohanty Additional Chief Secretary,
Government of MP

State of Madhya Pradesh in India
2
Located at Heart of India.
Tropic of Cancer passes through the state
Well Connected with Air and Rail
Largest State in India

PV Solar Capacity Addition in India
3
Sr. No. State/UT
Total Commissioned Cap till 31.04.14
Total Commissioned Cap till 31.04.13
Difference Position During 2013-14
1 Andhra Pradesh 131.84 23.15 108.69 4 2 Chhattisgarh 7.1 4 3.1 3 Gujrat 916.4 857.9 58.5 6 4 Haryana 10.3 7.8 2.5 5 Karnataka 31 14 17 6 Madhya Pradesh 347.16 37.31 309.85 1 7 Maharashtra 249.25 100 149.25 3 8 Orissa 30.5 13 17.5 9 Punjab 16.845 9.325 7.52 10 Rajasthan 730.1 551.15 178.95 2 11 Tamil Nadu 98.36 17.05 81.31 5 12 Others 63.05 49.75 13.3 Total 2631.905 1684.435 947.47

M.P. Solar Advantage

India & Solar Energy
5
More than 300 days of clear sun.
Solar radiation between 5.6 - 6.2 kWh/sq.m/day
Easy Approachability
Limited Dust and Moisture

Solar Power in MP
• Transmission Capacity of More than 13000 MW and Expanding
• Now under Green Corridor – to handle 7000 MW RE Power
Stable Transmission Network
• 20000 Hectare identified for solar energy projects
Availability of abundant land

RE Policy Development
Strategy

Requisite Support System
8
• Defined Policy Environment
• Clarity In Approach
• Clear Direction • Committed Implementation Framework

Policy Development
9
• Formulation Process Kept Open
• Draft shared with all stake holders
• Consultation with Financial Institutions, Consultants etc

Policy Development
10
• Simple land allocation procedures.
• No environment impact assessment required
• No land or project related inspection.

Policy Development
11
• No permission for construction from local bodies
• Simple Process & Minimum documentation
• Transparent online project clearance & monitoring

Policy Benefits Notified on July 2012

Benefits under Policies
13
• No electricity duty for 10 years
• No electricity cess for 10 years
• Wheeling charges reduced to 2%

Benefits under Policies
14
• Third party sale • Sale outside the state permitted
• No VAT and no entry tax
• Benefits of industry status

Benefits under Policies
15
• Stamp duty exemption on pvt. land purchase
• 100% banking
• Reduction in contract demand
• 100% CDM Benefit

Benefits under Policies
16
• Ease in selection of land
– Freedom to identify suitable land
– Bankable document for government land
– Government land for 25 years

Response to Policy Framework

Page 18
Response (Phase I Oct 2012, Phase II May 2013 and Phase III May 2014)
56
96
50
23
77
99
Phase 1 Phase 2 Phase 3
Response in Numbers Solar Wind
880 1461
588 685
3527
5753
Phase 1 Phase 2 Phase 3
Response in MW
Solar Wind

Installed Capacity as on 1st April, 2012
Wind Solar Biomass Hydro
314.89
2 35.1
86.25
19
71.85%
0.46%
8.01%
19.68%
Wind Solar Biomass Hydro
Total Installed Capacity : 438.24 MW

Installed Capacity as on 30th September, 2014
20
Total Installed Capacity : 965 MW
Wind Solar Hydro Biomass
456
356
86 67
47%
37%
9% 7%
Wind
Solar
Hydro
Biomass

Expected Installed Capacity as on 31st March, 2015
21
Total Installed Capacity : 2402 MW Growth Since 2012 : 548%
41.60%
40.75%
7.71%
9.93%
Wind Solar Biomass Hydro
Wind Solar Biomass Hydro
1161 1054
87 100

Present Estimated Potential
22
Land identified for setting up Solar Power projects and intimated by Respective Collectors More than 20,000
hectares.
Source wise RE Potential (MW)
8000
19000
1500 750
Solar Wind Biomass Small Hydro

Projects Under Execution
23
Projects Under Execution (MW) 5400
698
282 272
Wind Solar Small Hydro Biomass

Capacity Addition
24
Sl. No Verticals As on 1st Apr ‘12
Capacity on Apr ‘14
Capacity on Apr ‘15
Capacity targeted on Apr ‘16
Capacity targeted on Apr ‘17
MW MW MW MW MW
1 Wind 314 361 1161 2361 3261 2 Solar 2 354 1054 1854 2654 3 Biomass 35 67 87 137 197 4 SHP 86 86 100 160 240
Total 351 868 2402 4512 6352

25
Solar Story (From 2 MW to 2 GW)

Projects Under Execution
26
MW Numbers
Solar 696 36

Page 27
Capacity Installed March 2012 2.0 MW
Capacity By April 2014 356 MW
Progress in Solar Power

Solar Capacity Addition (MW) 2 MW to 2 GW
28
37.21
220.15 354
574
850
1250
1750
2250
Mar 2012 Mar 2013 Sep 2013 March 2014 March 2015 Dec 2015 March 2016 Dec-16 Mar-17
Capacity MW

MP: Take-off Stage
29
Maximum Capacity Addition
Pan-India addition
During 2013-14

REC Projects in MP
• First REC project of India registered in MP
• Projects registered: 61
30
Highest number of projects registered in the country

31
JNNSM Phase II Batch I

M.P. Consideration
32
• Total Projects 220 MW • Percentage Share : 33% (1/3 rd of Total
Allocation)
• Weighted Average VGF from MP : • DCR : 207 L/MW (Pan India : 212.63 L/MW) • Open: 102 L/MW(Pan India : 113.35 L/MW)

JNNSM Project Execution Status
33
• Number of Projects 7. Work started in April 2014 • Execution Status: All Projects
• Land Allotted • Have been given connectivity • Have achieved Financial Closure • Are expected to be completed in March 2015

34
Key Developers in M.P.

Key Developers: Commissioned Projects
35
Name of Developer MW
Welspun Solar Madhya Pradesh Pvt Ltd 130
NTPC 50
ACME Tele 25
Alpha Infra Pvt Ltd 20
Friends Salt Works & Allied Industries 10
KRBL Limitd 9.31
UJJAS Energy Pvt Ltd 7

Key Developers: Commissioned Projects
36
Name of Developer MW
UJJAS Energy Pvt Ltd 10
Deepak Industries Limited 5
Bhadresh Trading Corporation Ltd 5
Shri Balaji Enterprises 2
Eastman International 2
Adora Energy Pvt Ltd 2

On Going Projects
37
Name of Developer Capacity (MW) IL&FS Energy Development Company Ltd. 40 SEI L’Volta Private Limited 20 SEI Sitara Private Limited 30 Focal PhotoVoltaic India Pvt. Ltd. 10 Focal Energy Solar One India Pvt. Ltd. 20 Focal Renewable Energy Two India Pvt. Ltd. 10 Clean Solar Power (Dhar) Pvt. Ltd. 30 Waaneep Solar Pvt. Ltd 50 Finnsurya Energy Pvt. Ltd. 10 ReNew Solar Power Pvt. Ltd. 50 Today Homes and Infrastructure Pvt. Ltd. 20 Globus Steel & Power Pvt. Ltd. 20 Bhadresh Trading Company Ltd. 10 Himgiri Energy Ventures Pvt. Ltd. 5 KRBL Ltd. 15 Deligentia Energy and Infr. Pvt. Ltd. 25

On Going Projects
38
Name of Developer Capacity (MW)
M & B Switch Gears Ltd. Indore 95.75 Saranga Renewable Energy Barod Indore 5.00 Barod Renewable Energy Pvt. Ltd. Indore 10.00 Forever Solar Project Pvt. Ltd (Sai Prakash Power India Ltd 24
Jyotikiran Energy Pvt. Ltd. Noida 40 Jyotikiran Energy Pvt. Ltd. Noida 11 Welspun Renewable Energy Ltd. Mumbai 55 Riverdeep Infra Pvt. Ltd. Delhi 5 Cleaner Gen Projects Pvt. Ltd. N. Delhi 2 Sekema Power Generation Pvt. Ltd. 2 Solanki Energy 0.25 Ujaas Energy Limited 25 Ujaas Energy Limited 14 Ujaas Energy Limited 42

Recent Initiatives

Recent Initiatives for Investment Facilitation • Solar Park and Farms
• Resource Assessment
• Infrastructure upgradation
• Process simplification

Solar Farms • State to set up four 15 MW each solar farms
• Farms for small investors to plug and play.
• Farms to include all infrastructure
• Farms to be ready with EPC pre fixed
41

Resource Assessment
42
Investment Facilitation
Infrastructure upgradation
Process Simplification
Resource Assessment
20 stations for solar radiation measurement

Infrastructure Up gradation
43
Transmission infrastructure Upgradation
Rs 2100 Cr Plan ready
Cater to 7000 MW
Under PPP
Model
Funded Under Green
Corridor

Process Simplification
44
Process Simplification
Dynamic Project
Tracking System
Documents Standardization
Document Clearance time :- Maximum 7 Days Committed

2 UMSPP Proposed at :
Rewa Neemuch
MNRE Sanctioned 2 UMSPP

750 MW UMSPP (Rewa)
46
• Capacity: 750 MW
• Identified site: Rewa
• Project Development:
GoMP & SECI with
support from World bank
• Land : Nearly 1400 Ha

47
750 MW UMSPP (Rewa)

Rewa UMSPP
48
• Land area: 1400 Ha

Rewa UMSPP Present Status
49
• First Stage EIA and SIA has been completed with World Bank
• Pre-Feasibility Report is prepared by SECI
• Request made to DEA for World Bank funding

Rewa UMSPP Present Status
50
• Draft MoU Received from MNRE • Draft Joint Venture Agreement with SECI
prepared • Transmission Feasibility Studied by MP Transco
• Project Proposed to be rolled out in December

Commissioned MW Scale Projects

Sites in MP
52

53
First 1 MW Plant Commissioned in March 2012 at Rajgarh
First REC Plant in the Country

54
3 MW Plant Commissioned in December 2012 at Rajgarh
12 MW Plant Commissioned on 31st March at Barod

55
25 MW Plant at Khilchipur , distt Rajgarh (Biaora) developed by Acme Tele; commissioned in Jan 2014

Largest Solar Project in India
56
Total Capacity: 130 MW
(151 MW DC) Dedicated to Nation : 26th
February, 2014
Spread over 900
Acres
Completed 8
months ahead of schedule

Third Single Largest Solar Project In India
57
Commissioned on 31st
March 2014
Total Capacity: 50 MW (60 MW DC)
Spread over 275 Acres

Solar Results Achieved Commissioned Projects
58
Sl.No. Location PLF Achieved
1 Neemuch (130 MW) 21.5%
2 Rajgarh (NTPC 50 MW) 18.95%
3 Agar (UJJAS) 19.2%
4 Khilchipur (ACME Tele) 19.4%

Neemuch PLF Month on Month
59
18.26
18.21
18.86 17.64
23.02
27.44 25.51
21.79 21.21
16.07 16.87
20.81
10.00 12.00 14.00 16.00 18.00 20.00 22.00 24.00 26.00 28.00 30.00
PLF
Average 20.47%

Off-Grid Projects
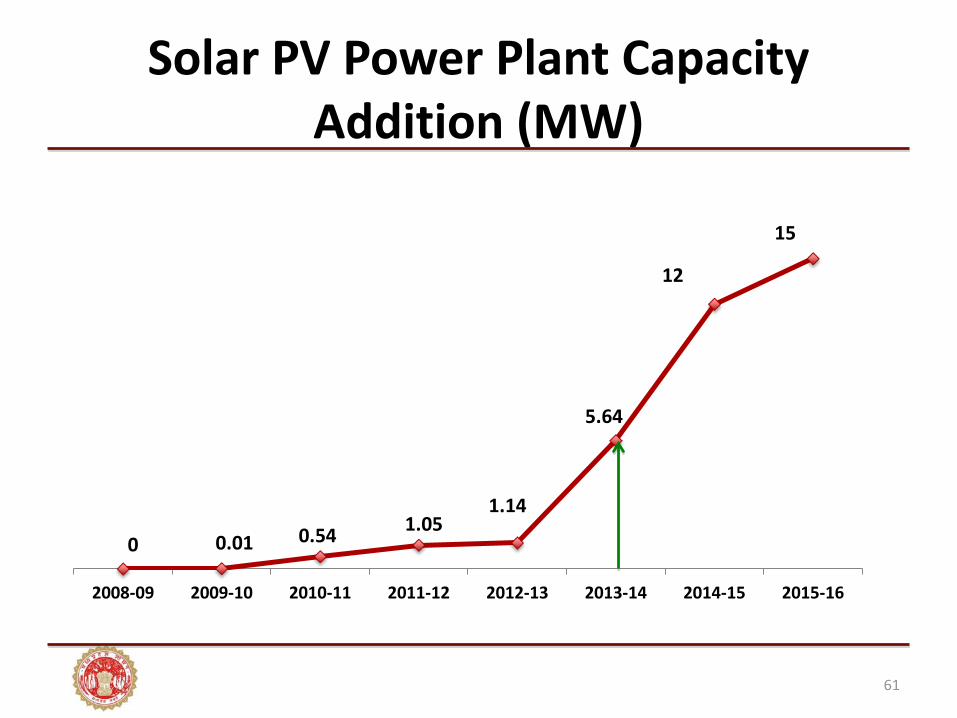
0 0.01 0.54 1.05 1.14
5.64
12
15
2008-09 2009-10 2010-11 2011-12 2012-13 2013-14 2014-15 2015-16
Solar PV Power Plant Capacity Addition (MW)
61

325 835 2272
4312
8110 10500
15000
25000
2008-09 2009-10 2010-11 2011-12 2012-13 2013-14 2014-15 2015-16
Solar Street Lights (nos.)
62

Solar Street Lights
63
• Achievement in 5 years (2006-07 to 2011-12): 4,000 nos
• Achievement in 2 years (2011-12 to 2013-14): 10,500 nos
• To add 25,000 nos in 2 years (2014-15 and 2015-16)

0 0 0 0 4
1704
4200
6000
2008-09 2009-10 2010-11 2011-12 2012-13 2013-14 2014-15 2015-16
Solar Pumps (nos.)
64

0.43 2 4 11
16
50
80
120
2008-09 2009-10 2010-11 2011-12 2012-13 2013-14 2014-15 2015-16
Solar Water Heaters (LPD in Lacs)
65

14 227 452 557 557
12000
25000
40000
2008-09 2009-10 2010-11 2011-12 2012-13 2013-14 2014-15 2015-16
Solar Cookers (nos.)
66

Future Plans
67
• Install solar solutions in the following :
National parks
Hospitals
Tribal hostels
Police stations
Jails
Public places

Future Plans
68
• Cover villages in LWE areas with solar solutions
• 5 municipal corporations & 19 municipalities to be equipped with solar/LED lights
• “One Child- One Light” program: 1 million lights

Future Plans
69
• All handloom clusters to be lit by home lights
• Net metering to be introduced
• Gwalior city to have rooftop solar lighting

GIS 2014 More than 350
Delegates Participated
110 B2G Meetings
107 Companies participated
Madhya Pradesh Global Investor Summit New & Renewable Energy
Committed Investment
More than Rs 4200 Cr.
Intention to Invest
More than Rs. 94000 Crore

Madhya Pradesh Global Investor Summit New & Renewable Energy
Key Investors(SOLAR)
NTPC 750 MW
NALCO 50 MW
BALCO 25 MW
MOIL 20 MW
Bharat Petroleum 10 MW

And By March 2017…

99.98%
0.02%
Apr-12
Conventional Power Solar Power
Solar Share in State Energy Pool
73
Projected Solar installed capacity: 2000 MW
88.24%
11.76%
March-17
Conventional Power Solar Power

95.91%
4.09% Apr-12
Conventional Power Renewable Power
Total Renewable Energy Share
74
Projected NRE installed capacity: 6400 MW
79.79%
20.21% March-2017
Conventional Power Renewable Power

160 kw solar PV plant at the roof of Nalco Bhavan at Bhubaneswar
75
Installed by UJJAS Energy Ltd
Indore (M.P.)

Thank You
Web site: www.mpnred.com