Harmonic template neurons in primate auditory cortex...
14
Harmonic template neurons in primate auditory cortex underlying complex sound processing Lei Feng a,1 and Xiaoqin Wang a,2 a Laboratory of Auditory Neurophysiology, Department of Biomedical Engineering, Johns Hopkins University School of Medicine, Baltimore, MD 21205 Edited by Dale Purves, Duke University, Durham, NC, and approved December 7, 2016 (received for review May 10, 2016) Harmonicity is a fundamental element of music, speech, and animal vocalizations. How the auditory system extracts harmonic structures embedded in complex sounds and uses them to form a coherent unitary entity is not fully understood. Despite the prevalence of sounds rich in harmonic structures in our everyday hearing envi- ronment, it has remained largely unknown what neural mechanisms are used by the primate auditory cortex to extract these biologically important acoustic structures. In this study, we discovered a unique class of harmonic template neurons in the core region of auditory cortex of a highly vocal New World primate, the common marmoset (Callithrix jacchus), across the entire hearing frequency range. Mar- mosets have a rich vocal repertoire and a similar hearing range to that of humans. Responses of these neurons show nonlinear fa- cilitation to harmonic complex sounds over inharmonic sounds, selectivity for particular harmonic structures beyond two-tone combinations, and sensitivity to harmonic number and spectral regularity. Our findings suggest that the harmonic template neu- rons in auditory cortex may play an important role in processing sounds with harmonic structures, such as animal vocalizations, human speech, and music. marmoset | auditory cortex | music | harmonic | hearing M any natural sounds, such as animal vocalizations, human speech, and the sounds produced by most musical instru- ments, contain spectral components at frequencies that are in- teger multiples (harmonics) of a fundamental frequency (f 0 ). Harmonicity is a crucial feature for perceptual organization and object formation in hearing. Harmonics of the same f 0 tend to fuse together to form a single percept with a pitch of f 0 . The perceptual fusion of harmonics can be used for segregating dif- ferent sound sources (1–3) or to facilitate the discrimination of vocal communication sounds in noisy environments (4–6). Har- monicity is also an important principle in the context of music perception. Two tones one octave apart are perceived to be more similar than tones at any other musical intervals, usually known as the octave equivalence in the construction and description of musical scales (7, 8). It has also been shown that harmonicity is correlated with preferences for consonant over dissonant chords (9–11). Therefore, understanding how the brain processes har- monic spectra is critical for understanding auditory perception, especially in the context of speech and music perception. In the peripheral auditory system, a harmonic sound can be represented by its constituent parts that are decomposed (or resolved) into separate tonotopically organized frequency chan- nels (12). The tonotopic organization starting from the cochlea is preserved at different stages up to the primary auditory cortex (A1) along the ascending auditory pathway, where many neurons are narrowly tuned to pure tones and can represent individually resolved frequency components in a harmonic sound with high precision (13–18). To form an auditory object based on harmonic spectral patterns, a central process is required to integrate har- monic components from different frequency channels. Such pro- cessing might be responsible for extracting pitch through template matching as has been previously suggested (19, 20), although the physiological evidence for such harmonic templates has been lacking. Auditory cortex has been shown to play an important role in harmonic integration in processing complex sounds. Pa- tients with unilateral temporal lobe excision showed poorer performance in a missing fundamental pitch perception task than normal listeners but performed as normal in the task when the f 0 was presented (21). Auditory cortex lesions could impair complex sound discrimination, such as animal vocalizations, and vowel-like sounds without affecting responses to relative simple stimuli, like pure tones (22–24). Primate auditory cortex is subdivided into a “core” region, consisting of A1 and the neighboring primary-like rostral (R) and rostral–temporal areas, surrounded by a belt region, which contains multiple distinct secondary fields (Fig. S1A) (25). Neurons in the core region are tonotopically organized and typically tuned spec- trally to individual components of resolved harmonics or temporally to the modulation frequency of summed unresolved harmonics (13– 16). Although a cortical region for representing low-frequency pitch (<1,000 Hz) near the low-frequency border between A1 and R has been implicated in both humans (26–29) and nonhuman primates (27), it remains unclear whether neurons in the core region can detect complex harmonic patterns across a broader frequency range. Previous studies using two tones showed that some neurons in A1 were tuned to more than one frequency, and those frequencies were sometimes harmonically related (30–32). Such findings suggest a neural circuitry in A1 for detecting harmonic structures more com- plex than two-tone combination, which may underlie the perceptual fusion of harmonic complex tones (HCTs). However, no study has provided direct evidence for such harmonic template processing at the single-neuron level in auditory cortex. In this study, we systematically evaluated harmonic processing by single neurons in the core area (A1 and R) of auditory cortex of the marmoset (Callithrix jacchus). The marmoset is a highly vocal New World primate, and its vocal repertoire contains rich harmonic structures (33). It has recently been shown that marmosets Significance Harmonicity is a fundamental element of music, speech, and animal vocalizations. How the brain extracts harmonic struc- tures embedded in complex sounds remains largely unknown. We have discovered a unique population of harmonic template neurons in the core region of auditory cortex of marmosets, a highly vocal primate species. Responses of these neurons show nonlinear facilitation to harmonic complex sounds over in- harmonic sounds and selectivity for particular harmonic struc- tures. Such neuronal selectivity may form the basis of harmonic processing by the brain and has important implications for music and speech processing. Author contributions: L.F. and X.W. designed research; L.F. performed research; L.F. an- alyzed data; and L.F. and X.W. wrote the paper. The authors declare no conflict of interest. This article is a PNAS Direct Submission. 1 Present address: Department of Psychology, University of Minnesota, Minneapolis, MN 55455. 2 To whom correspondence should be addressed. Email: [email protected]. This article contains supporting information online at www.pnas.org/lookup/suppl/doi:10. 1073/pnas.1607519114/-/DCSupplemental. E840–E848 | PNAS | Published online January 16, 2017 www.pnas.org/cgi/doi/10.1073/pnas.1607519114
Transcript of Harmonic template neurons in primate auditory cortex...

Harmonic template neurons in primate auditory cortexunderlying complex sound processingLei Fenga,1 and Xiaoqin Wanga,2
aLaboratory of Auditory Neurophysiology, Department of Biomedical Engineering, Johns Hopkins University School of Medicine, Baltimore, MD 21205
Edited by Dale Purves, Duke University, Durham, NC, and approved December 7, 2016 (received for review May 10, 2016)
Harmonicity is a fundamental element of music, speech, and animalvocalizations. How the auditory system extracts harmonic structuresembedded in complex sounds and uses them to form a coherentunitary entity is not fully understood. Despite the prevalence ofsounds rich in harmonic structures in our everyday hearing envi-ronment, it has remained largely unknownwhat neural mechanismsare used by the primate auditory cortex to extract these biologicallyimportant acoustic structures. In this study, we discovered a uniqueclass of harmonic template neurons in the core region of auditorycortex of a highly vocal NewWorld primate, the commonmarmoset(Callithrix jacchus), across the entire hearing frequency range. Mar-mosets have a rich vocal repertoire and a similar hearing range tothat of humans. Responses of these neurons show nonlinear fa-cilitation to harmonic complex sounds over inharmonic sounds,selectivity for particular harmonic structures beyond two-tonecombinations, and sensitivity to harmonic number and spectralregularity. Our findings suggest that the harmonic template neu-rons in auditory cortex may play an important role in processingsounds with harmonic structures, such as animal vocalizations,human speech, and music.
marmoset | auditory cortex | music | harmonic | hearing
Many natural sounds, such as animal vocalizations, humanspeech, and the sounds produced by most musical instru-
ments, contain spectral components at frequencies that are in-teger multiples (harmonics) of a fundamental frequency (f0).Harmonicity is a crucial feature for perceptual organization andobject formation in hearing. Harmonics of the same f0 tend tofuse together to form a single percept with a pitch of f0. Theperceptual fusion of harmonics can be used for segregating dif-ferent sound sources (1–3) or to facilitate the discrimination ofvocal communication sounds in noisy environments (4–6). Har-monicity is also an important principle in the context of musicperception. Two tones one octave apart are perceived to be moresimilar than tones at any other musical intervals, usually knownas the octave equivalence in the construction and description ofmusical scales (7, 8). It has also been shown that harmonicity iscorrelated with preferences for consonant over dissonant chords(9–11). Therefore, understanding how the brain processes har-monic spectra is critical for understanding auditory perception,especially in the context of speech and music perception.In the peripheral auditory system, a harmonic sound can be
represented by its constituent parts that are decomposed (orresolved) into separate tonotopically organized frequency chan-nels (12). The tonotopic organization starting from the cochlea ispreserved at different stages up to the primary auditory cortex(A1) along the ascending auditory pathway, where many neuronsare narrowly tuned to pure tones and can represent individuallyresolved frequency components in a harmonic sound with highprecision (13–18). To form an auditory object based on harmonicspectral patterns, a central process is required to integrate har-monic components from different frequency channels. Such pro-cessing might be responsible for extracting pitch through templatematching as has been previously suggested (19, 20), although thephysiological evidence for such harmonic templates has beenlacking. Auditory cortex has been shown to play an important
role in harmonic integration in processing complex sounds. Pa-tients with unilateral temporal lobe excision showed poorerperformance in a missing fundamental pitch perception task thannormal listeners but performed as normal in the task when the f0was presented (21). Auditory cortex lesions could impair complexsound discrimination, such as animal vocalizations, and vowel-likesounds without affecting responses to relative simple stimuli, likepure tones (22–24).Primate auditory cortex is subdivided into a “core” region,
consisting of A1 and the neighboring primary-like rostral (R) androstral–temporal areas, surrounded by a belt region, which containsmultiple distinct secondary fields (Fig. S1A) (25). Neurons in thecore region are tonotopically organized and typically tuned spec-trally to individual components of resolved harmonics or temporallyto the modulation frequency of summed unresolved harmonics (13–16). Although a cortical region for representing low-frequency pitch(<1,000 Hz) near the low-frequency border between A1 and R hasbeen implicated in both humans (26–29) and nonhuman primates(27), it remains unclear whether neurons in the core region candetect complex harmonic patterns across a broader frequency range.Previous studies using two tones showed that some neurons in A1were tuned to more than one frequency, and those frequencies weresometimes harmonically related (30–32). Such findings suggest aneural circuitry in A1 for detecting harmonic structures more com-plex than two-tone combination, which may underlie the perceptualfusion of harmonic complex tones (HCTs). However, no study hasprovided direct evidence for such harmonic template processing atthe single-neuron level in auditory cortex.In this study, we systematically evaluated harmonic processing
by single neurons in the core area (A1 and R) of auditory cortexof the marmoset (Callithrix jacchus). The marmoset is a highlyvocal New World primate, and its vocal repertoire contains richharmonic structures (33). It has recently been shown that marmosets
Significance
Harmonicity is a fundamental element of music, speech, andanimal vocalizations. How the brain extracts harmonic struc-tures embedded in complex sounds remains largely unknown.We have discovered a unique population of harmonic templateneurons in the core region of auditory cortex of marmosets, ahighly vocal primate species. Responses of these neurons shownonlinear facilitation to harmonic complex sounds over in-harmonic sounds and selectivity for particular harmonic struc-tures. Such neuronal selectivity may form the basis of harmonicprocessing by the brain and has important implications formusic and speech processing.
Author contributions: L.F. and X.W. designed research; L.F. performed research; L.F. an-alyzed data; and L.F. and X.W. wrote the paper.
The authors declare no conflict of interest.
This article is a PNAS Direct Submission.1Present address: Department of Psychology, University of Minnesota, Minneapolis, MN55455.
2To whom correspondence should be addressed. Email: [email protected].
This article contains supporting information online at www.pnas.org/lookup/suppl/doi:10.1073/pnas.1607519114/-/DCSupplemental.
E840–E848 | PNAS | Published online January 16, 2017 www.pnas.org/cgi/doi/10.1073/pnas.1607519114

perceive harmonic pitch in a similar manner as humans (34). UsingHCTs and other comparison stimuli, we identified a subpopulationof neurons that exhibited preference to particular HCTs over puretones or two-tone combinations. Responses of these neurons wereselective to fundamental frequencies (f0) of HCTs over a broadrange (400 Hz to 12 kHz) and sensitive to harmonic number andspectral regularity. Our findings suggest a generalized harmonicprocessing organization in primate auditory cortex that can be usedto effectively extract harmonic structures embedded in complexsound sources, such as music and vocal communication signals.
ResultsIdentification of Harmonic Template Neurons. Most of the neuronsin the core region of marmoset auditory cortex are responsiveto pure tones, some only weakly. Fig. 1A shows an A1 neuron’sresponse to pure tones (Fig. 1A, Left), two tones (Fig. 1A, Center),and HCTs (Fig. 1A, Right). The level of individual components ofan HCT or a two-tone combination matched the level of puretones. This neuron responded weakly to pure tones near twofrequencies (7.49 and 6.28 kHz), with the maximal firing rate at7.49 kHz [determined as best frequency (BF)] (Fig. 1A, Left).When the BF tone was presented simultaneously with a secondtone at varying frequency, this neuron’s response was enhanced atseveral f2 frequencies (Fig. 1A, Center). The two-tone response
profile shows higher firing rates than those of pure tones with twofacilitatory peaks flanking the BF at 6.28 and 8.57 kHz, re-spectively (Fig. 1B, Upper). The response of this neuron wasfurther enhanced when HCTs with varying f0 values were pre-sented. Fig. 1B, Lower Left illustrates the array of HCTs used inthe testing, each having several spectral components, all of whichare multiples of f0. We systematically varied f0 values and limitedall harmonics within a two-octave frequency range centered atBF. At some f0 values (e.g., 1.05 and 1.26 kHz), the responseswere much stronger than the maximal responses to pure tones ortwo-tone stimuli and became sustained through stimulus dura-tion (Fig. 1 A, Right and B, Lower Right). Because sustained firingis usually evoked by the preferred stimulus (or stimuli) of aneuron in auditory cortex of awake marmosets (35), we mayconsider that this example neuron preferred HCTs with partic-ular f0 values. The f0 at which the maximal firing rate is evoked byan HCT is referred to as the best f0 (Bf0). The neuron shown inFig. 1 A and B, therefore, has a Bf0 at 1.05 kHz (Fig. 1B, LowerRight). Its f0 tuning profile also has a smaller peak at 1.26 kHz. Aclose examination shows that the two HCTs corresponding to thetwo largest peaks at f0 of 1.05 and 1.26 kHz both contain threespectral components that aligned with the BF (7.49 kHz) and thetwo frequencies (6.28 and 8.57 kHz) at the facilitatory peaks ofthe two-tone response profile (Fig. 1B, Upper and Lower Left,
−1 −0.5 0 0.5 10
5
10
15
20
Perc
ent o
f Neu
rons
N = 372 neuronsFI = 0.33
200 300 400
2
4
8
16
Time (ms)
Freq
uenc
y (k
Hz)
200 300 400 500 0 200Rate (Spks/s)
Pure tone
f0 = 1.05kHz
f0 = 1.26kHz
4 6 8 10 121.0
1.2
1.4
1.6
1.8
2.0
Frequency (kHz)
Fund
amen
tal F
requ
ency
(kHz
)0
100
200 6.28
7.498.57
Rate
(Spk
s/s)
Spectra of HCTs
Time (ms)
Pure tone
1
8
16
f2 (k
Hz)
4
Two-tone (7.49kHz+f2)
Time (ms)200 300 400 500
1
1.2
1.4
1.6
1.8
2
Fund
amen
tal F
requ
ency
(kHz
)
HCTsTwo-tone (7.49kHz+f2)
Response to 7.49kHzf2 (kHz)
f0 = 1.26kHz
f0 = 1.05kHz
BF
BF (7.49kHz)
0 200 400 6000.38
0.48
0.70
1.23
5.33
Time (ms)
)zHk( ycneuqerF l at nemadnuF
Responses to HCTs
f0 = 621Hz
500
2 4 6 8 10
0.48
0.70
1.23
5.33
15 300
COS phaseALT phase
Rate (Spks/s) Frequency (kHz)
Spectra of HCTs
0.38
)zHk( ycneuqerF l at nemadnuF
6.28kHz
6.28kHz
8.57kHz
f0 (k
Hz)
100
A
C D E
B
Fig. 1. Examples of neuronal responses to HCTs in A1. (A) Raster plots of an example neuron’s (M79u-U472) responses to (Left) pure tone, (Center) two tone,and (Right) HCTs. (B) Same neuron as shown in A. (Upper) Pure-tone and two-tone response curves. (Lower Right) Firing rate vs. f0 tuning profile for HCTs. (Lower Left)Spectral components of HCTs (y axis: f0; x axis: frequency of individual harmonics) used to test the neuron. Each row represents an HCT, with each dot representing aharmonic in the stimulus. Components in the HCTs corresponding to the two largest peaks in the firing rate vs. f0 curve as shown in Lower Right plot are colored in red.Three vertical black dashed lines indicate BF and the two frequencies corresponding to the two facilitatory peaks in the two-tone response curve as shown inUpper plot.The firing rate curves are derived from the raster plots in A. Error bars represent SD of the mean firing rate. (C) Raster plots of another example neuron’s (M6x-U175)responses to HCTs. (D, Left) Spectral components of HCTs used to test the neuron shown in C. Harmonics of the preferred f0 are colored in red. (D, Right) Firing rate vs. f0curves of the same neuron shown in C. The black curve is the f0 tuning profile when all harmonics were added in cosine (COS) phase. The red curve is the f0 tuningprofile when all harmonics were added in alternating (ALT) phase (i.e., odd harmonics in sine phase, even harmonics in COS phase). (E) Distribution of the FI for all372 neurons tested with HCTs. The vertical dashed line indicates the threshold FI value to identify HTNs (FI = 0.33; corresponding to 100% facilitation).
Feng and Wang PNAS | Published online January 16, 2017 | E841
NEU
ROSC
IENCE
PNASPL
US
vertical dashed lines). The HCT at f0 of 1.26 kHz is slightlymisaligned from the HCT at f0 of 1.05 kHz, resulting in a smallerfiring rate in the f0 tuning profile. These observations suggestthat this neuron is tuned to a particular harmonic template.Another example of a neuron showing harmonic template tun-
ing is shown in Fig. 1 C andD. This neuron did not respond to puretones but was highly selective to HCTs with a Bf0 at 621 Hz (Fig.1C) and was not sensitive to the phases of individual harmonics(Fig. 1D). Because the phases of individual harmonics determinethe temporal envelope of an HCT and envelope modulationdominates the pitch perception of unresolved harmonics, theinsensitivity to the phase of an HCT suggests a representation ofresolved harmonics.The examples described above show that a neuron’s selectivity
to harmonic templates cannot be adequately predicted from itsresponses to pure tones or even two tones. They also suggest thatsome A1 neurons integrate multiple frequency components inHCTs in a nonlinear fashion. The increased firing rate to HCTscannot be explained by the change in overall sound level becauseof the high selectivity to particular HCTs by these neurons. Al-though the overall sound level of an HCT increased mono-tonically with decreasing f0, the firing rate evoked by an HCT didnot change monotonically as shown by the example neuronsin Fig. 1 B and D. We use a facilitation index (FI) to quantifythe difference between the responses to HCTs and pure tones(Materials and Methods) for 372 single neurons recorded fromA1 and R in four hemispheres of three awake marmosets (Fig.1E). FI is defined as ðRHCT −RToneÞ=ðRHCT +RToneÞ. When FI ispositive, it indicates a stronger response to HCTs than puretones. FI equals one if a neuron only responds to HCTs but doesnot respond to pure tones and zero if a neuron has equal responsesto HCTs and pure tones. Fig. 1D shows that a large proportion ofsampled neurons showed response enhancement to HCTs overpure tones (FI > 0), a substantial minority (∼10%) of which onlyresponded to HCTs (FI = 1).Fig. 1D also indicates the diversity in neural responses to
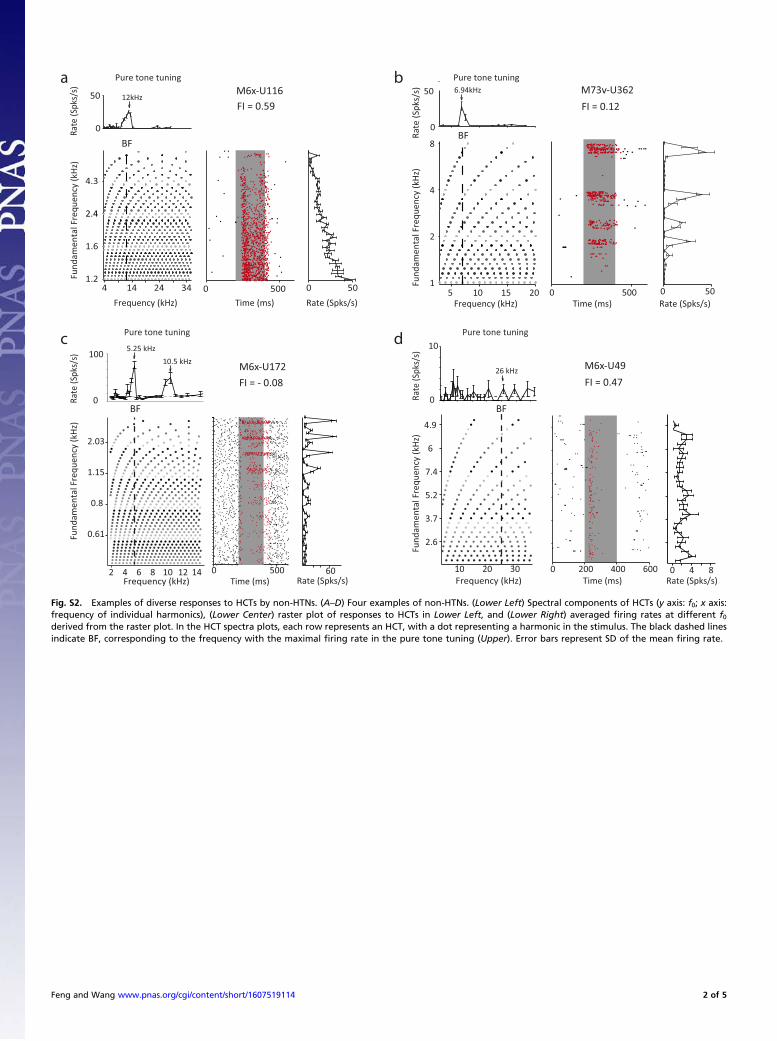
HCTs, with some neurons showing similar or even reduced firingrates compared with pure tones. One such example is shown inFig. S2B (FI = 0.12). This neuron responded to the HCTs only
when the stimuli contained the BF, and its responses decreasedas the f0 decreased, likely because of side-band inhibition evokedby dense spectral components surrounding BF (36). To illustratesuch diversity, we show several more example neurons in Fig. S2.Some neurons showed enhanced responses to HCTs (FI > 0) butweak selectivity to f0 values as shown by the example in Fig. S2A(FI = 0.59). The firing rate decreased monotonically as the f0increased. Because when the f0 of HCTs increases, the number ofharmonics within a neuron’s receptive field decreases, this neu-ron’s response reflects the preference for spectrally dense stimulibut not harmonic structures.We use FI > 0.33 (representing >100% response enhance-
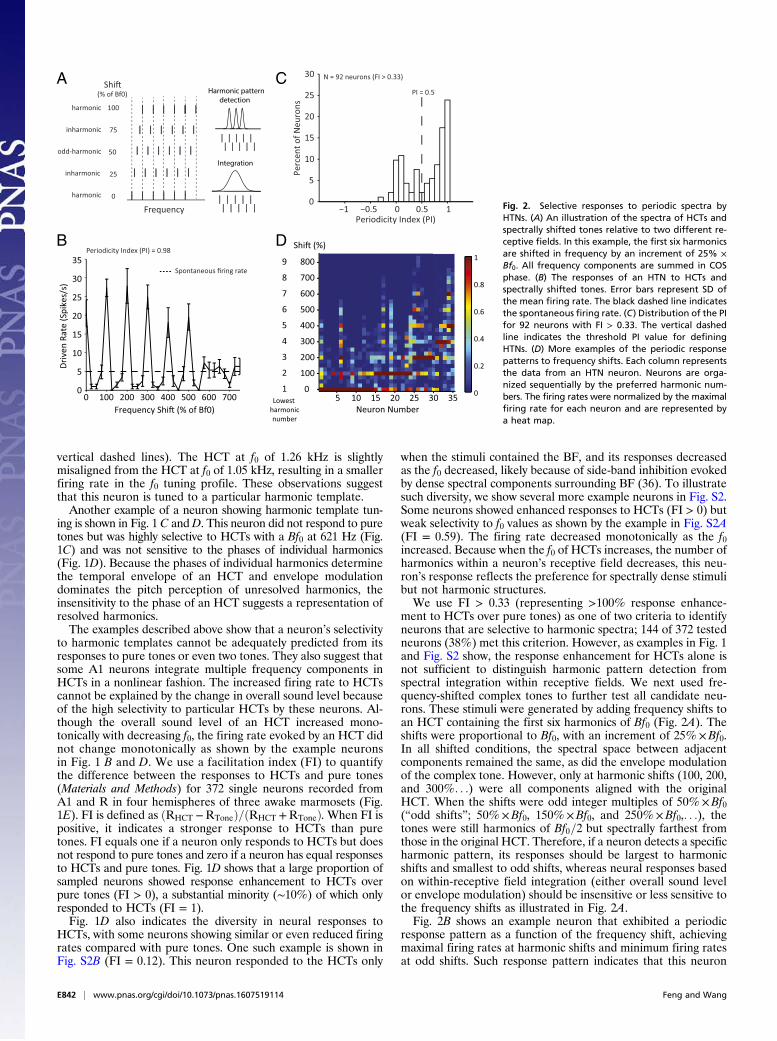
ment to HCTs over pure tones) as one of two criteria to identifyneurons that are selective to harmonic spectra; 144 of 372 testedneurons (38%) met this criterion. However, as examples in Fig. 1and Fig. S2 show, the response enhancement for HCTs alone isnot sufficient to distinguish harmonic pattern detection fromspectral integration within receptive fields. We next used fre-quency-shifted complex tones to further test all candidate neu-rons. These stimuli were generated by adding frequency shifts toan HCT containing the first six harmonics of Bf0 (Fig. 2A). Theshifts were proportional to Bf0, with an increment of 25%×Bf0.In all shifted conditions, the spectral space between adjacentcomponents remained the same, as did the envelope modulationof the complex tone. However, only at harmonic shifts (100, 200,and 300%. . .) were all components aligned with the originalHCT. When the shifts were odd integer multiples of 50%×Bf0(“odd shifts”; 50%×Bf0, 150%×Bf0, and 250%×Bf0,. . .), thetones were still harmonics of Bf0=2 but spectrally farthest fromthose in the original HCT. Therefore, if a neuron detects a specificharmonic pattern, its responses should be largest to harmonicshifts and smallest to odd shifts, whereas neural responses basedon within-receptive field integration (either overall sound levelor envelope modulation) should be insensitive or less sensitive tothe frequency shifts as illustrated in Fig. 2A.Fig. 2B shows an example neuron that exhibited a periodic
response pattern as a function of the frequency shift, achievingmaximal firing rates at harmonic shifts and minimum firing ratesat odd shifts. Such response pattern indicates that this neuron
A
B
C
D
0
25
50
75
100harmonic
harmonic
inharmonic
odd-harmonic
inharmonic
Shi"
Frequency −1 −0.5 0 0.5 10
5
10
15
20
25
30
Periodicity Index (PI)
Perc
ent o
f Neu
rons
N = 92 neurons (FI > 0.33)
PI = 0.5
0 100 200 300 400 500 600 7000
5
10
15
20
25
30
Frequency Shi" (% of Bf0)
Driv
en R
ate
(Spi
kes/
s)
35Spontaneous firing rate
Periodicity Index (PI) = 0.98
Integration
Harmonic pattern detection
5 10 15 20 25 30 35 0
0.2
0.4
0.6
0.8
1
0
100
200
300
400
500
600
700
800
Neuron Number
Shi" (%)
123
456789
Lowest harmonicnumber
(% of Bf0)
Fig. 2. Selective responses to periodic spectra byHTNs. (A) An illustration of the spectra of HCTs andspectrally shifted tones relative to two different re-ceptive fields. In this example, the first six harmonicsare shifted in frequency by an increment of 25% ×Bf0. All frequency components are summed in COSphase. (B) The responses of an HTN to HCTs andspectrally shifted tones. Error bars represent SD ofthe mean firing rate. The black dashed line indicatesthe spontaneous firing rate. (C) Distribution of the PIfor 92 neurons with FI > 0.33. The vertical dashedline indicates the threshold PI value for definingHTNs. (D) More examples of the periodic responsepatterns to frequency shifts. Each column representsthe data from an HTN neuron. Neurons are orga-nized sequentially by the preferred harmonic num-bers. The firing rates were normalized by the maximalfiring rate for each neuron and are represented bya heat map.
E842 | www.pnas.org/cgi/doi/10.1073/pnas.1607519114 Feng and Wang
detects harmonic patterns embedded in the stimuli and that theharmonics in the preferred pattern are resolved. A periodicityindex (PI), defined as the averaged firing rate difference be-tween each harmonic shift and adjacent odd shifts (Materials andMethods), was used to quantify a neuron’s sensitivity to harmonicpatterns. PI equals one if a neuron only responds to harmonicshifts but shows no response to the odd shifts or zero if a neuronresponds equally well to harmonic and odd shifts. The exampleneuron shown in Fig. 2B had a PI of 0.98. Of 144 neurons thathad FI > 0.33, we were able to hold 92 neurons long enough tofurther test their responses to frequency shift stimuli. Fig. 2Cshows the distribution of PI values of these 92 neurons. We usedPI > 0.5 as the second criterion to define a class of neurons thatare facilitated by and selective for harmonic complex sounds; 64of 92 neurons (∼70%) had PI values greater than 0.5 (Fig. 2C).We will hereafter refer to the neurons that met both criteria(FI > 0.33 and PI > 0.5) as “harmonic template neurons”(HTNs). A Venn diagram illustrating the criteria of identifyingHTNs is shown in Fig. S1B. Properties of the neurons that failedto qualify as HTNs will be systematically analyzed and reportedin a separate publication. To contrast properties of HTNs, Fig.S3 shows some example neurons that satisfied the facilitationcriterion (FI > 0.33) but failed to meet the periodicity criterion(PI > 0.5). The neurons shown in Fig. S3 A, C, and D do not showperiodic response patterns to the frequency shift stimuli (PI = 0.09,0.15, and 0.04, respectively), whereas the neuron shown in Fig. S3Bshows a clear but weaker periodic response pattern (PI = 0.44)compared with the example neuron in Fig. 2B (PI = 0.98) that isclassified as an HTN.Thus, for a neuron to qualify as an HTN, it must (i) show
at least 100% response enhancement to HCTs over pure tones(FI > 0.33) and (ii) exhibit a clear periodic pattern to frequency-shifted HCTs (PI > 0.5). We would point out that these two cri-teria are stringent. We chose the threshold values of these twocriteria to ensure that HTNs reflect the detection of harmonicspectral patterns. The number of neurons that qualified as HTNsunder these experimental conditions likely represents an un-derestimate of the neuronal population that functions to detectharmonic spectral patterns in the core region of marmosetauditory cortex. Below, we will further analyze the propertiesof HTNs.
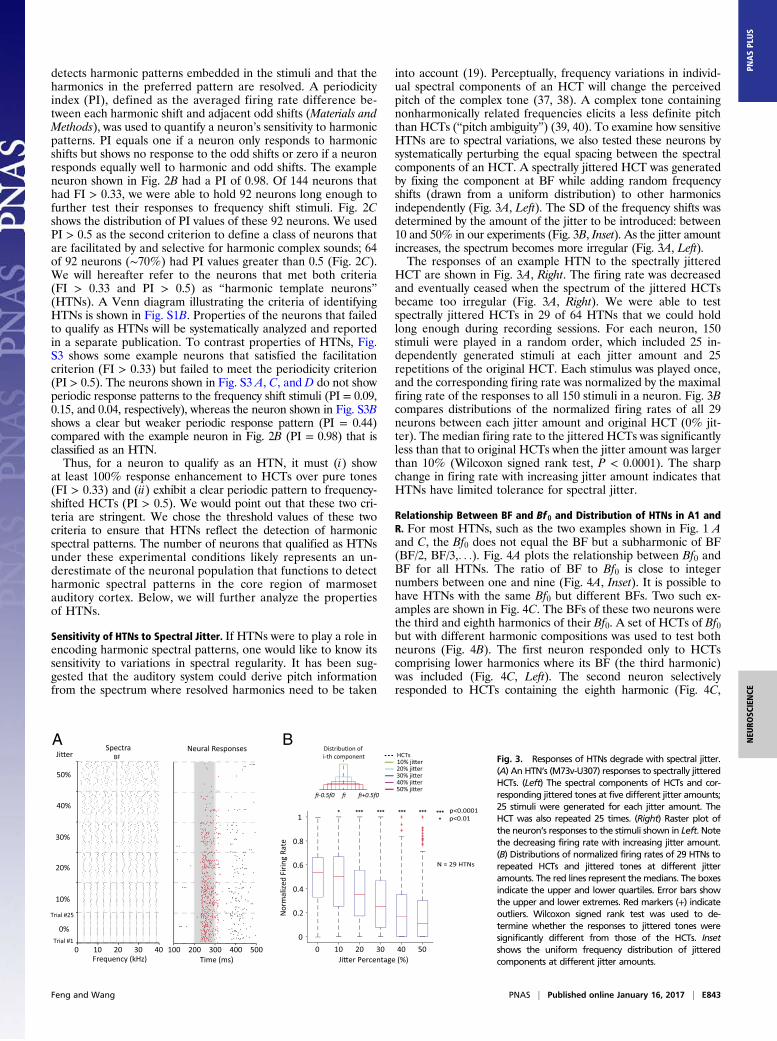
Sensitivity of HTNs to Spectral Jitter. If HTNs were to play a role inencoding harmonic spectral patterns, one would like to know itssensitivity to variations in spectral regularity. It has been sug-gested that the auditory system could derive pitch informationfrom the spectrum where resolved harmonics need to be taken
into account (19). Perceptually, frequency variations in individ-ual spectral components of an HCT will change the perceivedpitch of the complex tone (37, 38). A complex tone containingnonharmonically related frequencies elicits a less definite pitchthan HCTs (“pitch ambiguity”) (39, 40). To examine how sensitiveHTNs are to spectral variations, we also tested these neurons bysystematically perturbing the equal spacing between the spectralcomponents of an HCT. A spectrally jittered HCT was generatedby fixing the component at BF while adding random frequencyshifts (drawn from a uniform distribution) to other harmonicsindependently (Fig. 3A, Left). The SD of the frequency shifts wasdetermined by the amount of the jitter to be introduced: between10 and 50% in our experiments (Fig. 3B, Inset). As the jitter amountincreases, the spectrum becomes more irregular (Fig. 3A, Left).The responses of an example HTN to the spectrally jittered
HCT are shown in Fig. 3A, Right. The firing rate was decreasedand eventually ceased when the spectrum of the jittered HCTsbecame too irregular (Fig. 3A, Right). We were able to testspectrally jittered HCTs in 29 of 64 HTNs that we could holdlong enough during recording sessions. For each neuron, 150stimuli were played in a random order, which included 25 in-dependently generated stimuli at each jitter amount and 25repetitions of the original HCT. Each stimulus was played once,and the corresponding firing rate was normalized by the maximalfiring rate of the responses to all 150 stimuli in a neuron. Fig. 3Bcompares distributions of the normalized firing rates of all 29neurons between each jitter amount and original HCT (0% jit-ter). The median firing rate to the jittered HCTs was significantlyless than that to original HCTs when the jitter amount was largerthan 10% (Wilcoxon signed rank test, P < 0.0001). The sharpchange in firing rate with increasing jitter amount indicates thatHTNs have limited tolerance for spectral jitter.
Relationship Between BF and Bf0 and Distribution of HTNs in A1 andR. For most HTNs, such as the two examples shown in Fig. 1 Aand C, the Bf0 does not equal the BF but a subharmonic of BF(BF/2, BF/3,. . .). Fig. 4A plots the relationship between Bf0 andBF for all HTNs. The ratio of BF to Bf0 is close to integernumbers between one and nine (Fig. 4A, Inset). It is possible tohave HTNs with the same Bf0 but different BFs. Two such ex-amples are shown in Fig. 4C. The BFs of these two neurons werethe third and eighth harmonics of their Bf0. A set of HCTs of Bf0but with different harmonic compositions was used to test bothneurons (Fig. 4B). The first neuron responded only to HCTscomprising lower harmonics where its BF (the third harmonic)was included (Fig. 4C, Left). The second neuron selectivelyresponded to HCTs containing the eighth harmonic (Fig. 4C,
A B
0 10 20 30 40Trial #1
Trial #25
100 200 300 400 500Time (ms)Frequency (kHz)
0%
10%
20%
30%
40%
50%
BF
N = 29 HTNs
Spectra Neural ResponsesJi#er
Ji#er Percentage (%)
0
0.2
0.4
0.6
0.8
1
Norm
alize
d Fi
ring
Rate
0 10 20 30 40 50
p<0.0001p<0.01
fifi-0.5f0 fi+0.5f0
Distribu$on of i-th component HCTs
10% ji#er20% ji#er30% ji#er40% ji#er50% ji#er
Fig. 3. Responses of HTNs degrade with spectral jitter.(A) An HTN’s (M73v-U307) responses to spectrally jitteredHCTs. (Left) The spectral components of HCTs and cor-responding jittered tones at five different jitter amounts;25 stimuli were generated for each jitter amount. TheHCT was also repeated 25 times. (Right) Raster plot ofthe neuron’s responses to the stimuli shown in Left. Notethe decreasing firing rate with increasing jitter amount.(B) Distributions of normalized firing rates of 29 HTNs torepeated HCTs and jittered tones at different jitteramounts. The red lines represent themedians. The boxesindicate the upper and lower quartiles. Error bars showthe upper and lower extremes. Red markers (+) indicateoutliers. Wilcoxon signed rank test was used to de-termine whether the responses to jittered tones weresignificantly different from those of the HCTs. Insetshows the uniform frequency distribution of jitteredcomponents at different jitter amounts.
Feng and Wang PNAS | Published online January 16, 2017 | E843
NEU
ROSC
IENCE
PNASPL
US
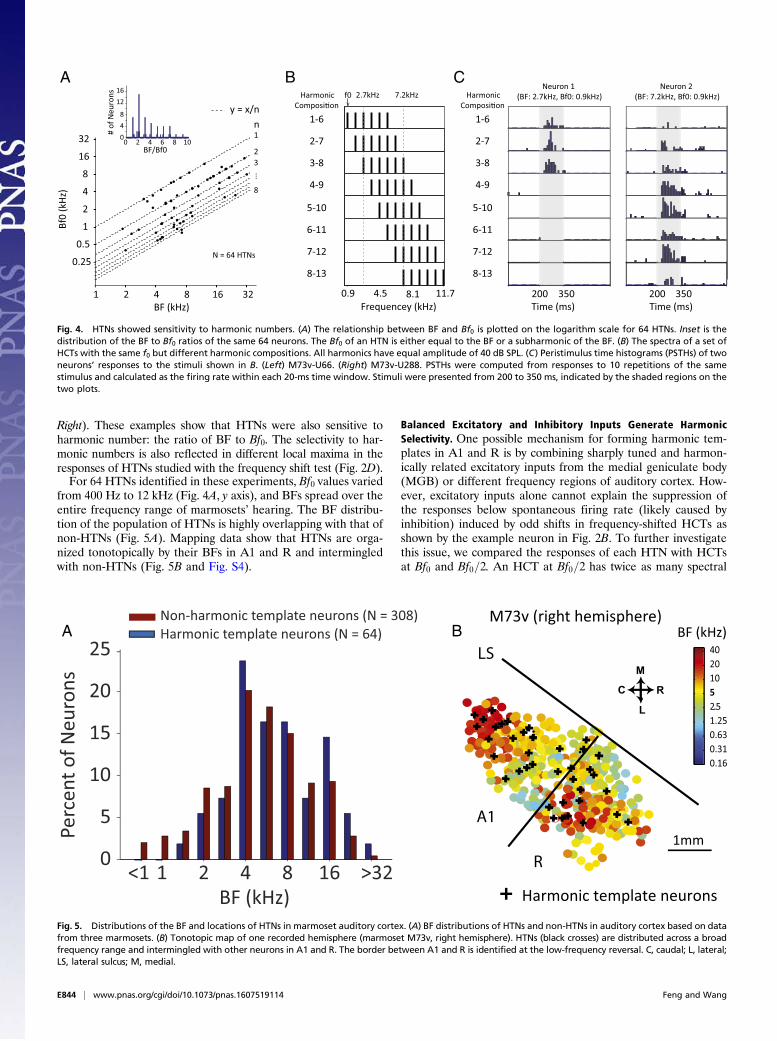
Right). These examples show that HTNs were also sensitive toharmonic number: the ratio of BF to Bf0. The selectivity to har-monic numbers is also reflected in different local maxima in theresponses of HTNs studied with the frequency shift test (Fig. 2D).For 64 HTNs identified in these experiments, Bf0 values varied
from 400 Hz to 12 kHz (Fig. 4A, y axis), and BFs spread over theentire frequency range of marmosets’ hearing. The BF distribu-tion of the population of HTNs is highly overlapping with that ofnon-HTNs (Fig. 5A). Mapping data show that HTNs are orga-nized tonotopically by their BFs in A1 and R and intermingledwith non-HTNs (Fig. 5B and Fig. S4).
Balanced Excitatory and Inhibitory Inputs Generate HarmonicSelectivity. One possible mechanism for forming harmonic tem-plates in A1 and R is by combining sharply tuned and harmon-ically related excitatory inputs from the medial geniculate body(MGB) or different frequency regions of auditory cortex. How-ever, excitatory inputs alone cannot explain the suppression ofthe responses below spontaneous firing rate (likely caused byinhibition) induced by odd shifts in frequency-shifted HCTs asshown by the example neuron in Fig. 2B. To further investigatethis issue, we compared the responses of each HTN with HCTsat Bf0 and Bf0=2. An HCT at Bf0=2 has twice as many spectral
1 2 4 8 16 32
0.250.5
1248
1632
BF (kHz)
Bf0
(kHz
)
0 2 4 6 8 10048
1216
BF/Bf0
# of
Neu
rons
N = 64 HTNs
y = x/n
1
A B Neuron 1 (BF: 2.7kHz, Bf0: 0.9kHz)
0.9 4.5 11.7 200 350 200 350
f0 Harmonic Composi$on
1-6
2-7
3-8
4-9
5-10
6-11
7-12
8-13
Frequencey (kHz) Time (ms) Time (ms)8.1
2.7kHz 7.2kHz
1-6
2-7
3-8
4-9
5-10
6-11
7-12
8-13
Harmonic Composi$on
Neuron 2 (BF: 7.2kHz, Bf0: 0.9kHz)
C
23
...
8
n
Fig. 4. HTNs showed sensitivity to harmonic numbers. (A) The relationship between BF and Bf0 is plotted on the logarithm scale for 64 HTNs. Inset is thedistribution of the BF to Bf0 ratios of the same 64 neurons. The Bf0 of an HTN is either equal to the BF or a subharmonic of the BF. (B) The spectra of a set ofHCTs with the same f0 but different harmonic compositions. All harmonics have equal amplitude of 40 dB SPL. (C) Peristimulus time histograms (PSTHs) of twoneurons’ responses to the stimuli shown in B. (Left) M73v-U66. (Right) M73v-U288. PSTHs were computed from responses to 10 repetitions of the samestimulus and calculated as the firing rate within each 20-ms time window. Stimuli were presented from 200 to 350 ms, indicated by the shaded regions on thetwo plots.
Harmonic template neurons (N = 64)Non-harmonic template neurons (N = 308)
BF (kHz)
Perc
ent o
f Neu
rons
<1 1 2 4 8 16 >320
5
10
15
20
25M73v (right hemisphere)
0.160.310.631.252..55102040
BF (kHz)
1mm
A B
M
L
RC
A1
R
LS
Harmonic template neuronsFig. 5. Distributions of the BF and locations of HTNs in marmoset auditory cortex. (A) BF distributions of HTNs and non-HTNs in auditory cortex based on datafrom three marmosets. (B) Tonotopic map of one recorded hemisphere (marmoset M73v, right hemisphere). HTNs (black crosses) are distributed across a broadfrequency range and intermingled with other neurons in A1 and R. The border between A1 and R is identified at the low-frequency reversal. C, caudal; L, lateral;LS, lateral sulcus; M, medial.
E844 | www.pnas.org/cgi/doi/10.1073/pnas.1607519114 Feng and Wang
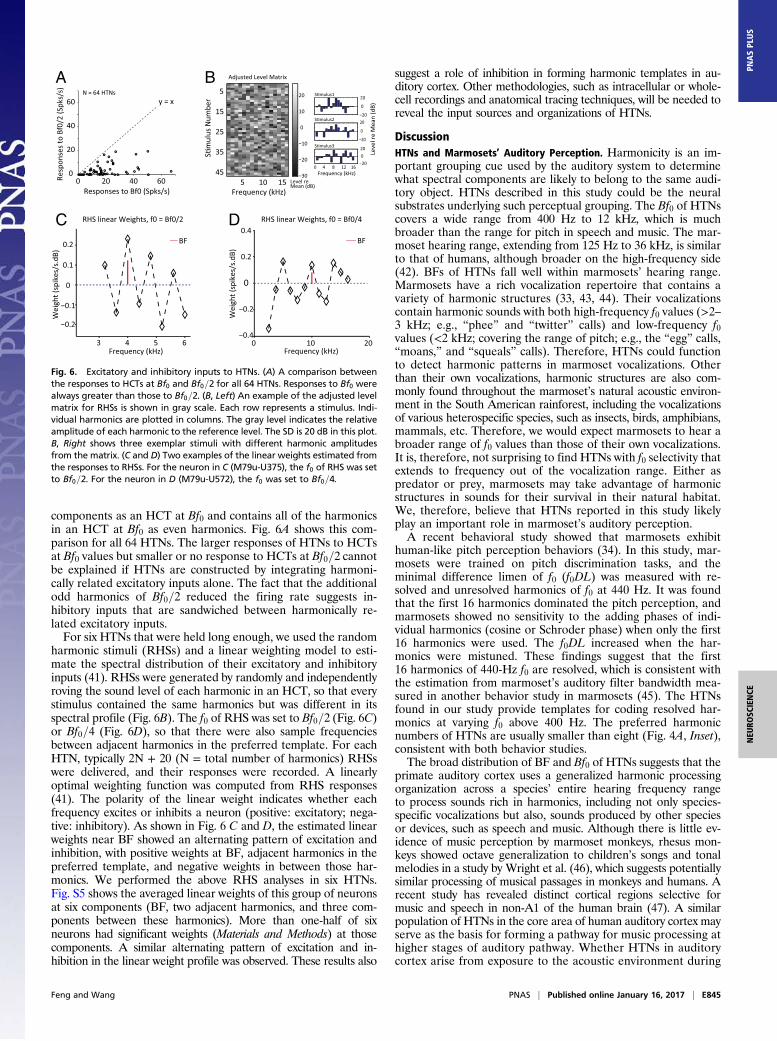
components as an HCT at Bf0 and contains all of the harmonicsin an HCT at Bf0 as even harmonics. Fig. 6A shows this com-parison for all 64 HTNs. The larger responses of HTNs to HCTsat Bf0 values but smaller or no response to HCTs at Bf0=2 cannotbe explained if HTNs are constructed by integrating harmoni-cally related excitatory inputs alone. The fact that the additionalodd harmonics of Bf0=2 reduced the firing rate suggests in-hibitory inputs that are sandwiched between harmonically re-lated excitatory inputs.For six HTNs that were held long enough, we used the random
harmonic stimuli (RHSs) and a linear weighting model to esti-mate the spectral distribution of their excitatory and inhibitoryinputs (41). RHSs were generated by randomly and independentlyroving the sound level of each harmonic in an HCT, so that everystimulus contained the same harmonics but was different in itsspectral profile (Fig. 6B). The f0 of RHS was set to Bf0=2 (Fig. 6C)or Bf0=4 (Fig. 6D), so that there were also sample frequenciesbetween adjacent harmonics in the preferred template. For eachHTN, typically 2N + 20 (N = total number of harmonics) RHSswere delivered, and their responses were recorded. A linearlyoptimal weighting function was computed from RHS responses(41). The polarity of the linear weight indicates whether eachfrequency excites or inhibits a neuron (positive: excitatory; nega-tive: inhibitory). As shown in Fig. 6 C and D, the estimated linearweights near BF showed an alternating pattern of excitation andinhibition, with positive weights at BF, adjacent harmonics in thepreferred template, and negative weights in between those har-monics. We performed the above RHS analyses in six HTNs.Fig. S5 shows the averaged linear weights of this group of neuronsat six components (BF, two adjacent harmonics, and three com-ponents between these harmonics). More than one-half of sixneurons had significant weights (Materials and Methods) at thosecomponents. A similar alternating pattern of excitation and in-hibition in the linear weight profile was observed. These results also
suggest a role of inhibition in forming harmonic templates in au-ditory cortex. Other methodologies, such as intracellular or whole-cell recordings and anatomical tracing techniques, will be needed toreveal the input sources and organizations of HTNs.
DiscussionHTNs and Marmosets’ Auditory Perception. Harmonicity is an im-portant grouping cue used by the auditory system to determinewhat spectral components are likely to belong to the same audi-tory object. HTNs described in this study could be the neuralsubstrates underlying such perceptual grouping. The Bf0 of HTNscovers a wide range from 400 Hz to 12 kHz, which is muchbroader than the range for pitch in speech and music. The mar-moset hearing range, extending from 125 Hz to 36 kHz, is similarto that of humans, although broader on the high-frequency side(42). BFs of HTNs fall well within marmosets’ hearing range.Marmosets have a rich vocalization repertoire that contains avariety of harmonic structures (33, 43, 44). Their vocalizationscontain harmonic sounds with both high-frequency f0 values (>2–3 kHz; e.g., “phee” and “twitter” calls) and low-frequency f0values (<2 kHz; covering the range of pitch; e.g., the “egg” calls,“moans,” and “squeals” calls). Therefore, HTNs could functionto detect harmonic patterns in marmoset vocalizations. Otherthan their own vocalizations, harmonic structures are also com-monly found throughout the marmoset’s natural acoustic environ-ment in the South American rainforest, including the vocalizationsof various heterospecific species, such as insects, birds, amphibians,mammals, etc. Therefore, we would expect marmosets to hear abroader range of f0 values than those of their own vocalizations.It is, therefore, not surprising to find HTNs with f0 selectivity thatextends to frequency out of the vocalization range. Either aspredator or prey, marmosets may take advantage of harmonicstructures in sounds for their survival in their natural habitat.We, therefore, believe that HTNs reported in this study likelyplay an important role in marmoset’s auditory perception.A recent behavioral study showed that marmosets exhibit
human-like pitch perception behaviors (34). In this study, mar-mosets were trained on pitch discrimination tasks, and theminimal difference limen of f0 (f0DL) was measured with re-solved and unresolved harmonics of f0 at 440 Hz. It was foundthat the first 16 harmonics dominated the pitch perception, andmarmosets showed no sensitivity to the adding phases of indi-vidual harmonics (cosine or Schroder phase) when only the first16 harmonics were used. The f0DL increased when the har-monics were mistuned. These findings suggest that the first16 harmonics of 440-Hz f0 are resolved, which is consistent withthe estimation from marmoset’s auditory filter bandwidth mea-sured in another behavior study in marmosets (45). The HTNsfound in our study provide templates for coding resolved har-monics at varying f0 above 400 Hz. The preferred harmonicnumbers of HTNs are usually smaller than eight (Fig. 4A, Inset),consistent with both behavior studies.The broad distribution of BF and Bf0 of HTNs suggests that the
primate auditory cortex uses a generalized harmonic processingorganization across a species’ entire hearing frequency rangeto process sounds rich in harmonics, including not only species-specific vocalizations but also, sounds produced by other speciesor devices, such as speech and music. Although there is little ev-idence of music perception by marmoset monkeys, rhesus mon-keys showed octave generalization to children’s songs and tonalmelodies in a study by Wright et al. (46), which suggests potentiallysimilar processing of musical passages in monkeys and humans. Arecent study has revealed distinct cortical regions selective formusic and speech in non-A1 of the human brain (47). A similarpopulation of HTNs in the core area of human auditory cortex mayserve as the basis for forming a pathway for music processing athigher stages of auditory pathway. Whether HTNs in auditorycortex arise from exposure to the acoustic environment during
0 20 40 600
20
40
60
Responses to Bf0 (Spks/s)
Resp
onse
s to
Bf0/
2 (S
pks/
s)
y = xN = 64 HTNs
3 4 5 6
−0.2
−0.1
0
0.1
0.2
Frequency (kHz)
Wei
ght (
spik
es/s
.dB)
RHS linear Weights, f0 = Bf0/2
BF
0 10 20−0.4
−0.2
0
0.2
0.4
Frequency (kHz)
Wei
ght (
spik
es/s
.dB)
RHS linear Weights, f0 = Bf0/4
BF
Frequency (kHz)
S$m
ulus
Num
ber
Adjusted Level Matrix
5 10 15
5
15
25
35
45 −30
−20
−10
0
10
20
Level reMean (dB)
0 4 8 12 16−20020
Frequency (kHz)
Leve
l re
Mea
n (d
B)
−20
0
20−20
0
20S$mulus1
S$mulus2
S$mulus3
A
C D
B
Fig. 6. Excitatory and inhibitory inputs to HTNs. (A) A comparison betweenthe responses to HCTs at Bf0 and Bf0=2 for all 64 HTNs. Responses to Bf0 werealways greater than those to Bf0=2. (B, Left) An example of the adjusted levelmatrix for RHSs is shown in gray scale. Each row represents a stimulus. Indi-vidual harmonics are plotted in columns. The gray level indicates the relativeamplitude of each harmonic to the reference level. The SD is 20 dB in this plot.B, Right shows three exemplar stimuli with different harmonic amplitudesfrom the matrix. (C and D) Two examples of the linear weights estimated fromthe responses to RHSs. For the neuron in C (M79u-U375), the f0 of RHS was setto Bf0=2. For the neuron in D (M79u-U572), the f0 was set to Bf0=4.
Feng and Wang PNAS | Published online January 16, 2017 | E845
NEU
ROSC
IENCE
PNASPL
US

early development or as a consequence of natural evolution toadapt to the statistics of natural sounds is a fascinating topic foradditional investigations.
HTNs and Pitch-Selective Neurons.An earlier study identified pitch-selective neurons in marmoset auditory cortex (27). A similarlylocated pitch center has also been identified in human auditorycortex (26–29). HTNs found in this study are distinctly differentfrom the pitch-selective neurons in several important ways. First,pitch-selective neurons are localized within a small cortical re-gion (∼1 × 1 mm in size) lateral to the low-frequency borderbetween areas A1 and R (Fig. S1A) (27, 29), whereas HTNs aredistributed across A1 and R (Fig. 5B and Fig. S4). Second, pitch-selective neurons have BFs < 1,000 Hz, whereas HTNs have BFsranging from ∼1 to ∼32 kHz, which covers the entire hearingrange of the marmoset. Third, pitch-selective neurons are re-sponsive to pure tones and tuned to a BF, and they are responsiveto “missing fundamental harmonics” and tuned to a best f0 equalto BF (27, 29). In contrast, not all HTNs respond (or only respondweakly) to pure tones (21 of 64 HTNs had FI of 1.0 and wereunresponsive to pure tones). An HTN typically responds maxi-mally to harmonic complex sounds of a particular f0 with theirspectra covering its BF (or would-be BF). For those HTNs thatare responsive to pure tones and tuned to a BF, the Bf0 is oftennot equal to BF (usually much smaller) (Fig. 4A). Although HTNswere not required to respond to missing fundamental harmonicsby the selection criteria, some of them did respond to HCTs withor without the fundamental component. Fourth, the range of thebest f0 of pitch-selective neurons is below 1,000 Hz, whereas theBf0 of HTNs has a broader distribution (400 Hz to 12 kHz). Fifth,pitch-selective neurons have a preference for low harmonic num-bers, which have greater pitch salience than high harmonic num-bers. HTNs, however, may prefer low or high harmonic numbersdepending on the ratio of BF to Bf0 as shown by the examples inFig. 4C. Therefore, HTNs do not encode pitch per se. They areselective to a particular combination of harmonically spaced fre-quency components (referred to as “harmonic templates”). How-ever, HTNs do share one important characteristic with a subset ofpitch-selective neurons that extract pitch from resolved harmonics:both are sensitive to spectral regularity and show reduced firingrates to spectral jitters (Fig. 3).HTNs can be used to extract pitch information from a par-
ticular harmonic pattern in a template matching manner assuggested by a maximum likelihood model (19). The estimationof f0 from harmonics with such an operation may have a certaindegree of ambiguity as predicted by the model. We also observedsuch ambiguity in the responses of HTNs to HCTs depending onthe tuning width of the frequency receptive fields. As the exampleshow in Fig. 1B, the neuron responded strongly at two different f0values (indicated by red arrows in Fig. 1B), because the preferredtemplate matched either the fourth, fifth, and sixth harmonics ofthe first f0 (1.05 kHz) or the fifth, sixth, and seventh harmonics ofthe second f0 (1.26 kHz). Similar ambiguity in pitch perception wasalso observed in human psychophysics studies (39, 48). Althoughsome HTNs could be precursors of pitch-selective neurons, HTNsseem to represent a larger class of neurons selective for harmonicstructures beyond pitch. The responses of HTNs represent atransformation from coding individual components of complexsounds to coding features (harmonicity in our case) and eventu-ally, form representations of objects in auditory processing, anal-ogous to the transformation from coding of lines to coding ofcurvatures in visual processing. Such an integral representation ofharmonic structures can be used in (but not limited to) pitch ex-traction. Because of their selectivity to harmonic numbers, HTNsalso encode information for extracting timbre, and they could alsobe a preprocessing stage for the coding of complex sounds, such asanimal vocalizations.
Nonlinear Spectral Integration by HTNs. A number of previousstudies have shown nonlinear integration in multipeaked neu-rons and two-tone responses of single-peaked neurons in A1 ofseveral species, including the marmoset (31, 32, 49). There are,however, major differences between HTNs and these previousfindings. Multipeaked neurons can be strongly driven by puretones at its primary BF (31), but HTNs are not necessarily drivenor can only be weakly driven by pure tones. Therefore, HTNsexhibit much greater nonlinearity than previously reported sin-gle-peaked and multipeaked neurons. In addition, the complexspectral tuning property that HTNs exhibit is a reflection of thenonlinear spectral integration, where a combination of puretones evokes maximal responses. Individual components of thiscombination are either suboptimal (evoke weak responses) orsubthreshold (elicit no response). In other words, such complexspectral tuning does not always show as the multiple peaks (evenif the HTN responds to pure tones). Finally, the multipeakedneurons do not necessarily show facilitation to multiple har-monically related pure tones, but HTNs always do by definition.Some single-peaked neurons show nonlinear facilitation whenstimulated by two-tone stimuli (sometimes harmonically related)(31), whereas HTNs by definition always show nonlinear facili-tation when stimulated by harmonic complex sounds. Two-tonestimuli may reveal some harmonic interactions in an HTN but donot reveal the optimal stimulus for an HTN, which is usually acombination of three or more harmonics with a particular f0(example neurons are shown in Fig. 1 B and C). Thus, the uniqueproperties of HTNs are not necessarily predictable from pre-viously reported multipeaked neurons and two-tone responses(31, 32). Of 64 HTNs reported in this study, only 11 showedmultipeak tuning in their pure tone response.The two-tone stimuli are usually based on the pure tone tuning
to decide the fixed frequency of one tone while varying the fre-quency of the second tone. This approach would miss thoseHTNs that do not respond to pure tones at all. Multiple peaks inpure tone tuning do not necessarily imply nonlinear spectralintegration either as indicated by the responses of the neuronshown in Fig. S2C. This neuron responded to any HCT when atleast one harmonic overlaps either of the two peaks in pure tonetuning. The larger peaks appeared when there were componentsnear both peaks in pure tone tuning. There were also smallerpeaks that corresponded to HCTs, which contained only a com-ponent near the second peak. This type of response to HCTs iscloser to a sum of two single-peak neurons shown in Fig. S2B. Bycontrast, HTNs by definition always show nonlinear facilitationwhen stimulated by harmonic complex sounds. However, it ispossible that HTNs receive inputs from such multipeaked neuronsto form their harmonic selectivity.In summary, our findings revealed more complicated and
harmonically structured receptive fields for extracting harmonicpatterns than previous studies. These findings provide directbiological evidence for previously proposed harmonic templatematching models at the single-neuron level for the central pro-cessing of pitch and other harmonic sounds (19, 20). In the pe-ripheral auditory system, single auditory nerve fibers encodeindividual components of harmonic sounds. In contrast, HTNsfound in marmoset auditory cortex can represent combinations ofmultiple harmonics. Such a change in neural representation ofharmonic sounds from auditory nerve fibers to auditory cortexreflects a neural coding principle in sensory systems: neurons inthe later stage of sensory pathway transform the representation ofphysical features, such as frequencies of sounds in hearing or lu-minance of images in vision, into the representation of perceptualfeatures, such as pitch in hearing or curvature in vision, whicheventually lead to the formation of auditory or visual objects (50,51). Such transformations could simplify decoding for purposes ofsound source recognition (52, 53).
E846 | www.pnas.org/cgi/doi/10.1073/pnas.1607519114 Feng and Wang

Distributions of HTNs in Auditory Cortex. We did not find anyfunctional clusters of HTNs among a large number of neuronsrecorded in A1 and R. Instead, HTNs were intermixed withother non-HTNs (Fig. 5B and Fig. S4). They had frequencypreference (BFs) such as their neighboring neurons, except fortheir harmonically structured receptive fields. Those findings areconsistent with previous studies, which did not reveal any func-tional clusters for multipeaked neurons in A1, except in the spe-cialized cortical areas of echo-locating bats (31, 32, 54). Such anorganization is analogous to the coexistence of simple and com-plex cells in primary visual cortex (55). Although we were unableto determine the exact laminar location of each recorded neuronbecause of the limitation of the chronic extracellular recordingmethod, we recorded the depth of each neuron relative to thelocation of the first neuron encountered in each recording track.Fig. S6 shows the depth distributions of both HTNs and non-HTNs studied in these experiments. The majority of neurons inour study were recorded at superficial cortical depths, most likelyin layers II/III (median relative depth: 0.2 mm for HTNs and0.3 mm for non-HTNs). A previous study in awake marmosetsfound a high proportion of combination-selective, nontone-responsive, and low spontaneous-firing neurons at superficial corti-cal depths in A1 (49). A two-photon imaging study showed that A1neurons in layer IV respond more strongly to pure tones thanneurons in upper layers (56). To fully understand the hierarchicalauditory processing of harmonic information, it will be importantto investigate the circuitry basis of HTNs and their connectivity toother neurons in auditory cortex in future studies. It will also beimportant to examine harmonic selectivity in subcortical stations,such as the inferior colliculus (IC) and MGB, to determinewhether the harmonic selectivity shown by HTNs is inherited fromprevious stages or emerges at cortical level, preferably usingsimilar stimulus paradigms used in this study. Hitherto, there hasnot been evidence of HTNs in neural structures below auditorycortex. Kostlan (57) has conducted single-neuron recording ex-periments in the IC of awake marmosets using the same stimuliused in our study and did not find any evidence of HTNs.It will also be interesting to test harmonic selectivity in neu-
rons of higher cortical areas, such as belt and parabelt, whichreceive inputs from A1 and R. Previous studies have shown thatneurons in those areas selectively respond to complex features,such as species-specific vocalizations or narrowband noises (50,58), and typically do not respond well to pure tones. However, arecent multiunit study in macaques showed that responses to puretones in parabelt were comparable with the responses to bandpassnoise (59). How the neurons outside the core region respond toHCTs would provide additional insights into the roles that HTNsplay in processing sounds containing harmonic structures, such asmusic and speech. It has been suggested that neurons in the lateralbelt area of macaque monkeys may process harmonic sounds (60).In light of the observations of harmonically related multipeakfrequency tuning (61) and cortical regions selective for musicsounds (47) in human auditory cortex, one would expect that theharmonic selectivity performed by the HTNs described in thisstudy may form the basis for harmonic processing across primateauditory cortex.
Materials and MethodsNeurophysiology. All experimental procedures were approved by the JohnsHopkins University Animal Use and Care Committee. Singe-unit neural re-cordings were conducted in a double-walled soundproof chamber (IndustrialAcoustics). Single-neuron responses were recorded from four hemispheres ofthreemarmosetmonkeys. Details of the chronic recording preparation can befound in previous publications from our laboratory (62). Marmosets wereadapted to sit quietly in a primate chair with the head immobilized. Atungsten electrode (2–5 MΩ; A-M System) was inserted into the auditorycortex perpendicularly to the surface through a 1-mm craniotomy on theskull. The electrode was manually advanced by a hydraulic microdrive (TrendWells). Each recording session lasted 3–5 h. Animals were awake but were
not required to perform a task during recordings. Spike waveforms werehigh-pass filtered (300 Hz to 3.75 kHz), digitized, and sorted in a template-based online sorting software (MSD; Alpha Omega Engineering). Werecorded neurons from A1 and R. A1 was identified by the tonotopic mapand the frequency reversal at the rostral part dividing A1 and R (Fig. S1A).HTNs were found in both A1 and the R high-frequency region after thefrequency reversal (Fig. 5B and Fig. S4).
Acoustic Stimuli.All acoustic stimuli were generated digitally and delivered bya free-field loudspeaker (Fostex FT-28D or B&W-600S3) 1 m in front of theanimal. All stimuli were sampled at 100 kHz and attenuated to a desiredsound pressure level (SPL) (RX6, PA5; Tucker-Davis Technologies). Tones atdifferent frequencies (1–40 kHz; 10 steps per octave) were typically played ata moderate sound level (between 30 and 60 dB SPL) to measure the fre-quency selectivity. If neurons did not respond, other sound levels (20 and80 dB SPL) were tested. BF was defined as the pure tone frequency thatevoked the maximal firing rate. The threshold of a neuron was estimatedfrom the rate-level function at BF tone (from −10 to 80 dB SPL in steps of10 dB). Threshold was defined as the lowest sound level that evoked a re-sponse significantly larger than spontaneous firing rate (t test, P < 0.05).
Three types of complexes tones were used to study the spectral selectivity:HCTs, spectrally shifted tones, and jittered tones. For all complex tones,individual components were kept at the same sound level and added in cosinephases. The sound intensity per component was initially set to 10 dB abovethe threshold of a tone at the BF. If a neuron did not respond to pure tone, a40-dB SPL sound level per component was used. HCTs at different f0 valueswere generated that contained harmonics within a three-octave frequencyrange centered at BF. For neurons that preferred low-frequency f0 values, asmaller two-octave range was also tested to balance the number of har-monics to high-frequency f0 values. For neurons that did not respond to puretones, BF was estimated from adjacent neurons in the same recording track.Five different jitter amounts (10, 20, 30, 40, and 50%) were used for thejittered tones. Twenty-five stimuli were independently generated for eachjitter amount. The RHSs used here were adapted from random spectrumstimuli (41, 63). Each stimulus consisted of a sum of harmonics of a chosen f0,typically Bf0=2 or Bf0=4, within a three-octave range centered at the BF. In anRHS set, every stimulus differed from every other stimulus in the spectralprofiles, which were determined by the mean sound level and the level SD.The spectral profile was generated by randomly and independently rovingsound level of each harmonic, so that the RHS set as a whole was “white” (i.e.,the stimuli were uncorrelated to each other). The mean sound level, also calledthe reference level, was the level used for HCTs and inharmonic tones. Themost common level SD used was 10 dB. If time permitted, other SDs, like 5, 15,and 20 dB, were also tested. Each RHS set consisted of N + 10 pairs of stimuliwith various spectral profiles, where N is the number of harmonics. The am-plitude levels of the first stimulus in each pair were inverted in the secondstimulus. Additionally, 10 flat spectrum stimuli, in which all harmonics hadequal amplitude, were used to estimate the reference firing rate R0.
Typically, stimuli were 100 ms in duration, with a 500-ms interstimulusinterval (ISI) and 5-ms onset and offset ramps. Longer durations (150, 200, and500 ms) with longer ISIs (>1,000 ms) were used for HCTs at f0 values less than1 kHz. Every stimulus was presented for 10 repetitions in a random orderwith other stimuli.
Data Analysis. Firing rates were calculated over the time window from 15 msafter stimulus onset to 50 ms after stimulus offset. An FI is defined asðRHCT −RToneÞ=ðRHCT +RToneÞ to quantify the response difference betweenHCTs and BF tones, where RHCT is the firing rate to the preferred HCT, andRTone is the firing rate to BF tones. FI is a measure of neural preference tocombinations of tones. FI equals 1 if the neuron only responds to HCTs butdoes not respond to pure tones, 0 if the maximal response to complex tonesis the same as that to pure tones, and −1 if the neuron only responds to puretones but does not respond to complex tones.
A PI is the averaged firing rate difference between harmonic shifts andadjacent odd shifts as defined in Eq. 1:
PI=
PN
i=1
ð2×Rni −Rni+50%−Rni−50%Þ
ð2×Rni +Rni+50%+Rni−50%Þ
N, [1]
where N is the total number of harmonic shifts that evoke a firing rate sig-nificantly larger than spontaneous rate (t test, P < 0.05). R is the firing rate,and ni for Rni is the ith harmonic shift. For example, ni for the example neuronshown in Fig. 2B would be 0, 100, 200, 300, 400, and 500% for i= 1, . . . , 6,respectively. Rni+50% and Rni−50% are responses to the two adjacent odd shifts
Feng and Wang PNAS | Published online January 16, 2017 | E847
NEU
ROSC
IENCE
PNASPL
US

50% up or down from the harmonic shift ni. If a neuron only responds to har-monic shifts but shows no response to the odd shifts, the PI will be one. If aneuron responds equally well to harmonic shifts and odd shifts, the PI will be zero.
The relationship between the firing rate r and the spectral shape of eachstimulus in an RHS set is modeled as the given function:
r=R0 +XN
i=1
wiSi, [2]
where R0 is the reference firing rate estimated from the response to all flatstimuli, Si is the relative decibel level of each harmonic to the reference level,
and wi is the linear weight. The linear weights can be estimated by recordingthe responses to RHSs and solving Eq. 2 by using a least squares method. Tomaximize the ratio of data to model parameters, weights were computedonly for a limited number of harmonics around BF. Those harmonics werechosen by estimating first-order weights over all harmonics but only selectingcontinuous harmonics with significant weights (the absolute value of theweight >1 SD from zero; bootstrapping).
ACKNOWLEDGMENTS. We thank J. Estes and N. Sotuyo for help with animalcare and members of the laboratory of X.W. for their support and feedback.This research was supported by NIH Grant R01DC03180 (to X.W.).
1. Bregman AS (1990) Auditory Scene Analysis (MIT Press, Cambridge, MA).2. Darwin CJ, Carlyon RP (1995) Auditory grouping. Hearing, ed Moore BC (Academic,
London), Vol 2, pp 387–424.3. Houtsma AJM, Smurzynski J (1990) Pitch identification and discrimination for complex
tones with many harmonics. J Acoust Soc Am 87(1):304–310.4. Feng AS, et al. (2006) Ultrasonic communication in frogs. Nature 440(7082):333–336.5. Bates ME, Simmons JA, Zorikov TV (2011) Bats use echo harmonic structure to dis-
tinguish their targets from background clutter. Science 333(6042):627–630.6. de Cheveigné A, McAdams S, Laroche J, Rosenberg M (1995) Identification of con-
current harmonic and inharmonic vowels: A test of the theory of harmonic cancel-lation and enhancement. J Acoust Soc Am 97(6):3736–3748.
7. Deutsch D, Boulanger RC (1984) Octave equivalence and the immediate recall of pitchsequences. Music Percept 2(1):40–51.
8. Borra T, Versnel H, Kemner C, van Opstal AJ, van Ee R (2013) Octave effect in auditoryattention. Proc Natl Acad Sci USA 110(38):15225–15230.
9. McDermott JH, Lehr AJ, Oxenham AJ (2010) Individual differences reveal the basis ofconsonance. Curr Biol 20(11):1035–1041.
10. Krumhansl CL (1990) The Psychological Representation of Musical Pitch in a TonalContext (Oxford Univ Press, London).
11. Malmberg CF (1918) The perception of consonance and dissonance. Psychol Monogr25(2):93–133.
12. Glasberg BR, Moore BC (1990) Derivation of auditory filter shapes from notched-noisedata. Hear Res 47(1-2):103–138.
13. Schwarz DW, Tomlinson RW (1990) Spectral response patterns of auditory cortexneurons to harmonic complex tones in alert monkey (Macaca mulatta). J Neurophysiol64(1):282–298.
14. Fishman YI, Micheyl C, Steinschneider M (2013) Neural representation of harmonic complextones in primary auditory cortex of the awake monkey. J Neurosci 33(25):10312–10323.
15. Fishman YI, Reser DH, Arezzo JC, Steinschneider M (1998) Pitch vs. spectral encodingof harmonic complex tones in primary auditory cortex of the awake monkey. BrainRes 786(1-2):18–30.
16. Kalluri S, Depireux DA, Shamma SA (2008) Perception and cortical neural coding ofharmonic fusion in ferrets. J Acoust Soc Am 123(5):2701–2716.
17. Abeles M, Goldstein MH, Jr (1972) Responses of single units in the primary auditorycortex of the cat to tones and to tone pairs. Brain Res 42(2):337–352.
18. Sadagopan S, Wang X (2008) Level invariant representation of sounds by populationsof neurons in primary auditory cortex. J Neurosci 28(13):3415–3426.
19. Goldstein JL (1973) An optimum processor theory for the central formation of thepitch of complex tones. J Acoust Soc Am 54(6):1496–1516.
20. Cohen MA, Grossberg S, Wyse LL (1995) A spectral network model of pitch percep-tion. J Acoust Soc Am 98(2 Pt 1):862–879.
21. Zatorre RJ (1988) Pitch perception of complex tones and human temporal-lobefunction. J Acoust Soc Am 84(2):566–572.
22. Heffner HE, Heffner RS (1986b) Effect of unilateral and bilateral auditory cortex le-sions on the discrimination of vocalizations by Japanese macaques. J Neurophysiol56(3):683–701.
23. Whitfield IC (1980) Auditory cortex and the pitch of complex tones. J Acoust Soc Am67(2):644–647.
24. Kudoh M, Nakayama Y, Hishida R, Shibuki K (2006) Requirement of the auditoryassociation cortex for discrimination of vowel-like sounds in rats. Neuroreport 17(17):1761–1766.
25. Kaas JH, Hackett TA (2000) Subdivisions of auditory cortex and processing streams inprimates. Proc Natl Acad Sci USA 97(22):11793–11799.
26. Patterson RD, Uppenkamp S, Johnsrude IS, Griffiths TD (2002) The processing oftemporal pitch and melody information in auditory cortex. Neuron 36(4):767–776.
27. Bendor D, Wang X (2005) The neuronal representation of pitch in primate auditorycortex. Nature 436(7054):1161–1165.
28. Penagos H, Melcher JR, Oxenham AJ (2004) A neural representation of pitch saliencein nonprimary human auditory cortex revealed with functional magnetic resonanceimaging. J Neurosci 24(30):6810–6815.
29. Norman-Haignere S, Kanwisher N, McDermott JH (2013) Cortical pitch regions inhumans respond primarily to resolved harmonics and are located in specific tonotopicregions of anterior auditory cortex. J Neurosci 33(50):19451–19469.
30. Qin L, Sakai M, Chimoto S, Sato Y (2005) Interaction of excitatory and inhibitoryfrequency-receptive fields in determining fundamental frequency sensitivity of pri-mary auditory cortex neurons in awake cats. Cereb Cortex 15(9):1371–1383.
31. Kadia SC, Wang X (2003) Spectral integration in A1 of awake primates: Neurons withsingle- and multipeaked tuning characteristics. J Neurophysiol 89(3):1603–1622.
32. Sutter ML, Schreiner CE (1991) Physiology and topography of neurons with multi-peaked tuning curves in cat primary auditory cortex. J Neurophysiol 65(5):1207–1226.
33. Agamaite JA, Chang C-J, Osmanski MS, Wang X (2015) A quantitative acoustic analysisof the vocal repertoire of the common marmoset (Callithrix jacchus). J Acoust Soc Am138(5):2906–2928.
34. Song X, Osmanski MS, Guo Y, Wang X (2016) Complex pitch perception mechanismsare shared by humans and a New World monkey. Proc Natl Acad Sci USA 113(3):781–786.
35. Wang X, Lu T, Snider RK, Liang L (2005) Sustained firing in auditory cortex evoked bypreferred stimuli. Nature 435(7040):341–346.
36. Sadagopan S, Wang X (2010) Contribution of inhibition to stimulus selectivity inprimary auditory cortex of awake primates. J Neurosci 30(21):7314–7325.
37. Dai H (2000) On the relative influence of individual harmonics on pitch judgment.J Acoust Soc Am 107(2):953–959.
38. Moore BC, Peters RW, Glasberg BR (1985) Thresholds for the detection of in-harmonicity in complex tones. J Acoust Soc Am 77(5):1861–1867.
39. Schouten JF, Ritsma RJ, Cardozo BL (1962) Pitch of the residue. J Acoust Soc Am34(9B):1418–1424.
40. De Boer E (1956) Pitch of inharmonic signals. Nature 178(4532):535–536.41. Yu JJ, Young ED (2000) Linear and nonlinear pathways of spectral information
transmission in the cochlear nucleus. Proc Natl Acad Sci USA 97(22):11780–11786.42. Osmanski MS, Wang X (2011) Measurement of absolute auditory thresholds in the
common marmoset (Callithrix jacchus). Hear Res 277(1-2):127–133.43. Bezera BM, Souto A (2008) Structure and usage of the vocal repertoire of Callithrix
jacchus. Int J Primatol 29:671–701.44. Epple G (1968) Comparative studies on vocalization in marmoset monkeys (Hapalidae).
Folia Primatol (Basel) 8(1):1–40.45. Osmanski MS, Song X, Wang X (2013) The role of harmonic resolvability in pitch
perception in a vocal nonhuman primate, the common marmoset (Callithrix jacchus).J Neurosci 33(21):9161–9168.
46. Wright AA, Rivera JJ, Hulse SH, Shyan M, Neiworth JJ (2000) Music perception andoctave generalization in rhesus monkeys. J Exp Psychol Gen 129(3):291–307.
47. Norman-Haignere S, Kanwisher NG, McDermott JH (2015) Distinct cortical pathwaysfor music and speech revealed by hypothesis-free voxel decomposition. Neuron 88(6):1281–1296.
48. Micheyl C, Oxenham AJ (2007) Across-frequency pitch discrimination interferencebetween complex tones containing resolved harmonics. J Acoust Soc Am 121(3):1621–1631.
49. Sadagopan S, Wang X (2009) Nonlinear spectrotemporal interactions underlying se-lectivity for complex sounds in auditory cortex. J Neurosci 29(36):11192–11202.
50. Tian B, Reser D, Durham A, Kustov A, Rauschecker JP (2001) Functional specializationin rhesus monkey auditory cortex. Science 292(5515):290–293.
51. Connor CE, Brincat SL, Pasupathy A (2007) Transformation of shape information inthe ventral pathway. Curr Opin Neurobiol 17(2):140–147.
52. Rolls ET, Treves A (1990) The relative advantages of sparse versus distributed en-coding for associative neuronal networks in the brain. Network 1:407–421.
53. Barlow H (2001) Redundancy reduction revisited. Network 12(3):241–253.54. Suga N, O’Neill WE, Manabe T (1979) Harmonic-sensitive neurons in the auditory
cortex of the mustache bat. Science 203(4377):270–274.55. Hubel DH, Wiesel TN (1962) Receptive fields, binocular interaction and functional
architecture in the cat’s visual cortex. J Physiol 160:106–154.56. Winkowski DE, Kanold PO (2013) Laminar transformation of frequency organization
in auditory cortex. J Neurosci 33(4):1498–1508.57. Kostlan K (2015) Responses to harmonic and mistuned complexes in the awake
marmoset inferior colliculus. Master’s thesis (Johns Hopkins Univ, Baltimore).58. Rauschecker JP, Tian B, Hauser M (1995) Processing of complex sounds in the macaque
nonprimary auditory cortex. Science 268(5207):111–114.59. Kajikawa Y, et al. (2015) Auditory properties in the parabelt regions of the superior
temporal gyrus in the awake macaque monkey: An initial survey. J Neurosci 35(10):4140–4150.
60. Kikuchi Y, Horwitz B, Mishkin M, Rauschecker JP (2014) Processing of harmonics in thelateral belt of macaque auditory cortex. Front Neurosci 8:204.
61. Moerel M, et al. (2013) Processing of natural sounds: Characterization of multipeakspectral tuning in human auditory cortex. J Neurosci 33(29):11888–11898.
62. Lu T, Liang L, Wang X (2001) Neural representations of temporally asymmetric stimuliin the auditory cortex of awake primates. J Neurophysiol 85(6):2364–2380.
63. Barbour DL, Wang X (2003) Auditory cortical responses elicited in awake primates byrandom spectrum stimuli. J Neurosci 23(18):7194–7206.
64. Bendor D, Wang X (2008) Neural response properties of primary, rostral, and ros-trotemporal core fields in the auditory cortex of marmoset monkeys. J Neurophysiol.100(2):888–906.
E848 | www.pnas.org/cgi/doi/10.1073/pnas.1607519114 Feng and Wang

Supporting InformationFeng and Wang 10.1073/pnas.1607519114
M
L
CR
LS
AI
STS
V1
S1M1
MT
RT AILateral Belt
Medial Belt Ventral Bank
Dorsal Bank
LS
STS
Ins
S2PV
Parabelt
Parabelt
(Auditory, Visual)
(Auditory, Visual)
Visual
Lateral Belt
Late
ral B
elt
Medial BeltMedial Belt
High
Low High
High
1mm
R
}Pitch region
Tested HCT vs. Pure tone (n=372)
FI > 0.33 (n=144)
Tested freq-shifted stimuli (n=92)
HTNPI > 0.5 (n=64)
a
b
Fig. S1. (A) A schematic drawing showing the organization of marmoset auditory cortex and the location of pitch region. Adapted from refs. 27 and 64. Inset showsthe location of auditory cortex on the marmoset brain. C, caudal; Ins, insula; L, lateral; LS, lateral sulcus; M, medial; M1, primary motor cortex; MT, middle-temporalarea; PV, parietal ventral area; RT, rostral temporal field; S1, primary somatosensory cortex; STS, superior temporal sulcus; S2, secondary somatosensory cortex. (B) AVenn diagram illustrating the criteria of identifying HTNs. C, caudal; L, lateral; LS, lateral sulcus; M, medial; RT, rostral–temporal.
Feng and Wang www.pnas.org/cgi/content/short/1607519114 1 of 5
BF
0 500Time (ms)
5 10 15 201
2
4
8
Frequency (kHz)
Fund
amen
tal F
requ
ency
(kHz
)
0 50 Rate (Spks/s)
0
50
Rate
(Spk
s/s)
0 500Time (ms)
4 14 24 341.2
1.6
4.3
Frequency (kHz)0 50Rate (Spks/s)
0
50
Rate
(Spk
s/s)
Fund
amen
tal F
requ
ency
(kHz
)a b Pure tone tuningPure tone tuning
0 500Time (ms)
2 4 6 8 10 12 14
0.61
0.8
1.15
2.03
Rate (Spks/s)60
0
100
10 20 30
2.6
3.7
5.2
7.4
6
4.9
0 4 8Rate (Spks/s)
0 200 400 600Time (ms)
0
10
M73v-U362
M6x-U172 M6x-U49FI = 0.47FI = - 0.08
FI = 0.12FI = 0.59
Rate
(Spk
s/s)
Frequency (kHz)
Fund
amen
tal F
requ
ency
(kHz
)
c d
M6x-U116
BF
BF BFRa
te (S
pks/
s)
Frequency (kHz)
Fund
amen
tal F
requ
ency
(kHz
)
12kHz6.94kHz
5.25 kHz10.5 kHz
26 kHz
Pure tone tuningPure tone tuning
Fig. S2. Examples of diverse responses to HCTs by non-HTNs. (A–D) Four examples of non-HTNs. (Lower Left) Spectral components of HCTs (y axis: f0; x axis:frequency of individual harmonics), (Lower Center) raster plot of responses to HCTs in Lower Left, and (Lower Right) averaged firing rates at different f0derived from the raster plot. In the HCT spectra plots, each row represents an HCT, with a dot representing a harmonic in the stimulus. The black dashed linesindicate BF, corresponding to the frequency with the maximal firing rate in the pure tone tuning (Upper). Error bars represent SD of the mean firing rate.
Feng and Wang www.pnas.org/cgi/content/short/1607519114 2 of 5

a b
c d
0 200 400 600 8000
5
10
15
20
25
30
Frequency Shi! (% of f0)
Firin
g Ra
te (S
pks/
s)
Frequency Shi! (% of f0)
Frequency Shi! (% of f0) Frequency Shi! (% of f0)
Firin
g Ra
te (S
pks/
s)
0 100 200 300 400 5000
20
40
60
80
100
120
140
0 200 400 600 800 10000
2
4
6
8
10
12
PI = 0.44
400 600 800 100010
20
30
40
50
60
70
80
Firin
g Ra
te (S
pks/
s)
M6x-U123
M73v-U345
PI = 0.15
PI = 0.09
M6x-U49
M6x-U178
PI = 0.04
Firin
g Ra
te (S
pks/
s)
Spontaneous Firing Rate
Fig. S3. Additional examples of responses to frequency shifts by non-HTNs. (A–D) The responses of non-HTNs to HCTs and spectrally shifted tones. Error barsrepresent SD of the mean firing rate. The black dashed lines indicate the spontaneous firing rate.
Feng and Wang www.pnas.org/cgi/content/short/1607519114 3 of 5

1mm
0.512481632
harmonic template neurons
M73v (le! hemisphere)
LS
M
LCR
A1
0.250.512481632
M79u (le! hemisphere)
1mm
BF (kHz)
a
b
M
LCR
BF (kHz)
LS
A1
R
1mm
LS
A1
c
0.250.512481632
BF (kHz)M
LCR
M6x (le! hemisphere)
R
RFig. S4. Distributions of the BF and locations of HTNs in marmoset A1. (A–C) Additional tonotopic maps of three hemispheres of two marmosets reportedhere. HTNs (black crosses) are distributed across a broad frequency range in A1 and R. C, caudal; L, lateral; LS, lateral sulcus; M, medial.
Feng and Wang www.pnas.org/cgi/content/short/1607519114 4 of 5
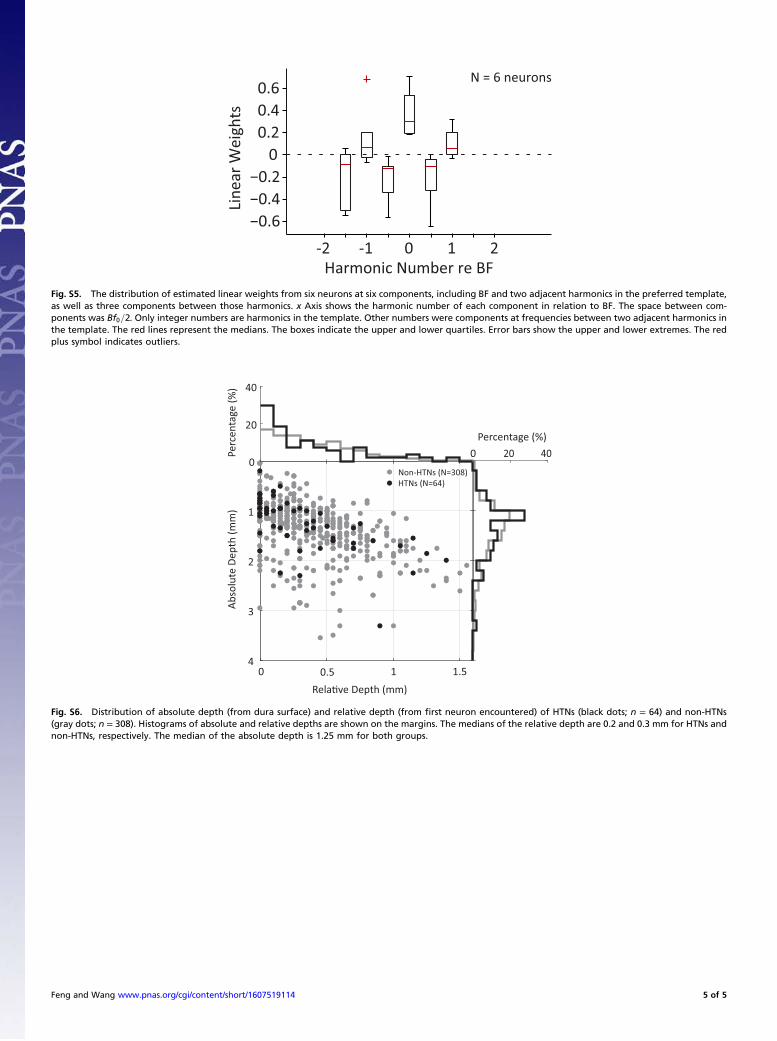
−0.6−0.4−0.2
00.20.40.6
Harmonic Number re BF
Linea
r Wei
ghts
N = 6 neurons
0 1-1-2 2
Fig. S5. The distribution of estimated linear weights from six neurons at six components, including BF and two adjacent harmonics in the preferred template,as well as three components between those harmonics. x Axis shows the harmonic number of each component in relation to BF. The space between com-ponents was Bf0=2. Only integer numbers are harmonics in the template. Other numbers were components at frequencies between two adjacent harmonics inthe template. The red lines represent the medians. The boxes indicate the upper and lower quartiles. Error bars show the upper and lower extremes. The redplus symbol indicates outliers.
4
3
2
1
0Non-HTNs (N=308)HTNs (N=64)
20 40
20
40
Rela#ve Depth (mm)
Abso
lute
Dep
th (m
m)
0 0.5 1.51
Perc
enta
ge (%
)
0Percentage (%)
Fig. S6. Distribution of absolute depth (from dura surface) and relative depth (from first neuron encountered) of HTNs (black dots; n = 64) and non-HTNs(gray dots; n = 308). Histograms of absolute and relative depths are shown on the margins. The medians of the relative depth are 0.2 and 0.3 mm for HTNs andnon-HTNs, respectively. The median of the absolute depth is 1.25 mm for both groups.
Feng and Wang www.pnas.org/cgi/content/short/1607519114 5 of 5