HARISH.G KARVY COMTRADE LTD. INTRODUCTION AGRONOMICAL FEATURES SEASONALITY DEMAND AND SUPPLY...
22
HARISH .G KARVY COMTRADE LTD
-
Upload
noah-atkins -
Category
Documents
-
view
218 -
download
1
Transcript of HARISH.G KARVY COMTRADE LTD. INTRODUCTION AGRONOMICAL FEATURES SEASONALITY DEMAND AND SUPPLY...

HARISH .G
KARVY COMTRADE LTD

INTRODUCTION
AGRONOMICAL FEATURES
SEASONALITY
DEMAND AND SUPPLY ANALYSIS
PRICE ANALYSIS
ARRIVAL PATTERN
FACTORS TO WATCH OUT
PRICE TARGET
AGENDA

“Queen of Spices” - Ginger family Zingiberaceae
Expensive spice after Vanilla and Saffron
Three typical kinds - Malabar, Mysore and Ceylon
Native of India, Sri Lanka and parts of Southeast Asia
Called as a Versatile Spice - Usage in both sweet and salty foods
Auyervedic medicine preparations
INTRODUCTION
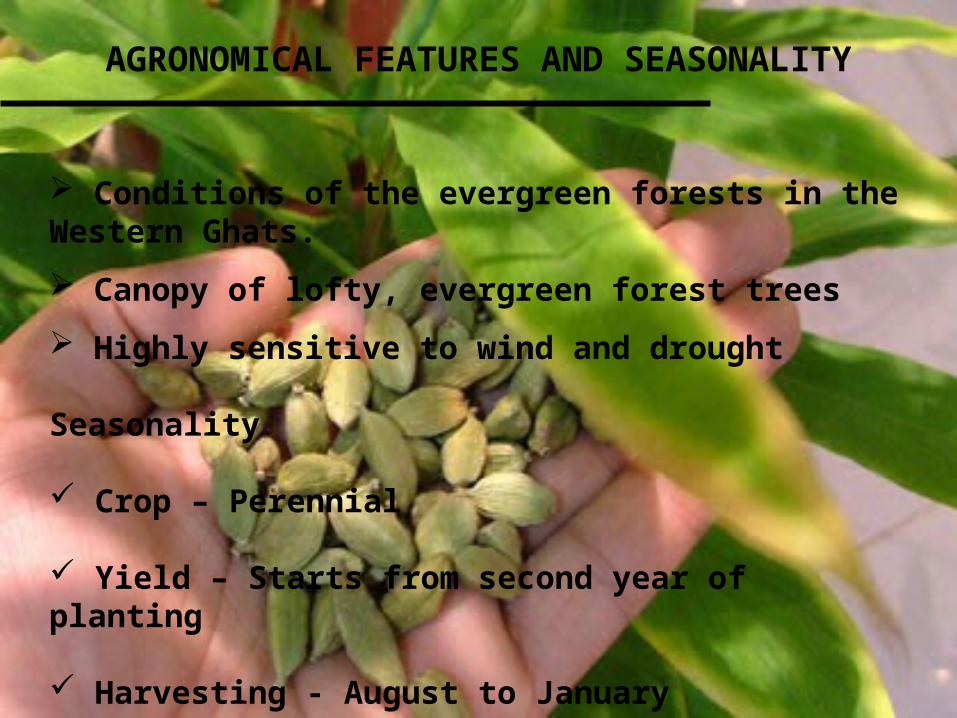
Conditions of the evergreen forests in the Western Ghats.
Canopy of lofty, evergreen forest trees
Highly sensitive to wind and drought
Seasonality
Crop – Perennial
Yield – Starts from second year of planting
Harvesting - August to January
AGRONOMICAL FEATURES AND SEASONALITY

WORLD SCENARIO
World production of cardamom is estimated at 30000 MT
Major producer is Guatemala - An average annual production of 18000 to 20000 MT
India - second largest producer - An average production of 11000 to 12000 MT
Indian cardamom - Superior quality
About 60% of the world production is exported to Arab (South West Asia, North Africa) countries
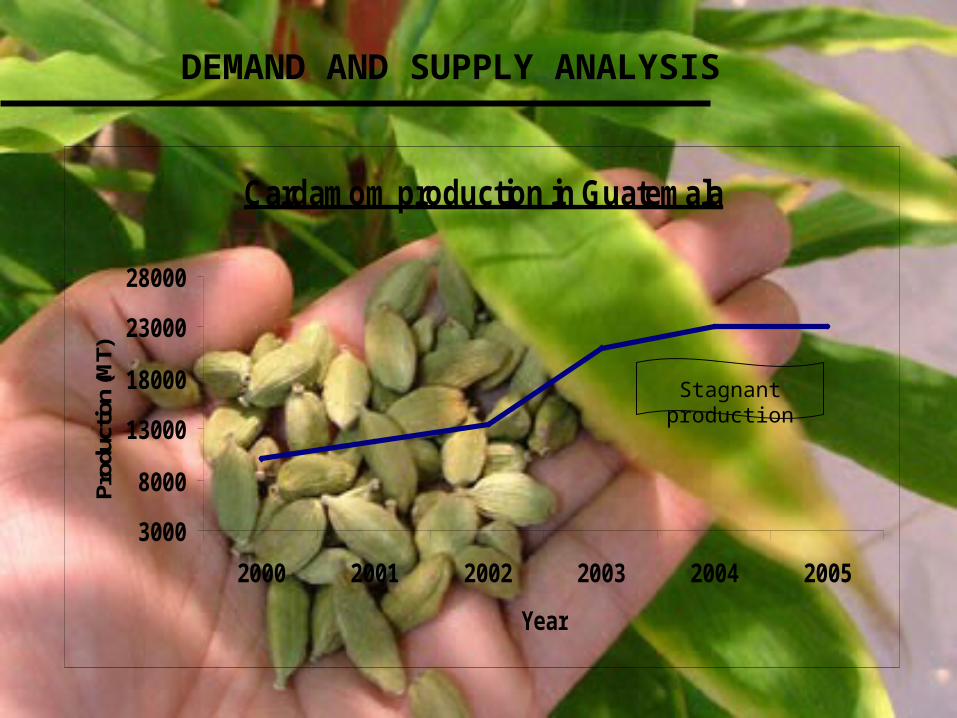
DEMAND AND SUPPLY ANALYSIS
Cardamom production in Guatemala
3000
8000
13000
18000
23000
28000
2000 2001 2002 2003 2004 2005
Year
Prod
uctio
n (M
T)
Stagnant production

DEMAND AND SUPPLY ANALYSIS
Area and Production of Cardamom in India
10000
20000
30000
40000
50000
60000
70000
80000
90000
100000
110000
Area
(ha)
1000
3000
5000
7000
9000
11000
13000
Prod
uctio
n (to
nnes
)
Area (Hects) Production (Tonnes)

DEMAND AND SUPPLY ANALYSIS
Cardamom production in India
500
2500
4500
6500
8500
10500
Production (Tonnes)
Production follows 6-7 year cyclical pattern

DEMAND AND SUPPLY ANALYSIS
Cardamom yield in India
10
60
110
160
210
260
1970
-71
1972
-73
1974
-75
1976
-77
1978
-79
1980
-81
1982
-83
1984
-85
1986
-87
1988
-89
1990
-91
1992
-93
1994
-95
1996
-97
1998
-99
2000
-01
2002
-03
Yiel
d (k
gs/h
a)

DEMAND AND SUPPLY ANALYSIS
Area under Cardamom Percentage share 2005-06
56%37%
7%
Kerala Karnataka Tamil Nadu

DEMAND AND SUPPLY ANALYSIS
Percentage share in cardamom production 2005-06
78%
14%
8%
Kerala Karnataka Tamil Nadu

DEMAND AND SUPPLY ANALYSIS
Exports of cardamom from India
676
1545
1031
650
875
100
300
500
700
900
1100
1300
1500
170019
90-9
1
1991
-92
1992
-93
1993
-94
1994
-95
1995
-96
1996
-97
1997
-98
1998
-99
1999
-00
2000
-01
2001
-02
2002
-03
2003
-04
2004
-05
2005
-06
Exp
ort q
uant
ity (M
T)

DEMAND AND SUPPLY ANALYSIS
Percentage consumption
59%16%
14%
3%3% 5%
West Asia Scandinavia Other EU Countries USA Japan Others

PRICE ANALYSIS
Annual auction prices of Cardamom (small) - Kerala
0
100
200
300
400
500
600
700
1970
-71
1972
-73
1974
-75
1976
-77
1978
-79
1980
-81
1982
-83
1984
-85
1986
-87
1988
-89
1990
-91
1992
-93
1994
-95
1996
-97
1998
-99
2000
-01
2002
-03
2004
-05
Pric
e (R
s/kg
)

PRICE ANALYSIS
Monthly average prices of Cardamom - Kerala
200
220
240
260
280
300
320
340
360
380
Aug Sept Oct Nov Dec Jan Feb Mar Apr May Jun Jul
Pric
e/K
g
2004-05

PRICE ANALYSIS
Annual average prices of cardamom (small) in Middle East
4
6
8
10
12
14
16
18
20
1992
-93
1993
-94
1994
-95
1995
-96
1996
-97
1997
-98
1998
-99
1999
-00
2000
-01
2001
-02
2002
-03
2003
-04
2004
-05
Pri
ce (U
S$/
kg)
India Guatemala

ARRIVAL PATTERN
Harvesting (Picking) pattern in cardamom
Arrivals mainly depends on percentage of picking in the growing regions
August to September – 25% to 30%
September to October – 30% to 35%
October to November – 20% to 25%
December to January – 10%

WORD OF MOUTH
Factors supporting the price rally
This year there is a gap of around 40 to 45 days in harvesting due to dropping (because of rain and wind)
Production is estimated to be lower by 17% this season
Increasing export orders from West Asia
Spurt in domestic demand due to upcoming festivals
Poor quality crop in Guatemala which is the major competitor for Indian cardamom in overseas market.

Daily QMOMc2 [Bar, EMA 10, EMA 20, EMA 50]5/23/2006 - 10/9/2006 (GMT)[Professional]
27 02 08 14 20 26 01 07 13 19 25 31 05 11 18 24 30 05 11 16 22 28 05May 06 Jun 06 Jul 06 Aug 06 Sep 06
PriceINRKg
260
280
320
340
360
380
420
440
460
480
520
540
560
580
620
640
300
400
500
600
QMOMc2, Last Trade, Bar10/5/2006 486.00 499.50 469.50 478.00QMOMc2, Close(Last Trade), EMA 1010/5/2006 543.74QMOMc2, Close(Last Trade), EMA 2010/5/2006 548.60QMOMc2, Close(Last Trade), EMA 5010/5/2006 488.84
TECHNICAL OUTLOOK

Short termThe bearish trend would continue in the short term as it has broken the 50% retracement (support) of 260-667 move. The next support is seen around 400-420 levels.
Medium termPrices are expected to take support around 400 levels and fresh buying can be seen which may push the prices towards t 520-550 then 650 levels.
PRICE TARGET

FACTORS TO BE TAKEN CARE OF…
If rain occurs during October and November in KERALA we can see fall in the prices as rain will boost the production of cardamom.

THANK YOU