Harbor Benthic Monitoring Report: 2011 Results · Harbor Benthic Monitoring Report: 2011 Results...
35
Harbor Benthic Monitoring Report: 2011 Results Massachusetts Water Resources Authority Environmental Quality Department Report 2012-14
Transcript of Harbor Benthic Monitoring Report: 2011 Results · Harbor Benthic Monitoring Report: 2011 Results...

Harbor Benthic Monitoring Report:
2011 Results
Massachusetts Water Resources Authority
Environmental Quality Department
Report 2012-14

Citation:
Pembroke, AE, RJ Diaz, and EC Nestler. 2012. Harbor Benthic Monitoring Report: 2011 Results.
Boston: Massachusetts Water Resources Authority. Report 2012-14. 28 pages.

Harbor Benthic Monitoring Report:
2011 Results
Submitted to
Massachusetts Water Resources Authority
Environmental Quality Department
100 First Avenue
Charleston Navy Yard
Boston, MA 02129
(617) 242-6000
prepared by
Ann E. Pembroke1
Robert J. Diaz2
Eric C. Nestler1
1Normandeau Associates, Inc.
25 Nashua Road
Bedford, NH 30110
2Diaz and Daughters
6198 Driftwood Lane
Ware Neck, VA 23178
December 2012
Report No. 2012-14

2011 Harbor Benthic Monitoring Report December 2012
i
TABLE OF CONTENTS
1. INTRODUCTION .................................................................................................................................................. 1
1.1 BACKGROUND............................................................................................................................................... 1
2. METHODS ............................................................................................................................................................. 1
2.1 FIELD METHODS ........................................................................................................................................... 1 2.2 LABORATORY METHODS .............................................................................................................................. 3 2.3 DATA HANDLING, REDUCTION, AND ANALYSIS ............................................................................................ 3
3. RESULTS AND DISCUSSION ............................................................................................................................. 4
3.1 SEDIMENT CONDITIONS ................................................................................................................................ 4 3.2 BENTHIC INFAUNA ........................................................................................................................................ 8 3.3 SEDIMENT PROFILE IMAGING ...................................................................................................................... 19
4. CONCLUSION ..................................................................................................................................................... 26
5. REFERENCES ..................................................................................................................................................... 27

2011 Harbor Benthic Monitoring Report December 2012
ii
LIST OF FIGURES
Figure 1. Locations of soft-bottom sampling and sediment profile imaging stations for 2011. ..................... 2
Figure 2. 2011 monitoring results for sediment grain size. ............................................................................ 5
Figure 3. Mean percent fine sediments at five stations in Boston Harbor, 1991 to 2011. .............................. 6
Figure 4. Mean concentrations of TOC at five stations in Boston Harbor, 1991 to 2011. ............................. 6
Figure 5. Mean concentrations of Clostridium perfringens at five stations in Boston Harbor, 1991
to 2011. ........................................................................................................................................... 6
Figure 6. Comparison of TOC across four discharge periods at Boston Harbor stations (T01-T08)
from 1992 to 2011 (1991 excluded)................................................................................................ 7
Figure 7. Comparison of Clostridium perfringens across four discharge periods at Boston Harbor
stations (T01-T08) from 1992 to 2011 (1991 excluded). ................................................................ 7
Figure 8. Mean abundance of benthic infauna at eight Boston Harbor stations, 1991-2011. ........................ 9
Figure 9. Total abundance of four dominant taxa at eight Boston Harbor stations, 1991-2011. ................. 10
Figure 10. Mean annual abundance of Ampelisca spp. averaged over eight Boston Harbor stations,
1991-2011. .................................................................................................................................... 11
Figure 11. Spatial distribution of Ampelisca spp. at eight Boston Harbor stations, 2007-2011. .................... 11
Figure 12. Mean species richness at eight Boston harbor stations, 1991-2011. ............................................. 12
Figure 13. Mean community evenness at eight Boston Harbor stations, 1991-2011. .................................... 12
Figure 14. Mean Shannon-Weiner diversity at eight Boston harbor stations, 1991-2011. ............................ 13
Figure 15. Mean log-series alpha diversity at eight Boston Harbor stations, 1991-2011. ............................. 13
Figure 16. Results of (a) cluster analysis and (b) multidimensional scaling analysis of the 2011
infauna samples. ........................................................................................................................... 14
Figure 17. Mean total abundance at Boston Harbor Stations T01 and C019, 1991-2011. ............................. 17
Figure 18. Mean species richness at Boston Harbor Stations T01 and C019, 1991-2011. ............................ 17
Figure 19. Mean Shannon-Weiner diversity at Boston Harbor Stations T01 and C019, 1991-2011. ............ 17
Figure 20. Mean evenness at Boston Harbor Stations T01 and C019, 1991-2011. ........................................ 18
Figure 21. Mean log series alpha diversity at Boston Harbor stations T01 and C019, 1991-2011. ............... 18
Figure 22. Mean abundance of Nephtys cornuta and total community abundance at Station C019,
2004-2011. .................................................................................................................................... 18
Figure 23. Thumbnail SPI images from station T04 located in Dorchester Bay, for baseline (1992-
2000) and post-baseline (2001-present) years. ............................................................................. 21
Figure 24. Thumbnail SPI images from station T02 located in President Roads, for baseline (1991-
2000) and post-baseline (2001-present) years. ............................................................................. 22
Figure 25. Ampelisca spp. tube mat at Station R20 in 2011. ......................................................................... 23
Figure 26. Proportion of SPI stations in Boston Harbor with Ampelisca spp. tubes present at mat
densities (bottom of bar in blue) or as scattered tubes (top of bar in brown) during
baseline (through 2000) and post-baseline (2001-present) surveys. ............................................. 24
Figure 27. Temporal and spatial distribution of Ampelisca spp. tubes at Boston Harbor SPI stations
during baseline (1990-2000) and post-baseline (2001-2011) years. ............................................. 24
Figure 28. High level of bioturbation from the amphipod Leptocheirus pinguis at Station R07 in
2008. ............................................................................................................................................. 25
Figure 29. Eel grass bed at Station R08 in 2011. ........................................................................................... 25

2011 Harbor Benthic Monitoring Report December 2012
iii
LIST OF TABLES
Table 1. 2011 monitoring results for sediment condition parameters. .......................................................... 5
Table 2. 2011 mean infaunal community parameters by station .................................................................. 8
Table 3. Dominant taxa at eight grab stations in Boston Harbor in August 2011. ....................................... 9
Table 4. Mean abundance per sample of dominanta taxa during four discharge periods at eight
Boston Harbor stations (T01-T08), 1992-2011. ............................................................................. 9
Table 5. Mean abundance of dominant taxa in 2011 Boston Harbor station groups defined by
cluster analysis. ............................................................................................................................. 15
Table 6. Benthic community parameters for stations T01-T08, summarized by time periods
defined by Taylor (2006) .............................................................................................................. 19

2011 Harbor Benthic Monitoring Report December 2012
1
1. INTRODUCTION
1.1 Background
Boston Harbor was once considered among the most degraded harbors in the country. Direct discharge of
wastewater with limited treatment into the harbor had affected both water quality and biological
conditions. Both the EPA and the Federal Court prevailed upon the Commonwealth of Massachusetts to
take actions to improve these conditions substantially and the Massachusetts Water Resources Authority
(MWRA) was created in response. In 1985, MWRA initiated a multi-faceted plan to meet these
mandates, most significantly including an upgrade to secondary treatment, elimination of sludge disposal
into the harbor, and relocation of wastewater discharge through an offshore diffuser located 9.3 mi off
Deer Island in Massachusetts Bay. Subsequently, improvements have been made to numerous Combined
Sewer Overflows (CSOs).
MWRA has conducted monitoring in Boston Harbor since 1991 in order to evaluate changes to the
ecosystem, in particular the benthic community, as contaminated discharges have been reduced over time.
This report provides a summary of the results of the benthic surveys that were conducted in 2011. These
include sediment conditions, benthic infauna, and sediment profile imagery. A quantitative evaluation of
the long-term sediment monitoring data collected since 1991 is provided in the 2007 harbor benthic
monitoring report (Maciolek et al. 2008).
2. METHODS
Benthic monitoring in Boston Harbor continued at the same stations that have been surveyed since 1991.
No changes were made to this program in the 2010 revision to the Ambient Monitoring Plan (MWRA
2010). This survey comprises three components: sediment conditions (grain size, total organic carbon,
and Clostridium perfringens), benthic infauna, and sediment profile imaging (SPI).
Methods used to collect, analyze, and evaluate all sample types remain largely consistent with those
reported by Maciolek et al. (2010 and 2011) for previous monitoring years. Detailed descriptions of the
methods are contained in the Quality Assurance Project Plan (QAPP) for Benthic Monitoring 2011–2014
(Nestler et al. 2011). A brief overview of methods, focused on information that is not included in the
QAPP, is provided in Sections 2.1 to 2.3.
2.1 Field Methods
Sediment and infauna sampling was conducted at 9 stations on August 20 and 22, 2011 (Figure 1). Soft-
bottom stations were sampled for grain size composition, total organic carbon (TOC), the sewage tracer
Clostridium perfringens, and benthic infauna.
SPI samples were collected in triplicate at 61 stations on August 16-18, 2011 (Figure 1).

2011 Harbor Benthic Monitoring Report December 2012
2
Figure 1. Locations of soft-bottom sampling and sediment profile imaging stations for 2011.

2011 Harbor Benthic Monitoring Report December 2012
3
2.2 Laboratory Methods
Laboratory methods for benthic infauna and SPI image analyses were consistent with the QAPP (Nestler
et al. 2011) except that all three replicates were analyzed for benthic infauna from each station.
Analytical methods for grain size, TOC, and Clostridium perfringens are described in (Lao et al. 2012).
2.3 Data Handling, Reduction, and Analysis
All benthic data were extracted directly from the HOM database and imported into Excel. Data handling,
reduction, and graphical presentations were performed in Excel or SAS (version 9.2), as described in the
QAPP (Nestler et al. 2011) or in Maciolek et al. (2008). Data are presented graphically as means
(averages per sample) unless otherwise noted. Multivariate analyses were performed using PRIMER v6
(Plymouth Routines in Multivariate Ecological Research) software to examine spatial patterns in the
overall similarity of benthic assemblages in the survey area (Clarke 1993, Warwick 1993, Clarke and
Green 1988). These analyses included classification (cluster analysis) by hierarchical agglomerative
clustering with group average linking and ordination by non-metric multidimensional scaling (MDS).
Bray-Curtis similarity was used as the basis for both classification and ordination. Prior to analyses,
infaunal abundance data were fourth-root transformed to ensure that all taxa, not just the numerical
dominants, would contribute to similarity measures.
Cluster analysis produces a dendrogram that represents discrete groupings of samples along a scale of
similarity. This representation is most useful when delineating among sites with distinct community
structure. MDS ordination produces a plot or “map” in which the distance between samples represents
their rank ordered similarities, with closer proximity in the plot representing higher similarity. Ordination
provides a more useful representation of patterns in community structure when assemblages vary along a
steady gradation of differences among sites. Stress provides a measure of adequacy of the representation
of similarities in the MDS ordination plot (Clarke 1993). Stress levels less than 0.05 indicate an excellent
representation of relative similarities among samples with no prospect of misinterpretation. Stress less
than 0.1 corresponds to a good ordination with no real prospect of a misleading interpretation. Stress less
than 0.2 still provides a potentially useful two-dimensional picture, while stress greater than 0.3 indicates
that points on the plot are close to being arbitrarily placed. Together, cluster analysis and MDS ordination
provide a highly informative representation of patterns of community-level similarity among samples.
The “similarity profile test” (SIMPROF) was used to provide statistical support for the identification of
faunal assemblages (i.e., selection of cluster groups). SIMPROF is a permutation test of the null
hypothesis that the groups identified by cluster analysis (samples included under each node in the
dendrogram) do not differ from each other in multivariate structure.

2011 Harbor Benthic Monitoring Report December 2012
4
3. RESULTS AND DISCUSSION
3.1 Sediment Conditions
Sediment conditions in Boston Harbor were characterized by three parameters measured during 2011 at
each of the nine sampling stations: (1) grain size (gravel, sand, silt, and clay), (2) total organic carbon,
and (3) Clostridium perfringens (Table 1).
Grain Size. Surface sediments at the nine stations sampled during 2011 included a wide range of
sediment types (Table 1, Figure 2). Grain size profiles ranged from predominantly sand (i.e., T08) to
almost entirely silt and clay (i.e., C019 and T04); with most stations having mixed sediments ranging
from silty-sand (i.e., T01, T05A) to sandy-silt (i.e., T03, T07). The grain size composition of the
sediments in 2011 remained consistent with results reported in prior years (Figure 3).
Total Organic Carbon. Concentrations of total organic carbon (TOC) in 2011 also remained similar to
values reported in prior years (Figure 4). Concentrations of TOC track closely to percent fine sediments
(i.e., silt + clay), with higher TOC values generally associated with higher percent fines (Maciolek et al.
2008). A comparison of Figures 3 and 4 illustrates this association. During 2011, the highest
concentrations of TOC were once again reported at stations T04 and C019, two stations with the highest
percent fine sediments. Nonetheless, although these stations have very similar grain size compositions,
TOC concentrations remain higher at T04 than at C019 (Table 1, Figure 4). This station (T04) is located
in a depositional area where contaminants entering Boston Harbor are known to accumulate (Wallace et
al. 1991; Stolzenbach and Adams 1998). As in prior years, the lowest TOC concentrations for 2011 were
reported at station T08.
Clostridium perfringens. Spores of Clostridium perfringens, an anaerobic bacterium found in the
intestinal tract of mammals, provide a sensitive tracer of effluent solids. Abundances of C. perfringens
(normalized to percent fines) during 2011 were highest at station C019 and lowest at station T08 (Table 1,
Figure 5). C. perfringens concentrations at C019 during 2011 were comparable to those reported in 2010,
and below the elevated levels at this station in 2008 and 2009. C. perfringens counts at other Harbor
stations have remained consistently below historical averages since around 1999 (Figure 5).
Taylor (2006) defined time periods related to various changes in MWRA’s management of wastewater
and sludge treatment and discharges. Significant events that had a likelihood of affecting the harbor
benthic community included ending the discharge of sludge in 1991 (end of Period I); opening of the new
primary treatment plant at Deer Island (1995) and its upgrade to secondary treatment between 1997 and
2001 (Period II); implementation of the transfer of wastewater from Nut Island to Deer Island, ending the
Nut Island discharge in 1998 (onset of Period III); and implementation of the offshore outfall in 2000
(onset of Period IV).
Results during 2011 for grain size, TOC, and C. perfringens in Boston Harbor sediments, are consistent
with prior year monitoring results (Maciolek et al. 2008, 2011). Concentrations of both TOC and C.
perfringens at the traditional harbor stations (T01 to T08) have remained lower during the past decade,
than those reported during the 1990s (Figures 6 and 7). These findings are consistent with changes

2011 Harbor Benthic Monitoring Report December 2012
5
documented in the Harbor following improvements to the collection, treatment and disposal of
wastewater as part of the Boston Harbor Project (Maciolek et al. 2008, Taylor 2006).
Table 1. 2011 monitoring results for sediment condition parameters.
Parameter C019 T01 T02 T03 T04 T05A T06 T07 T08
Clostridium perfringens
(cfu/g dry/%fines) 157 61 130 121 115 57 149 141 41
Total Organic Carbon
(%) 3.01 0.84 1.37 2.45 3.75 0.72 1.02 2.11 0.12
Gravel (%) 0 1.6 1.2 1.9 0 1.6 0.8 4.5 0.8
Sand (%) 4.5 68.8 55.8 26.9 4.5 74.0 67.0 30.4 95.3
Silt (%) 60.6 19.6 29.6 47.0 66.0 18.4 21.6 43.3 2.5
Clay (%) 34.9 9.9 13.4 24.2 29.6 6.0 10.6 21.9 1.5
Percent Fines (Silt +
Clay) 95.5 29.5 43.0 71.2 95.5 24.4 32.3 65.2 4.0
Figure 2. 2011 monitoring results for sediment grain size.
GravelSandSiltClay
Perc
ent C
om
positio
n
0
25
50
75
100
C019 T01 T02 T03 T04 T05A T06 T07 T08

2011 Harbor Benthic Monitoring Report December 2012
6
Figure 3. Mean percent fine sediments at five stations in Boston Harbor, 1991 to 2011.
Figure 4. Mean concentrations of TOC at five stations in Boston Harbor, 1991 to 2011.
Figure 5. Mean concentrations of Clostridium perfringens at five stations in Boston Harbor, 1991
to 2011.
Perc
ent
Fin
e S
edim
ents
(S
ilt
+ C
lay)
0
10
20
30
40
50
60
70
80
90
100
1991 1993 1995 1997 1999 2001 2003 2005 2007 2009 2011
T01T02T04T08C019
Tota
l O
rganic
Carb
on (
%)
0
1
2
3
4
5
6
7
8
1991 1993 1995 1997 1999 2001 2003 2005 2007 2009 2011
T01T02T04T08C019
Clo
str
idiu
m p
erf
ringens (
cfu
/g d
ry/%
fines)
0
100
200
300
400
500
600
700
800
900
1000
1100
1991 1993 1995 1997 1999 2001 2003 2005 2007 2009 2011
T01T02T04T08C019

2011 Harbor Benthic Monitoring Report December 2012
7
Figure 6. Comparison of TOC across four discharge periods at Boston Harbor stations (T01-T08)
from 1992 to 2011 (1991 excluded).
Figure 7. Comparison of Clostridium perfringens across four discharge periods at Boston Harbor
stations (T01-T08) from 1992 to 2011 (1991 excluded).
To
tal O
rga
nic
Ca
rbo
n (
%)
1.5
2.0
2.5
3.0
Period I(1991-1992)
Period II(1993-1998)
Period III(1999-2001)
Period IV(2002-2011)
Mean +/- 1StdErr
Clo
str
idiu
m p
erf
rin
ge
ns (
cfu
/g d
ry/%
fin
es)
0
50
100
150
200
250
300
350
400
450
Period I(1991-1992)
Period II(1993-1998)
Period III(1999-2001)
Period IV(2002-2011)
Mean +/- 1StdErr

2011 Harbor Benthic Monitoring Report December 2012
8
3.2 Benthic Infauna
3.2.1 Community Parameters
A total of 50,566 infaunal organisms were counted from the 27 samples in 2011. Organisms were
classified into 165 discrete taxa; 134 of those taxa were species-level identifications, and these species
richness values are consistent with values observed in the harbor in recent years. Abundance values
reported herein reflect the total counts from both species and higher taxonomic groups, while diversity
measures are based on the species-level identifications only (Table 2).
Table 2. 2011 mean infaunal community parameters by station
Station
Total
Abundance
Number of
Species
Pielou's
Evenness
Shannon-
Wiener Log-series
alpha (J') Diversity (H')
C019 442.3 13.7 0.37 1.39 2.71
T01 1416.7 36.3 0.66 3.38 7.13
T02 3817.0 43.0 0.55 2.96 6.82
T03 3465.3 41.0 0.60 3.18 6.59
T04 84.7 5.3 0.35 0.83 1.27
T05A 4794.0 57.0 0.54 3.17 9.34
T06 1462.0 32.3 0.61 3.08 5.89
T07 520.3 16.0 0.66 2.58 3.16
T08 853.0 45.3 0.71 3.91 10.44
Abundance values reported for 2011 were generally lower than in 2010 and were among the lowest
reported since 1991 but were still within the range of abundances observed historically (Figure 8). Most
of the species that dominated the infauna at these stations in 2010 continued to do so in 2011 but at lower
abundances (Table 3). In particular, ampeliscid amphipods and two oligochaete species remained the
most abundant taxa. One change from 2010 was the order-of-magnitude decline in abundance of the
polychaete Phyllodoce mucosa (total abundance of 343 in 2011, compared to 2,142 in 2010). Spatial
patterns of abundance appeared to be consistent with 2010, however, as Stations T02, T03, and T05A
continued to support the highest abundances and T04, T07, and C019 continued to support the lowest
abundances.
Temporally, benthic infauna abundance in the harbor has been controlled by a handful of species
(Table 4). Although these dominants have varied somewhat over the course of the surveys, four taxa
have consistently been among the most abundant organisms. Annual abundances of these species are
presented in Figure 9. Aricidea catherinae and Limnodriloides medioporus have exhibited little
interannual variation in abundance whereas both Polydora cornuta and Ampelisca spp. have exhibited
fluctuations of one to two orders of magnitude. Both of these species reside in the upper substrate layer
so variability could be related to many factors, including changes in organic enrichment, physical forces
such as storm events, and reproductive success in a given year as was described in previous reports
(Maciolek et al. 2006, 2011).

2011 Harbor Benthic Monitoring Report December 2012
9
Figure 8. Mean abundance of benthic infauna at eight Boston Harbor stations, 1991-2011.
Table 3. Dominant taxa at eight grab stations in Boston Harbor in August 2011.
Taxon
Total 2011 Abundance
(compared with 2010)
Ampelisca spp. 15,251 (decrease)
Limnodriloides medioporus 5,717 (decrease)
Tubificoides intermediusa
4,621 (decrease)
Polydora cornuta 3,913 (decrease)
Aricidea catherinae 2,777 (decrease)
Scoletoma hebes 1,954 (decrease)
Nepthys cornuta 1,927 (large decrease)
Tharyx spp. 1,116 (decrease)
Scolelepis bousfieldi 906 (increase)
Streblospio benedicti 872 (slight decrease)
Orchomenella minuta 832 (decrease)
Photis pollex 772 (decrease) a
previously identified as T. apectinatus
Tota
l abundance
0
2000
4000
6000
8000
10000
1991 1993 1995 1997 1999 2001 2003 2005 2007 2009 2011
Mean +/- 1StdErr

2011 Harbor Benthic Monitoring Report December 2012
10
Table 4. Mean abundance per sample of dominanta taxa during four discharge periods at eight
Boston Harbor stations (T01-T08), 1992-2011.
Phylum
Higher
Taxon Family Species
Period
I
Period
II
Period
III
Period
IV 2011
Annelida Polychaeta Capitellidae Capitella capitata
complex 65.2 88.8 3.4 6.3 7.0
Cirratulidae Tharyx acutus 50.6 111.8 52.4 61.9 46.4
Lumbrineridae Scoletoma hebes 3.4 10.5 4.2 47.5 81.4
Nephtyidae Nephtys cornuta - 11.4 10.3 244.8 80.3
Paraonidae Aricidea catherinae 325.0 237.4 204.3 210.6 115.7
Spionidae Polydora cornuta 525.8 1053.0 269.6 261.8 163.0
Streblospio benedicti 236.0 298.6 27.7 53.0 36.3
Annelida Oligochaeta Tubificidae Limnodriloides
medioporus 484.7 297.9 315.2 208.8 238.2
Tubificoides
intermedius
42.6 101.4 231.2 255.0 192.5
Arthropoda Amphipoda Ampeliscidae Ampelisca spp. 354.3 1698.3 1205.9 720.4 635.5
Aoridae Leptocheirus pinguis 29.0 117.4 66.0 103.1 21.5
Corophiidae Corophiidae spp. 16.1 336.2 23.0 1.7 1.3
Crassicorophium
bonellii
7.9 217.3 37.3 9.9 1.1
Isaeidae Photis pollex 11.4 77.0 86.8 42.5 32.2
Phoxocephalidae Phoxocephalus
holbolli
28.0 116.9 125.9 7.9 25.8
aDominants identified as taxa composing 75% of total abundance in each period.
Figure 9. Total abundance of four dominant taxa at eight Boston Harbor stations, 1991-2011.
Tota
l abundance
0
1000
2000
3000
4000
5000
6000
7000
8000
1991 1993 1995 1997 1999 2001 2003 2005 2007 2009 2011
Ampelisca spp.Aricidea catherinaeLimnodriloides medioporusPolydora cornutaTotal abundance

2011 Harbor Benthic Monitoring Report December 2012
11
Patterns of abundance of Ampelisca spp. have been of particular interest throughout the past 21 years that
Stations T01-T08 have been studied. Previous annual reports on the harbor surveys have related changes
in the spatial extent of Ampelisca beds and abundances of individual amphipods to changes in organic
loading (the period from 1991 through about 1999) and storm events and subsequent recruitment (around
2005 through 2009; Maciolek et al. 2006, 2011). Following a period of low abundances, Ampelisca
abundances increased again in 2009 and have remained at moderately high levels since (Figure 10).
Several stations have not exhibited a substantial increase in Ampelisca abundance (Figure 11), however,
and only three stations (T02, T03, and T05A) accounted for most of the change consistently in the last
three years. Each of these stations is located in the vicinity of the main shipping channel.
Figure 10. Mean annual abundance of Ampelisca spp. averaged over eight Boston Harbor stations,
1991-2011.
Figure 11. Spatial distribution of Ampelisca spp. at eight Boston Harbor stations, 2007-2011.
Me
an
ab
un
da
nce
pe
r sa
mp
le
0
500
1000
1500
2000
2500
3000
3500
1991
1992
1993
1994
1995
1996
1997
1998
1999
2000
2001
2002
2003
2004
2005
2006
2007
2008
2009
2010
2011
2007
2008
2009
2010
2011
T01 T02 T03 T04 T05A T06 T07 T08
79 19 544 157 186 100 302
61 55 453 1 641 202 59 117
75 1135 746 2089 1598 160 852
82 3995 2023 1 1103 375 2 68
283 1513 783 2 2180 251 35 37
2011 Harbor Benthic Monitoring Report December 2012
12
The numbers of species reported for 2011 ranged from 5 to 57 per station and averaged around 32 species
per sample, consistent with numbers reported in the mid-1990s and for several years between 1999 and
2007 (Figure 12). The decrease in species richness from the 2008 peak continued a trend that was
observed in 2009 and 2010 (Maciolek et al. 2011). As with abundance, species richness followed the
same spatial patterns observed previously. Stations T05A, T08, and T02 exhibited the highest species
richness and Stations C019, T07, and T04 supported the lowest species richness in both 2010 (Maciolek
et al. 2011) and 2011.
Figure 12. Mean species richness at eight Boston harbor stations, 1991-2011.
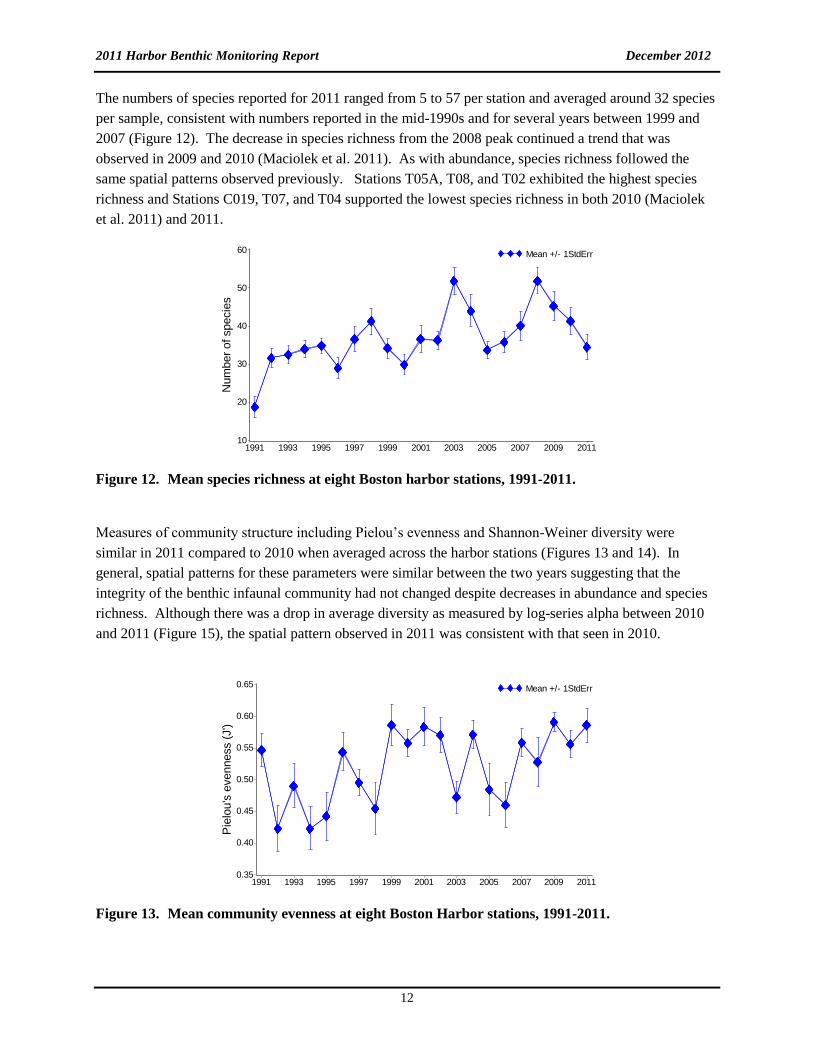
Measures of community structure including Pielou’s evenness and Shannon-Weiner diversity were
similar in 2011 compared to 2010 when averaged across the harbor stations (Figures 13 and 14). In
general, spatial patterns for these parameters were similar between the two years suggesting that the
integrity of the benthic infaunal community had not changed despite decreases in abundance and species
richness. Although there was a drop in average diversity as measured by log-series alpha between 2010
and 2011 (Figure 15), the spatial pattern observed in 2011 was consistent with that seen in 2010.
Figure 13. Mean community evenness at eight Boston Harbor stations, 1991-2011.
Num
ber
of specie
s
10
20
30
40
50
60
1991 1993 1995 1997 1999 2001 2003 2005 2007 2009 2011
Mean +/- 1StdErr
Pie
lou's
evenness (
J')
0.35
0.40
0.45
0.50
0.55
0.60
0.65
1991 1993 1995 1997 1999 2001 2003 2005 2007 2009 2011
Mean +/- 1StdErr

2011 Harbor Benthic Monitoring Report December 2012
13
Figure 14. Mean Shannon-Weiner diversity at eight Boston harbor stations, 1991-2011.
Figure 15. Mean log-series alpha diversity at eight Boston Harbor stations, 1991-2011.
3.2.2 Infaunal Assemblages
Multivariate analyses were used to assess spatial and temporal patterns in the faunal assemblages at the
Boston Harbor sampling stations. Replicates within each station exhibited high similarities in community
structure. One main assemblage was identified in a cluster analysis of the 27 samples from 2011 and
included all replicates from each of 6 stations (T01, T02, T03, T05A, T06, and T08); three stations each
formed their own discrete groups (Figure 16). Average community parameters, including total abundance,
number of species, Shannon-Weiner and log-series alpha diversity, were all notably higher at stations in
the main group than at T04, T07, or C019 (Table 2). The amphipod Ampelisca spp. (comprising A. abdita
and A. vadorum) dominated in the main group, averaging more than double the abundance of the next
most common species and was an important differentiator among the groups (Table 5). Ampelisca spp.
also occurred at Stations T04, T07, and C019 but at more than an order of magnitude lower abundance
than in the main group. Low abundances of Ampelisca spp. at these harbor stations are consistent with
recent patterns (Maciolek et al. 2011). Three species of oligochaetes were among the top dominants but
the majority of the other dominants were polychaetes that have been common among the dominant taxa in
recent years in the harbor. Stations T04 (Dorchester Bay) and C019
Shannon d
ivers
ity (
H')
1.5
2.0
2.5
3.0
3.5
1991 1993 1995 1997 1999 2001 2003 2005 2007 2009 2011
Mean +/- 1StdErr
Log s
eries a
lpha
3
4
5
6
7
8
9
10
1991 1993 1995 1997 1999 2001 2003 2005 2007 2009 2011
Mean +/- 1StdErr

2011 Harbor Benthic Monitoring Report December 2012
14
Figure 16. Results of (a) cluster analysis and (b) multidimensional scaling analysis of the 2011
infauna samples.
T08
T08
T08
T06
T06
T06
T01
T01
T01
T05A
T05A
T05A
T02
T02
T02
T03
T03
T03
T07
T07
T07
C019
C019
C019
T04
T04
T04
100
80
60
40
20
0
Bra
y-C
urt
is S
imilari
ty
a.
b.
Group I

2011 Harbor Benthic Monitoring Report December 2012
15
Table 5. Mean abundance of dominant taxa in 2011 Boston Harbor station groups defined by cluster analysis.
Phylum Major Taxon Family Species Group I T07 C019 T04
Platyhelminthes Turbellaria Turbellaria spp. 0.9 - - 0.7
Mollusca Bivalvia Tellinidae Angulus agilis 13.2 2.7 1.7 0.3
Yoldiidae Yoldia limatula 0.1 - 1.7 -
Annelida Polychaeta Cirratulidae Chaetozone anasimus - - 61.7 -
Chaetozone cf. vivipara 0.1 - 9.7 -
Tharyx acutus 61.2 3.7 5.3 0.3
Tharyx sp. b - - - 1.0
Lumbrineridae Scoletoma hebes 107.6 5.7 - -
Nephtyidae Nephtys cornuta 82.2 142.3 294.0 6.7
Paraonidae Aricidea catherinae 154.2 0.7 - -
Phyllodocidae Eteone heteropoda 0.8 - - 0.3
Spionidae Polydora cornuta 212.2 31.0 2.7 -
Scolelepis bousfieldi 50.3 - 0.7 -
Streblospio benedicti 19.0 106.0 - 70.7
Annelida Oligochaeta Tubificidae Limnodriloides medioporus 304.1 81.3 - -
Tubificoides intermedius 247.8 53.3 1.3 -
Tubificoides sp. 2 4.4 44.7 0.3 3.0
Arthropoda Amphipoda Ampeliscidae Ampelisca spp. 841.2 35.0 13.3 1.3
Aoridae Leptocheirus pinguis 28.6 - 40.3 -
Lysianassidae Orchomenella minuta 46.2 - 2.7 -
Arthropoda Decapoda Crangonidae Crangon septemspinosa 1.1 - 0.7 0.3

2011 Harbor Benthic Monitoring Report December 2012
16
(Inner Harbor) have long had the highest percentage of fine sediments of all harbor stations (see Section
3.1), and differences in the infaunal assemblages at these stations as compared to other harbor stations
were identified and discussed by Maciolek et al. (2008). Maciolek et al. (2011) reported an abrupt decline
in the numbers of taxa at Station T07 (Quincy Bay) from 2009 (32 species) to 2010 (12.7 species) that
could be related to a substantial reduction in the percent fines. Number of taxa remained relatively low in
2011, averaging 16 species per sample although percent fines increased to levels found previously at this
station.
3.2.3 Selected Stations
Station T01. Infaunal community conditions at Station T01, located near Deer Island Flats north of
President Roads, have exemplified conditions at most stations in the Harbor throughout the survey period.
Community parameters in 2011 were generally equal to or higher than the means for Stations T01-T08,
but most of these parameters decreased in 2011 compared to 2010. Mean abundance was slightly lower
in 2011 than from 2006 through 2010, but remained higher than 1999-2000 and 2002-2005 (Figure 17).
Species richness declined to a level below that seen in most years since 1991 (Figure 18), but Shannon-
Weiner diversity (Figure 19) and Pielou’s evenness (Figure 20) remained at or above levels observed
since the mid-1990s, indicating that the substrate at this station continued to support a benthic community
with a varied species composition with relatively even distribution of abundances. Mean log-series alpha
continued to decline at T01, reaching a similar level to that observed in 2006 and years preceding the
divergence.
Station C019. Station C019 was initially included in the Harbor sampling program as part of the
Sediment-Water Exchange (SWEX) study (Gallagher and Keay 1998). When first sampled in 1989, the
benthic infauna consisted of only a few taxa and was overwhelming dominated by two polychaete
species, Streblospio benedicti and Chaetozone setosa. There has been a substantial increase in species
richness during recent years (Figure 18), although the number of taxa present in 2011 declined compared
to the peak in 2010. Mean abundance was also lower in 2011 compared to 2010 (figure 17). Measures of
diversity, however, were all similar to the past several years (Figures 19, 20, and 21). As in 2004 through
2010, Nepthys cornuta continued to represent the majority of the infauna found at Station C019 (Figure
22), accounting for 66.5% of the total abundance. The decrease in the relative contribution of a single
species to the total abundance explains the increase in the evenness and Shannon-Weiner indices.

2011 Harbor Benthic Monitoring Report December 2012
17
Figure 17. Mean total abundance at Boston Harbor Stations T01 and C019, 1991-2011.
Figure 18. Mean species richness at Boston Harbor Stations T01 and C019, 1991-2011.
Figure 19. Mean Shannon-Weiner diversity at Boston Harbor Stations T01 and C019, 1991-2011.
Tota
l abundance
0
1000
2000
3000
4000
5000
6000
7000
8000
1991 1993 1995 1997 1999 2001 2003 2005 2007 2009 2011
T01C019
Num
ber
of specie
s
10
20
30
40
50
60
1991 1993 1995 1997 1999 2001 2003 2005 2007 2009 2011
T01C019
Shannon d
ivers
ity (
H')
0.0
0.5
1.0
1.5
2.0
2.5
3.0
3.5
4.0
4.5
1991 1993 1995 1997 1999 2001 2003 2005 2007 2009 2011
T01C019

2011 Harbor Benthic Monitoring Report December 2012
18
Figure 20. Mean evenness at Boston Harbor Stations T01 and C019, 1991-2011.
Figure 21. Mean log series alpha diversity at Boston Harbor stations T01 and C019, 1991-2011.
Figure 22. Mean abundance of Nephtys cornuta and total community abundance at Station C019,
2004-2011.
Pie
lou's
evenness (
J')
0.0
0.1
0.2
0.3
0.4
0.5
0.6
0.7
0.8
1991 1993 1995 1997 1999 2001 2003 2005 2007 2009 2011
T01C019
Log s
eries a
lpha
0
1
2
3
4
5
6
7
8
9
10
11
1991 1993 1995 1997 1999 2001 2003 2005 2007 2009 2011
T01C019
Tota
l abundance
0
200
400
600
800
1000
1200
1400
2004 2005 2006 2007 2008 2009 2010 2011
Nephtys cornutaTotal abundance

2011 Harbor Benthic Monitoring Report December 2012
19
3.2.4 Trends Over Time
Benthic community parameters for the harbor have exhibited changes since 1991 that correspond well to
the management changes defined by Taylor (2006) and described in Section 3.1 (Table 6). While mean
total abundance has not changed dramatically through these periods, increases in species richness,
evenness, and diversity between Periods I and IV have been notable and the trend in all of these
parameters suggests a response to the reduction in pollutant loading into the harbor. Mean Period IV
values for number of species, Shannon-Weiner diversity, and log-series alpha diversity for 2001-2011
were virtually the same as for 2001-2010 (Maciolek et al. 2011) so it is apparent that this trend has
continued.
Table 6. Benthic community parameters for stations T01-T08, summarized by time periods
defined by Taylor (2006)
Parameter
Period I (1991-
1992) n=47
Period II (1993-
1998) n=144
Period III (1999-
2001) n=70
Period IV (2001-
2011) n=240
Mean Std Err Mean Std Err Mean Std Err Mean Std Err
Total Abundance 2606.4 343.64 5513.4 469 3213.5 492.66 2756.5 163.54
Log-series alpha 4.2 0.31 5.51 0.17 6.16 0.27 7.5 0.21
Shannon-Wiener
Diversity (H')
2.12 0.12 2.41 0.07 2.81 0.09 2.84 0.06
Pielou's Evenness (J') 0.48 0.02 0.47 0.01 0.58 0.02 0.54 0.01
Number of Species 25.45 2.06 34.74 1.14 33.61 1.7 41.51 1.12
3.3 Sediment Profile Imaging
In 2011, soft bottom benthic habitat in Boston Harbor continued to show signs of improvement. Much if
not all of the improvement in benthic habitat quality over the last 20 years can be attributed to upgrades in
wastewater treatment and removal of outfall discharge from within the Harbor (Diaz et al. 2008, Taylor
2010). Improvements continue to be observed at inner Harbor stations, such as those in Dorchester Bay,
for example T04 (Figure 23). Of the eight long-term benthic stations within the Harbor, T04 was the
most impacted by poor benthic habitat conditions. In 1995 and 1998 it appeared that T04 was severely
hypoxic with traces of bacterial mats at the sediment-water-interface in August when the SPI images were
collected (Figure 23). Benthic diversity (H’) for these years was 0.19 in 1995 and 0.03 in 1998. By the
early 2000s T04 had substantially recovered with no signs of hypoxia and H’ diversity consistently >1,
but it continues to have lowest diversity and a species composition that sets it apart from the other benthic
stations (Figure 16). Species known to be favored by high levels of TOC, such as Streblospio benedicti,
are still the dominants at T04 but species indicative of improving sediment conditions, such as Ampelisca
spp., are starting to appear.
The general recovery pattern of inner and mid Harbor stations has closely followed the classic Pearson-
Rosenberg (1978) organic gradient model, which relates community structure and bioturbation rates to the
concentration of organic matter in the sediments. A good example of this recovery sequence is seen at
station T02 in President Roads, near Deer Island Flats (Figure 24). Through the 1990s, the aRPD was

2011 Harbor Benthic Monitoring Report December 2012
20
shallow with a mean of about 1 cm. In the early 2000s the aRPD deepened to about 1.5 cm and by the
late 2000s and early 2010s the aRPD was >4 cm. Sediments appeared lighter in color during the mid-
2000s and the presence of deep-dwelling infauna and biogenic structures increased. As a result, much of
the improvement in benthic habitat quality at T02 was related to increased bioturbation, which burns off
sediment organic matter. Through time there was a decline in TOC at three of the four harbor flux
stations (T03, T07, and T08) from 1995 to 2008 (Tucker et al. 2009). At the fourth flux station, T02,
TOC remained about the same over the same period.
Outer Harbor stations that are more strongly influenced by hydrodynamic factors have always had higher
habitat quality, but also improved after the operation of the ocean outfall. From 1992 to the present there
is strong evidence that benthic habitats within Boston Harbor shifted from a more anaerobic state to a
more aerobic state and that these changes are directly related to changes in carbon loading associated with
outfall placement and improvements in wastewater treatment. There were also corresponding decreases
in primary production due to reduced nutrient loadings (Oviatt et al. 2007).
Much of the recovery in benthic habitat quality can be seen in the dynamics of the tube building
amphipod Ampelisca spp. which can reach very high densities and form thick tube mats (Figure 25).
Over the 20 years of SPI monitoring, biogenic activity associated with the presence of Ampelisca spp. had
the most influence habitat quality. At some time between 1990 and 1992, when the SPI monitoring
started, there was an increase in the occurrence of Ampelisca spp. tube mats (Figure 26). Prior to the
dominance of Ampelisca spp. it appeared that blue mussels and polychaete tube mats were widely
distributed (SAIC 1990, 1992). Amphipod tube mats peaked from 1994 to 1997 potentially in response to
a combination of sediment disturbance from a significant storm event in October 1991 (the “perfect
storm”), cessation of sludge discharge in December 1991, and the onset of new primary treatment plants
at Deer Island in 1995. It is possible that prior to these events either organic or pollutant loading was too
high for Ampelisca spp. to thrive. Life history of Ampelisca spp. reflects a combination of opportunism in
responding to organic matter (McCall 1977) and sensitivity to pollutants (Wolfe et al. 1996). As the
organic and pollutant loading, and also primary production within the Harbor continued to decline, mat
densities of Ampelisca spp. also declined. This started in 1998 and by 2005 no tube mats were observed.
The loss of tube mats in 2005 may also have been associated with a strong storm in late 2004 that
disrupted tube mats. Ampelisca spp. tube mats reappeared 2006 and have increased to levels seen in the
late 1990s (Figure 26). The reappearance of tube mats was at stations with highest occurrences in the past
(Figure 27).
Overall, the improvements in wastewater treatment and moving the outfall offshore have led to
improvements in benthic habitats within Boston Harbor by favoring processes that enhance bioturbation
or the mixing of sediment by organisms. For example, in 2008 and 2009, high levels of bioturbation from
large numbers of the amphipod Leptocheirus pinguis was observed at many stations (Figure 28). An
eelgrass bed has persisted at Station R08 since 2008 (Figure 29).

2011 Harbor Benthic Monitoring Report December 2012
21
(vertical scale on each image = 1 cm increments)
Figure 23. Thumbnail SPI images from station T04 located in Dorchester Bay, for baseline (1992-
2000) and post-baseline (2001-present) years.

2011 Harbor Benthic Monitoring Report December 2012
22
(vertical scale on each image = 1 cm increments)
Figure 24. Thumbnail SPI images from station T02 located in President Roads, for baseline (1991-
2000) and post-baseline (2001-present) years.

2011 Harbor Benthic Monitoring Report December 2012
23
(note: vertical scale on image = 1 cm increments)
Figure 25. Ampelisca spp. tube mat at Station R20 in 2011.

2011 Harbor Benthic Monitoring Report December 2012
24
(Note: no data 1989 and 1991; 1992 represented by two sampling periods in 1992, spring [low
occurrence] and summer [92/8])
Figure 26. Proportion of SPI stations in Boston Harbor with Ampelisca spp. tubes present at mat
densities (bottom of bar in blue) or as scattered tubes (top of bar in brown) during baseline
(through 2000) and post-baseline (2001-present) surveys.
(Note: mat [dark green] is tube mat densities, + [light green] is tubes present, - [pink] is no amphipod tubes present,
blank cell is no data)
Figure 27. Temporal and spatial distribution of Ampelisca spp. tubes at Boston Harbor SPI
stations during baseline (1990-2000) and post-baseline (2001-2011) years.

2011 Harbor Benthic Monitoring Report December 2012
25
(Note: vertical scale on image = 1 cm increments)
Figure 28. High level of bioturbation from the amphipod Leptocheirus pinguis at Station R07 in
2008.
(Note: vertical scale on image = 1 cm increments)
Figure 29. Eelgrass bed at Station R08 in 2011.

2011 Harbor Benthic Monitoring Report December 2012
26
4. CONCLUSION
Physical and biological properties of the soft substrate in Boston Harbor in 2011 were consistent with
trends observed in previous years (Maciolek et al. 2011). Concentrations of both TOC and C.
perfringens, indicators of organic enrichment and deposition from municipal wastewater discharge, have
remained low compared to the levels occurring prior to the offshore diversion. Although abundances of
individual taxa, such as the dominants Ampelisca spp. and Polydora cornuta have varied over time, the
infaunal community structure and evidence from sediment profile imaging suggest that these changes
relate more to normal physical disturbances than organic stress in the years since wastewater impacts to
the Harbor have been reduced. The trends observed in previous years, including reduction of indicators
of organic enrichment and increases in species diversity that continued in the 2011 survey are consistent
with the recovery of benthic habitats from decades of inadequately treated sewage discharges.

2011 Harbor Benthic Monitoring Report December 2012
27
5. REFERENCES
Clarke, K.R. (1993). Non-parametric multivariate analyses of changes in community structure. Aust. J.
Ecol., 18: 117-143.
Clarke, K.R. and R.H. Green (1988). Statistical design and analysis for a ‘biological effects’ study. Mar.
Ecol. Prog. Ser., 46: 213-226.
Diaz, RJ, Rhoads, DC, Blake, JA, Kropp, RK, and Keay, KE. 2008. Long-term trends in benthic habitats
related to reduction in wastewater discharges to Boston Harbor. Estuaries and Coasts 31:118–1197.
Gallagher, E.D. and K.E. Keay. 1998. Organisms-Sediment-Contaminant Interactions in Boston Harbor.
Pp. 89-132 In: Contaminated Sediments in Boston Harbor. K.D. Stolzenbach and EE. Adams (eds.)
Marine Center for Coastal Processes, MIT Sea Grant College Program. Cambridge, MA 02139.
Lao, Y, J Constantino, W Leo, MF Delaney, P Epelman, and S Rhode. 2012. Quality Assurance Project
Plan (QAPP) for Chemistry Analyses for Fish and Shellfish Monitoring, Revision 1 (2012). Boston:
Massachusetts Water Resources Authority. Report 2012-04. 46 pp.
McCall, PL 1977. Community patterns and adaptive strategies of the infaunal benthos of Long Island
Sound. Journal of Marine Research 35:221–266.
Maciolek, NJ, DT Dahlen, and RJ Diaz. 2010. 2009 Boston Harbor Benthic Monitoring Report. Boston:
Massachusetts Water Resources Authority. Report 2010-18. 19 pages + appendices.
Maciolek, NJ, DT Dahlen, and RJ Diaz. 2011. 2010 Boston Harbor Benthic Monitoring Report. Boston:
Massachusetts Water Resources Authority. Report 2011-18. 20 pages + appendix.
Maciolek, NJ, RJ Diaz, DT Dahlen, and IP Williams. 2006. 2005 Boston Harbor Benthic Monitoring
Report. Boston: Massachusetts Water Resources Authority. Report ENQUAD 2006-24. 87 pages +
appendices.
Maciolek, NJ, RJ Diaz, DT Dahlen, and SA Doner. 2008. 2007 Boston Harbor Benthic Monitoring
Report. Boston: Massachusetts Water Resources Authority. Report ENQUAD 2008-22. 77 pages +
appendices.
MWRA. 2010. Ambient monitoring plan for the Massachusetts Water Resoruces Authority effluent
outfall revision 2. July 2010. Boston: Massachusetts Water Resources Authority. Report 2010-04.
107 p.
Nestler, EC, AE Pembroke, and RC Hasevlat. 2011. Quality Assurance Project Plan for Benthic
Monitoring 2011–2014. Boston: Massachusetts Water Resources Authority. Report 2011-07, 90 pp.
plus Appendices.
Oviatt, CA, Hyde, KJW, and Keller, AA. 2007. Production patterns in Massachusetts Bay with outfall
relocation. Estuaries and Coasts 30:35–46.
Pearson, TH and R Rosenberg. 1978. Macrobenthic succession in relation to organic enrichment and
pollution of the marine environment. Oceanography and Marine Biology: an Annual Review 16:229-
311.
SAIC. 1990. REMOTS® sediment-profile photography surveys of Boston Harbor, Dorchester, Quincy,
Hingham, and Hull Bays: June 1989 and May 1990. SAIC Report No. SAIC-90/7578&236. Science
Applications International Corporation, Woods Hole, MA 45 pp.
SAIC. 1992. REMOTS® sediment-profile photography survey of Boston Harbor, Dorchester, Quincy,
Hingham, and Hull Bays: May 1992. SAIC Report No. 266. Science Applications International
Corporation, Newport, RI. 20 pp.

2011 Harbor Benthic Monitoring Report December 2012
28
Stolzenbach, K.D. and E.E. Adams. 1998. Contaminated Sediments in Boston Harbor. MIT Sea Grant
Publication 98 1, MIT Sea Grant College Program. Cambridge, MA. 170 pp.
Taylor, D.I. 2006. Update of patterns of wastewater, river, and non-point source loadings to Boston
Harbor (1990-2005). Boston: Massachusetts Water Resources Authority. Report 2006-22. 77pp.
Taylor, DI. 2010. The Boston Harbor Project, and large decreases in loadings of eutrophication-related
materials to Boston Harbor. Marine Pollution Bulletin 60:609–619.
Tucker J, Kelsey S, and Giblin A. 2009. 2008 Annual benthic nutrient flux monitoring summary report.
Boston: Massachusetts Water Resources Authority. Report ENQUAD 2009-08. 32 p.
Wallace, G.T., C. Krahfrost, L. Pitts, M. Studer, and C. Bollinger. 1991. Assessment of the chemical
composition of the Fox Point CSO effluent and associated subtidal and intertidal environments:
Analysis of CSO effluent and surficial sediments for trace metals prior to CSO modification. Final
report to the Massachusetts Department of Environmental Protection, Office of Research and
Standards.
Warwick, R.M. (1993). Environmental impact studies on marine communities: pragmatical
considerations. Aust. J. Ecol., 18: 63-80
Wolfe, DA, ER Long, and GB Thursby. 1996. Sediment toxicity in the Hudson-Raritan Estuary:
Distribution and correlations with chemical contamination. Estuaries 19:901–912.

Massachusetts Water Resources Authority
Charlestown Navy Yard
100 First Avenue
Boston, MA 02129
(617) 242-6000
http://www.mwra.state.ma.us