Happy Customers and More Homes - Housing Solutions · PDF fileHappy Customers and More Homes...
49
Annual Report and Accounts for the year ended 31 March 2015 Happy Customers and More Homes Co-Operative and Community Benefit Societies No. 27876R
-
Upload
dinhkhuong -
Category
Documents
-
view
218 -
download
2
Transcript of Happy Customers and More Homes - Housing Solutions · PDF fileHappy Customers and More Homes...
Annual Report and Accounts for the year ended 31 March 2015
Happy Customers and More Homes
Co-Operative and Community Benefit Societies No. 27876R

HOUSING SOLUTIONS LIMITED
OWNERSHIP – each of us takes responsibility and will respond to an enquiry, issue or situation to ensure a satisfactory outcome.
INNOVATION – we will understand, value and nurture new ideas and use creative thinking, passion, energy and enthusiasm to achieve practical results.
TEAMWORK – we value each person and their job as much as we value our own. We welcome different points of view and will work co-operatively in teams and across teams to achieve more together than we could alone.
INCLUSION – our relationships with each other, residents and stakeholders are based on trust and respect and we ensure that everyone is able to fully participate in our services and organisation.
The Housing Solutions Group Housing Solutions is a registered housing provider with charitable status dedicated to providing affordable and supported homes. We have a housing stock of over 5,000 properties in the South East of England. We offer affordable homes to rent, shared ownership schemes, key worker housing and specialist accommodation for older people and people who need support and care to live within the community. All our homes are supported by a range of housing services, including our own professional team of maintenance staff who provide a comprehensive repair and maintenance service.
There are two subsidiaries within the Group. They are: Housing Solutions Capital is a PLC set up to facilitate capital market funding for the Group. It was incorporated on the 6 July 2012. HSG Property Services Limited provides photo voltaic panels on residents’ roofs and other energy saving solutions in order to save utility costs for those residents and at the same time produce revenue for the group through the Feed In Tariff programme.
Our core purpose is to understand and effectively meet local affordable housing needs by involving our residents and working closely with local authority partners to deliver responsive, value for money services and homes
Housing Solutions
CAPITAL PLC

HOUSING SOLUTIONS LIMITED
CONTENTS Members, Executives and Advisers 2
Operating and Financial Review and Report of the Board 3 -19
Independent Auditor’s Report 20
Income and Expenditure Accounts 21
Statement of Total Recognised Surpluses and Deficits 22
Balance Sheets 23-24
Consolidated Cash Flow Statement 25
Notes to the Accounts 26-47

HOUSING SOLUTIONS LIMITED
2
Members, Executives and Advisers BOARD OF MANAGEMENT CHAIRMAN Roger Mabey (resigned September 2014)
Nigel cook (Independent - appointed September 2014) VICE CHAIRMAN Mark Pullen (Independent) BOARD MEMBERS Paul Dunn Sims (Independent – resigned February 2014)
Deirdre Moroney (Independent – resigned September 2014) Hayley Peters (Independent) Derek Wilson (Council nominee) Val Bagnall (Independent) Alice McDonagh (Resident nominee) Taslim Gbaja-Biamila (Resident nominee – appointed 4 December 2013)
John Petitt (Chief Executive) Jim McGill (Independent) EXECUTIVE TEAM GROUP CHIEF EXECUTIVE John Petitt GROUP DIRECTOR OF RESOURCES Andrew Robertson GROUP BUSINESS DEVELOPMENT DIRECTOR
Jill Caress
GROUP DIRECTOR OF CUSTOMER SERVICES GROUP COMMERCIAL DIRECTOR
Peter Hatch John Barnes
The Executive Team hold no interest in the association’s shares and act within the authority delegated by the Board. AUDITORS SOLICITORS Grant Thornton UK LLP Grant Thornton House Melton Street Euston Square London NW1 2EP
Owen White Senate House 62-70 Bath Road Slough SL1 3SR
Lewis Silkin 5 Chancery Lane Cliffords Inn London EC4A 1BL
Penningtons Solicitors LLP da Vinci House Basing View Basingstoke Hampshire RG21 4EQ
Mills and Bann Solicitors 8 Cheap Street Newbury Berkshire RG14 5DD
Trowers & Hamlins LLP3 Bunhill Row London EC1Y 8YZ
FUNDERS Barclays Bank PLC 1 Churchill Place Canary Wharf London E14 5HP
Lloyds TSB PLC 25 Gresham Street London EC2V 7HN
M & G Limited Laurence Poutney Hill London EC4R 0HH
Legal & General Investment ManOne Coleman Street London EC2R 5AA
TREASURY ADVISORS VALUERS Canaccord Genuity Limited 88 Wood Street, London, EC2V 7QR
Jones Lang LaSalle 22 Hanover Square London W1S 1JA
Registered with the Homes and Communities Agency (HCA) Reg No. L4073 Registered as 0061 Co-Operative and Community Benefit Societies Reg No. 27876R Registered Office, Crown House, Crown Square, Waldeck Road, Maidenhead, Berkshire SL6 8BY

HOUSING SOLUTIONS LIMITED
3
OPERATING AND FINANCIAL REVIEW AND REPORT OF THE BOARD FOR THE YEAR ENDED 31 MARCH 2015 REPORT OF THE BOARD The board of Housing Solutions Limited presents its report together with the audited financial statements of Housing Solutions Limited (the association) and Housing Solutions Group (the group) for the year ended 31 March 2015.
The group comprises the association and its subsidiary undertakings Housing Solutions Capital plc and HSG Property Services Limited.
PRINCIPAL ACTIVITIES The group’s principal activities are the development and management of affordable housing and residential care homes and providing repairs services to its own stock as well as external clients.
The group’s head office is in Maidenhead and its properties are primarily in Maidenhead and surrounding areas, although increasingly new properties are being built in Wokingham and Buckinghamshire.
The association has charitable status and operates four key business streams:
housing for rent, primarily for families who are unable to rent or buy at open market rates;
supported housing and care homes for people who need additional housing-related support or additional care;
low-cost home ownership, primarily shared ownership whereby residents purchase a share in the equity of their home and pay rent to the association on the remainder;
maintenance services for external clients including other registered providers.
As well as managing over 5,000 properties, the group develops new affordable housing and is a member of the Sovereign Development Consortium (SDC).
The group also provides a small amount of non-social housing, in particular market rent accommodation.
However, the group’s focus remains its social housing activities and these are expected to constitute over 80 per cent of the group’s activities by turnover.
BOARD MEMBERS AND EXECUTIVE DIRECTORS
The present board members and executive directors of the group are set out on page 2.
The executive directors are the Chief Executive, the Group Director of Resources; the Group Director of Customer Services; the Group Business Development
Director and the Group Commercial Director. Of the executive directors only the Chief Executive is a member of the board. All executives work within the authority delegated by the board. Group insurance policies indemnify board members and officers against liability when acting for the group.
EMPLOYMENT CONTRACTS
Excluding the Chief Executive, board members are paid based on a scale reflecting their relative responsibilities to the group. The total amount paid to board members during 2014/15 was £45,819 which represents 0.1 per cent of the group’s turnover.
The executive directors are employed on the same terms as other staff, their notice periods ranging from six to twelve months.
PENSIONS The executive directors are entitled to be members of the Royal County of Berkshire Pension Fund, a defined benefit (Career Average) pension scheme. They participate in the scheme on the same terms as all other eligible staff and the group contributes to the scheme on behalf of its employees. With effect from 1st April 2014 the Royal County of Berkshire Pension Scheme was closed to new employees and a new Group Personal Pension Plan has been set up for new employees. The Executive Directors may participate in this scheme on the same terms as all other eligible staff and Housing Solutions make contributions into the Individual Personal Pensions.
POST BALANCE SHEET BUDGET EFFECT
The budget announcement on July 8th included proposed changes in the rent charging regulations applicable to all registered Housing Associations. The main change proposed a reduction in social housing general needs rents by 1% each year for the 4 years commencing April 1st 2016. Previously the formula had been increases linked to CPI + 1% margin. The effect this has on HSL is twofold – firstly, it may reduce our margins going forward and secondly, it may reduce the accounts valuation of our assets which is used for gearing covenant calculation. In respect of our margins, we have had a strong ratio of operating surplus to turnover, and we also have a mix of non-general needs properties such as Shared Ownership which are not affected by the rent reductions. We have modelled the effects and there will be no breach of our interest cover covenant in the near future. In respect of the valuation issue, we have commissioned an independent valuation update from Jones Lang LaSalle Ltd which indicates we will remain within our gearing covenant over at least the next three years. We also have adequate security to be able to meet our asset cover covenants especially since the security valuations are higher than the accounts valuations due to mortgagee in possession clauses.
.

HOUSING SOLUTIONS LIMITED
4
OPERATING AND FINANCIAL REVIEW AND REPORT OF THE BOARD FOR THE YEAR ENDED 31 MARCH 2015
OBJECTIVES AND STRATEGY
The Group’s objectives and strategy are set out in a business plan that is reviewed and approved by the Board each year. The Executive Team and the Board monitor achievement of the Group’s objectives by measuring performance against targets. The Board agrees targets each year that are designed to manage development and deliver continuous improvement and value for money.
Last year we launched a new six-year strategy – Twenty Twenty Vision. This focuses our activities on two clear objectives – to achieve Happy Customers and build More Homes.
The Group’s key strategic objectives and their outcomes are summarised below and on the next page
CORPORATE OBJECTIVES
HAPPY CUSTOMERS
Improve our approach to customer service and achieve 91% customer satisfaction by 2017.
OUTCOME
We have made great progress against our Happy Customers Objective. In January the latest results of our annual Have Your Say Survey showed that we had hit the 91% target – two years early. This was our highest ever overall satisfaction score and puts us in the top quartile of our peer group. We have now set a target of maintaining this top quartile position.
Early in the year we launched a new Customer Service Strategy, designed to achieve a cultural shift in our approach to serving customers. As part of this we have:
Introduced a company-wide Brilliant Customer Service training programme;
Focused on improving services which are a priority to our customers;
Ran an internal campaign on getting the basics of customer service right, first time;
Listened and learnt from customer feedback;
Developed a collaborative working pilot to trial new ways of delivering services to our customers.
In addition we changed the way we handled complaints of anti-social behaviour, moving away from telephone contact and providing a face to face service. Customer satisfaction with the handling of their case increased to 72%.
We introduced our first App to enable smart phone access to our online repair reporting and appointment service. We changed the way we schedule repairs putting the emphasis on getting the repair right first time for our customers.
The Group invested £4 million in maintaining and improving existing homes. During the year we improved 1,200 homes. Customer satisfaction with the quality of homes increased to 89%. Satisfaction with our repairs service increased to 86%.
A large part of our programme concentrated on improving the energy efficiency of homes to meet our customers’ priority need to reduce their energy bills. We installed cavity wall insulation in more than 200 properties and invested in our first renewable heat incentive to improve the energy efficiency of our largest off-grid neighbourhood. We also began a pilot using BlueGen cells in Sheltered Housing schemes to produce electricity.
We launched a number of initiatives to improve our neighbourhoods as a place to live. This includes a £500k courtyard refurbishment programme which has transformed neglected areas into pleasant outside space for residents to use. In response to customer feedback we have changed the way we deliver caretaking and grounds maintenance services. Customer satisfaction with their neighbourhood as a place to live increased to 89%.
The work of our Customer Scrutiny Panel is producing improvements to our services. Last year the Panel completed two Scrutinies covering the work of our responsive repairs contractor and the work of our Tenancy and Neighbourhood Officers (TNOs). A wide range of recommendations from both Scrutinies have been implemented bringing about changes in the way our TNOs work and the appointment of a more customer focussed responsive repairs contractor.
The number of customers satisfied that we listen and act on their views increased to 83%. This score puts us in the top quartile of our peer group in the South East.
We continued to look for more efficient ways to turnaround empty properties quickly. In partnership with customers we introduced a new standard for empty properties. Turnaround time was an average of 10.3 days. This is the top performance in our peer group.
To improve the delivery and the efficiency of our Planned Maintenance Programme we have strengthened our in-house Surveying Team and invested in a new Keystone Asset Management Database, which will enable us to hold improved data on the condition of our stock and target improvements, including those around energy efficiency, more effectively.

HOUSING SOLUTIONS LIMITED
5
OPERATING AND FINANCIAL REVIEW AND REPORT OF THE BOARD FOR THE YEAR ENDED 31 MARCH 2015
CORPORATE OBJECTIVES
HAPPY CUSTOMERS
As part of our Community Social Responsibility programme we are continuing to offer training and support to help our customers and local residents get back into work. Our award winning Business Start-up Course is now offered in partnership with the Royal Borough of Windsor and Maidenhead, Wokingham Borough Council and Wycombe District Council and several other housing associations. Nearly 200 of our customers and local people have now taken part in the course. Many are now running their own businesses and a few have created jobs for other people.
To achieve Happy Customers we believe we need to have happy staff. We have taken steps this year to make Housing Solutions a great place to work; that is fit for the future in terms of customer service, culture and the working environment we offer our colleagues.
During the year we:
Launched a company-wide Brilliant Customer Service training course;
Reviewed our office space – introducing a lunch room for colleagues;
Introduced new and innovative ways of communicating including an Open House, to get candid feedback from colleagues;
Put greater emphasis on recruiting colleagues who matched the company’s values;
Developed new collaborative ways of working which were launched in 2015.
We introduced our first sabbaticals for colleagues during the year.
We also developed plans to improve work/life balance for colleagues by introducing more options for flexible and home working. Nearly a quarter of our colleagues have taken advantage of this.
Our latest survey shows that we have a high level of employee engagement with the majority of colleagues happy and proud to work for the company. It also highlights that 83% of colleagues believe that the company is moving in the right direction and three quarters were positive about improvements made in customer service.
MORE HOMES
Our ambition is to build 2020 new homes by 2020.
OUTCOME
To support our growth plans we secured a new £50 million loan with Legal & General. The deferred funding has a 40 year maturity and is priced at a competitive credit spread. We also secured a new seven year £30 million Revolving Capital Facility with Barclays.
In addition we are currently in negotiations with a private investment fund that represents a number of individuals and institutions who want to invest in affordable housing.
We invested £31 million in new developments, and completed 229 new homes last year. We have another 600 homes currently on site. During the year we completed Glassford House, our first development of new build apartments for private rent. We have recently established a partnership with the Royal County of Berkshire Pension Fund, who have invested directly in this new development of 40 one and two bedroom apartments in Wokingham. This has released some of our initial investment in the scheme, which we can redirect into building more new private rented sector homes without affecting our affordable homes programme.
Work on Project Care, a £50 million regeneration programme across Buckinghamshire, was completed last year. This was designed to improve the quality of accommodation for older people and people with learning disabilities, as well as meeting future legislations on care standards. Our eighth and final new care home was completed in October. In total the programme has provided 669 beds in eight care homes and ten supported housing units for people with learning difficulties. The Group has been working in partnership with Buckinghamshire County Council and the care provider, The Fremantle Trust.
VALUE FOR MONEY
Ensure that we deliver Value for Money services and housing, which contributes towards improving local communities.
OUTCOME
On the following pages we have provided our Value for Money Self Assessment.

HOUSING SOLUTIONS LIMITED
6
OPERATING AND FINANCIAL REVIEW AND REPORT OF THE BOARD FOR THE YEAR ENDED 31 MARCH 2015 VALUE FOR MONEY SELF ASSESSMENT
This section is intended to provide our stakeholders with an overview of how we are delivering value for money (vfm). We have also published a summary of our Self Assessment in our customer newsletter which can be found on our website at: http://housingsolutions.co.uk/Aboutus/Corporatepublications.aspx
We’ve outlined our strategy on the previous pages. Our approach to value for money delivery is:
Delivering more Happy Customers for the same resource;
Maximising the number of new homes delivered to help meet local housing need;
Building capacity to invest in more new homes by improving return on assets, reducing costs and increasing income and attracting new investment.
In summary here is what we have achieved in the year in pursuit of those goals:
Increased overall satisfaction by 8%. 91% overall satisfaction puts us in the top 25% of providers and has been delivered with operating costs broadly static;
90% of customers were satisfied that rent represented value for money;
Increased investment in new homes by 22% and completed 229 new homes in the year;
Funded those homes primarily from our own resources and new debt, with public grant accounting for only 2% of capital expenditure;
Increased EBITDA by £1.6m with improvements in EBITDA and operating margins. This supports future investment in services and more homes;
Increased disposals of assets that could not deliver an appropriate return. Income from disposals increased 148% with profit on disposals nearly doubling compared to 13/14.
We monitor and govern our VFM performance by setting cost and outcome targets over the short to medium term.
We monitor our performance against our previous results, the targets we have set ourselves and against the performance of a peer group of similar landlord (South East LSVTs with a stock of 2500-7500 units).
Whilst benchmarking has limitations in terms of comparing like for like, due to the individual characteristics of registered providers it does give us an essential external view of how our performance compares. The notes at the end of this section give guidance on interpreting the data.
We have also included a number of actions that we will focus on during the coming year to deliver better value.
At the time of writing a number of changes, including to the income from social housing lettings, were announced as part of the Summer Budget. These will present a challenge to our ambitious growth plans and we are in the process of updating our strategy in response to this.

HOUSING SOLUTIONS LIMITED
7
78.00%
80.00%
82.00%
84.00%
86.00%
88.00%
90.00%
92.00%
2012/13 2013/14 2014/15
Overall Satisfaction
OverallSatisfaction
UpperQ
Median
LowerQ
OPERATING AND FINANCIAL REVIEW AND REPORT OF THE BOARD FOR THE YEAR ENDED 31 MARCH 2015 VALUE FOR MONEY SELF ASSESSMENT
HAPPY CUSTOMERS
We have significantly improved performance on our headline measure of happy customers. 91% of customers in our rented homes were very or fairly satisfied with Housing Solutions this year - an increase of 8% on 13/14. As we indicated in last year’s self-assessment we commenced a change programme around customer service, focussed on getting more
satisfaction from the same resource. This has delivered earlier than anticipated and our performance is now in the top 25% of both our peer group and providers nationally. Satisfaction with individual services has improved across every area. Here are the results from our most recent customer survey and how they compare:
Current Progress Benchmark Comparison
Overall 91% 88%
Repairs and Maintenance 86% 83%
Quality of Home 89% 87%
Neighbourhood 89% 88%
Views taken into account 82% 72%
Value for Money of Rent 90% N/A 86%
Customer Satisfaction Outcomes
The table below shows the absolute costs of delivering these services and outcomes and how we compare:
Current Progress Benchmark Comparison
Responsive and Void Maintenance 786£ 810£
Planned and Cyclical Maintenance 992£ 1,576£
Rent Collection 147£ 141£
Resident Participation 59£ 70£
ASB 64£ 57£
Tenancy Management 130£ 108£
Estate Services 182£ 190£
Lettings 82£ 63£
Total cost per property of delivering specific services

HOUSING SOLUTIONS LIMITED
8
OPERATING AND FINANCIAL REVIEW AND REPORT OF THE BOARD FOR THE YEAR ENDED 31 MARCH 2015 VALUE FOR MONEY SELF ASSESSMENT
HAPPY CUSTOMERS
The value graph below is intended to combine the cost and performance data on the previous page, to give an overall picture of value from services provided.
It considers our cost and performance and how they compare to other providers year on year. The following services are shown:
1. Responsive/Void Maintenance 2. Rent Collection 3. ASB 4. Planned Maintenance 5. Lettings 6. Tenancy Management 7. Resident Involvement, 8. Estate Services
Below are some of the key improvements we have delivered to support the improved outcomes:
Answered more calls on our Customer Contact centre and reduced abandonments by 4%;
Delivered customer service training to all staff;
Improved neighbourhoods by investing c.£500k in the improvement of common areas and completing more estate inspections (including improved customer led inspections);
Developed our Tenancy and Neighbourhood service with the help of a review by our Customer Scrutiny Panel;
Increased the percentage of ASB cases that were successfully resolved from 64% to 77%;
Reduced the average time to complete a repair by over one day and implemented the recommendations from the review by our Customer Scrutiny Panel;
Engaged with more customers struggling financially through our financial inclusion service.
Below are some of our priorities for the coming year to maintain our performance and address some of our weaknesses:
Focus on improving collaboration between teams through a trial of geographical rather than function based delivery of services;
Improve communication and interactions with our customers in supported housing homes (this was the only group where satisfaction decreased) so customer satisfaction is in line with the wider rented stock;
Homeowners are our customer group who are the least satisfied with our service. We will focus on better communication of planned maintenance work and around service charges to home owners to increase their overall satisfaction;
Deliver smarter working process reviews in three areas (caretaking, rent collection and repairs management) in order to add value and reduce the cost of services in the bottom quartile.

HOUSING SOLUTIONS LIMITED
9
0
100
200
300
400
2011/12 2012/13 2013/14 2014/15 Pipeline2015/16
Pipeline2016/17
New homes
Total delivered in year Forecast
OPERATING AND FINANCIAL REVIEW AND REPORT OF THE BOARD FOR THE YEAR ENDED 31 MARCH 2015 VALUE FOR MONEY SELF ASSESSMENT
NEW HOME DELIVERY
Delivering more homes is the second part of our 2020 Vision and sits alongside creating happy customers. The supply challenges in the UK housing market are well known. We want to be part of the solution and this is why we set ourselves the ambitious challenge of 2020 new homes by 2020 when we revised our strategic plan in 2014. We invested over £31m in new homes (both completed and in progress) in 14/15 which was an increase of over 22% on the previous year. Public (social housing) grant made up only £720k or 2.3% of this investment and we expect this to reduce in 15/16. By 2016/17 we forecast social housing grant will fund under 0.5% of a total investment of over £47m.
We delivered 229 new homes in the year - an increase of 133 on last year. We’ve also done a considerable amount of work on securing sites for future delivery. Our delivery pipeline stretches out to 2018 already and our current commitments for the next two years are
shown below. We have also shown our forecast for 16/17 based on current opportunities.
The final units of our care home programme (62) were delivered alongside our first new build homes for private rent (40). The remainder of the programme was split fairly evenly between properties for social rent, affordable rent and shared ownership. We are continuing to try and deliver new units at social rent in line with locally identified housing need. Our first new build homes for private rent were let promptly and are producing an income above target. Our strategy on private rent is to invest a small amount (c. 2% of balance sheet value) into delivering new units with a medium to long term objective to act as a manager for other investors as opposed to investing ourselves. In doing this we believe that we can use our skill to increase housing supply, but continue to focus our investment predominately in affordable housing.

HOUSING SOLUTIONS LIMITED
10
0
100
200
300
2011/12 2012/13 2013/14 2014/15
New Homes by Type
Social Rent Affordable Rent Shared Ownership
Supported Care Market
OPERATING AND FINANCIAL REVIEW AND REPORT OF THE BOARD FOR THE YEAR ENDED 31 MARCH 2015 VALUE FOR MONEY SELF ASSESSMENT
NEW HOME DELIVERY (CONTINUED)
We compare very well with our peer group on delivery of new homes - both new units as a percentage of existing stock and the number of staff involved in the delivery of those units put us in the top 25% of providers. Satisfaction with new homes dropped to 94% but still compares well.
These new homes are helping us towards the 2020 target, but we still have significant work to do to meet this ambitious goal. We have strengthened our development team with the recruitment of two senior staff focussed on securing and delivering new opportunities. Subsequently we expect the number of FTE staff involved in the delivery of development units indicator to worsen in the short term before improving as the new staff increase supply. We are also working with potential investors to increase appetite for the
direct investment in affordable housing in order to further increase new supply.
Below are some of our priorities for the coming year:
Delivery of 187 new homes;
Strengthen the development pipeline for 16/17 to target 300 new homes;
Focus on handover and defect period to increase satisfaction with new homes;
Deliver planning consents to increase new units on existing sites (see funding section below);
Review development strategy in light of changes to income following the Budget.

HOUSING SOLUTIONS LIMITED
11
0.0%
10.0%
20.0%
30.0%
40.0%
50.0%
60.0%
2011/12 2012/13 2013/14 2014/15
Operating and EBITDA Margin
Operating surplus as % Turnover EBITDA as % Turnover
OPERATING AND FINANCIAL REVIEW AND REPORT OF THE BOARD FOR THE YEAR ENDED 31 MARCH 2015 VALUE FOR MONEY SELF ASSESSMENT
BUILDING FUNDING CAPACITY TO INVEST IN MORE NEW HOMES AND SERVICE
Operating surplus rose 8% and operating margin increased from 41.9% in 13/14 to 42.6%. EBITDA (Earnings before interest, tax, depreciation and amortisation) increased by £1.6m and EBITDA as % turnover also increased.
Our operating costs (excl. sales) increased 3.7% to £19.25m. Operating costs excluding depreciation increased by 1.3% in nominal terms or a 1% reduction in real terms. This was driven mainly by an 8% reduction in planned maintenance spend. We have built on the procurement savings made in 13/14 and
achieved a total of £173k of savings in the year. £102k of these are recurring savings following procurement activity in 13/14 and the remaining £71k are new savings in the year.
The largest savings came from a re-procurement of our maintenance materials supply contract and the second year of a two year painting contract. We continue to use a number of frameworks through procurement clubs in order to benefit from the collective buying power of the sector.
2013/14 2014/15
Turnover £34.4m £36.7m
EBITDA £18.7m £20.4m
Operating Surplus £14.4m £15.7m
Total Stock 4937 5148
Current Progress Benchmark Comparison
EBITDA as % Turnover 55.6%
Operating margin 42.6% 30.4%
Weighted average cost of borrowing 4.2% 4.1%
ROCE 3.0% N/A
Overheads as % of turnover 8.6% 11.3%
Financial Highlights
£‐
£5,000,000
£10,000,000
£15,000,000
£20,000,000
£25,000,000
2011/12 2012/13 2013/14 2014/15
Operating Costs
Staff Costs Other
Responsive Maintenance Planned/Major Repairs (expensed)
Depreciation

HOUSING SOLUTIONS LIMITED
12
OPERATING AND FINANCIAL REVIEW AND REPORT OF THE BOARD FOR THE YEAR ENDED 31 MARCH 2015 VALUE FOR MONEY SELF ASSESSMENT
BUILDING FUNDING CAPACITY TO INVEST IN MORE NEW HOMES AND SERVICE
Our ambitious development goals and minimal funding through public grant mean that we are reliant on generating strong surpluses to reinvest. 14/15 saw a positive increase in the surplus we generated. We continue to use a small proportion of resources on non-social housing activity. This includes activity to generate profit for reinvestment and/or activity that compliments our business or increases housing supply. Profit from other activities increased in the year from £960k to £1.16m. This is due to an increase in maintenance activity and the delivery of our first new build housing units for the private rented sector. Operating profit from these other activities remains a
small contributor to overall operating surplus (7%) in order to manage risk.
Debt increased by £13.6m to £276m in order to fund new homes. Although debt is increasing we continue to control interest cover and gearing in order to manage the risk. Capital employed has increased from £480m to £515m. There is little change on the return on capital employed (ROCE) which remains at 3%. Operating surplus as a percentage of fixed assets remains at 3.3% which remains above ROCE as a result of timing differences between resourcing the funds to invest in new homes and turning that investment in to revenue generating assets.
2.4%
2.9%
3.4%
2011/12 2012/13 2013/14 2014/15
Return on Capital
ROCE Operating Surplus as % Fixed Assets
£‐
£2,000,000
£4,000,000
£6,000,000
£8,000,000
£10,000,000
2011/12 2012/13 2013/14 2014/15
Surplus

HOUSING SOLUTIONS LIMITED
13
£‐
£5,000,000
£10,000,000
£15,000,000
2011/12 2012/13 2013/14 2014/15
Property Disposals
Diposal Proceeds Profit on Disposals
OPERATING AND FINANCIAL REVIEW AND REPORT OF THE BOARD FOR THE YEAR ENDED 31 MARCH 2015 VALUE FOR MONEY SELF ASSESSMENT
BUILDING FUNDING CAPACITY TO INVEST IN MORE NEW HOMES AND SERVICE
Last year we developed our new strategic asset management approach which has three strands:
Planned maintenance investment to reduce future costs (Fix It);
Re-development and reconfiguration to increase supply or income (Fund it);
Sales of existing assets where we can do more to meet our happy customers and more homes objective with a capital receipt than with the existing asset (Flog it).
FIX IT - We reduced the number of units that have a negative net present value (NPV) over the next 30 years. This has been done by making planned maintenance investment which has reduced the ongoing costs meaning that those units now make positive contribution. Overall the number of units with a negative NPV is now 1% of stock.
FUND IT - We completed a large project in the year to evaluate opportunities to improve return and build new homes on existing sites. We have appraised in excess of 50 opportunities, the first of which will be entered in to the planning system in 15/16.
FLOG IT - We have made considerable progress selling property where a receipt could meet our aims better, than retaining the asset. Sales receipts
increased from £3.99m to £9.93m (148% increase) and profits from sales from £1.17m to £3.34m (198% increase). These sales included the disposal of number of former care home sites under our Project Care programme and the sale of an affordable housing scheme that was outside of our main operational area and had increased running costs as a result. This was sold to another registered provider better placed geographically to operate the scheme.
Here are some of our priorities for the coming year:
Deliver new procurement and efficiency savings of at least £150k per annum;
Review operating cost and agree new operating cost targets to 2020;
Continue building relationships with investors - particularly focused on getting direct investment in to delivering new homes we do not have capacity to build ourselves;
Disposals of units with high open market value and poor NPV performance. These sales will be limited according to when they become available and our ability to suitably replace them;
Reduce number of units with negative NPV from c.1% to 0.5% stock.
0%
20%
40%
60%
Gross Rental Yields at OMV
% of stock
HOUSING SOLUTIONS LIMITED
14
OPERATING AND FINANCIAL REVIEW AND REPORT OF THE BOARD FOR THE YEAR ENDED 31 MARCH 2015 VALUE FOR MONEY SELF ASSESSMENT
CONCLUSION Since we launched our new vision 2020 Strategic Plan, which focuses on creating Happy Customers and Building More Homes, we have seen an improvement in our VFM performance across the business.
In the last year, we have:
achieved a significant increase in our overall customer satisfaction (91%), putting us in the top 25% of providers in our peer group. We also achieved top performer status in customer satisfaction with value for money for rent, our repairs rervice and listening and acting on customer views;
made improvements in the value for money (judged by the cost and performance relationship) of services in a number of key areas, including Planned Maintenance, Responsive and Void Maintenance, Resident Involvement and Estate Services;
increased investment in new homes by 22% to £31m, primarily funded from our own surpluses and new debt, with public grant now accounting for only 2% of development expenditure;
delivered 229 new homes which puts us in the top 25% of our peer group in terms of the number of new homes delivered as a percentage of existing homes;
improved the financial management of assets through our Fix-it, Fund-it and Flog-it strategic asset management approach.
We are committed to continuing to improve our VFM performance. We have a wide range of initiatives to deliver improvements in the current year, including smarter working to improve efficiency and reduce costs, improved procurement and developing relationships
with investors who can help us deliver more new homes.
NOTES
1. Cost figures are shown in nominal terms unless stated otherwise.
2. Total cost of delivering services on page 7 are calculated using the HouseMark benchmarking systems and relate to the cost of services to our rented affordable housing stock. The figures include an area cost adjustment to make a fair comparison across different operating areas.
3. Progress arrows show if our performance has improved (shown by an upward green arrow), stayed broadly the same (horizontal amber arrow) or worsened (red downward arrow) when compared to 2013/14;
4. Where benchmark performance is shown in the tables it shows the median 2014/15 performance (at the time of writing) for the peer group we use to benchmark our performance.
5. The comparison traffic light shows how we compared at the latest benchmark. A green indicator shows our performance puts us in the top 25% of providers in the peer group. An amber indicator shows our performance places us in the next 50%. A red indicator shows our performance is in the bottom 25%.
6. In the value graphs each dot on the graph represents each service. The vertical axis shows our cost position compared to peers. The lower we are on the graph the better the cost of the service is in comparison to our peer group. The horizontal axis shows our performance position in relation to our peers. The further to the right of the graph the better our performance in comparison to our peers.

HOUSING SOLUTIONS LIMITED
15
OPERATING AND FINANCIAL REVIEW AND REPORT OF THE BOARD
FOR THE YEAR ENDED 31 MARCH 2015
FINANCIAL POSITION
The group’s five year income and expenditure accounts and balance sheets are summarised in Table 1 (page 17) and the following paragraphs highlight key features of the group’s financial position at 31 March 2015.
ACCOUNTING POLICIES
The group’s principal accounting policies are set out on pages 26 to 28 of the financial statements. The policies that are most critical to the financial results relate to accounting for housing properties and include: capitalisation of costs; deduction of capital grant from the cost of assets; housing property depreciation; and treatment of shared ownership properties.
The group has adopted the Statement of Recommended Practice (SORP) Accounting by Registered Social Housing Providers Update 2010. There were no significant changes to accounting policies in the current year.
HOUSING PROPERTIES
At 31 March 2015 the group owned 5,148 housing properties (2014: 4,937).
The board appointed external professional valuers to undertake the annual valuation of the group’s housing properties as at 31 March 2015. The value of the properties, on an existing use for social housing basis, was £436.5 million and this has been reflected in the valuation of properties in the financial statements.
On valuation, the annual surplus of £13.5m over the carrying value has been taken to the property revaluation reserve.
Our investment in housing properties this year was funded through a mixture of social housing grant, loan finance and working capital where we continue to show a strong current asset balance, an important indicator of liquidity.
PENSION COSTS
The group participates in the Royal County of Berkshire Pension Fund (RCBPF), a Local Government Pension Scheme. This is an average salary scheme, offering good benefits for our staff. The group has contributed to the scheme in accordance with levels, set by the actuaries, at 18.4 per cent.
The latest actuarial valuation of the RCBPF as at 31 March 2013 has been rolled forward allowing for the different financial assumptions required under IAS19/FRS17 to calculate the funding valuation at 31 March 2015.
CAPITAL STRUCTURE AND TREASURY POLICY
The group borrowed a further £20.0 million during the year, to develop general needs, supported housing and care home accommodation for the elderly. This was offset by the buyback of the majority of the Harbour Bond. £6.4m was bought back leaving a balance of £1.6m which was bought back shortly after the year end, this was done to free up security as the Harbour Bond required a high level of security.
By the year end group borrowings amounted to £276.6 million with the first repayment date being September 2017. Gearing, calculated as total loans as a percentage of the balance sheet value of completed housing property, had decreased to 62.8% by 31 March 2015 (2014: 66.2%). This decrease is due to the buyback of the Harbour Bond, increase in value of housing stock and the completion of new units. During the year £5 million has been on lent by Housing Solutions Capital plc to Housing Solutions Limited with £35 million remaining in Housing Solutions Capital plc. This is to protect the gearing within Housing Solutions Limited and ensure that the gearing buffer is adhered to. Cash held at 31 March 2015 was £46.8m compared to £46.1m at 31 March 2014.

HOUSING SOLUTIONS LIMITED
16
OPERATING AND FINANCIAL REVIEW AND REPORT OF THE BOARD FOR THE YEAR ENDED 31 MARCH 2015
MATURITY 2015 2014
£m £m
Within one year - -
Between one and two years - -
Between two and five years 11.1 7.1
After five years 265.5 255.9
276.6 263.0
(Figures do not include the netting of the debt service reserve.)
The group is borrowing principally from banks and building societies and through the bond market, at both fixed and floating rates of interest (see further details in note 19). Interest rate swaps are used to generate the desired interest profile and to manage the group’s exposure to interest rate fluctuations. The group’s policy is to keep between 65 per cent and 90 per cent of its borrowings at fixed rates of interest and to maintain an average duration within a range of 7 to 13 years with a target of 10 years.
At the year-end, 82 per cent of the group’s borrowings were at fixed rates after taking account of interest rate swaps (2014: 81 per cent). The fixed rates of interest range from 1.5 per cent to 5.5 per cent. Our all-in average cost of funds was 4.1 per cent.
The trend information in Table 1 (page 17) shows that reserves have increased from a total of £211.8 million as at 31 March 2014 to £230.1 million by 31 March 2015.
The group’s lending agreements require compliance with a number of financial and non-financial covenants. The group’s position is monitored on an on-going basis and reported to the board at each meeting. The group funding committee regularly reviews the group’s treasury position including requirements for new loan facilities. Recent reports confirmed that the group was in compliance with its loan covenants both at the balance sheet date currently and also the board
expects to remain compliant in the foreseeable future. The group borrows and trades only in sterling and so is not exposed to currency risk.
CASH FLOWS
Cash inflows and outflows during the year are shown in the consolidated cash flow statement (page 25).
Net cash inflow from financing decreased from £50.0 million (2014) to £13.6 million (2015). FUTURE DEVELOPMENTS
The group continues to assess the impact of the government policy on its business plan and intended future developments. The group’s resources are only committed once funding has been secured. Other initiatives continue to be developed to assist our customers in dealing with changes to housing and other benefits. STATEMENT OF COMPLIANCE In preparing this Operating and Financial Review and Board report, the board has followed the principles set out in the Statement of Recommended Practice (SORP): Accounting for registered social housing providers.

HOUSING SOLUTIONS LIMITED
17
OPERATING AND FINANCIAL REVIEW AND REPORT OF THE BOARD FOR THE YEAR ENDED 31 MARCH 2015 TABLE 1 – GROUP HIGHLIGHTS, FIVE YEAR SUMMARY
2015 2014
2013
2012 2011
Group Income and Expenditure account £000 £000 £000 £000 £000
Total turnover 36,736 34,395 31,236 28,585 27,667
Income from lettings 31,475 29,920 28,474 26,080 24,005
Operating surplus (before exceptional items) 15,649 14,422 13,154 11,010 10,973
Surplus for the year transferred to reserves 8,245 6,752 2,772 5,225 4,956
Group Balance Sheet
Housing properties (at valuation) 461,985 424,563 382,801 351,054 330,418
Other fixed assets 9,806 9,712 9,577 8,971 7,715
Fixed assets 471,791 434,275 392,378 360,025 338,133
Net current assets 43,227 45,670 15,532 804 4,364
Total assets less current liabilities 515,018 479,945 407,910 360,829 342,497
Loans (due over one year) 276,633 263,052 213,052 177,185 172,185
Less: Debt Service Reserve (5,185) (4,450) (4,825) (4,584) (3,897)
Net Loans 271,448 258,602 208,227 172,601 168,288
Pensions liability 13,507 9,516 7,626 7,437 5,666
Reserves: Designated - - - - 289
Revenue 37,794 32,313 26,194 22,541 17,951
Revaluation 192,269 179,514 165,863 158,250 150,303
Total 230,063 211,827 192,057 180,791 168,543
515,018 479,945 407,910 360,829 342,497
Housing properties owned at year end: No. No. No. No. No.
Social Housing 5,028 4,898 4,831 4,716 4,592
Non-social Housing 120 39 82 81 78
5,148 4,937 4,913 4,797 4,670
Statistics:
EBITDA as % of turnover 55.6% 54.4% 45.5% 51.8% 52.6%
Operating surplus as % of turnover 42.6% 41.9% 42.1% 38.5% 39.7%
Surplus for year as % of income from lettings 22.4% 22.6% 9.7% 20.0% 20.6%
Cost per unit (excluding depreciation and planned maintenance)
£1,764 £1,807 £1,762 £1,677 £1,717
Rent arrears (gross arrears as % of rent and service charges receivable)
2.6% 2.1% 2.4% 2.8% 3.4%
Liquidity (current assets divided by current liabilities)
5.6 9.7 4.0 1.2 1.7
Gearing (total loans as % of value of completed housing properties)
62.8% 66.2% 58.0% 51.3% 54.5%

HOUSING SOLUTIONS LIMITED
18
OPERATING AND FINANCIAL REVIEW AND REPORT OF THE BOARD FOR THE YEAR ENDED 31 MARCH 2015 INTERNAL CONTROLS ASSURANCE The board acknowledges its overall responsibility, applicable to all organisations within the group, for establishing and maintaining the whole system of internal control and for reviewing its effectiveness.
The system of internal control is designed to manage, rather than eliminate, the risk of failure to achieve business objectives and to provide reasonable assurance against material mis-statement or loss.
The process for identifying, evaluating and managing the significant risks faced by the group is ongoing and has been in place throughout the period commencing 1 April 2014 up to the date of approval of the report and financial statements.
Key elements of the control framework include:
board approved terms of reference and delegated authorities for audit, group funding and emergency committees;
clearly defined management responsibilities for the identification, evaluation and control of significant risks;
robust strategic and business planning processes, with detailed financial budgets and forecasts;
formal recruitment, retention, training and development policies for all staff;
established authorisation and appraisal procedures for significant new initiatives and commitments;
a sophisticated approach to treasury management which is subject to external review each year;
regular reporting to the appropriate committee on key business objectives, targets and outcomes;
board approved whistle-blowing and anti-theft and corruption policies;
board approved fraud policies, covering prevention, detection and reporting, together with recoverability of assets;
regular monitoring of loan covenants and requirements for new loan facilities.
A fraud register is maintained and is reviewed annually by the audit committee. During the year there were no reports of actual or suspected frauds.
The board cannot delegate ultimate responsibility for the system of internal control but has delegated authority to the audit committee to regularly review the effectiveness of the system of internal control.
The board receives an annual report from the audit committee and meeting minutes. The audit committee has received the Chief Executive’s annual review of the effectiveness of the system of internal control for the group, and the annual report of the internal auditor, and has reported its findings to the board.
NHF CODE OF GOVERNANCE
We are pleased to report that the group complies with the principal recommendations of the NHF Code of Governance (revised).

HOUSING SOLUTIONS LIMITED
19
OPERATING AND FINANCIAL REVIEW AND REPORT OF THE BOARD FOR THE YEAR ENDED 31 MARCH 2015 STATEMENT OF THE RESPONSIBILITIES OF THE BOARD FOR THE REPORT AND FINANCIAL STATEMENTS The board is responsible for preparing the report and financial statements in accordance with applicable law and regulations. Co-Operative and Community Benefit Societies legislation requires the board to prepare financial statements for each financial year. Under that law the board have elected to prepare the financial statements in accordance with United Kingdom Generally Accepted Accounting Practice (United Kingdom Accounting Standards and applicable laws). Under the Co-Operative and Community Benefit Societies legislation the board must not approve the financial statements unless they are satisfied that they give a true and fair view of the state of affairs of the group and association at the end of the year and of the surplus or deficit of the association and group for that period. In preparing those financial statements the Board is required to:
select suitable accounting policies and apply them consistently;
make judgements and estimates that are reasonable and prudent;
state whether applicable UK Accounting Standards and the Statement of Recommended Practice (SORP) Accounting by Registered Housing Providers Update 2010, have been followed, subject to any material departures disclosed and explained in the financial statements;
Prepare the financial statements on the going concern basis unless it is inappropriate to presume that the company will continue in business.
The board is responsible for keeping proper accounting records which disclose with reasonable accuracy at any time the financial position of the group and association and enable it to ensure that the financial statements comply with the Co-Operative and Community Benefit Societies Act 2014. It is also responsible for safeguarding the assets of the group and association and hence for taking reasonable steps for the prevention and detection of fraud and other irregularities. The board is responsible for ensuring that the report of the board is prepared in accordance with the Statement of Recommended Practice: Accounting by Registered Housing Providers Update 2010. The board is responsible for the maintenance and integrity of the corporate and financial information on the group’s website.
POST BALANCE SHEET BUDGET EFFECTS The budget announcement on July 8th included proposed changes in the rent charging regulations applicable to all registered Housing Associations. The main change proposed a reduction in social housing general needs rents by 1% each year for the 4 years commencing April 1st 2016. Previously the formula had been increases linked to CPI + 1% margin. The effect this has on HSL is twofold – firstly, it will reduce our margins going forward and secondly, it will reduce the accounts valuation of our assets which is used for gearing covenant calculation. In respect of our margins, we have had a strong ratio of operating surplus to turnover, and we also have a mix of non-general needs properties such as Shared Ownership which are not affected by the rent reductions. We have modelled the effects and there will be no breach of our interest cover covenant in the near future. In respect of the valuation issue, we have commissioned an independent valuation update from Jones Lang LaSalle Ltd which indicates we will remain within our gearing covenant over at least the next three years. We also have adequate security to be able to meet our asset cover covenants especially since the security valuations are higher than the accounts valuations due to mortgagee in possession clauses. ANNUAL GENERAL MEETING The annual general meeting will be held on 16 September 2015 at Crown House, Crown Square, Waldeck Road, Maidenhead, Berkshire, SL6 8BY. DISCLOSURE OF INFORMATION TO AUDITORS At the date of making this report each of the association’s board members, as set out on page 2, confirm the following:
so far as each board member is aware, there is no relevant information of which the group’s and association’s auditors are unaware;
the board members have taken all the steps that they ought to have taken to make themselves aware of any relevant audit information and to establish that the auditors are aware of that information.
EXTERNAL AUDITORS A resolution to re-appoint Grant Thornton UK LLP will be proposed at the forthcoming annual general meeting. The report of the board was approved by the board on 16 September 2015 and signed on its behalf by:
MARK PULLEN VICE CHAIRMAN

HOUSING SOLUTIONS LIMITED
20
INDEPENDENT AUDITOR'S REPORT TO THE
MEMBERS OF HOUSING SOLUTIONS LIMITED
We have audited the financial statements of Housing Solutions Limited for the year ended 31 March 2015 which comprise the group and association income and expenditure accounts, the group and association statements of total recognised gains and losses, the consolidated and association balance sheets, the consolidated cash flow statement and the related notes. The financial reporting framework that has been applied in their preparation is applicable law and United Kingdom Accounting Standards (United Kingdom Generally Accepted Accounting Practice).
This report is made solely to the housing association’s members, as a body, in accordance with regulations made under Section 9 and 13 of the Co-Operative and Community Benefit Societies Act 2014. Our audit work has been undertaken so that we might state to the housing association’s members those matters we are required to state to them in an auditor’s report and for no other purpose. To the fullest extent permitted by law, we do not accept or assume responsibility to anyone other than the housing association and the housing association’s members as a body, for our audit work, for this report, or for the opinions we have formed.
RESPECTIVE RESPONSIBILITIES OF THE
BOARD AND THE AUDITOR
As explained more fully in the Statement of Board's Responsibilities set out on page 19, the board is responsible for the preparation of financial statements which give a true and fair view. Our responsibility is to audit and express an opinion on the financial statements in accordance with applicable law and International Standards on Auditing (UK and Ireland). Those standards require us to comply with the Auditing Practices Board’s (APB’s) Ethical Standards for Auditors.
SCOPE OF THE AUDIT OF THE FINANCIAL
STATEMENTS
A description of the scope of an audit of financial statements is provided on the Financial Reporting Council's website at www.frc.org.uk/auditscopeukprivate.
OPINION ON FINANCIAL STATEMENTS
In our opinion the financial statements:
give a true and fair view of the state of the group and parent association's affairs as at 31 March 2015 and of the group and parent's income and expenditure for the year then ended;
have been properly prepared in accordance with the
Co-Operative and Community Benefit Societies Act 2014, the Housing and Regeneration Act 2008, and the Accounting Direction for Private Registered Providers of Social Housing 2012.
MATTERS ON WHICH WE ARE REQUIRED TO
REPORT BY EXCEPTION
We have nothing to report in respect of the following matters where the Co-Operative and Community Benefit Societies Act 2014 requires us to report to you if, in our opinion:
a satisfactory system of control over transactions has not been maintained; or
the parent association has not kept proper accounting records or returns adequate for our audit have not been received from branches not visited by us;
the financial statements are not in agreement with the books of account; or
we have not received all the information and explanations we need for our audit.
Grant Thornton UK LLP Statutory Auditor, Chartered Accountants London

HOUSING SOLUTIONS LIMITED
21
INCOME AND EXPENDITURE ACCOUNTS FOR THE YEAR ENDED 31 MARCH 2015
Group Group Association Association Notes 2015 2014 2015 2014 £000 £000 £000 £000 Turnover 3 36,736 34,395 36,526 34,187 Cost of sales 3 (1,837) (1,405) (1,809) (1,377)Operating costs 3 (19,250) (18,568) (19,168) (18,544)Operating surplus 7 15,649 14,422 15,549 14,266 Profit on sale of fixed assets 8 3,429 1,170 3,429 1,170Interest receivable and other income 9 927 183 977 284 Interest payable and similar charges 10 (11,760) (9,023) (11,762) (9,020) Surplus on ordinary activities before taxation 8,245 6,752 8,193 6,700Tax on surplus on ordinary activities 11 - - - - Surplus for the financial year 8,245 6,752 8,193 6,700
All of the group’s turnover and surplus disclosed above are derived from continuing activities.
The accompanying accounting policies and notes on pages 26 – 47 form an integral part of the financial statements.
The financial statements were approved and signed by the Board of Management on 16 September 2015 and are signed on its behalf by:
Vice Chairman Mark Pullen
Secretary John Petitt
Board Member Hayley Peters

HOUSING SOLUTIONS LIMITED
22
STATEMENT OF TOTAL RECOGNISED SURPLUSES AND DEFICITS FOR THE YEAR ENDED 31 MARCH 2015
Notes Group Group Association Association 2015 2014 2015 2014 £000 £000 £000 £000 Surplus for the financial year 8,245 6,752 8,193 6,700 Unrealised surplus on revaluation of properties 21 13,508 14,511 13,508 14,511 21,753 21,263 21,701 21,211 Actuarial (losses)/ gains relating to pension scheme: 26 (3,516) (1,493) (3,516) (1,493) Total recognised surplus relating to the year 18,237 19,770 18,185 19,718 HISTORICAL COST SURPLUSES AND DEFICITS
Reported surplus on ordinary activities before taxation 8,245 6,752 8,193 6,700 Difference between historical cost depreciation and actual depreciation charge calculated on the revalued amount
22 752 860 752 860
Historical cost surplus on ordinary activities before taxation 8,997 7,612 8,945 7,560Historical cost retained revenue surplus 8,997 7,612 8,945 7,560 The accompanying accounting policies and notes on pages 26 – 47 form an integral part of the financial statements.
HOUSING SOLUTIONS LIMITED
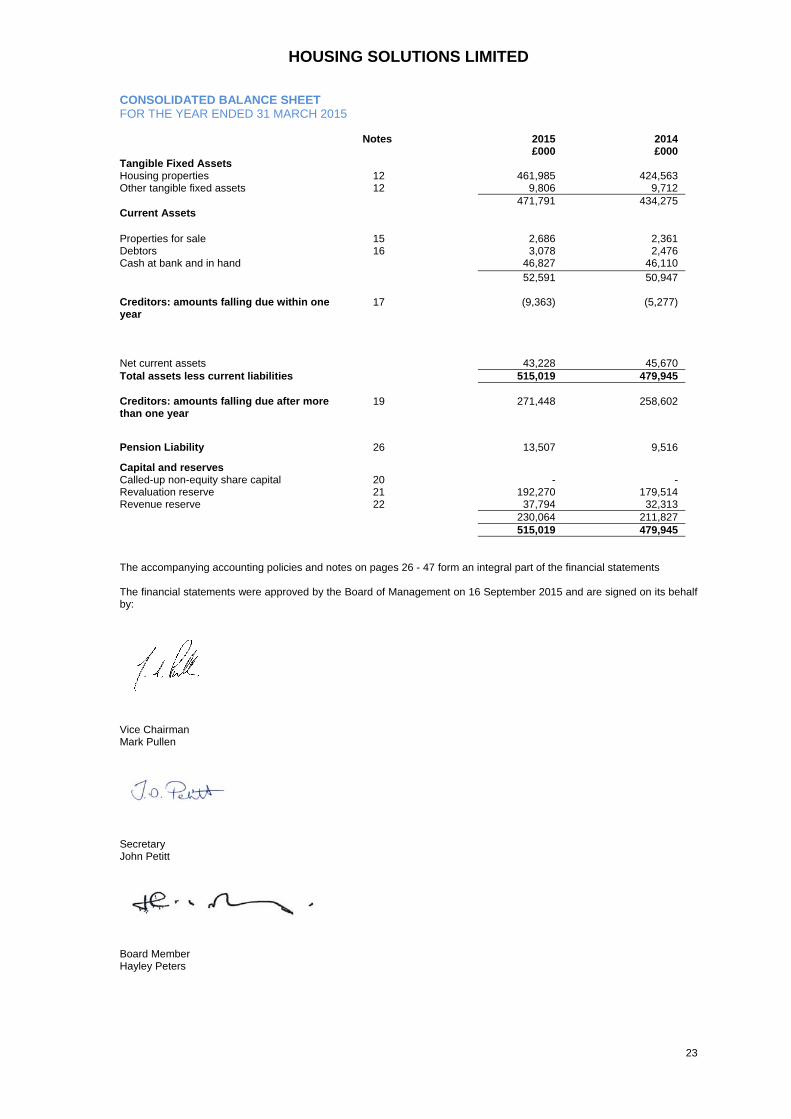
23
CONSOLIDATED BALANCE SHEET FOR THE YEAR ENDED 31 MARCH 2015 Notes 2015 2014 £000 £000 Tangible Fixed Assets Housing properties 12 461,985 424,563 Other tangible fixed assets 12 9,806 9,712 471,791 434,275Current Assets Properties for sale 15 2,686 2,361 Debtors 16 3,078 2,476Cash at bank and in hand 46,827 46,110 52,591 50,947 Creditors: amounts falling due within one year
17 (9,363) (5,277)
Net current assets 43,228 45,670 Total assets less current liabilities 515,019 479,945 Creditors: amounts falling due after more than one year
19 271,448 258,602
Pension Liability 26 13,507 9,516
Capital and reserves Called-up non-equity share capital 20 - -Revaluation reserve 21 192,270 179,514 Revenue reserve 22 37,794 32,313 230,064 211,827 515,019 479,945 The accompanying accounting policies and notes on pages 26 - 47 form an integral part of the financial statements The financial statements were approved by the Board of Management on 16 September 2015 and are signed on its behalf by:
Vice Chairman Mark Pullen
Secretary John Petitt
Board Member Hayley Peters

HOUSING SOLUTIONS LIMITED
24
ASSOCIATION BALANCE SHEET FOR THE YEAR ENDED 31 MARCH 2015 Notes 2015 2014 £000 £000 Tangible Fixed Assets Housing properties 12 461,985 424,563 Other tangible fixed assets 12 7,957 7,787 469,942 432,350 Long term investments 14 50 50 Current Assets Properties for sale 15 2,686 2,361Debtors 16 4,705 4,339 Cash at bank and in hand 11,684 26,083 19,075 32,783 Creditors: amounts falling due within one year
17 (9,118) (5,256)
Net current assets 9,957 27,527Total assets less current liabilities 479,949 459,927 Creditors: amounts falling due after more than one year
19 236,448 238,602
Pension Liability 26 13,507 9,516
Capital and reserves Called-up non-equity share capital 20 - - Revaluation reserve 21 192,270 179,514Revenue reserve 22 37,724 32,295 229,994 211,809 479,949 459,927 The accompanying accounting policies and notes on pages 26 - 47 form an integral part of the financial statements The financial statements were approved by the Board of Management on 16 September 2015 and signed on its behalf by:
Vice Chairman Mark Pullen
Secretary John Petitt
Board Member Hayley Peters

HOUSING SOLUTIONS LIMITED
25
CONSOLIDATED CASH FLOW STATEMENT AS AT 31 MARCH 2015
Notes 2015 2014 £000 £000 Net cash inflow from operating activities 25 23,565 16,628
Returns on investments and servicing of finance Interest received 192 183Interest paid (11,760) (10,809) Net cash outflow from returns on investments and servicing of finance
(11,568)
(10,626)
Capital Expenditure and Financial Investment
Acquisition and construction of housing properties (35,021) (31,250) Social housing grant received 720 -Other grant received - 786Purchase of other fixed assets (487) (523)Proceeds from sales of housing properties 9,927 3,985 Investment utilised to fund development - -Net cash outflow from Capital expenditure and financial investment
(24,861)
(27,002)
Financing Loans received 25 13,581 50,000
Net cash inflow from financing 13,581 50,000 Increase in cash 25 717 13,729

HOUSING SOLUTIONS LIMITED
26
NOTES TO THE REPORT AND FINANCIAL STATEMENTS FOR THE YEAR ENDED 31 MARCH 2015 1.0 Legal Status
The Association is registered under the Co-Operative and Community Benefit Societies Act 2014 and is registered with the Homes and Communities Agency (HCA) as a housing provider.
2.0 Accounting policies 2.1 Basis of preparation
The principal statements of the group have been prepared in accordance with applicable financial reporting standards and under the historical cost accounting rules, as modified for the revaluation of housing properties. The financial statements are prepared in accordance with the Statement of Recommended Practice - “Accounting by Registered Social Housing Providers Update” (SORP) 2010, and comply with the Accounting Direction for Private Registered Providers of Social Housing 2012. A summary of the more important accounting policies which have been consistently applied in dealing with items which are considered material in relation to the group's financial statements is set out below:
2.2 Turnover
Turnover represents rental receivable in the year, income from shared ownership first tranche sales and other services included at the invoiced value (excluding VAT) of goods and services supplied in the year.
2.3 Revenue Recognition
Rental income is recognised from the point when properties under development reach practical completion or otherwise become available for letting. Income from first tranche sales and sales of properties built for sale is recognised at the point of legal completion of the sale. Revenue grants are receivable when the conditions for receipt of agreed grant funding have been met. Charges for support services funded under Supporting People are recognised as they fall due under the contractual arrangements with Administering Authorities.
2.4 Housing Properties
Housing properties are principally properties available for rent.
Housing properties under construction are stated at cost less related social housing and other capital grants. Cost includes the cost of acquiring land and buildings, development costs, interest charges incurred during the development period and expenditure in respect of improvements. Works to existing properties which replace a component that has been treated separately for depreciation purposes, along with those works that result in an increase in net rental income over the lives of the properties, thereby enhancing the economic benefits of the asset are capitalised as improvements. Shared ownership properties are split proportionally between current and fixed assets based on the element relating to expected first tranche sales. The first tranche proportion is classed as a current asset and related sales proceeds included in turnover, and the remaining element is classed as fixed asset and included in housing properties at cost, less any provisions needed for depreciation or impairment. Valuation – existing housing properties are re-valued annually on the basis set out in Note 12. Any movement during the year is taken to the revaluation reserve (Note 22). Depreciation – The group separately identifies the major components which comprise its housing properties, and charges depreciation, so as to write-down the cost of each component to its estimated residual value, on a straight line basis. Mobile homes are depreciated over their expected useful economic life of 15 years. Where SHG has been allocated to a component; the depreciable amount is arrived at on the basis of original cost, less the proportion of SHG and other grants attributable to the component, less residual value. The group depreciates the major components of its housing properties at the following annual rates: %pa Number of years Structure 1.0 100 Roofs 1.3 75 Bathrooms 3.3 30 Kitchens 4.0 25 Windows and doors 3.3 30 Heating systems 5.0 20 Land is not depreciated

HOUSING SOLUTIONS LIMITED
27
NOTES TO THE ACCOUNTS FOR THE YEAR ENDED 31 MARCH 2015
Social Housing Grant – Social Housing Grant (SHG) is receivable from the Homes and Communities Agency (the HCA) and is utilised to reduce the capital costs of housing properties, including land costs. It is allocated to the land
and structure components of the associated asset in proportion to their cost. Grant receivable in respect of identifiable components is allocated to those components. SHG due from the HCA or received in advance is included as a current asset or liability. SHG received in respect of revenue expenditure is credited to the income and expenditure account in the same period as the expenditure to which it relates. SHG is subordinated to the repayment of loans by agreement with the HCA. SHG released on sale of a property may be repayable but is normally available to be recycled and is credited to a Recycled Capital Grant Fund and included in the balance sheet in creditors. Where individual components are disposed of and this does not create a relevant event for recycling purposes, any grant which has been allocated to the component is released to the income and expenditure account. Upon disposal of the associated property, the group is required to recycle these proceeds, as such a contingent liability is disclosed to reflect this. Other Grants - Other grants are receivable from local authorities and other organisations. Capital grants are utilised to reduce the capital costs of housing properties, including land costs. Grants in respect of revenue expenditure are credited to the income and expenditure account in the same period as the expenditure to which they relate. Impairment - Housing properties, including those with individual components, which are depreciated over a period in excess of 50 years are subject to impairment reviews annually. Other assets are reviewed for impairment if there is an indication that impairment may have occurred. Where there is evidence of impairment, fixed assets are written down to their recoverable amount, being the higher of the net realisable value or the value in use to the group. Any such write down is charged to operating surplus.
Properties for sale – Shared ownership first tranche sales, completed properties for outright sale and property under construction are valued at the lower of cost and net realisable value. Cost comprises materials, direct labour and direct development overheads. Net realisable value is based on estimated sales price after allowing for all further costs of completion and disposal.
Sale of Housing Properties – Sold properties are written out of the accounts at historic cost and any increase or decrease in the existing use value since purchase is transferred to the Revenue Reserve from the Revaluation Reserve. Capitalisation of Interest - Interest is capitalised on borrowings to finance developments to the extent that it accrues in respect of the period of development if it represents either:
interest on borrowings specifically financing the development programme after deduction of social housing grant received in advance; or
a fair amount of interest on borrowings of the association as a whole after deduction of social housing grant received in advance to the extent that they can be deemed to be financing the development programme.
Other interest payable is charged to the income and expenditure account in the year.
Capitalisation of Development Administration Costs - The cost of housing properties comprises their purchase price, together with directly attributable costs in bringing them into working condition for their intended use. Directly attributable costs, in accordance with FRS 15 – Tangible fixed assets, include salary costs of own employees incurred directly in respect of the construction or acquisition of the property, and incremental costs that would have been avoided only if individual properties had not been constructed or acquired.
2.5 Fixed Assets and Depreciation Tangible fixed assets, except housing properties, are stated at cost less accumulated depreciation. Depreciation is charged on a straight-line basis to write off the cost over the following expected useful life of the assets:
Other freehold property 100 years Free/Leasehold premises’ improvements 21 years Office furniture and equipment 5 years Computer equipment 5 years Motor vehicles 5 years Plant & machinery 25 years
2.6 Cyclical Repairs
All actual costs for cyclical repairs are charged to the income and expenditure account as incurred.

HOUSING SOLUTIONS LIMITED
28
NOTES TO THE ACCOUNTS FOR THE YEAR ENDED 31 MARCH 2015 2.7 Leased Assets
Rentals paid under operating leases are charged to the income and expenditure account as incurred. There are no finance leases.
2.8 Value Added Tax (VAT)
The group and its subsidiaries, excluding hsg property services limited, are group registered for VAT, but a large proportion of its income, including rents, is exempt for VAT purposes. The majority of expenditure is subject to VAT which cannot be reclaimed, and is shown gross of VAT. Where a part of the VAT incurred is recovered, this is reflected within the operating costs in the income and expenditure account.
2.9 Pension Costs
The cost of providing defined benefit retirement pensions and related benefits is charged to the income and expenditure account over the period benefiting from the employee’s services in accordance with FRS 17 – Retirement benefits.
2.10 Deferred Taxation
The payment of taxation is deferred or accelerated because of timing differences between the treatment of certain items for accounting and taxation purposes. Except as noted below, full provision for deferred taxation is made under the liability method on all timing differences that have arisen, but not reversed by the balance sheet date. In accordance with FRS 19 – Deferred tax, deferred taxation is not provided for gains on the sale of non-monetary assets, if the taxable gain will probably be rolled over. Deferred taxation is measured at the tax rates that are expected to apply in the periods in which the timing differences are expected to reverse based on tax rates and law enacted or substantively enacted at the Balance Sheet date. Deferred taxation assets and liabilities are not discounted.
2.11 Designated Reserves
The group establishes designated reserves where reserves are earmarked for a particular purpose.
2.12 Financial Instruments
The group does have the appropriate rules to enable it to enter into third party hedging arrangements. However, none are in place at this time. Were such arrangements entered into and not settled at year end a disclosure note would be made showing the fair value, as either a potential asset or liability at that date.
Where loans are re-financed, any gains or losses arising are recognised in the income and expenditure account in the year in which the refinancing takes place, except where the new debt gives the same economic result as the old debt, in which case the cost or benefit is spread over the remaining maturity of the debt.
2.13 Basis of consolidation
The consolidated accounts include the parent and its subsidiaries. Intra-group surpluses and deficits are eliminated on consolidation. Housing Solutions Limited is the parent with HSG Property Services Limited and Housing Solutions Capital PLC being active subsidiaries during the year. Payton Homes Limited and Fenhatch Limited are dormant companies. These bodies are subsidiaries by virtue of the power of Housing Solutions Limited to control the composition of their boards of management.
2.14 Revaluation Reserve
The difference between the market value of current asset investments and the historical cost carrying value is credited to the Revaluation Reserve. When housing properties are revalued, the difference between the carrying value of the properties and the valuation is credited to the housing property revaluation reserve.

HOUSING SOLUTIONS LIMITED
29
NOTES TO THE ACCOUNTS FOR THE YEAR ENDED 31 MARCH 2015 3 PARTICULARS OF TURNOVER, COST OF SALES, OPERATING COSTS AND OPERATING SURPLUS
GROUP 2015 2015 2015 2015 Turnover
£000 Cost of sales
£000 Operating costs
£000 Operating surplus
£000
Social housing lettings 31,475 - (17,416) 14,059 Other social housing activities Lifeline alarm system 159 - (92) 67Shared Ownership 2,238 (1,809) - 429 Non social housing activity Supporting people 129 - - 129Market rent accommodation 542 - (87) 455 Agency services 140 - (153) (13)Garages 253 - (31) 222External maintenance contracts 1,478 - (1,378) 100 Other activities 322 (28) (93) 201Total 36,736 (1,837) (19,250) 15,649
2014 2014 2014 2014 Turnover
£000 Cost of sales
£000 Operating costs
£000 Operating surplus
£000
Social housing lettings 29,920 - (16,903) 13,017 Other social housing activities
Lifeline alarm system 138 - (85) 53 Shared Ownership 1,821 (1,377) - 444
Non social housing activity Supporting people 143 - - 143Market rent accommodation 360 - (105) 255 Agency services 154 - (141) 13Garages 267 - (45) 222External maintenance contracts 1,281 - (1,198) 83 Other activities 311 (28) (91) 192Total 34,395 (1,405) (18,568) 14,422

HOUSING SOLUTIONS LIMITED
30
NOTES TO THE ACCOUNTS FOR THE YEAR ENDED 31 MARCH 2015 3 PARTICULARS OF TURNOVER, COST OF SALES, OPERATING COSTS AND OPERATING SURPLUS
ASSOCIATION 2015 2015 2015 2015 Turnover
£000 Cost of sales
£000 Operating costs
£000 Operating surplus
£000
Social housing lettings 31,475 - (17,427) 14,048 Other social housing activities Lifeline alarm system 159 - (92) 67 Shared Ownership 2,238 (1,809) - 429 Non social housing activity Supporting people 129 - - 129Market rent accommodation 542 - (87) 455Agency services 140 - (153) (13) Garages 253 - (31) 222External maintenance contracts 1,478 - (1,378) 100Other activities 112 - - 112Total 36,526 (1,809) (19,168) 15,549
2014 2014 2014 2014 Turnover
£000 Cost of sales
£000 Operating costs
£000 Operating surplus
£000
Social housing lettings 29,920 - (16,964) 12,956
Other social housing activities Lifeline alarm system 138 - (85) 53 Shared Ownership 1,821 (1,377) - 444
Non social housing activity Supporting people 143 - - 143 Market rent accommodation 360 - (105) 255 Agency services 154 - (141) 13Garages 267 - (45) 222 External maintenance contracts 1,281 - (1,198) 83Other activities 103 - (6) 97Total 34,187 (1,377) (18,544) 14,266

HOUSING SOLUTIONS LIMITED
31
NOTES TO THE ACCOUNTS FOR THE YEAR ENDED 31 MARCH 2015 3 PARTICULARS OF INCOME AND EXPENDITURE FROM SOCIAL HOUSING LETTINGS
GROUP (CONTINUED)
2015 2014 General
needs housing
Supported housing and
housing for older people
Key worker housing
Care homes
Low cost home ownership
Total Total
£000 £000 £000 £000 £000 £000 £000 Rent receivable net of identifiable service charges 21,145 3,376 257 4,443 835 30,056 28,559 Service income 691 544 - 17 167 1,419 1,361 Turnover from social housing lettings 21,836 3,920 257 4,460 1,002 31,475 29,920 Expenditure Management and other operating expenses 3,758 600 46 790 148 5,342 5,226 Services 730 540 8 57 75 1,410 1,431 Routine maintenance 1,480 667 30 468 19 2,664 2,599 Major Repairs expenditure 2,117 213 4 249 5 2,588 2,808 Bad debts 137 22 2 29 5 195 127 Property lease charges 9 - - - - 9 10 Depreciation of housing properties 3,089 493 38 649 122 4,391 3,918 Other costs 574 92 7 121 23 817 784 Operating costs on social housing lettings 11,894 2,627 135 2,363 397 17,416 16,903 Operating surplus on social housing lettings 9,942 1,293 122 2,097 605 14,059 13,017 Void losses 102 347 4 - 14 467 461

HOUSING SOLUTIONS LIMITED
32
NOTES TO THE ACCOUNTS FOR THE YEAR ENDED 31 MARCH 2015 3 PARTICULARS OF INCOME AND EXPENDITURE FROM SOCIAL HOUSING LETTINGS
ASSOCIATION (CONTINUED)
2015 2014 General
needs housing
Supported housing and
housing for older people
Key worker housing
Care homes
Low cost home ownership
Total Total
£000 £000 £000 £000 £000 £000 £000 Rent receivable net of identifiable service charges 21,145 3,376 257 4,443 835 30,056 28,559 Service income 691 544 - 17 167 1,419 1,361 Turnover from social housing lettings 21,836 3,920 257 4,460 1,002 31,475 29,920 Expenditure Management and other operating expenses 3,758 600 46 790 148 5,342 5,287 Services 741 540 8 57 75 1,421 1,431 Routine maintenance 1,480 667 30 468 19 2,664 2,599 Major Repairs expenditure 2,117 213 4 249 5 2,588 2,808 Bad debts 137 22 2 29 5 195 127 Property lease charges 9 - - - - 9 10 Depreciation of housing properties 3,089 493 38 649 122 4,391 3,918 Other costs 574 92 7 121 23 817 784 Operating costs on social housing lettings 11,905 2,627 135 2,363 397 17,427 16,964 Operating surplus on social housing lettings 9,931 1,293 122 2,097 605 14,048 12,956 Void losses 102 347 4 - 14 467 461

HOUSING SOLUTIONS LIMITED
33
NOTES TO THE ACCOUNTS FOR THE YEAR ENDED 31 MARCH 2015 4 ACCOMMODATION IN MANAGEMENT AND DEVELOPMENT GROUP AND ASSOCIATION At the end of the year accommodation in management for each class of accommodation was as follows: Group
2015 Group
2014 Association
2015 Association
2014 Number Number Number Number Social housing General needs 3,443 3,378 3,443 3,378 Supported housing and housing for older people 597 561 597 561Low cost home ownership 225 217 225 217Key worker housing 30 29 30 29 Residential care homes 733 713 733 713Total owned 5,028 4,898 5,028 4,898 Accommodation managed for others 101 112 101 112 Total owned and managed 5,129 5,010 5,129 5,010 Non-social housing Market rent 120 39 120 39 Total owned and managed 120 39 120 39 Accommodation in development at the year end 471 541 471 541
The group manages accommodation for One Housing Group a registered social landlord.

HOUSING SOLUTIONS LIMITED
34
NOTES TO THE ACCOUNTS FOR THE YEAR ENDED 31 MARCH 2015 5. Directors emoluments
The members of the board received remuneration for services provided as Directors of £45,819 (2014 - £42,731). The remuneration paid to the Executive Directors of Housing Solutions Group (defined as the Group Chief Executive, the Group Business Director, the Group Finance Director, the Group Operations Director and the Group Commercial Director) was:
2015 2014 £000 £000 Emoluments including benefits in kind 483 507 Pension contributions 63 57 546 564 Emoluments (excluding pension contributions)
paid to:
The highest paid Director (the Group Chief Executive) Pension contributions to a defined benefit scheme
123 21
121 20
144 141 6. Employee information 2015 2014 Number Number The average weekly number of full-time equivalent persons (including the Group
Chief Executive)
Office staff 107 99 Sheltered housing mangers, caretakers and cleaners 9 6 Building maintenance staff 53 42 169 147 2015 2014 £000 £000 Staff costs (for the above persons): Wages and salaries 5,226 5,215 Social security costs 455 451 Pension costs - Contributions 678 567 6,359 6,233
The full time equivalent number of staff who received emoluments:
2015 Number
2014 Number
£80,001 to £90,000 2 2 £90,001 to £100,000 2 2 £110,001 to £120,000 - - £120,001 to £130,000 1 1

HOUSING SOLUTIONS LIMITED
35
NOTES TO THE ACCOUNTS FOR THE YEAR ENDED 31 MARCH 2015
Group Group
7. Operating Surplus 2015 £000
2014 £000
Operating surplus is stated after charging/(crediting): Depreciation - housing stock 4,391 3,918 - other assets 393 372 Operating lease rentals: - hire of motor vehicles 40 40 - other leases 21 26 Auditors remuneration (including VAT) - for audit purposes 26 26 - for non-audit purposes - - - tax compliance 4 3 - other 1 1 Internal Auditors remuneration
36 32
Group Group Association Association
9. Interest Receivable and Similar Income 2015 2014 2015 2014 £000 £000 £000 £000
Intercompany interest receivable - - 51 128 Interest receivable 192 183 191 156 Surplus on revaluation of investment 735 - 735 - 927 183 977 284
Group Group 8. Profit on Sale of Fixed Assets – Housing properties 2015 2014 £000 £000 Disposal proceeds 9,927 3,985 Cost of sales (administration) (53) (4) Carrying value of fixed assets (6,445) (2,811) Profit on sale of fixed assets 3,429 1,170

HOUSING SOLUTIONS LIMITED
36
NOTES TO THE ACCOUNTS FOR THE YEAR ENDED 31 MARCH 2015 10. Interest Payable and Similar Charges Group Group Association Association 2015 2014 2015 2014 £000 £000 £000 £000 Loans and bank overdrafts 12,172 9,996 6,120 4,220 Interest payable to group companies - - 6,054 5,776 Interest payable capitalised on housing properties under
construction
(950)
(1,351)
(950)
(1,351) Other interest - 3 - - Breakage Costs 538 - 538 - Deficit on revaluation of investment - 375 - 375
11,760
9,023
11,762
9,020
Capitalisation rate used to determine the finance costs capitalised during the period
4.5%
4.5%
4.5%
4.5%
Corporation Tax
11.
Analysis of Charge in Period
UK Corporation Tax on surplus for the year. The reconciliation to the expected charge is as follows
Group Group
Association Association
2015 2014 2015 2014 £000 £000 £000 £000
Reconciliation of current tax charge
Surplus per accounts 8,245 6,752 8,193 6,700
Expected tax at 21% (2014: 23%) (1,732) (1,553) (1,721) (1,541)
Explained by:
Charitable activities 1,721 1,541 1,721 1,541
Capital allowances in excess of depreciation 10 53 - -
Unrelieved tax losses 1 (41) - -
Current tax charge for the period - - - -

HOUSING SOLUTIONS LIMITED
37
NOTES TO THE ACCOUNTS FOR THE YEAR ENDED 31 MARCH 2015 12 TANGIBLE FIXED ASSETS - PROPERTIES
GROUP Housing Properties and Mobile
Homes
Housing Properties
under Construction
Shared Ownership Properties
Shared Ownership Properties Under
Construction
Total
£000 £000 £000 £000 £000 Cost or Valuation at 1 April 2014 413,587 25,178 19,030 2,673 460,468
Completed
12,852
(12,852)
3,468
(3,468)
- Additions 9,573 11,112 1,768 3,538 25,991 Disposals/Write offs (194) - - - (194) Improvements/Capitalised Repairs 1,188 - - - 1,188 Revaluation 16,812 - (3,304) - 13,508 Valuation adjustment 784 - 235 - 1,019 At 31 March 2015 454,602 23,438 21,197 2,743 501,980 Depreciation at 1 April 2014 (33,443) (702) (1,760) - (35,905)
Depreciation charged in year (3,457) - (182) - (3,639)
Revaluation depreciation Depreciation charged in the year Eliminated on revaluation
(714) 4,171
(4,171)
- - -
(38) 220
(220)
- - -
(752) 4,391
(4,391) Released on disposal 147 - 154 - 301 At 31 March 2015 (37,467) (702) (1,826) - (39,995) Net book value as at 31 March 2015 417,135 22,736 19,371 2,743 461,985 Net book value as at 31 March 2014 380,144 24,476 17,270 2,673 424,563 Cost or valuation at 31 March 2015 is
represented by:
Gross Cost 282,001 22,736 21,017 2,743 328,497 Historic Cost Depreciation (13,679) - (1,371) - (15,050)
Less SHG (52,597) - (5,989) - (58,586) Revaluation 201,410 - 5,714 - 207,124 Total 417,135 22,736 19,371 2,743 461,985 During the year work to existing properties to the value of £1,188,000 (2014: £429,000) was capitalised. A further £2,664,000 (2014: £2,599,000) was spent on routine maintenance and £2,588,000 (2014: £2,808,000) on major repairs expenditure.
Long leasehold and freehold housing properties include £950,000 (2014: £1,350,000) of capitalised interest in the year. Social housing grant relating to housing properties in the course of construction is matched to the cost of the development at year end creating a current asset for grant to be received and a current liability for grant received in advance. Housing properties were valued at £436.5m (2014: £397.4m) on the basis of Existing Use Valuation for Social Housing (EUV-SH). The existing use value assumes a theoretical sale subject to the tenancies subsisting on 31 March 2015 to a buyer approved by the Homes and Communities Agency. The valuation method discounted the cash flows from rental and other income less management, maintenance and repair expenditure to their present value using a discount rate of 5.75% (2014: 5.75%). The rent increases have been assumed based on the Rent Influencing Regime (rent restructuring). The full valuation of all properties was carried out as at 31 March 2015 by Jones Lang LaSalle, 30 Warwick Street, London, W1B 5NH, a firm providing valuation and consultancy, in accordance with the Royal Institution of Chartered Surveyors (RICS) Appraisal and Valuation Manual. The valuer is “external.”

HOUSING SOLUTIONS LIMITED
38
NOTES TO THE ACCOUNTS FOR THE YEAR ENDED 31 MARCH 2015 12 TANGIBLE FIXED ASSETS – PROPERTIES
ASSOCIATION Housing Properties and Mobile
Homes
Housing Properties
under Construction
Shared Ownership Properties
Shared Ownership Properties Under
Construction
Total
£000 £000 £000 £000 £000 Cost or Valuation at 1 April 2014 413,587 25,178 19,030 2,673 460,468
Completed
12,852
(12,852)
3,468
(3,468)
- Additions 9,573 11,112 1,768 3,538 25,991 Disposals/Write offs (194) - - - (194) Improvements/Capitalised Repairs 1,188 - - - 1,188 Revaluation 16,812 - (3,304) - 13,508 Valuation adjustment 784 - 235 - 1,019 At 31 March 2015 454,602 23,438 21,197 2,743 501,980 Depreciation at 1 April 2014 (33,443) (702) (1,760) - (35,905)
Depreciation charged in year (3,457) - (182) - (3,639)
Revaluation depreciation Depreciation charged in the year Eliminated on revaluation
(714) 4,171
(4,171)
- - -
(38) 220
(220)
- - -
(752) 4,391
(4,391) Released on disposal 147 - 154 - 301 At 31 March 2015 (37,467) (702) (1,826) - (39,995) Net book value as at 31 March 2015 417,135 22,736 19,371 2,743 461,985 Net book value as at 31 March 2014 380,144 24,476 17,270 2,673 424,563 Cost or valuation at 31 March 2015 is
represented by:
Gross Cost 282,001 22,736 21,017 2,743 328,497 Historic Cost Depreciation (13,679) - (1,371) - (15,050)
Less SHG (52,597) - (5,989) - (58,586) Revaluation 201,410 - 5,714 - 207,124 Total 417,135 22,736 19,371 2,743 461,985 During the year work to existing properties to the value of £1,188,000 (2014: £429,000) was capitalised. A further £2,664,000 (2014: £2,599,000) was spent on routine maintenance and £2,588,000 (2014: £2,808,000) on major repairs expenditure.
Long leasehold and freehold housing properties include £950,000 (2014: £1,350,000) of capitalised interest in the year. Social housing grant relating to housing properties in the course of construction is matched to the cost of the development at year end creating a current asset for grant to be received and a current liability for grant received in advance. Housing properties were valued at £436.5m (2014: £397.4m) on the basis of Existing Use Valuation for Social Housing (EUV-SH). The existing use value assumes a theoretical sale subject to the tenancies subsisting on 31 March 2015 to a buyer approved by the Homes and Communities Agency. The valuation method discounted the cash flows from rental and other income less management, maintenance and repair expenditure to their present value using a discount rate of 5.75% (2014: 5.75%). The rent increases have been assumed based on the Rent Influencing Regime (rent restructuring). The full valuation of all properties was carried out as at 31 March 2015 by Jones Lang LaSalle, 30 Warwick Street, London, W1B 5NH, a firm providing valuation and consultancy, in accordance with the Royal Institution of Chartered Surveyors (RICS) Appraisal and Valuation Manual. The valuer is “external.”

HOUSING SOLUTIONS LIMITED
39
NOTES TO THE ACCOUNTS FOR THE YEAR ENDED 31 MARCH 2015
12 TANGIBLE FIXED ASSETS - OTHER
GROUP Plant & Machinery
Other Freehold Property
Motor Vehicles
Furniture and
Equipment
Free/ Leasehold
Improve- ments
Computer Equipment
Total
£000 £000 £000 £000 £000 £000 £000 Cost at 1 April 2014
2,081 7,124 154 133 985 1,929 12,406
Additions 2 10 - 119 102 254 487 Disposals/Write-off - - (24) - - - (24)At 31 March 2015 2,083 7,134 130 252 1,087 2,183 12,869
Depreciation at 1 April 2014
(156) (406) (145) (102) (527) (1,358) (2,694)
Charge for Year (77) (46) (1) (24) (47) (197) (393)Adjustment re Write-off
- - 24 - - - 24
At 31 March 2015 (233) (452) (122) (126) (574) (1,555) (3,063) Net book value as at 31 March 2015
1,850
6,682
8
126
513
628
9,806
Net book value as at 31 March 2014
1,925
6,718
9
31
458
571
9,712
ASSOCIATION Other
Freehold Property
Motor Vehicles
Furniture and
Equipment
Free/ Leasehold
Improve- ments
Computer Equipment
Total
£000 £000 £000 £000 £000 £000 Cost at 1 April 2014
7,124 154 133 985 1,929 10,325
Additions 10 - 119 102 254 485Disposals/Write-off - (24) - - - (24) At 31 March 2015 7,134 130 252 1,087 2,183 10,786 Depreciation at 1 April 2014
(406) (145) (102) (527) (1,358) (2,538)
Charge for Year (46) (1) (24) (47) (197) (315)Adjustment re Write-off
- 24 - - - 24
At 31 March 2015 (452) (122) (126) (574) (1,555) (2,829)Net book value as at 31 March 2015
6,682
8
126
513
628
7,957
Net book value as at 31 March 2014
6,718
9
31
458
571
7,787

HOUSING SOLUTIONS LIMITED
40
NOTES TO THE ACCOUNTS FOR THE YEAR ENDED 31 MARCH 2015
13. Investment in subsidiaries As required by statute, the financial statements consolidate the results of HSG Property Service Limited , Housing Solutions Capital PLC and Payton Homes Limited are all both subsidiaries of the association. The association has the right to appoint members to the boards of the subsidiaries and thereby exercises control over them.
% Shareholding
Country of incorporation
Principal Activity
HSG Property Services Limited 100 England Provides photo voltaic panels and other energy saving solutions to save costs and creates revenue for the group
Housing Solutions Capital PLC 100 England Facilitates capital market funding for the group
Payton Homes Limited 100 England Property lettings agent (dormant)
14. Long term investment Group
2015 £000
Group
2014 £000
Association
2015 £000
Association
2014 £000
Investment in Housing Solutions Capital PLC - - 50 50 - - 50 50
15. Properties for Sale Group
2015 £000
Group
2014 £000
Association
2015 £000
Association
2014 £000
Shared ownership properties 2,686 2,361 2,686 2,361 2,686 2,361 2,686 2,361
16. Debtors Group
2015 £000
Group
2014 £000
Association
2015 £000
Association
2014 £000
Due within one year Rent and service charge receivable 1,278 971 1,278 971 Less provision for bad and doubtful debts (623) (486) (623) (486) 655 485 655 485 Other tax and social security - 128 - 128 Prepayments and accrued income
Amounts owed by group undertakings 320
-279
-320
1,663 279
1,926 Other debtors 2,103 1,584 2,067 1,521 3,078 2,476 4,705 4,339
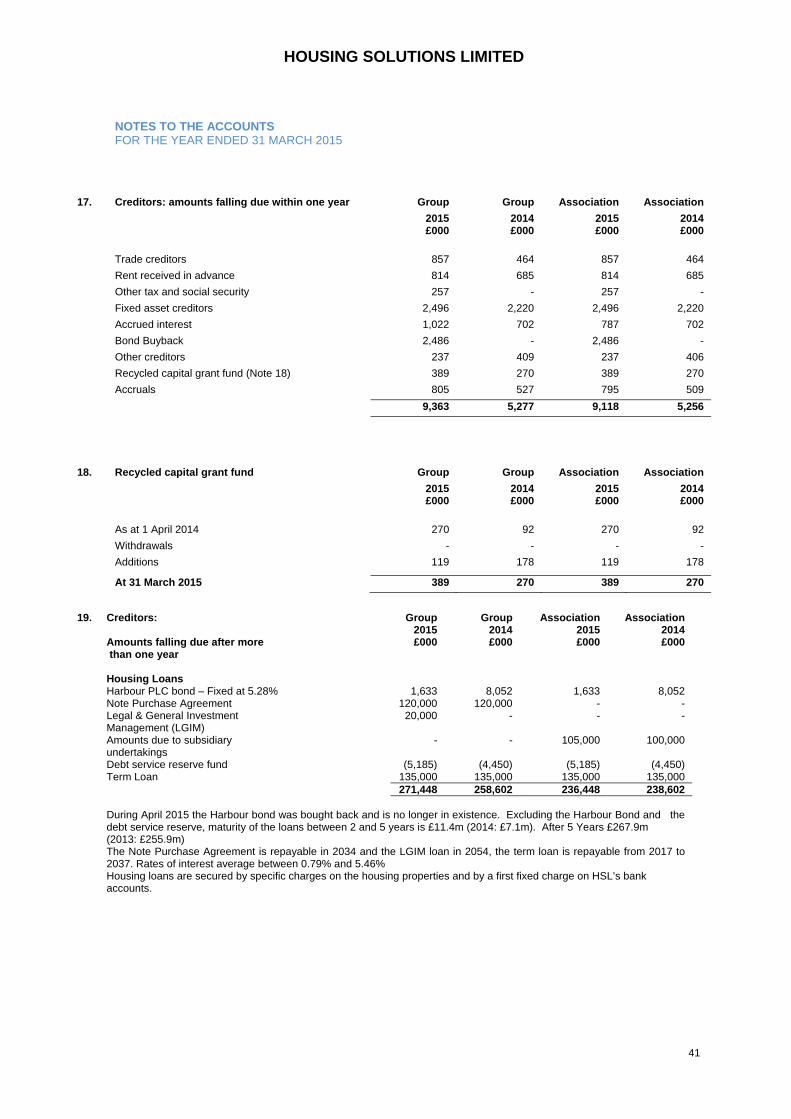
HOUSING SOLUTIONS LIMITED
41
NOTES TO THE ACCOUNTS
FOR THE YEAR ENDED 31 MARCH 2015
17. Creditors: amounts falling due within one year Group Group Association Association
2015 £000
2014 £000
2015 £000
2014 £000
Trade creditors 857 464 857 464
Rent received in advance 814 685 814 685
Other tax and social security 257 - 257 -
Fixed asset creditors 2,496 2,220 2,496 2,220
Accrued interest 1,022 702 787 702
Bond Buyback 2,486 - 2,486 -
Other creditors 237 409 237 406
Recycled capital grant fund (Note 18) 389 270 389 270
Accruals 805 527 795 509
9,363 5,277 9,118 5,256
18. Recycled capital grant fund Group Group Association Association
2015 £000
2014 £000
2015 £000
2014 £000
As at 1 April 2014 270 92 270 92
Withdrawals - - - -
Additions 119 178 119 178
At 31 March 2015 389 270 389 270
19. Creditors: Group Group Association Association
Amounts falling due after more than one year Housing Loans
2015 £000
2014 £000
2015 £000
2014 £000
Harbour PLC bond – Fixed at 5.28% 1,633 8,052 1,633 8,052 Note Purchase Agreement 120,000 120,000 - - Legal & General Investment
Management (LGIM) 20,000 - - -
Amounts due to subsidiary undertakings
- - 105,000 100,000
Debt service reserve fund (5,185) (4,450) (5,185) (4,450) Term Loan 135,000 135,000 135,000 135,000 271,448 258,602 236,448 238,602 During April 2015 the Harbour bond was bought back and is no longer in existence. Excluding the Harbour Bond and the
debt service reserve, maturity of the loans between 2 and 5 years is £11.4m (2014: £7.1m). After 5 Years £267.9m (2013: £255.9m) The Note Purchase Agreement is repayable in 2034 and the LGIM loan in 2054, the term loan is repayable from 2017 to 2037. Rates of interest average between 0.79% and 5.46%
Housing loans are secured by specific charges on the housing properties and by a first fixed charge on HSL’s bank accounts.

HOUSING SOLUTIONS LIMITED
42
NOTES TO THE ACCOUNTSFOR THE YEAR ENDED 31 MARCH 2015
20. Non-equity share capital Association Association 2015
Number 2014
Number Shares of £1 each issued and fully paid At 1 April 2014 9 9 Shares issued during the year - - Shares surrendered during
the year
-
- As at 31 March 2015 9 9 21. Revaluation Reserve Group Group Association Association 2015
£000 2014 £000
2015 £000
2014 £000
At 1 April 2014 179,514 165,863 179,514 165,863 Revaluation during the year 13,508 14,511 13,508 14,511 Transfer to revenue reserve (752) (860) (752) (860) As at 31 March 2015 192,270 179,514 192,270 179,514 22. Revenue Reserve Group Group Association Association
2015 2014 2015 2014 £000 £000 £000 £000 At 1 April 2014 32,313 26,194 32,295 26,228 Surplus for the year 8,245 6,752 8,193 6,700 Actuarial (losses)/gains on pension scheme (3,516) (1,493) (3,516) (1,493) Transfer from revaluation reserve 752 860 752 860 Surplus as at 31 March 2015 37,794 32,313 37,724 32,295
23. Leasing commitments Group and
Association Group and
Association Group and
Association Group and
Association 2015 2015 2014 2014 Motor Vehicles Other
Leases Motor Vehicles Other Leases
£000 £000 £000 £000
The group has annual commitments in respect of non cancellable operating leases as follow:-
Expiring within one year 27 5 24 11 Expiring between two and five years 13 15 16 15 40 20 40 26 24. Capital Commitments Group Group Association Association 2015 2014 2015 2014 £000 £000 £000 £000
Capital expenditure that has been contracted for but has not been provided for in the financial statements 27,476 39,596 27,476 39,596
Capital expenditure that has been authorised by the
board but has not been contracted for 6,923 12,019 6,923 12,019 The total amount contracted for at 31 March 2015 relates to approved schemes for which grant approval has been received,
private finance arranged or which will be met from the group’s own resources.

HOUSING SOLUTIONS LIMITED
43
NOTES TO THE ACCOUNTS FOR THE YEAR ENDED 31 MARCH 2015 25. Cashflow 2015 2014 £000 £000 (i) Net cash inflow from operating activities Operating surplus 15,649 14,422 Depreciation 4,784 4,290 Defined benefit pension operating charge 717 625 Impact of settlements and curtailments - - Net return on assets 413 337 Defined benefit pension contributions paid (665) (574) 20,898 19,100 Working capital movements Properties for sale (325) (2,361) Debtors (631) 1,111 Creditors 3,623 (1,222) Net cash inflow from operating activities 23,565 16,628 (ii) Reconciliation of net cashflows to movements in net debt As at 31 March
2015 As at 31 March 2014
£000 £000 Increase/(Decrease) in cash 717 29,000 Cash inflow from increase in debt (13,581) (50,000) Change in net debt resulting from cash flows (12,864) (21,000) Change in market value of debt service reserve 735 (375) Movement in net debt for the period (12,129) (21,375) Net Debt at 1 April 2014 (212,492) (191,117) Net Debt at 31 March 2015 (224,621) (212,492) (iii) Analysis of changes in net debt 1 April
2014 Cashflow Non-cash
movement 31 March
2015 £000 £000 £000 £000 Cash at bank and in hand 46,110 717 - 46,827 Investment - - - - Changes in cash 46,110 717 - 46,827
Loans (258,602) (13,581) 735 (271,448)
Net Debt (212,492) (12,864) 735 (224,621)

HOUSING SOLUTIONS LIMITED
44
NOTES TO THE ACCOUNTS FOR THE YEAR ENDED 31 MARCH 2014 26. Pensions Circa 54% of the group’s employees are members of the Royal County of Berkshire Pension Scheme.
The pension cost includes £665,000 of contributions payable by the group to this fund this year. The Royal County of Berkshire Pension Scheme is a defined benefit scheme providing benefits based on final pensionable pay. The group’s actuarial liabilities in respect of the scheme are subject to triennial valuation by independent actuaries. The most recent actuarial valuation showed that the market value of the scheme’s assets was £1,572 million and that the actuarial value of these assets represented 87% of the benefits that had accrued to members. The required contribution was calculated on the following assumptions:
% per annum
Investment return - Equities - Corporate Bonds
6.9% 3.9%
Rate of salary increase 4.5% Rate of pension increase 2.7% Employer’s contribution 18.4% Date of the last valuation 31 March 2013
The estimated asset distribution of the Fund as a whole, as at 31 March 2013, is as follows:
Assets Asset
Distribution
£m % Absolute Return 140 9% Commodities 153 10% Hedge Funds 132 8% Infrastructure 73 5% Equities 641 41% Bonds 243 15% Property 147 9% Gilts and Cash 43 3% Total 1,572 100%
The above information refers to the Fund as a whole, as the asset distribution of the group has not been provided. In order to comply with the additional disclosures required under FRS17, the Actuary has updated assumptions as follows: 2015 2014 2013 % per annum % per annum % per annum Rate of salary increase 3.30% 3.60% 3.40%Rate of pension increase 2.5% 2.8% 2.6% Employer’s contribution Discount rate Inflation assumption
18.4% 3.4% 3.3%
17.6% 4.5% 3.6%
16.9% 4.6% 3.4%

HOUSING SOLUTIONS LIMITED
45
NOTES TO THE ACCOUNTS FOR THE YEAR ENDED 31 MARCH 2015
26. Pensions (continued) The estimated asset distribution of the Fund as a whole, as at 31 March 2015, is as follows:
Assets Asset
Distribution Asset
Distribution Asset
Distribution
2015 2014 2013 Equities 44.0% 42.0% 41.0% Bonds 15.0% 17.0% 22.0% Property 12.0% 12.0% 10.0% Cash 5% 2% 0% Other 24% 27% - Alternative Assets 0% 0% 27.0% Total 100% 100% 100% The above information refers to the Fund as a whole, as the asset distribution of the group has not been provided. Additional disclosures required under the provisions of FRS17 –
Housing Solutions Group 2015 £000
2014 £000
2013 £000
2012 £000
2011 £000
Share of net pension fund deficit measured under FRS17 as at 31 March 2015 comprised the following:
Total market value of assets 15,297 13,754 12,451 11,097 10,848 Present Value of pension fund liabilities (28,733) (23,204) (20,077) (18,534) (16,514) Present Value of unfunded liabilities (71) (66) - - - FRS17 pension fund deficit recognised in the balance sheet (13,507) (9,516) (7,626) (7,437) (5,666) The following amounts have been recognised in the financial statements in
the year ended 31 March 2015 under the requirements of FRS 17: 2015 £000
2014 £000
2013 £000
2012 £000
2011 £000
Operating Surplus: Service Cost 717 625 567 615 (1,255) Total operating charge
717 625 567 615 (1,255)
Net interest on the defined liability (asset) (413) (337) (332) (262) (434) Statement of total recognised surpluses and deficits (STRSD): Return on Fund assets in excess of interest 672 - - - - Other actuarial gains on assets - 471 - - - Actual return less expected return on pension scheme assets - - 574 (684) (330) Experience loss on defined benefit obligation (1) (1,487) (3) - - Changes in financial assumptions underlying the present value of the
scheme liabilities (4,187) (477) (480) (774) 2,776 Actuarial (loss)/gain recognised in STRSD
(3,516)
(1,493)
91
(1,458)
2,446 Reconciliation of opening & closing balances of the present value of the
defined benefit obligation
Opening defined benefit obligation 23,270 20,077 18,534 16,514 19,654 Current service 717 625 521 525 742 Interest cost 1,038 916 846 918 1,074 Change in financial assumptions 4,187 971 - - - Change in demographic assumptions - (494) - - - Experience loss on defined benefit obligation 1 1,487 482 774 (2,776) Losses (gains) on curtailments - - 50 93 - Estimated benefit paid net of transfers in (668) (528) (548) (476) (386) Past service cost - - - - (1,994) Contributions by scheme participants 263 220 196 190 204 Unfunded pension payments (4) (4) (4) (4) (4) Closing defined benefit obligation 28,804 23,270 20,077 18,534 16,514
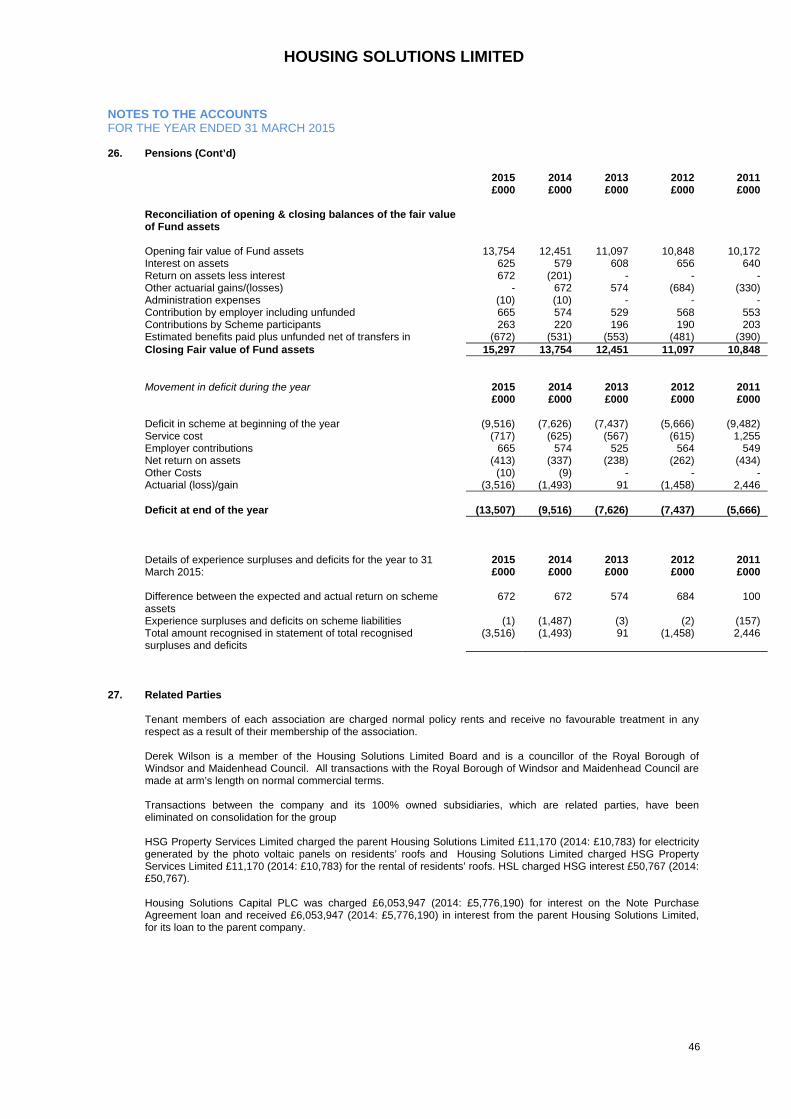
HOUSING SOLUTIONS LIMITED
46
NOTES TO THE ACCOUNTS FOR THE YEAR ENDED 31 MARCH 2015 26.
Pensions (Cont’d)
2015 £000
2014 £000
2013 £000
2012 £000
2011 £000
Reconciliation of opening & closing balances of the fair value
of Fund assets
Opening fair value of Fund assets 13,754 12,451 11,097 10,848 10,172 Interest on assets 625 579 608 656 640 Return on assets less interest 672 (201) - - - Other actuarial gains/(losses) - 672 574 (684) (330) Administration expenses (10) (10) - - - Contribution by employer including unfunded 665 574 529 568 553 Contributions by Scheme participants 263 220 196 190 203 Estimated benefits paid plus unfunded net of transfers in (672) (531) (553) (481) (390) Closing Fair value of Fund assets 15,297 13,754 12,451 11,097 10,848 Movement in deficit during the year
2015 £000
2014 £000
2013 £000
2012 £000
2011 £000
Deficit in scheme at beginning of the year (9,516) (7,626) (7,437) (5,666) (9,482) Service cost (717) (625) (567) (615) 1,255 Employer contributions 665 574 525 564 549 Net return on assets (413) (337) (238) (262) (434) Other Costs (10) (9) - - - Actuarial (loss)/gain (3,516) (1,493) 91 (1,458) 2,446
Deficit at end of the year
(13,507)
(9,516)
(7,626)
(7,437)
(5,666) Details of experience surpluses and deficits for the year to 31
March 2015:
2015 £000
2014 £000
2013 £000
2012 £000
2011 £000
Difference between the expected and actual return on scheme
assets 672 672 574 684 100
Experience surpluses and deficits on scheme liabilities (1) (1,487) (3) (2) (157) Total amount recognised in statement of total recognised
surpluses and deficits (3,516) (1,493) 91 (1,458) 2,446
27. Related Parties
Tenant members of each association are charged normal policy rents and receive no favourable treatment in any respect as a result of their membership of the association. Derek Wilson is a member of the Housing Solutions Limited Board and is a councillor of the Royal Borough of Windsor and Maidenhead Council. All transactions with the Royal Borough of Windsor and Maidenhead Council are made at arm’s length on normal commercial terms.
Transactions between the company and its 100% owned subsidiaries, which are related parties, have been eliminated on consolidation for the group HSG Property Services Limited charged the parent Housing Solutions Limited £11,170 (2014: £10,783) for electricity generated by the photo voltaic panels on residents’ roofs and Housing Solutions Limited charged HSG Property Services Limited £11,170 (2014: £10,783) for the rental of residents’ roofs. HSL charged HSG interest £50,767 (2014: £50,767). Housing Solutions Capital PLC was charged £6,053,947 (2014: £5,776,190) for interest on the Note Purchase Agreement loan and received £6,053,947 (2014: £5,776,190) in interest from the parent Housing Solutions Limited, for its loan to the parent company.

HOUSING SOLUTIONS LIMITED
47
NOTES TO THE ACCOUNTS FOR THE YEAR ENDED 31 MARCH 2015 28. Legislative Provisions The association is incorporated under the Co-Operative and Community Benefit Societies Act 2014, Registration No.
27876R and is a Registered Social Landlord under the Housing Act 1974, Registration No. L4073 29. 30.
Principal activities of subsidiaries HSG Property Services Limited provides photo voltaic panels on residents’ roofs providing residents with an efficient source of energy and creates revenue for the group through the Feed In Tariff programme. Housing Solutions Capital PLC is set up to facilitate capital market funding for the Group. Post Balance Sheet Event The budget announcement on July 8th included proposed changes in the rent charging regulations applicable to all registered Housing Associations. The main change proposed a reduction in social housing general needs rents by 1% each year for the 4 years commencing April 1st 2016. Previously the formula had been increases linked to CPI + 1% margin. The effect this has on HSL is twofold – firstly, it may reduce our margins going forward and secondly, it may reduce the accounts valuation of our assets which is used for gearing covenant calculation. In respect of our margins, we have had a strong ratio of operating surplus to turnover, and we also have a mix of non-general needs properties such as Shared Ownership which are not affected by the rent reductions. We have modelled the effects and there will be no breach of our interest cover covenant in the near future. In respect of the valuation issue, we have commissioned an independent valuation update from Jones Lang LaSalle Ltd which indicates we will remain within our gearing covenant over at least the next three years. We also have adequate security to be able to meet our asset cover covenants especially since the security valuations are higher than the accounts valuations due to mortgagee in possession clauses.