Handwriting fluency and the quality of primary grade ...
30
Vol.:(0123456789) Reading and Writing https://doi.org/10.1007/s11145-021-10185-y 1 3 Handwriting fluency and the quality of primary grade students’ writing Gustaf B. Skar 1 · Pui‑Wa Lei 2 · Steve Graham 3 · Arne Johannes Aasen 1 · Marita Byberg Johansen 1 · Anne Holten Kvistad 1 Accepted: 24 June 2021 © The Author(s) 2021 Abstract Until children can produce letters quickly and accurately, it is assumed that hand- writing disrupts and limits the quality of their text. This investigation is the largest study to date (2596 girls, 2354 boys) assessing the association between handwriting fluency and writing quality. We tested whether handwriting fluency made a statisti- cally unique contribution to predicting primary grade students’ writing quality on a functional writing task, after variance due to attitude towards writing, students’ language background (L1, L2, bilingual), gender, grade, and nesting due to class and school were first controlled. Handwriting fluency accounted for a statistically significant 7.4% of the variance in the writing quality of primary grade students. In addition, attitude towards writing, language background, grade and gender each uniquely predicted writing quality. Finally, handwriting fluency increased from one grade to the next, girls had faster handwriting than boys, and gender differences increased across grades. An identical pattern of results were observed for writing quality. Directions for future research and writing practices are discussed. Keywords Handwriting fluency · Writing quality · Children’s writing · Attitudes · Motivation Introduction Skilled writing is a complex task (Kellogg, 1996). It is a conscious, demanding, and self-directed activity involving the strategic use of a variety of interwoven and nested mental operations writers use to accomplish their goals (Chenworth & Hayes, * Gustaf B. Skar [email protected] 1 Norwegian University of Science and Technology, Trondheim, Norway 2 Pennsylvania State University, University Park, USA 3 Arizona State University, Tempe, USA
Transcript of Handwriting fluency and the quality of primary grade ...
Vol.:(0123456789)
Reading and Writinghttps://doi.org/10.1007/s11145-021-10185-y
1 3
Handwriting fluency and the quality of primary grade students’ writing
Gustaf B. Skar1 · Pui‑Wa Lei2 · Steve Graham3 · Arne Johannes Aasen1 · Marita Byberg Johansen1 · Anne Holten Kvistad1
Accepted: 24 June 2021 © The Author(s) 2021
AbstractUntil children can produce letters quickly and accurately, it is assumed that hand-writing disrupts and limits the quality of their text. This investigation is the largest study to date (2596 girls, 2354 boys) assessing the association between handwriting fluency and writing quality. We tested whether handwriting fluency made a statisti-cally unique contribution to predicting primary grade students’ writing quality on a functional writing task, after variance due to attitude towards writing, students’ language background (L1, L2, bilingual), gender, grade, and nesting due to class and school were first controlled. Handwriting fluency accounted for a statistically significant 7.4% of the variance in the writing quality of primary grade students. In addition, attitude towards writing, language background, grade and gender each uniquely predicted writing quality. Finally, handwriting fluency increased from one grade to the next, girls had faster handwriting than boys, and gender differences increased across grades. An identical pattern of results were observed for writing quality. Directions for future research and writing practices are discussed.
Keywords Handwriting fluency · Writing quality · Children’s writing · Attitudes · Motivation
Introduction
Skilled writing is a complex task (Kellogg, 1996). It is a conscious, demanding, and self-directed activity involving the strategic use of a variety of interwoven and nested mental operations writers use to accomplish their goals (Chenworth & Hayes,
* Gustaf B. Skar [email protected]
1 Norwegian University of Science and Technology, Trondheim, Norway2 Pennsylvania State University, University Park, USA3 Arizona State University, Tempe, USA

G. B. Skar et al.
1 3
2001; Hayes, 2012). It takes considerable time, experience, and direct assistance from teachers for students to develop the competence they need to become skilled writers (Bazerman et al., 2017).
This complexity is evident in the Writer(s)-Within-Community model (WWC; Graham 2018a, b). According to the WWC model, writing is a social activity situ-ated within specific writing communities. Writing is shaped and bound by the com-munity in which it takes place and by those who produce it. What is written and the acquisition of writing depends on how a community actualizes its purposes, val-ues, norms, audiences, tools and actions, social and physical arrangements, motiva-tions, power and responsibilities, stance/identity, and collective history, which are in turn influenced by institutional, political, social, cultural, and historical forces that operate outside of the community. Those who produce writing draw upon a variety of cognitive resources, including production processes for creating text (conceptu-alization, ideation, translation, transcription, and reconceptualization), long-term memory resources involving knowledge (e.g., content, genre, and specialized writ-ing knowledge) and beliefs (e.g., judgments about the value and utility of writing, competence as a writer, and why one engages in writing), as well as control mecha-nisms (i.e., attention, working memory, executive control, and self-regulation proce-dures) that enable writers to direct and regulate the writing enterprise. These writing processes, resources, and control mechanisms do not operate in a vacuum. They are moderated by writers’ emotions, personality traits, and physiological states as well as the characteristics, capacity, and variability of the community in which writing takes place (Graham 2018a, b).
Not surprisingly, it takes considerable time, experience, and direct assistance from teachers and mentors for writers to develop the competence needed to oper-ate successfully in multiple writing communities (Bazerman et al., 2017). Even so, very young children are typically able to produce text that meet the demands and expectations of the communities in which they write. This includes students in the primary grades (the focal point of the current study). To do so, young writers use a radically reduced and simplified version of the writing processes described above (McCutchen, 2000). They approach writing using a forward-moving content genera-tion process, simply telling what they know about a topic (referred to as the knowl-edge telling approach (Bereiter & Scardamalia, 1987 and expanded on by Hayes, 2011). They create or draw from memory a relevant idea and write it down. Suc-ceeding idea may be stimulated by the preceding phrase or sentence, focused on the general topic at hand, or involve elaboration of specific ideas as they are generated with the writer then returning to the general topic at hand. Little attention is directed at envisioning and creating an overall structure for the text, reconceptualizing the ideas presented, or considering the needs of the reader. The resulting text is typically a list of topic-related ideas instead of a coherent examination of the writing topic. In effect, they do little planning, evaluation, revising, or reflection when writing (Har-ris et al., 2009).
Young children likely rely on such an approach to writing because their writing skills are not sufficiently developed to allow them to compose in a more sophisti-cated fashion (Graham, 1990; McCutchen, 1988). In effect, the knowledge telling approach serves an adaptive function for beginning writers. Translation of ideas into

1 3
Handwriting fluency and the quality of primary grade students’…
words requires considerable cognitive effort and resources, even for adult writers (see Kellogg, 1987, 1993), and this is amplified for young writers who are still in the process of learning and automatizing foundational text transcription skills, such as handwriting fluency. Handwriting fluency refers to how quickly students can pro-duce letters correctly (Berninger, 1999).
The focus of the current investigation is the role of handwriting fluency in pri-mary grade students’ writing. Writing is constrained by capacity limitations (McCutchen, 1996, 2000; Graham & Harris, 2000), as young writers can hold so much information in working memory for so long at any given point in time (Mayer, 2012). Accordingly, if the cognitive demands of writing exceed the capacity of the processing system of a young writer, the result is cognitive overload and interfer-ence (McCutchen, 1988; Paas & Sweller, 2014). This is especially problematic for primary grade children as many of the actions they undertake when writing require conscious attention, effort, and resources. To prevent cognitive overload they con-centrate their processing efforts on generating ideas and transforming them as quickly as possible into text using their developing and effortful handwriting skills.
Until children can produce letters fluently and correctly, letter production can dis-rupt and limit their writing in multiple ways (see Berninger, 1999; Graham, 1999) for theoretical support for this proposition and Salas & Silvente, 2020; Kim et al., 2015; Kim et al., 2018; Limpo et al., 2017 for empirical support). Having to think about how to form a letter may tax children’s processing capacity, resulting in the loss of one or more writing ideas or plans held in working memory. Likewise, chil-dren’s handwriting may not be fast enough to keep up with their thoughts, causing them to lose writing ideas or plans held in working memory and interfering with generating the next idea. Having to apply effort and attention to fluently producing letters also means fewer resources are available for other writing actions. Individu-ally or collectively, these consequences likely undermine the quality of children’s writing.
As a result, primary grade students with more fluent handwriting should be bet-ter writers (see reviews by Feng et al., 2019; Graham, 2006; Graham et al., 1997; Graham & Harris, 2000; Kent & Wanzek, 2016; Santangelo & Graham, 2016). There is evidence to this effect in several prior reviews of the literature. For exam-ple, in seven studies with primary grade children, Kent and Wanzek (2016) reported a moderate positive association between handwriting fluency and writing quality (effect size = 0.59) In their review, Feng et al. (2019) indicated there was a small to moderate positive correlation between handwriting fluency and writing quality in 12 studies conducted with elementary-grade students (effect size = 0.40). Unlike the current investigation, the studies included in these reviews did little to control for other factors that account for variability in the quality of students’ writing.
The current study examined if individual differences in primary grade students’ handwriting fluency accounted for unique variance in the quality of writing pro-duced by a large and representative sample of children in grades 1 to 3 in Norway after we first controlled for variance in writing quality related to students’ grade, gender, language background, motivation for writing, and the nested nature of the data. To the best of our knowledge, the unique contribution of handwriting fluency in predicting the writing quality of primary grade students has not been established

G. B. Skar et al.
1 3
when these variables were first controlled (some studies with older children have controlled for the mediating effect of these variables; see Graham et al., 2019; Olinghouse & Graham, 2009; Olinghouse et al., 2015).
It is important to note that handwriting is not the only text transcription skill that can impact young students’ writing. Spelling is also a challenging skill that can dis-rupt and limit what children write (see Berninger, 1999). We did not investigate how spelling can predict writing quality in the current study for two reasons. One, Nor-wegian is a shallow orthography where relations between grapheme and phoneme are highly consistent (Seymour et al., 2003). This should reduce the influence of spelling on writing in Norwegian, as children do not have to deal with the incon-sistencies and complexities evident with spelling in a less transparent language like English. Two, the impact of spelling on writing is less certain than the impact of handwriting, as meta-analyses of intervention studies designed to improve these skills show that improvements in handwriting result in better writing (Santangelo & Graham, 2016), but this is not the case for spelling (Graham & Santangelo, 2014). As a result, we decided to focus our attention on handwriting fluency.
Theoretical underpinnings
The WWC model (Graham, 2018a) provided the theoretical framework for the cur-rent study. The model proposes that writing is a consequence of both the context in which it occurs and the cognitive capabilities and resources of those who produce it. The WWC model, like other models of writing (e.g., Berninger, 1992), was based on the assumption that writing is a demanding task and that limitations in cognitive architecture constrain the process of composing. Because the handwriting fluency of students in the primary grades is slow and still developing (Graham et al., 1998), it requires cognitive resources and effort that tax young writers’ processing capac-ity, resulting in interference and cognitive overload, influencing the quality of what children write.
The WWC model (Graham, 2018b) was further based on the assumption that children engage in a variety of cognitive actions as they write. While text transcrip-tion skills like handwriting fluency are an important part of text production, writing depends on additional text production processes (conceptualization, ideation, trans-lation, and reconceptualization), the knowledge and beliefs writers’ hold in long-term memory, mechanisms for executing and controlling the writing process (i.e., attention, working memory, and executive functioning), and mediating factors such as the emotions, personality traits, and the physical state of the writer. Writing is further complicated by writers’ experiences and biological and neurological fea-tures. As a result, the relationship between handwriting fluency and writing quality does not operate in a vacuum, as it is undoubtedly mediated by multiple factors.
In the present study, we were not able to control for every variable identified in the WWC model (Graham, 2018b) that might have conceivably confounded the relationship between handwriting fluency and writing quality. This would have been logistically unfeasible, and it would not have been possible in the context of Norwegian schools. However, we were able to control for the following variables

1 3
Handwriting fluency and the quality of primary grade students’…
without extending appreciably the amount of time needed by teachers to collect the requested data. One, we controlled for students’ experience as typified by their grade-level placement (i.e., grades 1, 2, or 3). As students move from one grade to the next, they obtain increasing experience with writing, and their handwriting flu-ency and the quality of their writing improves (Graham, 2006). Two, we controlled for gender differences. Gender is associated with individual differences in handwrit-ing fluency and quality of writing, as girls generally have faster handwriting and produce better text than boys (e.g., Cordeiro et al., 2018; Graham et al., 1998; Reilly et al., 2019). Three, we controlled for attitude towards writing. Students’ motiva-tional beliefs such as attitude towards writing influence how much effort they apply and what actions they initiate (Ekholm et al., 2018; Graham, 2018a), affecting their fluency with handwriting and their writing performance (e.g., Camacho et al., 2021; Graham et al., 2018; Limpo, et al., 2020a). Four, we controlled for variance due to students’ language background (i.e., Norwegian was students’ first language, sec-ond language, or they were bilingual with Norwegian being one of the languages a child spoke). Students’ language status impacts students’ writing, as children draw on their underlying knowledge of language(s) as they write (Shanahan, 2006).
The WWC model (Graham, 2018a, b) also emphasized that writing and its devel-opment depend on the context in which it takes place. Classrooms differ in their purposes for writing, the typified practices and actions used to meet these purposes, types of writing produced, tools for producing it, physical and social environment enacted, and the collective history of the writing community (Graham, in press; Limpo & Graham, 2020). As a result, we controlled for the nested nature of the data structure of students within classes, as well as classes in schools. We were only able to locate two studies examining the relationship between handwriting fluency and writing quality where variances due to classroom effects were controlled. They were both with older students (Graham et al., 2019; Wijekumar et al., 2019).
Controlling for class- and school-level differences as well as student grade, gen-der, motivation, and language background brought greater precision to our analysis of the relation between handwriting fluency and writing quality. It also provided evi-dence on the hypothesized role of context, accumulated experience, gender, attitude towards writing, and student language in the WWC model.
Research questions
We asked two research questions:
1. Are handwriting fluency and writing quality associated with the control variables (RQ1)?
a. Do students’ scores for handwriting fluency and writing quality differ by language background, gender, grade, and their interactions after accounting for clustering by class and school?

G. B. Skar et al.
1 3
b. Do handwriting fluency and writing quality correlate with attitude towards writing?
2. Does handwriting fluency account for unique variance in the quality of students’ writing after controlling for language background, gender, grade, their interac-tions, attitude towards writing, and clustering by class and school (RQ2)?
The first research question is preliminary to the second by focusing on the asso-ciations between main variables of interest (handwriting fluency and writing qual-ity) and control variables (i.e., discrete demographic variables, and continuous atti-tude measure). The second research question focused on the nuanced unique effect of handwriting fluency on writing quality above and over the control variables. The current investigation extended prior research examining the relation between hand-writing fluency and writing quality in multiple ways. First, this is the largest study to date examining whether individual differences in handwriting fluency predicts students’ writing quality. It involved close to 5000 primary grade students. With the exception of a study by Jimenez et al. (2018), which involved 1124 students in grades one and two, the next largest study with primary grade students included 494 students in grades two and three (Kim et al., 2015). In prior meta-analyses exam-ining the concurrent relationships between handwriting fluency and writing (Feng et al., 2019; Kent & Wanzek, 2016), the average number of students in each study ranged from 159 to 246, respectively. Even more importantly, the current study sam-pled students from multiple municipalities across Norway, resulting in a relatively representative sample of students in the primary grades countrywide.
Why is sample size and representativeness important? The larger and the more representative a sample of participants are of the population under study, the more likely the study provides more accurate, reliable, and conclusive outcomes (Lenth, 2001). Larger samples also limit the influence of outliers or extreme observations. As a result, large and representative samples are often considered the gold standard in research (Reilly et al., 2019).
Second, the present study controlled for other variables that are likely to con-found the relationship between handwriting fluency and the quality of primary grade students’ writing. This included language background, grade, gender, their interac-tions, attitude towards writing, and the nested nature of the data. This has not been done with primary grade children in earlier studies.
Third, unlike previous studies examining the relationship between handwriting fluency and writing quality, the current study created a purpose and audience for students’ writing (Graham et al., 1997, Harrison et al., 2016). Teachers read a letter to students explaining that researchers from the University of Trondheim were inter-ested in children’s favorite activities during recess time. The letter asked students to help these researchers better understand this topic by responding to the researchers by writing them a letter that described what they usually play during recess time. We anticipated this would increase engagement and motivation for writing. Addition-ally, our assessment of the quality of students’ letters took into account awareness of audience needs.
1 3
Handwriting fluency and the quality of primary grade students’…
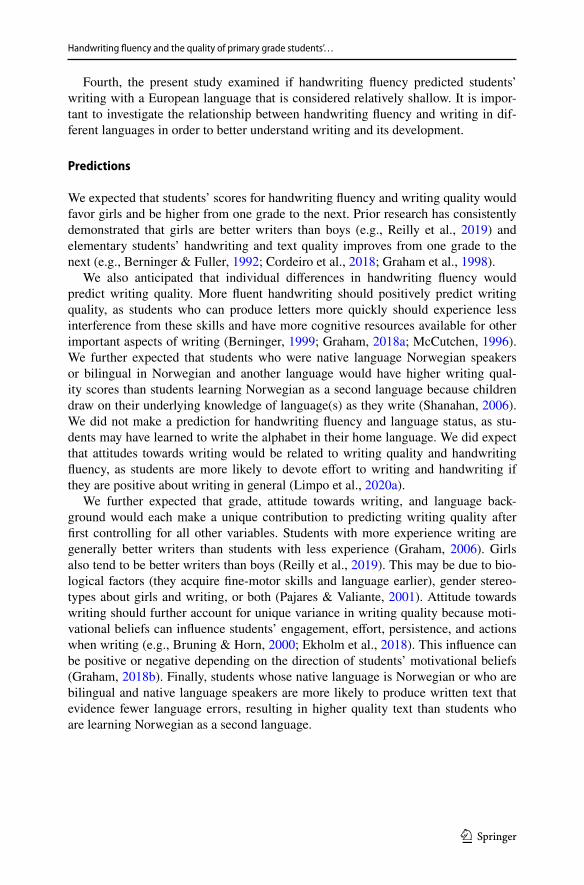
Fourth, the present study examined if handwriting fluency predicted students’ writing with a European language that is considered relatively shallow. It is impor-tant to investigate the relationship between handwriting fluency and writing in dif-ferent languages in order to better understand writing and its development.
Predictions
We expected that students’ scores for handwriting fluency and writing quality would favor girls and be higher from one grade to the next. Prior research has consistently demonstrated that girls are better writers than boys (e.g., Reilly et al., 2019) and elementary students’ handwriting and text quality improves from one grade to the next (e.g., Berninger & Fuller, 1992; Cordeiro et al., 2018; Graham et al., 1998).
We also anticipated that individual differences in handwriting fluency would predict writing quality. More fluent handwriting should positively predict writing quality, as students who can produce letters more quickly should experience less interference from these skills and have more cognitive resources available for other important aspects of writing (Berninger, 1999; Graham, 2018a; McCutchen, 1996). We further expected that students who were native language Norwegian speakers or bilingual in Norwegian and another language would have higher writing qual-ity scores than students learning Norwegian as a second language because children draw on their underlying knowledge of language(s) as they write (Shanahan, 2006). We did not make a prediction for handwriting fluency and language status, as stu-dents may have learned to write the alphabet in their home language. We did expect that attitudes towards writing would be related to writing quality and handwriting fluency, as students are more likely to devote effort to writing and handwriting if they are positive about writing in general (Limpo et al., 2020a).
We further expected that grade, attitude towards writing, and language back-ground would each make a unique contribution to predicting writing quality after first controlling for all other variables. Students with more experience writing are generally better writers than students with less experience (Graham, 2006). Girls also tend to be better writers than boys (Reilly et al., 2019). This may be due to bio-logical factors (they acquire fine-motor skills and language earlier), gender stereo-types about girls and writing, or both (Pajares & Valiante, 2001). Attitude towards writing should further account for unique variance in writing quality because moti-vational beliefs can influence students’ engagement, effort, persistence, and actions when writing (e.g., Bruning & Horn, 2000; Ekholm et al., 2018). This influence can be positive or negative depending on the direction of students’ motivational beliefs (Graham, 2018b). Finally, students whose native language is Norwegian or who are bilingual and native language speakers are more likely to produce written text that evidence fewer language errors, resulting in higher quality text than students who are learning Norwegian as a second language.

G. B. Skar et al.
1 3
Method
Participants
The study included 4950 students in grades one to three in Norway who com-pleted all measures and had been assented and consented. This involved 70.2% of all students in grades 1 to 3 attending 56 public schools and 398 classrooms. Our sample represented 2.6% of all primary grade students in Norway from 2.45% of all public schools serving students in these grades. The participating schools had all agreed to participate in an instructional study starting in the fall of 2019. Data for this study was collected three months prior to the start of the instructional investigation (i.e., June, 2019). Thirty-three percent of students were in grade one, 34% in grade two, and 33% of students in grade three. Sample breakdown by students’ gender and language background is given in Table 1.
The sample of students in our study were generally representative of primary grade students in Norway. We base this claim on three comparisons we made between data from our study and information publicly available in Norway. First, using data from the 2019 Information System of the primary and lower secondary schools in Norway (i.e., Grunnskolens informasjonssystem [GSI]; https:// gsi. udir. no/), we were able to establish that the percentage of girls (52%) in our study was relatively similar to the percentage of girls in primary grades nationwide (49%).
Second, schools with students’ participating in this study had similar scores on the National reading test administered to grade 5 students annually to those obtained by all elementary schools nationally. Unfortunately, there is no National writing test administered at any grade-level, and the National reading test is only administered at grade 5 in the elementary grades. The scores for the National reading test were obtained from the Directorate for Education and Training. The average score on this test for schools in our study was 51.6 (SD = 3.1; score range = 45.5–57.8). While this mean score was slightly higher than the national average of 50.0 (SD = 10; score range 42–58), the difference amounted to just 0.16 of a standard deviation.
Third, students in this study were drawn from five municipalities in Norway. These municipalities had a student population similar to that of Norway generally.
Table 1 Sample breakdown by students’ gender and language background
Grade 1 (n = 1636) Grade 2 (n = 1668) Grade 3 (n = 1646)
Gender Girls 835 (51%) 888 (53%) 873 (53%) Boys 804 (49%) 780 (47%) 773 (47%)Language Background L1 (Norwegian) 1353 (83%) 1388 (83%) 1345 (82%) L2 90 (5%) 98 (6%) 103 (6%) Bilingual 193 (12%) 182 (11%) 198 (12%)

1 3
Handwriting fluency and the quality of primary grade students’…
There were 423 municipalities in Norway in 2019, with an average population of 12,519 (SD = 39.038) in each municipality. The five municipalities in which participating students lived represented the population range of municipalities in Norway, as they ranged from large municipalities (population of 673,469, repre-senting 13% of the population) to average municipalities (population of 13,958, representing 3% of the population) to small municipalities (population of 6882, representing 1% of the population). Thus, students in the current study came from municipalities that represented the population range of municipalities in Norway.
Measures
Copying task
Teachers administered a copying task designed to assess handwriting fluency. For this task, students were asked to copy a short paragraph as quickly and accurately as possible within a 90 s period (Graham et al., 1997). The paragraph was taken from the Group Diagnostic Reading and Aptitude and Achievement Tests (Mon-roe & Sherman, 1996). The teacher showed an instructional video to students that explained how to complete the copying task. The teacher then read the paragraph to students. With the written paragraph in front of them, students were instructed to start copying the paragraph on the teacher’s command and stop copying when directed to do so (at the end of 90 s).
A single score measuring handwriting fluency was derived from the copying task. To obtain this score, trained raters counted all letters written correctly on the copying task. Letters that were skipped, written incorrectly, or in some way devi-ated from the paragraph students were directed to copy were not counted as correct. Inter-rater reliability estimate for this measure, which was based on 10% of all cod-ing, was good (κ = 0.812, ICC = 0.99). The score for handwriting was divided by 1.5 to provide an estimate of handwriting fluency per minute.
Functional writing task
Task Students were asked to write a letter using a prompt taken from the project Functional Writing in Primary School (Skar, Aasen, & Jölle, 2020). This task was designed to engage students in authentic communication. Teachers introduced the writing task by reading a letter aloud to the students. The letter was signed “researchers at the University of Trondheim,” and it explained that researchers were interested in young students’ favorite activities during recess time. The letter indi-cated that the students could help researchers understand this topic better by writing “a letter where you describe what you usually play with during recess time.”
Before writing the letter, the teacher led a class discussion where students dis-cussed what a researcher does, what students like to do during recess time, why they like that particular activity, what it means to describe something, and what the char-acteristics of a letter are. Furthermore, the teacher showed the students a picture of a school playground where children were engaged in multiple activities (e.g., playing

G. B. Skar et al.
1 3
marbles, swinging, building a sand castle, kicking a ball). Students were told they had 45 min to write their letter. Teachers were asked not to provide students with any help as they wrote. The writing sample was used to derive a measure of writing quality which is described below.
The theoretical rationale for the writing task was the notion of “functional writing” developed in a previous Norwegian project (Berge et al., 2019). This notion was operationalized in the model the Writing Wheel (Berge et al., 2016), which presented writing as a purpose driven communicative act. This emphasis on communicative purpose is also stressed in Norwegian tests to assess students’ writing performance (Skar, 2017). One of the consequences of this approach was to downplay requirements of adherence to genre forms and emphasize a writer’s ability to write for a particular purpose. In the present study, students were asked to account for toys and actions during recess time. The assessment criteria did not include criteria relating to genre specific traits (e.g., a letter head, a signature and so on).
Conducting prewriting discussions is a time-honored tradition in Norway, includ-ing in past national assessments (Skar, 2017; Skar & Aasen, 2018). The purpose of the discussion was to aid students in generating content, and to focus on the com-municative situation at hand. This approach helped to assure that the participating children understood the writing task, and they had an opportunity to consider their favorite activities during recess before writing their letter. It is likely that students just told to write the letter without any discussion may have performed more poorly on this writing task. Because prewriting discussion is so ingrained in Norwegian instruction and we wanted students to do their best on the writing task, we made a conscious decision to include this prewriting discourse.
Scoring Students’ letters to researchers describing the game they usually play at recess were scored for writing quality on eight rating scales, which were combined into a single, scaled score. Raters assessed each student’s letter using a validated rating scale, published in Skar, Jølle and Aasen (2020). This measure assigned a score of 1 to 5 to each of the following eight aspects of writing: audience awareness, organization, content relevance, vocabulary, sentence construction, spelling, legibil-ity and punctuation. Higher scores represented better quality for each aspect of writ-ing assessed, with five as the maximum score.
Each of the eight rating scales had descriptors and benchmark text for each score (1 to 5). The rating scale “audience awareness” concerned how the text explicitly or implicitly addressed a reader. The descriptor for a score of 1 (the lowest score), stated that “To understand the text, a conversation with the writer is required”, while the descriptor for a score of 5 (the highest level) stated that: “The text addresses the reader in the assignment in a generally relevant manner and takes into account the reader’s need for knowledge of participants’ characters, circumstances, and events. The text may contain traces of the student’s voice with reflective or evaluat-ing utterances.” The rating scale “organization” concerned the internal structure of the text at the macro-, meso-, and micro-level. “Content relevance” concerned the scope of a student’s text that presented relevant content with regards to the writ-ing task; a higher score therefore indicated more relevant content, but not neces-sarily longer text. “Vocabulary” concerned the repertoire of words used in the text,

1 3
Handwriting fluency and the quality of primary grade students’…
with the highest level descriptor stating that “The text contains a repertoire of words and expressions that are relevant to the task. In some cases, there is use of special-ized and abstract words, and/or creative forms of expression.” “Sentence construc-tion” concerned syntactical variation and syntactic complexity, while “Spelling” concerned the increasing mastery of correct spelling in text. “Legibility” concerned the shape and legibility of letters, including if letters were reversed or not. Lastly, “Punctuation” concerned the correct use of punctuation marks. The descriptor for the lowest level stated that: “the text does not contain punctuation marks,” while the descriptor for the highest level stated that: “mostly correct use of different punctua-tion marks. The use of comma may occur.”
Students’ written letters were scored by a pool of 24 trained raters, which were recruited from teacher education at the University of the first author of this study. The raters’ training involved sessions where the rating scales were presented and used, and where each rater was given opportunity to address any ambiguities or other questions. Further, all raters sent their first 25 ratings to the first author who provided feedback on individual raters’ relative harshness and consistency. There was also an email list which the raters used to post questions that arose during the rating session. When a question was posted on the list, the rating stopped, and raters were given directions according to the questions posed.
Each text was assessed independently by two raters, with each rater scoring on average 531 texts. Fifty of the students’ letters were scored by all raters, which allowed us to fit the ratings to a many-facet Rasch model (MFRM; Linacre, 2017). We used the following model:
where Pnijk represents the probability of student n, rated on rating scale i, by rater j, receiving a score of k, and Pnij(k-1) represents the probability of the same student under the same conditions receiving a score of k-1. Bn is the ability for person n, Ei is the difficulty of rating scale i, and Cj is the severity of rater j. Finally, Fx represents the point on the logit scale where category k and k–1 are equally probable.
The eight rating scales for writing quality were combined into a single, scaled score, using a many-facet Rasch measurement model (see above). The model fit the data well. The “reliability of separation”-measure, which is a MFRM analog to Cronbach’s alpha was 0.94, which indicates a reliability fit for high stakes assess-ment in the measure of students’ writing quality. Of the standardized residuals, 3.90% were in the range of |2–3| and 0.59% exceeding |3|, which indicated good fit, as standardized residuals above 2 should not exceed 5%, and standardized residu-als above 3 should not exceed 1% (Eckes, 2011). This allowed us to use the MFRM estimates to adjust students’ scores using a compensatory principle where the final writing quality score was a single averaged score adjusted for varying difficulties between rating scales and differing rater severity. We used the FACETS software to convert the logit scores to a five-point Writing Quality Scale with possible values from 1 to 5, not restricted to integers.
log(Pnij(k)∕Pnij(k−1)) = Bn− Ei− Cj− Fx,

G. B. Skar et al.
1 3
Attitude towards writing
Students’ attitude towards writing was assessed using a four-item survey. These items were: “I like the composition task,” “I am satisfied with my text,” “I am satis-fied with my effort,” and “I like to write.” Students were asked to rate each statement with a three-point Likert-type scale. The lowest point on the scale was represented by a single star and the highest point by three stars. An exploratory factor analysis, using principal axis factoring, suggested a one-factor solution, with all items load-ing at 0.58 or higher, accounting for 53.8% of the variance (coefficient alpha = 0.71). The score for the attitude measure was the average across the four items.
The items for our attitude scale were inspired by writing motivation measures assessing attitude towards writing and self-efficacy included in a study with upper-elementary grade students conducted by Graham et al. (2019). This earlier meas-ure included 18 items. After consulting with teachers, it was decided that partici-pating teachers would be unwilling to set aside the time to administer an 18-item survey, and young Norwegian students would be unfamiliar with many of the ideas included in these measures. As a result, we decided to construct a simpler scale that mainly assessed attitude towards writing, with all but one of the items (i.e., “I like to write.”) directly aimed at how students felt about the functional writing task they completed, including whether they liked the task, the composition they produced, and their effort. Thus, in contrast to attitude measure developed by Graham and his colleagues which asked about writing in general, our attitude measure was more directly tied to the writing task that students completed. This made the items more concrete and more likely to account for variance in the writing students did for this investigation. We piloted the scale with four primary grade teachers, who indicated that their students would understand the items and be able to complete them easily.
Language background
Information about students’ language background was obtained from their teachers. They indicated whether Norwegian was a students’ first language or second lan-guage or whether a student was bilingual, with Norwegian as one of the students’ languages.
Procedures
The procedures to obtain data from students were tailored to fit the Norwegian con-text. Testing and assessment are controversial in Norway, and formal grades are not introduced before 8th grade. These grades are based on teachers’ assessment of overall attainment of students in light of objectives specified in the national cur-riculum. While there are obligatory national tests in English, mathematics and read-ing already in 5th grade, students do not sit for externally administrated tests until 10th grade. The first author therefore consulted with several teachers in first, second, and third grade to frame the data collection in a way that would not alienate teach-ers, students, or parents or persons having custody of the child. It was decided that

1 3
Handwriting fluency and the quality of primary grade students’…
teachers would administrate the data collection, and that it would be labelled as “text collection,” rather than ‘testing’ or ‘assessment.’ It was furthermore decided that the task eliciting writing quality would be administrated during a regular lesson in the language arts subject (called “Norwegian”), and that students would be offered 45 min to write, which is similar to other tasks performed by students in regular instruction.
Once students were consented and assented, the research team sent teachers directions for administering the two writing tasks (functional writing and copying task) and the attitude towards writing measure. This included written directions for administering each task as well as a video demonstrating how to administer the functional writing and copying tasks (posted on an easily accessible online forum). The video for completing the copying task was also shown to students to ensure they did it correctly. Finally, a hotline was established so that teachers could contact the research team if they had any questions about task administration. Task administra-tion was counterbalanced so that one half of the teachers administered the functional writing task and attitude towards writing measure first and the copying task second, whereas the remaining teachers did just the opposite. Teachers had a 15-day win-dow in which to administer both tasks. Test administration occurred in June of 2019. After the two writing tasks were completed, teachers sent student responses to the first author, where they were registered and anonymized. While all children in each class were administered the two writing tasks, teachers only sent student responses if the child had been assented and consented.
Analysis
First, we examined if students’ handwriting fluency and writing quality were asso-ciated with the control variables (RQ1). Specifically, we tested whether handwrit-ing fluency and writing quality differed by language background, grade, gender, and their interactions, after accounting for clustering by class and school, followed by calculating correlations among handwriting fluency, writing quality, and attitude towards writing. Intra-class correlations (ICC) for the main outcome of interest, writing quality, was 0.47 at class-level, and 0.04 at the school-level. These ICC val-ues indicated large between-class variability and nonignorable dependence among observations within classes, though variability across schools was relatively small. Mixed models with random (class and school) intercepts were used to account for the nesting of students within classes within schools. Because fixed effects were of main interest, we used maximum likelihood estimation for all models. To address the question about language background, grade, and gender differences on writing (RQ1.a), a random-intercepts ANOVA model with language background, grade, gender, and their interactions as factors was conducted for writing quality and hand-writing fluency separately. Statistically nonsignificant interactions were dropped and significant ones were plotted. We then examined the correlations of writing quality and handwriting fluency with attitude towards writing (the only continuous control variable; RQ1.b).

G. B. Skar et al.
1 3
To address the second research question, we estimated a null model for ICC and R-square calculation and a full model with handwriting fluency (grand mean cen-tered), attitude towards writing (grand mean centered), grade (dummy coded with grade 3 as the reference), gender (dummy coded with girl as the reference), lan-guage background (dummy coded with L2 as the reference), and all possible interac-tions among grade, gender, and language as fixed effects to predict writing quality. Statistically nonsignificant interaction terms were removed from the full model for parsimony, and significant ones were plotted to examine the pattern of interaction. Student-level R2 (Snijders & Bosker, 1999) was computed for the final model (with all nonsignificant interactions removed) as a measure of effect size. This model allowed us to assess the unique contribution of handwriting fluency to predicting writing quality after controlling for variance due to the nested nature of the data, attitude towards writing, as well as gender, grade, language background, and their interactions.
Table 2 Descriptive statistics of writing measures by gender, language background, and grade
Writing quality
Handwriting fluency
Attitude towards writing
N Mean SD Mean SD Mean SD
Grade 1 L1 Boy 667 2.66 .43 14.40 6.66 2.48 .52
Girl 686 2.84 .43 17.25 8.62 2.63 .41 L2 Boy 40 2.66 .37 14.73 6.22 2.55 .50
Girl 50 2.79 .38 17.71 9.59 2.73 .34 Bilingual Boy 94 2.80 .39 15.46 7.32 2.55 .50
Girl 99 2.92 .41 15.95 8.13 2.68 .42Grade 2 L1 Boy 645 3.02 .50 26.17 10.49 2.34 .55
Girl 743 3.35 .51 30.95 11.72 2.61 .39 L2 Boy 48 3.07 .43 24.83 9.23 2.49 .55
Girl 50 3.22 .53 29.05 14.23 2.55 .45 Bilingual Boy 87 3.12 .55 27.42 11.30 2.47 .52
Girl 95 3.28 .49 31.35 14.73 2.62 .38Grade 3 L1 Boy 631 3.41 .57 35.46 12.35 2.27 .51
Girl 714 3.80 .51 42.98 14.45 2.55 .40 L2 Boy 52 3.28 .58 35.87 13.93 2.39 .57
Girl 51 3.54 .48 40.07 16.94 2.54 .55 Bilingual Boy 90 3.34 .51 38.30 12.32 2.38 .45
Girl 108 3.61 .54 45.69 11.72 2.58 .41

1 3
Handwriting fluency and the quality of primary grade students’…
Results
Relationship between students’ writing scores and demographic variables
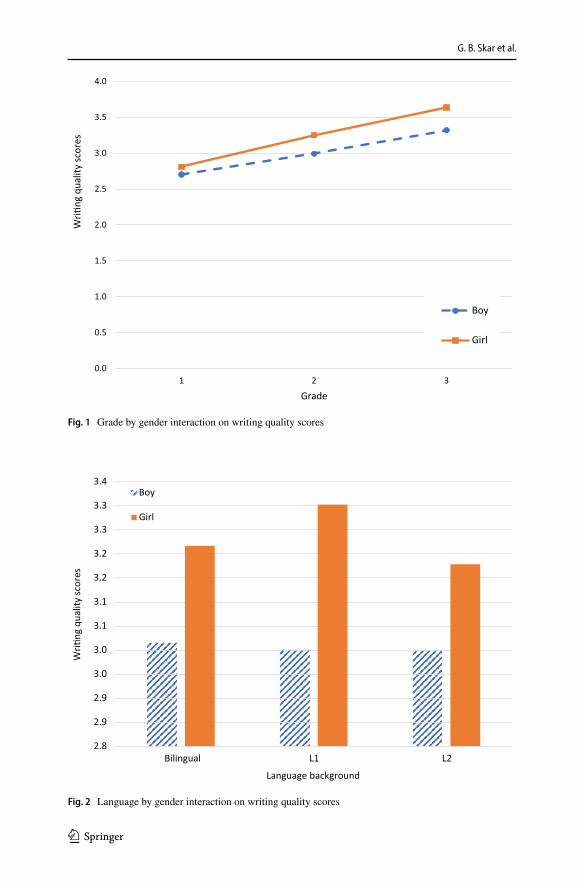
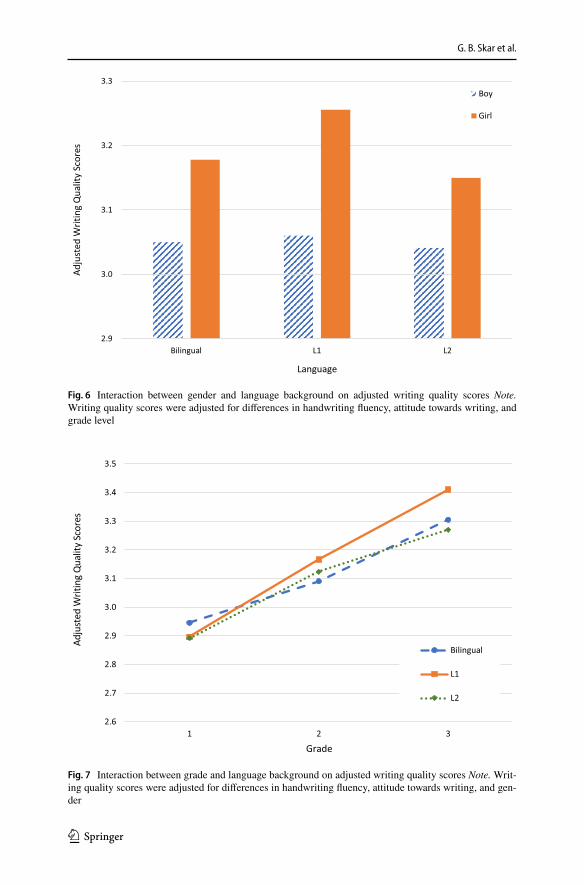
Table 2 shows the descriptive statistics of writing measures by students’ demo-graphic variables. Handwriting fluency more than doubled between grades one and three, whereas writing quality scores increased by about four-fifths of a point on a five-point scale over the same time period (see Table 2). As seen in Table 3, there were statistically significant differences for writing quality by gender, grade, lan-guage background, and their 2-way interactions (grade x gender: F(2, 4681) = 27.81, p < 0.0001; grade x language: F(4, 4896) = 3.55, p < 0.01; language x gender: F(2, 4687) = 6.06, p < 0.01). Students in higher grades produced papers of higher quality than those in lower grades, girls produced papers of higher quality than boys, and the gender gap tended to widen in higher grades (see Fig. 1). Gender differences in writing quality were also larger for L1 students than for bilingual and L2 stu-dents (see Fig. 2). Writing quality scores did not appear to differ much by language background at lower grades (1 and 2), but the variability in writing quality became slightly larger at Grade 3 with L1 students outperforming L2 students but not signif-icantly different from bilingual students (see Fig. 3). For handwriting fluency, there
Table 3 Mixed model estimates for RQ1.a
Standard errors are presented in parentheses*** p < .001, *p < .05
Writing quality Handwriting fluency
Fixed Effects Intercept 3.54*** (.06) 42.38*** (.88) Grade 1 − .76*** (.07) − 25.75*** (.73) Grade 2 − .32*** (.07) − 12.49*** (.73) Boy − .27*** (.05) − 7.17*** (.51) Bilingual .09 (.06) .96 (.78) L1 .21*** (.03) .75 (.68) Grade 1 × Boy .21*** (.03) 4.41*** (.72) Grade 2 × Boy .06* (.03) 2.48*** (.72) Grade 1 × Bilingual − .05 (.08) Grade 1 × L1 − .17* (.07) Grade 2 × Bilingual − .10 (.08) Grade 2 × L1 − .10 (.06) Bilingual x Boy − .02 (.06) L1 x Boy − .12* (.05)Random Components (variance) School .03 6.02 Class .05 17.21 Student .16 101.53
G. B. Skar et al.
1 3
0.0
0.5
1.0
1.5
2.0
2.5
3.0
3.5
4.0
1 2 3
Wri�
ng q
ualit
y sc
ores
Grade
Boy
Girl
Fig. 1 Grade by gender interaction on writing quality scores
2.8
2.9
2.9
3.0
3.0
3.1
3.1
3.2
3.2
3.3
3.3
3.4
Bilingual L1 L2
Wri
ng q
ualit
y sc
ores
Language background
Boy
Girl
Fig. 2 Language by gender interaction on writing quality scores

1 3
Handwriting fluency and the quality of primary grade students’…
0.0
0.5
1.0
1.5
2.0
2.5
3.0
3.5
4.0
1 2 3
Wri�
ng q
ualit
y sc
ores
Grade
Bilingual
L1
L2
Fig. 3 Grade by language interaction on writing quality scores
0.0
5.0
10.0
15.0
20.0
25.0
30.0
35.0
40.0
45.0
50.0
1 2 3
serocsycneulf
gnitirwdnaH
Grade
Boy
Girl
Fig. 4 Grade by gender interaction on handwriting fluency scores

G. B. Skar et al.
1 3
were statistically significant differences by gender, grade, and their interactions (F(2, 4742) = 18.86, p < 0.0001). Students’ handwriting fluency increased from one grade to the next, girls were faster hand-writers than boys, and the gender gap tended to widen from across the grades (Fig. 4).
Correlations between measures
Handwriting fluency and writing quality were moderately correlated each other (r = 0.61, p < 0.001) but weakly correlated with attitude towards writing. The cor-relation between handwriting fluency and attitude was 0.04 (p < 0.05), between writ-ing quality and attitude was.15 (p < 0.001).
Table 4 Mixed Model Estimates for RQ2
Standard errors are presented in parentheses*** p < .001, *p < .05
Null Model Final Model
Fixed effectsIntercept 3.14*** (.03) 3.35*** (.05)Handwriting fluency .014*** (.001)Attitude towards writing .15*** (.01)Grade 1 −.44*** (.07)Grade 2 −.16* (.07)Boy −.16*** (.05)Bilingual .04 (.05)L1 .18*** (.05)Grade 1 × Boy .13*** (.03)Grade 2 × Boy .02 (.03)Grade 1 × Bilingual .02 (.07)Grade 1 × L1 −.13* (.06)Grade 2 × Bilingual −.07 (.07)Grade 2 × L1 −.10 (.06)Bilingual x Boy −.02 (.05)L1 x Boy −.09 (.05)Random components (variance)School .01 .02Class .18 .05Student .19 .14Fit statisticsDeviance 6699.3 4894.3|∆ deviance from previous model| – 1805***∆ df – 15RL1
2 – .46

1 3
Handwriting fluency and the quality of primary grade students’…
Unique contribution of handwriting fluency to predicting writing quality
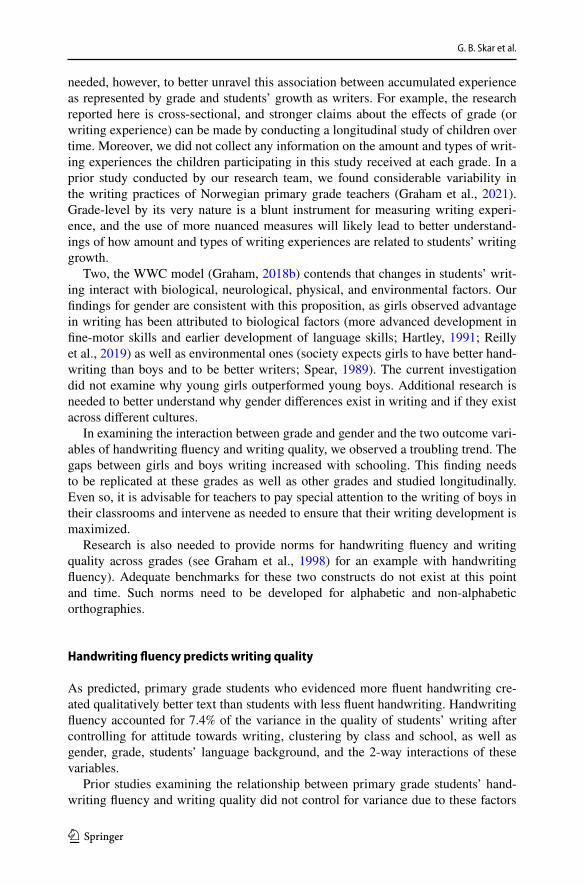
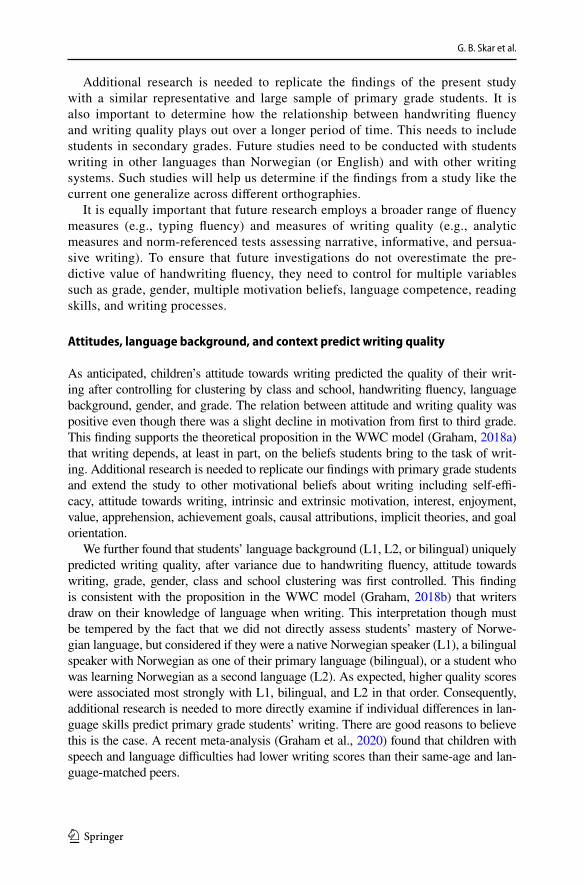
Table 4 presents the results from the mixed model estimates for a null model (ICC and R-square calculation), and a full model with the predictor handwriting fluency and control variables (attitude towards writing as well as language background, gen-der, grade, and their interactions). The 3-way interaction among gender, grade, and language status was not statistically significant (F(4,4679) = 0.066, p = 0.62). It was removed from the final model, and not reported in Table 4.
In the full model, the 2-way interactions between gender and grade (F(2,4674) = 13.82, p < 0.0001), grade and language background (F(4,4890) = 4.18, p = 0.002), and gender and language (F(2,4679) = 3.37, p = 0.03) were statistically significant (see Table 4). Main effects for handwriting fluency (F(1,4877) = 690.41, p < 0.0001), attitude towards writing (F(1,4762) = 146.65, p < 0.0001), gender (F(1,4669) = 57.97, p < 0.0001), grade (F(2,715) = 55.54, p < 0.0001), and lan-guage background (F(2,4830) = 5.11, p < 0.01) were all statistically significant. All variables in the full model (handwriting fluency, attitude towards writing, language background, gender, grade, and interactions) accounted for 46% of the total variance in student-level writing quality. Handwriting fluency was a statistically significant unique predictor of writing quality (b = 0.014, SE = 0.001, p < 0.0001), explaining 7.4% of student-level variance above and over attitude towards writing as well as gender, grade, language background and their 2-way interactions. The standardized coefficient for handwriting fluency was 0.34 (standardized by pooled within-group
2.6
2.7
2.8
2.9
3.0
3.1
3.2
3.3
3.4
3.5
1 2 3
serocSytilau
Qgnitir
WdetsujdA
Grade
Boy
Girl
Fig. 5 Interaction between grade and gender on adjusted writing quality scores Note. Writing quality scores were adjusted for differences in handwriting fluency, attitude towards writing, and language back-ground
G. B. Skar et al.
1 3
2.9
3.0
3.1
3.2
3.3
Bilingual L1 L2
serocSytilau
Qgnitir
WdetsujdA
Language
Boy
Girl
Fig. 6 Interaction between gender and language background on adjusted writing quality scores Note. Writing quality scores were adjusted for differences in handwriting fluency, attitude towards writing, and grade level
2.6
2.7
2.8
2.9
3.0
3.1
3.2
3.3
3.4
3.5
1 2 3
serocSytilau
Qgnitir
WdetsujdA
Grade
Bilingual
L1
L2
Fig. 7 Interaction between grade and language background on adjusted writing quality scores Note. Writ-ing quality scores were adjusted for differences in handwriting fluency, attitude towards writing, and gen-der

1 3
Handwriting fluency and the quality of primary grade students’…
standard deviations), suggesting that when all other variables were held constant, each SD increase in handwriting fluency was associated with 0.34 SD increase in writing quality.
Main effects of the control variables were as expected, with higher quality scores associated with higher attitude towards writing scores, higher grade levels, girls, and L1 students (followed by bilingual and L2). Figures 5, 6, and 7 show the 2-way interactions between gender and grade, gender and language background, and grade and language background, respectively. After adjusting writing quality scores for handwriting fluency, the gender gap in writing quality increased somewhat in higher grades (see Fig. 3) and the difference was largest for L1 students (Fig. 4). Further, the increase in adjusted writing quality scores over grades appeared to be slightly larger for L1 students than for the other language groups (Fig. 5).
Discussion
The primary purpose of this study was to determine whether individual differences in primary grade students’ handwriting fluency accounted for variability in the qual-ity of their writing. We also examined if students’ handwriting fluency and writing quality improved from one grade to the next, and if girls’ performance on these two measures exceeded that of boys. We discuss obtained grade and gender differences in handwriting fluency and writing quality first, followed by a discussion of the observed relationship between handwriting fluency and writing quality.
Grade and gender are related to handwriting fluency and writing quality
As predicted, students in higher grades had more fluent handwriting and produced qualitatively better papers than students in earlier grades. Girls also had faster hand-writing and wrote qualitatively better papers than boys. The correlations between attitude towards writing and handwriting fluency as well as writing quality were sta-tistically significant, but small (0.04 and 0.15, respectively). Language background was statistically related to quality of students’ writing, but they were mediated by students’ gender and grade. These findings are consistent with the findings from many earlier investigations (e.g., Berninger & Fuller, 1992; Graham et al., 1998; Cordeiro et al., 2018; Limpo, et al., 2020b; Reilly et al., 2019), but in contrast to most of these prior studies, we controlled for variance due to class and school clustering.
Collectively, the outcomes from this study and the relatively consistent findings from prior investigations provide support for two contentions in the WWC model (Graham, 2018b). One, students develop as writers through their experiences in par-ticipating in classroom writing communities (Graham, in press). Grade three stu-dents in our study participated in at least three elementary grade school-based writ-ing communities from grades one to three, whereas the youngest grade one students in our study were participating in their first such community. Additional research is
G. B. Skar et al.
1 3
needed, however, to better unravel this association between accumulated experience as represented by grade and students’ growth as writers. For example, the research reported here is cross-sectional, and stronger claims about the effects of grade (or writing experience) can be made by conducting a longitudinal study of children over time. Moreover, we did not collect any information on the amount and types of writ-ing experiences the children participating in this study received at each grade. In a prior study conducted by our research team, we found considerable variability in the writing practices of Norwegian primary grade teachers (Graham et al., 2021). Grade-level by its very nature is a blunt instrument for measuring writing experi-ence, and the use of more nuanced measures will likely lead to better understand-ings of how amount and types of writing experiences are related to students’ writing growth.
Two, the WWC model (Graham, 2018b) contends that changes in students’ writ-ing interact with biological, neurological, physical, and environmental factors. Our findings for gender are consistent with this proposition, as girls observed advantage in writing has been attributed to biological factors (more advanced development in fine-motor skills and earlier development of language skills; Hartley, 1991; Reilly et al., 2019) as well as environmental ones (society expects girls to have better hand-writing than boys and to be better writers; Spear, 1989). The current investigation did not examine why young girls outperformed young boys. Additional research is needed to better understand why gender differences exist in writing and if they exist across different cultures.
In examining the interaction between grade and gender and the two outcome vari-ables of handwriting fluency and writing quality, we observed a troubling trend. The gaps between girls and boys writing increased with schooling. This finding needs to be replicated at these grades as well as other grades and studied longitudinally. Even so, it is advisable for teachers to pay special attention to the writing of boys in their classrooms and intervene as needed to ensure that their writing development is maximized.
Research is also needed to provide norms for handwriting fluency and writing quality across grades (see Graham et al., 1998) for an example with handwriting fluency). Adequate benchmarks for these two constructs do not exist at this point and time. Such norms need to be developed for alphabetic and non-alphabetic orthographies.
Handwriting fluency predicts writing quality
As predicted, primary grade students who evidenced more fluent handwriting cre-ated qualitatively better text than students with less fluent handwriting. Handwriting fluency accounted for 7.4% of the variance in the quality of students’ writing after controlling for attitude towards writing, clustering by class and school, as well as gender, grade, students’ language background, and the 2-way interactions of these variables.
Prior studies examining the relationship between primary grade students’ hand-writing fluency and writing quality did not control for variance due to these factors

1 3
Handwriting fluency and the quality of primary grade students’…
(see Feng et al., 2019; Kent & Wanzek, 2016), nor did they examine such a large and representative sample of students. As a result, these studies likely overestimated the contribution of handwriting fluency to the prediction of writing quality. To illus-trate, the concurrent relationship between these two variables in the present study was 0.61, indicating they shared 37% of common variance. This was more than five times the amount of variance that handwriting fluency accounted for in writing qual-ity after we entered our control variables into our analysis. Similar findings have been obtained in studies with older elementary grade students, where the association between handwriting fluency and writing quality was reduced after variance due to other important factors were first controlled (e.g., Graham et al., 2019).
It is important to note that our study may also overestimate the variance hand-writing fluency accounts for in the quality of young children’s writing. For exam-ple, we did not control for variance related to text transcription skills such as spelling or handwriting legibility as well as other aspects of writing like knowl-edge of the topic, production processes (e.g., planning), and additional motiva-tional beliefs (e.g., self-efficacy). It is likely that the amount of unique variance in writing quality accounted for by handwriting fluency may be even less as such variables are added to the analysis. Of course, this needs to be tested empirically.
In contrast, our study may have overestimated the variance that handwriting fluency accounts for in writing quality. Before writing their essay, students and their teacher discussed the writing topic (what students like to do during recess time), including why they might like that particular activity, what it means to describe something, and what the characteristics of a letter are. Wagner et al. (2011) argued that when a child knows what they will write, their handwriting becomes more fluent as they write. This may explain, at least in part, why the relationship between handwriting fluency and writing quality were generally lower than they were in prior studies where such scaffolding was not provided. Even so, under natural classroom conditions, we would expect that teachers would discuss writing assignments with their students, including their purpose and what is expected. Thus, research is needed to determine better how the direc-tions given to students when writing influences the relationship between hand-writing fluency and writing quality with young children.
The current study provided evidence that supports the theoretical proposi-tion in the WWC model that text transcription skills like handwriting fluency can tax young writers’ processing capacity, resulting in interference and cogni-tive overload, with the resulting consequence that students with slower handwrit-ing produce qualitatively weaker text. When the findings from our investigation are combined with outcomes from prior studies demonstrating that better writ-ers evidence greater mastery of handwriting (e.g., Graham, Collins, & Wigby-Wells, 2017a), individual differences in handwriting fluency predict writing quality (Feng et al., 2019; Kent & Wanzek, 2016), and the teaching handwriting improves the quality of students’ text (Santangelo & Graham, 2016), it is clear that handwriting is a critical ingredient in young students’ writing. As a result, it is important that handwriting is one of the focal points of writing instruction in the primary grades, with a particular emphasis on helping young children learn to write letters correctly and fluently.
G. B. Skar et al.
1 3
Additional research is needed to replicate the findings of the present study with a similar representative and large sample of primary grade students. It is also important to determine how the relationship between handwriting fluency and writing quality plays out over a longer period of time. This needs to include students in secondary grades. Future studies need to be conducted with students writing in other languages than Norwegian (or English) and with other writing systems. Such studies will help us determine if the findings from a study like the current one generalize across different orthographies.
It is equally important that future research employs a broader range of fluency measures (e.g., typing fluency) and measures of writing quality (e.g., analytic measures and norm-referenced tests assessing narrative, informative, and persua-sive writing). To ensure that future investigations do not overestimate the pre-dictive value of handwriting fluency, they need to control for multiple variables such as grade, gender, multiple motivation beliefs, language competence, reading skills, and writing processes.
Attitudes, language background, and context predict writing quality
As anticipated, children’s attitude towards writing predicted the quality of their writ-ing after controlling for clustering by class and school, handwriting fluency, language background, gender, and grade. The relation between attitude and writing quality was positive even though there was a slight decline in motivation from first to third grade. This finding supports the theoretical proposition in the WWC model (Graham, 2018a) that writing depends, at least in part, on the beliefs students bring to the task of writ-ing. Additional research is needed to replicate our findings with primary grade students and extend the study to other motivational beliefs about writing including self-effi-cacy, attitude towards writing, intrinsic and extrinsic motivation, interest, enjoyment, value, apprehension, achievement goals, causal attributions, implicit theories, and goal orientation.
We further found that students’ language background (L1, L2, or bilingual) uniquely predicted writing quality, after variance due to handwriting fluency, attitude towards writing, grade, gender, class and school clustering was first controlled. This finding is consistent with the proposition in the WWC model (Graham, 2018b) that writers draw on their knowledge of language when writing. This interpretation though must be tempered by the fact that we did not directly assess students’ mastery of Norwe-gian language, but considered if they were a native Norwegian speaker (L1), a bilingual speaker with Norwegian as one of their primary language (bilingual), or a student who was learning Norwegian as a second language (L2). As expected, higher quality scores were associated most strongly with L1, bilingual, and L2 in that order. Consequently, additional research is needed to more directly examine if individual differences in lan-guage skills predict primary grade students’ writing. There are good reasons to believe this is the case. A recent meta-analysis (Graham et al., 2020) found that children with speech and language difficulties had lower writing scores than their same-age and lan-guage-matched peers.

1 3
Handwriting fluency and the quality of primary grade students’…
The current study also provided support for the contention in the WWC model (Gra-ham, 2018a) that writing is shaped and bound by the community in which it takes place (the classroom in this study). While the ICC for the quality of students’ writing at the school-level was small (0.04), the ICC at the class-level was large (0.47). Earlier studies by Graham et al. (2019) and Wijekumar et al. (2019) also found large and non-ignor-able ICCs at the class level for writing quality (0.17 to 0.24) with fifth-grade students. Even so, the findings from the current study require replication, and additional research is needed that examines if specific features of classroom contexts predict students’ writing performance. This includes examining if variation in writing purposes, values, norms, audiences, tools and actions, social and physical arrangements, motivations, power and responsibilities, and stance/identity across a large array of classrooms in which writing takes place or is taught account for unique variance in students’ writing.
Limitations and final comments
While the present study provides important information about the relationships between handwriting fluency and writing quality, there are several limitations which must be noted. First, we were not able to collect information on how stu-dents were taught writing in their individual classes. This limits any replication of the study, as it is impossible to determine if the context between this and sub-sequent studies are comparable (Graham, 2018a, b). It further means that inter-pretations of our findings are hampered somewhat by a lack of information on how handwriting fluency and writing were taught. While we recently conducted a nationwide survey of primary grade teachers in Norway (Graham et al., 2021) and some of the teachers in this study completed our survey, we cannot describe how the majority of teachers in the present investigation taught handwriting and writ-ing more generally. What we can say is that primary grade teachers in Norway generally provide a multi-faceted writing program, where students complete mul-tiple writing assignments spending about 20 min a day writing. Norwegian teach-ers commonly use a variety of instructional practices to teach writing skills and support students as they write. They devote less attention to teaching planning and revising, promoting students’ attitude towards writing, and applying evalua-tion data to adjust writing instruction.
Even though the current study involved close to 5000 primary grade children, it was conducted in a single country with a relatively shallow orthography (Sey-mour et al., 2003). Care must be taken in generalizing our results to other coun-tries, even ones with a shallow orthography. Prior research in Spain and Portugal, which both have relatively shallow orthographies, produced inconsistent findings regarding the relationships between text transcription and writing performance (Jimenez et al., 2018; Limpo & Alves, 2017).
The ICCs for the quality of students’ writing were large at the class-level (0.47). If we are to better understand the magnitude of the ICCs obtained in stud-ies of writing such as this one, future studies need to do a better job of describing writing instruction and the context in which it occurs to determine if specific fea-tures of classroom contexts predict students’ writing performance.
G. B. Skar et al.
1 3
The current study focused on only one transcription skill: handwriting fluency. Future research needs to examine how handwriting fluency and other text tran-scription skills like spelling and handwriting legibility are interactively related to the quality of primary grade students’ writing. In addition, we collected only one measure of students’ handwriting fluency and one sample of their writing. Future studies should collect multiple measures of handwriting fluency, including how quickly text can be copies and the alphabet written (see Graham et al., 1997), and writing in multiple genres (e.g., stories, informative writing, and persuasive text).
It is important to recognize that students’ writing samples were not typed nor were spelling miscues corrected before they were scored by raters. As Graham et al. (2011) indicated in their meta-analyses, poor handwriting legibility as well as spelling and grammatical miscues can impact raters’ scores of writing content, resulting in lower scores for writing quality. This may have influenced the mag-nitude of the relationship between handwriting fluency and writing quality. It is also important to note that all assessments were administered by teachers. This was necessary given the size of the study, but it is possible that teachers made mistakes in administering the assessments, and this should be taken into account when interpreting the results of the study.
Finally, caution must be exercised when drawing instructional implications from a correlational study such as this one. Our findings cannot be treated as if they are causal. Even so, the findings from this investigation are consistent with previ-ous research showing that children become better writers when efforts are made to increase their handwriting fluency (Santangelo & Graham, 2016). We need to build on these findings to understand better how to teach handwriting. This is not neces-sarily a straightforward process. For example, a recent study with third grade stu-dents found that teaching text transcription skills improved children’s handwriting, spelling, and quality of their text, but had a negative effect on motivation to write (Limpo, et al., 2020b). It is important that future instructional studies in writing take into account how different aspects of writing are impacted through handwriting instruction.
Funding Open access funding provided by NTNU Norwegian University of Science and Technology (incl St. Olavs Hospital - Trondheim University Hospital). This study was funded by a grant from the Norwegian Research Council, Grant No. 288795.
Open Access This article is licensed under a Creative Commons Attribution 4.0 International License, which permits use, sharing, adaptation, distribution and reproduction in any medium or format, as long as you give appropriate credit to the original author(s) and the source, provide a link to the Creative Com-mons licence, and indicate if changes were made. The images or other third party material in this article are included in the article’s Creative Commons licence, unless indicated otherwise in a credit line to the material. If material is not included in the article’s Creative Commons licence and your intended use is not permitted by statutory regulation or exceeds the permitted use, you will need to obtain permission directly from the copyright holder. To view a copy of this licence, visit http:// creat iveco mmons. org/ licen ses/ by/4. 0/.

1 3
Handwriting fluency and the quality of primary grade students’…
References
Bazerman, C., Applebee, A. N., Berninger, V. W., Brandt, D., Graham, S., Matsuda, P. K., Murphy, S., Rowe, D. W., & Schleppegrell, M. (2017). Taking the long view on writing development. Research in the Teaching of English, 51(3), 351–360. https:// www. jstor. org/ stable/ 44821 267
Bereiter, C., & Scardamalia, M. (1987). The psychology of written composition. Lawrence Erlbaum Associates.
Berge, K. L., Evensen, L. S., & Thygesen, R. (2016). The Wheel of Writing: A model of the writing domain for the teaching and assessing of writing as a key competency. The Curriculum Journal, 27(2), 172–189. https:// doi. org/ 10. 1080/ 09585 176. 2015. 11299 80
Berge, K. L., Skar, G. B., Matre, S., Solheim, R., Evensen, L. S., Otnes, H., & Thygesen, R. (2019). Intro-ducing teachers to new semiotic tools for writing instruction and writing assessment: Consequences for students’ writing proficiency. Assessment in Education: Principles, Policy and Practice, 26(1), 6–25. https:// doi. org/ 10. 1080/ 09695 94X. 2017. 13302 51
Berninger, D. Brandt, S. Graham, J. Langer, S. Murphy, P. Matsuda, D. Rowe, & M. Schleppegrell, (Eds.), The lifespan development of writing (pp. 271–325). National Council of English.
Berninger, V. W. (1999). Coordinating transcription and text generation in working memory during composing: Automatic and constructive processes. Learning Disability Quarterly, 22(2), 99–112. https:// doi. org/ 10. 2307/ 15112 69
Berninger, V., & Fuller, F. (1992). Gender differences in orthographic, verbal, and compositional fluency: Implications for assessing writing disabilities in primary grade children. Journal of School Psychol-ogy, 30, 363–382.
Bruning, R., & Horn, C. (2000). Developing motivation to write. Educational Psychologist, 35(1), 25–37. https:// doi. org/ 10. 1207/ S1532 6985E P3501_4
Camacho, A., Alves, R. A., & Boscolo, P. (2021). Writing motivation in school: A systematic review of empirical research in the early twenty-first century. Educational Psychology Review, 33(1), 213–247. https:// doi. org/ 10. 1007/ s10648- 020- 09530-4
Chenoweth, N. A., & Hayes, J. R. (2001). Fluency in writing: Generating text in L1 and L2. Written Com-munication, 18(1), 80–98. https:// doi. org/ 10. 1177/ 07410 88301 01800 1004
Cordeiro, C., Castro, S. L., & Limpo, T. (2018). Examining potential sources of gender differences in writing: The role of handwriting fluency and self-efficacy beliefs. Written Communication, 35, 448–473. https:// doi. org/ 10. 1177/ 07410 88318 788843
Eckes, T. (2011). Introduction to many-facet Rasch measurement: analyzing and evaluating rater-medi-ated assessments (1st ed.). Peter Lang.
Ekholm, E., Zumbrunn, S., & De-Busk-Lane, M. (2018). Clarifying an elusive construct: A systematic review of writing attitudes. Educational Psychology Review, 30(3), 827–856. https:// doi. org/ 10. 1007/ s10648- 017- 9423-5
Feng, L., Lindner, A., Ji, X. R., & Malatesha Joshi, R. M. (2019). The roles of handwriting and keyboard-ing in writing: A meta-analytic review. Reading and Writing: An Interdisciplinary Journal, 32(1), 33–63. https:// doi. org/ 10. 1007/ s11145- 017- 9749-x
Graham, S. (in press). Writer(s)-Within-Community model of writing as a lens for studying the teaching of writing. In R. Horrowitz (Ed.), The Routledge Handbook of International Research on Writing, Vol. II. NY: Routledge.
Graham, S. (1990). The role of production factors in learning disabled students= compositions. Journal of Educational Psychology, 82, 781–791.
Graham, S. (1999). The role of text production skills in writing development: A special Issue-I. Learning Disability Quarterly, 22(2), 75–77. https:// doi. org/ 10. 2307/ 15112 67
Graham, S. (2006). Writing. In P. Alexander & P. Winne (Eds.), Handbook of Educational Psychology (pp. 457–478). Earlbaum.
Graham, S. (2018a). A revised writer (s)-within-community model of writing. Educational Psychologist, 53(4), 258–279.
Graham, S. (2018b). The writer(s)-within-community model of writing. Educational Psychologist, 53(4), 258–279. https:// doi. org/ 10. 1080/ 00461 520. 2018. 14814 06
Graham, S., & Harris, K. R. (2000). The role of self-regulation and transcription skills in writing and writing development. Educational Psychologist, 35, 3–12.

G. B. Skar et al.
1 3
Graham, S., Berninger, V., Abbott, R., Abbott, S., & Whitaker, D. (1997). The role of mechanics in com-posing of elementary school students: a new methodological approach. Journal of Educational Psy-chology, 89(1), 170–182.
Graham, S., Berninger, V., Weintraub, N., & Schafer, W. (1998). The development of handwriting fluency and legibility in grades l through 9. Journal of Educational Research, 92(1), 42–52. https:// doi. org/ 10. 1080/ 00220 67980 95975 74
Graham, S., Collins, A., & Rigby-Wills, H. (2017a). A meta-analysis examining the writing characteris-tics of students with learning disabilities and normally achieving peers. Exceptional Children, 83, 199–218.
Graham, S., Kiuhara, S., Harris, K. R., & Fishman, E. (2017b). The relationship between strategic behav-ior, motivation, and writing performance with young, developing writers. Elementary School Jour-nal, 118, 82–104.
Graham, S., Harris, K. R., & Adkins, M. (2018). The impact of supplemental handwriting and spell-ing instruction with first grade students who do not acquire transcription skills as rapidly as peers: A randomized control trial. Reading & Writing: An Interdisciplinary Journal, 31(6), 1273–1294. https:// doi. org/ 10. 1007/ s11145- 018- 9822-0
Graham, S., Harris, K. R., & Hebert, M. (2011). It is more than just the message: Analysis of presentation effects in scoring writing. Focus on Exceptional Children, 44(4), 1–12.
Graham, S., Hebert, M., Fishman, E., Ray, A., & Gillespie-Rouse, A. (2020). Do children classified with specific language impairment experience writing difficulties? A Meta-analysis. Journal of Learning Disabilities, 53, 292–310.
Graham, S., & Santangelo, T. (2014). Does spelling instruction make students better spellers, readers, and writers? A meta-analytic review. Reading & Writing: An Interdisciplinary Journal, 27, 1703–1743.
Graham, S., Skar, G., & Falk, D. (2021). Teaching writing in the primary grades in Norway: A national survey. Reading and Writing: An Interdisciplinary Journal, 34, 529–569.
Graham, S., Wijekumar, K., Harris, K. R., Lei, P., Fishman, E., Ray, A., & Houston, J. (2019). Writing skills, knowledge, motivation, and strategic behavior predict students’ persuasive writing perfor-mance in the context of robust writing instruction. Elementary School Journal, 119, 487–510.
GSI (2019). Grunnskolens informasjonssystem [The Information system of Primary Education]. https:// gsi. udir. no/
Harris, K. R., Graham, S., Brindle, M., & Sandmel, K. (2009). Metacognition and children’s writing. In D. Hacker, J. Dunlosky, & A. Graesser (Eds.), Handbook of metacognition in education (pp. 131–153). Earlbaum.
Harrison, G. L., Goegan, L. D., Jalbert, R., McManus, K., Sinclair, K., & Spurling, J. (2016). Predictors of spelling and writing skills in first- and second-language learners. Reading and Writing, 29(1), 69–89. https:// doi. org/ 10. 1007/ s11145- 015- 9580-1
Hartley, J. (1991). Sex differences in handwriting: A comment on Spear. British Educational Research Journal, 17, 141–145.
Hayes, J. R. (2011). Kinds of knowledge-telling models: Modeling early writing development. Journal of Writing Research, 3(2), 74–92.
Hayes, J. R. (2012). Modeling and remodeling writing. Written Communication, 29(3), 369–388. https:// doi. org/ 10. 1177/ 07410 88312 451260
Jimenez, J. E., & Hernandez-Cabrera, J. A. (2018). Transcription skills and written composition in Span-ish beginning writers: Pen and keyboard modes. Reading and Writing: An Interdisciplinary Journal, 32(7), 1847–1879. https:// doi. org/ 10. 1007/ s11145- 018- 9928-4
Kellogg, R. T. (1987). Effects of topic knowledge on the allocation of processing time and cognitive effort to writing processes. Memory & Cognition, 15(3), 256–266. https:// doi. org/ 10. 3758/ BF031 97724
Kellogg, R. (1993). The psychology of writing. Oxford University Press.Kellogg, R. (1996). A model of working memory in writing. In M. Levy & S. Ransdell (Eds.), The sci-
ence of writing: Theories, methods, individual differences, and applications (pp. 57–72). Earlbaum.Kent, S. C., & Wanzek, J. (2016). The relationship between component skills and writing quality and
production across developmental levels: A meta-analysis of the last 25 Years. Review of Educational Research, 86(2), 570–601. https:// doi. org/ 10. 3102/ 00346 54315 619491.
Kim, Y.-S., Al Otaiba, S., Wanzek, J., & Gatlin, B. (2015). Toward an understanding of dimensions, predictors, and the gender gap in written composition. Journal of Educational Psychology, 107(1), 79–95. https:// doi. org/ 10. 1037/ a0037 210

1 3
Handwriting fluency and the quality of primary grade students’…
Kim, Y.-S.G., Gatlin, B., Al Otaiba, S., & Wanzek, J. (2018). Theorization and an empirical investigation of the component-based and developmental text writing fluency construct. Journal of Learning Dis-abilities, 51(4), 320–335. https:// doi. org/ 10. 1177/ 00222 19417 712016
Lenth, R. V. (2001). Some practical guidelines for effective sample size determination. The American Statistician, 55(3), 187–193.
Limpo, T., & Alves, R. (2017). Written language bursts mediate the relationship between transcription skills and writing performance. Written Communication, 34, 306–332. https:// doi. org/ 10. 1177/ 07410 88317 714234
Limpo, T., Alves, R., & Connelly, V. (2017). Examining the transcription-writing link: Effects of hand-writing fluency and spelling accuracy on writing performance via planning and translating in middle grades. Learning and Individual Differences, 53, 26–36. https:// doi. org/ 10. 1016/j. lindif. 2016. 11. 004
Limpo, T., Filipe, M., Magalhaes, S., Cordeiro, C., Veloso, A., Castro, S., & Graham, S. (2020a). Explor-ing third graders reasons to write and their relationship with self-efficacy and writing skills. Reading and Writing: an Interdisciplinary Journal, 33(9), 2173–2204.
Limpo, T., Vigário, V., Rocha, R., & Graham, S. (2020b). Promoting transcription in third-grade class-rooms: Effects on writing skills, composing, and motivation. Contemporary Educational Psychol-ogy, 61, 101856.
Limpo, T., & Graham, S. (2020). The role of handwriting instruction in writers’ education. British Jour-nal of Educational Studies, 68(3), 311–329. https:// doi. org/ 10. 1080/ 00071 005. 2019. 16921 27
Linacre, J. M. (2017). A user’s guide to FACETS. Rasch-model computer programs. Program manual 3.80.0. Downloaded 2017–05–25. http:// www. winst eps. com/a/ Facets- Manua lPDF. zip
Mayer, R. (2012). Information processing. Theories, constructs, and critical issuesIn K. Harris, S. Gra-ham, & T. Utdan (Eds.), APA educational psychology handbook (Vol. 1, pp. 85–100). American Psychological Association.
McCutchen, D. (1988). “Functional automaticity” in children’s writing: A problem of metacognitive con-trol. Written Communication, 5(3), 306–324. https:// doi. org/ 10. 1177/ 07410 88388 00500 3003
McCutchen, D. (1996). Introduction: From product to process: Legacy of the problem-solving approach to writing. Educational Psychology Review, 8(3), 187–191. https:// doi. org/ 10. 1007/ BF014 64072
McCutchen, D. (2000). Knowledge, processing, and working memory in writing and writing develop-ment. Educational Psychologists, 35(1), 13–24. https:// doi. org/ 10. 1207/ S1532 6985E P3501_3
Monroe, M., & Sherman, E. (1966). Group diagnostic reading aptitude and achievement tests. Nevins.Olinghouse, N., & Graham, S. (2009). The relationship between the writing knowledge and the writ-
ing performance of elementary-grade students. Journal of Educational Psychology, 101(1), 37–50. https:// doi. org/ 10. 1037/ a0013 462
Olinghouse, N., Graham, S., & Gillespie, A. (2015). The relationship of discourse and topic knowledge to writing performance. Journal of Educational Psychology, 107(2), 391–406. https:// doi. org/ 10. 1037/ a0037 549
Pajares, F., & Valiante, G. (2001). Gender differences in writing motivation and achievement of mid-dle school students” A function of gender orientation. Contemporary Educational Psychology, 26, 366–381.
Pass, F., & Sweller, J. (2014). Implications of cognitive load theory for multimedia learning. In R. Mayer (Ed.), The Cambridge handbook of multimedia learning (2nd ed., pp. 27–42). Cambridge University Press.
Reilly, D., Neumann, D., & Andrews, G. (2019). Gender differences in reading and writing achievement: evidence from the National Assessment of Educational Progress (NAEP). American Psychologist, 74(4), 445–458. https:// doi. org/ 10. 1037/ amp00 00356
Salas, N., & Silvente, S. (2020). The role of executive functions and transcription skills in writing: A cross-sectional study across 7 years of schooling. Reading and Writing: An Interdisciplinary Jour-nal, 33(4), 877–905. https:// doi. org/ 10. 1007/ s11145- 019- 09979-y
Santangelo, T., & Graham, S. (2016). A comprehensive meta-analysis of handwriting instruction. Educa-tional Psychology Review, 28, 225–265. https:// doi. org/ 10. 1007/ s10648- 015- 9335-1
Seymour, P., Aro, M., Erskine, J., & COST Action A8 Network. (2003). Foundation literacy acquisition in European orthographies. British Journal of Psychology, 94, 143-174. https:// doi. org/ 10. 1348/ 00071 26033 21661 859
Shanahan, T. (2006). Relations among oral language, reading, and writing development. In C. A. Mac-Arthur, S. Graham, & J. Fitzgerald (Eds.), Handbook of writing research (pp. 171–183). Guilford Press.

G. B. Skar et al.
1 3
Skar, G. B. (2017). The Norwegian National Sample-Based Writing Test 2016: Technical Report. Nas-jonalt senter for skriveopplæring og skriveforsking. http:// www. skriv esent eret. no/ uploa ds/ files/ Skriv eprov en2017/ NSBWT 2017. pdf
Skar, G. B., & Aasen, A. J. (2018). Å måle skriving som grunnleggende ferdighet. Acta Didactica Norge, 12(4), 1–29. https:// doi. org/ 10. 5617/ adno. 6280
Skar, G. B., Aasen, A. J., & Jølle, L. (2020a). Functional writing in the primary years: protocol for a mixed-methods writing intervention study. Nordic Journal of Literacy Research, 6(1), 201–216.
Skar, G. B., Jølle, L., & Aasen, A. J. (2020b). Establishing rating scales to assess writing proficiency development in young learners. Acta Didactica Norden, 14(1), 1–30. https:// doi. org/ 10. 5617/ adno. 7909
Snijders, T., & Bosker, R. (1999). Multilevel Analysis: an introduction to basic and advanced multilevel modeling. Sage Publications.
Spear, M. (1989). Difference between the written work of boys and girls. British Educational Research Journal, 15, 271–277.
Wagner, R., Puranick, C., Foorman, B., Foster, E., Wilson, L., Tschinkel, E., & Kantor, P. (2011). Mod-eling the development of writing. Reading & Writing: an Interdisciplinary Journal, 24(2), 203–220.
Wijekumar, K., Graham, S., Harris, K. R., Lei, P., Barkel, A., Aitken, A., Ray, A., & Houston, J. (2019). The roles of writing knowledge, motivation, strategic behaviors, and skills in predicting elementary students’ persuasive writing from source material. Reading & Writing: An Interdisciplinary Jour-nal, 32, 1431–1457. https:// doi. org/ 10. 1007/ s11145- 018- 9836-7
Publisher’s Note Springer Nature remains neutral with regard to jurisdictional claims in published maps and institutional affiliations.