Handover in WCDMA Uplink and Downlink. … Postgraduate Course in Radio Communications Handover in...
20
S-72.333 Postgraduate Course in Radio Communications 2001-2002 Handover in WCDMA Uplink and Downlink. Performance of Handover Algorithms Kimmo Hiltunen, 39195V [email protected]
Transcript of Handover in WCDMA Uplink and Downlink. … Postgraduate Course in Radio Communications Handover in...

S-72.333 Postgraduate Course in Radio Communications
2001-2002
Handover in WCDMA Uplink and Downlink. Performance of Handover
Algorithms
Kimmo Hiltunen, 39195V [email protected]

S-72.333 Postgraduate Course in Radio Communications Handover in WCDMA Uplink and Downlink. Performance of Handover Algorithms _____________________________________________________________________________________
Kimmo Hiltunen 2 26.2.2002
Contents
1 HANDOVER IN WCDMA...................................................................................... 3
2 WCDMA INTRA-FREQUENCY HANDOVER.................................................. 3 2.1 HANDOVER ALGORITHM ..................................................................................... 4
2.1.1 Mobile Station ............................................................................................ 4 2.1.2 Network..................................................................................................... 12
2.2 SOFT HANDOVER GAINS ................................................................................... 13 2.2.1 Soft Handover Gain Against Shadow Fading ......................................... 13 2.2.2 The Impact of Soft Handover on WCDMA Capacity .............................. 13 2.2.3 The Impact of Soft Handover on WCDMA Coverage ............................. 15
2.3 SOFT HANDOVER PROBABILITIES...................................................................... 15
3 WCDMA INTER-FREQUENCY HANDOVER ................................................ 17 3.1 INTER-FREQUENCY HANDOVERS WITHIN WCDMA ........................................ 17
3.1.1 Inter-Frequency Measurements. Compressed Mode .............................. 17 3.2 INTER-SYSTEM HANDOVERS BETWEEN WCDMA AND GSM.......................... 18
4 SUMMARY............................................................................................................. 19
5 REFERENCES ....................................................................................................... 19

S-72.333 Postgraduate Course in Radio Communications Handover in WCDMA Uplink and Downlink. Performance of Handover Algorithms _____________________________________________________________________________________
Kimmo Hiltunen 3 26.2.2002
1 HANDOVER IN WCDMA
The handovers in WCDMA can be divided into two groups: soft and hard handovers. In case of a soft handover the mobile is simultaneously connected to several base stations, while in case of a hard handover the mobile is connected to one base station at a time. Soft handover is possible only between intra-frequency cells, i.e. cells using the same frequency. Hard handover, however, can be performed either between two intra-frequency cells, two inter-frequency (WCDMA) cells, or between WCDMA and GSM. In the latter case the handover is typically called as inter-system handover. Finally, intra-frequency handovers are Mobile Estimated Handovers (MEHO), while inter-frequency and inter-system handovers are Network Evaluated Handovers (NEHO). However, mobile measurements can be used to trigger the required inter-frequency and inter-system measurements.
2 WCDMA INTRA-FREQUENCY HANDOVER
For dedicated channels a soft handover is typically performed, while for shared and common channels a hard handover is the only possibility. However, the specifications allow hard handover even for dedicated channels [1]. Hard handover for dedicated channels may be required for example when inter-RNC handover is not possible due to Iur congestion.
In this paper the main focus is on intra-frequency soft handover. Soft handover has a special importance in CDMA based systems, due to its close relationship to power control. CDMA systems are interference-limited meaning that their capacities are closely related to the amount of interference the systems can tolerate. Due to its effective frequency reuse factor of one, a CDMA system cell is affected, not only by the interference within its own cell, but also by the interference from its neighboring cells. To alleviate level of interference, and thus increase the capacity and quality, CDMA systems employ power control. Power control attempts to solve the near/far problem by adjusting the transmit power so that the target C/I is evenly satisfied. The fundamental idea behind the power control is to restrain from transmitting more power than necessary in order to limit the interference. With power control, each mobile and base station is disciplined to transmit just enough power to meet the target C/I level. But in order for power control to work effectively, the system must ensure that each mobile station is connected to the base station with the strongest signal at all time, otherwise a positive power feedback problem can instabilize the entire system. Thus, an instantaneous handover from the current cell to the new cell would be required when the signal strength of the new cell exceeds the signal strength of the current cell. This is not, however, feasible in practice. Since in soft handover the mobile is connected to either two or more base stations, its transmission power can be controlled according to the cell, which the mobile station receives with the highest signal strength. A mobile station enters the soft handover state when the signal strength of a neighboring cell exceeds a certain threshold but is still below the signal strength of the current cell.
Another fact in favour of the soft handover is that it offers gain both in system capacity and coverage. First of all, the handover, hard or soft, reduces the required log-normal shadow fading margin. This is because the shadow fading is partly uncorrelated

S-72.333 Postgraduate Course in Radio Communications Handover in WCDMA Uplink and Downlink. Performance of Handover Algorithms _____________________________________________________________________________________
Kimmo Hiltunen 4 26.2.2002
between the sectors, and by making a handover the mobile can select a better base station. Soft handover gives an additional macro diversity gain against fast fading by reducing the required Eb/N0 relative to a single radio link, due to the effect of macro diversity combining. All these different kinds of soft handover gains are discussed further in Chapter 2.2.
In the uplink direction, one typically separates the scenario where the mobile is communicating with different sites (soft handover) from the scenario where the mobile is communicating with sectors belonging to the same site (softer handover). In case of softer handover the combining of the links is performed internally within the site. Basically the question is about a similar RAKE processing (maximum ratio combining) as in case of multipath/antenna diversity. In case of soft handover selection combining is performed within the RNC. This is done by selecting the best received frame from all the RBS in the Active Set on a frame-by-frame basis.
In the downlink direction the same signal is transmitted from all RBS within the current Active Set. The links are maximum ratio combined within the mobile station’s RAKE receiver. However, opposite to the uplink, in the downlink the soft handover creates more interference to the system, since the new base station now transmits an additional signal for the mobile station. Therefore, it is possible that the mobile station is not able to collect all the energy that the base station transmits due to a limited number of RAKE fingers. Thus, the soft handover gain in the downlink depends on the gain of macro diversity and the loss of performance due to increased interference.
2.1 HANDOVER ALGORITHM
As mentioned, the intra-frequency soft handover is a MEHO algorithm. This means, that the mobile station monitors the air interface following the instructions supplied by the RNC, and reports the measurement results back to the RNC. The RNC makes then the final decision on which cells to add, remove, or replace.
Next, the soft handover algorithms implemented within the mobile station and the network are presented in more detail.
2.1.1 Mobile Station
A simple overview of the UE (User Equipment) model is presented in Figure 1 [2]. All the intra-frequency measurements are performed on the downlink Primary Common Pilot Channel (P-CPICH). The definitions of the different possible measurement quantities (i.e. Ec/I0, path loss and RSCP, Received Signal Code Power) and their performance requirements can be found in [2], [3] and [4]. First, the measurement samples are filtered with the “Layer 1 filter” in order to average out of the impact of multipath fading. Furthermore, in order to give the operator the possibility to have a better control over the accuracy of the measurements, a special higher layer (i.e. “layer 3”) filter model is specified in [1]:
( )2
1
2
1k
nnn
a
XaFaF−
−
=
⋅+⋅−=
(2.1)

S-72.333 Postgraduate Course in Radio Communications Handover in WCDMA Uplink and Downlink. Performance of Handover Algorithms _____________________________________________________________________________________
Kimmo Hiltunen 5 26.2.2002
where Xn is the latest received measurement result from the physical layer measurements, Fn is the filtered output from the layer 3 filter, k is the L3 filter parameter supplied by the operator.
The physical layer measurement results are sampled once every measurement period. The measurement period and the accuracy for a certain measurement is defined in [4]. With the help of the layer 3 filter the operator can easily increase the accuracy of the measurements, with the price of an increased delay.
Layer 1filteringmodel
Layer 3filteringmodel
Layer 3event
evaluation
P_CPICH Ec/N0P_CPICH RSCPDL Path loss
RRCMeasurementReport
L3 Filter parameter (k) Event trigger criteria
k’
Figure 1. UE model
2.1.1.1 Handover Measurements
The accuracy and the delay of the handover measurements, e.g. P-CPICH Ec/I0, is important for the handover performance. Therefore, even though the exact implementation of the layer 1 filter model is not specified, the minimum performance requirements are given [4]. These requirements include the minimum performance for the measurement accuracy and delay, and furthermore, the ability for parallel measurements.
For the P-CPICH Ec/I0 measurement, the technical specification [4] defines that the measurement period is 200 ms. This means that the reported measurement result after layer 1 filtering shall be an estimate of the average value of the measured quantity over the last 200 ms period. Typically, the choice of the measurement period is a tradeoff; if the averaging period is longer, the fast fading is more effectively averaged out, but at the same time the measurement delay is increased, which is not a good thing, in particular for micro cellular networks.
The impact of mobile speed on measurement accuracy can be studied by looking at the output of a fixed length (200 ms) layer 1 filter. Since only the impact of fast fading is studied, the path loss and the shadowing are not considered. Furthermore, the P-CPICH Ec/I0 is normalized so that without fast fading the ratio would be equal to 1 (0 dB). Thus,
( )agag
IE
ff
ffc
−+⋅
=
10 (2.2)
where the fading of the intercell interference is ignored. As mentioned, the target of the handover measurement is to obtain a measurement result where the effect of fast fading

S-72.333 Postgraduate Course in Radio Communications Handover in WCDMA Uplink and Downlink. Performance of Handover Algorithms _____________________________________________________________________________________
Kimmo Hiltunen 6 26.2.2002
is averaged out. The mobile is assumed to take an error-free measurement sample every 20 ms, and the output of the layer 1 filter is simply the linear expectation value of the last 10 samples. The correct measurement value would be 0 dB and the difference from that value is caused only by the fast fading which is not completely averaged out. The assumed multipath profile is a single-ray Rayleigh fading channel, which is a worst case assumption. If multipath diversity is available and the mobile can measure with multiple RAKE fingers, fast fading causes fewer inaccuracies than in case of the single-ray channel.
0 50 100 150 200 250 300−6
−5
−4
−3
−2
−1
0
1
Time [s]
dB
3 kmph, a = 0.8
0 50 100 150 200 250 300−10
−8
−6
−4
−2
0
2
4
Time [s]
dB
3 kmph, a = 0.35
Figure 2. Results for 3 km/h. Mobile is assumed to travel a distance of 250 m.
0 2 4 6 8 10 12 14 16 18−2.5
−2
−1.5
−1
−0.5
0
Time [s]
dB
50 kmph, a = 0.8
0 2 4 6 8 10 12 14 16 18−4.5
−4
−3.5
−3
−2.5
−2
−1.5
−1
−0.5
0
0.5
Time [s]
dB
50 kmph, a = 0.35
Figure 3. Results for 50 km/h. Mobile is assumed to travel a distance of 250 m.
From the results shown in Figure 2 and Figure 3 one can clearly notice that for 3 km/h the measurement errors are much larger than for 50 km/h. Furthermore, the errors are larger, when the mobile is closer to the cell border, i.e. when the parameter a has a smaller value. The larger measurement errors for the 3 km/h user speed are due to the fact that 200 ms filtering period is not long enough to average out the impact of fast fading. Thus, additional filtering of the measurement results is required in order to avoid any unnecessary handovers, obviously with the price of an increased delay. However, due to the slow user speed, the additional delay will most probably not cause any major problems for the network performance.
Regarding the delay, the specification defines that the mobile shall be able to detect and report an event within the measurement period, assuming that the cell is already

S-72.333 Postgraduate Course in Radio Communications Handover in WCDMA Uplink and Downlink. Performance of Handover Algorithms _____________________________________________________________________________________
Kimmo Hiltunen 7 26.2.2002
“known”, i.e. that the mobile has already been able to perform measurements on the primary CPICH in question. This requirement is valid for the scenario where no layer 3 filtering is applied [4].
For the accuracy of the P-CPICH Ec/I0 measurements, the minimum requirements listed in Table 1 and Table 2 are specified, assuming AWGN radio propagation conditions and no higher layer filtering [4].
Table 1. CPICH Ec/Io Intra-frequency absolute accuracy
Accuracy [dB] Conditions Parameter Unit Normal condition Extreme
condition Io [dBm]
CPICH_Ec/Io dB ± 1.5 for -14 ≤ CPICH Ec/Io
± 2 for -16 ≤ CPICH Ec/Io < -14 ± 3 for -20 ≤ CPICH Ec/Io < -16
± 3 -94...-50
Table 2. CPICH Ec/Io Intra-frequency relative accuracy
Accuracy [dB] Conditions Parameter Unit Normal condition Extreme
condition Io [dBm]
CPICH_Ec/Io dB ± 1.5 for -14 ≤ CPICH Ec/Io
± 2 for -16 ≤ CPICH Ec/Io < -14 ± 3 for -20 ≤ CPICH Ec/Io < -16
± 3 -94...-50
For the parallel measurements it is required that the mobile shall be able to perform P-CPICH Ec/I0 measurements for at least 8 detected intra-frequency cells, in the monitored set, and the UE physical layer shall be capable of reporting measurements to higher layers with the measurement period of 200 ms [4].
2.1.1.2 Measurement Reporting
When ordering the measurements, the network defines among other things whether the reporting should be based on measurements (i.e. “event-triggered”), or time (i.e. “periodical”, like in GSM). According to [5], from the system quality point of view the periodic reporting mode can perform better than the event-triggered mode. However, the resulted signaling load becomes considerably higher. In other words, at the same level of signaling load, the event-triggered mode results in better system quality. In this paper, only the event-triggered reporting is considered.
In the UTRA specifications a number of different measurement based events are defined [1]. However, it should be noted that normally the mobile station does not need to report all possible events. Instead, the list of different events can be seen as a toolbox from which the network can choose the reporting events that are needed for the implemented handover function, or other radio network functions. Thus, the network can order additional events in order to get more information from the system, but at the same time the signaling load over the air interface will increase.
In order to decrease the number of measurement reports and to avoid any unnecessary handovers, a hysteresis (H) and a time-to-trigger timer (∆T) can be implemented.

S-72.333 Postgraduate Course in Radio Communications Handover in WCDMA Uplink and Downlink. Performance of Handover Algorithms _____________________________________________________________________________________
Kimmo Hiltunen 8 26.2.2002
Furthermore, for each cell that is monitored, a positive or negative offset can be assigned. The offset is added to the measurement quantity before the mobile station evaluates if an event has occurred. In general, this offset mechanism provides the network with an efficient tool to change the reporting of an individual primary CPICH, e.g. it can be seen as a tool to move the cell border. It is also worth noticing that the required ∆T value and the applied layer 3 filtering are closely connected; due to the more stable measurement results, the value for the ∆T may at the same time be decreased, or even set to zero.
In case of an ADD and a REPLACE event the reporting range depends on either on a combination of the links in the current Active Set, or solely on quality of the best link. However, the operator has the possibility to forbid a certain primary CPICH to affect the reporting range. This mechanism could be effective if the operator knows by experience that the quality of a certain primary CPICH is very unstable in a specific area and therefore should not affect the reporting of the other primary CPICHs.
Furthermore, in case of an ADD and a REPLACE event the operator can also define the group of cells that can trigger the events. The possible choices are: Active Set, Monitoring Set (i.e. the cells in the neighbor list that are not in the current Active Set), or all cells in the neighbor list. By using an unnecessary large set of cells, the event detection may become more stable and robust, but at the same time the number of transmitted measurement reports may increase.
Figure 4 presents the events 1A (ADD), 1B (REMOVE) and 1D (CHANGE BEST). An ADD event is reported if a primary CPICH enters the reporting range as defined by the following equation
( ) ( ) ( )
−−⋅−+
⋅≥ ∑
=2
log101log10log10 11
1
aabest
N
iinew
HRMWMWMA
(2.3)
However, if the following condition is fulfilled until the time-to-trigger timer ∆T has expired, no measurement report is sent.
( ) ( ) ( )
+−⋅−+
⋅< ∑
=2
log101log10log10 11
1
aabest
N
iinew
HRMWMWMA
(2.4)
Finally, in order the measurement report to be transmitted, the number of cells in the current Active Set must not exceed the value given in a parameter report deactivation threshold.
In equations above,
Mnew is the measurement result for the cell entering the reporting range, Mi is the measurement result for a cell in the Active Set, NA is the number of cells in the current Active Set, Mbest is the measurement result for the best cell in the Active Set, W is a parameter sent from UTRAN to the UE,

S-72.333 Postgraduate Course in Radio Communications Handover in WCDMA Uplink and Downlink. Performance of Handover Algorithms _____________________________________________________________________________________
Kimmo Hiltunen 9 26.2.2002
R1a is the reporting range constant for event 1A, H1a is the hysteresis parameter for event 1A.
H1a
H1b
R1a
R1b
Event 1A Event 1D Event 1B Time
∆∆∆∆T ∆∆∆∆T ∆∆∆∆T
CPICH_A
CPICH_B
Figure 4. ADD, REMOVE and CHANGE BEST event.
A REMOVE event is reported if a primary CPICH leaves the reporting range as defined by the equation
( ) ( ) ( )
+−⋅−+
⋅≤ ∑
=2
log101log10log10 11
1
bbbest
N
iiold
HRMWMWM
A
(2.5)
However, if the following condition has fulfilled until the time-to-trigger ∆T has expired, no measurement report is sent:
( ) ( ) ( )
−−⋅−+
⋅> ∑
=2
log101log10log10 11
1
bbbest
N
iiold
HRMWMWMA
(2.6)
In the equations:
Mold is the measurement result for a cell leaving the reporting range, Mi is a measurement result for a cell in the Active Set, NA is the number of cells in the current Active Set, Mbest is the measurement result for the best cell in the Active Set, W is a parameter sent from UTRAN to UE, R1b is the reporting range constant for event 1B, H1b is the hysteresis parameter for event 1B.
S-72.333 Postgraduate Course in Radio Communications Handover in WCDMA Uplink and Downlink. Performance of Handover Algorithms _____________________________________________________________________________________
Kimmo Hiltunen 10 26.2.2002
An event 1D (CHANGE BEST) is reported when any of the cells within the reporting range becomes better than the previously best cell. Thus,
21d
bestNotBestH
MM +≥ (2.7)
On the other hand, if
21d
bestNotBestH
MM −< (2.8)
before the time-to-trigger timer ∆T has expired, no measurement report is sent. In the equations above:
MNotBest is the measurement result for a cell not stored in “best cell” in the variable BEST_CELL_1D_EVENT, Mbest is the measurement result for the cell stored in “best cell” in the variable BEST_CELL_1D_EVENT, H1d is the hysteresis parameter for the event 1D.
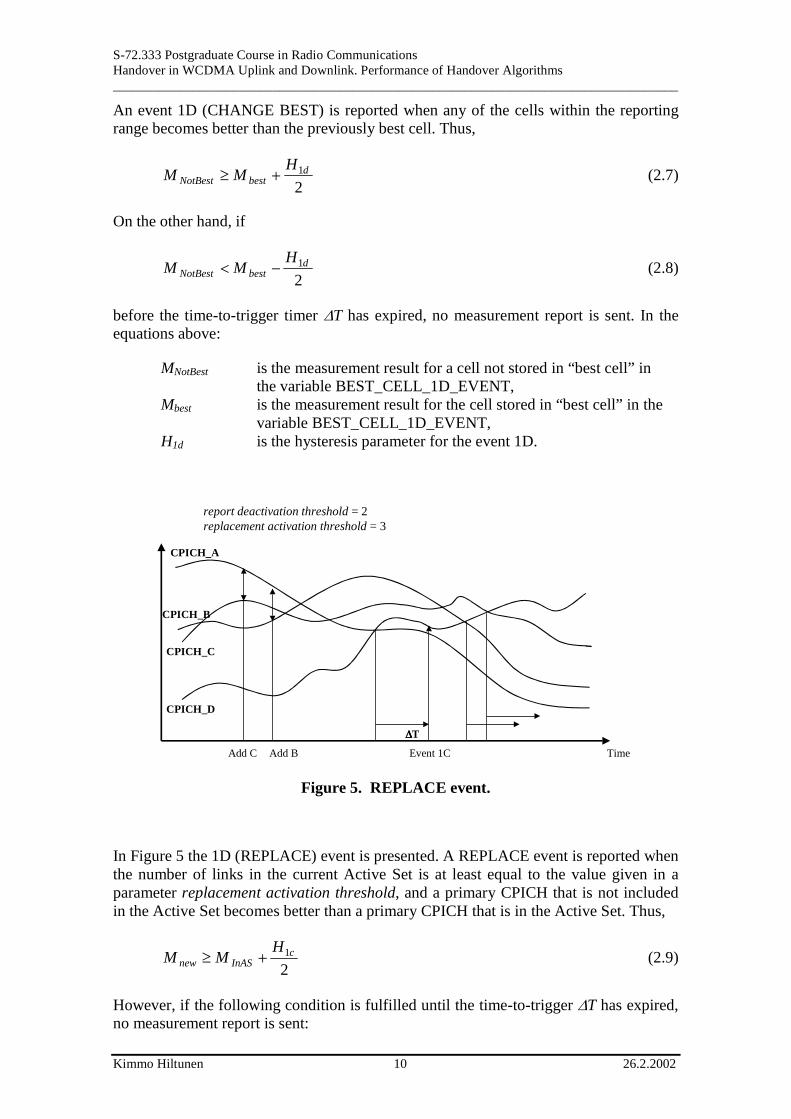
report deactivation threshold = 2replacement activation threshold = 3
CPICH_A
CPICH_B
CPICH_C
CPICH_D
Add C Add B Event 1C Time
∆∆∆∆T
Figure 5. REPLACE event.
In Figure 5 the 1D (REPLACE) event is presented. A REPLACE event is reported when the number of links in the current Active Set is at least equal to the value given in a parameter replacement activation threshold, and a primary CPICH that is not included in the Active Set becomes better than a primary CPICH that is in the Active Set. Thus,
21c
InASnewH
MM +≥ (2.9)
However, if the following condition is fulfilled until the time-to-trigger ∆T has expired, no measurement report is sent:
S-72.333 Postgraduate Course in Radio Communications Handover in WCDMA Uplink and Downlink. Performance of Handover Algorithms _____________________________________________________________________________________
Kimmo Hiltunen 11 26.2.2002
21c
InASnewH
MM −< (2.10)
In the equations above:
Mnew is the measurement result for a cell not included in the Active Set, MInAS is the measurement result for a cell in the Active Set, H1c is the hysteresis parameter for the event 1C.
In general, the replacement activation threshold should be larger than the report deactivation threshold. Furthermore, it should be noted that on top of these two, a separate maximum Active Set size parameter can be defined on the network side.
On top of the presented events, the following ones have also been defined in [1]:
• Event 1E: A primary CPICH becomes better than an absolute threshold. • Event 1F: A primary CPICH becomes worse than an absolute threshold.
With these two events, an IS-95A –like soft handover algorithm can be constructed.
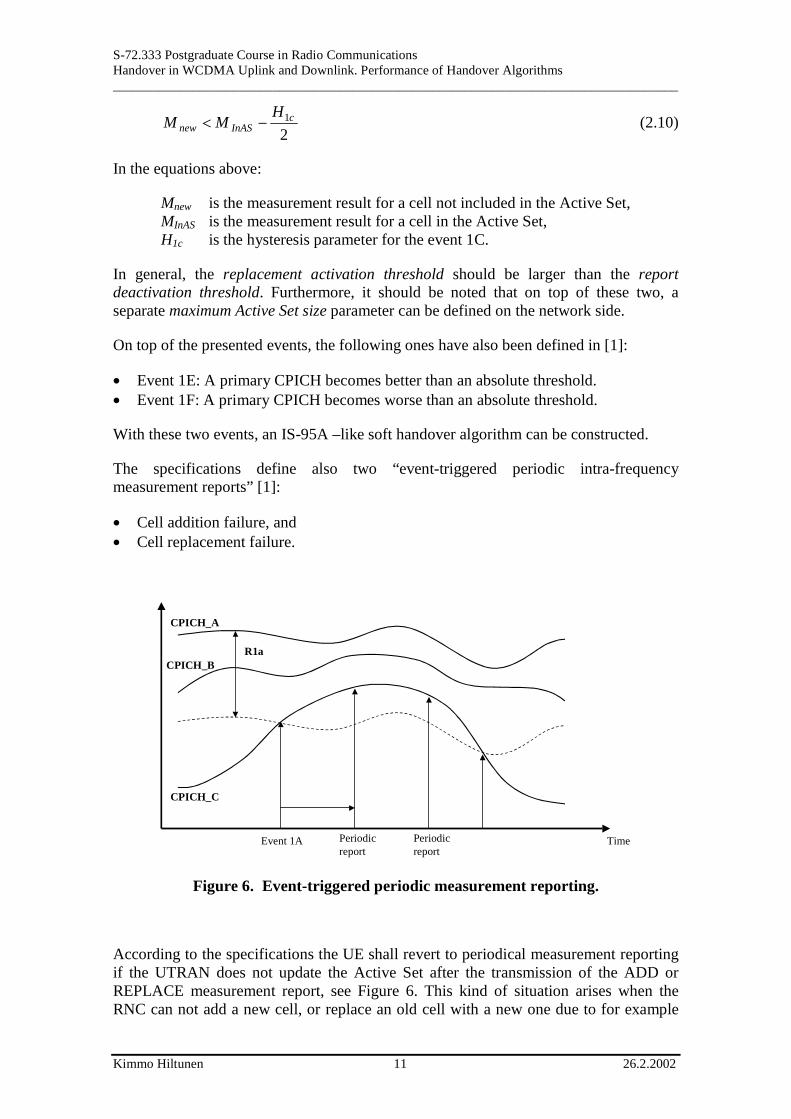
The specifications define also two “event-triggered periodic intra-frequency measurement reports” [1]:
• Cell addition failure, and • Cell replacement failure.
CPICH_A
CPICH_B
CPICH_C
Event 1A Periodicreport
Periodicreport
Time
R1a
Figure 6. Event-triggered periodic measurement reporting.
According to the specifications the UE shall revert to periodical measurement reporting if the UTRAN does not update the Active Set after the transmission of the ADD or REPLACE measurement report, see Figure 6. This kind of situation arises when the RNC can not add a new cell, or replace an old cell with a new one due to for example

S-72.333 Postgraduate Course in Radio Communications Handover in WCDMA Uplink and Downlink. Performance of Handover Algorithms _____________________________________________________________________________________
Kimmo Hiltunen 12 26.2.2002
capacity shortage. During the periodic reporting the UE shall transmit measurement report messages to the UTRAN at predefined intervals.
Event-triggered periodic measurement reporting is terminated if:
• there are no longer any monitored cell(s) within the reporting/replacement range; or • the UTRAN has added cells to the Active Set so that it includes the maximum
number of cells (defined by the reporting deactivation threshold parameter), which are allowed for event 1A to be triggered (ADD); or
• the UTRAN has removed cells from the Active Set so that there are no longer the minimum amount of active cells for event 1C to be triggered (as defined by the replacement activation threshold parameter) (REPLACE); or
• the UE has sent the maximum number of measurement report messages (defined by the amount of reporting parameter)
Finally, in general, one event-triggered measurement report can contain several cells, but only one kind of an event. Thus, several cells that trigger an ADD event at the same time can be reported in one measurement report. If also a REMOVE or CHANGE BEST event is detected, a separate measurement report has to be created. However, after the concatenation on the lower layer, the number of physical packets transmitted over the air interface will not necessarily be increased.
2.1.2 Network
The final decision regarding the Active Set updates is done in the RNC. However, the network part of the handover evaluation procedure is not defined in the UTRA technical specifications. Thus, it is up to each manufacturer to decide how the network reacts on the measurement reports the mobile stations are transmitting. Here, a quite simple network model is presented.
In case of event-triggered measurement reporting, the actions depend on the events which have triggered the reports. If the network receives an ADD report, it first checks if the reported cells are really candidate cells. If the cells are already in the Active Set, no action is done. Otherwise, after an approval from the admission control algorithm, the cells are added to the Active Set. If the measurement report includes more candidates than there is place in the Active Set, the processing is started from the best candidates.
In case of a REMOVE report, the network checks if the reported cells are in the current Active Set. The currently active links are removed, otherwise no action is done. Finally, in case of a REPLACE report, the network replaces the worst cell in the current Active Set with the best candidate, assuming that the admission control algorithm has first approved the action.
In case of periodic measurement reporting similar actions are also possible. However, due to the fact that the mobile is continuously reporting the measurement results for the currently best cells, the network has more freedom in constructing the best possible Active Set. Furthermore, the network can apply additional filtering of the measurement results before making the decisions on which cells to add and/or remove from the Active Set.

S-72.333 Postgraduate Course in Radio Communications Handover in WCDMA Uplink and Downlink. Performance of Handover Algorithms _____________________________________________________________________________________
Kimmo Hiltunen 13 26.2.2002
2.2 SOFT HANDOVER GAINS
2.2.1 Soft Handover Gain Against Shadow Fading
The signal strength value predicted by the wave propagation algorithms can be considered as a mean value of the signal strength within a small area. Assuming that fast fading has been averaged out, the local mean fluctuates in a way not modeled in the prediction algorithm. This deviation of the local mean has nearly a normal distribution in desibels. Therefore, it is typically called log-normal fading. In the link budgets a special log-normal fading margin is included in order to provide the specified coverage availability over the cell area.
In a multicell environment, if the mobile is able to perform handover between the cells, the required log-normal fading margin can be reduced resulting in increased coverage areas. Ideally, the mobile can be always connected to the closest base station from the path loss point of view. This condition is valid for example for the error-free soft handover scenario.
Typically, the value for the log-normal fading margin depends on the propagation conditions, standard deviation of the log-normal fading and the required coverage probability. In Figure 7 a simulated example of the log-normal fading margins are presented. There:
• Path loss ( )dL log6.373.15 += • Hexagonal three sector cells with 65 degree antenna lobes • Standard deviation of the log-normal fading is 6 (left) or 10 dB (right) • Required coverage probability is 85% or better • Ideal cell selection based on the received signal strength is assumed
−2 0 2 4 6 8 10 12 140.85
0.9
0.95
1
Cov
erag
e pr
obab
ility
Required log−normal fading margin [dB]
Single cell
Soft handover
0 2 4 6 8 10 12 14 16 18 20 220.85
0.9
0.95
1
Cov
erag
e pr
obab
ility
Required log−normal fading margin [dB]
Single cell
Soft handover
Figure 7. Simulated log-normal fading margin
2.2.2 The Impact of Soft Handover on WCDMA Capacity
The impact of soft handover on WCDMA system capacity has already been discussed in [6]. Therefore, in this paper, only a brief overview is given. Furthermore, the main focus is on the macro diversity combining gain per user, not on the obtained average gain from the whole system point of view.

S-72.333 Postgraduate Course in Radio Communications Handover in WCDMA Uplink and Downlink. Performance of Handover Algorithms _____________________________________________________________________________________
Kimmo Hiltunen 14 26.2.2002
In Figure 8 the simulated soft handover gain in the uplink transmission power is shown for the ITU Pedestrian A channel model at 3 km/h [7]. Furthermore, the relative average path loss from the mobile to BS1 compared to BS2 is 0, -3, -6 or –10 dB. As can be expected, the highest gains are obtained when the path loss is the same to both base stations, i.e. the relative path loss difference is 0 dB. The gain is relative to the single-link case where the mobile would be connected only to the best base station. In Figure 8, the maximum reduction of the mobile transmission power due to the soft handover is 1.8 dB if the relative path loss difference is 0 dB. If the relative path loss difference is large, the soft handover may result in an increased transmission power. This increase is caused by the signaling errors of the uplink power control commands which are transmitted on the downlink. But typically, the base station would not be in the Active Set if the path loss were 3-6 dB larger than the path loss to the closest base station.
Gain in uplink transmission power
-1
0
1
2
3
-12 -10 -8 -6 -4 -2 0
Relative path loss BS1 compared to BS2 [dB]
[dB]
Figure 8. Soft handover gain in uplink transmission power for ITU Pedestrian A
channel, 3 km/h.
Gain in downlink transmission power
-3
-2
-1
0
1
2
3
-12 -10 -8 -6 -4 -2 0
Relative path loss BS1 compared to BS2 [dB]
[dB]
Figure 9. Soft handover gain in downlink transmission power for ITU Pedestrian
A channel

S-72.333 Postgraduate Course in Radio Communications Handover in WCDMA Uplink and Downlink. Performance of Handover Algorithms _____________________________________________________________________________________
Kimmo Hiltunen 15 26.2.2002
The soft handover gain in required downlink transmission power in presented in Figure 9 [7]. There, neither transmit nor receiver antenna diversity is assumed. As can be noticed from the equations presented in [6] the WCDMA downlink capacity is proportional to the total power transmitted to the users. This is also taken into account in Figure 9, where the transmission power in case of the soft handover is the total power transmitted on the two links.
2.2.3 The Impact of Soft Handover on WCDMA Coverage
During soft handover the uplink transmission from the mobile is received by two or more base stations. Since the number of base stations trying to detect the mobile transmission is increased, the probability of correctly detected signal increases also, and the macro diversity gain is obtained. In a similar way, during the soft handover the mobile receives the same information from two or more base stations.
As an example, the macro diversity gain in uplink coverage is presented in Table 3 for the ITU Pedestrian A and Vehicular A channels with 3 km/h user speed [7]. Two cases are shown: when the path loss is the same to both base stations, and when there is a 3 dB difference in the path loss between the base stations. As can be expected, the first case gives the highest macro diversity gain. When the path loss difference is increased, the macro diversity gain decreases. The results show also that the less multipath diversity, the larger is the macro diversity gain. Furthermore, one can notice that the soft handover gain in coverage is larger than the gain in capacity. The reason is that at the edge of the coverage area the mobile is transmitting on full power and the diversity becomes important because the fast power control cannot compensate for the fast fading.
Table 3. Required Eb/N0 for FER = 1% for 8 kbps with full constant power.
Eb/N0 ITU Pedestrian A ITU Vehicular A Single link 11.3 dB 8.5 dB
Macro diversity result Equal powers / 3 dB difference
7.3 dB / 8.6 dB 6.3 dB / 7.7 dB
Macro diversity gain Equal powers / 3 dB difference
4.0 dB / 2.7 dB 2.2 dB / 0.8 dB
2.3 SOFT HANDOVER PROBABILITIES
During the system planning and optimization phase a very important task is to set proper values for the different parameters affecting the performance of the soft handover algorithm. Allowing more mobiles to be in soft handover, or increasing the maximum size of the Active Set will in most of the cases reduce the uplink interference. However, an increased signaling load can be expected in the network. For the downlink, the situation is not as simple. There, the macro diversity gain depends on the radio conditions and the number of available RAKE fingers. In the downlink, each new soft handover connection increases the transmitted interference to the system. When the increased interference exceeds the diversity gain, the soft handover does not provide any gain for the system performance. Also, in the downlink the number of reserved

S-72.333 Postgraduate Course in Radio Communications Handover in WCDMA Uplink and Downlink. Performance of Handover Algorithms _____________________________________________________________________________________
Kimmo Hiltunen 16 26.2.2002
orthogonal codes increases due to the soft handover, which can lead to a shortage of available codes.
Typically, the soft handover parameters should be set so that the soft handover probability is below 30-40% [7]. For IS-95, an ideal range of 25-40% has been given in [8]. As an example, soft handover probabilities for different initial assumptions are listed in Table 4. There, the environment is assumed to be urban macro cellular, with attenuation factor equal to 3.76. In the table, σ is the standard deviation of the log-normal fading and λ is the average number of links per user.
Table 4. Soft handover probabilities.
σ AS max
SoHO margin
1 link 2 links soft
2 links softer
3 links soft
3 links soft-softr
3 links softer
λ
3 dB 0.77 0.18 0.05 0 0 0 1.23 2 6 dB 0.57 0.33 0.10 0 0 0 1.43 3 dB 0.77 0.14 0.05 0.03 0.01 ≈0 1.27
6 dB
3 6 dB 0.57 0.18 0.08 0.10 0.07 ≈0 1.60 3 dB 0.74 0.20 0.06 0 0 0 1.26 2 6 dB 0.53 0.36 0.11 0 0 0 1.47 3 dB 0.74 0.15 0.05 0.04 0.02 ≈0 1.32
10 dB
3 6 dB 0.53 0.19 0.08 0.12 0.08 ≈0 1.67
In Figure 10 a geographical distribution of the different soft handover situations is presented. There, the maximum size of the Active Set is assumed to be equal to 3, the soft handover margin is 6 dB, and the standard deviation and the decorrelation distance of the log-normal fading is 10 dB and 100 m, respectively. Furthermore, the log-normal fading is assumed to be fully correlated between sectors belonging to the same site, and normally correlated between the sites.
−1500 −1000 −500 0 500 1000 1500 2000−1500
−1000
−500
0
500
1000
1500
Figure 10. Geographical presentation of the different soft handover situations.

S-72.333 Postgraduate Course in Radio Communications Handover in WCDMA Uplink and Downlink. Performance of Handover Algorithms _____________________________________________________________________________________
Kimmo Hiltunen 17 26.2.2002
In Figure 10 the different colors correspond to different soft handover situations in the following way:
• Green: One link. • Blue: Two links, soft handover. • Cyan: Two links, softer handover. • Magenta: Three links, soft handover. • Red: Three links, soft-softer handover. • Yellow: Three links, softer handover.
3 WCDMA INTER-FREQUENCY HANDOVER
3.1 INTER-FREQUENCY HANDOVERS WITHIN WCDMA
Most UMTS operators have two or three FDD carriers available. The different frequencies can be deployed in two different ways as shown in Figure 11: several frequencies on the same macro site, or hierarchical cell layers using different frequencies. Inter-frequency handovers between the WCDMA carriers are needed to support both scenarios.
f1 f1 f1 f1
f2 f2
f3 f3 f3 f3
Urban RuralLoad sharing
handover
Coverage handover
Coverage handover
Figure 11. Inter-frequency handovers within WCDMA.
3.1.1 Inter-Frequency Measurements. Compressed Mode
WCDMA uses continuous transmission and reception and can not make inter-frequency measurements with single receiver if there are no gaps generated to the WCDMA signals. Therefore, a method called compressed mode is needed for both inter-frequency and inter-system measurements. The compressed mode means that transmission and reception are halted for a short time in order to perform measurements on the other frequencies, see Figure 12. The intention is not to lose any data but to compress the data transmission in the time domain. The standard proposes three possibilities for the transmission time reduction [9]:
• Puncturing. A number of bits of the coded data are simply discarded, resulting in a lower performance of the coding. In practice, this method is limited to rather short Transmission Gap Lengths, since the puncturing has some practical limits. The

S-72.333 Postgraduate Course in Radio Communications Handover in WCDMA Uplink and Downlink. Performance of Handover Algorithms _____________________________________________________________________________________
Kimmo Hiltunen 18 26.2.2002
benefit is that the existing spreading factor is kept and therefore no new requirements are caused for the channelisation code usage.
• Increasing the data rate by reducing the spreading factor by 2. This method is suitable also for longer Transmission Gap Lengths.
• Higher layer scheduling. Higher layers set restrictions so that only a subset of the allowed Transport Format Combinations are used in a compressed frame. The maximum number of bits that will be delivered to the physical layer during the compressed radio frame is then known and a transmission gap can be generated
Normal frame Normal frame
Compressedmode
Measurement gap
Figure 12. Compressed mode.
Since more power is needed during the compressed mode, the use of compressed mode will affect the WCDMA coverage. Furthermore, since the fast power control loop is not active during the silent period, and the effect of interleaving is decreased, a higher Eb/N0 target is required, which affects the WCDMA capacity.
Due to the impact on WCDMA capacity and coverage, the compressed mode should be activated by the RNC only when there is a real need to execute an inter-system or inter-frequency handover. This can be done for example by monitoring the downlink transmission powers for each user, or with the help of mobile measurements.
3.2 INTER-SYSTEM HANDOVERS BETWEEN WCDMA AND GSM
WCDMA and GSM standards support inter-system handovers between WCDMA and GSM. These handovers can be used for coverage or load balancing reasons, see Figure 13. At the beginning of the WCDMA deployment, when WCDMA covers mainly only urban areas, handovers to GSM are required to provide continuous coverage. On top of that, handovers from GSM to WCDMA can be used to lower the loading in GSM cells. When the traffic in the WCDMA network increases, it becomes important to have support for load-triggered handover in both directions. The inter-system handovers are triggered in the source RNC/BSC, and from the receiving system point of view the inter-system handover is similar to inter-RNC or inter-BSC handover [7].
Like in the case of inter-frequency handovers, also the inter-system measurements require the use of dual receivers or compressed mode.

S-72.333 Postgraduate Course in Radio Communications Handover in WCDMA Uplink and Downlink. Performance of Handover Algorithms _____________________________________________________________________________________
Kimmo Hiltunen 19 26.2.2002
GSM GSM GSM GSM GSM GSM
WCDMA WCDMA WCDMA
Handover GSM ↔ WCDMAfor load sharing reasons
Handover WCDMA → GSMfor coverage extension
Urban Rural
Figure 13. Inter-system handovers between GSM and WCDMA.
4 SUMMARY
In this paper a brief overview of the WCDMA handover algorithms has been given. For intra-frequency handover situations, the soft handover is the most common choice. However, hard handover is the only possibility for inter-frequency and inter-system handovers.
In case of soft handover the mobile performs measurements on the P-CPICH, and reports the measurement results back to the RNC either periodically, or when a certain pre-defined event has happened. Finally, based on the measurement reports, the RNC makes the final decision on which cells to add, remove or replace.
The soft handover can offer gain both in capacity and coverage. For the uplink, the soft handover is more or less always advantageous. However, for the downlink, the overall gain of soft handover depends on the gain of macro diversity and the loss of performance due to increased interference.
5 REFERENCES
[1] 3GPP TSG RAN 25.331 V3.8.0, “RRC protocol specification (Release 1999)”, September 2001.
[2] 3GPP TSG RAN 25.302 V3.11.0, “Services provided by the physical layer (Release 1999)”, December 2001.
[3] 3GPP TSG RAN 25.215 V3.9.0, “Physical layer – Measurements (FDD) (Release 1999)”, December 2001.
[4] 3GPP TSG RAN 25.133 V3.8.0, “Requirements for support of radio resource management (FDD) (Release 1999)”, December 2001.
[5] K. Hiltunen et al., “Comparison Between the Periodic and Event-Triggered Intra-Frequency Handover Measurement Reporting in WCDMA”, Proceedings of WCNC 2000, Chicago, IL, USA.

S-72.333 Postgraduate Course in Radio Communications Handover in WCDMA Uplink and Downlink. Performance of Handover Algorithms _____________________________________________________________________________________
Kimmo Hiltunen 20 26.2.2002
[6] K. Hiltunen, “CDMA Cellular Architectures”, S-72.333 Postgraduate Course in Radio Communications 2001-2002.
[7] H. Holma, A. Toskala (editors), “WCDMA for UMTS”, John Wiley & Sons, Ltd, 2000.
[8] M. Feuerstein (Metawave Communications Corp), “Smart Antenna Applications to CDMA Systems”, Presentation given at 1998 CDMA & PCS Technology Conference, Orlando, Florida, USA.
[9] 3GPP TSG RAN 25.212 V3.8.0, “Multiplexing and channel coding (FDD) (Release 1999), December 2001.


![10 GSM BSS Network KPI (Uplink-Downlink Balance) Optimization Manual[1].Doc](https://static.fdocuments.net/doc/165x107/545a3905af795998788b5b03/10-gsm-bss-network-kpi-uplink-downlink-balance-optimization-manual1doc.jpg)


![10 gsm bss network kpi (uplink downlink balance) optimization manual[1].doc](https://static.fdocuments.net/doc/165x107/558ec7491a28ab66628b474b/10-gsm-bss-network-kpi-uplink-downlink-balance-optimization-manual1doc-558f343a2e921.jpg)