
Handbook of Zeolite Science and Technology · PDF fileTable 1 Continued Method Application...
51
6 Nuclear Magnetic Resonance Studies of Zeolites Clare P. Grey State University of New York at Stony Brook, Stony Brook, New York, U.S.A. I. INTRODUCTION Nuclear magnetic resonance (NMR) has been widely used to characterize zeolite structure, acidity, and binding sites, and to study catalytic reactions or sorption processes that occur within the pores of zeolites. NMR is a probe of local structure and often serves as a complementary tool for the probe of long-range order, namely, diffraction. The NMR spectra are sensitive to a range of local interactions, which provide detailed spatial and chemical information. Furthermore, NMR spectroscopy is a quantitative probe of the whole sample and, thus, can be used or to follow the fate of molecules inside the pores of the zeolite, during a catalytic reaction or following gas sorption, or to determine, for example, the extent of aluminum substitution into the zeolite framework. The time scale of the interactions probed by NMR spectroscopy can be close to the time scale of many motional processes, and so NMR can be used to study the dynamics of molecules sorbed in the pores of the zeolites or to study longer range diffusional processes (see Chapter 10). More than 3500 papers involving the application of NMR spectroscopy to the study of zeolites were published in or before 1993, and by the end of 2001 the number had risen to over 6000. The field was reviewed by Fyfe et al. in 1991 (1) and by Klinowski in 1993 (2). Thus, this chapter will focus primarily on some of the more recent uses of NMR, which make use of some of the newer NMR methodology developed during the last 10 years. However, the routine use of, for example, 29 Si magic angle spinning (MAS) NMR to determine aluminum framework content or to count the number of crystallographic sites in purely siliceous materials, and 27 Al MAS NMR to investigate the framework and extraframework species, still remain the most widely applied NMR methods. Therefore, these methods will also be discussed briefly. This chapter is not intended as a review of the entire subject but rather as an introduction to the use of the method to study zeolites and as an outline of some of the applications of NMR spectroscopy in this field. Examples are provided to illustrate how NMR can be used to tackle different problems or research projects, along with a brief description of the theory of some of the experiments. This chapter will focus primarily on zeolite structural characterization and on the characterization of binding sites in the zeolite channels or pores. Applications of particular experiments to other molecular sieves, such as aluminum phosphates (or AlPO 4 s), are mentioned only briefly. The applications of NMR to study catalytic processes or of solution NMR methods Copyright © 2003 Marcel Dekker, Inc.
Transcript of Handbook of Zeolite Science and Technology · PDF fileTable 1 Continued Method Application...
6Nuclear Magnetic Resonance Studiesof Zeolites
Clare P. GreyState University of New York at Stony Brook, Stony Brook, New York, U.S.A.
I. INTRODUCTION
Nuclear magnetic resonance (NMR) has been widely used to characterize zeolite structure,
acidity, and binding sites, and to study catalytic reactions or sorption processes that occur
within the pores of zeolites. NMR is a probe of local structure and often serves as a
complementary tool for the probe of long-range order, namely, diffraction. The NMR spectra
are sensitive to a range of local interactions, which provide detailed spatial and chemical
information. Furthermore, NMR spectroscopy is a quantitative probe of the whole sample and,
thus, can be used or to follow the fate of molecules inside the pores of the zeolite, during a
catalytic reaction or following gas sorption, or to determine, for example, the extent of
aluminum substitution into the zeolite framework. The time scale of the interactions probed by
NMR spectroscopy can be close to the time scale of many motional processes, and so NMR can
be used to study the dynamics of molecules sorbed in the pores of the zeolites or to study longer
range diffusional processes (see Chapter 10).
More than 3500 papers involving the application of NMR spectroscopy to the study of
zeolites were published in or before 1993, and by the end of 2001 the number had risen to over
6000. The field was reviewed by Fyfe et al. in 1991 (1) and by Klinowski in 1993 (2). Thus, this
chapter will focus primarily on some of the more recent uses of NMR, which make use of some
of the newer NMR methodology developed during the last 10 years. However, the routine use of,
for example, 29Si magic angle spinning (MAS) NMR to determine aluminum framework content
or to count the number of crystallographic sites in purely siliceous materials, and 27Al MAS
NMR to investigate the framework and extraframework species, still remain the most widely
applied NMR methods. Therefore, these methods will also be discussed briefly.This chapter is not intended as a review of the entire subject but rather as an introduction to
the use of the method to study zeolites and as an outline of some of the applications of NMR
spectroscopy in this field. Examples are provided to illustrate how NMR can be used to tackle
different problems or research projects, along with a brief description of the theory of some of
the experiments. This chapter will focus primarily on zeolite structural characterization and on
the characterization of binding sites in the zeolite channels or pores. Applications of particular
experiments to other molecular sieves, such as aluminum phosphates (or AlPO4s), are mentioned
only briefly. The applications of NMR to study catalytic processes or of solution NMR methods
Copyright © 2003 Marcel Dekker, Inc.
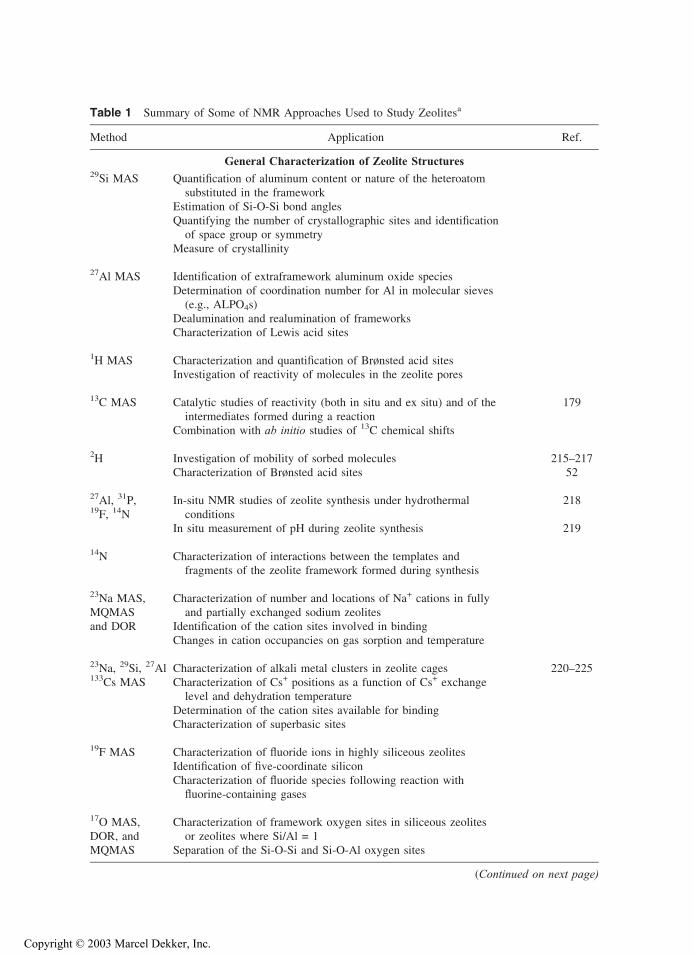
Table 1 Summary of Some of NMR Approaches Used to Study Zeolitesa
Method Application Ref.
General Characterization of Zeolite Structures29Si MAS Quantification of aluminum content or nature of the heteroatom
substituted in the frameworkEstimation of Si-O-Si bond anglesQuantifying the number of crystallographic sites and identificationof space group or symmetry
Measure of crystallinity
27Al MAS Identification of extraframework aluminum oxide speciesDetermination of coordination number for Al in molecular sieves(e.g., ALPO4s)
Dealumination and realumination of frameworksCharacterization of Lewis acid sites
1H MAS Characterization and quantification of Brønsted acid sitesInvestigation of reactivity of molecules in the zeolite pores
13C MAS Catalytic studies of reactivity (both in situ and ex situ) and of theintermediates formed during a reaction
179
Combination with ab initio studies of 13C chemical shifts
2H Investigation of mobility of sorbed molecules 215–217Characterization of Brønsted acid sites 52
27Al, 31P,19F, 14N
In-situ NMR studies of zeolite synthesis under hydrothermalconditions
218
In situ measurement of pH during zeolite synthesis 219
14N Characterization of interactions between the templates andfragments of the zeolite framework formed during synthesis
23Na MAS,MQMASand DOR
Characterization of number and locations of Na+ cations in fullyand partially exchanged sodium zeolites
Identification of the cation sites involved in bindingChanges in cation occupancies on gas sorption and temperature
23Na, 29Si, 27Al Characterization of alkali metal clusters in zeolite cages 220–225133Cs MAS Characterization of Cs+ positions as a function of Cs+ exchange
level and dehydration temperatureDetermination of the cation sites available for bindingCharacterization of superbasic sites
19F MAS Characterization of fluoride ions in highly siliceous zeolitesIdentification of five-coordinate siliconCharacterization of fluoride species following reaction withfluorine-containing gases
17O MAS,DOR, andMQMAS
Characterization of framework oxygen sites in siliceous zeolitesor zeolites where Si/Al = 1
Separation of the Si-O-Si and Si-O-Al oxygen sites
(Continued on next page)
Copyright © 2003 Marcel Dekker, Inc.

Table 1 Continued
Method Application Ref.
11B/10B,51V, 6Li/7Li,71Ga
Characterization of heteroatom substitution in zeolite frameworks
207Pb, 113Cd,(1H)
Characterization of extraframework cations and cation exchangereactions (Ag+, Cd2+, Pb2+, Ca2+)
94,226,227
129Xe Characterization of pore sizes and shapes, and cation distributions 228–230
Sorptionof O2
Identification of lithium, sodium, cesium, and proton sites availablefor gas binding (in combination with 6Li, 7Li, 23Na, 133Cs, or 1H NMR)
121,126
Double-Resonance and Two-Dimensional Correlation Experiments27Al/31P Assignments of resonances due to framework sites in AlPO4’s and
investigation of their connectivity to different Al/P sites(from SEDOR, TRAPDOR and REAPDOR experiments)
Identification of Lewis and Brønsted acid sites in zeolites, byusing phosphorus-containing probe molecules (TRAPDOR)
Investigation of coordination number of Lewis acid sites (INEPT)
1H/27Al Indirect detection of Brønsted acid sitesAssignment of 1H resonancesCharacterization of extraframework sites (TRAPDOR and REAPDOR)Measurement of H-Al distances (SEDOR)
27Al/15N and27Al/14N
Identification and quantification of Brønsted and Lewis acid sites(REDOR and TRAPDOR)
Measurement of Al-N distances to characterize binding of basic probemolecules (REDOR)
23Na/29Si Characterization of the location of Na+ cations (REAPDOR)
29Si Connectivity of different framework sites, by using (COSY andINADEQUATE two-dimensional experiments)
1H/29Si Location of molecules in the channels of highly siliceous zeolites (CP) 231,232Characterization of template/zeolite precursor interactions during the
synthesis of siliceous ZSM-5 (CP)
13C/27Al Characterization of probe molecule/zeolite interactions (TRAPDOR,REDOR, and REAPDOR)
233
1H/13C Binding of (deuterated) carbon-containing template molecules toprotonated defect sites (REDOR, CP)
aThe pulse sequences used in the experiments are given, where relevant, in parentheses. References are provided for
topics that will not be covered in Secs. II–IV or will only be discussed very briefly.
Copyright © 2003 Marcel Dekker, Inc.
to follow the zeolite nucleation and growth reactions that occur during zeolite synthesis are
largely outside the scope of this chapter. For completeness, however, some examples in this area
are documented in Table 1 and some of the challenges are discussed in Sec. III.
This chapter will be presented as follows: We first present a summary of some recent uses
of zeolites in the form of a table. Many of these applications are then outlined in Sec. II. A more
detailed but by no means comprehensive description of the NMR experiments, along with some
specific examples of variants of particular sequences that have been applied to zeolites, is
provided in the theory section presented at the end of the chapter (Sec. IV). The aim of Sec. IV is
to provide the reader with a brief background to some of the principles behind the experiments
and an explanation of some of the terms routinely used in NMR. This section attempts to address
the large disconnect between the detailed NMR papers that describe the theory behind the NMR
experiments and the more qualitative descriptions of these experiments, often provided in papers
written for the zeolite community. We assume that the reader is familiar with the basics of solid-
state NMR and terms such as magic angle spinning (MAS), and 90j (or k/2) pulses. The sectionon 1/2-integer spin quadrupolar nuclei is somewhat more detailed, since these nuclei are widely
found in zeolites; the acquisition of NMR spectra from these systems can sometimes be
nontrivial and, more importantly, can often be misleading. Thus, we have attempted to outline
some of the pitfalls and solutions to some of the problems. The sections are written, insofar as is
possible, so that Secs. II and III are still approachable for a reader who is less interested in the
underlying NMR theory.
II. APPLICATIONS OF NMR SPECTROSCOPY TO STUDYZEOLITE STRUCTURE
A. 29Si MAS NMR Studies
1. Aluminum Substitution and Framework Structure
In as early as 1980, Lippmaa, Engelhardt, and coworkers showed that the 29Si MAS NMR of
aluminum-containing zeolites contain well-resolved 29Si resonances whose shift depend on the
number of aluminum atoms in the silicon local coordination sphere Si(OSi)4�x(OAl)x (3,4). The
introduction of each aluminum atom into the silicon coordination sphere results in a shift of
approximately 5–6 ppm from the typical chemical shift position of a Si(OSi)4 local environ-
ment at approximately �102 to �110 ppm. Typically, up to five resonances can be observed
corresponding to x = 0, 1, 2, 3, and 4 (Fig. 1). The intensity of the resonances can be used to
quantify the concentration of each local environment and then determine the amount of
aluminum substituted into the framework, and thus the Si/Al ratio (5–7). Since the substitution
of aluminum in zeolite frameworks is not random and ‘‘Loewenstein’s rule’’ is generally
observed (i.e., no Al-O-Al linkages are formed in the framework), this needs to be taken into
account when calculating the Si/Al ratio:
Si=Al ¼X4x¼0
ISiðOAlÞx=X4x¼0
0:25� ISiðOAlÞx ð1Þ
The total silicon concentration is proportional to the total intensity of all five potential
resonances in the 29Si spectrum (i.e., S4
x=0ISi(OAl)x, where Si(OAl)x represents the local environ-
ment Si(OSi)4�x(OAl)x). The total aluminum content is proportional to the weighted sum of the
intensities of all the resonances due the environments Si(OSi)4�x(OAl)x, where the intensity of
each resonance is weighted by the number of aluminum atoms in the local environment. The
Copyright © 2003 Marcel Dekker, Inc.

sum must then be divided by 4 to account for the fact that each silicon atom is connected to four
other silicon or aluminum atoms. The aluminum framework content determined by this method
is more accurate than that determined by analytical (ICP) methods for the whole sample, since
the latter method cannot distinguish between framework and extraframework aluminum. The
presence of extraframework aluminum species can be confirmed by 27Al NMR (see Sec. II.B).
Note also that the isoelectronic Si4+ and Al3+ ions cannot be distinguished by X-ray diffraction.The silicon shift has been correlated with the mean Si-O-Si bond angle, u (8–11), the
bond angle controlling the s/p character of the oxygen orbitals used to bind to the two adjacent
silicon atoms (12). This observation can be used to assign the different resonances if the
structure is known or, conversely, provide structural information for an unknown structural
type. A series of correlations have been developed by plotting the shift, y, vs. u, sin(u/2), andcos u/(cos u�1), all these approaches providing reasonable correlations, primarily because all
of these angular functions are close to being linear over the angular ranges typically exhibited
by the materials that have been investigated. Ramdas and Klinowski proposed a general
relationship (13):
d=ppm ¼ 143:03þ 7:95n� 20:34vdTT ð2Þwhere n is the number of aluminum atoms in the silicon local coordination sphere and vdTT is
the sum of the four average Si-T distances (T indicates a tetrahedrally coordinated atom such as
Fig. 1 The 29Si MAS NMR experimental and simulated spectra of zeolites NaX and NaY showing the
five different resonances from the local environments Si(OSi)4-x(OAl)x, x = 0–4. Values of x are marked
above the resonances. (Reproduced from Ref. 214.)
Copyright © 2003 Marcel Dekker, Inc.

Si or Al) around the central Si atom, assuming Si-O and Al-O bond lengths of 1.62 and 1.75 A,
respectively, and is defined as:
vdTT=A ¼ ½3:37nþ 3:24ð4� nÞ�sinðu=2Þ ð3Þ
The effect of aluminum substitution on the shift is included in the expression via the
‘‘7.95n’’ term.
The use of ab initio calculations to calculate chemical shifts directly from the crystallo-
graphic structure is starting to become more routine (14–17). The level of accuracy that can be
obtained by these methods is steadily increasing, in part due to increased computer power and
the consequent ability to study larger zeolite fragments or unit cells and to use higher level
basis sets to describe the atomic orbitals. It is extremely likely that this approach will become
more widely used to help assign resonances and to optimize, or to provide a check on, the bond
angles obtained from diffraction experiments (14).
2. Dealumination Studies
Silicon NMR can be used to monitor dealumination, since changes in the Si/Al ratio can be
detected (18) along with the formation of defects in the form of silanols (2). Silanols can be
formed via reactions involving the destruction of the framework of the form:
Si-OðHÞ-Alþ H2O ! Si-OH þ HO-Al
which can occur during dehydration or steaming. Substitution of one -O-Si linkage by an -OH
group (converting a so-called Q4 group to a Q3 group) results in a shift of the 29Si resonance by
approximately +10 ppm. Thus, resonances with local environments Si(OAl)x(OSi)4�x and
Si(OH)(OAl)y(OSi)3�y where x = y + 1 [i.e., Si(OAl)(OSi)3 and Si(OH)(OSi)3, when y = 0]
often overlap; this can lead to errors in the determination of the Si/Al ratio. The 1H/29Si cross-
polarization (CP) double-resonance experiment can be used to select for 29Si nuclei that are
nearby protons, particularly if short contact times are used (Fig. 2). Although this experiment is
not quantitative unless a series of calibration experiments are performed, CP can be used to
Fig. 2 The 1H to 29Si cross-polarization NMR experiment used to select for silicon atoms that are
nearby protons. The distance over which the 1H magnetization is transferred may be controlled by varying
the contact time (c.t.). Shorter values of the c.t. are used to select for protons nearby silicon. 1H decoupling
may be applied, if required, during the acquisition of the 29Si free induction decay (FID).
Copyright © 2003 Marcel Dekker, Inc.
identify the silanol defect species and to determine whether they are present in large
concentrations and, thus, need to be taken into account when determining the Si/Al ratio.
For example, two Si(OH)(OSi)3�y(OAl)y, y = 0 and 1, groups were observed with 1H/29Si CP in
a mildly dealuminated faujasite. The presence of an aluminum atom in the silicon local
coordination sphere for the x = 1 group was confirmed with a 29Si/27Al double-resonance NMR
experiment (19).
3. Highly Siliceous Zeolites
Fyfe and coworkers showed that the resolution observed in the 29Si spectra of zeolites could be
dramatically improved by studying extremely crystalline samples of highly siliceous zeolites
(1). The materials were synthesized directly, obtained chemically via treatment of samples with
SiCl4 and water vapor, or subjected to hydrothermal treatment. The broadening due to
aluminum is associated with the local disorder in the lattice (i.e., small variations in bond
angles and bond lengths) caused by framework substitution and interactions with the extra-
framework cations or protons. Perhaps some of the most classic applications of this approach
can be found in the 29Si MAS NMR of MFI and related zeolites. Analysis of the 29Si of highly
siliceous ZSM-5 (Sil-ZSM-5) showed that there were 25 independent, crystallographically
distinct silicon atoms (or T atoms) in the unit cell (20,21); the result confirmed that this material
adopts a monoclinic space group. 29Si could then be used to follow the monoclinic to
orthorhombic phase transition that occurred on sorption of some organics such as paraxylene
(22). The approach has been used to study the phase transitions that occur with other gases such
as pyridine and on heating of the sample (21).
Fyfe et al. used two-dimensional COSY and INADEQUATE experiments to probe longer
range structure (1,23–28). Both of these NMR experiments exploit the J coupling between the
silicon nuclei of the zeolite framework and thus can be used to study the connectivities between
different framework sites. Initial experiments were performed on 29Si-enriched samples of
ZSM-39 by using a 1H! 29Si CP experiment to enhance the signal of the silicon atoms 1H spin
lattice relaxation times (T1’s) are 3s in comparison to the 29Si T1’s of 650s (29). Once the size
of the J couplings had been established, experiments on nonenriched samples became feasible
(24). These experiments have been reviewed in detail in Ref. 1.
Koller et al. have investigated the effect of synthesizing high-silica zeolites (beta, SSX-23,ITQ-3, ZSM-12, silicalite) in the presence of fluoride ions as mineralizing agents (30). The
fluoride ions serve to charge balance the templating agents (protonated amines) and prevent
theformation of significant concentrations of defects. The ions are actually incorporated into theframework, to form SiO4F
- units. The 29Si shift for this five-coordinated environment for silicon
was found to lie between �140 and �150 ppm. 19F MAS NMR studies showed that the fluorideions were mobile at ambient temperatures in some of the systems studied. For example, in
silicalite, the sample had to be cooled to 140 K before the fluoride ion motion was frozen out, on
the 19F chemical shift time scale. The 29Si NMR spectra for the mobile systems contain much
broader resonances with shifts between �120 and �150 ppm. This is consistent with rapid
exchange between four- and five-coordinate silicon, caused by the fluoride ion motion.
Highly siliceous zeolites synthesized in the absence of fluorine contain defects in the
framework to charge compensate for the cations used as templating agents. These defects take
the form of Si-O� groups (i.e., nonprotonated silanol groups). The interactions between these
groups and the templating agents have been studied in detailed by Shantz and Lobo, by using1H/2H CP and heteronuclear correlation (HETCOR) NMR experiments (31–33). The formation
of the defect can involve the loss of a silicon atom from the framework, with the loss of a
central silicon atom in the Si(-O-Si)4 local environment resulting in four Si-O- species. The
Copyright © 2003 Marcel Dekker, Inc.

Si-O- oxide ions are basic and may be readily protonated forming a hydroxyl nest comprising,
in theory, up to four framework SiOH groups:
ðSi-Ofram�Þ4Siþ 4H2O ! 4 ðSi-Ofram�Þ3Si-OH þ SiðOHÞ4Double-quantum and triple-quantum two-dimensional 1H MAS NMR spectroscopies
were used to show that the defect formed in Sil-ZSM-12 synthesized with deuterated
benzyltrimethylammonium cations consists of a charge compensating Si-O- group, hydrogen
bonded to three Si-OH groups in the defect or hydroxyl nest (34). Average distances between
the protons of 3.1 (F0.1A) were obtained, assuming that the protons are rigid at room
temperature. The Si-O- group is strongly hydrogen bonded to the nearby Si-OH groups,
resulting in a very large 1H shift for the silanols of 10.2 ppm (34). A 1H to 2H HETCOR
experiment was used to show that the proton(s) in this defect site are located close to the
structure-directing agents (SDAs). For example, Fig. 3 shows a 1H to 2H HETCOR experiment
for nonasil synthesized in the presence of the partially deuterated SDA N,N,N-trimethylcyclo-
pentylammonium-d9 hydroxide. A cross-peak is observed between the protons of the silanol
defect (10.2 ppm) and the deuterated methyl groups of the SDA, indicating that the methyl
groups are in proximity to the defect.
4. 29Si NMR Studies of Heteroatom Substitutions in Frameworks Other Than Al29Si NMR has now been shown to be sensitive to the substitution of a range of other
heteroatoms or T atoms into the framework, and can often be used to prove that these ions
have been substituted. This is sometimes difficult to show conclusively by diffraction methods.
Even the observation of a short Si-M distance in an extended X-ray absorption fine structure
(EXAFS) experiment, where M is the heteroatom, does not definitely prove that the heteroatom
is incorporated into the framework: short Si-M distances can often be observed between
framework and extraframework cations.
Examples where the 29Si chemical shift is significantly shifted by substitution of T atoms
into the Si local coordination sphere include T = Li in lithosilicates (35,36), T = Ga in
gallosilicates (37), and T = Zn in zincosilicates (38,39). The effect of cation substitution on the29Si MAS NMR spectra has been studied in detail by Weller et al. for Ge, Ga, Al, and Be
substitution of a series of sodalites (40). Shifts of 3.2 ppm from Si(OAl)4 to Si(OGa)4 for the
same T-O-T angle were observed (i.e., O-Ga for O-Si substitution results in a shift of about 6
ppm), while even larger shifts were observed for Be substitution, e.g., the 29Si resonance for the
Si(OBe)4 local environment in beryllium silicon sodalites lie between �67.8 and �74 ppm
depending on the nature of the cation and anions in the sodalite cages. These authors also
established correlations between 27Al, 71Ga shifts and the T-O-TV bond angles. A similar 29Si
shift of 6.7 ppm for gallium substitution for Si in six different topologies (ABW, SOD, FAU,
LTL, MAZ, and CGS) was determined by Cho et al. (37).
Unfortunately, there are a series of heteroatoms whose substitution does not appear to be
associated with a very large shift (i.e., the changes in 29Si chemical shift are smaller than or
comparable to the distributions of chemical shifts for the different crystallographic sites found
in the purely siliceous materials). Examples of systems that fall into this category include
vanadium-, boron-, and titanium-substituted zeolites (41–44). Fortunately, many of these
heteroatoms are NMR active, providing an alternative approach for probing their local
environments in the framework (see II.C).
B. 27Al Studies of Framework and Extraframework Sites
27Al MAS NMR spectroscopy has been widely used to study aluminum substitution in zeolites
(45). 27Al is a spin-5/2 quadrupolar nucleus with a moderately large quadrupole moment. This
Copyright © 2003 Marcel Dekker, Inc.

has important implications, particularly for characterizing the dehydrated, acidic forms of many
zeolites, which tend to contain highly distorted aluminum local environments. Distorted local
environments are typically associated with large electric field gradients (EFGs), and thus large
quadrupole coupling constants (QCCs). This has two important implications of which the reader
must be aware: (a) Not all 27Al signals may be detected, particularly if ‘‘standard,’’ one-pulse
NMR methods are used at lower fields. (b) The isotropic shift of the resonance is a sum of the
chemical shift and the quadrupole-induced shift. For environments with large QCCs, and at low
magnetic fields strengths, the latter contribution may be large and must be estimated (e.g., by
running the spectra at different field strengths or by measuring the QCC) before an accurate
value of the chemical shift can be extracted. The implications, potential pitfalls, and solutions are
discussed in considerable detail in the theory section.
Fig. 3 (a) The 1H MAS NMR spectrum and (b) two-dimensional 1H to 2H HETCOR NMR spectrum of
nonasil synthesized by using N,N,N-trimethylcyclopentylammonium-d9 hydroxide as the SDA. A cross-
polarization sequence, with a contact time of 300 As, was used to transfer 1H magnetization to the 2H spins
(which were then detected) in the HETCOR experiment. (Adapted from Ref. 54.)
Copyright © 2003 Marcel Dekker, Inc.

27Al spectra show distinct chemical shift ranges for tetrahedral, pentacoordinate, and
octahedral environments, and so can be used to distinguish between aluminum framework and
extraframework species. Aluminum tetrahedral framework atoms typically resonate at 60–50
ppm, and can be clearly distinguished from five- and six-coordinate extraframework species at
approximately 25 and 13 to �17 ppm, respectively (45). The highly symmetrical four-
coordinate AlO45- anion that is sometimes formed in the sodalite cages of X and Y zeolites
following mild dealumination or calcination resonates at a higher frequency of 70–90 ppm and
can, therefore, be easily resolved (Fig. 4) (46,47).
The quadrupole coupling constants for the hydrated, cation-exchanged forms of zeolites
are typically moderately small (0.6–2 MHz) (45), and spectra are readily acquired from these
materials. The QCCs increase noticeably on dehydration, as the water molecules that hydrogen
bond to the framework and bind to the cations are removed. Broad resonances are observed
with shoulders (or tails) to lower frequencies (Fig. 4a). These lineshapes are characteristic of a
distribution of QCCs, due to the range of local environments that occur in these materials. In
general, the QCC of a zeolite increases as the charge on the extraframework cation increases,
which is presumably a consequence of the lower numbers of cations coordinated to the nearby
oxygen atoms and the higher charge on the cations. Two-dimensional multiple-quantum MAS
(MQMAS) methods (48,49) have now been applied to the study of zeolites and aluminophos-
phates (AlPO4’s), with the method allowing the different crystallographic sites for aluminum in
many AlPO4’s to be resolved (50,51).
The dehydrated proton forms are associated with very large QCCs of more than 13–16
MHz (52). To a first approximation, this is a consequence of the large differences in charge
between the one protonated oxygen and the three other nonprotonated oxygen atoms
Fig. 4 (a) The 27Al MAS NMR spectrum of dehydrated Zn2+-exchanged NaY, collected at a fieldstrength of 8.4 MHz, showing the resonance due to the extraframework AlO4
5� species, and the
broadening of the resonance due to the tetrahedrally coordinated framework aluminum atoms. (Spinning
speed = 10 kHz; asterisks denote spinning sidebands). (b) The location of the AlO45� species and cations
obtained from X-ray diffraction. (Adapted from work published in Ref. 68.)
Copyright © 2003 Marcel Dekker, Inc.

coordinated to the central aluminum atom in this Al(-O-Si)3(-O(H)-Si) local environment (53).
These local environments are difficult to observe by one-pulse MAS methods, since the
broadening caused by the second-order quadrupolar interaction is larger than the spinning
speed, and broad featureless resonances are observed, which are difficult to distinguish from the
baseline. These aluminum spins are often termed ‘‘invisible,’’ but they can be observed in a
‘‘wideline’’ spectrum by using a spin echo. Ernst et al. were able to detect the 27Al central
transition of various dehydrated H zeolites under nonspinning conditions and to extract a value
of, for example, 16 MHz for the QCC for dehydrated H-ZSM-5 (52).
An alternative approach to detect the invisible spins is to use the TRAPDOR (TRAnsfer
of Populations in DOuble Resonance) NMR method (54,55). The experiment has been used to
determine the 27Al quadrupole coupling constants of different ‘‘invisible’’ aluminum environ-
ments in steamed and unsteamed zeolites, and to characterize the aluminum Lewis and
Brønsted acid sites (55–57). These environments have now been directly observed in MQMAS
methods, by using a combination of very high field strengths and very large spinning speeds.
The Al-O(H)-Si resonance, more importantly, could be separated from extraframework
environments that are either partially rehydrated or coordinated to extraframework cations,
such as Na+, which remain due to incomplete ion-exchange processes (58).27Al has been used extensively to study the extraframework aluminum species formed
during synthesis, ion exchange, calcination, or following chemical modification (2). Interest in
this area stems in part from the Lewis acidity is associated with these species, and the possible
interaction between the extraframework aluminum oxide/hydroxide clusters and the remaining
Brønsted acid sites. Care is required before the concentration of these species can be
determined from the 27Al MAS NMR spectra (see Sec. IV), even when the samples are fully
hydrated. Four-, five-, and six-coordinate extraframework species may be present, giving rise to
overlapping resonances in the one-pulse 27Al MAS spectra. Nonetheless, these spectra typically
show very characteristic features and peaks that have been assigned to five- and six-fold
coordinated species, allowing different local environments to be identified. High-field 27Al
MQMAS NMR experiments have recently been used to separate the resonances due to two
four-coordinate aluminum species in ultrastable Y (US-Y) (59). MQMAS studies of steamed
and acid-washed faujasite zeolites, performed at moderate field strengths (9.4 T) have
suggested that the 27Al resonance at approximately 32 ppm, which is often assigned to five-coordinated Al, is due to a distorted four-coordinated site (60). Fields corresponding to 1H
frequencies of 600 and 800 MHz were used in the former study (59), and it is clear that the use
of steadily higher fields in this research area will make such experiments increasingly more
routine and yield fewer ambiguous results. Furthermore, simple one-pulse experiments will also
yield spectra with higher resolution at these high fields, and the concentrations of the differentspecies will become more straightforward to extract.
C. Heteronuclear NMR Studies of Heteroatom Substitutionin Frameworks
The nuclei that have been most extensively studied include boron (10B and 11B), gallium (71Ga),
and vanadium (51V) (61,62). 49Ti has been used to study a number of titanates (63,64), but the
(I = 5/2) nucleus has a large quadrupole moment, which results in extremely broad resonances
for distorted local environments. The Ti site in zeolites is typically invisible, but extremely high
field strengths may make these experiments more feasible.
1. Boron
Although boron substitution does not appear to result in a significant shift in the 29Si resonance,
following substitution in the framework, both 11B and 10B are amenable to NMR studies
Copyright © 2003 Marcel Dekker, Inc.

(61,62,65–69). The as-synthesized zeolites contain four-coordinate BO45- groups. These groups
show a characteristic sharp 11B resonance due to the relatively symmetrical environment for
boron. Calcination to remove the templating agent and dry these materials appears to result in
the formation of trigonal boron groups (BO33-) via reactions of the form:
Si-OðHÞ-BðOSiÞ3 ! Si-OHþ BðOSiÞ3This reaction is accompanied by the growth of a broader 11B resonance, shifted to higher
frequencies, with a characteristic second-order quadrupolar lineshape due to the more distorted
trigonal environment. The boron is readily removed from the framework.
2. Gallium71Ga has been used to study gallium substitution in zeolites and gallophosphate molecular
sieves, and resonances due to tetrahedrally coordinated gallium (with similar lineshapes to
those seen for aluminum framework sites in 27Al spectra) have been observed (70,71). In the
case of a gallosilicate with the NAT topology, a lineshape dominated by the second-order
quadrupolar interaction was seen. This was ascribed to an unusual degree of local order due to a
nonrandom distribution of Si and Ga in the framework (37).
3. Lithium
Both 6Li and 7Li have been used to investigate lithium substitution in lithosilicates (36);
although the 6Li (I = 1) nucleus has a lower natural abundance, higher resolution spectra can be
obtained with 6Li in comparison with 7Li. The application of this method is hampered by the
very small chemical shift range of lithium, and sometimes by the rapid exchange of the lithium
between the different framework and extraframework sites. However, recent studies have
shown, that the resolution is significantly improved if the 6Li spectra are acquired at higher
fields, allowing framework and extraframework sites to be distinguished (72).
4. Vanadium
Vanadium substitution in zeolites has been studied by using the I = 5/2 51V isotope. Although a
quadrupolar nucleus, 51V has a very small quadrupole moment; thus, only small or negligible
broadening of the central transition is observed. The second-order quadrupolar-induced
contribution to the shift may be found by extracting the 51V isotropic resonance as a function
of the field strength. Vanadium environments are typically extremely distorted and, hence, the51V NMR resonances typically show large chemical shift anisotropies (CSAs). The relation-
ships between 51V chemical shifts, CSAs, and local coordination environments have been
studied in some detail, in part due to the role that many vanadates play in catalysis (73).
Although correlations have been established, the shifts for four-, five-, and six-coordinate
vanadium environments do not show well-separated chemical shift ranges.
A detailed electron spin resonance (ESR) and NMR study of V-substituted ZSM-12 has
been reported (41). A 51V resonance (at �610 ppm) could only be detected in the calcined
sample, with a quadrupole coupling constant that is consistent with a distorted coordination
environment such as 3(Si-O-)V=0, where the vanadium atom is coordinated to three framework
oxygen atoms. Silanol groups were observed by 29Si NMR, consistent with the presence of this
vanadium species. No signal was observed for the as-synthesized materials. ESR of the as-
synthesized samples revealed the presence of a vanadium environment due to the paramagnetic
V(IV) species VO2+. A second V(IV) tetrahedral species was also postulated to be present,
which could not be detected by either ESR or NMR. 51V NMR studies of a wider range of
Copyright © 2003 Marcel Dekker, Inc.
zeolites have suggested that other species may be present, which depend on the synthesis
method and the level of hydration of the zeolites (74,75).
D. 17O MAS NMR Studies of Oxygen Framework Sites
The I = 5/2 quadrupolar 17O nucleus may be used to probe the local environment of oxygen in a
zeolite framework. This nucleus is extremely sensitive to its local coordination environment
(with a chemical shift range of >1000 ppm), large chemical shift differences being observed as a
function of the Si-O-Al environment, and between Si-O-Si and Si-O-Al environments (76–78).
Enriched samples are generally required, a factor that has limited the number of studies in this
field to date. A number of studies have shown that 17O can be readily introduced into the
framework by heating the zeolites at 500–750jC in 17O2 gas. For example, Sil (siliceous)-FER
was exchanged by heating the sample for 18 h at 750jC in 17O2 (14). Lower temperatures may
be used for aluminum-containing zeolites (79). An alternative approach involves steaming the
zeolites in H217O at approximately 250jC (77). Stebbins et al. have studied the kinetics of
oxygen exchange with H217O between 157jC and 197jC for the natural zeolite stilbite and have
shown that the Si-O-Al oxygen atoms are exchanged more rapidly (80). For example,
approximately 30% of the Si-O-Si and 60% of Si-O-Al sites were exchanged, following
reaction in H217O at 197jC for 80 h. However, both approaches appear to lead to some
exchange of all the oxygen sites, provided the exchange is performed for sufficiently long time.
The preferred method will depend on the stability of the particular zeolite under investigation
under steaming vs. high-temperature conditions.
The 17O nucleus has a large quadrupole moment, and the one-pulse spectra of this
nucleus are typically very broad, consisting of a large number of overlapping resonances.
This is a particular problem for aluminum-containing zeolites that do not contain strictly
alternating Si and Al atoms (i.e., when both Si-O-Al and Si-O-Si oxygen atoms are present).
Double rotation (DOR) (81,82), dynamic angle spinning (DAS) (83), and MQMAS have been
used to obtain high-resolution 17O spectra for zeolites with Si/Al ratios of one, in which the
individual resonances due to the different crystallographic sites may often be resolved
(76,77). The purely siliceous materials also yield high-resolution spectra because only Si-
O-Si linkages are present.
One challenge in this field lies in correctly assigning the observed signals to the differentcrystallographic sites. The 17O QCCs of the Si-O-Si and Si-O-Al groups are very different andstrongly depend on the nature of the nearest-neighbor (Si or Al) atoms (76). Smaller QCCs (of
approximately 3.2–3.6 MHz for the sodium-exchanged zeolites) are generally seen for Si-O-Al
groups (76,77), whereas larger QCCs of more than 5 MHz are seen for Si-O-Si groups (14,78).
There is a weak correlation between the QCC and the Si-O-Si bond angles in the siliceous
materials, with the QCC increasing from approximately 5.1 MHz to 5.6 MHz as the angle
increases from 137j to 167j. However, QCCs of 5.6 and 5.4 MHz were obtained for sites in
ferrierite and faujasite with Si-O-Si bond angles of 165j and 167j, respectively (14). The
results indicate that the correlation is not strong enough to allow the resonances to be assigned
based solely on the bond angle. These results are consistent with Hartree-Fock (HF) ab initio
calculations for a series of zeolite topologies (ABW, CAN, CHA, EDI, and NAT) (84).
A correlation between the chemical shift and the Si-O-Al bond angle has been proposed
based on results obtained for NaA and Na-LSX (77). Use of a similar correlation by Bull et al.
for Sil-FER did not lead to the correct assignment of the resonances, and no simple correlation
between the shift and any geometrical parameter (bond angles and bond lengths) could be
established (14). The correlation similarly does not hold for Sil-Y and a number of other
Copyright © 2003 Marcel Dekker, Inc.
silicates. Ab initio calculations of the chemical shifts with both HF and density functional
theory (DFT) methods for Sil-FER showed that the calculations were only accurate to
approximately 2 ppm (14). A major source of error was shown to arise not from the level of
calculation but from the structural model used for the calculation, with small changes in bond
angles between different models of only 1.2j leading to changes in the chemical shifts of as
much as 3.6 ppm. Better fits between the calculated and experimental shifts of Sil-FER were
obtained for 29Si; the larger vibrations of the oxygen atoms were thought to be one source of the
larger error for 17O. Nonetheless, the accuracy of the calculated 17O shifts and QCCs for the 10
crystallographic sites were sufficient to assign the spectrum partially. The authors suggested
that a comparison between calculated and experimental chemical shifts (17O and 29Si) could
lead to a method for more accurate structure determination, particularly when the approach is
incorporated into a structure refinement based on diffraction data.
The shifts also vary significantly as a function of the hydration level and the nature of anynearby extraframework cations. This further complicates the assignments of the spectra but
should lead to more detailed chemical information, providing that factors controlling the shifts
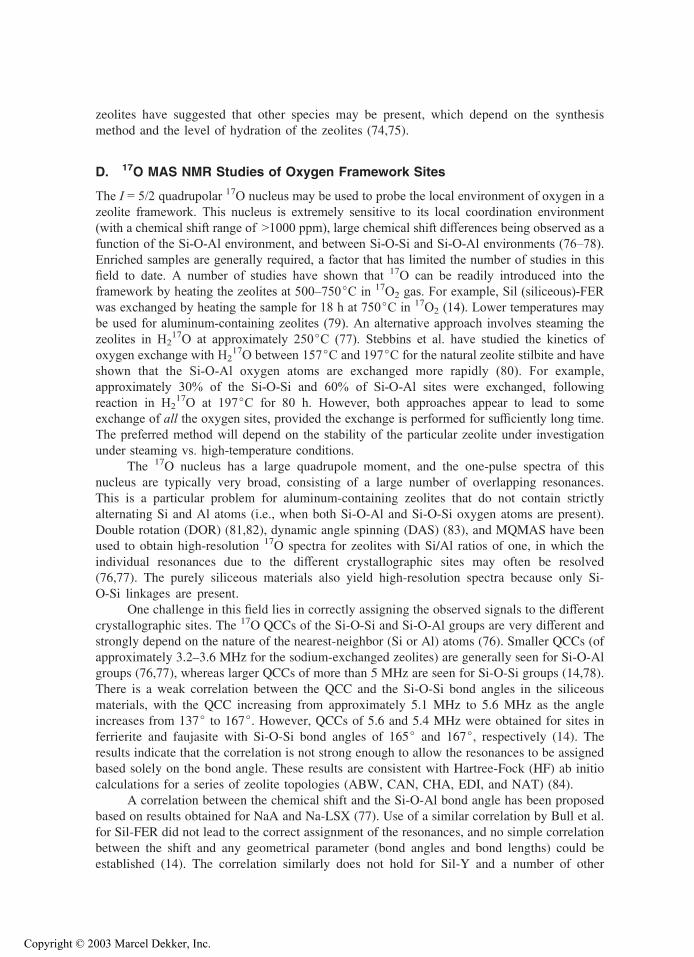
and the QCCs are correctly unraveled. The MQMAS spectra of hydrated and dehydrated CaA
(Si/Al = 1) are shown in Fig. 5. Unlike NaA, the calcium-exchanged forms of A contain ‘‘bare’’
oxygen atoms that are not coordinated to a cation [the O(1) sites in CaA]. These sites will be
hydrogen bonded to water in the hydrated zeolite, providing one explanation for the large shift
of the resonance at 45 ppm in the isotropic dimension of the MQMAS spectrum, to 75 ppm on
dehydration (79). 17O/23Na double-resonance (TRAPDOR) NMR experiments for partially
exchanged Ca(Na)A zeolites, which still contain significant numbers of residual sodium cations
(i.e., with compositions such as Ca4Na4A), confirmed that the sodium cations are not directly
bound to this oxygen site, consistent with the assignments (79). Similar behavior was found for
the Sr2+-exchanged form of NaA.
E. Use of Double-Resonance Experiments to Measure Connectivityand Internuclear Distances
1. Applications to Framework Structures
Many of these double-resonance experiments exploit the heteronuclear dipolar couplings
between sets of spins, whose magnitudes are proportional to the inverse third power of the
internuclear distance (see Sec. IV) and are therefore extremely sensitive to the distance between
the coupled spins. These methods have been used (a) as a tool to assign the resonances due to
different local environments and (b) to determine the connectivities between different sites in thestructure. For example, spin-echo double resonance (SEDOR) has been used to determine the27Al-31P distances in aluminophosphate molecular sieves (85). The high-resolution (MAS)
methods termed rotational echo double resonance (REDOR) (86) and transferred echo double
resonance TEDOR (87) have been applied to probe Al/Si connectivities in zeolites (88). Larger
dipolar couplings were seen for silicon local environments containing larger numbers of
aluminum atoms in the neighboring tetrahedral site. Connectivities between the different frame-
work sites could then be inferred from the distance measurements extracted from these studies.
INEPT experiments, which directly probe bonding between the two atoms of interest (via the J
coupling), have been used to study 29Si/27 Al connectivities (89). Fyfe and coworkers used a
combination of methods (1H-29Si CP-INADEQUATE and 1H/19F/29Si triple-resonance CP,
REDOR, and TEDOR NMR) to study the siliceous zeolites tetrapropylammonium fluoridesilicalite-1 (90) and octadecasil (91). The location of the fluoride ion was determined by mea-
suring a series of F-Si distances between the fluoride ion and the different framework sites (90).
Copyright © 2003 Marcel Dekker, Inc.
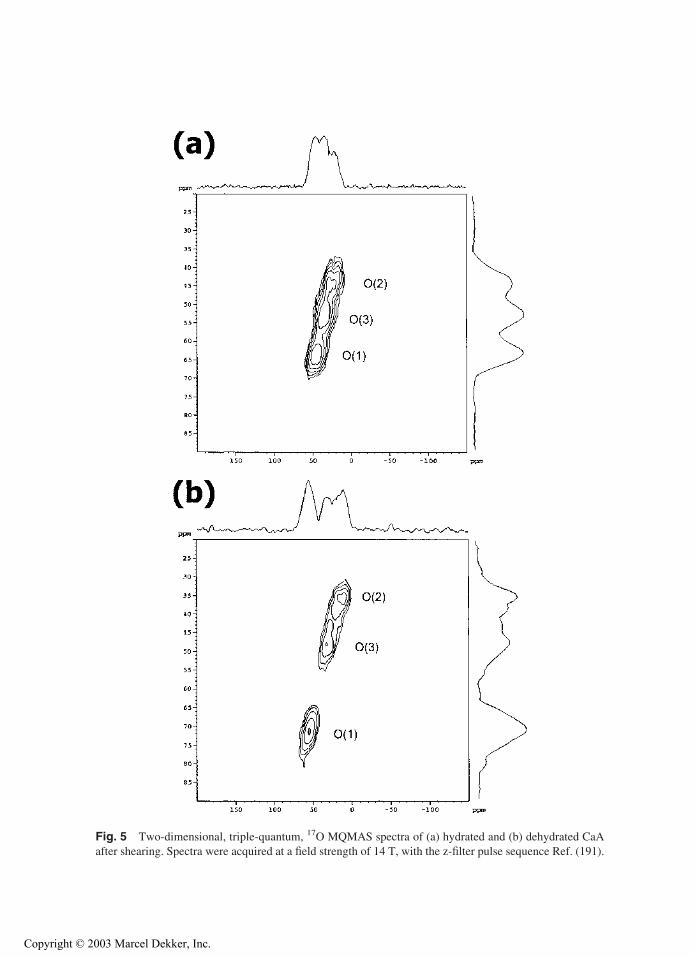
Fig. 5 Two-dimensional, triple-quantum, 17O MQMAS spectra of (a) hydrated and (b) dehydrated CaA
after shearing. Spectra were acquired at a field strength of 14 T, with the z-filter pulse sequence Ref. (191).
Copyright © 2003 Marcel Dekker, Inc.
Reimer and coworkers have made use of the SEDOR experiment to measure distances
between framework aluminum sites and extraframework cations. An Al-H bond length of 2.43
(F0.03) A between the Brønsted acid proton and the nearby framework aluminum atom was
measured with a 1H-27Al SEDOR experiment (92). 27Al-35Cu SEDOR NMR has been used to
show that the Cu+ cations in copper-exchanged ZSM-5 are located only 2.3 (F0.2) A from the
aluminum framework sites (93) and are thus associated with these sites. 27Al-207Pb SEDOR
NMR has also been used to study a series of lead-exchanged zeolites and the measured Pb-Al
distances were consistent with XRD studies (94). The 207Pb spectra were strongly affected by
hydration level, and the presence of both PbOH+ and Pb2+ cations (in equilibrium) was
proposed. The PbOH+ species is similar to that found in CaY that has not been completely
dehydrated (95). Rotational echo and adiabatic passage double resonance (REAPDOR) (96) has
been used to measure 29Si/23Na distances between framework atoms and extraframework Na+
cations in titanosilicates (97).
2. Applications to Gas Binding and Cluster Formation in the Zeolite Pores
These methods can be used, in principle, to determine how a molecule coordinates to the
framework of the zeolite by measuring a series of key internuclear distances. For example, Lobo
and coworkers have used 1H/27Al and 1H/29Si REDOR and 1H/29Si CP experiments to
investigate Al-ZSM-12 synthesized by using the selectively labeled deuterated benzyltrimethy-
lammonium cation as the SDA (32). A series of REDOR decay curves were obtained for
samples loaded with either SDA cations containing deuterated methyl groups or benzyl groups
or the fully deuterated SDA. The methylene protons were found to be preferentially located near
Si(OSi)3(OAl) silicon atoms, suggesting that the aluminum atoms themselves must be directly
associated with the SDAs. Ba et al. have used 29Si-27Al REAPDOR methods to investigate the
formation of silicon nanoclusters inside the pores of zeolite Y (98).
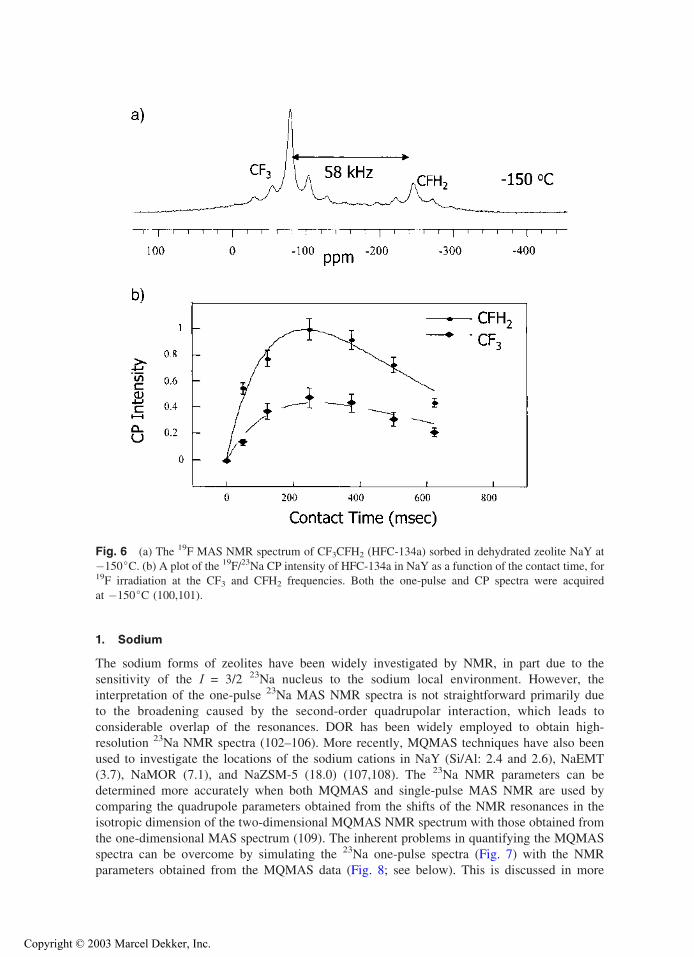
Even if accurate internuclear distances may not be readily obtained [due to residual
motion of the molecules, or multiple spin systems (99)], measurement of the relative distances
(or dipolar couplings) between sets of spins is often sufficient to distinguish among differentstructural models. 19F/23Na CP MAS NMR experiments have been used to study the binding of
the hydrofluorocarbon CF3CFH2 (HFC-134a) and CF3CF2H (HFC-125) and CF2HCFH2 (HFC-
143) to zeolite NaY. Individual CP buildup curves for the two end groups of the asymmetrical
molecules could been determined by exploiting the very large differences in 19F chemical shifts
for the two ends of the molecules (Fig. 6). These double-resonance experiments showed very
different binding for the different end groups and demonstrated that the hydrogen-containing
groups are bound more strongly to the zeolite framework in the order CF3 << CF2H < CFH2
(100,101).
F. NMR Studies of Extraframework Cations
The extraframework cations in zeolites can play an important role in determining the adsorption,
separation, and catalytic properties of zeolites. The distribution of the cations controls the
electric fields inside the pores of the zeolites, which can strongly influence absorptive behavior
and catalytic activity. Thus, characterization of the location and occupancies of the cation sites is
a prerequisite for understanding the physical properties of zeolites. NMR can play an important
complementary role to diffraction in this area, particularly for zeolites with more than one type of
cation (e.g., Na+ and Cs+), where it can sometimes be difficult to distinguish between the
different cations. NMR can be used to follow the cation-exchange procedure and identify cations
that are not removed during the ion-exchange reaction(s).
Copyright © 2003 Marcel Dekker, Inc.
1. Sodium
The sodium forms of zeolites have been widely investigated by NMR, in part due to the
sensitivity of the I = 3/2 23Na nucleus to the sodium local environment. However, the
interpretation of the one-pulse 23Na MAS NMR spectra is not straightforward primarily due
to the broadening caused by the second-order quadrupolar interaction, which leads to
considerable overlap of the resonances. DOR has been widely employed to obtain high-
resolution 23Na NMR spectra (102–106). More recently, MQMAS techniques have also been
used to investigate the locations of the sodium cations in NaY (Si/Al: 2.4 and 2.6), NaEMT
(3.7), NaMOR (7.1), and NaZSM-5 (18.0) (107,108). The 23Na NMR parameters can be
determined more accurately when both MQMAS and single-pulse MAS NMR are used by
comparing the quadrupole parameters obtained from the shifts of the NMR resonances in the
isotropic dimension of the two-dimensional MQMAS NMR spectrum with those obtained from
the one-dimensional MAS spectrum (109). The inherent problems in quantifying the MQMAS
spectra can be overcome by simulating the 23Na one-pulse spectra (Fig. 7) with the NMR
parameters obtained from the MQMAS data (Fig. 8; see below). This is discussed in more
Fig. 6 (a) The 19F MAS NMR spectrum of CF3CFH2 (HFC-134a) sorbed in dehydrated zeolite NaY at
�150jC. (b) A plot of the 19F/23Na CP intensity of HFC-134a in NaY as a function of the contact time, for19F irradiation at the CF3 and CFH2 frequencies. Both the one-pulse and CP spectra were acquired
at �150jC (100,101).
Copyright © 2003 Marcel Dekker, Inc.

Fig. 7 The isotropic resonances seen in the 23Na MAS NMR spectrum of dehydrated NaX acquired at a
spinning speed of 21 kHz. Simulations of the isotropic resonances were performed by using values for the
quadrupolar parameters and isotropic shifts for the different cation sites obtained from the MQMAS
spectrum (shown in Fig. 8; see Sec. IV for more details).
Fig. 8 2D 23Na triple-quantum MAS NMR spectrum of dehydrated NaX, after shearing. Projections on
the isotropic (F1) and anisotropic (F2) dimensions are shown. The asterisks mark the artifacts originating
from the collection of insufficient data points. A 23Na radio frequency field strength of 200 kHz and a
spinning speed of 21 kHz were used.
Copyright © 2003 Marcel Dekker, Inc.

detail in Sec. IV. However, the intensities extracted from the isotropic resonances may still
require correction to compensate for any intensity of the central resonance that is contained in
the spinning sidebands. The approach of Massiot et al. has been widely used for this, but
possibly the easiest approach is to simulate the spectra with one of the many available NMR
simulation programs. The corrections can be negligible for very fast spinning speeds
particularly at higher fields (110).Most studies have focused on the faujasite zeolites NaX and NaY. The typical cation
positions in faujasite zeolites such as NaX and Y have been determined by X-ray diffraction(XRD) and neutron diffraction (Fig. 9) (111–114). Sites I and IV are located in the hexagonal
prism and the sodalite cage, respectively, while the site II and III positions are in the supercage.
In dehydrated zeolite NaY, the sodium cations are mainly located on the site I, IV, and II
positions (111,112). Sodium cations are also found in several sites close to the site III position,
in dehydrated NaX. A QCC of 1.2 MHz was found for the SI cations in NaY and NaEMT, from
MQMAS experiments, which was much larger than expected for a cation located in the highly
symmetrical environment at the center of the hexagonal prism, as proposed based on XRD
experiments. These results suggest that the site I position is displaced from the center of the
hexagonal prism, resulting in the large QCC value (115). This has been observed by XRD for
Zn2+ substitution in the SI position (47).
Two types of IV sites, with slightly different local environments, were observed in an XRD
study of a single crystal of NaX (Si/Al: 1.18) (113). This can be rationalized as follows: A six-
membered ring in the faujasite structure is made up of, at most, three aluminum atoms per ring.
If the six-membered rings that contain zero or only one aluminum atom (which represent the
least probable arrangements in NaX zeolites) are ignored, then approximately 24 and 8 six-
membered rings per unit cell have three and two aluminum atoms per ring, respectively, for an
Si/Al ratio of 1.18 (Na88Si104Al88O384). Site IV sodium cations can be coordinated to both of
Fig. 9 The faujasite structure (adopted by zeolites Y and X), showing some of the typical
cation positions.
Copyright © 2003 Marcel Dekker, Inc.

these types of six-membered rings (113). Electric field gradient (EFG) calculations have shown
that the QCC for the site IV sodium cations coordinated to the six-membered rings containing
three aluminum atoms (5.0 MHz) is larger than that for the site IV cations coordinated to the
rings with only two aluminum atoms (3.6 MHz) (102). The 23Na DOR NMR spectrum of NaX
(Si/Al: 1.23) could be well reproduced by a computer simulation that used 23Na NMR
parameters for six different sodium cations [site I, II, and IIIV (two sites), and the two types
of site IV cations] (102). However, the DOR spectra are not always unambiguous due to overlap
between the isotropic resonances and the sidebands, which is difficult to avoid due to the
limitations in the maximal spinning speed of the outer DOR rotor (approximately 1 kHz). The
sodium cations at the site IV in zeolite NaY are not easy to detect by MQMAS NMR
spectroscopy due to their large QCCs. Nonetheless, experiments using higher radio frequency
(rf) field strengths (109) or by using the O-RIACT MQMAS pulse sequence (110) have
succeeded in observing these resonances. For example, Fig. 8 shows the MQMAS spectrum of
NaX. Two different SIII positions are seen, along with a weaker resonance for the SI’ cations. Aresonance due to the second IV environment was not detected in these studies. All of these
studies show distributions in QCCs and chemical shifts for the different sodium local
environments; this results in characteristic MQMAS lineshapes, in which the broadening due
to a distribution of QCCs and a distribution of shifts can be readily distinguished. The
environments are clearly sensitive to aluminum distributions in the framework and the nature of
the nearby cations. For example, the QCC of the major SII environment increases from 3.9
(F0.15) MHz in NaY to 4.9 (F0.15) MHz in NaX (109). Care is clearly required in interpreting
these spectra, as it cannot always be assumed that each cation site identified by crystallography
will necessarily correspond to a single 23Na resonance.
Having identified the NMR parameters for the different cation positions, the method can
be used to investigate gas binding. For example, 23Na MQMAS spectroscopy was used to follow
the effect of sorption of HFC 134 (CF2HCH2H) on the sodium cation positions (109). The
resonance due to the SI’ cations was no longer observed in the MQMAS spectrum, which was
somewhat surprising, given that these cations are not initially accessible for gas binding. The
results were, however, consistent with earlier diffraction and 23Na MAS NMR experiments on
the same system, which indicated long-range cation migration out of the sodalite cages and into
the supercages occurs, with the extra sodium cations occupying SIII-type sites (116). Variable-
temperature experiments indicate that the cation positions are not held rigidly to the framework,
with exchange between all the sites occurring at temperatures as low as 250jC (109).
2. Cesiumand Lithium
The cesium- and lithium-exchanged Y and X zeolites have also been extensively studied by
NMR. The 100% abundant 133Cs (I = 7/2) nucleus is very sensitive to its local environment, as
demonstrated by its large chemical shift range (117). The quadrupole coupling constants at133Cs sites are typically very small, and hence the broadening of the 133Cs resonances, due to the
second-order quadrupolar interaction, is very small. 133Cs is therefore a favorable nucleus to use
for study of the short-range ordering of extraframework cation sites in zeolites. Several studies
of dehydrated CsNa-Y zeolites have found cesium cations in various sites of the faujasite
framework (118–120). Some discrepancy in the assignments of the different 133Cs resonances tothe different cation sites exists in the literature. This appears to be related to (a) the sensitivity ofthe 133Cs chemical shift to small changes in the local environment (e.g., differences in the
numbers and arrangements of the framework aluminum atoms near to cations, or differences inthe numbers and types of nearby extraframework cations), (b) residual water in the nominally
dehydrated material, and (c) mobility of the cesium ions in the cages (119,120).
Copyright © 2003 Marcel Dekker, Inc.

In the lithium (121–125), sodium (126), and cesium systems (127), the assignment of the
resonances has been aided by investigating samples loaded with the paramagnetic molecule,
O2, either by cooling the sample in air or by loading controlled levels of the gas. The interaction
between the cations and oxygen molecules leads to shifts in the cation NMR resonances. Since
only cations in the supercages of faujasite zeolites can bind the oxygen molecules, supercage
vs. sodalite cage resonances can be readily distinguished (Fig. 10) (127). For example, the room
temperature spectrum of Cs-exchanged NaY acquired in air shows three resolved isotropic
resonances at �74, �90, and �155 ppm. These are assigned to two different types of SII Cs+
cations in the supercages (with the two peaks likely arising from differences in the number of
neighboring Al atoms in the cation local coordination environment) and SI’ Cs+ in the sodalite
cages (119), respectively. As the temperature is lowered, the resonances due to cesium in the
supercages shift dramatically to lower frequencies, primarily due to increased O2 loading and
increased magnetic susceptibility of the O2 molecules. The SIII resonance is clearly resolved at
�40jC and below, and both the SII’ and SI’ sites become clearly visible at �150jC at �122
and �148 ppm, respectively (127). O2 sorption studies of lithium-exchanged FAU zeolites have
shown that only the SIII/SIII’ cations interact with the oxygen atoms. The SII cations are
tucked into the 6-ring of the supercage and, in contrast to the cesium and sodium cations, are no
longer accessible (122,125). These studies have also shown that the Li+ cations in the SIII/SIII’
sites are highly mobile (123).133Cs NMR, in conjunction with in situ XRD, has been used to follow the Cs+ ion-
exchange of NaY (119). Cesium cations (ionic radius = 1.7 A) are only able to exchange with the
sodium cations in sites located in the supercages of X and Y zeolites, since the entrance to the
Fig. 10 113Cs MAS NMR spectra of dehydrated Cs-Y spun acquired in air at various temperatures. The
asterisks denote spinning sidebands. The sample of CsY was prepared from NaY by three ion-exchange +
dehydration steps. Following each ion-exchange reaction (with 0.1 M CsNO3), the sample was calcined
at 450jC.
Copyright © 2003 Marcel Dekker, Inc.

sodalite cage (2.2 A) limits the passage of cesium cations into the sodalite cage during the ion-
exchange process. Not until the sample is heated to 350jC and above do the cations migrate from
the sodalite to the supercages. This is accompanied by an increased intensity of the resonances at
�130 to�150 ppm due to the SI’ and SII Cs cations (Fig. 11). This is followed by themigration of
the residual sodium cations in the sodalite cages into the supercages (SII) and SI positions. This
latter process can be monitored with 23Na NMR. The differences in chemical shifts due to
environments assigned to SII and SIII cations in Fig. 10 and 11 result from small changes in the
Cs/Na cation ratio and the distributions of the Cs and Na cations in the different cages.
3. Rubidium
The quadrupole moment of the I = 3/2 87Rb is larger than that of 23Na making identification of
the different 87Rb resonances difficult. However, the method has been used to follow the
progress of solid-state ion-exchange reactions in faujasite zeolites (128).
G. 1H MAS NMR Studies of Zeolites
1H MAS NMR has been widely exploited to investigate acidity, and the defects in the zeolite
framework, created during synthesis, dehydration, or the catalytic reaction. 1H MAS NMR has
Fig. 11 Room temperature 133Cs MAS NMR spectra of cesium exchanged NaY, after the first ion-exchange reaction and subsequent dehydration at 300, 350, 400, and 500jC. All of the isotropic resonanceslie in a chemical shift range from �60 to �150 ppm. All the other peaks are spinning sidebands, which
primarily arise from the satellite transitions.
Copyright © 2003 Marcel Dekker, Inc.

also been used to follow the progress of the catalytic reaction. Acidic zeolites (HZ) are typically
created by dehydration of the ammonium-exchanged form of the zeolite:
ðNH4ÞZ ! HZþ NH3ðgÞTypical 1H chemical shifts for environments found in zeolites are listed in Table 2.
Notable exceptions to these general trends exist. For example, a resonance has been observed at
7.5 ppm, along a more intense resonance at 4.5 ppm, in some samples of H-ZSM-5 (129),
which have both been assigned to Brønsted acid protons. Although the chemical shifts of
protons in silanol and aluminum oxide (Al-OH) extraframework species overlap, 1H/27Al
TRAPDOR NMR may be used to determine whether the proton is near a 27Al spin and thus
separate these two species (56,95).
Acquiring 1H MAS NMR of zeolites requires careful preparation of the sample. The
spectra of hydrated zeolites will be complicated by the rapid exchange that often occurs
between water and many of the proton-containing species. For example, zeolites containing
Brønsted acid sites, NH4+ ions, and water, will show only one resonance with a chemical shift
that represents the average chemical shift position for the three species, weighted by the
appropriate concentrations of the three species (128). At the other extreme, prolonged
dehydration of many aluminum-rich zeolites at high temperatures can result in significantdealumination and a loss in the number of Brønsted acid sites (130).
Samples that have only been partially dehydrated can often show narrow resonances at
approximately 4.6–4.8 ppm due to water (95). These resonances can be distinguished from
those due to Brønsted acid sites because they show little or no 1H/27Al TRAPDOR effect. Inaddition, very characteristic sideband patterns may be observed at low temperatures where the
water motion is frozen out. Sideband patterns resembling a Pake doublet have been observed,
the splitting [i.e., the width of the resonance] being caused by the dipolar coupling between the
two 1H spins of water (95).
Haw et al. have shown that the shifts may be strongly affected by hydrogen bonding to
sorbed species (131). For example, strong hydrogen bonding to a sorbed molecule such as
acetylene results in a dramatic shift of the Brønsted acid proton from approximately 3.8 ppm to
7.3 ppm (131). The shift is highly dependent on the concentration of the sorbed base and on
temperature. At ambient temperatures, the shift arises from the rapid exchange between the
bound and free base, with the shift increasing as a function of loading level until a saturation
value is achieved; at lower temperatures two resonances can be resolved, one due to the free
base and the other from the hydrogen-bonded complex. Haw and Nicholas have performed
DFT ab initio calculations on a series of molecules and ions sorbed on representative zeolite
frameworks to determine the structures and calculate the 13C chemical shifts of the sorbed
Table 2 Typical Ranges for the 1H Chemical Shifts
(ppm) of Some Different Species Found Zeolites
Species Chemical Shift
(NH4+) and protonated amines 6.0–8.1
Non-hydrogen-bonded silanols 1.2–2.3
Hydrogen-bonded silanols 2.5–12
Brønsted acid sites 3.0–5.0
Al-OH nonframework species 1.2–3.6
Water 4.6–5.0
Source: Refs. 2,56,95,130, and 234–236.
Copyright © 2003 Marcel Dekker, Inc.

molecule–zeolite complexes (132,133). Figure 12 shows the extremely large shift in the 1H
chemical shift of the Brønsted acid site (originally at 4.3 ppm) that occurs on sorbing
nitromethane and deuterated acetone in H-ZSM-5. The larger shift for the Brønsted acid site
that is hydrogen bonded to acetone (18.6 ppm) in the presence of sorbed nitromethane suggests
that the interaction between the two sorbents leads to an additional degree of proton transfer
from the zeolite to the sorbent. These 1H NMR results were consistent with changes in the 13C
chemical shift of acetone in the presence and absence of nitromethane. DFT calculations were
again used to explore the effects of the coadsorbates on zeolite acidity. For example, Fig. 12d
shows the gas phase structure of the nitromethane acetone complex, following protonation of
the acetone. Protonation of this complex was calculated to be 16 kcal mol�1 more favorable
than protonation of acetone alone. Addition of nitromethane into a catalytic flow reactor
resulted in enhanced activities for a series of acid-catalyzed reactions (e.g., methanol and
isopropanol conversions), consistent with the increase in apparent zeolite acidity.
An even stronger interaction with the Brønsted acid proton (i.e., sorption of a stronger
base) results in the transfer of the proton from the zeolite framework to the sorbed base:
B---HZ ! BHþ---Z�
A decrease in the chemical shift is then seen, with the shift of the proton now depending
on the base and its interaction with the Brønsted acid site. For example, the 1H shifts of
protonated monomethylamine range from 6.8 to 8.0 ppm, with the shifts presumably depending
on the strength of hydrogen bonding of the proton, now on the protonated base molecule, to the
Fig. 12 The 1H MAS NMR spectrum of HZSM-5 loaded with (a) nitromethane, (b) acetone-d6, and (c)
acetone-d6 and nitromethane, showing the effect of hydrogen bonding on the 1H chemical shift of the
Brønsted acid site (originally at 4.3 ppm). The spectra were acquired at 77 K at a spinning speed of 10
kHz. (d) A DFT calculation of the protonated acetone-nitromethane complex formed in the gas phase,
illustrating some of the interactions that result in enhanced proton transfer from the zeolite to the sorbed
acetone molecules. (Reproduced from Ref. 133).
Copyright © 2003 Marcel Dekker, Inc.

zeolite framework (57). The shift of the probe molecule resonance to higher frequencies, with
increased strength of hydrogen bonding, and the subsequent decrease as the proton is trans-
ferred has resulted in some difficulty in determining whether a shift is indicative of proton
transfer or strong hydrogen bonding, particularly for sorption of weaker bases such as water and
methanol. All of these results are highly dependent on the temperature and the loading level
(see below). At higher loading levels, where the numbers of sorbed bases exceeds the number
of acidic sites, an average chemical shift is observed (56,134). Again, ab initio (DFT and HF)
methods have been used to help rationalize the NMR observations (135).
H. Probe Molecule Studies of Acidity and Basicity
An understanding of acid strength, and the role of the framework in controlling this, is
fundamental to the understanding of acid-catalyzed reactions in zeolites. The nature and
numbers of acidic sites can be studied by investigating the interactions of basic molecules
sorbed on zeolites by 13C, 15N, and 31P NMR spectroscopy (136–139). The 15N and 31P
chemical shifts of a series of bases such as trimethylphosphine (TMP) (137,140) monomethyl-
amine (MMA) (57), and pyridine (141) are significantly different depending on whether the base
is coordinated to a Lewis acid site, physisorbed, or whether the base is protonated by the
Brønsted acid proton, allowing the concentrations of different types of sites to be determined.
Research in this area has been reviewed (142,143). Experiments involving sorption of
phosphines and phosphine oxides on zeolites (57,140,144) are easier to carry out than those
involving amines in view of the sensitivity (large g and 100% natural abundance) of the 31P
nucleus. No isotopic labeling is required. Furthermore, binding of molecules such as TMP is less
complicated than binding of some other widely studied basic molecules such as water, methanol,
and many amines because extensive hydrogen-bonding networks are not formed.
All of the NMR results are highly dependent on the temperature and the loading level
(56,134,145,146). At low loading levels (i.e., where the loading level is lower than the available
number of Brønsted acid sites) of a strong base such as an amine or a phosphine, where hydrogen
transfer occurs, the protonated base remains bound to specific sites of the framework (at least at
ambient temperatures). At higher loading levels, the mobility of the bases increases dramati-
cally, hydrogen bonding between the nonprotonated bases and the protons in the protonated
bases allowing for rapid transfer of protons between molecules and for increased mobility of the
molecules and ions. This motion can be frozen out at lower temperatures, and resonances from
the individual components can be resolved. Phosphine oxides tend to be less mobile than
phosphines and rigid complexes are often observed, even at room temperature (144,147).
More recently, a series of double-resonance experiments have been performed that allow
the connectivities or distances between spins on the site of adsorption and on the adsorbed
molecule to be determined (148–151). 15N-27Al REDOR NMR has been used to measure the
distance between the aluminum T sites in zeolite HY and the nitrogen atom in 15N-enriched
MMA (150). The measured 15N-27Al distance of 3.1 A was consistent with models for MMAH+
binding involving two or three hydrogen bonds as predicted by the calculations of Teunissen
and van Santen for NH3 binding on acidic zeolitic clusters (152,153). The sorption of a probe
molecule such as MMA reduces the QCC of the aluminum site, and hence the second-order
quadrupolar interaction, significantly (53,56). This means that aluminum spins are now clearly
visible, even at moderate fields, in a standard MAS experiment, and experiments may be
performed where these spins are observed directly. One aluminum atom becomes ‘‘visible’’ per
adsorbed probe molecule (56). Thus, in these types of systems, the fraction of visible aluminum
should be accurately determined in order to analyze the REDOR data. Solid-state NMR
methods and ab initio calculations have been employed to investigate the structure of the
Copyright © 2003 Marcel Dekker, Inc.

trimethylphosphine (TMP)–Brønsted acid site complex in zeolite HY (151). 27Al/31P and27Al/1H REDOR experiments performed at �150jC were utilized to measure Al-P and Al-HB
distances for the acid site–TMP complex of 3.95 (0.05) A and 2.8–3.1 A, respectively, where
HB is the Brønsted acid site proton (151). A more accurate measurement of the Al-HB distance
was not possible because models that assume the presence of isolated Al-H spin pairs were not
valid in this case. A P-HB distance of 1.40 (0.02) A was obtained by fitting the spinning
sidebands in the 1H MAS NMR spectrum. These internuclear distances are within the range of
the Al-P, Al-H, and P-H distances obtained from ab initio calculations for the ion pair (IP)
TMPH+–zeolite complex that is formed by transferring a Brønsted acid proton to TMP.
The Lewis acid sites in dehydroxylated HY can be observed indirectly and quantified by
sorbing a basic probe molecule. For example, 15N/27Al TRAPDOR NMR has been used to
demonstrate that the nitrogen atom in the MMA molecule binds directly to an aluminum atom
in the Lewis acid site formed on hydroxylation (or steaming), and to determine a QCC of 8.5
MHz for this Lewis acid–MMA complex (56). 27Al/31P TRAPDOR methods have also been
used to study the binding of the probe molecules trimethylphosphine oxide (144) and TMP (57)
to the Lewis sites in dehydroxylated HY and USY. For example, Fig. 13 shows the 31P/27Al
TRAPDOR NMR of trimethylphosphine sorbed on HY dehydrated at 600jC. The 31P
resonance due to TMP bound to the aluminum Lewis acid site (at �46 ppm) is clearly
resolved in the ‘‘difference’’ spectrum. The resonances for TMP sorption on the Brønsted and
Fig. 13 The 31P/27Al TRAPDOR spectra of trimethylphosphine sorbed in HY obtained (top) without
and (middle) with 27Al irradiation at �150jC. The difference spectrum, i.e., top minus middle, is shown in
bottom. 27Al irradiation was applied for 725 As and a spinning speed of 5520 Hz was used.
Copyright © 2003 Marcel Dekker, Inc.

Lewis acid sites may be resolved and the concentrations of these two sites may be readily
determined as a function of the sample preparation method. INEPT experiments have been used
to observe a 31P-27Al J-coupling between the aluminum Lewis acid surface site and the bound
molecule (TMP) (154). A 31P-27Al J-coupling constant of 270 (F10) Hz was determined, which
is consistent with a five-coordinated aluminum Lewis acid–TMP complex, and thus a four-
coordinated Lewis acid site. The INEPT experiment represents an alternative approach for
probing the strength of these acid–base complexes, since the J coupling is a measure of the
interaction between the phosphorus and aluminum atoms.
The mobility of the probe molecules has been studied by many authors. For example,
in the TMP-zeolite system, Lunsford et al. showed that the motion of TMPH+ complexes in
zeolites such as HY, dealuminated HY, and HZSM-5 was strongly affected by the size of the
cavities and/or channels, and the temperature of the sample (155). The motion of TMP has
also been studied as a function of temperature by Bendada et al. (156) and by Kao et al.
(57,95). Exchange between different binding sites could be frozen out at low temperatures
(57,95). This mobility has important implications for the double-resonance experiments
(90,150,157).
NMR methods for measuring internuclear distances are based on a determination of the
dipolar coupling between two spins. In the absence on any motion, this dipolar coupling is
inversely proportional to the cube of the distance between the spins. However, the dipolar
coupling, even between nearby spins, is often very small on the time scale of many motional
processes, e.g., a 27Al–15N distance of 3.1 A corresponds to a dipolar coupling of only 0.1 kHz
(150). Thus, any residual motion at or faster than this time scale (generally more than 1–10 ms)
will reduce or, for isotropic motion, average the measured dipolar coupling constant to zero,
resulting in a longer than expected distance. This typically requires that any experiments
involving molecules sorbed on surfaces be performed at low temperatures, where the transla-
tional motion of the molecules will be frozen out. Any remaining motion (e.g., librations) of the
molecule on the surface will similarly reduce the measured internuclear distance, and in some
circumstances it may be appropriate to consider the NMR experiment as a method for
determining the maximal internuclear distance between spins. Fyfe and Lewis have also
discussed the need to consider mobility of the probe molecules when measuring internuclear
distances between sorbent and substrate (90,157).
NMR has also been used to probe basic sites in zeolites. Probe molecules such as pyrole
and chloroform have been used to probe interactions with the framework oxygen sites
(158,159). For chloroform and other chlorocarbons such as CF2HCF2Cl, the shift in the 1H
resonance provides clear evidence for hydrogen bonding to the basic zeolite framework sites
(160,161). 13C NMR has been used to study the methoxy groups formed on reaction of a
halocarbon or methanol with the zeolite framework, providing an alternative method for
investigating the basicity of different framework sites or zeolites (162–167). The basic zeolites
contain extraframework cations, which can dramatically alter the basicity of the framework
oxygen sites and play an important role in the catalytic reaction. The interactions of the probe
molecules with these cations need to be considered when interpreting the NMR results;
however, NMR can play an important role in sorting out the strength or importance of the
different interactions (168).
III. PRACTICAL CONSIDERATIONS
A. Controlling the Sample Environment
Many studies of zeolites require that the materials be studied under controlled atmosphere (to
prevent moisture entering the sample, or to prevent sorbed gases from escaping). This presents a
Copyright © 2003 Marcel Dekker, Inc.

challenge if MAS experiments are to be performed. Klinowski et al. and others have studied
catalytic reactions of, e.g., methanol in H-ZSM-5 (169) by sealing the samples in glass ampules,
which are designed so that they fit snugly into the NMR rotors (170). This technology is most
easily implemented in the Chemagnetics design of pencil probes, where sleeves can be readily
fabricated to hold the ampoules in place. Glass ampules are typically sealed by cooling the
sample with liquid nitrogen and then flame sealing, or by using glue to seal a constricted tube;
both methods lead to possible errors in quantifying the gas loading level. Glass ampules sealed
under vacuum can also suffer from heat conduction problems, resulting in differences betweenthe measured and actual temperatures that are much larger than those typically observed for a
fully packed rotor, particularly at low temperatures.
Sometimes a tight rotor cap can prove to be sufficiently airtight. At low temperatures in
particular, the differential contraction of the cap and rotor can lead to leaks, and this approach
may not be feasible. For example, when the low-temperature experiment is performed with air
as the spinning gas, oxygen can be sorbed into the zeolite pores, leading to dramatic changes in
the NMR spectra (171). Furthermore, samples packed into rotors at ambient temperatures in a
glove box may pick up gases present in the glove box, and lose some or all of the previously
sorbed gas. Haw et al. have solved these problems in their CAVERN design for loading rotors
(132). Here the zeolite sample is first evacuated and activated in the middle section of a
specially designed glass vessel. The sample is then cooled cryogenically, by placing the vessel
in liquid nitrogen, and controlled loading levels of gases are introduced. A plunger can then be
pulled, allowing the loaded sample to drop into the MAS rotor in the lower section of the
vessel. The rotor is then capped, again using the plunger. Since the capping is performed at low
temperatures, a very tight seal at higher temperatures is assured. The method also allows very
accurate control of gas loading levels.
B. High-Temperature Studies of Catalysis and Catalyst Structure
High-temperature MAS experiments are severely restricted by the highest temperature reached
by most commercial routine probes (250jC). Nonstandard high-temperature MAS approaches
used to date include laser-heated probes (172,173) and specially designed high-temperature
probes (174). The laser probes suffer from large temperature gradients and from difficulties in
determining the exact temperature. Nonetheless, they have been used to study catalytic
reactions in zeolites and proton mobility (175,176). They can be used for ‘‘temperature
jump’’ experiments, which allow species that are highly reactive at high temperatures to be
trapped and studied by NMR at lower temperatures (173). The DOTY water-cooled high-
temperature probe uses boron nitride components and rotor caps that are screwed to the main
rotor so as to overcome problems of differential expansion. For example, this probe has been
used to study cation mobility up to 500jC (120). An alternative approach, developed by Sarv
et al., involves spinning a long glass ampule (174). Spinning and heating are separated: one
end of the ampule is held tightly by a large and heavy MAS rotor, which spins in the MAS
stator. The other end of the ampule (containing the sample) sits in the coil and can be heated
to a desired temperature. This probe has been used to investigate the mobility of Brønsted acid
site protons.
None of these approaches is simple, and alternative setups for studying catalytic reactions
have been developed where the temperature of the sample containing the sorbed gas can be
rapidly quenched (in less than 200 ms) at different stages during the catalytic reaction. The
sample can then be transferred to an NMR rotor in a glove box, allowing the progress of the
reaction to be followed (177). The method also allows reactivity to monitored under flowconditions. This approach should be contrasted to reactivity studies performed in glass
Copyright © 2003 Marcel Dekker, Inc.

ampules. These studies will typically monitor the formation of the thermodynamic products.
For example, in the methanol-to-gasoline (MTG) chemistry that occurs over acidic zeolites,
unsaturated alkenes are not typically observed, although they are seen under flow conditions;
the alkenes react rapidly in these static reaction vessels (i.e., the ampules) to form the more
thermodynamically favorable saturated alkanes (169). Finally, Hunger et al. have developed a
MAS setup for catalysis, where the reactant gas is injected directly into a spinning rotor, which
contains the catalyst. The rotor is open at one end, allowing for continuous gas injection
throughout the experiment. The airflow is designed so that the reactant gas flows over the
catalyst and out of the rotor, where it is can be detected downstream by gas chromatography
(178). The method has been used to study catalytic reactions and the change in catalyst
structure as a function of the reaction conditions (179,180) and can also be combined with
stopped-flow methods (181,182).
IV. THEORETICAL DESCRIPTION OF THE NMR EXPERIMENTS
A. NMR of Noninteger Spin Quadrupolar Nuclei
Quadrupolar nuclei compose the majority of the magnetically active nuclei, of which the
noninteger spin nuclei are the most numerous. NMR spectroscopy of these nuclei differsfrom that of I = 1/2 nuclei in that spectra of these nuclei are typically influenced by the
interaction between the electric quadrupole moment of the nucleus and the electric fieldgradient at the nuclear site caused by the surrounding atoms. Thus, the quadrupolar
interaction contains chemical information concerning the local environment of the nucleus
and may be used to distinguish between, for example, different sodium cation sites in X and
Y zeolites.
This quadrupolar interaction can sometimes be so large that observation of the nucleus is
extremely difficult with NMR methods (e.g., for 35Cl, 63Cu, 127I, etc.). In this case, nuclear
quadrupole resonance (NQR) spectroscopy may be a more appropriate technique with which to
study these nuclei. However, for many nuclei encountered in the characterization of zeolites or
molecular sieves (e.g., 7Li, 11B, 17O, 23Na, 27Al, 51V, 133Cs), the quadrupolar interaction is
often sufficiently small that many of the NMR experiments used to study I = 1/2 nuclei can be
applied. The central transition (m = |+1/2> to |�1/2>; see below) for noninteger spin
quadrupolar nuclei is not broadened to first order by the quadrupolar interaction, and relatively
narrow resonances may be observed. The presence of the outer satellite transitions is often
ignored, and the noninteger spin is treated as a so-called fictitious spin-half system. The validity
of this assumption will depend on both experimental parameters and the sample. There are a
variety of consequences that result from the presence of these outer transitions, with differentpractical implications for obtaining quantitative spectra of zeolites. Acquiring NMR spectra of
these nuclei requires an understanding of some of the underlying theory, so that the
experimentalist is aware of the limitations of the method or to assure that the spectra obtained
are quantitative. For this reason, the theory describing NMR experiments involving these nuclei
will be provided below. For more detailed reviews of the theory of NMR of noninteger spin
nuclei, the reader is referred to reviews by, for example, Freude and Haase (45) and Vega (in
the Encyclopedia of NMR) (183).
1. First-Order Quadrupolar Interaction
The Hamiltonian for a quadrupolar nucleus in a magnetic field, with quadrupole moment Q, is a
sum of the Zeeman and quadrupolar terms:
H ¼ NLIz þ HQ ð4Þ
Copyright © 2003 Marcel Dekker, Inc.

where Eq. (4) is written in frequency units. Standard symbols for frequencies are used
throughout, where N, r, and y denote frequencies expressed in radians, Hz, and ppm,
respectively. The first-order quadrupolar interaction, HQ(1), is given by:
HQð1Þ ¼ ð1=2ÞQVðu;fÞfI2z � IðI þ 1Þ=3g ð5Þwhere Q V, the quadrupolar splitting, is a function of u and f, the polar angles that define the
orientation of the principal axis system of the quadrupole tensor (defined by the principal
components, Vxx, Vyy, and Vzz) in the Zeeman field (or laboratory frame) (Fig. 14) and the
asymmetry parameter, D, [D = (Vxx-Vyy)/Vzz]:
QVðu;fÞ ¼ ðNQ=2Þ½ð3 cos2 u� 1Þ � D sin2 u cos 2f� ð6ÞNQ, the quadrupole frequency, depends on the quadrupole coupling constant (QCC), e2qQ/h (or
CQ in some texts):
NQ ¼ 3e2qQ=½2Ið2I � 1Þh� ð7Þ(where eq = Vzz). Note that the QCC is zero for a nucleus located at a site with cubic,
octahedral, or tetrahedral point group symmetry. The energy levels of the quadrupolar nucleus,
Em, in the Zeeman field are given by:
Em ¼ mINL þ QVðu;fÞfm2I � IðI þ 1Þ=3g2 ð8Þ
The spectrum of a single crystal is split by the quadrupolar interaction, to first order,
into 2I evenly spaced resonances with splittings, given by Q’, and intensities that are
proportional to:
< mI j IX j mI þ 1 >2¼ fIðI þ 1Þ � mIðmI þ 1Þg=4 ð9ÞThus, when u = 0j and the principal axis of the EFG tensor is aligned along the static
magnetic field, the quadrupole splitting Q’(0,f) is given by NQ. When u = 90j and D = 0,
Q’(0,f) = -NQ /2.
One of the most important consequences that follows from Eq. (6) for noninteger spins is
that the frequency of the m = 1/2 to m = �1/2, or central transition, does not depend on Q’ and
Fig. 14 The angles that define the orientation of the quadrupole tensor (Vxx, Vyy, Vzz) and the rotor axis,
with respect to the static magnetic field, B0.
Copyright © 2003 Marcel Dekker, Inc.
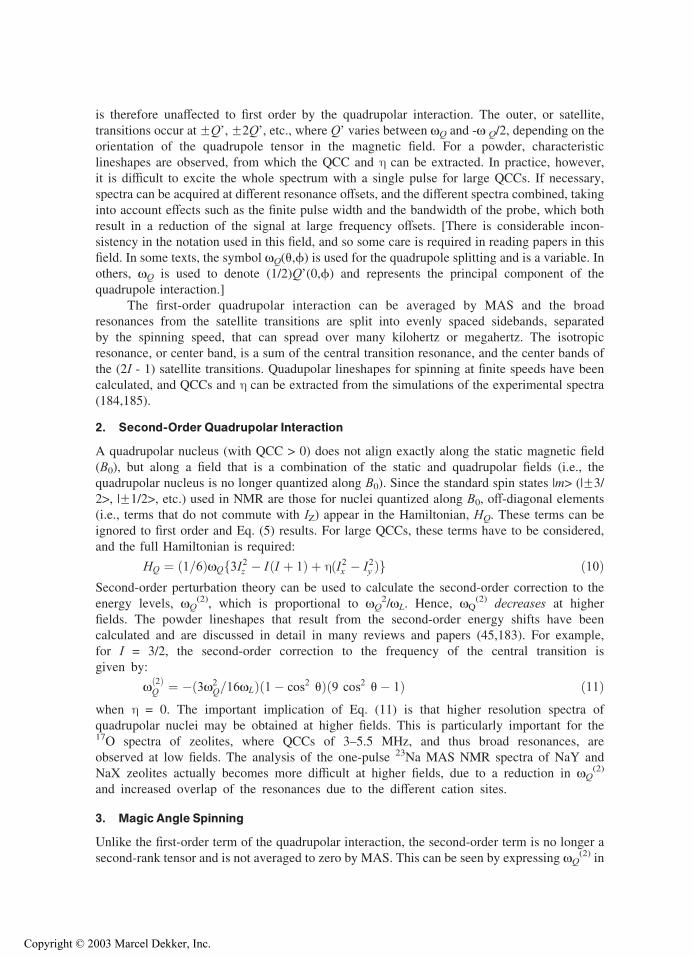
is therefore unaffected to first order by the quadrupolar interaction. The outer, or satellite,
transitions occur at FQ’, F2Q’, etc., where Q’ varies between NQ and -N Q/2, depending on the
orientation of the quadrupole tensor in the magnetic field. For a powder, characteristic
lineshapes are observed, from which the QCC and D can be extracted. In practice, however,
it is difficult to excite the whole spectrum with a single pulse for large QCCs. If necessary,
spectra can be acquired at different resonance offsets, and the different spectra combined, taking
into account effects such as the finite pulse width and the bandwidth of the probe, which both
result in a reduction of the signal at large frequency offsets. [There is considerable incon-
sistency in the notation used in this field, and so some care is required in reading papers in this
field. In some texts, the symbol NQ(u,f) is used for the quadrupole splitting and is a variable. In
others, NQ is used to denote (1/2)Q’(0,f) and represents the principal component of the
quadrupole interaction.]
The first-order quadrupolar interaction can be averaged by MAS and the broad
resonances from the satellite transitions are split into evenly spaced sidebands, separated
by the spinning speed, that can spread over many kilohertz or megahertz. The isotropic
resonance, or center band, is a sum of the central transition resonance, and the center bands of
the (2I - 1) satellite transitions. Quadupolar lineshapes for spinning at finite speeds have been
calculated, and QCCs and D can be extracted from the simulations of the experimental spectra
(184,185).
2. Second-Order Quadrupolar Interaction
A quadrupolar nucleus (with QCC > 0) does not align exactly along the static magnetic field(B0), but along a field that is a combination of the static and quadrupolar fields (i.e., the
quadrupolar nucleus is no longer quantized along B0). Since the standard spin states |m> (|F3/
2>, |F1/2>, etc.) used in NMR are those for nuclei quantized along B0, off-diagonal elements
(i.e., terms that do not commute with IZ) appear in the Hamiltonian, HQ. These terms can be
ignored to first order and Eq. (5) results. For large QCCs, these terms have to be considered,
and the full Hamiltonian is required:
HQ ¼ ð1=6ÞNQf3I2z � IðI þ 1Þ þ DðI2x � I2y Þg ð10ÞSecond-order perturbation theory can be used to calculate the second-order correction to the
energy levels, NQ(2), which is proportional to NQ
2/NL. Hence, NQ(2) decreases at higher
fields. The powder lineshapes that result from the second-order energy shifts have been
calculated and are discussed in detail in many reviews and papers (45,183). For example,
for I = 3/2, the second-order correction to the frequency of the central transition is
given by:
Nð2ÞQ ¼ �ð3N2
Q=16NLÞð1� cos2 uÞð9 cos2 u� 1Þ ð11Þwhen D = 0. The important implication of Eq. (11) is that higher resolution spectra of
quadrupolar nuclei may be obtained at higher fields. This is particularly important for the17O spectra of zeolites, where QCCs of 3–5.5 MHz, and thus broad resonances, are
observed at low fields. The analysis of the one-pulse 23Na MAS NMR spectra of NaY and
NaX zeolites actually becomes more difficult at higher fields, due to a reduction in NQ(2)
and increased overlap of the resonances due to the different cation sites.
3. Magic Angle Spinning
Unlike the first-order term of the quadrupolar interaction, the second-order term is no longer a
second-rank tensor and is not averaged to zero by MAS. This can be seen by expressing NQ(2) in
Copyright © 2003 Marcel Dekker, Inc.

terms of the zero-, second-, and fourth-order Legendre polynomials Pn(cos u), where n = 0, 2,
and 4, respectively:
P2ðcos uÞ ¼ ð3 cos2 u� 1ÞP4ðcos uÞ ¼ ð35 cos4 u� 30 cos2 uþ 3Þ ð12Þ
A second-rank tensor contains terms with n = 0 and 2 only; the n = 0 terms are the isotropic
terms (i.e., they do not vary as a function of the orientation in the magnetic field).Sufficiently fast spinning at an angle u, such that 3 cos2 u� 1 = 0 (the ‘‘magic angle’’), averages
the P2(cos u) terms to zero. The averaged value for NQ(2) under sample rotation, <NQ
(2)>rot, is
given by:
< N2Q >rot¼ A0 þ A2P2ðcos hÞ þ A4P4ðcos hÞ ð13Þ
where A0 is the isotropic shift, and A2 and A4 are functions of NQ, NL, D, and the relative
orientation of the quadrupolar tensor and rotor axis. h is the angle between the rotor axis and the
static magnetic field (see Fig. 14). P2(cos h) and P4(cos h) are averaged to zero and �7/18,
respectively, for sample rotation at the magic angle. Thus, MAS only reduces the linewidths of
the resonances obtained from powdered samples by approximately one-third, and for large QCCs
significant second-order quadrupolar line broadening remains. Characteristic lineshapes are
observed fromwhich the QCC and D can be extracted (46,183,186). Examples of this are found in
the 23Na MAS NMR spectra of sodium-exchanged zeolites (Fig. 7) (109) and in the 11B MAS
NMR of boron-exchanged zeolites (61).
A shift in the center of gravity of the resonance to lower frequencies also occurs. This is
called the second-order quadrupolar shift and is given by A0 (or NQiso(2)):
A0 ¼ Nð2ÞQiso ¼ �ðIðI þ 1Þ � 3=4Þð1þ D2=3ÞN2
Q=30NL ð14ÞNQiso
(2) depends on the Larmor frequency, and it is sometimes necessary to acquire spectra at
more than one magnetic field, before the chemical shift, yCS, and NQiso(2) can be separated.
Note that NQiso(2) is the value for the shift in radians. The shift in units of ppm, y(2), can be
calculated (y(2) = 106 � NQiso(2)/NL). The quadrupolar shift can shift resonances out of the
typical chemical shift ranges observed for different environments. This is particularly important
for 27Al NMR, where a large QCC can, for example, shift the resonance of a tetrahedrally
coordinated aluminum atom into the chemical shift range typically observed for five- and six-
coordinated aluminum atoms. This has complicated the interpretation of, for example,
extraframework aluminum sites in zeolites.
The second-order broadening can sometimes be so large that the central transition
resonances are no longer detected under conditions of MAS or are only observable as broad
humps in the baseline. These spins are often termed ‘‘invisible.’’ It is sometimes difficult to
distinguish between these broad components and any baseline distortions that may be present.
It is especially difficult when a range of QCCs is present and no sharp discontinuities are
visible in the second-order quadrupolar lineshapes; this is often the case in the 27Al MAS NMR
spectra of the extraframework aluminum species or Brønsted acid sites in dehydrated zeolites.
In addition, when narrower resonances are also present, the sidebands from these resonances
may spread out over many ppm, making quantification of the broad humps extremely difficult.
4. Removing the Second-Order Quadrupolar Broadening
There are now four major approaches to reducing or removing the second-order quad-
rupolar broadening. The most straightforward approach is to work at as high fields as
possible, since the broadening is inversely proportional to NL. Two other approaches
involve mechanical averaging of the second-order broadening [DAS (83) and DOR (82)].
The most recent technique, MQMAS (48,49), makes use of the different second-order
Copyright © 2003 Marcel Dekker, Inc.

quadrupolar broadenings of the single and triple or five-quantum transitions to accomplish
the averaging.
a. DOR
Averaging of the second-order quadrupolar broadening can be achieved by simultaneous
spinning at two angles (82,83). These angles, h1 and h2, are chosen such that both the second-
and fourth-order Legendre polynomials are reduced to zero:
P2ðcos h1Þ ¼ 0 h1 ¼ arc cosð1=31=2Þ ðthe ‘‘magic angle’’ÞP4ðcos h2Þ ¼ 0 h2 ¼ 30:55 or 70:12B ð15Þ
In practice, this achieved with a small rotor containing the sample (the inner rotor), which spins
inside another rotor (the outer rotor). The axis of rotation of the inner rotor is inclined at angle of
30.55j to the axis of rotation of the outer rotor. The outer rotor is then spun at the magic angle.
The isotropic shift, y, observed under conditions of DOR is a sum of the chemical shift, yCS, andthe second-order quadrupolar shift, yQiso
(2), defined in Eq. (14), (where yQiso(2) = NQiso
(2)/NL),and is therefore field dependent. yQiso
(2) must be determined independently (e.g., from studies at
different fields) in order to obtain yCS. The field dependence of yQiso(2) can be exploited to
separate resonances with similar values for yCS but with different QCCs.A major limitation to the technique remains the spinning speed of the outer rotor: speeds
of not more than 1.2 kHz are typically achieved, and the spectra often contain many
overlapping resonances. However, rotor synchronization will eliminate half of the spinning
sidebands (187). The poor filling factor of the coil also results in long acquisition times for low-
sensitivity nuclei such as 17O.
b. DAS
The DAS experiment works by spinning separately about two DAS complementary angles (83)
such that the second-order quadrupolar broadening is of equal magnitude for the two angles, but
opposite in sign. A two-dimensional experiment is performed wherein the spins are returned to
the z direction to preserve the magnetization while the flip between the two angles is
implemented. The evolution due to NQ(2) is refocused when t1 = t2, and an echo forms. Data
acquisition is started at the echo maximum at t2. A Fourier transform along t1 yields the
isotropic resonance, and quadrupolar second-order lineshapes are obtained after a Fourier
transform along t2. The DAS complementary angles can be found by finding solutions to the
two simultaneous equations:
P2ðcosh1Þ þ kP2ðcos h2Þ ¼ 0
P4ðcosh1Þ þ kP4ðcos h2Þ ¼ 0 ð16ÞFor example, when k = 5, h1 = 0j and h2 = 63.32j. Thus, spinning first about h1 = 0j and then
about h2 = 63.32j will produce an echo at 5t1 = t2.
DAS is only effective for nuclei with sufficiently long spin-lattice relaxation times, so that
significant magnetization is not lost during the time used to flip the rotor. In addition, DAS will
not remove the homonuclear dipolar couplings. Spin exchange may occur during the flippingtime, which will result in broadening of the DAS spectra. Since this is a two-dimensional
experiment, the experiment times are typically longer than for DOR.
c. Multiple-Quantum MAS NMR
In addition to the central transition, all odd-order multiple-quantum (MQ) transitions of
quadrupolar nuclei (i.e., 3Q, 5Q etc.) are unaffected by the first-order quadrupolar interaction.These MQ transitions are not directly observable but can be observed indirectly if the MQ
coherence is transferred back to the observable single (1Q) coherence (188). The MQ
Copyright © 2003 Marcel Dekker, Inc.
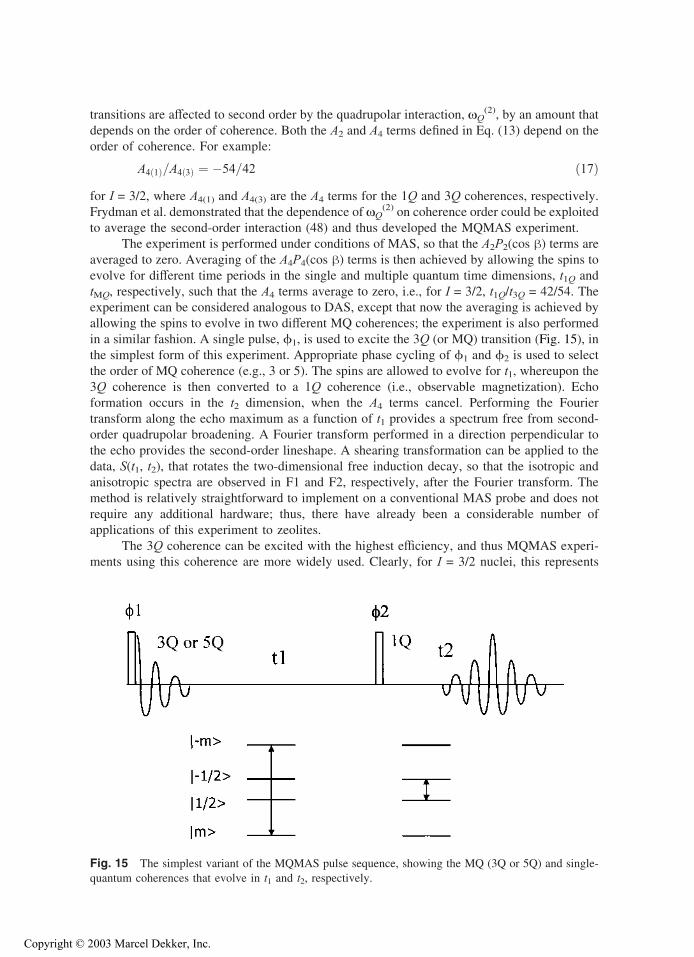
transitions are affected to second order by the quadrupolar interaction, NQ(2), by an amount that
depends on the order of coherence. Both the A2 and A4 terms defined in Eq. (13) depend on the
order of coherence. For example:
A4ð1Þ=A4ð3Þ ¼ �54=42 ð17Þfor I = 3/2, where A4(1) and A4(3) are the A4 terms for the 1Q and 3Q coherences, respectively.
Frydman et al. demonstrated that the dependence of NQ(2) on coherence order could be exploited
to average the second-order interaction (48) and thus developed the MQMAS experiment.
The experiment is performed under conditions of MAS, so that the A2P2(cos h) terms are
averaged to zero. Averaging of the A4P4(cos h) terms is then achieved by allowing the spins to
evolve for different time periods in the single and multiple quantum time dimensions, t1Q and
tMQ, respectively, such that the A4 terms average to zero, i.e., for I = 3/2, t1Q/t3Q = 42/54. The
experiment can be considered analogous to DAS, except that now the averaging is achieved by
allowing the spins to evolve in two different MQ coherences; the experiment is also performed
in a similar fashion. A single pulse, f1, is used to excite the 3Q (or MQ) transition (Fig. 15), in
the simplest form of this experiment. Appropriate phase cycling of f1 and f2 is used to select
the order of MQ coherence (e.g., 3 or 5). The spins are allowed to evolve for t1, whereupon the
3Q coherence is then converted to a 1Q coherence (i.e., observable magnetization). Echo
formation occurs in the t2 dimension, when the A4 terms cancel. Performing the Fourier
transform along the echo maximum as a function of t1 provides a spectrum free from second-
order quadrupolar broadening. A Fourier transform performed in a direction perpendicular to
the echo provides the second-order lineshape. A shearing transformation can be applied to the
data, S(t1, t2), that rotates the two-dimensional free induction decay, so that the isotropic and
anisotropic spectra are observed in F1 and F2, respectively, after the Fourier transform. The
method is relatively straightforward to implement on a conventional MAS probe and does not
require any additional hardware; thus, there have already been a considerable number of
applications of this experiment to zeolites.
The 3Q coherence can be excited with the highest efficiency, and thus MQMAS experi-
ments using this coherence are more widely used. Clearly, for I = 3/2 nuclei, this represents
Fig. 15 The simplest variant of the MQMAS pulse sequence, showing the MQ (3Q or 5Q) and single-
quantum coherences that evolve in t1 and t2, respectively.
Copyright © 2003 Marcel Dekker, Inc.

the only MQ coherence. The triple-quantum nutation frequency is inversely proportional to the
quadrupolar splitting, Q V, and is given by 2N13/3Q V2. Thus, the flip angle of the triple-quantum
excitation pulse will depend on Q V, and will not be constant for the whole powder, resulting in
nonuniform excitation of the sample. Thus, the method is less successful for large QCCs (and,
hence, larger values of Q V), especially at lower fields. However, even in these cases quantitativespectra may be obtained by using the parameters obtained from the MQMAS spectra to simulate
the one pulse spectra, where the intensities are more readily quantified (Fig. 7).
Many variants of the initial MQMAS experiment have been developed that allow pure
absorption spectra to be acquired in two dimensions [the shifted-echo (189,190), z-filter (191),and rotor synchronized z-filter (192) methods] and to improve the efficiency of the creation of
MQ coherences, and their reconversion to 1Q coherences, by exciting a higher fraction of spins
in the powder, such as the fast-amplitude modulation (FAM) shifted-pulse sequences developed
by Vega et al. (193,194), and methods based on sweeping the rf offset [the double-frequency
sweep sequence developed by Kentgens et al. (195,196)]. Some of these methods are compared
in Ref. 197. The new sequences have been widely applied to study zeolites. For example, FAM
pulses have been shown to improve the sensitivity of the 17O MQMAS spectra of zeolites (198).
Higher resolution spectra were obtained by using 5Q, as opposed to 3Q, sequences (198).
However, the signal-to-noise ratio obtained with this sequence is much lower than that of the 3Q
sequence, due to the lower efficiency of the 5Q excitation. The double-frequency sweep
sequence was used to study dehydrated HZSM-5 (58).
5. Acquiring Spectra
Two extreme cases can be distinguished for single-pulse excitation at small resonant offsets,which depend on the relative magnitudes of the QCC and N1. When N1 >> QCC, the whole
quadrupole spectrum is excited. In contrast, when QCC >> N1, only the central transition is
affected by N1. The transition can then be treated as an isolated or so-called fictitious spin-halftransition. Unfortunately, the nutation frequency of the spins (i.e., the frequency with which the
spins precess around the applied rf field) is different for these two cases. The signal intensity forI = 3/2 spins varies as 2 sin N1t and sin 2N1t for Q V = 0 and |Q V| >> N1, respectively, for a pulse
of length t. The intensity of a resonance is thus dependent on Q V (Fig. 16). In many cases, the
Fig. 16 The signal intensity versus pulse length for zero and a large quadrupolar spitting, Q V. The k/2and k pulse lengths for QV = 0 are shown.
Copyright © 2003 Marcel Dekker, Inc.

QCC is of the same order as N1 (the intermediate regime). The orientation dependence of Q Vthen results in a spread of nutation frequencies, which can vary from N1 to 2N1 for I = 3/2. The
second-order quadrupolar lineshape is also distorted, since the powder is no longer uniformly
excited. The situation is more complex under MAS as Q V is partially averaged during the pulse,
and Q V appears smaller (199). Thus, the nutation frequency will also depend on the spinning
speed. Since sin 2uc2 sinu for small flip angles, u, quantitative spectra and undistorted
lineshapes can be obtained with short excitation pulses. This can be seen in Fig. 16, where the
signal intensity obtained for large QCCs and Q = 0 can be seen to be very close, if pulses of 15jor less are used. More generally, the nutation frequencies for all noninteger spins vary between
sin(I + 1/2)N1t and (I + 1/2)N1t for |Q V|<<N1 and |Q V|>>N1, respectively, and quantitative
spectra can similarly be obtained with short flip angles. The spread in nutation frequencies
obtained in the intermediate regime can be used to determine the QCC and D; this is the basis ofnutation spectroscopy (200,201), which has been used to study sodium sites in zeolites (202).
6. Spin Counting
Since it is sometimes difficult to observe all of the spins in the sample, it is important to be able
to estimate the number of spins that are actually observed. Without accurate spin counting, it is
not always clear whether the species observed in the NMR spectra are representative of the
whole sample, or whether they comprise a small subset of the spins that are present in the least
distorted local environments. This is particularly important when obtaining 27Al NMR spectra
of dehydrated zeolites, where a large fraction of the sample is not always detected. Careful spin
counting has also been shown to be important in 23Na NMR. For example, in the assignment of
the 23Na spectra of faujasite zeolites, the concentrations of the different extraframework cation
sites were shown to be very close to those obtained from diffraction data, after the intensities
were scaled to account for the differences in the QCCs of the different sites (203).Typically, spin counting is performed by comparing the intensity of the isotropic
resonance in a spectrum of a sample of known weight, with the intensity from a standard
sample whose spectrum was acquired under identical conditions. The theoretical intensity of
each of the transitions can be calculated from Eq. (9) and will depend on I. Those for the central
transition are shown in Table 3. Unfortunately, the total number of spins that contribute to the
isotropic resonance will depend on the QCC. Three regimes can be identified:
ðiÞ NQ ¼ 0
This will be the case, for example, in liquids, for nuclei in sites with cubic site symmetry,
or for mobile species (e.g., hydrated cations in molecular sieves). In this case, all transitions
Table 3 Intensity of Central
Transition of a Noninteger Spin
Quadrupolar Nucleus as a
Percentage of Total Intensity
Spin Intensity (%)
3/2 40
5/2 26
7/2 19
9/2 15
Copyright © 2003 Marcel Dekker, Inc.

will be excited, and the center band, in the absence of other anisotropic interactions, will
contain intensity from 100% of the spins.
ðiiÞ 0 < NQ2 < NLNr
This is typically the case for 23Na and 7Li. Spinning sidebands from the satellite transitions are
now visible, and the contribution of these satellites to the isotropic resonance needs to be
estimated. Since the spinning speed is greater than the static linewidth of the central transition
(as NQ2/NLNr < 1), the contribution to the intensity of the spinning sidebands from the
central transition will be small, and can often be ignored. Note that other interactions, such as
the CSA or dipolar coupling, may result in intensity in the sidebands. Fast spinning will
clearly increase the intensity of the central transition in the center band (i.e., isotropic
resonance) but will also increase the contribution of the satellites to the center band. Both
contributions can be conveniently estimated with the graphical method proposed by Massiot
et al. (204) or by simulation. The sideband intensities from the satellite transitions are often
fairly constant close to the center band, allowing the contribution to the center band to be
estimated from the intensity of other nearby sidebands. Having obtained the absolute intensity
of the central transition resonance, the total number of spins in the sample can then be
calculated from Table 3.
ðiiiÞ Nr << NQ
The contribution of the outer satellites to the center band can be considered negligible when
NQ is two or more orders of magnitude greater than Nr. This is often the case for 27Al NMR. In
some cases, the outer satellites are not even observed due to poor setting of the magic angle,
insufficient signal-to-noise, or ionic motion of the nucleus. However, a significant concen-tration of the central transition may now be present in the sidebands. This may be accounted
for by integration of the whole resonance, including sidebands (if interference from the outer
satellites is not a problem). In instances where outer satellites are observed, it is often easier to
use the graphical method of Massiot et al. or to simulate the spectra.
7. Cross-polarization of Noninteger Spin Nuclei
Cross-polarization from an abundant I = 1/2 spin such as 1H or 19F to a quadrupolar nucleus, S,
is accomplished by matching the nutation frequencies of the two spins I and S (the Hartmann-
Hahn condition) during the contact time of the cross-polarization experiment (Fig. 2). As
discussed earlier, the nutation frequency of noninteger spins depends on Q V, and two differentHartmann-Hahn conditions apply for large and small Q V:
ðaÞ N1S ¼ N1I ðj QV j<< N1SÞðbÞ ðS þ 1=2ÞN1S ¼ N1I ðj QV j>> N1SÞ ð18Þ
As for single-pulse excitation, case a applies when the whole quadrupole spectrum is
excited, whereas case b applies when the isolated fictitious spin-1/2 system is excited. In the
intermediate regime, |Q V|cN1S, and a range of nutation frequencies is observed; thus, the
Hartmann-Hahn condition is poorly defined in this regime.
Continuous on- or close-to-resonance irradiation (i.e., the spin-locking fields) is appliedto both nuclei during the contact time. The outer satellite transitions for large QCCs (i.e., case
b) are unaffected by the rf field, N1, in the absence of MAS, and S-spin magnetization buildup
occurs along the direction of the spin-locking field for the central transition coherence only.
Additional complications arise under conditions of MAS, which may also result in inefficient
Copyright © 2003 Marcel Dekker, Inc.

CP (54,205,206). These arise from the time dependence in Q V introduced by the sample
spinning. Q V(t) depends on the orientation of the quadrupolar tensor (Vxx, Vyy, Vzz) with respect
to the static magnetic field (defined by the polar angles u and f). This orientation varies
continuously under MAS and Q V(t) oscillates between positive and negative values (Fig. 17),
with Q’ crossing through zero two or four times per rotor period, depending on the relative
orientation of the quadrupolar tensor and the rotor axis (the zero crossings).
A clearer understanding of the effect of MAS can be obtained by considering Fig. 17b,
which shows a plot of the eigenvalues and eigenstates of an I = 3/2 nucleus as a function of Q Vfor close-to-resonance irradiation. For large values of |Q V| the eigenstates are given by {|1/2>
F |�1/2>} and |F3/2>, and spins present in these states are said to be spin locked. Under
MAS, Q V varies continuously. Near the zero crossings of Q’, N1 is greater than |Q V|, and the rf
field induces transitions between all |m> Zeeman levels. A sweep from -Q V to +Q V, for
example, results in a smooth conversion of the central transition coherences {|1/2> F |-1/2>}
to the outer Zeeman levels |F3/2>. If this sweep is performed sufficiently slowly (i.e., is
adiabatic), all of the spins that populate the central transition coherences {|1/2> F |�1/2>}
are transferred to the |F3/2> states. Similarly, the populations in the |F3/2> states are
transferred to the central transition coherences. In contrast, a very fast sweep will leave the
Fig. 17 (a) Plots of the variation of Q V as a function of time in the rotor period, for NQ = 1 MHz, and two
different values of h; D = 0 and the initial orientation of the quadrupolar tensor at time = 0 is chosen such
that the rotation axis, B0 and Vzz all lie in the same plane. (b) The eigenvalues for an I = 3/2 nucleus as a
function of Q V, for close to on-resonance irradiation. The eigenstates for large Q V are marked.
Copyright © 2003 Marcel Dekker, Inc.

populations unchanged in their original states. A sweep performed at some intermediate rate
will result in the transfer of populations into non-spin-locked coherences. Magnetization
associated with these coherences decays rapidly. An adiabaticity parameter for the zero
crossing, aV, can be defined for a powder (206), which gives a measure of the efficiency of
the population transfers:
aV ¼ N21=NrNQ ð19Þ
Fast, intermediate, and adiabatic passages occur for aV << 1, aVc 0.4, and aV >1, respectively.Magnetization builds up in one of the spin-locked coherences {|1/2> F |�1/2>}, during
the spin-locking period of the CP experiment, assuming the Hartmann-Hahn condition is
adequately matched. Under MAS, however, the magnetization will not necessarily remain in
this coherence. Very slow MAS (i.e., adiabatic passages) results in the transfer of the magnet-
ization into the |F3/2> states at the zero crossings for Q V. At the next zero crossing, all of the
magnetization returns to the {|1/2> F |�1/2>} and no magnetization is lost. This will be the
case at the end of a rotor period, where an even number of crossings will have occurred. CP
for values of aV in the intermediate regime will result in a rapid decay of the spin-locked
magnetization, and inefficient or no CP. Fast MAS will leave the magnetization associated
with the {|1/2> F |�1/2>} coherence unaffected, and CP will again be efficient. The effect ofMAS on the spin-locked magnetization has been demonstrated experimentally by Vega (205).
In conclusion, obtaining CP spectra of noninteger spin nuclei is not necessarily
straightforward, even if the Hartmann-Hahn condition is matched. As a result, the inability
to transfer magnetization from I = 1/2 to quadrupolar S spins does not necessarily indicate that
the S spins are not dipolar-coupled to the I spins, but the converse (i.e., the detection of S-spin
magnetization) can be used to demonstrate the proximity of S and I spins. It is relatively
straightforward to calculate aV and to determine the conditions required for efficient CP. In
general, it is easier to perform the experiment in the fast regime (aV << 1), and 19F/23Na and31P/27Al experiments have been performed, e.g., to characterize gas binding and zeolite
structure under these conditions (88,100,168). The passages between Zeeman levels have also
been shown to be important in the CP/DOR experiments (207) and in double-resonance
experiments such as TRAPDOR and REAPDOR (see below) (54,96,208). For a fuller
description of the effect of adiabatic passages on spin locking and CP, the reader is referred
to the two papers by Vega (205,206).
B. Double-Resonance and Two-Dimensional NMR Experimentsfor Structure Elucidation
The information that can be obtained from the NMR experiment can be considerably enhanced
if the interactions that exist between the NMR nuclei of interest and other, nearby NMR spins
(i.e., NMR-active nuclei) can be exploited. These interactions can be used either to probe
connectivity (i.e., establish that chemical bonds are present) or to measure the distances between
atoms. The methods can be used to help develop three-dimensional models of the zeolite
structure so as to determine where molecules bind in zeolites or, at the simplest level, to aid in
the assignment of NMR resonances. If the experiment can be performed in a two-dimensional
fashion, it is often possible to establish connectivities between different atoms simultaneously,
sometimes allowing structural models for, say, the whole zeolite framework to be obtained in a
single experiment.
The experiments can be divided into two main categories. In the first set of experi-
ments, connectivity or distances between different types of nuclei (e.g., 29Si and 27Al) are
probed. These exploit heteronuclear couplings between nuclei and are often referred to as
Copyright © 2003 Marcel Dekker, Inc.

‘‘double-resonance’’ experiments, since the experiments require that rf pulses be applied,
often simultaneously, to both sets of nuclei. In the second set, ‘‘homonuclear’’ couplings
between the same types of nuclei (e.g., between two different 29Si nuclei in two differentzeolite framework sites) are measured. Both the heteronuclear and homonuclear experiments
may then be further divided into two categories, depending on the type of interaction that
couples the two sets of nuclei. One class of experiments exploits the J-coupling interaction
and requires that the nuclei of interest are separated by typically one or two chemical bonds.
The J coupling is an example of a ‘‘through-bond’’ interaction, since it is a measure of the
coupling between two nuclei, mediated via the intervening atomic (or molecular) orbitals.
Experiments based on this interaction can, therefore, be used to measure connectivity. The
size of the J coupling typically decreases extremely rapidly as a function of the number of
bonds between the nuclei (unless extended k systems are present) limiting the length scales
that can be probed with this method. Two nearby nuclei are also coupled by the ‘‘through-
space’’ dipolar coupling interaction. This interaction is typically much larger than the J
coupling (particularly for two- or three-bond J coupling) but, unlike the (isotropic part) of
the J-coupling interaction, it is removed by MAS. Experiments have, however, been
designed to reintroduce this interaction under MAS (see below). Since the size of this
interaction is proportional to 1/r3, (Fig. 18) where r is the internuclear separation between
the two spins, the internuclear distances between two atoms may be directly extracted from a
measurement of the dipolar coupling the between the two nuclei. The dipolar experiments
are complementary to those that exploit J coupling because the measurement of a short
internuclear distance does not necessarily indicate that a chemical bond(s) connects the two
atoms under investigation.
1. The Dipolar Interaction
Each nucleus creates its own local (magnetic) field in the presence of the larger external field(Fig. 18); nearby nuclei are affected by this field, which, depending on angle between the vectorconnecting the two spins and the direction of the static magnetic field (u), can reduce or
increase the total magnetic field felt by the nearby nucleus. This produces a shift of the NMR
resonance to lower or higher frequency depending on u, as can be seen from the expression for
the dipolar coupling Hamiltonian between two different nuclei, I and S:
HD ¼ �Dð3 cos u� 1ÞIzSz ð20Þ
Fig. 18 The dipolar coupling interaction between two spin-1/2 nuclei, I and S. In (a), the I spin is
coupled to the S |+1/2> state, while in (b), I is coupled to the |�1/2> state. The arrows on the two nuclei
represent magnetization vectors oriented along the direction of the static magnetic field, B0.
Copyright © 2003 Marcel Dekker, Inc.

D is the dipolar coupling constant (in hertz) and is given by gIgSh/2kr3. gI and gS are the
gyromagnetic ratio of the I and S nuclei and h is Planck’s constant. Thus, the dipolar coupling
constants will be greatest and easiest to measure for coupling involving nearby nuclei with
large values of g (e.g., 1H and 31P). The operator IzSz in Eq. (20) indicates that the interaction
involves a coupling between the I- and S-spin magnetization oriented along the direction of the
static magnetic field (defined by convention as the z direction). The angular dependence of this
interaction, (3 cos u - 1), is identical to that observed earlier for the first-order quadrupolarinteraction, when D = 0, i.e., the dipolar interaction can also be written in terms of a second-
order Legendre polynomial, P2(cos u). This holds true for all interactions that can be described
by a second-rank tensor (e.g., chemical shift anisotropy).
2. Direct Measurements of Dipolar Couplings from the NMR Spectrum
The dipolar coupling between two sets of spin-1/2 nuclei (I and S) gives rise to a
characteristic static spectrum for the powder (a so-called powder pattern) called a Pake
doublet. The shape arises because each I spin has an essentially equal probability of being
coupled to a ‘‘spin-up’’ or ‘‘spin-down’’ S spin (i.e., the S |+1/2> and |�1/2> states) (shown
schematically in Fig. 18a and b). (Note the difference in spin populations between the
|+1/2> and |�1/2> states is very small; nonetheless it is this difference in populations that gives
rise to the small net magnetization that is detected in the NMR experiment in the sample coil.)
As was discussed previously for the quadrupolar interaction, the dipolar coupling may also be
removed by sufficiently fast MAS. Slow MAS will result in characteristic sideband patterns,
which may be simulated to extract values for the dipolar coupling and hence the internuclear
distance. For example, a 31P-1H dipolar-coupling constant of 17.5 kHz was measured by
simulating the 1H MAS NMR sidebands observed for deuterated TMP adsorbed on HY (151).
The measured coupling constant is consistent with a distance of 1.4 A and indicated that a
transfer of the acidic protons from the framework to the sorbed probe molecule to form TMPH+
had occurred. In practice, this approach tends only to be feasible for couplings involving
directly bound atoms because the analysis of the sidebands becomes much less straightforward
when additional anisotropic interactions of similar magnitudes need to be included in the
simulation. For example, the spinning sidebands in the 31P spectra of the same system could
only be well reproduced in a simulation when the 31P CSA of the TMPH+ phosphorus atom was
included (along with the dipolar coupling) in the simulation (209).
3. Experiments Designed to Measure Dipolar Coupling
A different approach needs to be taken to measure distances involving smaller dipolar
couplings. The majority of these experiments are based on the SEDOR NMR experiment
developed by Hahn et al. in the 1950s (Fig. 19) (210). The experiment is performed by applying
a spin-echo experiment to one set of nuclei. In the normal spin-echo experiment, the magnet-
ization evolves in the x-y plane, following the first k/2 pulse, under the influence of a number
of interactions (e.g., the chemical shift and the dipolar coupling interactions). The k pulse
applied at the end of the ‘‘evolution period’’ serves to refocus the magnetization and an echo is
formed at the end of the ‘‘refocusing period.’’ For example, magnetization represented by the
operator Iy evolves under the dipolar Hamiltonian at a frequency given in angular units by ND =
2kD(3cosu - 1) to produce the coherence represented by the operator IxSz. That is, the
coherence IxSz, which now involves both the I and S spins, has been created by the dipolar
coupling interaction. The magnetization appears to decay because different spins in the
powdered sample are associated with different values of u. A (k)y pulse applied to the I spins
now converts the Ix term of the operator IxIz to -Ix, so that the overall term changes in sign.
Copyright © 2003 Marcel Dekker, Inc.

Fig. 19 The SEDOR experiment involving two sets of spins I and S. The spin-echo experiment is shown
in (a), which serves as the control experiment. The double resonance experiment is shown in (b), where a
k pulse is now applied to the S-spin channels.
Copyright © 2003 Marcel Dekker, Inc.

The I-spin magnetization continues to evolve in the same direction, but the effect is now to
refocus the magnetization to produce an echo. This is shown schematically in Fig. 19 by using
both the operator and magnetization vector description.
The experiment is modified in the SEDOR experiment by simultaneously applying a
second pulse simultaneously to the S spins. This k pulse now inverts the S-spin magnet-
ization (which can be represented by Sz), i.e., Sz ! -Sz. Thus, the magnetization of the I-S
coupled I spins continues to evolve in the same direction and appears to be unaffected by
the application of the two k pulses, no longer refocusing to form an echo. Other I spins that
are not coupled to nearby S spins will be refocused by the k pulses, forming an echo. The
loss of intensity at the I-spin intensity at the echo is then measured as a function of the
evolution time. The larger the dipolar coupling constant, the more rapidly the echo intensity
decays, as the evolution period is increased. This effect can be readily calculated using
expressions derived using the operator notation shown in Fig. 19 and the dipolar coupling
constant extracted.
a. REDOR
The REDOR experiment is the MAS variant of the SEDOR experiment, as it is designed to
reintroduce the dipolar coupling removed by the MAS (211). Since MAS works by refocusing
the signal or magnetization every rotor period (i.e., when the rotor has made one complete
evolution), k pulses are now introduced half-way through the rotor period to prevent the
refocusing. In order to prevent the dephasing that has occurred in one rotor period from being
refocused in the next rotor period, k pulses are also inserted at the end of every rotor period. For
example, the 27Al/31P REDOR pulse sequence used to study the interaction with the base TMP
with the zeolite framework is shown in Fig. 20. The 27Al spins were monitored by applying
short pulses to ensure that the whole solid sample was uniformly excited. This represents one of
the three main REDOR pulse sequences; for more details, the reader is referred to two review
articles (86,212). The TEDOR NMR experiment is a variant of the REDOR experiment that
uses the REDOR pulse sequence to transfer magnetization from one set of coupled spins to the
other, allowing the REDOR experiment to be performed in a two-dimensional fashion (213).
Fig. 20 The 27Al/31P REDOR NMR sequence. A spin echo is applied to the 27Al spins, while k pulses
are applied to the 31P spins. 1H decoupling may also be applied.
Copyright © 2003 Marcel Dekker, Inc.

b. TRAPDOR (Transfer of Populations in Double-Resonance) NMR
This experiment is designed to measure dipolar coupling involving one (or more) quadrupolar
nuclei, by making use of the population transfers (discussed in detail for the CP experiment)
that occur between the Zeeman levels of a quadrupolar nucleus under conditions of slow MAS
and continuous rf irradiation of the quadrupolar nucleus, S (54,55). For example, in 1H/27Al
TRAPDOR NMR (Fig. 21), 27Al irradiation is applied during the evolution period of the 1H
spin-echo experiment. The population transfers between the S spin (27Al) Zeeman levels alter
the evolution of the dipolar coupled I = 1/2 (1H) magnetization and prevent refocusing of the 1H
magnetization at the spin echo, causing a TRAPDOR ‘‘effect.’’ As in the REDOR and SEDOR
experiment, the TRAPDOR fraction, defined as (1 - I/I0), where I and I0 are the intensities at thespin echo with and without irradiation of the S spins, will depend on the dipolar coupling
between spins: the greater the dipolar coupling, the greater the dephasing of the I spins, and
thus the greater the TRAPDOR effect. Slower spinning ensures that the passages between the S
spins are closer to being adiabatic, resulting in more efficient population transfers and a larger
TRAPDOR fraction. Values of aV > 1 [where a’ was defined in Eq. (19)] ensure that most of the
passages that occur for the whole powder sample are adiabatic, but even values for aV as low as
0.27 have been shown to give significant TRAPDOR dephasing in the 1H/27Al TRAPDOR
experiment (55).
A TRAPDOR effect can only be determined if the S-spin irradiation frequency lies within
the S-spin (e.g., 27Al) first-order quadrupole spectrum. Thus, the size of the QCC for the
quadrupolar nucleus, S, can be estimated by mapping out the intensity of the I echo, as a
function of the S irradiation frequency offset, and determining where the TRAPDOR fraction
drops to zero (55). For I = 5/2 nuclei, the edge of the first-order quadrupole spectrum occurs at
F2rQ = (3/10) QCC.
The TRAPDOR NMR experiment can be applied to probe internuclear distances in two
situations where the REDOR NMR experiment may prove difficult. First, the TRAPDOR
experiment can detect dipolar coupling to ‘‘invisible’’ spins. Second, the TRAPDOR experi-
ment is designed to measure coupling involving quadrupolar nuclei, where it is not often
possible to use a k pulse to excite the whole sample. The dipolar coupling measured in
the TRAPDOR experiment is larger than that measured in the REDOR experiment because the
TRAPDOR experiment probes the coupling to spins in all the Zeeman levels of the
quadrupolar nucleus. Hence, the TRAPDOR experiment may be more sensitive to longer
range dipolar couplings.
Fig. 21 The 1H/27Al TRAPDOR NMR pulse sequence. The intensities (at the echo) are determined with
(I) and without (I0)27Al irradiation.
Copyright © 2003 Marcel Dekker, Inc.

c. REAPDOR (Rotational Echo and Adiabatic Passages Double Resonance) NMR
This experiment involves a combination of the TRAPDOR and REDOR methods (96). This
experiment does not require multiple rotor periods of S-spin irradiation to detect weak I-S
coupling (cf. TRAPDOR), and consequently the REAPDOR fractions are simpler to calculate
(208). The REAPDOR dephasing is also less sensitive to the relative orientation between the
QCC and dipolar tensors. Thus, this experiment typically yields more accurate internuclear
distances than can be obtained from the TRAPDOR experiment.
4. Two-Dimensional NMR Studies of Framework ConnectivitiesBased on J Coupling
The ability to resolve the different T sites in a zeolite framework allowed two-dimensional
NMR experiments to be employed to probe the proximity between different sites. These two-
dimensional experiments, and their one-dimensional variants, require a method or interaction
that connects the different sites (or NMR-active nuclei). Experiments based on the J coupling
have been most widely used to study zeolites (1). The basic 29Si COSY and CP-COSY
sequences are shown schematically below. The ‘‘(CP)’’ pulse length (the contact time) is
optimized for maximal 1H ! 29Si polarization transfer.
COSY : 29Si : ðp=2Þ � t1 � ðp=2Þ � t2ðacqÞ::CP� COSY 1H : ðp=2Þx ðCPÞy
29Si : ðCPÞ � t1 � ðp=2Þ � t2ðacqÞ::The Hamiltonian that describes the J-coupling interaction has the form HJ = �2kJI1zI2z, whereI1 and I2 represent two different 29Si nuclei that are coupled via J coupling of size J (measured
in hertz). Thus the magnetization will evolve during the t1 and t2 periods under the
Hamiltonian, HJ (and the Hamiltonians that describe the chemical shifts of the two nuclei).
For example, the ‘‘x-y’’ magnetization due to the I1 nucleus that is produced following an initial
(k/2)x pulse (or via the CP sequence) (I1x or I1y) will evolve under HJ to form coherences
represented by operators of the form I1yI2z. The second k/2 pulse will convert this coherence to
-I1zI2y. This coherence then evolves in the t2 period to produce observable I2 spin magnetization
(i.e., I2x). Hence, this sequence converts I1 spin magnetization to I2 spin magnetization (and
vice versa) for two sets of spins that are connected via the J coupling. This produces a cross-
peak in the two-dimensional spectrum connecting resonances from the I1 and I2 spins. The
INADEQUATE variant of the experiment has also been used to study zeolites (27,28,90). This
is a less sensitive experiment since it involves the creation of double-quantum coherences.
However, no ‘‘diagonal’’ peaks are seen in the two-dimensional experiment allowing coupling
between spins with very similar (or identical) chemical shifts to be resolved.
V. CONCLUSIONS
This chapter has outlined many of the varied NMR experiments that have been applied to study
zeolite structure, gas binding, and reactivity. Each experiment, particularly if combined with
another technique, or a series of other NMR experiments, can result in extremely detailed
chemical and/or structural information. New NMR experiments have permitted increasingly
higher resolution spectra to be obtained, even in the presence of considerable disorder. By
exploiting J or dipolar coupling, three-dimensional models of structure may be built up; these,
coupled with diffraction experiments, are playing an increasingly important role in definingstructure. Methods for studying catalytic reactions under increasingly realistic conditions have
Copyright © 2003 Marcel Dekker, Inc.
been developed and continue to be improved. These can now be used to determine in situ the
species inside the pores of the zeolites, information that is difficult to obtain directly from other
methods. The types of information that can be obtained by NMR, and the role that NMR plays
in characterizing zeolites, can be expected to increase.
ACKNOWLEDGMENTS
I thank current and former members of my research group who have contributed to much of what
I have discussed in this chapter. Particular thanks go to Jennifer Readman, Hsien-Ming Kao,
Haiming Liu, Kwang-Hun Lim, Michael Ciraolo, and Peter Chupas. The unpublished (17O
NMR) work discussed in this chapter was performed under the support of the Department of
Energy, Basic Energy Sciences (DE-FG02-96ER14681). Alexander Vega is thanked for many
helpful discussions and insightful comments over the last decade.
REFERENCES
1. CA Fyfe, Y Feng, H Grondey, GT Kokotailo, H Gies. Chem Rev 91:1525, 1991.
2. J Klinowski. Anal Chim Acta 283:929, 1993.
3. E Lippmaa, M Magi, A Samoson, G Engelhardt, AR Grimmer. J Am Chem Soc 102:4889, 1980.
4. E Lippmaa, M Magi, A Samoson, M Tarmak, G Engelhardt. J Am Chem Soc 103:4992, 1981.
5. J Klinowski, S Ramdas, JM Thomas, CA Fyfe, JS Hartman. J Chem Soc Faraday Trans II 78:1025,
1982.
6. JM Thomas, CA Fyfe, S Ramdas, J Klinowski, GC Gobbi. J Phys Chem 86:3061, 1982.
7. G Engelhardt, U Lohse, E Lippmaa, M Tarmak, M Magi. Z Anorg Allg Chem 478:239, 1981.
8. JM Thomas, J Klinowski, S Ramdas, BK Hunter, DTB Tennakoon. Chem Phys Lett 102:158, 1983.
9. JV Smith, CS Blackwell, GL Hovis. Nature 309:140, 1984.
10. JV Smith, CS Blackwell. Nature 303:223, 1983.
11. JB Higgins, DE Woessner. EOS Trans Am Geophys Union 63:1139, 1983.
12. R Radeglia, G Engelhardt. Chem Phys Lett 114:28, 1985.
13. S Ramdas, J Klinowski. Nature 308:521, 1984.
14. LM Bull, B Bussemer, T Anupold, A Reinhold, A Samoson, J Sauer, AK Cheetham, R Dupree.
J Am Chem Soc 122:4948, 2000.
15. G Valerio, A Goursot, R Vetrivel, DR Salahub. Micropor Mesopor Mater 30:111, 1999.
16. G Valerio, A Goursot, R Vetrivel, O Malkina, V Malkin, DR Salahub. J Am Chem Soc 120:11426,
1998.
17. B Bussemer, KP Schroder, J Sauer. Solid State Nucl Magn Reson 9:155, 1997.
18. H Hamdan, B Sulikowski, J Klinowski. J Phys Chem 93:350, 1989.
19. EF Rakiewicz, KT Mueller, TP Jarvie, KJ Sutovich, TG Roberie, AW Peters. Micropor Mater 7:81,
1996.
20. CA Fyfe, GC Gobbi, J Klinowski, JM Thomas, S Ramdas. Nature 296:530, 1982.
21. CA Fyfe, H Strobl, GT Kokotailo, GJ Kennedy, GE Barlow. J Am Chem Soc 110:3373, 1988.
22. CA Fyfe, GJ Kennedy, CT DeSchutter, GT Kokotailo. J Chem Soc Chem Commun 541, 1984.
23. CA Fyfe, H Gies, Y Feng. J Am Chem Soc 111:7702, 1989.
24. CA Fyfe, H Gies, Y Feng, GT Kokotailo. Nature 341:223, 1989.
25. CA Fyfe, H Grondey, Y Feng, GT Kokotailo. J Am Chem Soc 112:8812, 1990.
26. CA Fyfe, Y Feng, H Gies, H Grondey, GT Kokotailo. J Am Chem Soc 112:3264, 1990.
27. CA Fyfe, Y Feng, H Grondey, GT Kokotailo, A Mar. J Phys Chem 95:3747, 1991.
28. CA Fyfe, H Grondey, Y Feng, GT Kokotailo, S Ernst, J Weitkamp. Zeolites 12:50, 1992.
29. CA Fyfe, H Gies, Y Feng. J Chem Soc Chem Commun 1240, 1989.
30. H Koller, A Wolker, LA Villaescusa, MJ Diaz-Cabanas, S Valencia, MA Camblor. J Am Chem Soc
121:3368, 1999.
31. DF Shantz, RF Lobo. Chem Mater 10:4015, 1998.
Copyright © 2003 Marcel Dekker, Inc.

32. DF Shantz, RF Lobo. J Am Chem Soc 120:2482, 1998.
33. DF Shantz, RF Lobo. J Phys Chem B 103:5920, 1999.
34. DF Shantz, JS auf der Gunne, H Koller, RF Lobo. J Am Chem Soc 122:6659, 2000.
35. S-H Park, JB Parise, H Gies, H Liu, CP Grey, BH Toby. J Am Chem Soc 122:11023, 2000.
36. S-H Park, P Daniels, H Gies. Micropor Mesopor Mater 37:129, 2000.
37. HH Cho, SH Kim, YG Kim, YC Kim, H Koller, MA Camblor, SB Hong. Chem Mater 12:2292,
2000.
38. MA Camblor, ME Davis. J Phys Chem 98:13151, 1994.
39. MA Camblor, RF Lobo, H Koller, ME Davis. Chem Mater 6:2193, 1994.
40. GJ Johnson, PJ Mead, SE Dann, MT Weller. J Phys Chem 104:1454, 2000.
41. IL Moudrakovski, A Sayari, CI Ratcliffe, JA Ripmeester, KF Preston. J Phys Chem 98:10895,
1994.
42. A Sayari, I Moudrakovski, C Danumah, CI Ratcliffe, JA Ripmeester, KF Preston. J Phys Chem
99:16373, 1995.
43. A Labouriau, KC Ott, J Rau, WL Earl. J Phys Chem B 104:5890, 2000.
44. G Ricchiardi, J Sauer. Z Phys Chem-Int J Res Phys Chem Chem Phys 209:21, 1999.
45. D Freude, J Haase. In: NMR Basic Principles and Progress. Berlin: Springer-Verlag, 1993, Vol 29,
p 1.
46. DR Corbin, RD Farlee, GD Stucky. Inorg Chem 23:2920, 1984.
47. MF Ciraolo, P. Norby, JC Hanson, DR Corbin, CP Grey. J Phys Chem B 103:346, 1999.
48. L Frydman, JS Harwood. J Am Chem Soc 117:5367, 1995.
49. A Medek, JS Harwood, L Frydman. J Am Chem Soc 117:12779, 1995.
50. C Fernandez, J-P Amoureux. Chem Phys Lett 242:449, 1995.
51. PR Bodart, JP Amoureux, M Pruski, A Bailly, C Fernandez. Magn Reson Chem 37:S69, 1999.
52. H Ernst, D Freude, I Wolf. Chem Phys Lett 212:588, 1993.
53. H Koller, EL Meijer, RA van Santen. Solid State NMR 9:165, 1997.
54. CP Grey, AJ Vega, WS Veeman. J Chem Phys 98:7711, 1993.
55. CP Grey, AJ Vega. J Am Chem Soc 117:8232, 1995.
56. H-M Kao, CP Grey. J Phys Chem 100:5105, 1996.
57. HM Kao, CP Grey. Chem Phys Lett 259:459, 1996.
58. APM Kentgens, D Iuga, M Kalwei, H Koller. J Am Chem Soc 123:2925, 2001.
59. CA Fyfe, JL Bretherton, LY Lam. J Am Chem Soc 123:5285, 2001.
60. SMC Menezes, VL Camorim, YL Lam, RAS San Gil, A Bailly, JP Amoureux. Appl Catal A
207:367, 2001.
61. C Fild, H Eckert, H Koller. Angew Chem 37:2505, 1998.
62. G Engelhardt, D Michel. High-Resolution Solid State NMR of Silicates and Zeolites. Chichester:
John Wiley & Sons, 1987.
63. D Padro, AP Howes, ME Smith, R Dupree. Solid State NMR 15:231, 2000.
64. A Labouriau, WL Earl. Chem Phys Lett 270:278, 1997.
65. KFGJ Scholle, WS Veeman. Zeolites 5:118, 1985.
66. E Brunner, D Freude, M Hunger, H Pfeifer, W Reschetilowski, B Unger. Chem Phys Lett 148:226,
1988.
67. RF Lobo, ME Davis. J Am Chem Soc 117:3766, 1995.
68. C Fild, H Eckert, H Koller. J Am Chem Soc 122:12590, 2000.
69. C Fild, DF Shantz, RF Lobo, H Koller. Phys Chem Chem Phys 2:3091, 2000.
70. HKC Timken, E Oldfield. J Am Chem Soc 109:7669, 1987.
71. F Taulelle, A Samoson, T Loiseau, G Ferey. J Phys Chem B 102: 8588, 1998.
72. S-H Park, M Kleinsorge, CP Grey, JB Parise. J Solid State Chem 167:310, 2002.
73. OB Lapina, VM Mastikhin, AA Shubin, VN Krasilnikov, KI Zamaraev. Prog NMR Spectrosc
24:457, 1992.
74. S Dzwigaj, M Matsuoka, M Anpo, M Che. Catal Lett 72:211, 2001.
75. T Sen, PR Rajamohanan, S Ganapathy, S Sivasanker. J Catal 163:354, 1996.
76. Z Xu, JF Stebbins. Solid State NMR 11:243, 1998.
Copyright © 2003 Marcel Dekker, Inc.

77. UT Pingel, JP Amoureux, T Anupold, F Bauer, H Ernst, C Fernandez, D Freude, A Samoson. Chem
Phys Lett 294:345, 1998.
78. LM Bull, AK Cheetham, T Anupold, A Reinhold, A Samoson, J Sauer, B Bussemer, Y Lee, S
Gann, J Shore, A Pines, R Dupree. J Am Chem Soc 120:3510, 1998.
79. JE Readman, M Ziliox, N Kim, CP Grey. Chem Commun 2808, 2002.
80. Z Xu, JF Stebbins. Geochim. Cosmochim Acta 62:1803, 1998.
81. Y Wu, BQ Sun, A Pines, A Samoson, E Lippmaa. J Magn Reson 89:297, 1990.
82. A Samoson, E Lippmaa, A Pines. Mol Phys 65:1013, 1988.
83. KT Mueller, BQ Sun, CG Chingas, JW Zwanziger, T Terao, A Pines. J Magn Reson 86:470, 1990.
84. AV Larin, DP Vercauteren. Int J Quantum Chem 82:182, 2001.
85. ERH van Eck, WS Veeman. Solid State NMR 1:1, 1992.
86. T Gullion, J Schaefer. Adv Magn Reson 13:57, 1989.
87. AW Hing, S Vega, J Schaefer. J Magn Reson 96:205, 1992.
88. CA Fyfe, KC Wongmoon, Y Huang, H Grondey, KT Mueller. J Phys Chem 99:8707, 1995.
89. CA Fyfe, KC Wong-Moon, Y Huang, H Grondey. J Am Chem Soc 117:10397, 1995.
90. CA Fyfe, DH Brouwer, AR Lewis, JM Chezeau. J Am Chem Soc 123:6882, 2001.
91. CA Fyfe, AR Lewis, JM Chezeau, H Grondey. J Am Chem Soc 119:12210, 1997.
92. NP Kenaston, AT Bell, JA Reimer. J Phys Chem 98:894, 1994.
93. SL Hu, JA Reimer, AT Bell. J Phys Chem B 101:1869, 1997.
94. HG Niessen, M Van Buskirk, C Dybowski, DR Corbin, JA Reimer, AT Bell. J Phys Chem
105:2945, 2001.
95. HM Kao, CP Grey, K. Pitchumani, PH Lakshminarasimhan, VJ Ramamurthy. Phys Chem A
102:5627, 1998.
96. T Gullion. J Magn Reson A 117:326, 1995.
97. S Ganapathy, S Vega. J Am Chem Soc 120:1078, 1998.
98. Y Ba, J He, CI Ratcliffe, JA Ripmeester. J Am Chem Soc 121:8387, 1999.
99. CA Fyfe, AR Lewis. J Phys Chem B 104:48, 2000.
100. KH Lim, CP Grey. J Chem Soc Chem Commun 2257, 1998.
101. KH Lim, F Jousse, S Auerbach, CP Grey. J Phys Chem 105:9818, 2001.
102. M Feuerstein, M Hunger, G Engelhardt, JP Amoureux. Solid State NMR 7:95, 1996.
103. R Jelinek, S Ozkar, HO Pastore, A Malaek, GA Ozin. J Am Chem Soc 115:563, 1993.
104. R Jelinek, A Malaek, GA Ozin. J Phys Chem 99:9236, 1995.
105. H Koller, AR Overweg, RAV Santen, JWD Haan. J Phys Chem 101:1754, 1997.
106. M Hunger, G Engelhardt, H Koller, J Weitkamp. Solid State NMR 2:111, 1993.
107. KN Hu, LP Hwang. Solid State NMR 12:211, 1998.
108. M Hunger, P Sarv, A Samoson. Solid State NMR 9:115, 1997.
109. KH Lim, CP Grey. J Am Chem Soc 122:9768, 2000.
110. S Caldarelli, A Bucholz, M Hunger. J Am Chem Soc 123:7118, 2001.
111. AN Fitch, H Jobic, A Renouprez. J Phys Chem 90:1311, 1986.
112. WJ Mortier. Compilation of Extraframework Sites in Zeolites. London: Butterworth-Heineman,
1982.
113. DH Olson. Zeolites 15:439, 1995.
114. WJ Mortier, EVD Bossche, JB Uytterhoeven. Zeolites 4:41, 1984.
115. G Engelhardt. Micropor Mater 12:369, 1997.
116. CP Grey, FI Poshni, AF Gualtieri, P Norby, JC Hanson, DR Corbin. J Am Chem Soc 119:1981,
1997.
117. CJ Jameson. In: J. Mason, ed. Multinuclear NMR. New York: Plenum, 1987, p 51.
118. H Koller, B Burger, AM Schneider, G Engelhardt, J Weitkamp. Micropor Mater. 5:219, 1995.
119. P Norby, FI Poshni, AF Gualtieri, JC Hanson, CP Grey. J Phys Chem B 102:839, 1998.
120. M Hunger, U Schenk, A Buchholz. J Phys Chem B 104:12230, 2000.
121. RJ Accardi, RF Lobo. Micropor Mesopor Mater 40:25, 2000.
122. M Feuerstein, RF Lobo. Chem Commun 1647, 1998.
123. M Feuerstein, RF Lobo. Solid State Ionics 118:135, 1999.
Copyright © 2003 Marcel Dekker, Inc.

124. M Feuerstein, RJ Accardi, RJ Lobo. J Phys Chem B 104:10282, 2000.
125. J Plevert, LC de Menorval, FD Renzo, F Fajula. J Phys Chem B 102:3412, 1998.
126. RJ Accardi, RF Lobo, M Kalwei. J Phys Chem B 105:5883, 2001.
127. H Liu, CP Grey. Micropor Mater 53:109, 2002.
128. MF Ciraolo, JC Hanson, CP Grey. Micropor Mesopor Mater 49:111, 2001.
129. LW Beck, JL White, JM Haw. J Am Chem Soc 116:9657, 1994.
130. Z Luz, AJ Vega. J Phys Chem 91:365 1987.
131. JL White, LW Bechk, JF Haw. J Am Chem Soc 114:6182, 1992.
132. JF Haw, JB Nicholas, T Xu, LW Beck, DB Ferguson. J Am Chem Soc 29:259, 1996.
133. JF Haw, T Xu, JB Nicholas, PW Goguen. Nature 389:832, 1997.
134. RJ Gorte, D White. Top Catal 4:57, 1997.
135. F Haase, J Sauer. J Phys Chem 98:3083, 1994.
136. D Michel, A Germanus, H Pfeifer. J Chem Soc, Faraday Trans 1 78:237, 1982.
137. WP Rothwell, W Shen, JH Lunsford. J Am Chem Soc 106:2452, 1984.
138. D Farcasiu, R Leu, A Corma. J Phys Chem B 106:928, 2002.
139. GE Maciel, JF Haw, IS Chuang, BL Hawkins, TA Early, DR McKay, L Petrakis. J Am Chem Soc
105:5529, 1983.
140. JH Lunsford, WP Rothwell, W Shen. J Am Chem Soc 107:1540, 1985.
141. JF Haw, IS Chuang, BL Hawkins, GE Maciel. J Am Chem Soc 105:7206, 1983.
142. A Corma. Chem Rev 95:559, 1995.
143. WE Farneth, RJ Gorte. Chem Rev 95:615, 1995.
144. EF Rakiewicz, AW Peters, RF Wormsbecher, SK J., KT Mueller. J Phys Chem B 102:2890,
1998.
145. AI Biaglow, RJ Gorte, D White. J Phys Chem 97:7135, 1993.
146. AI Biaglow, RJ Gorte, GT Kokotailo, D White. J Catal 148:779, 1994.
147. MD Karra, KJ Sutovich, KT Mueller. J Am Chem Soc 124:902, 2002.
148. AL Blumenfeld, JJ Fripiat. J Phys Chem B 101:6670, 1997.
149. D Coster, A Blumenfeld, JJ Fripiat. J Phys Chem 98:6201, 1994.
150. CP Grey, B. S. A. Kumar. J Am Chem Soc 117:9071, 1995.
151. H-M Kao, H Liu, JC Jiang, S-H Lin, CP Grey. J Phys Chem B 104:4923, 2000.
152. EJ Teunissen, RA van Santen, AP Jansen, FB van Duijneveldt. J Phys Chem 97:203, 1993.
153. EH Teunissen, FB van Duijnevedlt, RA van Santen. J Phys Chem 96:366, 1992.
154. HM Kao, CP Grey. J Am Chem Soc 119:627, 1997.
155. B Zhao, H Pan, JH Lunsford. Langmuir 15:2761, 1997.
156. A Bendada, E DeRose, JJ Fripiat. J Phys Chem 98:3838, 1994.
157. A Lewis, PhD thesis, University of British Columbia, 1998.
158. E Bosch, S Huber, J Weitkamp, H Knozinger. Phys Chem Chem Phys 1:579, 1999.
159. M Sanchez-Sanchez, T Blasco. Chem Commun 491, 2000.
160. MF Ciraolo, JC Hanson, BH Toby, CP Grey. J Phys Chem B 105:12330, 2001.
161. M Sanchez-Sanchez, T Blasco, F Rey. Phys Chem Chem Phys 1:4529, 1999.
162. V Bosacek. J Phys Chem 97:10732, 1993.
163. V Bosacek, H Ernst, D Freude, T Mildner. Zeolites 18:196, 1997.
164. V Bosacek, R Klik, F Genoni, G Spano, F Rivetti, F Figueras. Magn Reson Chem 37:S135,
1999.
165. U Schenk, M Hunger, J Weitkamp. Magn Reson Chem 37:S75, 1999.
166. DK Murray, T Howard, PW Goguen, TR Krawietz, JF Haw. J Am Chem Soc 116:6354, 1994.
167. DK Murray, JW Chang, JF Haw. J Am Chem Soc 115:4732, 1993.
168. KH Lim, F Jousse, SM Auerbach, CP Grey. J Phys Chem B 105:9918, 2001.
169. MW Anderson, J Klinowski. Nature 339:200, 1989.
170. TA Carpenter, J Klinowski, DTB Tennakoon, CJ Smith, DC Edwards. J Magn Reson 68:561,
1986.
171. H Liu, H-M Kao, CP Grey. J Phys Chem B 103:4786, 1999.
172. H Ernst, D Freude, T Mildner, I Wolf. Solid State NMR 6:147, 1996.
Copyright © 2003 Marcel Dekker, Inc.

173. T Mildner, H Ernst, D Freude, WF Holderich. J Am Chem Soc 119:4258, 1997.
174. P Sarv, T Tuherm, E Lippmaa, K Keskinen, A Root. J Phys Chem 99:13763, 1995.
175. T Mildner, D Freude. J Catal 178:309, 1998.
176. T Mildner, H Ernst, D Freude, J Karger, U Winkler. Magn Reson Chem 37:S38, 1999.
177. JF Haw, PW Goguen, T Xu, TW Skloss, W Song, Z Wang. Angew Chem Int Ed 37:948,
1998.
178. M Hunger, M Seiler, T Horvath. Catal Lett 57:199, 1999.
179. M Hunger, M Seiler, A Buchholz. Catal Lett 74:61, 2001.
180. M Seiler, W Wang, M Hunger. J Phys Chem B 105:8143, 2001.
181. W Wang, M Seiler, M Hunger. J Phys Chem B 105:12553, 2001.
182. W Wang, M Seiler, Ivanova, II, J Weitkamp, M Hunger. Chem Commun 1362, 2001.
183. AJ Vega, Quadrupolar nuclei in solids. In: Encyclopedia of NMR, DM Grant, RK Harris, eds.
Chichester, UK: Wiley, 1996, p 3869.
184. J Skibstedt, NC Nielsen, H Bildsoe, HJ Jacobsen. J Magn Reson 95:88, 1991.
185. C Jager. In: NMR Basic Principles and Progress. Berlin: Springer-Verlag, 1994, Vol. 31, p 133.
186. D Muller. Ann Phys (Leipzig) 39:451, 1982.
187. A Samoson, E Lippmaa. J Magn Reson 84:410, 1989.
188. S Vega, Y Naor. J Chem Phys 75:75, 1981.
189. PJ Grandinetti, JH Baltisberger, A Llor, YK Lee, U Werner, MA Eastman, A Pines. J Magn Reson
103:72, 1993.
190. SP Brown, S Wimperis. J Magn Reson 128:42, 1997.
191. JP Amoureux, C Fernandez, S Steuernagel. J Magn Reson A123:116, 1996.
192. D Massiot. J Magn Reson A 122:240, 1996.
193. PK Madhu, A Goldbourt, L Frydman, S Vega. Chem Phys Lett 307:41, 1999.
194. PK Madhu, A Goldbourt, L Frydman, S Vega. J Chem Phys 112:2377, 2000.
195. APM Kentgens, D Iuga, M Kalwei, H Koller. J Am Chem Soc 123:2925, 2001.
196. APM Kentgens, R Verhagen. Chem Phys Lett 300:435, 1999.
197. M Pruski, JW Wiench, JP Amoureux. J Magn Reson 147:286, 2000.
198. P Zhao, PS Neuhoff, JF Stebbins. Chem Phys Lett 344:325, 2001.
199. NC Nielsen, H Bildsoe, HJ Jakobsen. Chem Phys Lett 191:205, 1992.
200. A Samoson, E Lippmaa. Chem Phys Lett 100:205, 1983.
201. APM Kentgens, JJM Lemmens, FMM Geurts, WS Veeman. J Magn Reson 71:62, 1987.
202. GAH Tijink, R Janssen, WS Veeman. J Am Chem Soc 109:7301, 1987.
203. G Engelhardt, M Hunger, H Koller, J Weitkamp. In: Exploring Cation Siting in Zeolites By Solid-
State NMR of Quadrupolar Nuclei. Studies in Surface Science and Catalysis. Amsterdam: Elsevier
Science, 1994, Vol. 84, p 421.
204. D Massiot, C Bessada, JP Coutures, F Taulelle. J Magn Reson 90:231, 1990.
205. AJ Vega. J Magn Reson 96:50, 1992.
206. AJ Vega. Solid State NMR 1:17, 1992.
207. Y Wu, D Lewis, JS Frye, AR Palmer, RA Wind. J Magn Reson 100:425, 1992.
208. Y Ba, HM Kao, CP Grey, L Chopin, T Gullion. J Magn Reson 133:313, 1998.
209. PJ Chu, RR Carvajal, JH Lunsford. Chem Phys Lett 175:407, 1990.
210. B Herzog, EL Hahn. Phys Rev 103:148, 1956.
211. T Gullion, J Schaefer. J Magn Reson 81:196, 1989.
212. T Gullion. Concepts Magn Reson 10:277, 1998.
213. AW Hing, S Vega, J Schaefer. J Magn Reson 96:205, 1992.
214. J Klinowski, S Ramdas, JM Thomas, CA Fyfe, JS Hartmann. J Chem Soc, Faraday Trans 2:1025,
1982.
215. DF Shantz, RF Lobo. J Phys Chem B 102:2339, 1998.
216. I Kustanovich, Z Luz, S Vega, AJ Vega. J Phys Chem 94:3138, 1990.
217. I Kustanovich, HM Vieth, Z Luz, S Vega. J Phys Chem 93:7427, 1989.
218. M Haouas, C Gerardin, F Taulelle, C Estournes, T Loiseau, G Ferey. J Chim Phys Phys Chim Biol
95:302, 1998.
Copyright © 2003 Marcel Dekker, Inc.

219. C Gerardin, M In, L Allouche, M Haouas, F Taulelle. Chem Mater 11:1285, 1999.
220. H Nakayama, DD Klug, CI Ratcliffe, JA Ripmeester. J Am Chem Soc 116:9777, 1994.
221. VI Srdanov, GD Stucky, E Lippmaa, G Engelhardt. Phys Rev Lett 80:2449, 1998.
222. KL Moran, PD Barker, JE Readman, PP Edwards, R Dupree, PA Anderson. Chem Commun 55,
1999.
223. G Engelhardt, M Feuerstein, P Sieger, D Markgraber, G Stucky, V Srdanov. Chem Commun 729,
1996.
224. HK Kira, H Tou, Y Maniwa, Y Murakami. J Magnetism Mag Mater 3002:1095, 2001.
225. I Heinmaa, S Vija, E Lippmaa. Chem Phys Lett 131, 2000.
226. A Eldewik, JM Hook, NK Singh, RF Howe. Magn Reson Chem 37:S63, 1999.
227. T Baba, N Komatsu, H Sawada, Y Yamaguchi, T Takahashi, H Sugisawa, Y Ono. Langmuir
15:7894, 1999.
228. VV Terskikh, IL Moudrakovski, HB Du, CI Ratcliffe, JA Ripmeester. J Am Chem Soc 123:10399,
2001.
229. CJ Jameson, AC de Dios. J Chem Phys 116:3805, 2002.
230. RG Larsen, J Shore, K Schmidt Rohr, L Emsley, H Long, A Pines, M Janicke, BF Chmelka. Chem
Phys Lett 214:220, 1993.
231. SL Burkett, ME Davis. J Phys Chem 98:4647, 1994.
232. SL Burkett, ME Davis. Chem Mater 7:920, 1995.
233. L van Wullen, M Kalwei. J Magn Reson 139:250, 1999.
234. WPJH Jacobs, JW de Haan, LJM van de Ven, RA van Santen. J Phys Chem 97:10394, 1993.
235. D Freude, T Frohlich, M Hunger, H Pfeifer, G Scheler. Chem Phys Lett 98:263, 1983.
236. D Freude, J Klinowski, H Hamdan. Chem Phys Lett 49:355, 1988.
Copyright © 2003 Marcel Dekker, Inc.