HANDBOOK OF HYPHENATED ICP-MS APPLICATIONS · are gas chromatography (GC) and high-performance...
138
2nd Edition HANDBOOK OF HYPHENATED ICP-MS APPLICATIONS HANDBOOK OF HYPHENATED ICP-MS APPLICATIONS, 2nd Edition
Transcript of HANDBOOK OF HYPHENATED ICP-MS APPLICATIONS · are gas chromatography (GC) and high-performance...

2nd Edition
HANDBOOK OF HYPHENATED ICP-MS APPLICATIONS
HANDBOOK OF HYPHENATED ICP-MS APPLICATIONS, 2nd Edition

2
ForewordWithout doubt, speciation analysis has found its rightful place as a valuable methodology within the toolbox of analytical science. The enhanced information value provided by speciation analysis compared to classical elemental analysis is not only of academic interest, but is most often the key to answering important questions about health risks, or more generally, biological activity, as well as environmental cycling of elements and fate of pollutants or to unravel complex metabolic pathways. Indeed, this list is by no means complete and could be extended, since most questions related to chemistry are not related to elements but to the chemical compounds which they comprise. Over the last two decades, the development of speciation methodology has been driven forward to a great extent by hyphenated techniques using ICP-MS as a detection system. The main reason for this success story is the ease of interfacing the different separation techniques to the ICP-MS, the wide range of accessible elements and the detection power provided by ICP-MS. While today speciation analysis is well established within the area of research, its routine application in the general field of testing and analysis is still in development. The complexity of instrumentation, but even more, the complexity of the chemistry involved are the biggest obstacles on the way to the standardization of methods. Therefore, the transfer of know-how from research towards the field of application plays a major role for the further development of this valuable tool. This handbook for speciation analysis aims at overcoming such obstacles by providing a broad collection of proven methods that can be applied for a specific task but also may provide guidance and inspiration to address other speciation-related topics.
Michael Sperling European Virtual Institute for Speciation Analysis (EVISA) E-mail: [email protected] www.speciation.net

Table of Contents
3
Introduction to Hyphenated ICP-MS 5
HPLC-ICP-MS 9 Introduction to HPLC-ICP-MS 10
Speciation of Gaseous Arsines using Chemotrapping followed by HPLC-ICP-MS 11
Determination of Inorganic Arsenic in Rice by Anion Exchange HPLC-ICP-MS 13
Arsenic Speciation in Rice — A Routine HPLC-ICP-MS Method? 15
Determination of Arsenic Species in Marine Samples using Cation Exchange HPLC-ICP-MS 17
Application of Compound Independent Calibration Software to Arsenic Speciation 20
Benefits of HPLC-ICP-MS Coupling for Mercury Speciation in Food 23
Mercury Speciation Measurements in Fish Tissues and Sediments by HPLC-ICP-MS 26
Determination of Mercury Species in Crude Oil by Speciated Isotope Dilution LC-ICP-MS 29
Low-Level Speciated Analysis of Cr(III) and Cr(VI) using LC(IC)-ICP-MS 32
Determination of Hexavalent Chromium in NIST SRM 2701 by Speciated Isotope Dilution Mass 36 Spectrometry (EPA Method 6800) using IC-ICP-MS
HPLC-ICP-MS for Preliminary Identification and Determination of Methyl-Selenium Metabolites of 39 Relevance to Health in Pharmaceutical Supplements
Selenium Speciation Analysis by LC-ICP-MS with Mass Balance Calculations for Se-Enriched Yeasts 42
Antimony Speciation in Natural Waters by HPLC-ICP-MS 44
Measurement of Total Antimony and Antimony Species in Mine Contaminated Soils by ICP-MS and 46 HPLC-ICP-MS
New Hyphenated Instrumental Combination for Speciation — Solid-Phase Microextraction (SPME) 48 Coupled to HPLC-ICP-MS
Treble Detection of Heteroatom-Tagged Green Fluorescence Protein by HPLC Photodiode Array (PDA) 51 Detector, Fluorescence Detector (FD) and ICP-MS
Determination of Ceruloplasmin in Human Serum by Immunoaffinity Chromatography and Size- 54 Exclusion Chromatography (SEC) ICP-MS
Application of ICP-MS to the Analysis of Phospholipids 57
Analysis of Glyphosate, Gluphosinate, and AMPA by Ion-Pairing LC-ICP-MS 60
Troubleshooting LC-ICP-MS Systems 62
GC-ICP-MS 65 Introduction to GC-ICP-MS 66
Analysis of Polybrominated Diphenyl Ether (PBDE) Flame Retardants by GC-ICP-MS 68
Analysis of Sulfur in Low-Sulfur Gasoline by GC-ICP-MS 70
Characterization of Metalloporphyrins in Crude Oils by High Temperature Simulated Distillation using 72 GC-ICP-MS
Determination of Mercury Species in Whole Blood by Calibration Curve-Free Speciated Isotope 75 Dilution Solid-Phase Microextraction (SPME) GC-ICP-MS with Microwave Assisted Isotope Equilibration and Extraction

4
Determination of Phosphoric Acid Triesters in Human Plasma using Solid-Phase Microextraction 77 (SPME) and GC-ICP-MS
Determination of Arsine in Ethylene and Propylene by GC-ICP-MS 80
Determination of Organotin Compounds in Urine Samples using GC-ICP-MS 82
Specific Migration of Organotin Compounds from Food Contact Materials — Selective Determination 85 by GC-ICP-MS
Troubleshooting GC-ICP-MS Systems 89
Multi-MS 91
Introduction to Multi-MS — Coupling HPLC with Elemental and Molecular Mass Spectrometry 92
Mercury Speciation in Rice — More Than Methylmercury using HPLC-ICP-MS/Electrospray 93 Ionization (ESI) MS
Speciation of Selenometabolites in the Liver of Sea Turtles using HPLC-ICP-MS and Electrospray 95 Ionization (ESI) MS-MS
Determination and Quantification of Non-Metal Bound Phytochelatins by HPLC-ICP-MS/Electrospray 98 Ionization (ESI) MS
Fractionation and Identification of Arseno Fatty Acids from Cod-Liver Oil by the Parallel Use of HPLC 100 On-Line with ICP-MS and Electrospray Ionization (ESI) MS
Selenium Speciation in Soybean using HPLC-ICP-MS and Electrospray Ionization (ESI) Ion Trap (IT) 102 MS
Multi-Elemental Exposure of Freshwater Plants and Identification of Heteronuclear Phytochelatin 105 Complexes by HPLC Electrospray Ionization (ESI) MS/ICP-MS
Protein Phosphorylations as Potential Biomarkers in Cerebral Spinal Fluid 109
Field-Flow Fractionation (FFF) ICP-MS 111
Introduction to Field-Flow Fractionation (FFF) ICP-MS 112
Investigation of the Relationship between Salinity and the Adsorption of Different Elements on the 114 Surface of Nanoparticles in Natural Water Samples
Quantitative Characterization of Gold Nanoparticles by Field-Flow Fractionation (FFF) Coupled 117 On-Line with Light Scattering Detection and ICP-MS
Asymmetric Flow Field-Flow Fractionation (AF4) ICP-MS for Speciation of Various Elements in 119 Aggregated Proteins
Other Speciation Techniques 123
Introduction to ‘Other’ Speciation Techniques 124
Absolute Quantification of a Metalloprotein using Species-Specific Isotope Dilution Methodology 125 and Gel Electrophoresis (GE) Laser Ablation (LA) ICP-MS
Contribution of Capillary Electrophoresis (CE) ICP-MS to Metalloprotein Analysis 127
Determination of Roxarsone and its Transformation Products using Capillary Electrophoresis (CE) 129 Coupled to ICP-MS
Acknowledgements 132
Index 133

5www.agilent.com/chem/icpms
When the first edition of the Agilent Handbook of Hyphenated ICP-MS Applications (publication number 5989-6160EN) was published in August of 2007, hyphenated techniques utilizing ICP-MS for elemental detection had become arguably the fastest growing general area of research in atomic spectroscopy. Four years later, the trend has only continued with the addition of new or newly applied separation techniques as well as new or significantly improved parallel detection devices, which can provide additional information unavailable in the ICP-MS spectrum alone.
Figure 1. The number of publications in the period 1984–2009. The data was collected from SciFinder. Courtesy Qilin Chan, Doctoral Dissertation, University of Cincinnati.
Hyphenated techniques involving ICP-MS continue to be among the fastest growing research and application areas in atomic spectroscopy. This is because, by itself, ICP-MS does not give information on the chemical or structural form of the analytes present (since all forms of the analytes are converted to positively charged atomic ions in the plasma). However, as an excellent elemental analyzer, it also performs as a superb detector for chromatography. Hyphenated ICP-MS is achieved through the coupling of the ICP-MS to a separation technique — normally a chromatographic separation. In this way, target analytes are separated into their constituent chemical forms or oxidation states before elemental analysis (Figure 2). The most common separation techniques are gas chromatography (GC) and high-performance liquid chromatography (HPLC), which includes ion chromatography (IC); but other separation techniques, such as capillary electrophoresis (CE) and field-flow fractionation (FFF), are also used.
Figure 2. Schematic diagram showing the interrelationships of the various components in a hyphenated ICP-MS system
This handbook specifically addresses the use of ICP-MS as an elemental detector for GC, LC, IC, CE and FFF, though the same principles would apply to other similar techniques. Because of its ability to accurately distinguish isotopes of the same element, particularly now that collision/reaction cell (CRC) technology has all but eliminated interferences, ICP-MS is also capable of isotope dilution (ID) quantification.
Applications of hyphenated ICP-MS fall into the general category termed speciation analysis. In all cases, the fractionation device (chromatograph or other) is used to separate the species from each other and the matrix, and the ICP-MS is used to detect the species of interest. The analyte species may be as simple as elemental ions of various oxidation states in solution, or as complex as mixtures of pesticides or biomolecules. In all cases though, the ICP-MS is simply acting as an elemental detector. The fractionation device serves to separate the various components in the sample before detection as well as providing additional information in the form of retention time. Often this combination is sufficient to identify and quantify the target analytes. However, analysis of standards or the use of additional mass spectrometric techniques can provide further confirmation of identification.
Elemental speciation is important in many application areas and is becoming particularly important in the environmental, food, clinical and life science industries. This is because, for many elements, properties such as those listed below depend on the species or chemical form of the element present in the sample:
Introduction to Hyphenated ICP-MS
Optional organic MSHPLC
GC
CEOptional
conventionaldetector(s) In
terfa
ce
ICP-MS
Separation Detection
FFF
Other
Optionalconventionaldetector(s)
1985 1990 1995 2000 2005 20100
20
40
60
80
100
120
140
160
Num
ber o
f jou
rnal
arti
cles
Year
LC-ICPMSGC-ICPMSCE-ICPMS

6
• Toxicityornutritional value
• Environmentalmobilityandpersistence
• Bioavailability
• Volatility
• Chemicalreactivity
A common example would be the measurement of Cr(VI) (toxic) and Cr(III) (essential nutrient) as opposed to total Cr in environmental samples. Similar examples of elemental speciation include As(III)/As(V), Se(IV)/Se(VI), and other elements that can exist in different stable oxidation states. Furthermore, arsenic and selenium in particular also commonly exist in various organic forms, which can significantly affect the traits listed above.
In the case of more complex molecules such as pesticides or biomolecules, the ICP-MS is able to identify and quantify the presence of a particular element or elements in molecular chromatographic peaks. When used in conjunction with organic MS techniques, this technique can permit quick screening for molecules (peaks) containing specific elements in a complex mixture, prior to analysis by organic MS. With modern, integrated systems and software, simultaneous analysis by ICP-MS and organic (for example, electrospray ionization [ESI]) MS is also possible, using a split flow from a single chromatographic device. Examples of ICP-MS in molecular speciation are many and cover a broad variety of applications:
• Totalsulfur and sulfur species in hydrocarbon fuels
• Metalporphyrinsincrude oil
• Organotinspeciesinmarinesediments and biota, consumer goods, and drinking water
• Mercury species in fish, industrial discharges, and petroleum processing
• Arsenicspeciesinmarinealgae,food products, and drinking water
• Brominatedandphosphorus-based flame retardants in consumer goods and environmental samples
• Phosphorusandsulfur in biological samples
• Protein-andpeptide-boundmetals
• Pesticidesandherbicides
• Chemicalwarfareagents
• Volatileorganohalidesinairsamples
• Metalcontainingnanomaterials
In some cases, it is the presence of the target element that is important (for example Cr(III) or Cr(VI)). In other cases, the element or elements are a simple way to identify and quantify a molecule present in a complex mixture (for example using P as a means of quantifying organophosphorus compounds).
In addition to the more conventional liquid phase separations (HPLC and IC, for example), ICP-MS is also an excellent detector for separations carried out by GC. While other element-specific detectors exist for GC, none possesses the elemental coverage, sensitivity, or specificity of ICP-MS.
This handbook is divided into sections based on the chromatographic component of the hyphenated ICP-MS system. Each section is composed of a short introduction to the technique followed by a series of ‘application briefs’, which outline typical or interesting applications for that technique. The application briefs are deliberately short, showing only general conditions and outlining results. Specific details for each application can be found in referenced publications in each brief. The final part of each section is a practical troubleshooting section designed to help the new user identify and solve common analytical problems related to hyphenated ICP-MS systems.
General RequirementsAll hyphenated ICP-MS systems require that a few simple conditions are met:
• Theconnectinginterface(transferline)musttransmitthe fractionated sample quantitatively from the separation system (called a chromatograph from this point forward) to the plasma of the ICP-MS in a form that the plasma can tolerate.
• Thetemporalresolutionofthesamplecomponentsmust not be unacceptably degraded during transfer to the plasma.
• ThechromatographshouldcommunicatewiththeICP-MS to allow synchronous separation and detection.
• TheICP-MSmustbecapableoftransientsignalacquisition at sufficient sampling frequency and over sufficient dynamic range to accommodate the resolution of the chromatograph and the required number of elements or isotopes per peak over their ranges of concentrations.

7www.agilent.com/chem/icpms
A good rule of thumb for chromatographic detectors applies here. In order to achieve accurate and precise peak integration, a minimum of 10 data points (scans) must be acquired across a typical Gaussian peak. Very narrow peaks will require a higher sampling frequency than wider peaks. However, scanning too quickly, while generating good peak shapes, will degrade sensitivity and precision, and should be avoided. As a quadrupole mass spectrometer, the ICP-MS sampling frequency is dependent on the scan speed of the quadrupole, the number of masses scanned, the dwell time for each mass and the settling time necessary for the quadrupole to stabilize after each mass jump. Typically, since the number of elements or isotopes in hyphenated work is small, sufficient scan speed is not a problem.
It must be possible to tune the ICP-MS under plasma conditions similar to those encountered during the chromatographic run. Generally, this entails introducing the tuning element(s) via the chromatographic interface. In general, using an ICP-MS as a detector for chromatography is a simple matter of connecting the outlet of the chromatographic column to the sample introduction system of the ICP-MS. If the sample is gaseous, as in GC, the transfer line should be passivated and heated to eliminate sample degradation and condensation and should terminate directly into the ICP torch. If the sample is a liquid, the transfer line will likely terminate in a nebulizer in order to generate an aerosol compatible with the plasma. This may require either a split flow or make-up flow in order to match the chromatographic flow with the nebulizer and plasma requirements. Depending on the total sample flow and choice of nebulizers, the use of a spray chamber may or may not be necessary.

8
This page is intentionally left blank.

HPLC-ICP-MS
www.agilent.com/chem/icpms
Introduction to HPLC-ICP-MS 10Speciation of Gaseous Arsines using Chemotrapping followed by HPLC-ICP-MS 11Determination of Inorganic Arsenic in Rice by Anion Exchange HPLC-ICP-MS 13Arsenic Speciation in Rice — A Routine HPLC-ICP-MS Method? 15Determination of Arsenic Species in Marine Samples using Cation Exchange HPLC-ICP-MS 17Application of Compound Independent Calibration Software to Arsenic Speciation 20Benefits of HPLC-ICP-MS Coupling for Mercury Speciation in Food 23Mercury Speciation Measurements in Fish Tissues and Sediments by HPLC-ICP-MS 26Determination of Mercury Species in Crude Oil by Speciated Isotope Dilution LC-ICP-MS 29Low-Level Speciated Analysis of Cr(III) and Cr(VI) using LC(IC)-ICP-MS 32Determination of Hexavalent Chromium in NIST SRM 2701 by Speciated Isotope Dilution Mass 36 Spectrometry (EPA Method 6800) using IC-ICP-MSHPLC-ICP-MS for Preliminary Identification and Determination of Methyl-Selenium Metabolites of 39 Relevance to Health in Pharmaceutical SupplementsSelenium Speciation Analysis by LC-ICP-MS with Mass Balance Calculations for Se-Enriched Yeasts 42Antimony Speciation in Natural Waters by HPLC-ICP-MS 44Measurement of Total Antimony and Antimony Species in Mine Contaminated Soils by ICP-MS and 46 HPLC-ICP-MSNew Hyphenated Instrumental Combination for Speciation — Solid-Phase Microextraction (SPME) 48 Coupled to HPLC-ICP-MSTreble Detection of Heteroatom-Tagged Green Fluorescence Protein by HPLC Photodiode Array (PDA) 51 Detector, Fluorescence Detector (FD) and ICP-MSDetermination of Ceruloplasmin in Human Serum by Immunoaffinity Chromatography and Size 54 Exclusion Chromatography (SEC) ICP-MS Application of ICP-MS to the Analysis of Phospholipids 57Analysis of Glyphosate, Gluphosinate, and AMPA by Ion-Pairing LC-ICP-MS 60Troubleshooting LC-ICP-MS Systems 62

10
Prof. Mag. Dr. Walter Goessler Institut für Chemie Bereich Analytische Chemie, Graz, Austria
A clear trend in speciation analysis is towards higher accuracy of the results. Published semiquantitative results are nowadays the exception. Determination of the column recovery (ratio of the amount of an element injected onto the column/the sum of the species) is obligatory. The use of reference materials, when available, is compulsory although there is still a big need for more certified reference materials with certified species concentrations. Proper species standards (for example, arsenoriboses) are still not commercially available. Intercomparison studies of expert laboratories already show good agreement. However, the spreading of the developed methods from the specialized laboratories to routine laboratories is still not happening. A possible reason is certainly the fact that the legislation is not changing, although the European Food Safety Authority summarized in a recent report on arsenic that more speciation results are necessary to estimate the risk for the population from inorganic arsenic.
The following short papers represent an excellent cross-section of the current research in speciation analysis using HPLC coupled to ICP-MS.
Introduction to HPLC-ICP-MS
High performance liquid chromatography (HPLC) when coupled to ICP-MS for elemental detection is by far the most widely used technique for speciation analysis. For speciation analysis of samples that are not already in liquid form, three steps are generally required. The first step comprises the extraction of the element species from the sample, because so far, no techniques are available to do in situ speciation analysis at environmental concentrations. During this critical extraction step, the compounds should be quantitatively extracted and must not be changed. Combinations of water and/or organic solvents or weak acids are often employed for this purpose. In a second step, the compounds are then separated by liquid chromatography. After the separation of the compounds, a reliable detection step is necessary. ICP-MS is typically the detector of choice because of its excellent detection limits, wide dynamic range, multi-element capabilities and the possibility to determine isotopes. The robustness of the ICP is certainly one of the reasons that make the hard ionization in the ICP superior to molecule-selective detection using electrospray ionization. Compound independent quantification should be mentioned as another benefit of ICP-MS. This allows the quantification of compounds without having a standard available (provided the compounds behave in the same way in the sample introduction system).
What has changed since the publication of the first Agilent Speciation Handbook in 2007? The elements of interest are quite similar. From nutritional and environmental aspects, arsenic and selenium are dominating, followed by mercury, chromium and antimony. These elements are of great interest because they occur in stable compounds that show different chemical properties with respect to mobility, bioavailability and toxicity. In recent years more attention has been given to the non-metals; phosphorus and sulfur.
With the continuing improvements in the robustness of ICP-MS instruments, chromatographic separations using organic solvents are no longer taboo. The addition of oxygen to the plasma makes an isocratic separation with an organic solvent ‘routine’. Challenges remain when gradient elution is required, and quantification becomes a bit more difficult, but possible solutions (counter gradients, excess of carbon in the plasma) are already published.

11www.agilent.com/chem/icpms
Keywordsnatural gas, volatile organometallic compounds, VOMC, arsenic, arsines, stibines, chemotrapping, arsine, AsH3, monomethylarsine, MeAsH2, dimethylarsine, Me2AsH, trimethylarsine, TMA, cation exchange, anion exchange, HPLC-ICP-MS
IntroductionWhen sampling and analyzing volatile organometallic compounds (VOMC), such as arsines or stibines, scientists can employ different techniques. Gases can either be sampled in bags or canisters and then analyzed directly using GC-ICP-MS, or, if the concentration is very low, a cryotrapping step can be added. A less used but very interesting technique is chemotrapping, which relies on isolating the compounds of interest from the matrix, preconcentrating the compounds and converting them to their nonvolatile equivalents. Using silver nitrate impregnated silica gel traps, our method enabled us, after thorough validation, to easily measure arsines derived from natural samples including: arsine (AsH3); monomethylarsine (MeAsH2); dimethylarsine (Me2AsH); and trimethylarsine (TMA). Once the species are trapped and stable, the samples can be sent for analysis without risk of loss or conversion. The silica gel traps can be eluted with boiling diluted nitric acid for total analysis or with boiling water for speciation analysis. Anion exchange HPLC-ICP-MS can then be used to analyze the volatile arsenic species that have been converted to their methylated oxy-ions AsH3 to As(III) (arsenite); MeAsH2 to MMAA (methylarsonic acid); Me2AsH to DMAA (dimethylarsinic acid); and TMAs to TMAO (trimethylarsine oxide).
ExperimentalPreparation of the traps, trapping itself and elution are thoroughly explained in Uroic et al. 2010 [1] and Mestrot et al. 2009 [2]. Volatile arsines were prepared daily from solution by batch hydride generation into different Tedlar bags. 1% H2O2 was added to each sample after elution to oxidize As(III) to As(V), which would otherwise co-elute in the void volume of the anion exchange column, with trimethylamine oxide (TMAO). The presence of TMAO was ascertained by cation exchange HPLC-ICP-MS.
An Agilent HPLC (1100 Series) was fitted with an anion exchange column (Hamilton PRP-X-100) to separate the species eluted from the trap. The flow was 1 mL/min and the eluent was a 6.6 mM phosphate buffer at pH 6.2. The HPLC was coupled to an Agilent 7500c ICP-MS. The following masses were monitored: m/z 75 for As, m/z 77 and 82 to check for interferences and m/z 103 for Rh (internal standard). First, all four species from the hydride generated Tedlar bags were trapped onto different silver nitrate impregnated tubes, then onto a single one (Figure 1). Species were identified by spiking standards (10 ng As/mL) into the eluate.
Application to Rice Paddy SoilThree microcosms containing a low level arsenic-contaminated Spanish rice paddy soil (10.5 ± 0.4 mg As/kg) amended with cow dung were incubated anaerobically. Traps were fitted and the headspace was pumped through the traps at 12 mL/min for a 69 day period. The traps were then eluted with boiling water and the eluate was analyzed by HPLC-ICP-MS. This technique was used successfully to preconcentrate the gaseous species as well as separating them from a complex matrix that could hinder their analysis by GC-ICP-MS, allowing the measurement of arsines in natural gas. All species were separated both in synthetic and actual samples. No loss of concentration nor demethylation was observed after trapping in the Tedlar bags. TMAs was found to be the most commonly occurring arsine present in our samples [3].
Speciation of Gaseous Arsines using Chemotrapping followed by HPLC-ICP-MSAdrien Mestrot, M. Kalle Uroic, Eva M. Krupp, Andy Meharg and Jörg Feldmann TESLA (Trace Element Speciation Laboratory), University of Aberdeen, Meston Walk, AB24 3UE, Scotland, UK

12
Figure 1. Separation of the four oxidized forms of the arsine species standards eluted from a single trap and separated by anion exchange HPLC (top). Chromatogram of trapped arsines eluted from three traps fitted on microcosms containing soil compared to a blank (BLK) (bottom).
ConclusionsSpeciation of gases using chemotrapping followed by HPLC-ICP-MS analysis is sensitive enough to be used in the field. The method also stabilizes unstable volatile organometallic compounds such as arsines, preserving the speciation between the sampling and analysis in the lab. Finally, simplicity of use makes chemotrapping/HPLC-ICP-MS a very valuable tool for monitoring arsenic fluxes, allowing for better understanding of the As biogeochemical cycle.
References1. Uroic, M. K. et al. (2009). Chemotrapping-atomic fluorescence spectrometric method as a field method for volatile arsenic in natural gas. Journal of Environmental Monitoring, 11, 2222–2230.
2. Mestrot, A. et al. (2009). Quantitative and qualitative trapping of arsines deployed to assess loss of volatile arsenic from paddy soil. Environmental Science and Technology, 43, 8270–8275.
3. Mestrot, A. et al. (2011). Field fluxes and speciation of arsines emanating from soils, 45, 1798–1804.

13www.agilent.com/chem/icpms
Determination of Inorganic Arsenic in Rice by Anion Exchange HPLC-ICP-MS
Keywordsinorganic arsenic, rice, food safety, speciation, HPLC-ICP-MS
IntroductionLong-term ingestion of inorganic arsenic by humans has been associated with development of severe adverse health effects including cancer, skin lesions, developmental effects, cardiovascular disease, neurotoxicity and diabetes [1]. Ingestion of contaminated drinking water is the most well-known cause of exposure to inorganic arsenic. However, recent reported data have indicated that elevated inorganic arsenic in rice can contribute significantly to dietary intake. Rice is generally grown under flooded conditions and accumulates As from the soil and water where As mobility is high.
Recently, toxicological risk evaluations on dietary inorganic arsenic exposure have been published by the European Food Safety Authority (EFSA) [2] and WHO/FAO Joint Expert Committee on Food Additives and Contaminants (JECFA) [1], proposing benchmark dose lower confidence limit (BMDL) values between 0.3 and 8 μg/kg body weight (bw)/day and 3 μg/kg bw/day, respectively. The dietary exposures to inorganic arsenic estimated by EFSA for average and high level consumers in Europe were within the range of the BMDL values identified, and hence little or no margin of exposure leading to possible risk to some EU consumers was one of the conclusions of the report [2]. In both reports there is a call for more accurate information on the inorganic arsenic content of foods in order to improve the assessments of dietary exposures to inorganic arsenic and furthermore it was concluded that there is a need for development of validated methods for selective determination of inorganic arsenic in food matrices, for example rice.
ExperimentalIn the present method, the extraction of inorganic arsenic used subsamples of approximately 0.2 g, which were weighed into microwave quartz containers and 10.00 mL of 0.06 M hydrochloric acid (Merck) in 3% hydrogen peroxide (Merck) was added. The solutions were placed in a microwave oven (Multiwave, Anton Paar, Austria) and the power was programmed to hold the solutions at 90 °C for 20 min. Using this procedure, the inorganic arsenic is extracted from the sample matrix and furthermore As(III) is oxidized to As(V), thus allowing for the determination of total inorganic arsenic as As(V). The solutions were allowed to cool to room temperature and the supernatant transferred to 15 mL plastic tubes and centrifuged at approximately 4,000 rpm for 10 min and subsequently filtered (0.45 µm) prior to analysis.
Table 1. HPLC and ICP-MS instrument operating conditions
HPLC
Injection volume 25 µL Operating pressure 45–50 bar Mobile phase concentration 30 mmol/L (NH4)2CO3 Mobile phase flow rate 1 mL/min
Jens J. Sloth, Birgitte K. Herbst, Rikke V. Hedegaard and Rie R. Rasmussen National Food Institute, Technical University of Denmark, Mørkhøj Bygade 19, DK-2860 Søborg, Denmark
ICP-MS
RF power 1550 W Carrier gas flow rate 0.97 L/min Make-up gas flow rate 0.18 L/min Plasma gas flow rate 15 L/min Auxiliary gas flow rate 1 L/min Nebulizer Concentric Spray chamber Water-cooled double-pass (5 °C) Interface cones Platinum Mass resolution 0.8 u Integration time 1000 ms

14
The determination of inorganic arsenic was done using anion exchange HPLC-ICP-MS following the chromatographic principles previously reported [3]. The column was the strong anion exchanger ION-120; 120 mm × 4.6 mm; 5 µm particles (Transgenomic, USA). The mobile phase was a solution of 30 mM ammonium carbonate (Merck, Germany) at pH 10.3 (pH adjusted with 25% NH3 (aq), Merck) filtered through 0.45 µm prior to use. The extracts were quantified using external calibration with matched standard solutions (0.07 M HCl in 3% hydrogen peroxide). Stock standard solution (1000 mg As/L) (SCP science) was used to prepare the calibration standards.
ResultsFigure 1 shows an example of a chromatogram of a rice sample used in an EU-RL proficiency test [4]. The total arsenic concentration determined in this rice sample was 0.172 ± 0.018 mg/kg and the measured result for inorganic As of 0.12 ± 0.01 mg/kg agreed well with the estimated target value at 0.107 ± 0.014 mg/kg derived from the results from all participating laboratories. For quality assurance of the method, the certified reference material NIST 1568a was analyzed. Although, this material is not certified for inorganic arsenic, it has been referenced many times in the scientific literature, where a mean concentration for inorganic arsenic at 97 ± 9 µg/kg (mean ± sd) can be calculated from 16 different publications. Using the method presented here, a concentration of 103 ± 7 µg/kg (mean ± sd, N = 3) was found for NIST 1568a, which is in good agreement with the literature values.
ConclusionsA method for the selective detection of inorganic arsenic in rice is presented. During sample extraction As(III) is oxidized to As(V), allowing the determination of inorganic arsenic (sum of As(III) and AsV), which is separated from other arsenic compounds by anion exchange HPLC-ICP-MS. The measured results for inorganic arsenic in two reference samples agreed well with literature values.
References1. Evaluation of certain contaminants in food: Seventy-second report of the Joint FAO/WHO Expert Committee on Food Additives. WHO technical report series. 959, Geneva, Switzerland.
2. European Food Safety Authority (EFSA) (2009). Scientific opinion on arsenic in food. EFSA Journal, 7(10), 1351–1550.
3. Sloth, J. J. & Julshamn, K. (2008). Survey of total and inorganic arsenic content in blue mussels (Mytilus edulis L) from Norwegian fiords — revelation of unusual high levels of inorganic arsenic. Journal of Agricultural and Food Chemistry, 56, 1269–1273.
4. De la Calle, M. B., Linsinger, T., Emteborg, H., Charoud-Got, J. & Verbist, I. Report of the Seventh Interlaboratory Comparison Organised by the European Union Reference Laboratory for Heavy Metals in Feed and Food (IMEP-107: Total and Inorganic Arsenic in Rice).
Figure 1. Chromatogram of an extract of a rice sample used in an EU-RL proficiency test. First peak at approximately 1.9 min is DMA and the peak at approximately 7 min is As(V) = inorganic arsenic.

15www.agilent.com/chem/icpms
Keywordsfood, rice, soil, arsenic, As(III), As(V), dimethylarsinic acid, HPLC-ICP-MS
IntroductionRice constitutes a major food source in a large part of the world. Unfortunately, rice accumulates arsenic and concentrations up to 2 µg/g dry weight of rice have been reported [1]. The arsenic in rice may be present as either the more toxic inorganic forms, As(III) and As(V), or in the lesser toxic organic forms, mainly dimethylarsinic acid — DMA(V). A large variation is found in the arsenic speciation of rice depending on one or a combination of factors including the genotype of rice and environmental factors such as soil composition [1]. Identifying the safest variety of rice to consume could potentially minimize the exposure of millions of people to inorganic arsenic. However, with more than 8,000 different varieties of rice, a routine method of analysis is required.
ExperimentalA sample of dried and milled rice grain (0.2 g) was left in 10 mL 1% HNO3 overnight and then subjected to microwave assisted extraction (0–55 °C over 5 min, hold for 5 min, 55–75 °C over 5 min, hold for 5 min, 75–95 °C over 5 min and hold for 30 min). The samples were centrifuged and hydrogen peroxide added to the supernatant (100 μL /500 μL of sample), prior to injection (100 µL) onto the HPLC column (Hamilton PRP-X100 column (PEEK 250 μm × 4.6 mm)). The mobile phase (flow rate 1 mL/min) consisted of 6.66 mM ammonium hydrophosphate and 6.66 mM ammonium nitrate, adjusted to pH 6.2 with ammonium hydroxide. The HPLC (Agilent 1100 Series) was coupled on-line to an Agilent 7500c ICP-MS and the signals at m/z 75 (As) and m/z 115 (In) were monitored. Standard instrumental parameters were used, and ions with m/z 75 and m/z 115 were monitored with dwell times of 100 ms and 20 ms respectively.
Results and DiscussionCalibration was carried out by analyzing solutions of DMA between 0.5 and 25 µg/L. The limit of detection (LOD) was calculated as three times the standard deviation of the blank measurements. Typical LODs were 0.1–0.3 µg/L.
The species identified in the extracts of rice were mainly DMA(V) and As(V). The amount of inorganic arsenic was calculated as the sum of the As(III) and As(V) peaks (pink area of Figure 1), since the hydrogen peroxide had not succeeded in oxidizing all As(III) and As(V). The amount of organic arsenic (green area of Figure 1) is the sum of the DMA(V) and MA(V) peaks plus the unidentified As peak eluting in the void volume. This presumption is based on the fact that inorganic arsenic in solution only exists as As(III) and As(V) and that several cationic organic arsenic species exist.
Helle R. Hansen, Gareth J. Norton, Andy A. Meharg and Jörg Feldmann University of Aberdeen, College of Physical Sciences, Aberdeen, AB 24 3UE, Scotland, UK
Arsenic Speciation in Rice — A Routine HPLC-ICP-MS Method?

16
Figure 1. HPLC-ICP-MS chromatograms of rice extracts and an As standard mixture
References 1. Williams, P. N., Price, A. H., Raab, A., Hossain, A., Feldmann, J. & Meharg, A. A. (2005). Variation in arsenic speciation and concentration in paddy rice related to dietary exposure. Environ. Sci. Technol., 39(15), 5531–5540.
2. Hansen, H. R., et al. (2011). Identification of tetramethylarsonium in rice grains with elevated arsenic content. J. Environ. Monit. 13(1), 32–34.
ConclusionsDespite the occurrence of an unknown cationic As species, the applied method is capable of separating inorganic As from organic As. It is important however to oxidize As(III) and As(V) in order to minimize the potential overlap of the As(III) peak with organic As species such as tetramethylarsonium (TMA) as identified recently in rice grain [2].

17www.agilent.com/chem/icpms
InstrumentationAn Agilent 7500c ICP-MS was used as an element-specific detector connected to an Agilent 1100 Series HPLC system (degasser, autosampler, and quaternary pump). A Chrompack Ionospher C column (100 × 3 mm id) was used as the stationary phase and a pyridine solution in 3% MeOH adjusted to pH = 2.7 with formic acid as the mobile phase. A three-step gradient elution was employed in order to achieve the best possible separation of the arsenic species. Figure 1 shows a chromatogram of a standard solution of the available arsenic species. The three-step gradient elution procedure is illustrated by the dotted line.
Keywordsarsenic species, marine samples, scallop kidney, NRCC DORM-2 Dogfish Muscle, BCR-627 Tuna, cation exchange, HPLC-ICP-MS
IntroductionA method for the determination of arsenic species in marine samples by cation exchange HPLC-ICP-MS was investigated. A three-step gradient elution of the arsenic species led to the detection of up to 23 different arsenic species in a single analytical run.
ExperimentalSample preparationFreeze-dried samples of marine origin (0.25 g) were extracted three times by mechanical agitation with methanol/water (1 + 1). The three supernatants were combined, evaporated to dryness, and redissolved in 5 mL of water prior to analysis.
Determination of Arsenic Species in Marine Samples using Cation Exchange HPLC-ICP-MSJens J. SlothA+B, Kåre JulshamnA and Erik H. LarsenB A. National Institute for Nutrition and Seafood Research (NIFES), Bergen, Norway B. National Food Institute, Technical University of Denmark, Søborg, Denmark
Figure 1. Chromatogram of a standard solution. Dotted line illustrates the gradient elution of the arsenic species with the pyridinium mobile phase.
DMA
DMAA
AB
TMAP
AC
2.00 4.00 6.00 8.00 10.00 12.00 14.00 16.00 18.00 20.00
5000
10000
15000
20000
25000
30000
35000
40000
45000
50000
55000
60000
Time
Abundance Ion 75.00 (74.70 to 75.70): 001SMPL.D
2.68
4.51
10.96
13.26
14.81 17.59
18.51
20 mM Py
0.5 mM Py 0.5 mM Py
5 mM Py
DMA
DMAA
AB
TMAO
Sign
al in
tens
ity/
cps
TMAs
Key:DMA Dimethylarsinic acid AB Arsenobetaine TMAO Trimethylarsine oxide AC Arsenocholine ion
TETRA Tetramethylarsonium ion DMAA Dimethylarsinoylacetic acid TMAP Trimethylarsoniopropionate

18
Figure 2. LC-ICP-MS chromatogram of arsenic species in scallop kidney extract
Results and DiscussionThe separation/detection capability of the methodology is illustrated in Figure 2, where 23 different arsenic species are detected in one analytical run (25 min) in a scallop kidney. Seven arsenic species have been identified by retention time matching with available standards. As can be seen from the chromatogram, unknown peaks remain. The majority of these peaks are probably arsenoriboside compounds (arsenosugars).
Analysis of certified reference materialsTo date, only two reference materials of marine origin have been certified for the content of arsenic species: NRCC DORM-2 Dogfish Muscle and BCR-627 Tuna. Table 2 shows the results from this work and the certified values. In all cases, good agreement between measured and target values was obtained.
Agilent 1100 Series HPLC
Flow rate 1.0 mL/min Injection volume 25 µL
Table 1. HPLC and ICP-MS instrument operating conditions
Agilent 7500c ICP-MS
RF power 1600 W Nebulizer Babington Plasma gas flow rate 15.0 L/min Auxiliary gas flow rate 1.0 L/min Carrier gas flow rate 1.18 L/min Spray chamber temperature 2 °C Sampling depth 6 mm Integration time 1 s
Time
Abundance
Sign
al in
tens
ity/
cps
AB
DMAA
TMAO
TMAP
AC
TMAs
DMA
2.00 4.00 6.00 8.00 10.00 12.00 14.00 16.00 18.00 20.00
5000
10000
15000
20000
25000
30000
35000
40000
45000
50000
55000
60000
65000
Ion 75.00 (74.70 to 75.70): 032SMPL.D

19www.agilent.com/chem/icpms
Table 2. Results from the analysis of the certified reference materials NRCC DORM-2 (Dogfish Muscle) and BCR-627 Tuna. All results in mg(As)/kg ± 95% confidence interval.
AB 16.4 + 1.1 16.9 + 0.8 3.9 + 0.2 3.7 + 0.2DMA – – 0.15 + 0.01 0.14 + 0.01TETRA 0.248 + 0.054 0.26 + 0.01 – –
DORM-2 BCR-627 Tuna Certified Found Certified Found
ConclusionsAn HPLC-ICP-MS method capable of separating 23 arsenic species in one analytical run has been developed. The separation, which was based on cation exchange HPLC, employed a three-step gradient elution and resulted in excellent selectivity. The analysis of the CRMs DORM-2 and BCR-627 Tuna fish tissue showed good agreement with certified values and provided a set of values for noncertified arsenic species. The method is useful for future studies of arsenic metabolism in biological samples of marine origin. Several naturally occurring arsenic species were detected but could not be identified in this study due to the lack of available standard substances. In order to characterize these unknowns, further investigation by, for example, ESI-MS/MS will be necessary. Identification of the unknown arsenic compounds will improve our understanding of arsenic-containing natural products and possibly help to elucidate the pathways of transformation of arsenic compounds in the environment.
Additional InformationSloth, J. J., Larsen, E. H. & Julshamn, K. (2003). Determination of organoarsenic species in marine samples using gradient elution cation exchange HPLC-ICP-MS. J. Anal. At. Spectrom., 18, 452–459.
Reprinted from 1st Edition Agilent Handbook of Hyphenated ICP-MS Applications, August 2007.

20
Application of Compound Independent Calibration Software to Arsenic Speciation
Keywordscompound independent calibration, CIC, heteroatom, arsenic, arsenobetaine, monomethylarsonic acid, arsenite, As(III), dimethylarsinic acid, arsenate, As(V), urine
IntroductionLiquid chromatography (LC) coupled to ICP-MS has gained increasing popularity for speciation studies during the last 15 years. ICP-MS offers sensitivity in the ng/L range for most elements, including Sn, Se, As, Hg, and so forth. However ICP-MS cannot determine the compound form (or species) of the element directly and therefore a separation technique has to be employed. LC (or ion chromatography (IC)) allows the use of column chemistries to separate the species and ‘identify’ the individual forms of the elements based upon their retention times. With well-developed separation chemistry that is reliable and reproducible, LC-ICP-MS is an elegant and powerful solution to the problem of species identification.
Provided the chemistry is stable, the only real limitation to routine analysis is calibration of the species of interest. Standards for some species might not be commercially available (or obtainable in a pure enough form for use as calibration standards) or are prohibitively expensive for routine use — for example, arsenobetaine can be as expensive as 200 Euro for 50 mg.
An alternative is to use the ability of ICP-MS to perform compound independent calibration (CIC) using the heteroatom — in this case arsenic. Within the plasma all compounds are essentially converted to their component atoms before ionization; therefore the compound’s response is based solely upon the As signal and calibration for As should be independent of the species.
Here we compare data obtained using CIC to that obtained using traditional compound specific calibration (CSC).
ExperimentalAn Agilent 7700x ICP-MS was coupled to an Agilent 1260 HPLC fitted with an Agilent arsenic speciation column and guard column as described by Sakai et al. [1]. The mobile phase consisted of 2.0 mM PBS/0.2 mM EDTA/10 mM CH3COONa/3.0 mM NaNO3/1% EtOH, pH 11.00 adjusted
with NaOH and Ar purged throughout the run. This configuration allows the direct injection of undiluted urine. Instrumental conditions are given in Table 1. Both the HPLC and ICP-MS were fully controlled by the Agilent MassHunter workstation software.
Results and DiscussionIn order to test the robustness of the method over a typical analytical run, twelve patient urine samples were injected directly along with calibration standards. Analysis of the samples and standards was repeated three times giving a total run time of over 13 hours.
Raimund Wahlen and Glenn Woods Agilent Technologies, UK
Agilent 1260 HPLC
Column G3288-80000 (4.6 × 250 mm) G3154-65002 (guard column) Flow rate 1.0 mL/min Injection volume 5 μL
Table 1. HPLC and ICP-MS instrument operating conditions
Repeatability for a 50 μg/L standard is displayed in Figure 1. A standard was used in order to check for any signal drift or retention time shift for all five species after multiple injections of undiluted urine (×36) and standard solutions (×12).
The samples were quantitated using CSC and recalculated using CIC based upon the most readily available inorganic arsenic standard — As(V). Data are presented in Table 2. The ratio of CIC/CSC displays the closeness of fit between the two calibration strategies.
Agilent 7700x ICP-MS
RF power 1550 W Sampling depth 9.0 mm Spray chamber temperature 2 °C Carrier gas flow rate 1.04 L/min Make-up gas flow rate 0.3 L/min (to purge mobile phase) Nebulizer MicroMist

21www.agilent.com/chem/icpms
Figure 1. Overlaid chromatograms (3×) (50 µg/L standard) over a 13 h run of undiluted urine (highlight displays As(V) integration window)
Patient 1 49.41 48.72 3.69 3.32 0.36 0.32 0.53 0.61 0.42 0.42 Patient 2 514.55 507.33 6.82 6.13 ND ND 0.67 0.77 0.92 0.92 Patient 3 10.33 10.19 7.60 6.83 0.66 0.59 0.90 1.04 0.75 0.75 Patient 4 21.85 21.55 1.54 1.38 ND ND ND ND 0.66 0.66 Patient 5 21.63 21.32 1.49 1.34 ND ND ND ND 1.01 1.01 Patient A 1.26 1.24 200.62 180.34 4.21 3.76 21.99 25.42 5.27 5.27 Patient B 63.36 62.47 33.22 29.86 0.60 0.54 1.95 2.25 1.11 1.11 Patient C 158.89 156.66 20.33 18.27 0.39 0.35 0.68 0.79 1.71 1.71 Patient D 63.07 62.18 5.95 5.35 0.35 0.31 0.62 0.71 0.74 0.74 Patient E 981.72 967.95 25.61 23.02 0.96 0.86 2.13 2.46 1.23 1.23 Patient F 3.54 3.49 8.43 7.58 ND ND 0.83 0.96 2.76 2.76 Patient G 43.18 42.58 46.11 41.45 ND ND 2.38 2.75 3.53 3.53 CIC/CSC 0.986 ND 0.899 ND 0.891 ND 1.16 ND 1.00 ND
Table 2. Comparison of CSC and CIC data in μg/L for arsenobetaine (AB), monomethylarsonic acid (MMA), arsenite As(III), and dimethylarsinic acid (DMA). All peaks calibrated using arsenate (As(V)).
AB MMA As(III) DMA As(V) Sample CSC CIC CSC CIC CSC CIC CSC CIC CSC CIC

22
ConclusionsA direct data comparison confirms the feasibility of CIC as an alternative to traditional compound specific calibration; a calibration regime using two or more of the readily available (or less expensive) As species combined with CIC would undoubtedly yield even closer agreement. The benefit of CIC can also be extended to unexpected/unknown peaks, for example arsenosugars.
AcknowledgementThe authors would like to give special thanks to Leeds NHS Teaching Hospital, UK for providing the patient samples.
Reference1. Sakai, T. & Wilbur, S. Routine analysis of toxic arsenic species in urine using HPLC with ICP-MS. Agilent application note, publication number 5989-5505EN.
23www.agilent.com/chem/icpms
Benefits of HPLC-ICP-MS Coupling for Mercury Speciation in Food
KeywordsBCR-464, tuna muscle, Dolt-4, dogfish liver, Hg2+, methylmercury, ethylmercury, phenylmercury
IntroductionMercury is highly toxic to living organisms. This element is naturally encountered at relatively low concentration in the environment but with its amplification through the food chain, the final concentration in some foods can be relatively high. In addition, its toxicity is not only linked to its total concentration but also to its species. Therefore, mercury speciation in food analysis is required to fully estimate the toxicity of this element to humans.
Due to the low detection limits required, the use of the GC-ICP-MS has traditionally been preferred for Hg speciation. However, recent developments in ICP-MS have yielded improvements in sensitivity and also tolerance to sample and solvent matrices, so HPLC-ICP-MS can now be applied more effectively to Hg speciation measurement. In contrast to GC separation, sample extracts are directly injected into the HPLC and no species derivatization is required.
In this study, the use of HPLC-ICP-MS was evaluated for the speciation analysis of mercury in food samples. The separation of four alkyl mercury species was achieved using a rapid organic solvent gradient. Advances in RF generator technology allowed the switch between aqueous and organic solvent to be made without affecting plasma stability. The method was evaluated with the use of certified reference materials.
ExperimentalInstrumentationChromatographic analysis was performed using an Agilent 1260 binary pump HPLC with autosampler. The column was a Zorbax C-18, 4.6 × 50 mm, with 1.8 µm particle size. The chromatographic details are shown in Table 1 (top). The separation is an optimization of previous works made by Hight et al. [1].
Sébastien Sannac, Yu-Hong Chen, Raimund Wahlen and Ed McCurdy Agilent Technologies
An Agilent 7700x ICP-MS fitted with a MicroMist nebulizer was used for the detection of mercury at m/z 201 in no gas mode. The addition of oxygen (mix of 20% O2 in argon) was used to enable the direct introduction of organic solvent into the ICP-MS without the risk of carbon buildup on the interface. Platinum cones and a 1.0 mm injector torch were used (nickel cones would give the same performance but are susceptible to oxidation damage by an excess of O2 in the plasma). ICP-MS parameters are shown in Table 1 (bottom).
Agilent 1260 HPLC
Flow rate 1 mL/min Injection volume 50 µL Mobile phase: A channel 0.5 g/L L-cystein 0.5 g/L L-cystein, HCl, H20 pH = 2.3 with HCl Mobile phase: B channel Methanol
Table 1. HPLC and ICP-MS instrument operating conditions
Agilent 7700x ICP-MS
RF power 1600 W Carrier gas flow rate 0.54 L/min Make-up gas flow rate 0.10 L/min Option gas (O2) 9% (of carrier and make-up gas flow rates) Spray chamber temperature -5 °C Sampling depth 8.0 mm
Both the 1260 HPLC and 7700x ICP-MS were directly controlled from the ICP-MS MassHunter software. In addition to making the HPLC-ICP-MS system easy to set up and use, control of the complete system by the ICP-MS MassHunter software increases safety, since if one instrument shuts down, the software will automatically shut down the second instrument.

24
Sample preparation Two certified reference materials (CRMs) were used for the evaluation of the method. BCR-464 Tuna Muscle (IRMM, Belgium) is certified at 5.12 ± 0.16 mg(Hg)/kg for methylmercury, representing 97% of its total mercury content. DOLT-4 Dogfish Liver (NRC, Canada) contains MeHg+ at 1.33 ± 0.12 mg(Hg)/kg (52% of its total mercury content). The extraction procedure used has been published previously [2]. Briefly, 150 mg of material is extracted in 20 mL of mobile phase A (see Table 1). Extraction was assisted with the use of a microwave extraction system: hold for 11 min at 140 W. The supernatants are directly injected into the HPLC after filtration through 0.45 µm filters.
Chromatographic Analysis Under isocratic conditions the separation of three mercury species are obtained in less than 3 minutes, but the fourth species, phenylmercury does not elute. To increase the eluting power of the mobile phase, gradient conditions were used. Figure 1 shows the gradient used during the separation: starting at 2% methanol and increasing to 90%.
Under these conditions, good separation of the four mercury species was obtained in less than 3 minutes (Figure 2). In addition, the plasma remained stable as the methanol content was increased from 2% to 90% in less than 1 minute due to the fast frequency-matching capability of the 7700 Series ICP RF generator. Likewise at the end of the separation, when the mobile phase switched back to 2% methanol, no plasma stability issues were observed.
Performance of the HPLC-ICP-MS System The system was calibrated with a mix of the four mercury species from 80 ng/L to 8 µg/L and 62 ng/L to 6.2 µg/L for MeHg+. Calibrations curves can be seen in Figure 3. All calibrations demonstrated excellent linearity over the calibration range. Background equivalent concentration (BEC) for all four species was lower than 15 ng/L.
Analysis of Samples The two CRMs were extracted and analyzed in triplicate according to the new method. Results are shown in Table 2. Since the content of inorganic mercury for each sample is not certified, the concentrations in brackets are based on the assumption that only Hg2+ and MeHg+ are present in the sample (no EtHg+ or PhHg+ was observed in the sample chromatograms). For MeHg+, the measured concentrations were in good agreement with the certified concentrations.
Figure 2. Separation of mercury species under gradient conditions
Figure 1. Gradient conditions used during the separation
100
80
60
40
20
00 50 100
Time (s)150 200
% M
eOH

25www.agilent.com/chem/icpms
Figure 3. Calibration curves for the analysis of the four mercury species
BCR-464 DOLT-4 Hg2+ MeHg+ Hg2+ MeHg+
Result 0.074 4.93 1.17 1.34RSD (%) 9 8 8 10Certified (0.12)* 5.12 ± 0.16 (1.25)* 1.33 ± 0.12 Recovery (%) 62 96 94 101
Table 2. Results for the analysis of the CRM sample. Concentrations are expressed in mg/kg of mercury. * Not certified.
AcknowledgementsGuillaume Labarraque and Caroline Oster from the Laboratoire National de Métrologie et d’Essais (LNE, France) are acknowledged for the preparation of the CRM extracts.
References 1. Hight, S. C. & Cheng, J. (2006). Anal. Chim. Acta., 567, 160–172.
2. Sannac, S., Labarraque, G., Fiscaro, P., Pannier, F. & Potin Gautier, M. (2009). Accred. Qual. Assur., 14, 263–267.
Conclusions A fast and effective HPLC-ICP-MS method has been developed for the analysis of mercury species in foods. The method performs the separation of four species in less than three minutes under gradient conditions. BECs were at the low ng/L (ppt) level, and the method was tested on certified samples with excellent agreement for species with certified concentrations.

26
Mercury Speciation Measurements in Fish Tissues and Sediments by HPLC-ICP-MS
Keywordsenvironmental, sediments, soil, fish muscle, methylmercury and mercury(II), HPLC-ICP-MS
IntroductionMercury is considered to be a major environmental pollutant on a global scale [1]. Environmental and health risks for mercury derive from methylmercury that is formed by biomethylation of mercury (II), which is carried out by microorganisms in sediment and soil [2]. Methyl mercury concentration, however, usually does not exceed 1.5% of the total mercury content in sediments [3]. Developing a sensitive, reliable and cost effective method to measure mercury species is important for the monitoring of mercury concentrations in biota and sediments in order to avoid ecotoxicological risks and to understand the biogeochemical cycling of mercury species in the environment [3]. Here, procedures for the extraction and determination of methylmercury and mercury (II) in fish muscle tissues and sediment samples using HPLC-ICP-MS are described.
ExperimentalInstrumentationTotal mercury concentrations in digests and extracts were determined using a PerkinElmer SCIEX ELAN DRC-e ICP-MS with a Ryton cross-flow nebulizer. Mercury species separation was performed by HPLC using a 3 µm C8 (30 mm × 3 mm) column coupled to the ICP-MS.
Procedures Fish muscle tissues by enzymatic extractionFreeze-dried samples (0.1 g) were weighed into 50 mL FEP tubes (Oakridge, Selby Scientific) with 10 mg of protease type XIV and 4 mL of phosphate buffer (pH = 7.5) containing 0.05% cysteine. The tubes were incubated for 2 h in a hybridization oven (XTRON HI 200, Bartlett Instruments) at 37 °C with rotation of samples at 20 rpm. Extracts were transferred to acid washed 10 mL polypropylene centrifuge tubes, made up to a final volume of 5 mL with buffer and centrifuged for 20 min at 3,000 rpm [1].
Fish muscle tissues and sediments by 2-mercaptoethanol extractionFreeze-dried samples (0.2 g) were weighed into 55 mL polytetrafluoroethylene (PTFE) digestion vessels with 5 mL or 2.5 mL of 0.5% v/v 2-mercaptoethanol in 5% v/v methanol for fish tissues or sediment samples respectively. The vessels were heated in a microwave oven at 120 °C for 15 min. The extracts were transferred to acid washed 10 mL polypropylene centrifuge tubes and centrifuged for 20 min at 3,000 rpm. For sediment samples only, after the supernatant was separated, the extraction was repeated and extracts combined.
HPLC-ICP-MSAll supernatants were filtered through an Acrodisc LC 13-mm Syringe filter with 0.2 mm PVDF membrane (Gelman, USA) before analysis. Aliquots of extracts were injected onto an HPLC-ICP-MS and mercury species separated and measured as described in Table 1. External calibration using the standards 0–100 µg/L was used. Hg species were quantified by peak area. Calibration curves for methylmercury (I) and mercury (II) standards were linear in the range of 0–100 mg/L. The lowest measurable mercury was 0.4 mg/L, which corresponds to 0.01 mg/g in samples.
F. Krikowa1, W. Maher1, Rajani Jagtap1, S. Foster1 and M. Ellwood2 1. Ecochemistry Laboratory, Institute for Applied Ecology, University of Canberra, Bruce, ACT, 2601, Australia 2. Research School of Earth Sciences, The Australian National University, Canberra, ACT, 0200, Australia

27www.agilent.com/chem/icpms
Results and DiscussionWhen 2-mercaptoethanol is used as an extraction reagent and is present in the mobile phase, methylmercury (I) elutes before mercury (II) with baseline separation of two peaks (Figure 1A). However, when cysteine was used in the extracting solution, the order of elution was reversed (Figure 1B). The elution of the methylmercury species first has advantages when analyzing sediment extracts, as these normally contain relatively large amounts of mercury (II) (Figure 1C) and elution of the mercury (II) peak first leads to severe peak tailing and memory effects in the ICP-MS.
Biota extracts normally contain relatively small amounts of mercury (II) (Figure 1D).
The use of the 2-mercaptoethanol solution to extract the certified fish tissue reference materials NRCC DORM-2 Dogfish Muscle, NRCC DOLT-3 Dogfish Liver, NIST RM-50 Albacore Tuna and IRMM IMEP-20 Tuna Fish gave values of 4.4 ± 0.8 mg/g, 1.55 ± 0.09 mg/g, 0.89 ± 0.08 mg/g and 3.5 ± 0.6 mg/g respectively while the use of the enzymatic extraction procedure gave 4.47 ± 0.1 mg/g, 1.4 ± 0.0 mg/g, 0.85 ± 0.0 mg/g and 4.24 ± 0.1 mg/g respectively. Results were in good agreement with the certified values (4.47 ± 0.32 mg/g, 1.59 ± 0.12 mg/g, 0.87 ± 0.03 mg/g and 4.24 ± 0.27 mg/g).
Recovery of methylmercury from the sediment certified reference material ERM CC 580 was 85 ± 1% (0.065 ± 0.05 mg/g compared to certified value 0.075 ± 0.0037 mg/g). Spiking of an in-house reference sediment material with 5, 10, 20 and 40 mg/g of methylmercury gave recoveries of 82 ± 12, 92 ± 3, 96 ± 1 and 89 ± 2% respectively.
Table 1. HPLC and ICP-MS instrument operating conditions
HPLC
Column C8, 3 µm (30 mm × 3 mm) Mobile phase 0.5% v/v 2-mercaptoethanol in 5% v/v CH3OH, pH 5.3 (flow rate, 1.5 mL/min; temperature, 25 °C) Sample volume 100 µL
PerkinElmer SCIEX ELAN DRC-e ICP-MS
RF power 1200 W Plasma argon flow rate 15 L/min Auxiliary argon flow rate 1.2 L/min Nebulizer gas flow rate 0.84 L/min Acquisition mode Peak hopping Isotopes monitored 202Hg, 201Hg, 200Hg, 198Hg, 181Ta, 184W Dwell time 300 ms Sweeps per reading 1 Replicates 1

28
Time (min)0 2 4 6 8 10 12
Resp
onse
0
10000
20000
30000
40000
50000MeHg+
Hg2+
Figure 1. HPLC-ICP-MS chromatogram of mercury standards and sediment reference material, ERM CC 580, using a PerkinElmer 3 µm C8 (30 mm × 3 mm) column and mobile phase containing 0.5% 2-mercaptoethanol and 5% v/v CH3OH (pH 5.3), at a flow rate of 1.5 mL/min and a temperature of 25 °C. A: Mercury standards in 2-mercaptoethanol. B: Mercury standards in 1% w/w cysteine. C: Sediment reference material ERM CC 580 extracted with 2-mercaptoethanol. D: DORM-2 extracted with 2-mercaptoethanol.
A B
CD
ConclusionsWe have developed and validated procedures for the extraction and determination of methylmercury and mercury (II) in fish muscle tissues and sediment samples using HPLC-ICP-MS. The analysis of the CRMs showed good agreement with certified values.
References1. Rai, R., Maher, W. & Kirkowa, F. (2002). Journal of Analytical Atomic Spectrometry, 12, 1560–1563.
2. Tutschku, S., Schantz, M. M. & Wise, S. A. (2002). Analytical Chemistry, 74, 4694–4701.
3. Tseng, C. M., Diego, A. D., Martin, F. M., Amouroux, D. & Donard, O. F. X. (1997). Journal of Analytical Atomic Spectrometry, 12, 743–750.
Time (min)0 1 2 3 4 5
Resp
onse
0
2000
4000
6000
8000
10000
MeHg+
Hg2+
Time (min)0 2 4 6 8 10 12
Resp
onse
0
5000
10000
15000
20000
MeHg+
Hg2+
Time (min)0 1 2 3 4 5 6
Resp
onse
02000400060008000
1000012000140001600018000
MeHg+
Hg2+

29www.agilent.com/chem/icpms
Determination of Mercury Species in Crude Oil by Speciated Isotope Dilution LC-ICP-MS
Keywordsmercury, environmental, crude oil, EPA Method 3200, monomethyl mercury, monoethyl mercury, SIDMS
IntroductionMercury is found in a variety of chemical and physical forms in the environment arising from many sources, both natural and anthropogenic. Among the contributors of mercury to the environment, the burning of fossil fuel is a significant concern. Sources include natural gas, gas condensate, crude oil and petroleum, which may contain significant amounts of mercury. Depending on the region, crude oil produced around the world may contain mercury ranging from 0.1 to 20,000 µg/kg [1]. The nature of mercury compounds in crude oil is not well characterized and quantified. The presence of mercury species in crude oil facilitates a variety of reactions possible with metallic surfaces, forming amalgams, impairing proper operation of the equipment, clogging pipelines and poisoning catalysts. As such, the determination of mercury in crude oil is essential to understand the mechanisms of interaction of mercury with equipment and catalysts, the optimization of downstream processes, its effective removal and to evaluate and safeguard against hazards to workers [2]. The aim of our work was to measure, with high accuracy, extractable mercury species from crude oil using speciated calibration curve-free isotope dilution mass spectrometry (ccf-SIDMS). The unique ccf-SIDMS capability performed the dual role of quantifying and correcting for species transformation of up to three or four species simultaneously [3]. We believe this is the first time speciation of crude oil for extractable mercury compounds has been done with such level of accuracy.
ExperimentalHPLC conditionsThe chromatography system consisted of two 818 IC Pumps, a 762 IC Interface, software IC Net v2.3 SR3, and an 838 IC Autosampler (Metrohm USA). The separation system included a six-port sample injector equipped with a 100 µL sample loop and a 5 µm Supelcosil LC-18 HPLC column (300 mm × 4.6 mm, 5 µm) to separate different mercury species. See Figure 1.
ICP-MSAn Agilent 4500 ICP-MS was used for detection. Instrument operating conditions are shown Table 1.
G. M. Mizanur Rahman1, Timothy M. Fahrenholz1, Matt Pamuku2 and H. M. Skip Kingston1 1. Department of Chemistry and Biochemistry, Duquesne University, Pittsburgh, PA, 15282, USA. 2. Applied Isotope Technologies, Inc., Sunnyvale, CA, 94087, USA.
Table 1. RP-HPLC and ICP-MS instrument operating conditions
Agilent 4500 ICP-MS
RF power 1450 W Plasma gas flow rate 15.0 L/min Auxiliary gas flow rate 1.0 L/min Analysis mode TRA Isotopes monitored 199Hg, 200Hg, 201Hg, 202Hg Dwell time 0.1 s per isotope Nebulizer gas flow rate 1.0 L/min
Reagents, solutions and samplesHigh-purity double deionized (DDI) water (18 M /cm), Optima HNO3 and H2O2; and Reagent grade L-Cysteine, pyridine and methanol were used. The samples were obtained from one of the crude oil companies. A Method 6800-compliant, 3Hg-SPC mercury speciation analysis kit, containing both natural (isotopic) abundant and isotopic enriched mercury species and SIDMS-deconvolution software was obtained from Applied Isotope Technologies, Inc.
Sample preparation procedure for mercury speciationThe crude oil samples and procedural blank were extracted according to EPA Method 3200 after isotopic labeling using laboratory microwave system.
RP-HPLC
Column Supelcosil LC-18 (300 mm × 4.0 mm, 5 µm) Mobile phase 0.4% (w/v) L-Cysteine + 0.05% (v/v) 2-mercaptoethanol + 0.06 mol L-1 ammonium acetate + 5% (v/v) methanol Flow rate 1 mL/min Injection volume 100 µL

30
Results and DiscussionTo perform SIDMS analysis, samples were processed in accordance with EPA Method 3200 after triple-spiking with known amounts of isotopically enriched stable mercury species. After equilibration with the sample species, the samples were extracted using EPA Method 3200 and the extracts were analyzed using HPLC-ICP-MS. The deadtime and mass bias corrected isotope ratios for 199Hg/202Hg, 200Hg/202Hg and 201Hg/202Hg were calculated for inorganic mercury, monomethylmercury and monoethylmercury in each of the sample replicates. The SIDMS calculations were performed to determine the concentrations of inorganic mercury, monomethylmercury and monoethylmercury, and to deconvolute the interspecies transformations using the 3Hg-SPC software (www.sidms.com). The final concentrations for all extractable mercury species in crude oil samples, the percent of interspecies transformation during extraction are summarized in Table 2.
Table 2 demonstrates that the concentration of inorganic mercury ranges from 17.3 ± 3.6 ng/g to 23.6 ± 3.7 ng/g, monomethylmercury ranges from 0.5 ± 0.1 to 0.8 ± 0.1 ng/g and monoethylmercury ranges from 7.4 ± 2.2 to 10.7 ± 1.1 ng/g. The degree of de-ethylation to inorganic mercury was higher for all crude oil samples and was in the range of 55.1% and 86.9%, whereas the demethylation to monomethylmercury was negligible in all samples and was in the range of 0.8% and 0.9%.
Figure 1. HPLC-ICP-MS chromatograms obtained for 10 ppb three mercury species

31www.agilent.com/chem/icpms
Table 2. SIDMS analysis results for two of the eight crude oil samples analyzed. Uncertainties are at 95% CL, n = 8. The 95% CL was calculated based on pooled standard deviation
Sample Inorganic Methylmercury Ethylmercury Hg2+ to MeHg+ to MeHg+ to EtHg+ to EtHg+ to Hg2+ to name mercury (CH3Hg+), (C2H5Hg+), MeHg+ Hg2+ EtHg+ MeHg+ Hg2+ EtHg+ (Hg2+), ng/g ng/g ng/g (%) (%) (%) (%) (%) (%)
Serial # 871833 17.3 ± 3.6 0.8 ± 0.1 10.7 ± 1.1 9.6 ± 0.9 2.9 ± 0.8 0.8 ± 0.1 6.1 ± 0.6 55.1 ± 2.2 2.1 ± 1.0 Serial # 870987 23.6 ± 3.7 0.5 ± 0.1 7.4 ± 2.2 7.4 ± 1.0 6.2 ± 1.0 0.9 ± 0.1 7.9 ± 0.8 86.9 ± 1.5 1.3 ± 0.1
ConclusionsHPLC-ICP-MS analysis of mercury species can be successfully used for crude oil samples by following ccf-SIDMS (EPA Method 6800). The method detection limit for Hg2+, CH3
Hg+ and C2H5Hg+ was better than 0.1 ng/mL, which corresponds to 1 ng/g in crude oil sample.
References1. Wilhelm, S. M., Liang, L., Cussen, D. & Kirchgessner, D. A. (2007). Environ. Sci. Technol., 41(13), 4509.
2. Yan, T. Y. (1996). Ind. Eng. Chem. Res., 35, 3697.
3. US EPA (2008). Method 6800. Test Methods for Evaluating Solid Waste, Physical/Chemical Methods SW 846, Update IV-A. US Government Printing Office, Washington, D.C., USA.

32
Low-Level Speciated Analysis of Cr(III) and Cr(VI) using LC(IC)-ICP-MS
Keywordschromium speciation, Cr(VI), Cr6+, hexavalent chromium, ion chromatography, drinking water, RoHS
IntroductionChromium (Cr) is used in stainless steel and other alloys, and is commonly used to provide a corrosion-resistant coating to steel and other metals. Cr is also widely used in dyes, preservatives and the tanning industry. Cr typically exists in one of two common oxidation states, Cr(III), also known as Cr3+ or trivalent chromium, and Cr(VI), Cr6+ or hexavalent chromium. These two oxidation states differ markedly in their properties, in that Cr(III) is an essential trace dietary nutrient for humans, while Cr(VI) is a known carcinogen. As a result, Cr is monitored and regulated in many sample types, including the environment, food, drinking water, pharmaceutical products and consumer goods. Worldwide, Cr is typically regulated in drinking water at a maximum allowable level of around 50 to 100 µg/L (ppb), but the Office of Environmental Health Hazard Assessment (OEHHA) of the California EPA has recently published a draft Public Health Goal proposing a “negligible risk” limit more than 1000× lower at 0.02 µg/L (20 ng/L or ppt) Cr(VI) in drinking water. The US EPA is expected to follow suit. Cr(VI) is also regulated in waste products, for example under the European Union Restrictions on Hazardous Substances (RoHS) regulations, which control certain harmful substances (including Cr(VI)) in electrical and electronic goods. Occupational exposure to Cr(VI) is strictly controlled in many industries; recent studies have also indicated a health risk from chronic exposure to low levels of Cr(VI) by ingestion. As a result, there is a need for a routine, highly sensitive method to determine both Cr(III) and Cr(VI) in a wide range of sample types. An HPLC-ICP-MS method using collision/reaction cell ICP-MS operated in helium cell mode is described below.
ExperimentalThe Agilent 7700 Series ICP-MS with the Octopole Reaction System (ORS3) collision/reaction cell (CRC) provides sensitive and specific analysis of chromium (Cr) in the presence of multiple interferences. These interferences arise from carbon (ArC) and chloride (ClO)
and can affect the two major isotopes of Cr at mass 52 and 53. Operating the ORS3 in helium mode removes the matrix-based polyatomic interferences from both Cr isotopes, allowing data to be internally validated by comparing the measured results for both isotopes. However, to directly measure Cr(VI), it must be separated from Cr(III), typically by anion exchange liquid chromatography (LC) or ion chromatography (IC), prior to the ICP-MS measurement. LC/IC-ICP-MS is a routine, well-established speciation technique. Measurement of Cr(VI) alone is simple, but the determination of both Cr species is more difficult, because Cr(III) is cationic and Cr(VI) is anionic in solution. In real sample analysis, the measurement can also be compromised by mineral elements in the sample competing for binding sites in the column, leading to low recovery and retention time shifts. A newly developed method overcomes these challenges.
HPLC conditionsAn Agilent 1200 high performance liquid chromatograph (HPLC) equipped with a binary pump, autosampler and vacuum degasser was used in this study. The LC was fitted with the Agilent LC biocompatibility kit (part number 5065-9972), which replaces the metal components in the LC sample path with inert materials such as PEEK. The HPLC system was connected to the ICP-MS using the Agilent LC connection kit. An anion exchange column (4.6 mm internal diameter × 30 mm polyhydroxymethacrylate base resin) was used for separation. The column was maintained at ambient temperature for all experiments. Details of the operating conditions are reported in Table 1 (top).
ICP-MS conditionsAn Agilent 7700x ICP-MS was used for Cr detection, and instrument operating conditions are shown in Table 1 (bottom). The ORS3 was operated in helium mode to remove the matrix-based interferences ArC and ClOH on the primary Cr isotope at m/z 52 and ClO on the secondary isotope at m/z 53. 53Cr, was measured in addition to the primary 52Cr isotope to give confirmation of the results at the primary isotope. He mode is universal (works for all polyatomic species), so the same He mode conditions could be used for both Cr isotopes.
Mina Tanoshima1, Tetsushi Sakai1 and Craig Jones2 1. Agilent Technologies, Tokyo, Japan 2. Agilent Technologies, Santa Clara, CA, USA

33www.agilent.com/chem/icpms
Table 1. HPLC and ICP-MS instrument operating conditions. * High-purity Na-EDTA (Dojindo Laboratory, Japan) was used for this work and no problem of trace metal contamination was encountered.
Agilent 1200 HPLC
Column Agilent anion exchange, p/n G3268-80001, 4.6 mm × 30 mm Mobile phase 5 mM EDTA (2Na)* — 5 mM NaH2PO4 / 15 mM Na2SO4, pH = 7.0 adjusted with NaOH Flow rate 1.2 mL/min Temperature Ambient Injection volume 100 μL
Agilent 7700x ICP-MS
RF power 1550 W Sampling depth 8 mm Carrier gas flow rate 1.05 L/min Dwell time 0.5 s/isotope Isotopes monitored 52Cr, 53Cr Cell gas He at 4 mL/min
Table 2. DLs for Cr species as a function of injection volume
Injection Peak height/counts Noise Area/counts DL (µg/L) volume (µL) 52Cr(III) 52Cr(VI) 52Cr(III) 52Cr(VI) 52Cr(III) 52Cr(VI)
5 32621 24233 204 514586 503778 1.88 2.53 20 130764 97934 314 2101007 2007572 0.72 0.96 50 323593 241948 300 5154321 4970771 0.28 0.37 100 632808 475244 274 10204281 9796463 0.13 0.17
Table 3. Major element composition for three different mineral waters
Element Water A (ppm) Water B (ppm) Water C (ppm)
Na 6.5 11.6 9.4 Ca 9.7 11.5 468 Mg 1.5 8 74.5 K 2.8 6.2 2.8 Sulfate - - 1121
Figure 1 shows the chromatograms obtained from mineral water A: unspiked and also spiked with 10 µg/L of both Cr(III) and Cr(VI). Table 4 shows the summary results for the long-term analysis of all 3 water samples (8 hours, n=30 for each sample). The excellent long-term stability and the accurate recovery of ppb-level spikes for both Cr species validates the effectiveness of the optimized method, and is especially impressive considering the high matrix level of Water C. RSDs for Cr(VI) and Cr(III) peak area and concentration were all <2.5%, demonstrating the stability and reproducibility of the method for use in routine labs. Furthermore, adding EDTA to form Cr(III)-EDTA prevented interconversion between Cr(III) and Cr (VI), demonstrated by good spike recovery for both species.
Quantification of Cr(VI) at ultratrace levelsWhile the new method was developed to measure both Cr(III) and Cr(VI) in drinking water, the State of California in the US has recently (2009) proposed a new “Public Health Goal” of 0.02 µg/L for Cr(VI) in drinking water. To meet this goal, the method was optimized for higher sensitivity and selectivity for Cr(VI) alone. The same column was used for separation, but the method was modified with a larger injection volume and lower concentration of EDTA(2Na) in the mobile phase. With these modifications, Cr(III) could not be quantified because of interference from the water dip due to the large injection volume.
Results and DiscussionUnder the conditions described above, detection limits (DLs) of <200 ng/L for both 52Cr(III) and 52Cr(VI) were obtained. DLs were calculated as three times the peak-to-peak signal-to-noise. The DLs obtained with injection volumes ranging from 5 µL to 100 µL are shown in Table 2.
Drinking water analysisThis method was applied to the determination of both Cr(III) and Cr(VI) species in spiked and unspiked mineral water samples. The three samples evaluated were a Japanese mineral water (Water A), and two French mineral waters referred to as Water B and C. The drinking waters selected covered a range of typical mineral water compositions. Water C was very highly mineralized (over 450 ppm Ca and over 1000 ppm sulfate). The major element composition of the water samples is shown in Table 3.

34
Figure 1. Overlaid chromatograms for Mineral Water A — unspiked (black) and spiked with 10 µg/L Cr species (blue). Cr(III) elutes at ~1 min, Cr(VI) at ~2.5 min
52Cr(III)-EDTA 52Cr(VI) Sample Area Conc. (µg/L) Area Conc. (µg/L)
Table 4. Concentration data for 10 µg/L spiked mineral water and stability test data (8 hours, n = 30)
Water A Average 906,410 10.4 913,019 10.3 %RSD 1.4 1.4 2.1 2.1 Water B Average 933,560 10.7 920,154 10.3 %RSD 1.0 1.0 2.3 2.3 Water C Average 900,775 10.3 879,234 9.9 %RSD 0.8 0.8 1.4 1.4
Using the larger injection volume and modified mobile phase, the detection limit for Cr(VI) was reduced to single ng/L (ppt). Although high concentration anions are present in drinking water, no peak shape change or retention time shift occurred, as illustrated in the chromatograms for a 50 ng/L standard and 3 California waters shown in Figure 2. Calibration linearity was better than 0.9995 for Cr(VI) (calibration range 0.05–1.00 µg/L) as shown in Figure 3. The Cr(VI) detection limit (3× peak-to-peak signal-to-noise) was calculated at 0.008 µg/L.
Table 5 shows the analysis and spike recovery data for the two drinking waters (tap water A and B) and the river water (river water A) from California. The measured concentration of Cr(VI) in all three samples exceeded the proposed California regulation of 0.02 ppb. Overlaid chromatograms for tap water A (unspiked and spiked with 0.5 µg/L Cr(VI)) are shown in Figure 4.
Figure 2. Chromatograms of a 50 ng/L Cr(VI) standard solution (left) and three different waters (unspiked) from the State of California (right)

35www.agilent.com/chem/icpms
Figure 3. Calibration plot for Cr(VI) using modified method
Table 5. Analysis and spike recovery data (0.5 µg/L Cr(VI)) for three different water samples. Units: µg/L
Tap Water A Tap Water B River Water A Non-spiked Spiked Recovery Non-spiked Spiked Recovery Non-spiked Spiked Recovery (%) (%) (%)
1 0.1840 0.6335 90.58 0.1203 0.6198 99.12 0.0411 0.5231 96.272 0.1772 0.6470 93.28 0.1281 0.6222 99.60 0.0423 0.5282 97.30Average 0.1806 0.6403 91.93 0.1242 0.6210 99.36 0.0417 0.5256 96.79
Figure 4. Chromatograms of Cr(VI) for spiked (0.5 µg/L) and unspiked tap water A
ConclusionsAccurate, sensitive determination of chromium species in highly mineralized waters was demonstrated using anion exchange chromatography after conversion of Cr(III), which is cationic, to its anionic form by complexing with EDTA. Analysis is rapid, taking only about 3 minutes, and is capable of measuring both species at concentrations less than 200 ng/L. To improve Cr(VI) sensitivity further, the method was modified by adjusting the mobile phase and increasing the injection volume. While this prevents the simultaneous measurement of Cr(III), the detection limit for Cr(VI) was improved to ~0.008 µg/L (8 ppt), which is well below the draft Public Health Goal of 0.02 µg/L proposed by the State of California.

36
Keywordschromium speciation, Cr(VI), Cr6+, chrome, ion chromatography, SIDMS, chromite ore processing residue, COPR
IntroductionChromium species may exist in several oxidation states, but the hexavalent, Cr(VI) and trivalent, Cr(III) oxidation states are most common in the environment. The toxicity of chromium species depends on the species’ chemistry and on its bioavailability, both of which are related to its chemical form (species) and concentration. Trivalent chromium is regarded as more stable, relatively non toxic and known to be an essential trace nutrient in the human diet helping to maintain effective glucose, lipid and protein metabolism. Hexavalent chromium is considered toxic and carcinogenic because it can diffuse easily through the cell membrane and oxidize biological molecules [1]. The objectives of this study were to apply EPA Method 6800, which uses speciated isotope dilution mass spectrometry (SIDMS), and to compare chromium speciation results from SIDMS with those obtained from conventional techniques [2].
ExperimentalInstrumentationAn Ethos-1 laboratory microwave system (Milestone, Monroe, CT, USA) equipped with temperature and pressure feedback control and magnetic stirring capability was used in the microwave digestion and extraction processes. The chromatography system consisted of two 818 IC Pumps, a 762 IC Interface, software IC Net v2.3 SR3, and an 838 IC Autosampler (Metrohm USA). The separation system included a six-port sample injector equipped with a 100 µL sample loop and an anion exchange column, PEEK 250 mm x 4.6 mm, 10 µm (PRP X-100, Hamilton) to separate Cr(VI) and Cr(III). Because no special interface is required between the PRP X-100 Cr column and the ICP-MS (Agilent 7700x), one outlet of the column is interfaced directly to the nebulizer of the ICP-MS with a length of PFA tubing, and the other end is connected to a 100 µL
sample loop. Figure 1 shows a typical separation of Cr(III) and Cr(VI) using this system at a flow rate of 1.0 mL/min. The operating conditions of the IC-ICP-MS are shown in Table 1.
Determination of Hexavalent Chromium in NIST SRM 2701 by Speciated Isotope Dilution Mass Spectrometry (EPA Method 6800) using IC-ICP-MSG. M. Mizanur Rahman, Naudia Martone and H. M. Skip Kingston Department of Chemistry and Biochemistry, Duquesne University, Pittsburgh, PA 15282, USA
Metrohm 818 IC
Table 1. IC and ICP-MS instrument operating conditions
IC pumps Metrohm 818 IC (PEEK) Column PRP X-100 anion exchange (250 mm × 4.6 mm, 10 µm) (PEEK) (Hamilton) Mobile phase A: 0.06 M NO3
- (pH 9.3), and B: 0.06 M NO3
- (pH 1.2) Flow rate 1 mL/min Gradient program 1: 0 min, 0% B, 2: 6 min, 0% B, 3: 7 min, 100% B, 4: 10 min, 100% B, 5: 10.5 min, 0% B, 6: 13 min, 0% B Injection volume 100 µL
Column temperature Ambient Nebulizer MicroMist Spray chamber Scott Collision gas He Isotopes monitored 50Cr, 52Cr, 53Cr Acquisition mode Time-resolved analysis Integration time per mass 0.1 s Total analysis time 14 min
Agilent 7700x ICP-MS
Reagents, solutions and samplesHigh purity double deionized (DDI) water (18 MΩ/cm), optima HNO3 and concentrated NH3(aq)(15 mol/L) were used. An extraction solution containing 0.5 mol/L NaOH and 0.28 mol/L Na2CO3 was prepared by dissolving the reagents in DDI water. The eluents A and B were prepared by adding 7.8 mL optima HNO3 and 2.0 mL of 10 mg/mL thulium (Tm) standard into a 2 L polyethylene bottle. The final pH of eluent A was adjusted to approximately 9.3 with concentrated NH4OH.

37www.agilent.com/chem/icpms
Five reference standard solutions were prepared, including natCr(III) standard, 1.0 mg/g in 1% HNO3; natCr(VI) standard, 50 µg/g in DDI water; 50Cr(III) spike, 1.0 mg/g in 1% HNO3; 53Cr(VI) spike, 150 µg/g in 1% NH3(aq); and srmCr (NIST SRM 979), 10 µg/g in 1% HNO3. The working solutions of natCr(VI), natCr(III) and srmCr (for deadtime and mass bias correction) were gravimetrically prepared from the stock natCr(VI), natCr(III) and srmCr, by diluting with DDI water to the desired mass.
A standard reference material (SRM), SRM 2701 (Hexavalent Chromium in Contaminated Soil, High Level from National Institute of Standards and Technology, Gaithersburg, MD, USA) was used in this study [3].
Sample preparation procedure for Cr(VI) Approximately 0.5 g of sample and 25 mL of extraction solvent were weighed into a microwave vessel. Appropriate amounts of 50Cr(III) and 53Cr(VI) ('double-spiking') were added to the vessel. The amount of isotopic spike depends on the expected levels of Cr(VI) and Cr(III) in the sample. The vessels were sealed and heated at 95 ± 2 °C in the microwave unit for 1 h with constant stirring. A second set of samples was extracted using the same procedure without spiking with isotope enriched materials. After extraction, the vessels were allowed to cool to room temperature and then the solutions were filtered using a 0.22 µm glass fiber filter and stored at 4 °C until analysis (usually less than a week). The filtrates were analyzed directly using the PRP X-100 column.
Results and DiscussionThe concentration of hexavalent chromium in the extract was determined by two methods: (i) external calibration and (ii) SIDMS analysis by double spiking the sample before extraction.
IC-ICP-MS determination using external calibration The extracts (non-spiked with isotopic species) were analyzed by IC-ICP-MS for Cr(VI). The concentration of both Cr(III) and Cr(VI) was calculated by using the Agilent 7700 ICP-MS MassHunter Software (Figure 2). The final concentration of Cr(VI) in the samples was calculated from the calibration curve using natCr(VI) as the calibration standard (Table 2, Column 2). The Cr(VI) concentration was 478.87 ± 4.20 µg/g. This is consistent with the Cr(VI) concentration that was found during an interlaboratory study of this SRM using Method 7196A and Method 7199, which rely on an external calibration curves to determine the analyte concentration.
Under the conditions stated in Table 1, the LOD (n = 3) for Cr(VI) is 0.1 ng/mL. The LODs are based on a 100 µL PEEK sample loop. Table 3 illustrates the method’s reproducibility for both response and concentration.
Figure 1. IC-ICP-MS chromatogram for 25 ppb Cr(III) and Cr(VI) standard
Coun
tCo
unt
TIC : 25PPB2.D
Cr(VI) : Target(50)
x104
2
0
x103
0
1
RT (min)
RT (min)
4.0 8.0 12.0
Cr(VI) Cr(III)
7.0 7.5 8.0 8.5

38
Figure 2. Calibration curve for Cr(VI)
Analysis mode Cr(VI) conc. Conversion from (µg/g) Cr(III) to Cr(VI) (%)
Table 2. Concentration of Cr(VI) in NIST SRM-2701. Uncertainties are at 95% CI, n = 12. Certified value = 551.2 ± 34.5 µg/g (with SIDMS).
IC-ICP-MS (external 478.87 ± 4.20 - calibration) SIDMS (He mode; 539.20 ± 3.77 1.94 ± 0.50 PRP X100)
Cr(III) area Cr(VI) area Cr(III) conc. Cr(VI) conc. (ppb) (ppb)
Table 3. A mixture of 25 ppb Cr(III) and 27 ppb Cr(VI) standard (n = 7)
Average 63,411 71,116 25.69 27.01 Standard 568 1,441 0.38 0.55 deviation % RSD 0.89 2.03 1.49 2.03
the concentration of both Cr(III) and Cr(VI) present in the sample at the time of spiking, as well as the amount of interconversion that took place during sample extraction and analysis (Table 2). From Table 3, Column 3, it can be observed that statistically there is no difference between the Cr(VI) results obtained during this study and that of the certified values at their 95% confidence interval (CI).
ConclusionsAccurate and reproducible results at very low detection levels for both chromium species were obtained during this study. The analysis time per sample was less than 15 minutes which can be reduced by using a shorter column. The Cr(VI) concentration agreed with the certified and reference Cr(VI) concentration for the SRM 2701. NIST’s certificate of analysis for SRM-2701 states that Method 6800 SIDMS was used to determine the true value.
The unique capability of SIDMS to track inter-species conversions and provide the analyst with the ability to make legally defensible corrections, especially for samples with highly reactive matrices, such as chromite ore processing residue (COPR), makes Method 6800 an indispensable tool for chromium speciation.
References1. Rahman, G. M. M., Kingston, H. M. S., Towns, T. G., Vitale, R. J. & Clay, K. R. (2005). Determination of hexavalent chromium by using speciated isotope-dilution mass spectrometry after microwave speciated extraction of environmental and other solid materials. Anal. Bioanal. Chem., 382, 1111–1120.
2. US EPA (2010). Method 6800A — Elemental and speciated isotope dilution mass spectrometry. Test Methods for Evaluating Solid Waste, Physical/Chemical Methods SW 846, Update V. US Government Printing Office (GPO), Washington, D.C., USA.
3. Certificate of Analysis for NIST SRM 2701. Hexavalent chromium in contaminated soil (high level). National Institute of Standards and Technology, Gaithersburg, MD, USA.
IC-ICP-MS detection by SIDMS: Double spiked before extraction (EPA Method 6800)A method 6800 compliant SIDMS analysis depends on some fundamental operations: isotopic spike preparation and calibration; sample collection; sample extraction; sample spiking; sample species and spike species equilibration; species separation; isotope ratio measurements of each speciated component; and deconvolution of the species concentrations and species transformations.
Sample extracts were analyzed directly by LC-ICP-MS without any pH adjustment using a PRP X-100 anion exchange column to separate Cr(III) from Cr(VI). The resulting chromatograms were integrated and the corresponding peak areas for chromium isotopes (50Cr, 52Cr and 53Cr) were exported into a personal computer for further manipulation. The dead time and mass bias corrected isotope ratios of 50/52 and 53/52 were determined for both Cr(III) and Cr(VI). The fully corrected isotope ratios were then entered in into the SIDMS software obtained from Applied Isotope Technologies supplied with the Cr-SPC Kit to determine
53 Cr(VI)x105
1
0
y = 2614.8681 * x + 31.0000R = 0.9991DL = 0 ppbBEC = 0.01186 ppb
112661.00
20.0 40.0Concentration (ppb)
60.0
Coun
t
43.0730

39www.agilent.com/chem/icpms
Keywordsselenium, dietary, pharmaceutical, nutritional, supplements, selenized yeast, reversed-phase, HPLC-ICP-MS
IntroductionSelenium (Se) is an essential trace element with several functions that are relevant to health. While the nutritionally essential functions of Se are understood to be fulfilled by the selenoproteins, dietary Se can be metabolized to low molecular weight species (for example, methyl-Se compounds) that have more recently generated interest because of possible anticancer effects [1]. In contrast to such beneficial effects, at a sufficiently high dose level, Se metabolites can also cause toxicity. Since selenium is declining in the ordinary diet in Europe, efforts have been made to increase Se intake levels, mainly through biofortification of food and the production of pharmaceutical supplements.
Knowledge of speciation of selenium in food and food supplements will have implications with respect to the determination of Se requirements and to the investigation of relationships between Se status and health and disease. It will help in the development of safe and effective products and with future regulation of their production and use. Characterization of food and dietary supplements for Se speciation is challenging and demands the development of analytical techniques, such as hyphenated mass spectrometry methods, that allow the measurement and identification of Se chemical forms (species) in a complex sample matrix [2]. The combined application of element-specific MS (ICP-MS) and molecule-specific MS (ESI- or MALDI-MS) with HPLC has become an irreplaceable tool in this field.
In terms of quantifying Se compounds, the attractive features of ICP-MS, such as isotope specificity, versatility, high sensitivity, large dynamic range, and the virtual independence of the signal intensity of the structure of the biomolecule, makes this detector, in combination with a selective chromatographic separation, a potential and unique tool for quantitative Se speciation. ICP-MS, when used in combination with complementary HPLC separation
methods, may allow preliminary identification of Se compounds for which standards are available. Moreover, knowledge of the HPLC-ICP-MS retention times of minor Se-containing compounds in complex matrix samples (for example, food supplements) has been found to be essential to the identification of the Se isotope patterns in the total ion chromatogram (TIC) obtained by HPLC-ESI-MS [3].
In this paper, the potential of the coupling HPLC-ICP-MS for Se speciation analysis in complex samples (for example, dietary supplements) will be illustrated through its application to the measurement and preliminary identification of minor Se metabolites, for example γ-glutamyl-Se-methylselenocysteine (γ-glutamyl- SeMC) in selenized yeast used as the intervention agent in human cancer prevention trials [1].
ExperimentalInstrumentationExtraction of the water-soluble seleno compounds from yeast was carried out by accelerated solvent extraction (ASE) using a Dionex ASE 200 system (Sunnyvale, CA, USA). HPLC-ICP-MS measurements were performed using an Agilent Technologies 1100 Series HPLC system for chromatographic separations and an Agilent 7500i ICP-MS for element-specific detection. Reversed-phase HPLC was performed on an Agilent ZORBAX Rx-C8 column (250 mm × 4.6 mm id, with a particle size of 5 μm). The HPLC column was directly connected to the 100 μL/min PFA MicroFlow concentric nebulizer of the ICP-MS via PEEK tubing (30 cm × 0.1 mm id). The Agilent ICP-MS chromatographic software (part number G1824C, Version C.01.00) was used for integration of the chromatographic signal.
Reagents and samplesSelenium standards (Figure 1a) and other chemical substances were purchased from Sigma-Aldrich (St. Louis, MO, USA) unless stated otherwise. L-γ-glutamyl-Se-methylseleno-L-cysteine was purchased from PharmaSe (Lubbock, TX, USA). Single-standard stock solutions (1 mg/g) were prepared and stored as detailed elsewhere [4]. A standard solution of 10 μg/kg of Se in
HPLC-ICP-MS for Preliminary Identification and Determination of Methyl-Selenium Metabolites of Relevance to Health in Pharmaceutical SupplementsHeidi Goenaga-Infante LGC Limited, Queens Road, Teddington, UK

40
the corresponding mobile phase was prepared from a 1,000 mg/kg Se reference solution (Romil) and used for the daily optimization of the ICP-MS parameters (optimal settings: RF power — 1,300 W; make-up Ar flow rate — 0.31 L/min; nebulizer Ar flow rate — 0.85 L/min; isotopes — 77Se, 82Se, and 103Rh; integration time per mass — 100 ms).
Samples from one batch of SelenoPrecise, Lalmin Se2000 and SelenoExcell selenized yeast were supplied by Pharma Nord (Vejle, Denmark), Lallemand Inc. (Montréal, Canada) and Cypress Systems, Inc. (Fresno, CA, USA), respectively. These samples were stored at 4 °C in the dark under dry conditions and thoroughly mixed before sample treatment. The moisture content of these samples was determined using a procedure reported elsewhere [4].
ProceduresExtraction of Se species in water0.3 g of Se-yeast was extracted with degassed water using accelerated solvent extraction using the conditions described in a previous work [4].
Se speciation by reversed-phase (RP) HPLC-ICP-MSA 50-μL portion of the 1:5 diluted extract was analyzed by ion-pairing RP HPLC-ICP-MS at a flow rate of 0.5 mL/ min using a water/methanol (98:2, v/v) mixture containing 0.1% (v/v) formic acid as the mobile phase. For quantification, calibration was carried out by the standard addition technique at three concentration levels, using peak area measurements of the chromatographic signals by monitoring the 82Se signal. The Se concentration of γ-glutamyl-SeMC in the water-soluble extracts is given the average ± SD (n = 3) expressed in the dry sample. Total Se determination of the yeast samples was performed by ICP-MS after microwave acid digestion [4].
Figure 1. RP HPLC-ICP-MS chromatograms of (a) a Se standard mixture containing 3 μg/L Se as Se(Cys)2 (peak 1), 2.5 μg/L Se as selenite (peak 2), 5 μg/L Se as SeMC (peaks 3 and 4) and SeMet (peak 5), and 25 μg/L Se as g-glutamyl-SeMC (peak 6); and (b) the 1:5 diluted Se-yeast water extracts
0
12000
24000
0 5 10 15 20 25
1983 µg g_1 Se
1550 µg g_1 Se
1291 µg g_1 Se
0
5000
10000
0
6000
12000
(a)
(b)
2
2
2
4
5
5
5
6
6
6
U1
U1
U
0
700
1400
2100
2800
3500
1
2
3
4
5
6
4
U

41www.agilent.com/chem/icpms
Results and DiscussionTwo ion-pairing reversed-phase HPLC methods (with trifluoroacetic acid [TFA] and formic acid as ion-pairing reagents) coupled with ICP-MS were compared for preliminary identification of γ-glutamyl-SeMC in Se-yeast aqueous extracts. The method using formic acid with on-line ICP-MS detection (see conditions above) was preferred for further experiments due to its capability to provide enough retention of target Se species while offering good chromatographic/detection selectivity in the chromatographic region under investigation. Moreover, in comparison with TFA, the use of formic acid is preferable because of its higher compatibility with electrospray ionization (ESI). For chromatographic identification, retention time matching with an authentic standard was used. An alternative, standardless approach based on retention time matching with an aqueous extract from garlic, in which the major species of Se is known to be the γ-glutamyl-SeMC species, was also investigated [4].
The chromatograms of a standard mixture and of 1:5 diluted aqueous extracts from the Se-yeast samples are shown in Figure 1. Assignments based on retention times suggest that the samples seem to contain Se species such as SeMC, selenomethionine (SeMet), and γ-glutamyl-SeMC. For quantification of γ-glutamyl-SeMC, the 1:5 diluted extracts were spiked with a γ-glutamyl-SeMC standard of a known Se concentration (see procedures) at three concentration levels. The recovery of added γ-glutamyl-SeMC was 98.9 ± 2.1%. Based on three times the standard deviation for 11 replicate determinations of the reagent blank, the detection limit for γ-glutamyl-SeMC was found to be 8.1 ng/kg.
Table 1 summarizes the percentage of the total Se in the water extract, which is associated with γ-glutamyl-SeMC as well as the concentration of Se found as γ-glutamyl-SeMC in the yeast samples analyzed. The results shown in Table 1 and Figure 1 suggest that there is a significant variation of the Se speciation in the water extracts with the variation of the total Se. The numbers in Table 1 also show that the concentration of γ-glutamyl-SeMC decreased not only relatively, but also in absolute terms between concentrations of 1,550 and 1,983 μg/g Se. Since Se-yeast samples with a wider range of total Se concentrations were not available, the results above, while intriguing, should be interpreted with caution regarding the change in selenium distribution upon increase in total Se content. Moreover, further studies should be pursued to elucidate whether or not the differences observed for the speciation of selenium may also be a result of the slightly different methods of yeast enrichment with selenium used by the different manufacturers.
ConclusionsConfirmation of the presence of γ-glutamyl-SeMC (a dipeptide of SeMC and glutamic acid) in the Se yeast samples analyzed by HPLC-ICP-MS was achieved, for the first time, using the on-line coupling of the chromatographic method developed with ESI MS/MS in selected reaction monitoring mode without the need for extract pretreatment [4]. The presence of γ-glutamyl-SeMC might be relevant to the anticarcinogenic potential of selenized yeast since this species is believed to serve primarily as a carrier of SeMC, which appears to be easily converted in animals and possibly humans to methylselenol. This Se metabolite is thought to be an effective anticarcinogen.
References1. Rayman, M. P. (2004). Br. J. Nutr., 92, 557–573.
2. Goenaga-Infante, H., Hearn, R. & Catterick, T. (2005). Anal. Bioanal. Chem., 382, 957–967.
3. Goenaga-Infante, H., O’Connor, G., Rayman, M. P., Hearn, R. & Cook, K. (2006). J. Anal. At. Spectrom., 11, 1256–1263.
4. Goenaga-Infante, H., O’Connor, G., Rayman, M. P., Spallholz, J. E., Wahlen, R., Hearn, R. & Catterick, T. (2005). J. Anal. At. Spectrom., 20, 864–870.
Reprinted from 1st Edition Agilent Handbook of Hyphenated ICP-MS Applications, August 2007.
Table 1. Percentage of the total Se in the yeast water extract and in the whole yeast sample associated with γ-glutamyl-SeMC and concentration of Se (μg/g) incorporated into γ-glutamyl-SeMC in the yeast sample, as found by RP HPLC-ICP-MS. Precisions are calculated for three independent chromatograms. * Fraction of the total Se in the water extract.† Fraction of the total Se in yeast.
Yeast source Se concentration of γ-glutamyl-SeMC Water extract Yeast sample (%)* (%)† µg/g
SelenoExcell 4.4 ± 0.1 0.91 ± 0.041 11.2 ± 0.6 (1291 µg/g Se) SelenoPrecise 7.3 ± 0.2 1.00 ± 0.06 15.7 ± 0.9 (1550 µg/g Se) Lalmin Se2000 2.4 ± 0.1 0.4 ± 0.02 7.2 ± 0.4 (1983 µg/g Se)

42
Keywordsnutritional, dietary, supplements, selenium, animal feed, compound independent calibration, LC-ICP-MS
IntroductionSpeciation analysis of nutritional supplements is a basic requirement of many regulatory authorities. It is no longer sufficient to determine only the total concentration, as it is well known that the chemical form of a trace element determines its physiological function [1]. This applies to supplementation of animal and human diets, and the onus is on the manufacturers of such products to demonstrate product efficacy.
Selenium is an important component of several antioxidant enzymes and Se-enriched yeast is routinely added to animal feed to overcome problems associated with Se deficiency, for example ill-thrift, low fertility and muscle myopathy. As a result, the Se status of the animal is increased. This, in turn, is beneficial in the case of edible tissues such as meat, milk and eggs, whereby this essential element may be transferred up the food chain and contribute to improved Se status in humans. Selenomethionine (SeMet) is the main species in Se-enriched yeast, yet several other compounds are known to be responsible for important physiological effects such as cancer prevention [2].
ExperimentalSamples of Se-enriched yeast (0.2 g) were extracted three times (18 hours @ 37 °C) with 5 mL volumes of 30 mM, pH 7.5 tris buffer containing protease (20 mg) and lipase (10 mg). Extracts were centrifuged at 6,000 rpm for 30 minutes to yield soluble and insoluble fractions. The soluble fractions were pooled. All samples for total Se analysis were microwave digested in nitric acid (6 mL) and hydrogen peroxide (0.5 mL) using an Anton Paar Multiwave 3000.
Analysis for total selenium was performed by ICP-MS in helium mode (5 mL/min). Speciation analysis was performed using an LC coupled to an ICP-MS operating in hydrogen mode on the soluble fraction only, using the conditions in Table 1.
Selenium Speciation Analysis by LC-ICP-MS with Mass Balance Calculations for Se-Enriched YeastsPatrick Ward and Cathal Connolly Alltech Biotechnology Centre, Dunboyne, Co. Meath, Ireland
Table 1. HPLC and ICP-MS instrument operating conditions
Agilent 1260 HPLC
Column Zorbax C8, 4.6 × 250 mm (5 µm) Mobile phase 0.1% TFA/2% MeOH @ 1 mL/min Injection volume 50 µL
Agilent 7700x ICP-MS
RF power 1550 W Nebulizer Glass concentric Carrier gas flow 1.05 L/min KED 3 V Cell gas H2 @ 6.5 mL/min Isotopes monitored 77, 78, 82 Integration time 0.1 s
A sample of certified reference material SELM-1 (NRC, Canada), total Se: 2,059 mg/kg, SeMet Se: 1,389 mg/kg was included to check method accuracy.
Results and DiscussionTotal selenium concentrations were determined in the soluble and insoluble fractions after microwave digestion (Table 2). In all cases, the bulk of the selenium (70–90%) was extracted into the soluble fraction following enzymatic treatment. This is important because it means that the subsequent speciation analysis, which is performed on the soluble fraction only, concerns most of the selenium in the sample.
Table 2. Recovery of selenium from soluble and insoluble fractions
Sample Se (µg) Soluble Se Insoluble Se Se recovery (µg) (µg) (%)
Se Yeast 1 424.4 387.0 25.6 97.2 Se Yeast 2 205.0 176.0 13.8 92.6 Se Yeast 3 236.3 178.6 32.2 89.2 Se Yeast 4 395.9 301.8 67.4 93.2 SELM-1 374.3 341.6 22.6 97.3

43www.agilent.com/chem/icpms
The chromatogram in Figure 1 and the data in Table 3 indicate that SeMet is the main selenium-containing compound in the soluble fraction. This concurs with earlier work published by many different research groups. In the case of SELM-1, we found that SeMet accounted for 66.9% of the total selenium. This agrees well with the NRC-certified value of 67.5%.
Figure 1. Full LC chromatogram for SELM-1 showing SeMet as the main peak and early portion of chromatogram showing several smaller peaks corresponding to ‘unknown’ Se-compounds
To perform mass balance calculations on the speciation data, we used ‘compound independent calibration’ (CIC) to estimate the total selenium recovery from each chromatogram. This feature of the MassHunter software permits the use of a ‘known’ calibrant, in our case selenomethionine, to estimate the Se content of other ‘unknown’ peaks in the chromatogram. The last column in Table 3 demonstrates the usefulness of this approach, especially when working with samples that contain compounds not yet identified or characterized.
ConclusionsWe found LC-ICP-MS to be well suited for speciation analysis of Se compounds extracted from selenium-enriched yeast. The CIC function within the MassHunter software allowed us to obtain useful information relating to the selenium content of unknown peaks. This enabled us to perform more detailed analysis of the results, including a full mass balance calculation.
References1. Jacques, K. A. (2002). Feed Compounder, 14–21.
2. Goenaga-Infante, H. et al. (2005). Journal of Analytical Atomic Spectrometry, 20, 864–870.
Table 3. Recovery of selenium following speciation analysis of the soluble fraction. * Numbers in brackets represent the % of total Se recovered as SeMet.
Sample Se (µg) *SeMet Se CIC, Se Mass (µg) recovery balance Se from LC (µg) recovery (%)
Se Yeast 1 387.0 256.2 (66.2) 392.4 101.4 Se Yeast 2 176.0 115.8 (65.8) 169.5 96.3 Se Yeast 3 178.6 120.0 (67.2) 172.7 96.7 Se Yeast 4 301.8 194.2 (64.3) 311.2 103.1 SELM-1 341.6 228.5 (66.9) 354.9 103.9

44
Keywordsenvironmental, water, soil, Sb(III), Sb(V), HPLC-ICP-MS
IntroductionArsenic and antimony belong to the same family of the periodic table. However, during the last 10 years, a lot of work has been done on arsenic speciation but relatively little on antimony speciation, even though antimony is widely used in a range of industrial and consumer products, which can act as sources of environmental and human exposure.
Antimony exists in environmental systems in different oxidation states (-3, 0, +3 and +5). In water, only trivalent and pentavalent oxidation states are found, predominantly Sb(V). The average concentration of antimony in natural surface water is around 1 µg/L but this can increase to 100 µg/L near a contaminated source. Under reducing conditions, Sb(III) is found in contaminated water.
Because the toxicity of Sb(III) is greater than the toxicity of Sb(V), many countries are looking to regulate Sb(III) in water. Since 2002, in the province of Quebec (Canada), the regulation respecting the burial of contaminated soils includes the analysis of Sb(III) in groundwater, leachates and surface water. A new method has been developed using HPLC coupled to ICP-MS that permits the separation of Sb(III) and Sb(V) using isocratic conditions in less than 3 minutes.
ExperimentalAn Agilent 1100 Series HPLC fitted with an anion exchange column (Dionex AS12A, 4 mm × 200 mm) was coupled to an Agilent 7500cx ICP-MS fitted with a Babington nebulizer. Operating conditions are given in Table 1.
Antimony Speciation in Natural Waters by HPLC-ICP-MSPierre Tremblay, François Bossanyi and Jean-Pierre Blouin Centre d’Expertise en Analyse Environnementale du Québec, Québec, Canada
Table 1. HPLC and ICP-MS instrument operating conditions
Agilent 1100 HPLC
Column Dionex AS12A (4 mm × 200 mm) Mobile phase Ammonium bicarbonate 0.16 g/L; Tartaric acid 6 g/L; pH 8, 20 Flow rate 1.5 mL/min Injection volume 50 µL
Agilent 7500cx ICP-MS
RF power 1500 W Nebulizer Babington Plasma gas flow rate 15.0 L/min Auxiliary gas flow rate 1.0 L/min Carrier gas flow rate 1.15 L/min Spray chamber 2 °C Sampling depth 6 mm Integration time 2 s Isotope monitored 121Sb
Reagents A solution of Sb(III) standard (1000 mg/L) was prepared from antimony potassium tartrate (C8H4K2O12Sb2 – 3H2O), while the Sb(V) standard (1000 mg/L) was prepared from potassium antimonate (KSb(OH)6). An intermediate standard containing both Sb(III) and Sb(V) at 10 mg/L and calibration solutions from 0 to 100 µg/L containing 1 mL EDTA (2Na) 0.25 M per 100 mL were prepared at least 12 hours before analysis to allow for equilibrium to be reached (see Figure 1). In order to preserve the oxidation states of the different antimony species between sampling and analysis, 1 mL of EDTA (2Na) 0.25 M solution per 100 mL was added to each water sample.

45www.agilent.com/chem/icpms
Results and DiscussionA natural water sample spiked with 20 µg/L of Sb(V) and Sb(III) was injected and the separated species (Figure 2) was quantified by ICP-MS at mass 121. The recovery obtained was 101% and 97% (the solutions were prepared at least 12 hours before analysis to allow equilibrium to be reached). A detection limit of 0.2 µg/L for each of the two oxidation states was achieved using this method. The detection limit was calculated as three times the standard deviation found when analyzing 10 samples spiked with 2 µg/L of each species of antimony.
Figure 2. Chromatogram showing clear separation of 20 µg/L of Sb(V) and Sb(III) in spiked natural water
Figure 1. Calibration curves for Sb(III) and Sb(V)
ConclusionsWe have successfully developed and validated a method for the measurement of Sb(III) and Sb(V) species in natural waters. The total analysis time for the analysis using isocratic HPLC-ICP-MS was less than 3 minutes.
ReferenceCentre d’Expertise en Analyse Environnementale du Québec (2010). Détermination de la spéciation de l’antimoine, de l’arsenic et du chrome: Méthode par chromatographe liquide à haute pression couplé à un spectromètre de masse à source ionisante au plasma d’argon. MA. 200 — Spéc. Mét. 1.0, Ministère du Développement durable, de l’Environnement et des Parcs du Québec, 17.

46
Keywordsenvironmental, sediments, plants, soil, antimony
IntroductionAntimony (Sb) is widely used in the manufacture of plastics, textiles, semiconductors, glass and brake linings [1]. Levels in the environment are increasing, however, little is known about the effects of human activities on the biogeochemical cycle of antimony. As antimony is considered to be non-essential for plants and animals [2], there is concern about its potential toxicity and other biological effects. An understanding of antimony’s biogeochemical cycle requires measurements of total antimony for mass balances and antimony species for assessment of biological effects. In this paper we describe our experiences in measuring total antimony and antimony species in sediments.
ExperimentalTotal antimony Total Sb concentrations were determined with a PerkinElmer Elan-6000 ICP-MS by measuring the signal intensity at m/z 121 and 123. An HPLC system coupled to the ICP-MS was used for speciation measurements. Approximately 0.2 g of freeze dried sample was weighed into 55 mL polytetrafluoroethylene (PTFE) digestion vessels. 3 mL of 1:2 v/v HNO3:HCl acid mixture solution was added and heated in a microwave oven using a four-step time and temperature program: 1) Ramp to 120 °C over 10 min, 2) Hold for 5 min at 120 °C, 3) Ramp to 150 °C over 3 min, 4) Hold for 15 min at 150 °C. After digestion, vessels were allowed to cool at room temperature (~25 °C) and extracts were transferred to 50 mL polyethylene vials and diluted to 30 mL with high purity water. Samples were diluted to 1% (v/v) acid concentration prior to being analyzed on the ICP-MS. Internal standards were added on-line to compensate for any acid effects and instrument drift.
Antimony speciesApproximately 0.5 g of homogenized wet soil was weighed into 55 mL PTFE vessels and 10 mL of 25 mM citric acid added. The citric acid solution was purged using nitrogen gas for 20 min to remove oxygen, sealed and samples heated in a microwave oven at 90 °C for 20 min to assist in antimony extraction. Samples were cooled to room temperature and decanted into 50 mL polyethylene vials, homogenized using a vortex mixer for 0.5 min and centrifuged at 5000 rpm for 20 min. Total antimony concentrations extracted in citric acid extracts were determined by acidifying 5 mL of the supernatant to 1% (v/v) HNO3 prior to ICP-MS analysis.
Prior to chromatography, 0.5–1 mL of extracts were filtered through 0.45 µm Iso-Disc N-4-4 Nylon filters (Supelco, USA). Aliquots of 40 µL were injected onto a PEEK Hamilton PRP-X100 anion exchange column (250 mm × 4.6 mm, 10 µm, Phenomenex, USA) and eluted with a mobile phase containing 20 mM EDTA (pH 4.5), flow rate 1.5 mL/min, temperature 50 °C [3]. The eluant from the HPLC column was directed via 0.2 mm id PEEK capillary tubing into the cross-flow nebulizer of the ICP-MS, which was used as an antimony-specific detector by monitoring the signal intensity at m/z 121 and 123. The Sb species were quantified by peak area.
Results and Discussion Antimony results (Table 1), when extracted from contaminated soils by the 1:2 v/v HNO3:HCl acid mixture, were similar to those extracted using a four-acid mixture (HNO3, HF, HClO4, HCl). Elevated temperatures, pressures and the use of HCl enhances the dissolution of antimony-containing phases especially iron-containing minerals, however, silicate and sulfide minerals are unaffected [4].
Measurement of Total Antimony and Antimony Species in Mine Contaminated Soils by ICP-MS and HPLC-ICP-MSK. Telford, W. Maher, F. Krikowa and S. Foster Ecochemistry Laboratory, Institute of Applied Ecology, University of Canberra, Belconnen, ACT, 2601, Australia
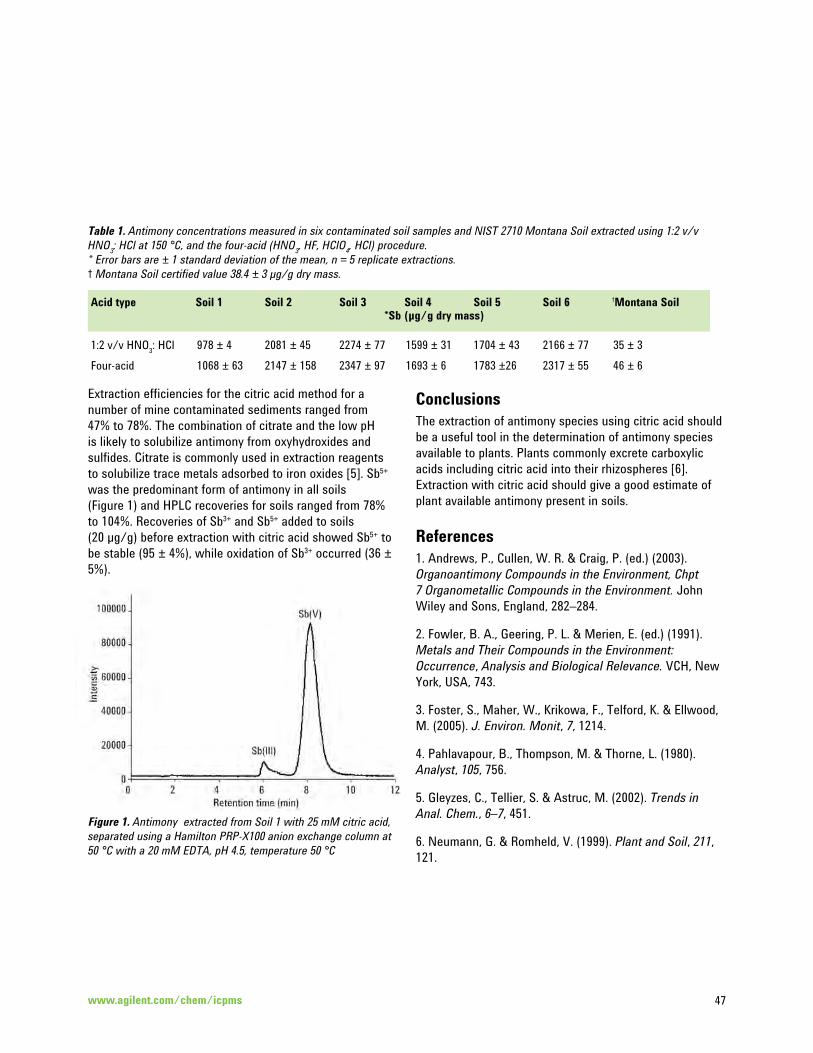
47www.agilent.com/chem/icpms
Extraction efficiencies for the citric acid method for a number of mine contaminated sediments ranged from 47% to 78%. The combination of citrate and the low pH is likely to solubilize antimony from oxyhydroxides and sulfides. Citrate is commonly used in extraction reagents to solubilize trace metals adsorbed to iron oxides [5]. Sb5+ was the predominant form of antimony in all soils (Figure 1) and HPLC recoveries for soils ranged from 78% to 104%. Recoveries of Sb3+ and Sb5+ added to soils (20 µg/g) before extraction with citric acid showed Sb5+ to be stable (95 ± 4%), while oxidation of Sb3+ occurred (36 ± 5%).
Table 1. Antimony concentrations measured in six contaminated soil samples and NIST 2710 Montana Soil extracted using 1:2 v/v HNO3: HCl at 150 °C, and the four-acid (HNO3, HF, HClO4, HCl) procedure. * Error bars are ± 1 standard deviation of the mean, n = 5 replicate extractions.† Montana Soil certified value 38.4 ± 3 µg/g dry mass.
Acid type Soil 1 Soil 2 Soil 3 Soil 4 Soil 5 Soil 6 †Montana Soil *Sb (µg/g dry mass)
1:2 v/v HNO3: HCl 978 ± 4 2081 ± 45 2274 ± 77 1599 ± 31 1704 ± 43 2166 ± 77 35 ± 3 Four-acid 1068 ± 63 2147 ± 158 2347 ± 97 1693 ± 6 1783 ±26 2317 ± 55 46 ± 6
Retention time (min)
0 2 4 6 8 10 12
Intensity
0
20000
40000
60000
80000
100000
Sb(III)
Sb(V)
Figure 1. Antimony extracted from Soil 1 with 25 mM citric acid, separated using a Hamilton PRP-X100 anion exchange column at 50 °C with a 20 mM EDTA, pH 4.5, temperature 50 °C
ConclusionsThe extraction of antimony species using citric acid should be a useful tool in the determination of antimony species available to plants. Plants commonly excrete carboxylic acids including citric acid into their rhizospheres [6]. Extraction with citric acid should give a good estimate of plant available antimony present in soils.
References1. Andrews, P., Cullen, W. R. & Craig, P. (ed.) (2003). Organoantimony Compounds in the Environment, Chpt 7 Organometallic Compounds in the Environment. John Wiley and Sons, England, 282–284.
2. Fowler, B. A., Geering, P. L. & Merien, E. (ed.) (1991). Metals and Their Compounds in the Environment: Occurrence, Analysis and Biological Relevance. VCH, New York, USA, 743.
3. Foster, S., Maher, W., Krikowa, F., Telford, K. & Ellwood, M. (2005). J. Environ. Monit, 7, 1214.
4. Pahlavapour, B., Thompson, M. & Thorne, L. (1980). Analyst, 105, 756.
5. Gleyzes, C., Tellier, S. & Astruc, M. (2002). Trends in Anal. Chem., 6–7, 451.
6. Neumann, G. & Romheld, V. (1999). Plant and Soil, 211, 121.

48
Keywordssolid-phase microextraction, SPME, HPLC-ICP-MS, organotin, tributyltin, triphenyltin, trimethyltin, tripropyltin, water, seawater
IntroductionSolid-phase microextraction (SPME), due to its simple, fast and solventless features, has received growing interest in speciation analysis. SPME allows the simultaneous extraction and preconcentration of analytes directly from the sample matrix or from the headspace above the sample. Nowadays, one of the most common instrumental combinations for organometallic speciation analysis relies on the coupling of a suitable chromatographic separation system to an ICP-MS. To date, in most cases, SPME has been coupled to ICP-MS following gas chromatographic separation. Few papers describe SPME based extraction of organometallic compounds with liquid chromatography and ICP-MS; these approaches use electrosynthesized organic conducting polymers as SPME elements to preconcentrate the analytes, with conventional injection to the LC system, without an on-line coupling. As an alternative, a new hyphenated technique based on the coupling of SPME on-line with HPLC-ICP-MS is proposed.
An SPME-HPLC-ICP-MS method for the extraction, separation and quantification of trisubstituted organotin compounds (tributyltin — TBT-, triphenyltin — TPhT-, trimethyltin — TMeT- and tripropyltin — TPrT-) in water samples is presented. Organotins are regarded as priority pollutants by the European Union both in the Pollutant Emission Register (2000/479/EC) and in the Water Framework Directive (2000/60/EC), with the trisubstituted species being the most toxic forms.
ExperimentalThe coupling of SPME on-line with HPLC and ICP-MS is direct and straightforward. The manual injector of the HPLC is replaced with a commercial SPME interface (Supelco, Belafonte, PA, USA). The mobile phase outlet from the HPLC pump then connects to the SPME interface, and this to the entrance of the chromatographic column. However, some considerations need be taken into account:
• The volume of the fiber desorption chamber of the SPME interface (60 µL) should be compatible with the chromatographic column.
• The chromatographic column should also be compatible with the flow of the ICP-MS nebulizer. It is also important to keep the connecting tubing between the HPLC and the ICP-MS short to minimize the dead volume and subsequent peak broadening and loss of reproducibility.
• If static desorption with a high organic content solvent is required in the SPME procedure, it may be necessary to increase the amount of oxygen that is added into the ICP-MS make-up gas in order to prevent the deposition of carbon on the ICP-MS interface cones.
The HPLC system consisting of an Agilent 1100 binary pump fitted with a Rheodyne injection valve was coupled to an Agilent 7500ce ICP-MS. The SPME/HPLC interface consisting of a holder assembly and polymeric fibers was from Supelco. SPME, LC and ICP-MS conditions are summarized in Table 1.
Results and DiscussionIn order to investigate the applicability of the proposed method, five natural freshwater samples from a leisure port on the Ullibarri-Ganboa reservoir (Alava, Spain) were studied. No interferences were detected in the analyzed samples and only one of them contained TMeT (1.01 µg/L). The applicability of the method to seawater samples was also studied. Five seawater samples from a seaport (Bermeo, Vizcaya, Spain) were also analyzed, but none of the analytes; TMeT, TPrT, TPhT, and TBT were detected. In order to evaluate the accuracy of the developed method, both freshwater and seawater samples were spiked with 3 µg/L of TMeT, TPrT, TPhT, and TBT (Table 2). Typical SPME-HPLC-ICP-MS chromatograms of spiked freshwater and seawater samples are shown in Figures 1a and 1b respectively.
New Hyphenated Instrumental Combination for Speciation — Solid-Phase Microextraction (SPME) Coupled to HPLC-ICP-MSAna Ugarte, Nora Unceta, M. Carmen Sampedro, M. Aránzazu Goicolea, Alberto Gómez-Caballero and Ramón J. Barrio University of the Basque Country, Department of Analytical Chemistry, Faculty of Pharmacy, Vitoria-Gasteiz, Spain

49www.agilent.com/chem/icpms
Table 1. SPME, LC and ICP-MS instrument operating conditions
SPME
Sample volume 3 mL Extraction mode and Direct immersion at room temperature, time 45 min Fiber coating PDMS/DVB 60 µm Ionic strength 75 g/L NaCl Desorption mode Static (with mobile phase) Desorption time 5 min + 1 min injection
HPLC
Column Mediterranea Sea18 (100 × 2.1 mm; 3 µm), Teknokroma, Spain Flow rate 0.3 mL/min Injection volume 10 µL Mobile phase Water:Acetonitrile:Acetic acid (50:40:10)
Agilent 7500c ICP-MS
RF power 1550 W Oxygen flow rate 0.1 mL/min Nebulizer MicroMist (optimum aspiration level: 0.3–0.6 mL/min) Spray chamber Double-pass Scott-type, Peltier cooled to -5 °C ICP torch injector 1.5 µm diameter Interface cones Platinum Integration time per 300 ms mass Isotopes acquired 103Rh, 118Sn, 120Sn
Table 2. Analytical assessment of the method. (Concentrations given as Sn.)
Analyte r LOD LOQ Intra-day RSD Inter-day RSD Recovery (%, n = 3) (ng/L) (ng/L) (%, n = 10) (%, n = 10) (mean ± SD) 1 µg/L 5 µg/L 1 µg/L 5 µg/L Freshwater Seawater
TMeT 0.999 135 451 3.18 7.18 7.73 4.47 104 ± 9 78 ± 10 TPrT 0.994 6 19 13.03 5.40 18.20 16.07 99 ± 15 96 ± 11 TPhT 0.991 11 38 13.66 3.54 19.23 16.94 100 ± 19 71 ± 13 TBT 0.999 185 616 13.65 10.91 14.71 3.25 80 ± 9 85 ± 8
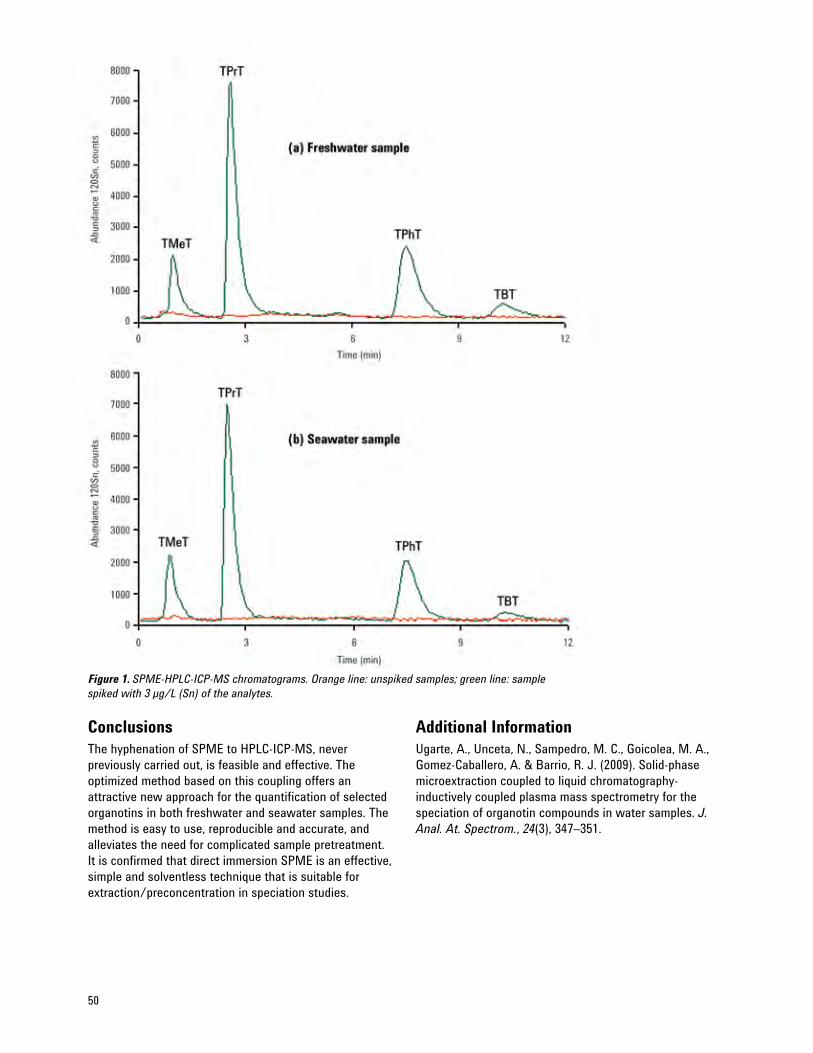
50
Figure 1. SPME-HPLC-ICP-MS chromatograms. Orange line: unspiked samples; green line: sample spiked with 3 µg/L (Sn) of the analytes.
ConclusionsThe hyphenation of SPME to HPLC-ICP-MS, never previously carried out, is feasible and effective. The optimized method based on this coupling offers an attractive new approach for the quantification of selected organotins in both freshwater and seawater samples. The method is easy to use, reproducible and accurate, and alleviates the need for complicated sample pretreatment. It is confirmed that direct immersion SPME is an effective, simple and solventless technique that is suitable for extraction/preconcentration in speciation studies.
Additional InformationUgarte, A., Unceta, N., Sampedro, M. C., Goicolea, M. A., Gomez-Caballero, A. & Barrio, R. J. (2009). Solid-phase microextraction coupled to liquid chromatography-inductively coupled plasma mass spectrometry for the speciation of organotin compounds in water samples. J. Anal. At. Spectrom., 24(3), 347–351.

51www.agilent.com/chem/icpms
Keywordsheteroatoms, proteomics, metabolomics, protein tagging, sulfur, phosphorus, selenium, iodine, tellurium, enriched stable isotopes, cysteine, methionine, wheat germ extract, photodiode array detector, fluorescence detector, HPLC-PDA-FD-ICP-MS
IntroductionTagging of proteins and metabolites with heteroatoms (for example, sulfur (S), phosphorus (P), selenium (Se), and iodine (I)) and heteroisotopes (enriched stable isotopes) and their detection with an ICP-MS offers several advantages in proteomics and metabolomics. However, since the hitherto techniques for protein tagging were always post-translational modifications, the target proteins were limited to phosphorylated and antibody-available proteins. The detection of sulfur signals originating from cysteine (Cys) and methionine (Met) in proteins using ICP-MS detection can be considered another aspect of heteroatom tagging. However, the relatively low sensitivity for sulfur with ICP-MS indicates the pressing need to further improve the quantification of proteins by heteroatom tagging. On-translational tagging may resolve some of these challenges. Therefore, on-translational tagging with a heteroisotope in the form of [34S]-enriched Met, or a heteroatom, that is, selenomethionine (SeMet) or telluromethionine (TeMet), could provide an excellent tool for quantitative proteomics.
The expression of a recombinant gene in cultured cells is a convenient way to obtain the protein corresponding to the gene. It is well known that SeMet is incorporated into protein sequences without discrimination from Met in bacteria, plants, and animals. In vitro translation can synthesize desired proteins as efficiently as in vivo translation. Therefore, heteroatom- or heteroisotope-tagged proteins were translated in wheat germ extract (WGE) in the present study.
Detection of Se at its most abundant isotope at m/z 80, using quadrupole ICP-MS suffers from a significant molecular interference from 80ArAr+ originating from the argon plasma source. However, tellurium (Te), which
belongs to the same group as Se, is not affected by the ArAr+ interference and has a lower ionization potential than Se, suggesting that the detection limit of Te may be a superior alternative to Se. Thus, TeMet-tagged proteins were also translated in the same system as [34S]-Met- and SeMet-tagged proteins. In addition, we also evaluated whether or not SeMet- and TeMet-tagged proteins have the same physiological function as the original Met-containing proteins.
In this study, green fluorescence protein (GFP) gene was translated in vitro. The fluorescence of GFP is a function of its structure, and GFP has 6 Met out of 239 amino acids in its sequence. In vitro translation with heteroatom- and/or heteroisotope-derivatized Met, that is, [34S]-Met, SeMet and TeMet, followed by HPLC and treble detection with a photodiode array detector, a fluorescence detector and an ICP-MS, was demonstrated.
Experimental[34S]-Met and TeMet were synthesized in our laboratory [1]. A commercially available kit consisting of WGE was used for in vitro translation of GFP mRNA. A 20 µL aliquot of the reaction mixture was applied to an HPLC coupled with a photodiode array (PDA), a fluorescence detector (FD), and an ICP-MS to analyze the absorption at 200–900 nm, the fluorescence intensity of GFP detected at the 395 nm excitation wavelength and the 510 nm emission wavelength, as well as the distribution of S, Se or Te, respectively. The HPLC system consisted of an on-line degasser, an HPLC pump, a Rheodyne six-port injector, and a multimode size-exclusion column (Shodex Asahipak GS-520HQ, 7.5 id × 300 mm with a guard column; Showa Denko, Tokyo, Japan). A schematic diagram of the system is depicted in Figure 1. The column was eluted with 50 mM tris-HCl, pH 7.4, at a flow rate of 0.6 mL/min. The eluate was introduced into the PDA, FD, and ICP-MS detectors in series. The ICP-MS equipped with an Octopole Reaction System was used in hydrogen reaction mode using deuterium instead of hydrogen. Deuterium (D2) reaction mode allows the detection of Se without interference originating from certain polyatomic ions [2]. The operation parameters are shown in Table 1. The distribution of exogenous (labeled) S was calculated.
Treble Detection of Heteroatom-Tagged Green Fluorescence Protein by HPLC Photodiode Array (PDA) Detector, Fluorescence Detector (FD) and ICP-MSYasumitsu Ogra Showa Pharmaceutical University, Tokyo, Japan

52
Figure 1. Schematic diagram of HPLC-PDA-FD-ICP-MS
Table 1. ICP-MS instrument operating conditions
ICP-MS Notes
RF power 1500 W Plasma gas flow rate 15.0 L/min Auxiliary gas flow rate 1.15 L/min Carrier gas flow rate 1.05 L/min D2 gas flow rate 2.0 mL/min Deuterium used instead of hydrogen Integration time 100 ms Isotopes monitored 48, 50, 77, 78, 80, 82, 125, 128 m/z 48 and 50 used to detect S as SO 50% O2 flow rate 0.05 L/min Introduced into carrier gas as reactant to form SO

53www.agilent.com/chem/icpms
Results and DiscussionUnder the negative control condition, that is, without Met addition, fluorescence intensity detected at the retention time of 15.0 min was low (Figure 2a). SeMet was also incorporated into GFP in the same manner as [34S]-Met (Figures 2b and 2c). Exogenous Met added as [34S]-Met clearly appeared at the retention time of 21.1 min and was incorporated into GFP (15.0 min). The signal appearing at the retention time of around 19.1 min is noise produced by the elution of large amounts of sulfur-containing salts, such as sulfate, at this retention time. The results suggest that SeMet-containing GFP has the same fluorescence characteristics as Met-containing GFP. The peaks appearing at the retention times of 27.8 and 32.5 min have been assigned in another article [3]. Because endogenous Se was not detected in the reaction mixture, the elution of Se provided higher S/N ratio in addition to higher sensitivity than that of S on ICP-MS detection. Thus, SeMet tagging in in vitro translation is more convenient to perform than heteroisotope tagging, that is, [34S]-Met tagging. Although TeMet was incorporated into GFP, the fluorescence intensity of TeMet-containing GFP at the retention time of 15.0 min was significantly lower than that of Met- or SeMet-containing GFP because of the instability of TeMet in the reaction mixture (Figure 2d).
ConclusionsIn vitro translation enabled tagging of GFP with [34S]-Met, SeMet, and TeMet in the WGE system. The SeMet tagging of desired proteins is the most suitable for in vitro translation followed by ICP-MS detection among the Met derivatives due to its stability and sensitivity.
References1. Ogra, Y., Kitaguchi, T., Suzuki, N. & Suzuki, K. T. (2008). In vitro translation with [34S]-labeled methionine, selenomethionine and telluromethionine. Anal. Bioanal. Chem., 390, 45–51. (For additional information).
2. Ogra, Y., Ishiwata, K. & Suzuki, K. T. (2005). Effects of deuterium in octopole reaction and collision cell ICP-MS on detection of selenium in extracellular fluids. Anal. Chim. Acta, 554, 123–129.
3. Ogra, Y., Kitaguchi, T., Ishiwata, K., Suzuki, N., Toida, T. & Suzuki, K. T. (2009). Speciation of selenomethionine metabolites in wheat germ extract. Metallomics, 1, 78–86.
Figure 2. Elution profiles of heteroisotope- and heteroatom-tagged GFP

54
Keywordsblood plasma, serum, copper, size-exclusion chromatography, SEC-ICP-MS, clinical, biological
IntroductionCeruloplasmin (Cp) is a blue alpha-2 glycoprotein with a molecular weight of 132 kilodaltons (kDa) that binds 90 to 95% of blood plasma copper (Cu) and has six to seven Cu atoms per molecule. The various functions of this protein include ferroxidase activity, amine oxidase activity, superoxidase activity, and involvement in Cu transport and homeostasis. At present there is no standardized reference method for Cp, and the immunologic methods cross-react with apoceruloplasmin (apoCp), which can bias data and deliver higher than expected concentrations for the target protein. A method for the determination of Cp in human serum at biologically relevant concentrations > 0.01 mg/mL has been developed. Size-exclusion chromatography (SEC) is used to separate Cp from other proteins and from inorganic ions, and ICP-MS to detect Cu isotopes (m/z = 63, 65) and to confirm the identity of Cp using the 63Cu/65Cu ratio.
ExperimentalMaterialsReconstituted, lyophilized Cp standards purified from human plasma were used in the study. (EMD Biosciences/Calbiochem, La Jolla, CA, USA, and Sigma, Saint Louis, MO, USA). Serum samples from patients with one of four different diseases, including myocardial infarction (MI), rheumatoid arthritis (RA), systemic lupus erythematosus (SLE), and pulmonary embolism (PE), and normal controls (NC) were obtained from Stanford University (Stanford, CA). All samples were kept frozen at -20 °C until analysis. ERM DA470 is a human serum certified for 15 proteins, including Cp, and was purchased from RTC (Laramie, WY, USA).
InstrumentationTo eliminate possible interference from highly abundant proteins, some of which may bind Cu to form protein-Cu complexes, the sample is depleted of albumin, IgG, IgA, transferrin, haptoglobin, and antitrypsin by immunoaffinity chromatography using the Agilent 4.6 mm × 100 mm immunoaffinity column prior to SEC. An Agilent 1100 binary liquid chromatography (LC) system was used for the immunoaffinity work. Protein separation was achieved on a silica TSKGel column SW3000 from Tosoh Bioscience (Montgomeryville, PA, USA). All SEC analyses were performed on another Agilent 1100 Series binary HPLC system with diode array detector at 0.3 mL/min flow (0.1 M tris, pH 7). The exit from the diode array detector was connected directly to the Agilent 7500ce ICP-MS (MicroMist nebulizer) using polyetheretherketone (PEEK) tubing (60 cm length). The 7500ce was operated in helium collision mode with a He flow rate of 3.5 mL/min to remove the Na-, Mg- and P-based polyatomic interferences on 63Cu and 65Cu by kinetic energy discrimination (KED). High levels of Na in the sample can cause the creation of 40Ar23N a polyatomic species that overlaps with 63Cu. Similarly, 31P molecular species such as 31P16O2 can overlap with 63Cu, and 31P16O18O can overlap with 65Cu. High levels of 25Mg can lead to the formation of 25Mg40Ar, which overlaps with 65Cu.
Determination of Cp by SEC-ICP-MS SEC retention times were calibrated using a mixture of standard proteins. Cp eluted at 8.4 minutes, between albumin and IgG. However, its detection in real samples by UV is difficult due to overlap by other serum proteins. Using SEC-ICP-MS, the Cu-containing Cp is easily identified. Cp-bound copper is easily distinguished from free Cu by retention time.
Determination of Ceruloplasmin in Human Serum by Immunoaffinity Chromatography and Size-Exclusion Chromatography (SEC) ICP-MSViorica Lopez-Avila, Agilent Technologies, Santa Clara, CA, USA Orr Sharpe and William H. Robinson, Stanford University, Stanford, CA, USA Kirk Lockits, University of Cincinnati, Cincinnati, OH, USA

55www.agilent.com/chem/icpms
Table 1. Concentration of Cp in the ERM DA470 reference serum * Uncertainty (mg/mL). † Average of three determinations; value given in parentheses is the percent coefficient of variation (CV%).‡ Average of seven determinations; value given in parentheses is the percent coefficient of variation (CV%).
Reference serum Certified value Measured 63Cu/65Cu (mg/mL) concentration (mg/mL)
ERM DA470 reference 0.205 (0.011)* 0.208 (5.4%)† 2.1 (3.6%)† serum (freshly reconstituted) — Agilent Technologies ERM DA470 reference 0.205 (0.011) 0.201 (6.4%)‡ 2.2 (7.3%)‡ serum (freshly reconstituted) — Univ. of Cincinnati
Table 2. Determination of Cp by SEC-ICP-MS — method performance
Method indicator Value
Detection limit 0.01 mg/mL (5-µL injection) Dynamic range 0.01 to 5.0 mg/mL (tested only to 5 mg/mL) Reproducibility Overall CV: <10% Accuracy 98–101% (ERM DA 470) Cp identification Retention time plus Cu 63/65 isotope ratio = 2.2 ± 0.1
Method performanceThe performance of this assay was established with the reference human serum ERM DA470, which is certified for Cp at 0.205 mg/mL. The results, summarized in Table 1, illustrate excellent agreement with the certified values. Method performance data are included in Table 2. Total analysis time is approximately 95 min/sample from start to finish (15 min dilution and filtration, 30 min immunoaffinity chromatography, 20 to 30 min concentration, and 20 min SEC-ICP-MS analysis).
ResultsForty-seven human sera from patients with one of four different diseases and a set of normal controls were analyzed for Cp by the SEC-ICP-MS method (Figure 1). An additional 120 samples from patients with MI, PE, RA, SLE, and other forms of arthritis and a set of healthy patients as NC were analyzed by University of Cincinnati.

56
Figure 1. Cp concentration in human sera from patients with four diseases and from normal controls; numbers in parentheses indicate the number of sera analyzed for Cp. Gray area shows Cp range reported for normal subjects (0.2 to 0.5 mg/mL).
ConclusionsCeruloplasmin in human serum can be accurately determined at physiologically relevant levels using SEC-ICP-MS after cleanup by immunoaffinity chromatography as demonstrated using ERM DA470 reference serum. Initial application of the technique to sera of diseased patients shows a relationship between some diseases and elevated serum Cp concentrations. Our data for the 167 human sera show that Cp concentrations tend to be higher in MI, RA and SLE patients. When comparing Cp concentrations with clinical data, we observed that Cp concentrations were higher in female as compared to male patients, and this trend was most prominent in patients with RA. We did not find a correlation between Cp concentration and patient’s age for the limited set of 70 patients for which we had gender and age information. Thus, measurement of Cp levels by ICP-MS represents a biomarker that when combined with conventional clinical and laboratory data may provide increased diagnostic value.
Additional InformationLopez-Avila, V., Sharpe, O. & Robinson, W. (2006, September). Determination of ceruloplasmin in human serum by SEC-ICP-MS. Analytical and Bioanalytical Chemistry, 386(1), 180–187.
Lopez-Avila, V., Sharpe, O. & Robinson, W. Determination of ceruloplasmin in human serum by immunoaffinity chromatography and size-exclusion chromatography coupled to ICP-MS. Agilent publication number 5989-5304EN.
Lopez-Avila, V., Robinson, W. H. & Lockits, K. (2009). Ceruloplasmin levels in human sera from various diseases and their correlation with patient’s age and gender. Health, 1(2), 104–107.
Reprinted from 1st Edition Agilent Handbook of Hyphenated ICP-MS Applications, August 2007.
DiseaseMI NC PE RA SLE
0.4
0.6
0.8
1
Cp c
onc
(mg/
mL)
1.2
1.4
1.6
Normal Cp concis 0.2 to 0.5 mg/mL[15]
MI – myocardial infarction (16)
NC – normal controls (7)
PE – pulmonary embolism (7)
RA – rheumatoid arthritis (10)
SLE – systemic lupus erythematosus (7)

57www.agilent.com/chem/icpms
Keywordsbiological, phosphorus, phospholipids, lipid extracts, yeast Saccharomyces cerevisiae, HPLC-ICP-MS
IntroductionPhospholipids are the main constituents of membranes in all types of prokaryotic and eukaryotic cells. Due to their complexity and heterogeneity in biological samples, qualitative and quantitative analyses of membrane phospholipids in cellular extracts represent major analytical challenges, mainly due to the requirement for suitable and sensitive detection methods. ICP-MS is a suitable detector for selective determination of phospholipids, which all contain phosphorus. However, the determination of phosphorus and its compounds by an ICP-MS is not an easy task because phosphorus has a high ionization potential and, consequently, is poorly ionized in the plasma. Additionally, it suffers from polyatomic interferences at m/z ratio 31 from 12C1H316O, 15N16OH, 15N16O, and 14N17O. Phospholipids are extractable with organic solvents; therefore, liquid chromatography with an organic mobile phase was used for separation of different lipid species.
ExperimentalReagents and sample preparationA standard mixture of six phospholipids was prepared by diluting each standard in a chloroform/methanol mixture (2/1, v/v).
• 1,2-dioleoyl-phosphatidic acid monosodium salt (C39H72O8PNa, DOPA)
• 1,2-dioleoyl-phosphatidylcholine (C44H84NO8P, DOPC)
• 1,2-dioleoyl-phosphatidylethanolamine (C41H78NO8P, DOPE)
• 1,2-dioleoyl-phosphatidylglycerol sodium salt (C42H78O10PNa, DOPG)
• 1,2-dioleoyl-phosphatidylserine sodium salt (C42H77NO10PNa, DOPS)
• Phosphatidylinositol sodium salt isolated from bovine liver (C47H82O13PNa, PI)
The concentrations of each expressed as phosphorus were:
• 3.3 mg/LDOPA
• 2.9 mg/LDOPG
• 2.7 mg/LPI
• 3.1 mg/LDOPE
• 3.0 mg/LDOPS
• 2.9 mg/LDOPC
Chromatographic systemHPLC separations were carried out using an Agilent 1100 chromatographic system equipped with a thermostatted autosampler (variable injection loop 0 to 100 μL), YMC-Pack Diol-120 column (250 × 4.6 mm, 5 μm) (Kyoto, Japan) maintained at 50 °C and a flow rate of 0.6 mL/min. The composition of mobile phase A was acetone/hexane/acetic acid/triethlyamine (900/70/14/2 [v/v]) and the composition of mobile phase B was methanol/hexane/ acetic acid/triethlyamine (900/70/14/2 [v/v]). The following gradient elution program was used: 95% of A at 0 min, 82% of A at 40 min, 55% of A at 42 min, 40% of A at 44 min, 40% of A at 49 min, 95% of A at 49.5 min, and 95% of A at 58 min.
Detection systemThe 0.6 mL/min flow from the HPLC column was split to approximately 130 μL/min before reaching the 7500c ICP-MS via self-aspiration using a PFA 100 nebulizer. To prevent deposition of carbon on the interface cones, an optional gas (20% oxygen in argon) was introduced. Since added oxygen promotes corrosion of interface cones, a platinum sampler cone was used. Detection was carried out by recording m/z ratio 31 at a scan rate of 0.3 s per point.
The system was optimized by pumping mobile phase A containing 2 mg/L of phosphorus as DOPE. The optimized conditions used for the detection of the phospholipids are given in Table 1.
All chromatograms were smoothed before integration.
Application of ICP-MS to the Analysis of PhospholipidsMiroslav KovacevicA, Regina LeberB, Sepp D. KohlweinB, and Walter GoesslerC A. National Institute of Chemistry, Slovenia B. Institute of Molecular Biology, Biochemistry and Microbiology, Karl Franzens University Graz, Austria C. Institute of Chemistry-Analytical Chemistry, Karl Franzens University Graz, Austria

58
Results and DiscussionChromatographic separation Successful chromatographic separation of six standard phospholipids was achieved by utilization of modified conditions described by Sas et al. [1]. A typical chromatogram is presented in Figure 1. Almost all six phospholipid standards were baseline separated.
Table 1. ICP-MS instrument operating conditions
Agilent 7500c ICP-MS
Plasma gas flow rate 15 L/min Auxiliary gas flow rate 1.0 L/min Carrier gas flow rate 0.50 L/min Optional gas flow rate 24% (of carrier gas flow rate) RF power 1600 W ORS gas (helium) flow rate 4.0 mL/min Spray chamber temperature 25 °C Sampling depth 10 mm
Figure 1. Separation of six chemically defined phospholipids in standard mixture on YMC Pack Diol-120 column (250 × 4.6 mm, 5 μm) with ICP-MS detection of phosphorus at m/z ratio 31 (5 μL injected, 0.6 mL/min, each peak corresponds to ~15 ng of phosphorus)
The usefulness of the developed method for analysis of phospholipids was demonstrated on a complex lipid extract from yeast. Each identified compound was quantified by using the calibration curves given in Table 2. The results are presented in Table 3 as peak areas and as calculated masses and concentrations of each identified compound in the sample extract. It should be noted that all masses and concentrations are expressed as phosphorus and that a peak co-eluting with chemical class of phosphatitylcholine (PC) was integrated and considered as belonging to PC class.
Theoretically, the response of an ICP-MS is element dependent, meaning it is the same for all compounds regardless of their structure. The determined response factors, which are part of calibration curves in Table 2, have values from 16,500 to 25,000 peak area units per ng of phosphorus. Deviations from theory are expected, since we used a gradient elution program. This gives a different matrix composition for each compound, resulting in different nebulization and ionization efficiencies. Therefore, simplification of the quantification procedure by using a calibration curve based only on one compound should be used with caution and considered in the field of semiquantitative analysis. In cases when we are interested only in obtaining approximate ratios between classes of phospholipids in the sample, only peak areas without any calibration can be used. To show the usefulness of such a quick semiquantitative analysis, a yeast lipid extract was treated in that way. Peak areas of all peaks found in the chromatogram were summed; their relative amounts were calculated and are presented in Table 3. Compared to literature data [2], this semiquantitative approach gives good agreement.
2000
1500
1000
500
00 10 20 30
Retention time/min40 50 60
Det
ecto
r res
pons
e/co
unts DOPA
DOPG
DOPEDOPC
DOPS
PI
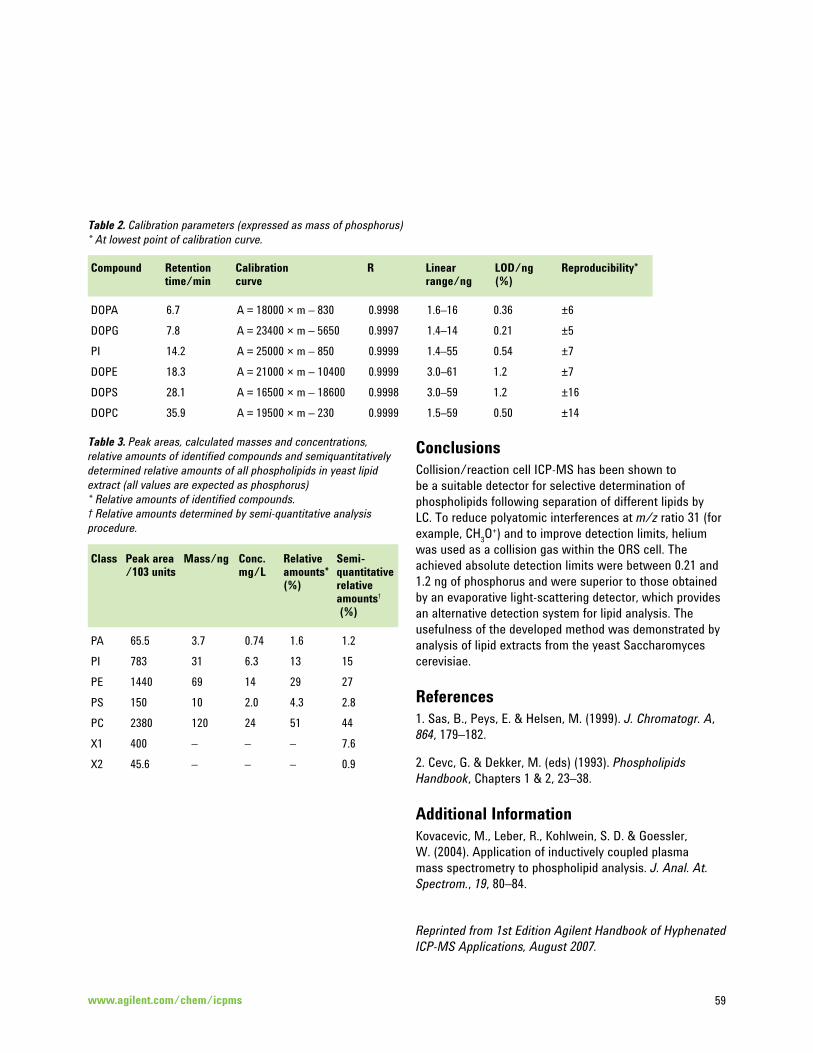
59www.agilent.com/chem/icpms
ConclusionsCollision/reaction cell ICP-MS has been shown to be a suitable detector for selective determination of phospholipids following separation of different lipids by LC. To reduce polyatomic interferences at m/z ratio 31 (for example, CH3O+) and to improve detection limits, helium was used as a collision gas within the ORS cell. The achieved absolute detection limits were between 0.21 and 1.2 ng of phosphorus and were superior to those obtained by an evaporative light-scattering detector, which provides an alternative detection system for lipid analysis. The usefulness of the developed method was demonstrated by analysis of lipid extracts from the yeast Saccharomyces cerevisiae.
References1. Sas, B., Peys, E. & Helsen, M. (1999). J. Chromatogr. A, 864, 179–182.
2. Cevc, G. & Dekker, M. (eds) (1993). Phospholipids Handbook, Chapters 1 & 2, 23–38.
Additional InformationKovacevic, M., Leber, R., Kohlwein, S. D. & Goessler, W. (2004). Application of inductively coupled plasma mass spectrometry to phospholipid analysis. J. Anal. At. Spectrom., 19, 80–84.
Reprinted from 1st Edition Agilent Handbook of Hyphenated ICP-MS Applications, August 2007.
Table 2. Calibration parameters (expressed as mass of phosphorus) * At lowest point of calibration curve.
Compound Retention Calibration R Linear LOD/ng Reproducibility* time/min curve range/ng (%)
DOPA 6.7 A = 18000 × m – 830 0.9998 1.6–16 0.36 ±6 DOPG 7.8 A = 23400 × m – 5650 0.9997 1.4–14 0.21 ±5 PI 14.2 A = 25000 × m – 850 0.9999 1.4–55 0.54 ±7 DOPE 18.3 A = 21000 × m – 10400 0.9999 3.0–61 1.2 ±7 DOPS 28.1 A = 16500 × m – 18600 0.9998 3.0–59 1.2 ±16 DOPC 35.9 A = 19500 × m – 230 0.9999 1.5–59 0.50 ±14
Table 3. Peak areas, calculated masses and concentrations, relative amounts of identified compounds and semiquantitatively determined relative amounts of all phospholipids in yeast lipid extract (all values are expected as phosphorus) * Relative amounts of identified compounds. † Relative amounts determined by semi-quantitative analysis procedure.
Class Peak area Mass/ng Conc. Relative Semi- /103 units mg/L amounts* quantitative (%) relative amounts† (%)
PA 65.5 3.7 0.74 1.6 1.2 PI 783 31 6.3 13 15 PE 1440 69 14 29 27 PS 150 10 2.0 4.3 2.8 PC 2380 120 24 51 44 X1 400 – – – 7.6 X2 45.6 – – – 0.9
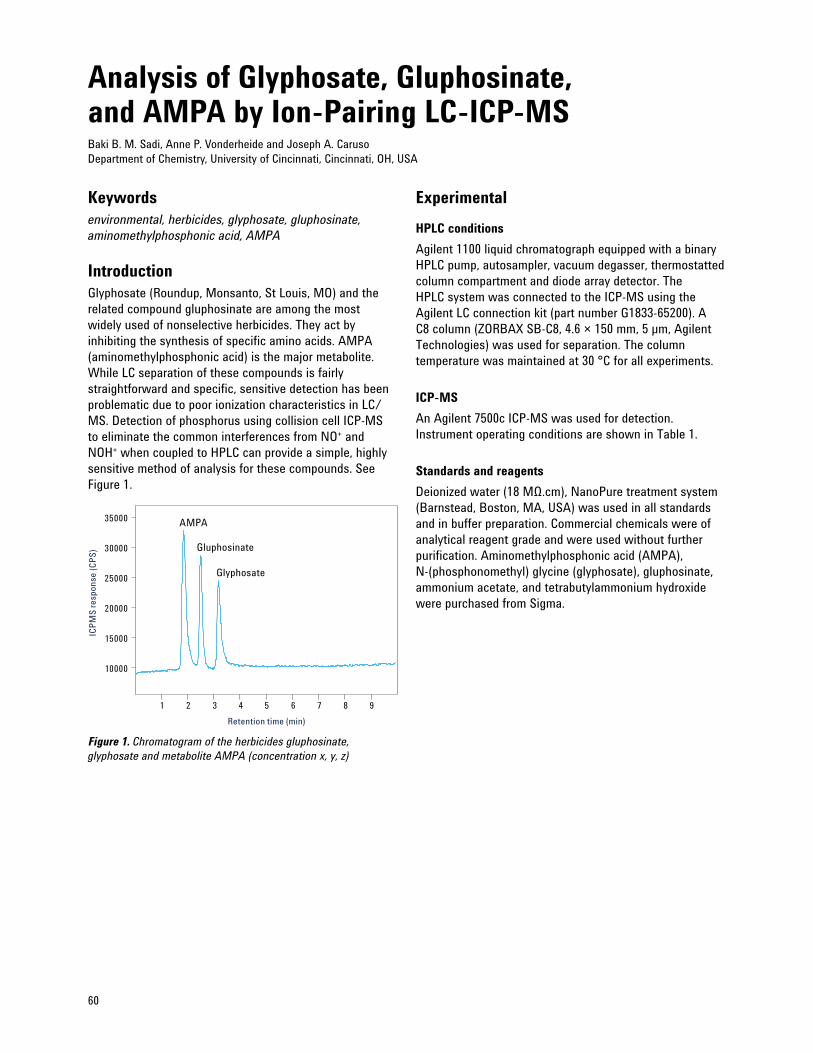
60
Analysis of Glyphosate, Gluphosinate, and AMPA by Ion-Pairing LC-ICP-MS Baki B. M. Sadi, Anne P. Vonderheide and Joseph A. Caruso Department of Chemistry, University of Cincinnati, Cincinnati, OH, USA
Keywordsenvironmental, herbicides, glyphosate, gluphosinate, aminomethylphosphonic acid, AMPA
IntroductionGlyphosate (Roundup, Monsanto, St Louis, MO) and the related compound gluphosinate are among the most widely used of nonselective herbicides. They act by inhibiting the synthesis of specific amino acids. AMPA (aminomethylphosphonic acid) is the major metabolite. While LC separation of these compounds is fairly straightforward and specific, sensitive detection has been problematic due to poor ionization characteristics in LC/MS. Detection of phosphorus using collision cell ICP-MS to eliminate the common interferences from NO+ and NOH+ when coupled to HPLC can provide a simple, highly sensitive method of analysis for these compounds. See Figure 1.
ExperimentalHPLC conditionsAgilent 1100 liquid chromatograph equipped with a binary HPLC pump, autosampler, vacuum degasser, thermostatted column compartment and diode array detector. The HPLC system was connected to the ICP-MS using the Agilent LC connection kit (part number G1833-65200). A C8 column (ZORBAX SB-C8, 4.6 × 150 mm, 5 μm, Agilent Technologies) was used for separation. The column temperature was maintained at 30 °C for all experiments.
ICP-MSAn Agilent 7500c ICP-MS was used for detection. Instrument operating conditions are shown in Table 1.
Standards and reagentsDeionized water (18 MΩ.cm), NanoPure treatment system (Barnstead, Boston, MA, USA) was used in all standards and in buffer preparation. Commercial chemicals were of analytical reagent grade and were used without further purification. Aminomethylphosphonic acid (AMPA), N-(phosphonomethyl) glycine (glyphosate), gluphosinate, ammonium acetate, and tetrabutylammonium hydroxide were purchased from Sigma.
Figure 1. Chromatogram of the herbicides gluphosinate, glyphosate and metabolite AMPA (concentration x, y, z)
10000
15000
20000
25000
30000
35000
1 2 3 4 5 6 7 8 9
Retention time (min)
ICP
MS
resp
onse
(CP
S)
AMPA
Gluphosinate
Glyphosate

61www.agilent.com/chem/icpms
Table 1. HPLC and ICP-MS instrument operating conditions
Agilent 7500c ICP-MS
RF power 1500 W Plasma gas flow rate 15.0 L/min Carrier gas flow rate 1.11 L/min Sampling depth 6 mm Sampling and Nickel skimmer cones Dwell time 0.1 s per isotope Isotope monitored 31P Nebulizer Glass concentric Spray chamber Scott double-pass Cell gas He Cell gas flow rate 1.5 mL/min
Agilent 1100 HPLC
Column ZORBAX SB-C8, 4.6 × 150 mm, 5 μm Mobile phase 50 mM ammonium acetate/acetic acid buffer 5 mM tetrabutylammonium as ion-pairing reagent 1% methanol pH = 4.7 Flow rate 1.0 mL/min Temperature 30 °C Injection volume 100 μL
Methods
ConclusionsWhen coupled with ion-pairing HPLC, the Agilent 7500c ICP-MS, using ORS technology to remove interferences on phosphorus, can provide a superior detection system for the phosphorus-containing herbicides and their metabolites.
ReferencesSadi, B. B. M., Vonderheide, A. P. & Caruso, J. A. (2004, September 24). Analysis of phosphorus herbicides by ion-pairing reversed-phase liquid chromatography coupled to inductively coupled plasma mass spectrometry with octopole reaction cell. Journal of Chromatography A, 1050(1), 95–101.
Reprinted from 1st Edition Agilent Handbook of Hyphenated ICP-MS Applications, August 2007.
ResultsTable 2. Limits of detection for phosphorus in glyphosate, glyphosonate and AMPA
AMPA Glufosinate Glyphosate
Regression coefficient 0.999 0.998 0.999LOD (concentration) 25 ppt 27 ppt 32 pptLOD (amount) 2.5 pg 2.7 pg 3.2 pgRSD, retention time, n = 8 1.1% 0.8% 1.2%

62
Note: This section isn’t intended to be a comprehensive LC troubleshooting guide but rather to help recognize common problems that may be encountered in typical LC-ICP-MS applications and to help diagnose problems unique to LC-ICP-MS. For a more complete guide to developing and troubleshooting HPLC methods and systems refer to Agilent’s guide to HPLC, The LC Handbook: Guide to LC Columns and Method Development, publication number 5990-7595EN, available online at: www.chem.agilent.com.
LC-ICP-MS is a relatively complex analytical system, composed of discrete components that can and should be tested individually when the system is not performing as expected. The most common and successful technique requires dividing the system into increasingly smaller subsystems and eliminating those that are functioning correctly. This begins with isolating the LC performance from the ICP-MS performance. This doesn’t require physically separating the instruments. Once the source of the problem has been identified (LC or ICP-MS), then that system is further subdivided and the process repeated. In order to isolate and troubleshoot the LC system, an appropriate UV detector for the application will be necessary. This detector can be configured in series with (before) the ICP-MS. Be aware that the sensitivity and selectivity of the UV detector will vary significantly from the ICP-MS, so you should not expect your ICP-MS chromatograms to exactly resemble the UV chromatograms. However, you should expect to see acceptable peak shape, resolution, sensitivity and baseline behavior in the UV chromatogram before moving to the use of the ICP-MS as a detector. Also, remember that the ICP-MS is an elemental detector, not a molecular detector and as a result will not see peaks that do not contain the elements being scanned.
When setting up an LC-ICP-MS method, several basic considerations must be met:
1. The ICP-MS nebulizer should be chosen to match the LC column flow. Commonly available nebulizers operate from less than 100 μL/min up to 1 mL/min. If the LC flow is outside this range, the flow can be corrected through the use of either a flow splitter (flow is too high), or the use of make-up flow (the flow is too low). Alternatively, very low-flow nebulizers optimized for nano-LC or CE-ICP-MS are available.
2. The connector tube between the LC column (or UV detector) and the ICP-MS nebulizer should be as short and inert as possible. The diameter should be chosen to transfer the peaks from the LC to the ICP-MS as quickly as possible without introducing excessive backpressure to the UV detector.
3. For normal phase applications, the solvent flow should be as low as practical to minimize the organic solvent load on the plasma. Several other precautions must also be taken.
a. The ICP-MS spray chamber temperature should be set below zero (typically -5 °C) to minimize organic vapor load on the plasma.
b. A small bore ICP injector (1 mm inner diameter) should be used.
c. An organic sample introduction kit should be fitted to the ICP-MS.
d. The use of oxygen addition to the plasma will be required to eliminate buildup of carbon on the ICP interface cones. In this case the use of Pt cones is recommended due to the potential for damage to Ni cones from excessive oxygen.
Troubleshooting LC-ICP-MS Systems

63www.agilent.com/chem/icpms
4. For gradient applications, consideration needs to be made for the changing composition of the mobile phase and its effect on the plasma and mass spectrometer.
a. Extreme or very rapid changes in mobile phase composition may cause the plasma to extinguish. Therefore, it is necessary to tune the ICP plasma to tolerate both extremes of the gradient. Test this in the ICP-MS Tune window while introducing mobile phase over the anticipated gradient.
b. Changes in mobile phase composition can also change the sensitivity and background for some analyte elements. Verify (in Tune) that you have sufficient signal-to-noise for your analytes under the eluent conditions in which they are expected to elute.
c. In the extreme case where it is not possible to define a single set of tune conditions that work for all analytes over the entire gradient range, the time program function of acquisition allows the user to change the tune conditions during a run in order to optimize the performance for particular analytes or groups of analytes. Be sure to set the time where the tune changes to an area in the chromatogram that is free of analyte peaks.
d. Alternatively, it is possible to negate the effects of the chromatographic gradient through the use of a second mobile phase channel, which is exactly the reverse of the chromatographic mobile phase that is added post column. This effectively cancels the gradient before it reaches the ICP-MS but also causes a 1:1 dilution of the sample before detection.
5. Scan rate. In general, the rule of thumb for chromatographic data acquisition frequency applies here. That is, that approximately 10 data points across a Gaussian chromatographic peak is sufficient to precisely define the peak shape, while still allowing sufficient integration time per scan to achieve good signal-to-noise ratios. Scanning too rapidly will reduce the signal-to-noise, resulting in poor detection limits. Scanning too slowly will not accurately define the peak shape, resulting in poor precision and accuracy. The longest integration times that will achieve a scan time approximately equal to 1/10 of the peak width in seconds should be used. The integration times can be varied from element to element to compensate for varying response and sensitivity needs.
The following troubleshooting matrix is intended to guide the user through some common problems specific to LC with ICP-MS as the detector. It isn’t intended to be comprehensive. Again, basic LC troubleshooting guidance is available in the Agilent LC Handbook.

64
Problem Suggested solution. Refer to the corresponding number in Table 2 for more detail.
NopeaksinICP-MSchromatogram •IstheICP-MSworking?[1] •IstheLCmobilephasereachingtheICP-MS?[2]Poorpeakshapeorpoorseparationofpeaks •[3]Poorsensitivity •CheckICP-MStunesensitivity. •AreICP-MSintegrationtimessufficientforanalyteconcentrations?[3] •Isthecorrectoptionalgaschosenandoptimized?[4]Excessivebackgroundorhighbaseline •DoesitoriginatewithLCorwithICP-MS?[5]Baselinedrift •Iscarbonaccumulatingoncones?[6]
Number Detailed suggested solution
1 Did the ICP-MS meet the standard tune criteria when tuning without LC mobile phase? How about when tuning in mobile phase? 2 Use of an internal standard added post column in the mobile phase can be used to diagnose flow problems as well as correct for gradient caused sensitivity changes. 3 a) Use the maximum integration times consistent with maintaining at least 10 scans per chromatographic peak. b) Is the nebulizer flow compatible with the LC column flow? Is the transfer line length minimized? c) Are LC conditions (column, mobile phase, and so forth) appropriate for the analysis? 4 Addition of nitrogen, oxygen or helium can significantly improve the sensitivity for some elements. This can be tested by introducing the element (in mobile phase) and monitoring the signal in tune while varying the flow of various auxiliary gases added to the plasma. 5 Monitor the baseline using the UV detector first. Then monitor it using various elements with the ICP-MS. This will help determine the source of the drift. 6 Oxygen addition to the plasma gas will prevent the buildup of carbon on the cones and interface. The correct oxygen flow can be determined by watching the plasma as the oxygen flow is slowly increased in tune. When the bright carbon emission just disappears, the oxygen flow is correct.
Table 1. Primary LC-ICP-MS troubleshooting matrix
Table 2. Secondary LC-ICP-MS troubleshooting matrix

Introduction to GC-ICP-MS 66
Analysis of Polybrominated Diphenyl Ether (PBDE) Flame Retardants by GC-ICP-MS 68
Analysis of Sulfur in Low-Sulfur Gasoline by GC-ICP-MS 70
Characterization of Metalloporphyrins in Crude Oils by High Temperature Simulated Distillation using 72 GC-ICP-MS
Determination of Mercury Species in Whole Blood by Calibration Curve-Free Speciated Isotope 75 Dilution Solid-Phase Microextraction (SPME) GC-ICP-MS with Microwave-Assisted Isotope Equilibration and Extraction
Determination of Phosphoric Acid Triesters in Human Plasma using Solid-Phase Microextraction 77 (SPME) and GC-ICP-MS
Determination of Arsine in Ethylene and Propylene by GC-ICP-MS 80
Determination of Organotin Compounds in Urine Samples using GC-ICP-MS 82
Specific Migration of Organotin Compounds from Food Contact Materials — Selective Determination 85 by GC-ICP-MS
Troubleshooting GC-ICP-MS Systems 89
GC-ICP-MS
www.agilent.com/chem/icpms

66
GC-ICP-MS is used for the analysis of volatile organic or organometallic compounds when no other GC detector can provide the required elemental or isotopic specificity or sensitivity. Furthermore, because of the generally higher resolution of GC compared with LC, it is sometimes advantageous to create volatile derivatives of otherwise nonvolatile compounds for analysis by GC. When used as a detector for GC, ICP-MS provides several other advantages over alternative elemental detectors:
• ICP-MSisalmostuniversal.Onlyhydrogen,helium,argon, fluorine, and neon cannot be measured directly due to ionization potentials (IPs) that are higher than argon. A few other elements such as nitrogen and short lived radionuclides are not practical in most cases.
• ICP-MScantolerateawiderangeofGCcarriergasesand flows.
• ICP-MSpermitstheuseofcompound independent calibration, which is useful for screening or when standards are expensive or unavailable.
• ICP-MSdoesnottypicallysufferfromsuppressionofanalyte response due to co-eluting compounds.
• ICP-MSiscapableofisotopedilutionquantification.
The Agilent GC-ICP-MS interface consists of a heated, passivated transfer line and a special torch with a heated injector tube. Argon make-up gas supplied by the ICP-MS is preheated via a stainless steel heat exchanger inside the GC oven before being added to the GC column effluent at the head of the transfer line. In this way, the sample is maintained at constant high temperature from the end of the chromatographic column in the GC oven to the tip of the ICP injector (Figure 1).
Figure 1. GC-ICP-MS diagram
Introduction to GC-ICP-MS
67www.agilent.com/chem/icpms
Tuning and Optimization of ICP-MS for GC ApplicationsTuning an ICP-MS requires optimization of the plasma for efficient ion production, ion optics, and torch position for best sensitivity, octopole reaction cell (if equipped) for optimum interference removal, quadrupole for mass resolution and mass calibration, and detector for sensitivity and linear dynamic range. These tasks are simplified and automated in modern Agilent ICP-MS instruments by using sophisticated autotuning algorithms during which an aqueous tune solution containing several elements is continuously introduced. However in the case of the Agilent GC-ICP-MS, the liquid sample introduction system is not fitted. Since the Agilent GC-ICP-MS interface does not rely on introduction of a wet aerosol for tuning or operation, optimization is somewhat different from typical wet plasma conditions. First, because no water or acids are being introduced, polyatomic interferences, particularly oxides, are mostly eliminated. Second, without the introduction of water, much lower plasma power is required for complete ionization, even of high IP elements. Typically, optimum performance is achieved with plasma power set between 600 and 800 watts, which under the dry plasma, low carrier gas conditions is sufficient to achieve optimum plasma temperatures. Higher plasma power settings are occasionally used when the application calls for higher carrier gas flows, which reduce the plasma temperature. When operating a GC-ICP-MS, tuning and optimization must be carried out using a gaseous tune sample. Normally, this is accomplished through the addition of 0.05–0.1% xenon in helium or argon, either in the GC carrier gas or in the argon make-up gas. Since Xe is composed of nine isotopes between masses 124 and 136, ranging in abundance from ~0.1 to 26% relative abundance, it provides numerous good tuning points. Because it is introduced with the GC carrier gas, it is also useful in optimizing the horizontal and vertical torch positions, which are critical to optimum sensitivity due to the narrow injector diameter of the GC torch. Additionally, if the Xe is introduced with the GC carrier gas, it can be used as an internal standard to monitor and correct for any drift in ICP-MS response over time. If a wider range of masses is needed, other tuning gases can be used, or, alternatively, plasma background masses such as 38 and 78 can be used. For example, a common application of GC-ICP-MS is the analysis of sulfur species in hydrocarbon fuels. In this case, using a 0.1% mix of hydrogen sulfide in He provides an ideal gas on which to optimize sulfur sensitivity.
Use of Optional GasesIn addition to Xe for tuning, the addition of other gases to the plasma can have benefits. Adding a small amount of oxygen can be used to prevent carbon deposits on the interface components (primarily the cones) by oxidizing elemental carbon to volatile carbon oxides. Optional gases, including oxygen and nitrogen, have also been shown to enhance the sensitivity for several common analyte elements, including Sn, As, Se, and others. These gases are typically added via a tee connector into the argon make-up gas line at the point where the GC column enters the transfer line. Flow can be controlled by either the auxiliary mass flow controller on the ICP-MS or by an optional mass flow control channel on the GC. Controlling the optional gas flows from the GC has the advantage that they can be controlled as a function of time. For example, it is sometimes useful to turn on oxygen at the beginning of a run to control carbon buildup during the solvent peak, but then turn it off for the duration of the run to avoid interferences on sulfur. Since extended exposure to oxygen can shorten the life of standard nickel cones, the use of platinum cones is sometimes recommended when the use of oxygen addition is employed.

68
KeywordsPBDE, polybrominated diphenyl ether, brominated flame retardants, GC-ICP-MS, RoHS, BDE-209
IntroductionPBDEs are widely used flame retardants added to many common household products, including textiles, mattresses and furniture, and electronic devices. Their similarity in structure to PCBs and dioxins has raised concerns about health risks associated with their use. Recently some classes of these compounds have been banned in Europe in response to Restriction of Hazardous Substances (RoHS) regulations and voluntarily removed from production in the US. However, some classes are still in use, and the compounds are widely distributed within the environment. Gas chromatography is typically used in the separation of these compounds, since the large number of possible congeners (209) makes LC separation impractical. However, the low volatility, high molecular weight, and fragile nature of some congeners make GC analysis difficult. In particular, identifying trace levels of PBDEs in the presence of other halogenated compounds is difficult with conventional GC detectors.
ExperimentalInstrumentationThe analytical system consisted of an Agilent 6890N GC interfaced to an Agilent 7500a ICP-MS using the Agilent GC-ICP-MS interface. GC and ICP-MS conditions are summarized in Table 1. A short 5 m × 0.25 mm × 0.25 μm Agilent DB-5MS column was used. The GC was equipped with the optional three-channel auxiliary EPC module to control the addition of optional gases, including oxygen and helium. Oxygen is added to the plasma gas to burn off carbon deposits on the sample and skimmer cone. Helium is added to the carrier gas to enhance the sensitivity for bromine. 100 ppm Xe in He was used as an alternate GC carrier gas supplied to the GC via a manual switching valve to allow either pure He or Xe in He to be used. Xe is used to tune the ICP-MS for maximum sensitivity and can also be used as an on-line internal standard.
Analysis of Polybrominated Diphenyl Ether (PBDE) Flame Retardants by GC-ICP-MSSteven M. Wilbur and Emmett Soffey Agilent Technologies, Bellevue, WA, USA
Standards and reagentsPBDE standards were purchased from AccuStandard Inc. (New Haven, CT, USA) and diluted into either semiconductor-grade xylene or pesticide-grade iso-octane. At the time of this work, no certified standard reference materials were available for PBDE compounds in real matrices.
Results and DiscussionGC-ICP-MS as described is capable of rapid, sensitive detection of PBDEs, including the difficult-to-analyze deca-bromo congener (BDE-209), see Figure 1. Analysis times of less than 12 minutes with detection limits of ~150 fg on column (0.15 ppb) can be achieved.
Table 1. GC and ICP-MS instrument operating conditions
Agilent 7500a ICP-MS
RF power 650 W Isotopes acquired 79Br, 81Br Dwell time 0.1 s/point Acquisition mode Time-resolved Sampling depth 7 mm Extract 1 -180 V
Agilent 6890N GC
Injection Split/splitless — 1 μL Carrier gas He at 7 mL/min GC column Agilent DB-5MS 5 m × 0.25 mm × 0.25 μm Oven program 80 °C (1 min), 20°/min –> 320 °C (5 min) Transfer line temperature 250 °C ICP injector temperature 280 °C

69www.agilent.com/chem/icpms
Figure 1. GC-ICP-MS chromatogram of PBDE standard mix (AccuStandard BDE-COC) 50 pg each congener on column, 250 pg BDE-209
Peak Congener (50 ng/mL)
1 1,2,2’-TriBDE (BDE-17) 2 2,4,4’-TriBDE (BDE-28) 3 2,3’,4’,6-TetraBDE (BDE-71) 4 2,2’,4,4’-TetraBDE (BDE-47) 5 2,3’4,4’-TetraBDE (BDE-66) 6 2,2’,4,4’,6-PentaBDE (BDE-100) 7 2,2’,4,4’,5-PentaBDE (BDE-99) 8 2,2’,3,4,4’-PentaBDE (BDE-85) 9 2,2’,4,4’,5,6’-HexaBDE (BDE-154) 10 2,2’,4,4’,5,5’-HexaBDE (BDE-153) 11 2,2’,3,4,4’,5’-HexaBDE (BDE-138) 12 2,2’,3,4,4’,5’,6-HeptaBDE (BDE-131) 13 3,3’,4,4’,5,6-HeptaBDE (BDE-190) 14 DecaBDE (BDE-209) (250 ng/mL)
ConclusionsICP-MS is the ideal GC detector for PBDEs and other bromine-containing volatile organics. It is sensitive, selective, and can tolerate a wide range of GC carrier gases and flows. Very high GC column flow allows rapid elution of deca-BDE, which improves recovery.
Reprinted from 1st Edition Agilent Handbook of Hyphenated ICP-MS Applications, August 2007.
4.00 5.00 6.00 7.00 8.00 9.00 10.00 11.000
20000
40000
60000
80000
100000
120000
140000
160000
Time
Abundance
Ion 79.00 (78.70 to 79.70): 0526A_10.D
Ion 81.00 (80.70 to 81.70): 0526A_10.D
1 2 3 45
6 7 89 10
1112
13
14

70
KeywordsGC-ICP-MS, sulphur, sulfur, gasoline, thiophene, compound independent calibration, motor fuel
IntroductionSulfur in motor fuels has been implicated in global warming and acid rain. It is also a catalyst poison for automobile catalytic converters and refinery catalytic crackers. Reducing total sulfur in motor fuels has become a critical air pollution control goal worldwide. The US EPA tier-2 guidelines beginning in 2004 mandate an average sulfur standard of 30 ppm and a cap of 80 ppm total sulfur by 2007. The European Union announced in December of 2002 that new regulations would require full market availability of sulfur-free fuels, defined as containing less than 10 parts per million (ppm) sulfur content, by January 1, 2005. GC-ICP-MS has the capability to meet current and projected detection limits for both total sulfur in reformulated gasolines and other motor fuels as well as individual sulfur species. Additionally, GC-ICP-MS can identify and quantify other volatile organometallic species in fuels.
ExperimentalHardware setupAn Agilent 6890 GC with split/splitless injector was coupled to an Agilent 7500a ICP-MS using the Agilent GC-ICP-MS interface. GC and ICP-MS conditions are summarized in Table 1.
Standards and reagentsCalibration was based on a multi-level analysis of thiophene and 2-methyl thiophene spiked into 3:1 iso-octane/toluene obtained from Ultra Scientific, (N. Kingstown, RI, USA). Calibration levels ranged from 2.5 ppm per compound to 500 ppm per compound (Figure 1). Because GC-ICP-MS is capable of compound-independent calibration, it was not necessary to calibrate every possible sulfur compound separately. The sulfur response factor for any compound(s) can be determined from a single compound. In this case, the response factors from thiophene were used and confirmed by those from 2-methylthiophene.
Analysis of Sulfur in Low-Sulfur Gasoline by GC-ICP-MSSteve Wilbur and Emmett Soffey Agilent Technologies, Bellevue, WA, USA
Table 1. GC and ICP-MS instrument operating conditions
Agilent 7500a ICP-MS
RF power 700 W Sampling depth 13 mm Carrier gas flow rate 1.1 L/min Extract 1 -150 V Extract 2 -75 V Auxiliary gas He, 10 mL/min added to Ar carrier ICP injector temperature 260 °C Isotope monitored 32
ResultsChromatograms of three standard reference gasolines and a standard reference diesel are shown in Figure 2. Comparison with quantitative results for total sulfur compared favorably with those obtained by x-ray fluorescence [1]. Single compound detection limits for thiophene and 2-methyl thiophene are less than 5 ppb. When translated to total sulfur in gasoline, the detection limit is approximately 0.1 to 0.5 ppm.
Agilent 6890 GC
Injector temperature 260 °C Inlet Split/splitless Inlet temperature 250 °C Column 30 m × 0.25 mm id × 0.25 μm HP-5 Injection volume 1 μL Injection mode Split 1:50 Carrier gas Helium Carrier gas flow rate 2.5 mL/min (constant flow mode) Transfer line temperature 250 °C Oven temperature 40 °C /4 min, 20 °C/min to 250 °C, hold for 1 min

71www.agilent.com/chem/icpms
Figure 1. Calibration curves, thiophene and 2-methylthiophene in 3:1 iso-octane:toluene
Figure 2. a) ASTM-Fuel-QCS02, conventional gasoline QC sample, ~330 ppm total sulfur. b) ASTM Round Robin Gasoline Standard #2, not certified for sulfur. c) CARB low-sulfur reformulated gasoline, ~55 ppm total sulfur. d) Low-sulfur diesel diluted to ~5.6 ppm total sulfur, analyzed in triplicate.
400000
0
800000
1200000
1600000
2000000
2400000
2800000
3200000
Time
Abundance
Ion 32.00 (31.70 to 32.70): GAS05.D
11.000
400000
800000
1200000
1600000
2000000
2400000
2800000
Abundance
Ion 32.00 (31.70 to 32.70): GAS04.D
1.00Time 2.00 3.00 4.00 5.00 6.00 7.00 8.00 9.00 10.00
1.00 2.00 3.00 4.00 5.00 6.00 7.00 8.00 9.00 10.00Time 11.001.00 2.00 3.00 4.00 5.00 6.00 7.00 8.00 9.00 10.00
5000
0
10000
15000
20000
25000
30000
35000
Abundance
Ion 32.00 (31.70 to 32.70): 005SMPL.DIon 32.00 (31.70 to 32.70): 014SMPL.D (*)Ion 32.00 (31.70 to 32.70): 023SMPL.D (*)
1.00 2.00 3.00 4.00 5.00 6.00 7.00 8.00 9.00
100000
200000
300000
400000
500000
600000
700000
800000
900000
1000000
1100000
1200000
Abundance
Ion 32.00 (31.70 to 32.70): GAS03.D
Time
a b
c d
ConclusionsGC-ICP-MS offers significant advantages over other techniques for the analysis of total sulfur and sulfur species in motor fuels. These include high sensitivity, wide dynamic range, freedom from interferences and suppression, ability to use compound independent calibration as well as the ability to simultaneously monitor other elements.
References1. Bouyssiere et. al. (2004). Investigation of the sulfur speciation in petroleum products by capillary gas chromatography with ICP-MS collision cell-MS detection. J. Anal. At. Spectrom., 19, 1–5.
Additional InformationQuantification and characterization of sulfur in low-sulfur reformulated gasolines by GC-ICP-MS. Agilent publication number 5988-9880EN.
Reprinted from 1st Edition Agilent Handbook of Hyphenated ICP-MS Applications, August 2007.
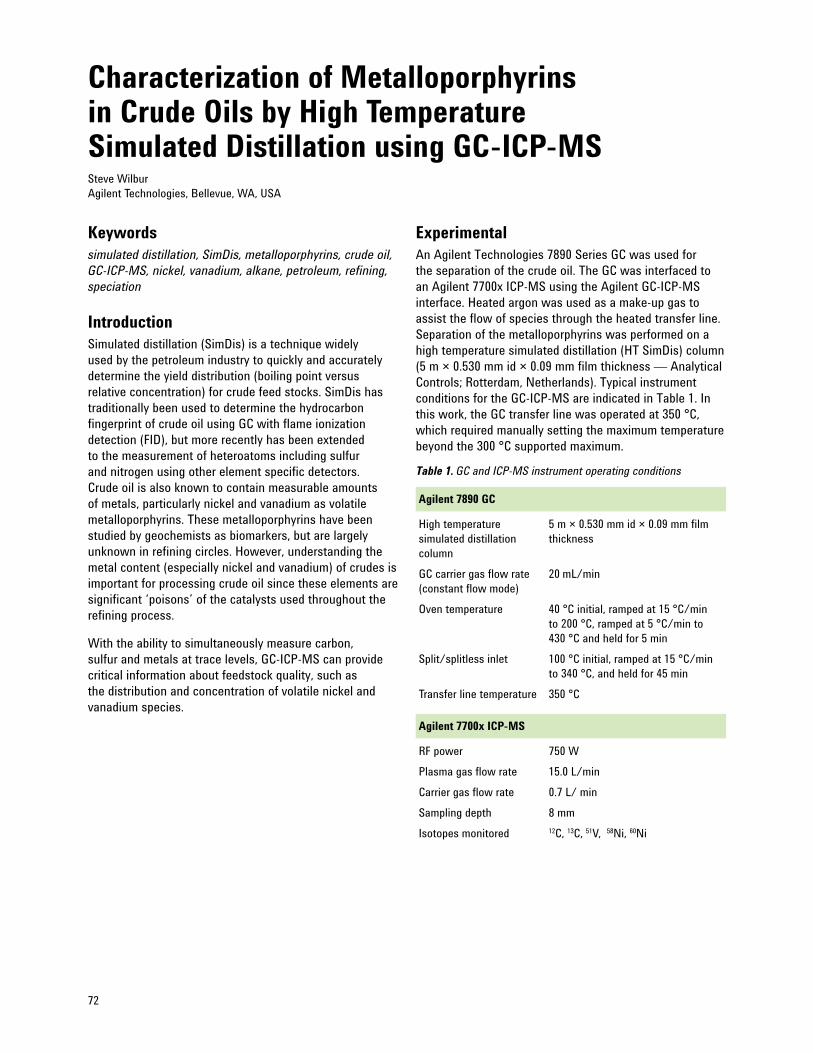
72
Keywordssimulated distillation, SimDis, metalloporphyrins, crude oil, GC-ICP-MS, nickel, vanadium, alkane, petroleum, refining, speciation
IntroductionSimulated distillation (SimDis) is a technique widely used by the petroleum industry to quickly and accurately determine the yield distribution (boiling point versus relative concentration) for crude feed stocks. SimDis has traditionally been used to determine the hydrocarbon fingerprint of crude oil using GC with flame ionization detection (FID), but more recently has been extended to the measurement of heteroatoms including sulfur and nitrogen using other element specific detectors. Crude oil is also known to contain measurable amounts of metals, particularly nickel and vanadium as volatile metalloporphyrins. These metalloporphyrins have been studied by geochemists as biomarkers, but are largely unknown in refining circles. However, understanding the metal content (especially nickel and vanadium) of crudes is important for processing crude oil since these elements are significant ‘poisons’ of the catalysts used throughout the refining process.
With the ability to simultaneously measure carbon, sulfur and metals at trace levels, GC-ICP-MS can provide critical information about feedstock quality, such as the distribution and concentration of volatile nickel and vanadium species.
Characterization of Metalloporphyrins in Crude Oils by High Temperature Simulated Distillation using GC-ICP-MSSteve Wilbur Agilent Technologies, Bellevue, WA, USA
Table 1. GC and ICP-MS instrument operating conditions
Agilent 7700x ICP-MS
RF power 750 W Plasma gas flow rate 15.0 L/min Carrier gas flow rate 0.7 L/ min Sampling depth 8 mm Isotopes monitored 12C, 13C, 51V, 58Ni, 60Ni
ExperimentalAn Agilent Technologies 7890 Series GC was used for the separation of the crude oil. The GC was interfaced to an Agilent 7700x ICP-MS using the Agilent GC-ICP-MS interface. Heated argon was used as a make-up gas to assist the flow of species through the heated transfer line. Separation of the metalloporphyrins was performed on a high temperature simulated distillation (HT SimDis) column (5 m × 0.530 mm id × 0.09 mm film thickness — Analytical Controls; Rotterdam, Netherlands). Typical instrument conditions for the GC-ICP-MS are indicated in Table 1. In this work, the GC transfer line was operated at 350 °C, which required manually setting the maximum temperature beyond the 300 °C supported maximum.
Agilent 7890 GC
High temperature 5 m × 0.530 mm id × 0.09 mm film simulated distillation thickness column GC carrier gas flow rate 20 mL/min (constant flow mode) Oven temperature 40 °C initial, ramped at 15 °C/min to 200 °C, ramped at 5 °C/min to 430 °C and held for 5 min Split/splitless inlet 100 °C initial, ramped at 15 °C/min to 340 °C, and held for 45 min Transfer line temperature 350 °C

73www.agilent.com/chem/icpms
Reagents and samplesA heavy crude oil sample was distilled into five different fractions with boiling point ranges of 900–950 °F (482–510 °C), 950–1000 °F (510–538 °C), 1000–1050 °F (538–566 °C), 1050–1100 °F (566–593 °C), and 1100+ °F (593+ °C).
ProcedureThe ICP-MS was optimized using a tuning gas of He containing 100 ppm of Xe. Once optimized, the instrument did not require further adjustment to the torch position or other parameters. The typical instrumental conditions and isotopes measured are given in Table 1. To prepare the crude oil samples for injection into the GC-ICP-MS, an aliquot (~0.1 g) was dissolved in carbon disulfide (~1.0 g). The samples were vortexed to help the crude oil sample dissolve. New samples were prepared daily. The HT SimDis sample was injected as received from the manufacturer.
Results and DiscussionAnalysis of the high temperature SimDis standard clearly calibrated the boiling point range of the system as configured. The maximum carbon number in the HT SimDis standard is C100, and the identifying peak in the standard is C40, which can easily be seen as the tallest peak in Figure 1. This standard is composed of discrete n-alkanes up to C28 mixed with Polywax 655 whose components sequentially vary by two carbons. Using Figure 1, counting from C40, the highest carbon number eluting is ~C86. This BP range is sufficient because it is the range in which the Ni and V porphyrins were observed to elute. However, in another experiment, we are able to elute higher carbon numbers than those shown in Figure 1 using the same hardware configuration.
Figure 1. GC-ICP-MS chromatogram of high temperature SimDis boiling point calibration standard consisting of even numbered n-alkanes from C6 to C100
In Figures 2 and 3, nickel and vanadium porphyrin standard chromatograms were overlaid on the crude oil fractions. The nickel and vanadium porphyrin standards elute at ~1084 °F (~584 °C) and ~1087 °F (~586 °C), respectively, on the HT column. It is clear that there is more than one nickel and vanadium-containing porphryin in this crude oil and that the concentrations increase in the higher boiling point fractions. This observation is supported by total Ni and V concentrations that were determined on each fraction by ICP-AES prior to this study. The 1100+ °F (593+ °C) fraction is the only fraction that did not fully elute off the column. This is not surprising since the GC does not fully elute species whose boiling point is higher than ca. 1350 °F (732 °C) (the boiling point of C120 - the highest calibration point).

74
Figure 2. Nickel porphyrins in different boiling point fractions of crude oil overlaid with a Ni porphyrin standard
Figure 3. Vanadium porphyrins in different boiling point fractions of crude oil overlaid with V porphyrin standard
Nickel octaethyl porphyrin
Vandyl octaethyl porphyrin oxide
ConclusionsHigh temperature gas chromatography coupled to ICP-MS using a sufficiently hot and inert transfer line has the capability to provide elemental speciation information on very high boiling point compounds, such as metalloporphyrins in crude oils. In this work, GC-ICP-MS has successfully been used for the analysis of a HT SimDis standard, Ni and V metalloporphryins, and real crude oil fractions.
References1. Moldowan, J. M., Albrecht, P. & Philip, R. P. (1992). Biological Markers in Sediments and Petroleum. Prentice Hall, Inc., Englewood Cliffs, NJ, USA.
2. Peters, K. E. & Moldowan, J. M. (1993). The Biomarker Guide. Prentice Hall, Inc., Englewood Cliffs, NJ, USA.
3. Caumette, G., Lienemann, C., Merdrignac, I., Bouyssiere, B. & Lobinski, R. (2009). J. Anal. At. Spectrom., 24, 263–276.
4. Pretorius, W. G., Ebdon, L. & Rowland, S. J. (1993). J. Chromatogr., 646, 369.
5. Ebdon, L., Evans, E. H., Pretoriust, W. G. & Rowland, S. J. (1994). J. Anal. At. Spectrom., 9, 939–943.
6. Standard Test Method for Boiling Range Distribution of Petroleum Distillates in Boiling Range from 174 to 700 °C by Gas Chromatography, Designation: D 6352 – 04.
N
NN
N
EtEt
EtEt
EtEtEt
EtNi2+

75www.agilent.com/chem/icpms
Keywordsspeciated isotope dilution mass spectrometry, blood, mercury species, SIDMS, solid-phase microextraction, SPME, methylmercury, EPA 6800, GC-ICP-MS
IntroductionFor humans, fish consumption is the major source of methylmercury, a potent neurotoxin. Methylmercury’s ability to cross biological barriers is of particular concern because it can pass from the placenta to the fetus, potentially impairing neurological development. Most clinical studies cite whole blood and hair as optimal biomarkers for mercury, and the total mercury concentration in hair is often assumed to average 250-fold higher than that in blood. Although methylmercury is the predominant species in blood, inorganic mercury may also be present, and its concentration may be increased by occupational exposure. For these reasons, the specific measurement of methylmercury in blood should be the preferred biomarker. The goal of our study was to determine different mercury species in human whole blood by using calibration curve-free speciated isotope dilution mass spectrometry (ccf-SIDMS) protocol using solid-phase microextraction capillary GC hyphenated with ICP-MS (SPME-GC-ICP-MS).
ExperimentalInstrumentationThe analytical system consisted of an Agilent 7890A GC interfaced to an Agilent 7700s ICP-MS using the Agilent GC-ICP-MS interface. A 30 m × 0.25 mm × 0.25 µm Agilent HP-5 GC column was used. Helium was used as a carrier gas for the GC system. Xe (0.1% in the GC He carrier gas) was used to tune the ICP-MS for maximum sensitivity.
Reagents, solutions and samplesHigh-purity water (18 MΩ cm-1) (Barnstead NANOpure, Dubuque, IA, USA) was used in the preparation of all
Determination of Mercury Species in Whole Blood by Calibration Curve-Free Speciated Isotope Dilution Solid-Phase Microextraction (SPME) GC-ICP-MS with Microwave-Assisted Isotope Equilibration and ExtractionG. M. Mizanur Rahman, Timothy M. Fahrenholz and H. M. Skip Kingston Department of Chemistry and Biochemistry, Duquesne University, Pittsburgh, PA, USA
solutions. Optima HNO3 and H2O2 were obtained from Fisher Scientific (Pittsburgh, PA, USA). The derivatization reagent, sodium tetrapropylborate, was obtained from Sigma-Aldrich, France. The samples used during this study were obtained from NIST and local donors. The 3Hg-SPC mercury speciation analysis kit, containing both natural (isotopic) abundant and isotopically enriched inorganic mercury (199HgCl2) (91.95%), both naturally abundant and isotopically enriched monomethyl mercury chloride (CH3
200HgCl) (96.41%), and both naturally abundant and isotopically enriched monoethyl mercury chloride (C2H5
201HgCl) (98.11%), and SPC ccf-SIDMS-deconvolution software keyed to these isotopic abundances were obtained from Applied Isotope Technologies, Inc. (AIT — Sunnyvale, CA, USA). All stock solutions were stored in amber glass bottles in a cold room at 4 °C. Working standards were made daily by dilution with high purity water.
Sample preparation procedure for mercury speciationFor mercury speciation analysis, the blood samples were extracted according to EPA Method 3200 after isotopic labeling (see EPA Method 6800 for SIDMS analysis) using a laboratory microwave system (Milestone). The SRM, samples and blanks were triple-spiked with isotopically labeled mercury species and microwave extracted. A solution containing 199Hg2+, CH3
200Hg+, and C2H5201Hg+ along
with 0.300 g of blood sample, and 7.200 g of 2 M HNO3 was added to a small quartz microwave vessel, containing a star-shaped PTFE stir bar. This quartz vessel was put into a larger TFM microwave vessel into which 10 mL of 2 M HNO3 had been placed. The larger vessel was capped, placed into a liner, put into the microwave, heated to 100 °C over two minutes and held at that temperature for 10 minutes. After cooling, the contents of the vessels were transferred to 15 mL polypropylene tubes and centrifuged for 10 minutes to remove the precipitate. The supernatants were decanted into clean 15 mL polypropylene tubes, and stored at 4 °C until analysis (usually next day). A procedural blank was prepared along with the samples for quality assurance purposes. The extracts were then

76
derivatized with NaBPr4, extracted using solid-phase microextraction (SPME, Carboxen/PDMS) and injected into the GC-ICP-MS for detection. Figure 1 shows the chromatograms obtained following the analysis of three mercury standards using the operating parameters given in Table 1.
Figure 1. GC-ICP-MS extracted ion chromatograms for 40 ppt standards containing three mercury species (baselines were shifted from the original baseline for clarity)
Table 1. GC and ICP-MS instrument operating conditions
Agilent 7890A GC
GC column HP 5 (30 m × 0.25 mm id × 0.25 µm) SPME syringe 85 µm Carboxen/PDMS Injection SPME, splitless Oven program 60 °C (3 min), 15 °C/min to 120 °C (0 min), 25 °C/min to 220 °C (1 min) Carrier gas He at 2 mL/min Transfer line temperature 220 °C GC injector temperature 220 °C
Agilent 7700s ICP-MS
Isotopes monitored 199Hg, 200Hg, 201Hg, 202Hg Acquisition mode Time-resolved Integration time 0.3 s/point RF power 1500 W Sampling depth 8.5 mm Carrier gas flow rate 0.45 L/min
Table 2. SID-GC-ICP-MS results for NIST blood SRM-966 and three clinical samples. Uncertainties are at 95% CI, n = 4. DL = 4 pg/mL. * Reference values are in parentheses.
Sample Hg2+ (ng/g) CH3Hg+ (ng/g) C2H5Hg+ (ng/g)
SRM-966 (Level 2) 16.7 ± 1.2 15.3 ± 1.5 < DL (14.1 ± 0.9)* (15.6 ± 1.3)* HB-1 1.54 ± 0.12 3.72 ± 0.48 0.09 ± 0.02 HB-2 5.43 ± 1.52 25.2 ± 2.8 < DL HB-3 4.28 ± 2.29 19.1 ± 2.3 < DL
Results and DiscussionDuring this study, one standard reference material (NIST SRM 966 (level 2)) and three human blood samples were extracted and analyzed as described above. After analysis, the chromatograms were integrated and the isotope ratios were calculated after correcting for both dead time and mass bias. The corrected isotope ratios were then used to calculate the native mercury species concentration and inter-conversions using the SPC ccf-SIDMS software. The results (Table 2) show that the extraction and analysis method recovery was approximately 100% for the NIST SRM-966. Ethylmercury was detected at trace level in a single blood sample (HB-1).
ConclusionsA GC-ICP-MS operating protocol for blood extract analysis was optimized by reducing the formation of elemental mercury during analysis. EPA Method 3200 (sample preparation) and EPA Method 6800 (SIDMS analysis) were applied successfully to simultaneously determine three mercury species from blood samples.

77www.agilent.com/chem/icpms
KeywordsGC-ICP-MS, human blood plasma, solid-phase microextraction, SPME, phosphoric acid triesters, flame retardants, GC-TOFMS, triphenylphosphate, plasticizer
IntroductionAlthough phosphoric acid triesters are used as flame retardants and plasticizers in a variety of products, some of the alkyl phosphates like tris(2-chlororethyl) phosphate show neurotoxic and carcinogenic properties. Similarly, aryl phosphates such as triphenyl phosphate and 2-ethyl-hexyl diphenyl phosphate show allergenic and hemolytic effects. Analysis of these species in human blood plasma is gaining increasing attention due to their possible leaching from the plastic plasma collection bags.
ExperimentalSample preparationSolid-phase microextraction (SPME) was utilized as a sample preparation step for extraction and preconcentration of phosphate esters from the human plasma samples stored in conventional polyvinyl chloride (PVC) plasma bags.
InstrumentationAn Agilent 6890 Series GC system for the separation of the species was connected via the Agilent heated GC-ICP-MS interface to an Agilent 7500cs ICP-MS with Octopole Reaction System collision/reaction cell. Separation of phosphoric acid esters was performed on a 30 m × 0.320 mm id × 0.25 μm DB-5 capillary column (Agilent Technologies, Folsom, CA, USA). The presence of phosphoric acid triesters in human plasma was further validated by SPME GC time-of-flight high-resolution mass spectrometry (GC-TOF-MS) using a Micromass GCT orthogonal time-of-flight mass spectrometer coupled to the Agilent 6890 GC.
Determination of Phosphoric Acid Triesters in Human Plasma using Solid-Phase Microextraction and GC-ICP-MSMonika Shah, Juris Meija, Joseph A. CarusoA and Baiba CabovskaB A. University of Cincinnati, Department of Chemistry, Cincinnati, OH, USA B. Laboratory of Applied Pharmacokinetics and Therapeutic Drug Monitoring, Cincinnati Children’s Hospital Medical Center, Cincinnati, OH, USA
Results and DiscussionTo check the performance of the method, SPME analysis of spiked plasma samples containing known amounts of phosphoric acid ester standards was performed. The assay was linear (r2 > 0.993) over a concentration range of 0.1 to 50 ng P/mL for each phosphoric ester studied (see Table 1). The detection limits were 50 ng/L for tripropyl phosphate, 17 ng/L for tributyl phosphate, 240 ng/L for tris(2-chloroethyl) phosphate, and 24 ng/L for triphenyl phosphate. Recovery of triphenyl phosphate increased from 5 to 66% after deproteinization of plasma samples while that for tripropyl, tributyl, and tris(2-chloroethyl) phosphates was in the range of 35%, 43%, and 49%, respectively, after sample deproteinization at 10 ng/mL of spiked concentration. Note that such a low analyte recovery is commonly encountered in drug determination from plasma due to considerable binding with the plasma proteins. The precision of the method was obtained by consecutive analysis of 10 replicate spiked plasma samples at 1 ng P/mL. The relative repeatability was below 15% for all the analytes. Validation of the method could not be performed due to lack of commercially available certified reference material for determination of analytes in the plasma matrix.
Table 1. Analytical performance characteristics of the phosphoric acid triester detection in human plasma
Phosphoric Limit of Retention r2 Method Recovery acid triesters detection time precision (%) (ng P/L) (min) (%)
Tripropyl 50 3.36 ± 0.03 0.998 8 35 phosphate Tributyl 17 4.48 ± 0.01 0.999 11 43 phosphate Tris(2-chloro 240 4.98 ± 0.01 0.993 7 49 ethyl) phosphate Triphenyl 24 7.21 ± 0.04 0.995 14 66 phosphate

78
Application to human plasma samplesHuman plasma collected from a plasma bag was analyzed for the organophosphate esters. Presence of tributyl phosphate and tri-phenyl phosphate was detected in the plasma that was exposed to the polyvinyl chloride plasma collection bag for a 2 week period (Figure 1b), while these compounds were absent in the same plasma that had not been stored in the conventional plastic storage bags (Figure 1a). Levels of triphenyl phosphate were in the range of 0.2 ng P/mL, while that of tributyl phosphate was close to the detection limit of the method (0.02 ng P/mL).
Figure 1. Analysis of phosphoric acid triesters in human plasma with GC-ICP-MS (left) and GC-TOF-MS showing extracted ion chromatogram for triphenyl phosphate, Mo+ and [M-H]+ ions for sample and standard (right). (a) Native human plasma, (b) human plasma that had been stored in a polyvinyl chloride bag for 2 weeks, and (c) human plasma spiked with 1 ng(P)/mL (1 ppb) of phosphoric acid triesters. SPME extraction was performed after sample deproteinization, and addition of 0.70 g NaCl at pH 7.0. Extraction was carried out with a 65-μm PDMS-DVB fiber for 30 min at 40 °C.
Both 31P GC-ICP-MS and GC-TOF-MS chromatograms for the non-spiked human plasma are presented in Figure 1. Presence of triphenyl phosphate in natural plasma stored in polyvinyl chloride bags was confirmed with high-resolution TOF-MS measurements. The identity of the triphenyl phosphate was verified by retention time matching, correct isotope pattern (Mo+ and [M-H]+) and accurate mass measurements (within 1 mDa accuracy) as seen in Figure 1. However, presence of tributyl phosphate could not be confirmed through GC-TOF-MS due to its low concentration level in the plasma samples.
2000
GC-ICP-MSm/z = 31 u
GC-TOF-MSm/z = 326.070 ± 0.010 u
?
600
sample
standard
t, min
c) standards
b) PVC-exposed plasma
a) non-exposed plasma
400
200
0
1500
1000
500
0
2.0 3.0 4.0 5.0 6.0 7.0 8.0 2.0 3.0 4.0 5.0 6.0 7.0 8.0

79www.agilent.com/chem/icpms
ConclusionsApplication of SPME in conjunction with GC-ICP-MS proved to be a very promising analytical method for determination of trace amounts of phosphoric acid esters in complex biological samples such as human plasma. The developed method is relatively simple, sensitive, reasonably fast, and solvent-free. Low detection limits obtained in the parts-per-trillion (ppt) range also assisted in the determination of triphenyl phosphate in human plasma previously stored in conventional plasma storage bags. Levels of triphenyl phosphate were found to be three orders of magnitude lower than its hemolytic EC20 value. The combination of GC-ICP-MS with GC-TOF-MS helped to confirm the presence of this species in plasma collected from the bag. The presence of this is attributed to the fact that triphenyl phosphate is applied as nonflammable plasticizer in polyvinyl chloride bags. Despite previous reports of large levels of ethylhexyl diphenyl phosphate in plasma stored in polyvinyl chloride bags, no evidence of this compound was found in our study.
Additional InformationShah, M., Meija, J., Cabovska, B. & Caruso, J. A. (2006). Determination of phosphoric acid triesters in human plasma using solid-phase microextraction and GC-ICP-MS. Journal of Chromatography A, 1103, 329–336.
Reprinted from 1st Edition Agilent Handbook of Hyphenated ICP-MS Applications, August 2007.
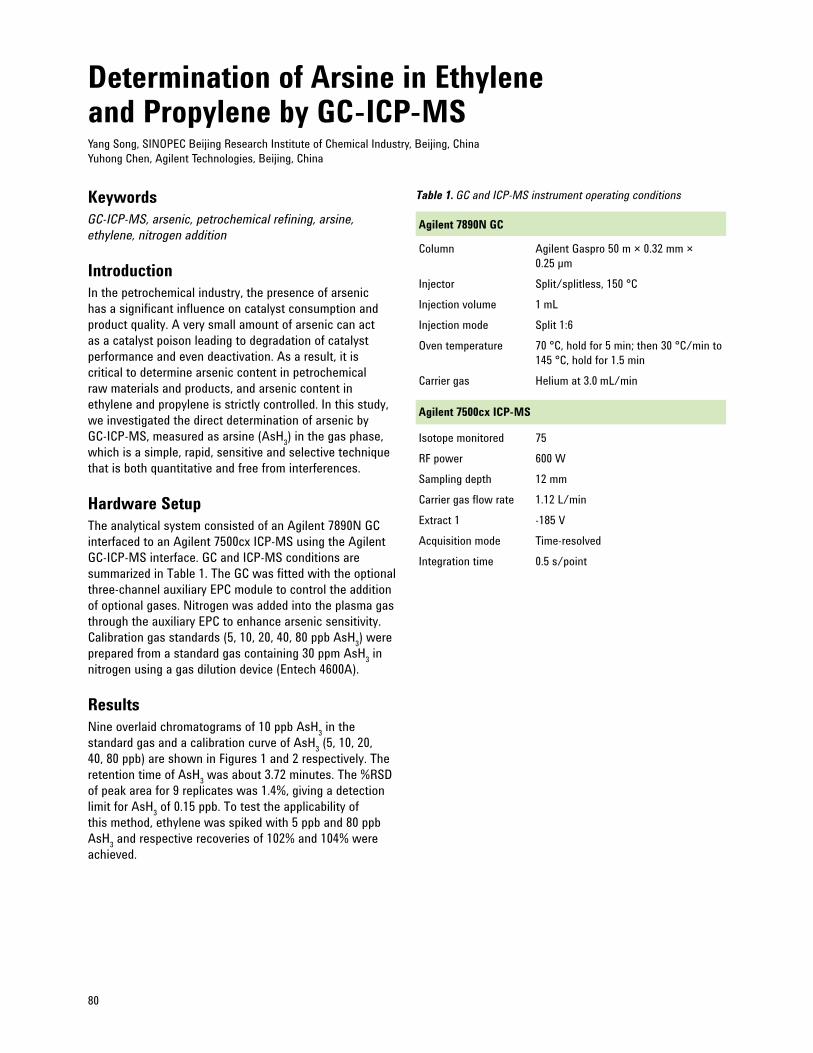
80
KeywordsGC-ICP-MS, arsenic, petrochemical refining, arsine, ethylene, nitrogen addition
IntroductionIn the petrochemical industry, the presence of arsenic has a significant influence on catalyst consumption and product quality. A very small amount of arsenic can act as a catalyst poison leading to degradation of catalyst performance and even deactivation. As a result, it is critical to determine arsenic content in petrochemical raw materials and products, and arsenic content in ethylene and propylene is strictly controlled. In this study, we investigated the direct determination of arsenic by GC-ICP-MS, measured as arsine (AsH3) in the gas phase, which is a simple, rapid, sensitive and selective technique that is both quantitative and free from interferences.
Hardware SetupThe analytical system consisted of an Agilent 7890N GC interfaced to an Agilent 7500cx ICP-MS using the Agilent GC-ICP-MS interface. GC and ICP-MS conditions are summarized in Table 1. The GC was fitted with the optional three-channel auxiliary EPC module to control the addition of optional gases. Nitrogen was added into the plasma gas through the auxiliary EPC to enhance arsenic sensitivity. Calibration gas standards (5, 10, 20, 40, 80 ppb AsH3) were prepared from a standard gas containing 30 ppm AsH3 in nitrogen using a gas dilution device (Entech 4600A).
ResultsNine overlaid chromatograms of 10 ppb AsH3 in the standard gas and a calibration curve of AsH3 (5, 10, 20, 40, 80 ppb) are shown in Figures 1 and 2 respectively. The retention time of AsH3 was about 3.72 minutes. The %RSD of peak area for 9 replicates was 1.4%, giving a detection limit for AsH3 of 0.15 ppb. To test the applicability of this method, ethylene was spiked with 5 ppb and 80 ppb AsH3 and respective recoveries of 102% and 104% were achieved.
Determination of Arsine in Ethylene and Propylene by GC-ICP-MSYang Song, SINOPEC Beijing Research Institute of Chemical Industry, Beijing, China Yuhong Chen, Agilent Technologies, Beijing, China
Table 1. GC and ICP-MS instrument operating conditions
Agilent 7890N GC
Column Agilent Gaspro 50 m × 0.32 mm × 0.25 μm Injector Split/splitless, 150 °C Injection volume 1 mL Injection mode Split 1:6 Oven temperature 70 °C, hold for 5 min; then 30 °C/min to 145 °C, hold for 1.5 min Carrier gas Helium at 3.0 mL/min
Agilent 7500cx ICP-MS
Isotope monitored 75 RF power 600 W Sampling depth 12 mm Carrier gas flow rate 1.12 L/min Extract 1 -185 V Acquisition mode Time-resolved Integration time 0.5 s/point

81www.agilent.com/chem/icpms
Figure 1. Overlaid chromatograms of 10 ppb AsH3 in nitrogen gas by GC-ICP-MS (n = 9)
Figure 2. Calibration curve of AsH3 at 5, 10, 20, 40, 80 ppb
ConclusionsAs a detector for GC, ICP-MS offers high sensitivity, excellent selectivity and minimal interferences for the analysis of AsH3 in gas samples. Limits of detection for AsH3 in ethylene and propylene by GC-ICP-MS are at least 50 times better than can be achieved by other techniques [1, 2].
References1. Chen, S., Song, Y., Li, S. R. & Zhang, Y. (2010). Rapid analysis of trace arsenic hydride phosphine carbonyl sulfide in propylene by GC-MS. Chinese Journal of Analysis Laboratory, 29, Suppl. 317–319.
2. Lei, Z. X., Jiang, T. & Zhang M. (1998). Determination of arsenic element in propylene by ICP-AES [J]. Chinese Journal of Spectroscopy Laboratory, 15, 84–86.
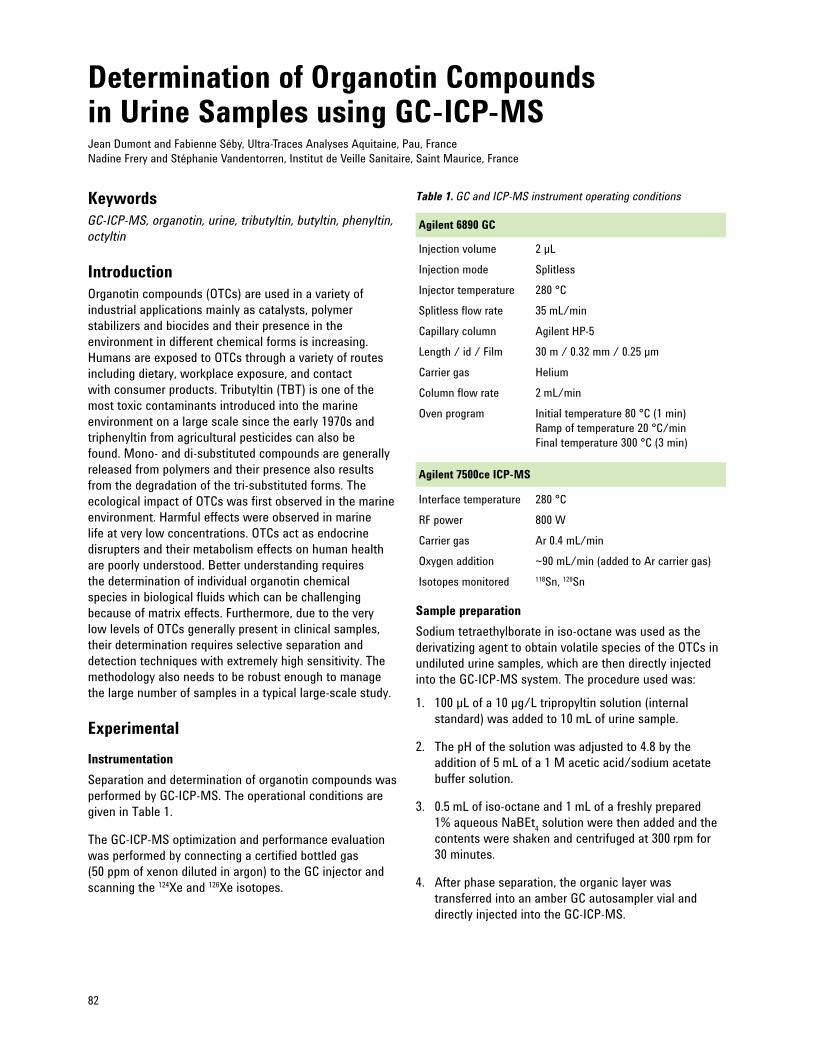
82
KeywordsGC-ICP-MS, organotin, urine, tributyltin, butyltin, phenyltin, octyltin
IntroductionOrganotin compounds (OTCs) are used in a variety of industrial applications mainly as catalysts, polymer stabilizers and biocides and their presence in the environment in different chemical forms is increasing. Humans are exposed to OTCs through a variety of routes including dietary, workplace exposure, and contact with consumer products. Tributyltin (TBT) is one of the most toxic contaminants introduced into the marine environment on a large scale since the early 1970s and triphenyltin from agricultural pesticides can also be found. Mono- and di-substituted compounds are generally released from polymers and their presence also results from the degradation of the tri-substituted forms. The ecological impact of OTCs was first observed in the marine environment. Harmful effects were observed in marine life at very low concentrations. OTCs act as endocrine disrupters and their metabolism effects on human health are poorly understood. Better understanding requires the determination of individual organotin chemical species in biological fluids which can be challenging because of matrix effects. Furthermore, due to the very low levels of OTCs generally present in clinical samples, their determination requires selective separation and detection techniques with extremely high sensitivity. The methodology also needs to be robust enough to manage the large number of samples in a typical large-scale study.
ExperimentalInstrumentationSeparation and determination of organotin compounds was performed by GC-ICP-MS. The operational conditions are given in Table 1.
The GC-ICP-MS optimization and performance evaluation was performed by connecting a certified bottled gas (50 ppm of xenon diluted in argon) to the GC injector and scanning the 124Xe and 126Xe isotopes.
Determination of Organotin Compounds in Urine Samples using GC-ICP-MSJean Dumont and Fabienne Séby, Ultra-Traces Analyses Aquitaine, Pau, France Nadine Frery and Stéphanie Vandentorren, Institut de Veille Sanitaire, Saint Maurice, France
Table 1. GC and ICP-MS instrument operating conditions
Agilent 6890 GC
Injection volume 2 µL Injection mode Splitless Injector temperature 280 °C Splitless flow rate 35 mL/min Capillary column Agilent HP-5 Length / id / Film 30 m / 0.32 mm / 0.25 µm Carrier gas Helium Column flow rate 2 mL/min Oven program Initial temperature 80 °C (1 min) Ramp of temperature 20 °C/min Final temperature 300 °C (3 min)
Agilent 7500ce ICP-MS
Interface temperature 280 °C RF power 800 W Carrier gas Ar 0.4 mL/min Oxygen addition ~90 mL/min (added to Ar carrier gas) Isotopes monitored 118Sn, 120Sn
Sample preparationSodium tetraethylborate in iso-octane was used as the derivatizing agent to obtain volatile species of the OTCs in undiluted urine samples, which are then directly injected into the GC-ICP-MS system. The procedure used was:
1. 100 µL of a 10 µg/L tripropyltin solution (internal standard) was added to 10 mL of urine sample.
2. The pH of the solution was adjusted to 4.8 by the addition of 5 mL of a 1 M acetic acid/sodium acetate buffer solution.
3. 0.5 mL of iso-octane and 1 mL of a freshly prepared 1% aqueous NaBEt4 solution were then added and the contents were shaken and centrifuged at 300 rpm for 30 minutes.
4. After phase separation, the organic layer was transferred into an amber GC autosampler vial and directly injected into the GC-ICP-MS.

83www.agilent.com/chem/icpms
The derivatized extracts can be stored at -20 °C before analysis. Butyl-, octyl- and phenyltin species are considered stable for 1 month under these conditions. Extraction vessels and vials for sample preparation were acid cleaned in subsequent baths of 10% HNO3 and 10% HCl and rinsed with ultrapure water before use.
ResultsThe method was applied to analysis of a urine sample spiked with different butyl-, phenyl- and octyltin compounds at a concentration of 50 ng(Sn)/L. The chromatogram (Figure 1) shows good separation of all tin species without obvious matrix effects.
Figure 1. Chromatogram of a urine sample spiked with different butyl-, phenyl- and octyltin compounds at a concentration of 50 ng(Sn)/L. (MBT: monobutyltin, DBT: dibutyltin, TBT: tributyltin, MPhT: monophenyltin, DPhT: diphenyltin, TPhT: triphenyltin, MOcT: monooctyltin, DOcT: dioctyltin, and TOcT: trioctyltin). Table 2 presents the results obtained for the determination of OTCs in urine samples.
Limits of detection (LOD) and limits of quantification (LOQ) evaluated according to IUPAC criteria as the concentration corresponding to three times and ten times the standard deviation (SD) of 10 blanks (3 and 10 SD of the blank/slope), respectively, were good enough to allow the determination of OTCs at concentrations generally lower than 5 ng(Sn)/L. Only MBT presented a higher LOQ. For quantification of species, the method of standard addition (MSA) was used in order to avoid bias due to matrix effects. Repeatabilities based on 50 ng(Sn)/L spiked samples were calculated from three successive injections of the same derivatized extract and those obtained after injection of three different ethylations of the same urine sample were satisfactory. Reproducibility was better than 10% for all OCTs except for late eluting DPhT and TPhT. Recoveries of 50 ng(Sn)/L can be considered as quantitative for most species except for TBT, where its lower recovery is not yet understood.

84
Table 2. Performance of the GC-ICP-MS method for the determination of OTCs in urine samples
Parameter Unit MBT DBT TBT MocT Doct TOcT MPhT DPhT TPhT
LOD ng/L 2.5 1 0.5 1.5 0.5 0.5 0.5 1 0.5 LOQ ng/L 10 5 2 5 1.5 1.5 1.5 3 1.5 Linearity R² Between 0.995 and 1.000 (to 200 ng/L) Injection %RSD 1 2 4 2 4 1 4.5 5 2 repeatability (n = 3) Ethylation %RSD 3.5 3 1.5 3 5 7 5 5 4 repeatability (n = 3) Reproducibility %RSD 3.5 10 8 3 10 3 6 16 22 (3 days) Recovery %RSD 112 92 72 86 91 100 115 111 89 (50 ng(Sn)/L)
ConclusionsThe GC-ICP-MS analytical method permitted the determination of different butyl-, phenyl- and octyltin species in difficult samples such as urine with a good sensitivity, repeatability and reproducibility. LODs can be improved further by increasing the volume of urine analyzed.
Further to this study, this method was applied to the analysis of more than 200 samples of urine collected from women just after they had given birth [1,2]. OTC levels found were generally lower than the detection limits of the GC-ICP-MS method. However, monobutyltin, diphenyltin, mono- and dioctyltin species were present in some samples at concentrations between 20 and 120 ng(Sn)/L. Other organotin species such as the tri-substituted forms were not detected.
References1. Vandentorren, S., Bois, S., Pirus, C., Sarter, H., Salines, G. & Leridon, H. (2009). Rationales, design and recruitment for the ELFE longitudinal study. BMC Pediatrics, 9, 58–68.
2. Oleko, A., Betsou, F., Sarter, H., Gerdil, C., Desbois, I., Charles, M. A., Leridon, H. & Vandentorren, S. (2011). A pilot study of the ELFE longitudinal cohort: Feasibility and preliminary evaluation of biological collection. Biopreservation and Biobanking, 9, 223–227.

85www.agilent.com/chem/icpms
KeywordsGC-ICP-MS, organotin, food, food contact materials, PVC, DBT, TBT, TPhT, DOT
IntroductionOrganotin compounds are chemicals containing at least one bond between a tin and a carbon atom. Within Europe, 20,000 tons/year of organotin compounds are used in five major applications: PVC heat stabilizers, biocides, catalysts, agrochemicals, and glass coatings of which PVC stabilizers account for approximately 15,000 tons/year [1]. In food contact materials (FCM), mono- and di-alkyl tins are used as PVC stabilizers. Other organotin compounds can come from catalysts, and impurities present in the raw materials [1]. Since organotin compounds are not bound in the FCM matrices, they can migrate upon contact with food [2]. Because the combination of FCMs and types of food is numerous, legislation [3] allows the use of food simulants to test migration instead of real food. Examples are 3% acetic acid or 10%/95% ethanol and oil.
Toxicity and RegulationThe toxicity of organotin compounds to humans was recently evaluated by the European Food Safety Authority (EFSA), who found DBT, TBT, TPhT and DOT (Table 1) to be immunotoxic. Other effects include reproductive and developmental toxicity, genotoxicity, carcinogenicity, and neurotoxicity. This resulted in a lowering of the “tolerable daily intake” (TDI) value by a factor 6 to 0.10 µg Sn/kg body weight (b.w.) for the sum of the four compounds [4]. EU specific migration limits (SML) for organotin migration from plastic to food are listed in the plastic positive list [5]. For substances not covered by the plastics directive, limits can be calculated based on their TDI values, according to the Framework Regulation, Article 3 [6].
Table 1 lists both the present limits and the lower limits based upon the recent EFSA opinion (values in parenthesis).
A small-scale survey was conducted by DTU Food for the Danish Veterinary and Food Administration to investigate organotin migration from FCM to food. Thirty-three samples were collected by local food inspectors from FCM producers and importers including: baking paper, PVC cling films, silicone baking equipment, lids with plasticized PVC gaskets, and PUR agglomerated cork wine stoppers. Nine organotin compounds were investigated.
MethodologyFirst the FCM was exposed to one of the food simulants 3% acetic acid (HAC), 10% ethanol or 95% ethanol. Organotin compounds were then derivatized/extracted using NaBH4 followed by triple extraction into pentane. Separation and detection of the organotin compounds was performed using an Agilent 6890N GC interfaced to an Agilent 7500ce ICP-MS using the Agilent GC-ICP-MS interface. GC and ICP-MS conditions are summarized in Table 2. External calibration with internal standardization was based on the analysis of tripropyltin (TPrT).
Results and DiscussionTable 3 shows the names and acronyms of the organotin compounds tested, in addition to the obtained retention times, limit of detection (LOD) and estimated measurement uncertainty.
Note: The migration test used 100 mL foodstuff simulator to 0.6 dm2 material, 20 mL of migrate solution was used for extraction, 45 mL pentane was used for the extraction, 1 kg foodstuff was in contact with 6 dm2 (conventional conversion factor).
Specific Migration of Organotin Compounds from Food Contact Materials — Selective Determination by GC-ICP-MSJens J. Sloth, Xenia T. Trier, Birgitte K. Herbst, Lisbeth K. Jensen and Erik H. Larsen Technical University of Denmark, National Food Institute (DTU Food), Division of Food Chemistry, DK-2860 Søborg, Denmark
Table 1. EU specific migration limits for organotin compounds (EFSA evaluation values in parenthesis) samples
Compounds Maximum level (µg Sn/kg foodstuff)
Σ DBT, TBT, TPhT and 40 (6) DOT Σ MMT, DMT 180 MOT 1200 MDDT 12000 (50) DDDT 24000 (50)
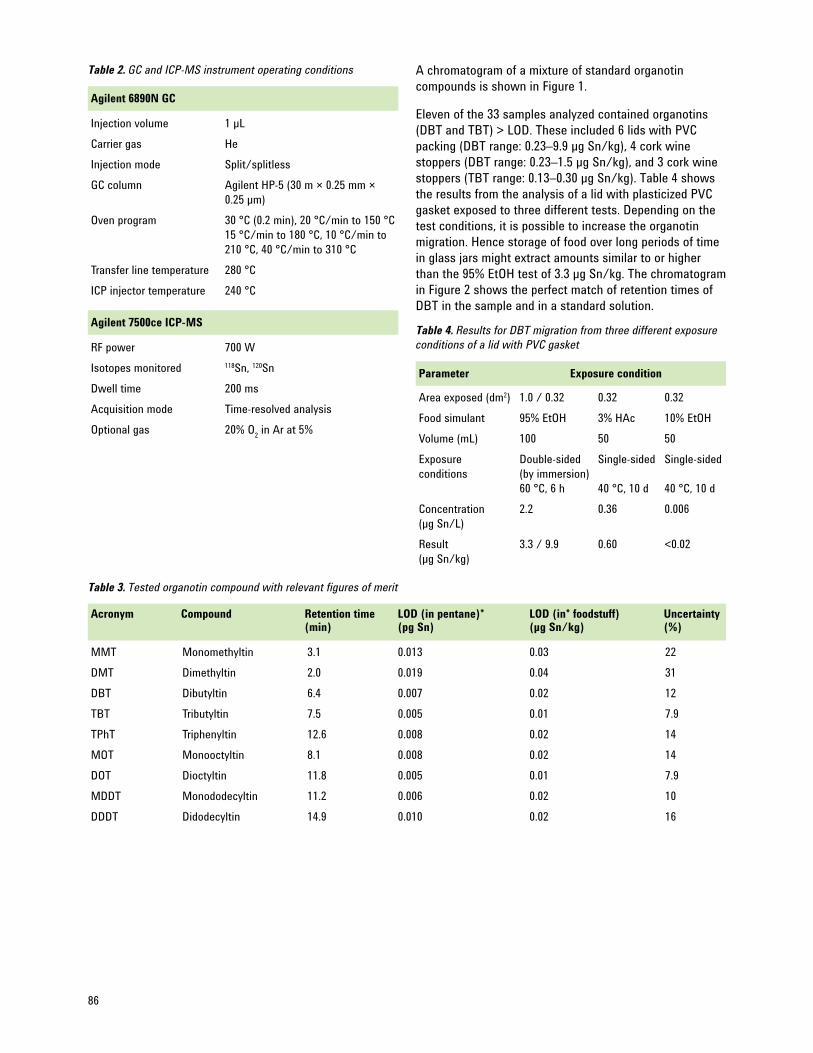
86
Table 2. GC and ICP-MS instrument operating conditions
Agilent 6890N GC
Injection volume 1 µL Carrier gas He Injection mode Split/splitless GC column Agilent HP-5 (30 m × 0.25 mm × 0.25 µm) Oven program 30 °C (0.2 min), 20 °C/min to 150 °C 15 °C/min to 180 °C, 10 °C/min to 210 °C, 40 °C/min to 310 °C Transfer line temperature 280 °C ICP injector temperature 240 °C
Agilent 7500ce ICP-MS
RF power 700 W Isotopes monitored 118Sn, 120Sn Dwell time 200 ms Acquisition mode Time-resolved analysis Optional gas 20% O2 in Ar at 5%
Table 3. Tested organotin compound with relevant figures of merit
Acronym Compound Retention time LOD (in pentane)* LOD (in* foodstuff) Uncertainty (min) (pg Sn) (µg Sn/kg) (%) MMT Monomethyltin 3.1 0.013 0.03 22 DMT Dimethyltin 2.0 0.019 0.04 31 DBT Dibutyltin 6.4 0.007 0.02 12 TBT Tributyltin 7.5 0.005 0.01 7.9 TPhT Triphenyltin 12.6 0.008 0.02 14 MOT Monooctyltin 8.1 0.008 0.02 14 DOT Dioctyltin 11.8 0.005 0.01 7.9 MDDT Monododecyltin 11.2 0.006 0.02 10 DDDT Didodecyltin 14.9 0.010 0.02 16
Parameter Exposure condition
Area exposed (dm2) 1.0 / 0.32 0.32 0.32 Food simulant 95% EtOH 3% HAc 10% EtOH Volume (mL) 100 50 50 Exposure Double-sided Single-sided Single-sided conditions (by immersion) 60 °C, 6 h 40 °C, 10 d 40 °C, 10 d Concentration 2.2 0.36 0.006 (µg Sn/L) Result 3.3 / 9.9 0.60 <0.02 (µg Sn/kg)
Table 4. Results for DBT migration from three different exposure conditions of a lid with PVC gasket
A chromatogram of a mixture of standard organotin compounds is shown in Figure 1.
Eleven of the 33 samples analyzed contained organotins (DBT and TBT) > LOD. These included 6 lids with PVC packing (DBT range: 0.23–9.9 µg Sn/kg), 4 cork wine stoppers (DBT range: 0.23–1.5 µg Sn/kg), and 3 cork wine stoppers (TBT range: 0.13–0.30 µg Sn/kg). Table 4 shows the results from the analysis of a lid with plasticized PVC gasket exposed to three different tests. Depending on the test conditions, it is possible to increase the organotin migration. Hence storage of food over long periods of time in glass jars might extract amounts similar to or higher than the 95% EtOH test of 3.3 µg Sn/kg. The chromatogram in Figure 2 shows the perfect match of retention times of DBT in the sample and in a standard solution.

87www.agilent.com/chem/icpms
Figure 1. Chromatogram of a standard solution of 13 organotin compounds
Figure 2. Chromatogram from the analysis of a double-sided test of a lid with PVC gasket

88
ConclusionsThis GC-ICP-MS method can selectively determine nine organotins in migrates from food contact materials with detection limits that meet the new limits for organotin compounds proposed by the European Food Safety Authority. Of the 33 Danish food contact material samples analyzed, none exceeded the existing EU levels. However, it was possible to get a migration of DBT above the proposed EFSA limit of 6 µg Sn/kg for the sum of DBT, TBT, TPhT, and DOT from one of the lids that was tested, illustrating that migration of organotin compounds from FCM to food may potentially be of toxicological concern.
References1. EU report (2002). Assessment of the Risks to Health and the Environment Posed by the Use of Organostannic Compounds. EU DG Enterprise, 2002.
2. Jiang, G., Liu, J. & Zhou, Q. (2004). Environ. Sci. Technol, 38, 4349–4352.
3. Technical Migration directives 828711/EC + amendments 93/8/EC and 97/8/EC.
4. EFSA (2004). Opinion on the health risks to consumers associated with exposure to organotins in foodstuffs. The EFSA Journal, 102, 1–114.
5. Plastic Directive for FCM, EU 2002/72/EC with amendments.
6. EU Framework regulation (EC) No. 1935/2004.

89www.agilent.com/chem/icpms
Note: This section isn’t intended to be a comprehensive GC troubleshooting guide but rather to help recognize common problems that may be encountered in typical GC-ICP-MS applications and to help diagnose problems unique to GC-ICP-MS.
GC-ICP-MS is a relatively complex analytical system, composed of discrete components, which can and should be tested individually when the system is not performing as expected. The most common and successful technique requires dividing the system into increasingly smaller subsystems and eliminating those that are functioning correctly. This begins with isolating the GC performance from the ICP-MS performance. This doesn’t require physically separating the instruments. Once the source of the problem has been identified (GC or ICP-MS), then that system is further subdivided and the process repeated.
Problem Suggested solution. Refer to the corresponding number in Table 2 for more detail.
Nopeaks • IstheICP-MSworking?[1] •IstheGCcarrierflowreachingtheICP-MS?[2] •IsthesamplebeingtransportedfromtheGCinjectortotheGCcolumn?[3]Poorpeakshapeorpoor •IstheGCcolumnflowcorrect?[4] separationofpeaks •AretheGCconditions(injectionprogram,ovenprogram,andchoiceofcolumn)appropriateforthe solvent and analyte? [5]Poorsensitivity • CheckICP-MStunesensitivity.[6] • AreICP-MSintegrationtimessufficientforanalyteconcentrations?[7] • Isthecorrectoptionalgaschosenandoptimized?[8] • PoortransferofanalytesfromGCinlettoICP-MS.[9]Excessivebackgroundorhigh • DoesitoriginatewithGCorwithICP-MS?[10] baselineBaselinedrift • IsconstantflowenabledontheGC?[11] • Iscarbonaccumulatingoncones?[12] • Besurethattransferlineandinjectortemperatureshavestabilized.Lossofhighboilingpeaks • ChecktransferlineandICPinjectortemperature.[13]Lossofreactiveorlabile • ReplaceGCinjectorliner. peaks • Replacetransferlinelinerwithnew,Sulfinertliner. • Ifsplitlessinjection,trypulsedpressureinjection. • Useaninert,lowbleedstationaryphasesuchasDB-5MS. • Useathinnerstationaryphasefilmifpossible.Poorreproducibilityon • Isinjectionmodesplitless?Carbonmaybedepositingoncones.[12] repeatinjections • Isinjectionmodesplit?Carbonmaybedepositedonconesorinadequatemixingofgasinside injection port. A small plug of silanized glass wool or quartz wool in the injection port liner may enhance mixing.
Table 1. Primary GC-ICP-MS troubleshooting matrix
Troubleshooting GC-ICP-MS Systems

90
Number Detailed suggested solution
1 Did the ICP-MS meet tune criteria for Xe? Can you see counts at m/z 80 in the tune screen? Have you autotuned the EM and discriminator? 2 First, make sure He/Xe is switched on. Replace the GC septum. Check the Xe signal in the ICP-MS tune screen. Does it increase and decrease with changing He/ Xe flow? Check column nuts and ferrules at both ends for tightness and examine column for breaks (a He leak detector is very useful here). Is torch position properly set? Are the horizontal, vertical and sampling depths correctly set? Have the transfer line and injector heater stabilized at temperature setpoints? Are EPC (electronic pressure control) column parameters properly set; that is, dimensions, film thickness, column exit pressure, and so on? 3 Replace the GC injection port septum and liner o-ring and check the column ferrule for leaks using a He leak detector. Ensure that the inlet pressure is sufficiently high to overcome column outlet pressure. 4 See [3] above. If flow is not correct, double-check EPC parameters, especially column exit pressure. Inject air and watch for N peak at m/z 14 in tune. Alternatively, inject butane from a butane lighter and monitor C at m/z 12. Check the retention time and use it to calculate the average linear velocity (LV) in the GC column. LV should be somewhere between ~20–60 cm/s. 5 Check the column supplier catalog for chromatographic conditions for similar analyte compounds. 6 Is the Xe signal within the typical range for the He/Xe flow and concentration being used? Is Extract 1 lens voltage set at a high negative value (-150 to -180 V) for maximum sensitivity (especially for low mass elements)? 7 Integration times should be as long as possible while still permitting at least 10 full scans across the width of the chromatographic peak. High ionization potential or low abundance isotopes will require longer integration times than low IP, higher abundance isotopes. 8 Different elements are enhanced by different optional gases, typically O2 or N2. The selection and flow of the optional gas should be optimized for best sensitivity. If O2 is used to burn off carbon at the time of injection, is it turned off at the time compounds elute? O2 can interfere with some elements, sulfur in particular, and reduce the sensitivity of others, Hg and Br for example. 9 Is the injection splitless or split? If splitless, increase the splitless time to allow for better transfer of analyte to the column before the split vent opens. What is the column split ratio? Can a lower split ratio be used? Are you using pulsed pressure injection? Check literature for recommended GC injection conditions for your particular analyte/solvent combination. 10 Monitor the background as the oven temperature ramps. If it follows the GC oven temperature, it is likely caused by GC column bleed or contamination. Check the background masses in tune. Column bleed usually comes in the form of phenyl and methyl silicones, which should give rise to the background associated with all masses of carbon and silicon (12, 13, 28, 29, and 30). Run ICP-MS detector autotune. Ensure that Discriminator is selected. 11 If the GC flow is not constant, the baseline can drift, particularly if Xe is being used as an internal standard, because the Xe flow will vary as a function of oven temperature. 12 After repeated splitless injections with organic solvents, carbon can deposit on the sampler cone. Sometimes this deposition is evidenced by a red glow at the tip of the sampler cone. At other times, it may not be visibly apparent but still results in instability and irreproducibility from injection to injection. A 1–3 minute pulse of O2 at the time of injection, delivered via an auxiliary gas line, will often remedy this problem. The use of Pt cones is recommended when using oxygen addition. 13 Are the transfer line and injector temperature set at least as high as the final oven temperature? Are temperatures of the transfer line and ICP-injector cycling above and below the set point? If so, make sure that GC PID values are properly set for these zones (see GC configuration manual or ICP-MS transfer line installation manual for details on setting PID values for various thermal devices).
Table 2. Secondary GC-ICP-MS troubleshooting matrix

Introduction to Multi-MS — Coupling HPLC with Elemental and Molecular Mass Spectrometry 92
Mercury Speciation in Rice — More Than Methylmercury using HPLC-ICP-MS/Electrospray Ionization 93 (ESI) MS
Speciation of Selenometabolites in the Liver of Sea Turtles using HPLC-ICP-MS and Electrospray 95 Ionization (ESI) MS-MS
Determination and Quantification of Non-Metal Bound Phytochelatins by HPLC-ICP-MS/Electrospray 98 Ionization (ESI) MS
Fractionation and Identification of Arseno Fatty Acids from Cod-Liver Oil by the Parallel Use of HPLC 100 On-Line with ICP-MS and Electrospray Ionization (ESI) MS
Selenium Speciation in Soybean using HPLC-ICP-MS and Electrospray Ionization (ESI) Ion Trap (IT) 102 MS
Multi-Elemental Exposure of Freshwater Plants and Identification of Heteronuclear Phytochelatin 105 Complexes by HPLC Electrospray Ionization (ESI) MS/ICP-MS
Protein Phosphorylations as Potential Biomarkers in Cerebral Spinal Fluid 109
MULTI-M
S
www.agilent.com/chem/icpms

92
While ICP-MS is an excellent quantitative elemental detector for high performance liquid chromatography (HPLC), it cannot, by itself, provide information about molecular weight or structure. Conversely, traditional molecular mass spectrometry (MS) techniques commonly used with HPLC can provide molecular weight and structural information, but lack the element specificity and sensitivity of ICP-MS. When used in parallel, elemental and molecular MS can work together to provide analytical information previously unavailable in a single analysis.As a result, the combined application of elemental and molecular MS with HPLC has been increasingly exploited in bio-inorganic analytical chemistry for the past ten to fifteen years. ICP-MS, the most popular element-specific detector has played a crucial role in this marriage because of its detection power, which can measure low parts-per-billion and parts-per-trillion (ppt) levels of elemental species in environmental, food and bioclinical samples. Additionally, its multi-element and multi-isotope detection capabilities have been invaluable for monitoring the degree of species transformation and for species quantification in speciation applications. The elemental specificity of ICP-MS, improved by continued developments in interference-reducing technology, has become a key to successful compound identification by combined elemental and molecular MS. LC-ICP-MS retention times, although insufficient on their own for this purpose, are invaluable in helping to locate target elemental species in very complex organic mass spectra by data mining, enabling their subsequent structural characterization. The capability to characterize elemental species at subnanomolar levels in complex samples by electrospray ionization MS/MS (ESI-MS/MS) has been further improved by significantly improved signal-to-noise ratio as obtained by using multistep sample preparation and preconcentration procedures. Additionally, efforts have been made to develop high resolution separation systems compatible with both ICP and ESI. This means introduction of higher organic content and lower flow rates (down to nL/min) into the ICP-MS, which have driven the development of optimized ICP-MS instrumentation and chromatographic interfaces. For elements of high molecular diversity, successful strategies have made use of the power of accurate mass measurement. Due to the high probability of assigning different chemically possible formulas to the same mass,
the need for combining a highly selective separation technique with element-specific detection, for example by ICP-MS, and accurate mass measurement of the parent and fragment ions, for example by quadrupole-time-of-flight (Q-TOF) MS/MS, Fourier transfer (FT) MS/MS or orbitrap MS/MS to reduce the ambiguity of identification has been demonstrated by a number of speciation scientists.
In summary, the combination of HPLC with element (ICP-MS) and molecule-specific (ESI-MS/MS or MALDI MS) detection is considered a ‘must’ in speciation research nowadays. Future developments of this multi-MS approach will be driven by the introduction of new concepts, technologies, emerging regulations and needs in modern clinical chemistry, for example protein analysis.
Introduction to Multi-MS — Coupling HPLC with Elemental and Molecular Mass SpectrometryHeidi Goenaga Infante LGC, Queens Road, Teddington, Middlesex, TW11 OLY, UK

93www.agilent.com/chem/icpms
Keywordsbiothiols, glutathione, phytochelatins, rice, reversed-phase HPLC, ICP-MS, electrospray ionization, ESI-MS
IntroductionTo date, mercury speciation has focused primarily on the determination of methylmercury (CH3Hg), which is known to accumulate in the marine environment. However, methylmercury alone does not explain the long latency time of acute mercury toxicity, nor does it explain the organ-specific accumulation phenomena in predatorial fish and mammals. In contrast, the uptake of mercury from soil into plants and its translocation in plants is better understood and it is hypothesized that complexation with biothiols such as glutathione or phytochelatins (PCs) may influence its transport inside plants.
ExperimentalSeparation of various phytochelatins in plant extracts was achieved using an Agilent Eclipse XDB-C18 column (5 µm, 4.6 × 150 mm) with a linear gradient of 0.1% formic acid (HCO2H) in water and 0.1% formic acid in methanol at a flow rate of 1 mL/min. The eluent flow was split post column using a ratio of 2:8, with 2 parts going to the ICP-MS (Agilent 7500c) and the remaining 8 parts going to an electrospray ionization mass spectrometer (ESI-MS) (Agilent MSD XCT). Details have been reported elsewhere [1].
Rice (Oryza sativa) plants were exposed to 10 mg/L Hg2+ and extracted in formic acid, which preserves the stability of the complex and is similar to the mobile phase used for the separation.
Results and DiscussionWith the simultaneous determination of elemental mercury by ICP-MS and the molecular masses using ESI-MS, it is now possible to identify and quantify novel mercury species in rice. Figure 1 shows a chromatogram of a root extract from Oryza sativa exposed to Hg2+ present in hydroponic solutions. The m/z 202 (Hg) trace obtained using ICP-MS shows the presence of 11 different mercury-containing compounds (Figure 1). The peak labeled 1 is Hg2+, peak 8 has been identified as iso-PC2 (Ser), peak 9 is PC2Hg (forming a characteristic fragment M-Gly) and peak 11 is iso-PC2Hg (Glu). All of the other peaks are unidentified mercury complexes [2].
These complexes can be determined not only in rice but also in other mercury accumulators such as Marrubium vulgare. However when those plants are exposed to methylmercury, no complexes with phytochelatins or glutathione have been identified.
Mercury Speciation in Rice — More Than Methylmercury using HPLC-ICP-MS/ Electrospray Ionization (ESI) MS Eva M Krupp, Adrien Mestrot, Jörg Feldmann TESLA (Trace Element Speciation Laboratory), University of Aberdeen, Meston Walk, AB24 3UE, Scotland, UK

94
ConclusionsLabile mercury biothiol complexes can be separated by reversed-phase (RP) HPLC and the simultaneous use of ESI-MS and ICP-MS provides the capability to identify and quantify novel mercury compounds, even though no standards are available. It is not yet established whether these mercury phytochelatin species influence the transport of mercury inside plants.
Figure 1. RP-HPLC-ICP-MS/ESI-MS chromatogram of a root extract from rice exposed to inorganic mercury showing mercury-specific and molecular-specific signals simultaneously. PC2Hg is illustrated as a stick and ball model: Hg — gray; S — yellow; N — blue; O — red; C — cyan; H — not shown.
202Hg(ICP-MS)
0 200 400 600 800 Time (s)
m/z 812Iso-PC2Hg (Glu)
m/z 740PC2Hg
m/z 554unknown
m/z 797unknown
m/z 683 PC2Hg-Gly
m/z 770Iso-PC2Hg (Ser)
ESI-MSTotal ion count
5
4
32
1
6 1110
9
87
References1. Krupp, E. M., Milne, B. F., Mestrot, A., Meharg, A. A. & Feldmann, J. (2008). Analytical and Bioanalytical Chemistry, 390, 1753.
2. Krupp, E. M., Mestrot, A., Wielgus, J., Meharg, A. A., Feldmann, J. (2009). Chemical Communications, 28, 4257.

95www.agilent.com/chem/icpms
Keywordsselenium, selenoproteins, selenosugars, trimethylselenonium, selenoneine, HPLC-ESI-MS-MS, HPLC-ICP-MS
IntroductionSelenium (Se) is an essential micronutrient in animals that is necessary for the formation of selenocysteine (SeCys), an amino acid that forms the active centers of various seleno-enzymes. The metabolic pathway of Se, from its ingestion to excretion, has been well-studied in laboratory animals. It is known that all Se species ingested via food and drinking water are transformed into selenide, and this is utilized for the biosynthesis of SeCys for incorporation into selenoproteins, or selenosugars and trimethylselenonium (TMSe) for excretion.
Se is also known to detoxify mercury (Hg) by direct interaction. Higher trophic marine animals, such as marine mammals and seabirds, co-accumulate Se and Hg in their tissues at a 1:1 molar ratio. However, we found in a previous study that some sea turtles accumulated Se but not Hg in their livers [1]. The sole accumulation of Se suggests that some marine animals have a unique pathway for Se metabolism.
In this study, speciation analysis using HPLC-ICP-MS and HPLC-ESI-MS-MS was performed to identify selenometabolites in the livers of Hawksbill (Eretmochelys imbricata) and Green (Chelonia mydas) turtles.
ExperimentalWith permission from the Japanese government, Hawksbill and Green turtles were collected in the Yaeyama Islands, Japan, and their livers were immediately frozen in liquid nitrogen and stored at -80 °C until analysis.
HPLC-ICP-MS analysisThe liver samples were homogenized and separated into cytosol and insoluble fractions using ultra centrifugation. A portion of the cytosol fraction was heated and then centrifuged to obtain a heat-treated fraction. The cytosol
and heat-treated fractions were applied to multimode gel filtration columns, (GS-520HQ; exclusion size, 300,000 Da; 7.5 id × 300 mm; Showa Denko, Tokyo, Japan) and (GS-320HQ; exclusion size, 40,000 Da; 7.5 id × 300 mm; Showa Denko), respectively. The former column was eluted with 50 mM tris-HCl, pH 7.4, at a flow rate of 1.0 mL/min, and the latter with 50 mM ammonium acetate, pH 6.5, at a flow rate of 0.6 mL/min. The eluate was introduced directly to an Agilent 7500ce ICP-MS for analysis. Operating parameters are given in Table 1.
Speciation of Selenometabolites in the Liver of Sea Turtles using HPLC-ICP-MS and Electrospray Ionization (ESI) MS-MS Yasumi Anan and Yasumitsu Ogra, Laboratory of Chemical Toxicology and Environmental Health, Showa Pharmaceutical University, Tokyo, Japan Kazuya Ishiwata, Noriyuki Suzuki, Graduate School of Pharmaceutical Sciences, Chiba University, Chiba, Japan Shinsuke Tanabe, Center for Marine Environmental Studies, Ehime University, Ehime, Japan
Table 1. ICP-MS instrument operating conditions
Agilent 7500ce ICP-MS
RF power 1500 W Plasma gas flow rate 15.0 L/min Carrier gas flow rate 1.05 L/min Auxiliary gas flow rate 1.15 L/min Nebulizer gas flow rate 1.05 L/min Acquisition mode Time-resolved Isotope monitored 82Se Integration time 100 ms Points per peak 1
HPLC-ESI-MS-MS analysisAn API3000 triple quadrupole MS with an electrospray ionization source (ESI-MS-MS; Applied Biosystems, Tokyo) was used to identify the structure of the unknown Se compound(s). The ESI-MS-MS was operated in positive ion mode. The heat-treated soluble fraction was applied to an HPLC equipped with a narrow bore multimode size-exclusion column (Shodex GS320A-2E; 2.0 id × 250 mm; Showa Denko). The column was eluted with 10 mM ammonium acetate, pH 6.5, at a flow rate of 40 µL/min, and the eluate was introduced into the ionization spray of the ESI-MS-MS without splitting. The introduction into the ESI-MS-MS was time-separated for Se elution using a four-way valve. The dissociation of Se-containing molecular ions at m/z 278 and 553 was induced with collision energies of 15, 25, and 35 eV, and fragment ions were detected with the second mass spectrometer.

96
ResultsThe HPLC-ICP-MS was equipped with a GS-520HQ column. Two peaks were observed in the spectra of the hepatic cytosol of Hawksbill and Green turtles (Figure 1). The first peak disappeared on heat treatment, suggesting it was due to selenoproteins and/or Se-containing proteins. The second (larger) peak was stable to heat treatment, suggesting a low molecular weight selenium metabolite. To analyze these selenometabolites with higher resolution, another multimode gel filtration column, GS-320HQ, with a smaller molecular weight range was used. Several Se peaks were detected (Figure 2). Two of the selenometabolites existed in relatively small amounts and were assignable to selenosugar (1ß-methylseleno-N-acetyl-D-galactosamine) and TMSe according to their chromatographic behavior. However, the retention time of the major Se peak did not match those of any authenticated Se standards.
Figure 2. Elution profiles of low molecular weight Se compounds in the heat-treated cytosol from sea turtles on a GS-320HQ column. (ukSe: unknown Se compound.)
Figure 1. Elution profiles of Se in the hepatic cytosol of Hawksbill turtle and Green turtle on a GS-520HQ column
To identify the unknown Se compound, HPLC-ESI-MS-MS analysis was performed. ESI-MS spectra showing the isotope patterns of monomeric and dimeric Se were observed at around m/z 278 and 553, respectively (Figure 3). MS-MS analysis of the ion at m/z 278 revealed it to be selenoneine (2-selenyl-N,N,N-trimethyl-L-histidine), which was recently detected in the blood of bluefin tuna [2].

97www.agilent.com/chem/icpms
ConclusionsTwo species of sea turtles, Hawksbill turtle (E. imbricata) and Green turtle (C. mydas), were found to accumulate Se in their livers but not Hg. The major hepatic Se species is a novel selenometabolite that was identified as selenoneine (2-selenyl-N,N,N-trimethyl-L-histidine) by HPLC-ESI-MS-MS. The fact that selenoneine was first identified in the sea turtles suggests that they possess specific mechanisms for Se metabolism, which result in the sole accumulation of Se. The biological significance and metabolism of selenoneine are unclear at present and further studies are warranted to reveal its biological and ecological significance in sea turtles.
References1. Anan, Y., Kunito, T., Watanabe, I., Sakai, H. & Tanabe, S. (2001). Environ. Toxicol. Chem., 20, 2802–2814.
2. Yamashita, Y. & Yamashita, M. (2010). J. Biol. Chem., 285, 18134–18138.
Figure 3. ESI-MS spectrum of the eluate containing unknown Se compound (ukSe) in the heat-treated cytosol fraction of liver from Hawksbill turtle
Additional InformationAnan, Y., Ishiwata, K., Suzuki, N., Tanabe, S. & Ogra, Y. (2011). Speciation and identification of low molecular weight selenium compounds in the liver of sea turtles. J. Anal. At. Spectrom., 26, 80–85.

98
Keywordsphytochelatins, PC, PCs, cysteine, peptides, sulfur, sulphur, ORS, oxygen, HPLC-ICP-MS, electrospray ionization, ESI-MS
IntroductionPhytochelatins (PCs) are cysteine-rich peptides that are thought to contribute to the regulation of metal(loid) toxicity in plants. Metal-PC complexes can be determined quantitatively, down to ppt levels, by HPLC-ICP-MS/ESI-MS, with the ICP-MS being the quantitative tool and electrospray ionization (ESI)-MS providing information for the identification of the compound of interest. Traditionally, the quantification of non-metal bound PCs was restricted to UV-D data using Ellman’s reagent or monobromobimane (mBBr) with both methods relying on the availability of respective standards. More recently phytochelatins have been quantified by measuring S at m/z 32 by ICP-MS. However, m/z 32 suffers overlap from solvent derived O2 interferences that require either removal of the interference using Xe as a cell gas (by charge transfer reaction) or by converting the S to SO with O2 cell gas and measuring it as SO+ at m/z 48. Both approaches are possible using an Agilent 7500c, which is equipped with an Octopole Reaction System (ORS) collision/reaction cell.
ExperimentalSeparation of various phytochelatins in plant extracts was achieved on an Agilent Eclipse XDB-C18 column (5 µm, 4.6 × 150 mm) using a linear gradient of 0.1% formic acid (HCO2H) in water and 0.1% formic acid in methanol at a flow rate of 1 mL/min. The eluent flow was split after the column using a ratio of 2:8*; with 2 parts going to the ICP-MS (Agilent 7500c) and the remaining 8 going to the ESI-MS (Agilent MSD XCT). Operating parameters are given in Table 1.
* Ratio when the ICP-MS was operated in reaction mode using oxygen as a reaction gas. The eluent split ratio was 1:9 when xenon was used.
Determination and Quantification of Non-Metal Bound Phytochelatins by HPLC-ICP-MS/ Electrospray Ionization (ESI) MS Katharina Bluemlein, B. Alan Wood, Andrea Raab, Eva M. Krupp and Jörg Feldmann TESLA (Trace Element Speciation Laboratory), University of Aberdeen, Meston Walk, AB24 3UE, Scotland, UK
Table 1. ESI-MS and ICP-MS instrument operating conditions
Agilent MSC XCT ESI-MS
Scan mode Positive MS/MS mode Automatic m/z scan range 100–2000 Target m/z depending on time: 0–5 min 300 5–11 min 600 11–18 min 800 18 min till end 1100 Ion spray voltage 3500 V Nebulizer gas, nitrogen 50 psi Dry gas, nitrogen 12 L/min Ion source temperature 350 °C
Agilent 7500c ICP-MS [Xenon] [Oxygen]
Nebulizer Microconcentric Microconcentric RF power 1570 W 1570 W Carrier gas flow rate 0.75 L/min 0.75–0.85 L/min Optional gas: 20% O2 5% 5% in Ar OctP bias -48 V -4 or -3.8 V QP bias -2.5 V -3.5 V Collision gas: Xe/O2 17% 15% Isotope/integration As (m/z 75): 1 s SO (m/z 48): 1 s time S (m/z 32): 1 s AsO (m/z 91): 0.7 s Split ratio 1:9 2:8 ICP-MS/ESI-MS

99www.agilent.com/chem/icpms
ResultsThe sulfur detection limit of 100 µg/g achieved by operating the 7500c ICP-MS in no gas mode could be lowered down to approximately 80 ng/g by using either xenon or oxygen as cell gases [1]. Although xenon provides satisfactory results using standards, it is less applicable for actual samples because of its high cost. Instead, the 7500c was configured to use oxygen as a cell gas. Figure 1 shows the co-elution of the ICP-MS trace at m/z 48 (SO+) and the respective ESI-MS signals for free PC2, PC3 and PC4. The sum of the quantified arsenic phytochelatin complexes agreed with measurements obtained using solid-phase direct speciation analysis (XANES/EXAFS) [2], validating the HPLC-ICP-MS/ESI-MS methodology.
Figure 1. HPLC-ICP-MS/ESI-MS analysis of a Thunbergia alata root extract for free and arsenite phytochelatins using an Agilent 7500c ICP-MS in reaction cell mode with oxygen as the reaction gas
ConclusionsThe determination of free phytochelatins outlined here demonstrates that the Agilent 7500c ICP-MS operating with oxygen as a reaction gas can be used to determine sulfur-containing compounds down to the ppb level [3]. Consequently this method is a suitable replacement for the traditional methods that require Ellman’s reagent and mBBr.
References1. Bluemlein, K., Raab, A. & Feldmann, J. (2009). Stability of arsenic peptides in plant extracts: Off-line versus on-line parallel elemental and molecular mass spectrometric detection for liquid chromatographic separation. Analytical and Bioanalytical Chemistry, 393, 357–366.
2. Bluemlein, K., Raab, A., Meharg, A. A., Charnock, J. M. & Feldmann, J. (2008). Can we trust mass spectrometry for determination of arsenic peptides in plants: Comparison of LC-ICP-MS, LC-ESMS/ICP-MS with XANES/EXAFS in analysis of Thunbergia alata. Analytical and Bioanalytical Chemistry, 390, 1739–1751.
3. Wood, B. A., Miyashita, S., Kaise, T., Raab, A., Meharg, A. A. & Feldmann J. (2011). Arsenic is not stored as arsenite-phytochelatin complexes in the seaweeds Fucus spiralis and Hizikia fusiforme. Environmental Chemistry, 8, 30–43.
05000
100001500020000250003000035000400004500050000
0 5 10 15 20 25 30Time (min)
ICP-
MS
inte
nsity
0.E+00
1.E+062.E+063.E+064.E+065.E+066.E+067.E+068.E+069.E+06
ES-MS intensity
AsO+ m/z 91
SO+ m/z 48ICP-qMS (oxygen)
ES-MS
oxd. PC3 m/z 770red. PC3 m/z 772oxd. PC4 m/z 1000red. PC2 m/z 540oxd. PC2 m/z 538AsIII-PC3 m/z 844
AsIII-(PC2)2 m/z 1151AsIII-PC4 m/z 1076

100
Keywordsarsenic, arsenolipids, fatty acids, ORS, oxygen, reversed-phase HPLC, HPLC-ICP-MS, electrospray ionization, ESI-MS
IntroductionArsenic compounds have been studied extensively because of their toxicity. However, the vast majority of the research has focused on water-soluble arsenic compounds. Lipid-soluble arsenic compounds (arsenolipids) have been largely neglected because of challenges associated with their analysis. Recent studies by Taleshi et al. (2008) isolated and identified three arsenolipids as arsenic-containing long chain hydrocarbons in the oil extracted from capelin fish and Rumpler et al. (2008) reported the presence of at least 15 arsenolipid species in cod-liver oil. Six were identified as arsenic-containing fatty acids, which accounted for 20% of the total arsenolipid content. Cod-liver oil is an important dietary supplement and the presence of arsenolipids raises the question about their speciation and the toxicological implication when cod-liver oil is consumed by humans. Although most arsenolipids are yet to be identified, here we report on the identification of a series of arsenolipids from cod-liver oil using HPLC with parallel detection by ICP-MS and electrospray ionization MS (ESI-MS).
ExperimentalArsenolipids in cod-liver oil were preconcentrated and then purified by vacuum liquid chromatography (VLC) using gradient elution on a column packed with silica gel 60. Hexane, ethyl acetate and methanol with varying compositions in order of increasing polarity was used as the eluting solvent. The fractions (8 and 9) obtained using 100% MeOH were found, on analysis with HPLC-ICP-MS, to be enriched with arsenolipids. The arsenolipids were separated using a gradient of 0.1% formic acid (HCO2H) in water and 0.1% formic acid in methanol on a reversed-phase column, ACE C18, 150 × 4.5 mm. The eluent flow was split post column, at a ratio of 2:8 to the ICP-MS and ESI-MS respectively. An Agilent 7500c ICP-MS was fitted with a microconcentric nebulizer and operated in organic mode. HPLC-ESI-MS was performed using an Agilent 1100 Series LC/MSD in positive ion scan mode. Instrument operating conditions are shown in Table 1.
ResultsAnalysis by reversed-phase (RP)-HPLC using ICP-MS as a specific detector for arsenic (m/z 75) clearly revealed the presence of arsenolipids in cod-liver oil, as shown in Figure 1. Identification was further enhanced from the ESI-MS data in positive ion mode and the following peaks were identified in the mass chromatogram: m/z 333, 361, 405, 335, 363, 419, 391, 389, 437, 365, 418, all co-eluting with arsenic peaks at m/z 75, as illustrated in Figure 2.
Fractionation and Identification of Arseno Fatty Acids from Cod-Liver Oil by the Parallel Use of HPLC On-Line with ICP-MS and Electrospray Ionization (ESI) MS Kenneth O. Amayo, Andrea Raab and Jörg Feldmann TESLA (Trace Element Speciation Laboratory), University of Aberdeen, Meston Walk, AB24 3UE, Scotland, UK
Table 1. HPLC, ICP-MS and ESI-MS instrument operating conditions
Agilent 1100 HPLC
Column ACE C18, 150 × 4.5 mm, 30 °C Injection volume 100 µL Buffer A 0.1% formic acid in water Buffer B 0.1% formic acid in methanol Splitter ratio 2:8 Flow rate 1 mL/min Gradient 0–25 min: 0–100%, 5 min 100% B Saponification 0–30 min: 0–100% B, 20 min 100% B
Agilent 7500c ICP-MS
Mode Organic RF power 1570 W Nebulizer Microconcentric Nebulizer gas flow rate 0.86 L/min Optional gas O2 6% Plasma gas flow rate 0.89 L/min Coolant gas flow rate 14.9 L/min
ESI-MS (Trap MS)
Capillary voltage 4000 V Curtain gas flow rate 12 L/min Curtain gas temperature 350 °C Mode Positive

101www.agilent.com/chem/icpms
Figure 1. RP-HPLC-ICP-MS chromatogram of an arsenolipid extract from cod-liver oil showing arsenic-containing compounds at m/z 75
VLC was used to separate the cod-liver oil into 10 fractions using gradient elution. Arsenolipids were detected in fractions 8 and 9. The chromatograms for these two fractions revealed that more arsenolipids were present in fraction 9 and broader peaks (likely due to matrix effects) were observed in fraction 8. Predicted structures for arsenolipids were based on fragmentation patterns. An example is given for m/z 391, MS/MS –> 101, 111, 121, 135, 149, 163, 177, 233, 251, 327, 355, 373 (-H2O). The proposed arsenolipid structure is:
Figure 2. HPLC-ICP-MS/ESI-MS chromatogram of arsenolipids from cod-liver oil showing overlapping of peaks
the recent study in which we identified and quantified several arsenic-containing hydrocarbons and fatty acids in the fishmeal from capelin [3]. The structures of the arsenolipids were proposed based on the ESI-MS data and fragmentation pattern. This knowledge is important in accessing the toxicity of arsenic in cod-liver oil.
References1. Taleshi, M. S., Jensen, K. B., Raber, G., Edmonds, J. S., Gunnlaugsdottir, H. & Francesconi, K. A. (2008). Chem. Commun., 4706–4707.
2. Rumpler, A., Edmonds, J. S., Katsu, M., Jensen, K. B., Goessler, W., Raber, G., Gunnlaugsdottir, H. & Francesconi, K. A. (2008). Angew. Chem. Int. Ed., 47, 2665–2667.
3. Amayo, K. O., Petursdottir, A., Newcombe, C., Gunnlaugsdottir, H., Raab, A., Krupp, E. M. & Feldmann, J. (2011). Anal. Chem., 83, 3589–3595.
ConclusionsThrough the parallel hyphenation of RP-HPLC with ICP-MS and ESI-MS, we have identified eleven species of arsenolipids in cod-liver oil. This compares well with

102
Keywordsselenium, selenomethionine, methylselenocysteine, MeSeCys, chemopreventive agent, proteins, amino acids, ion-pairing reversed-phase, HPLC-ICP-MS, electrospray ionization, ion trap, ESI-ITMS, size-exclusion chromatography, SEC-ICP-MS
IntroductionSelenium has been increasingly studied over the last two decades. Some selenium metabolites produced by plants have a high nutritional value. For example, Se-methylselenocysteine (MeSeCys), one of the major selenium metabolites in Se-enriched garlic, onions, broccoli florets and sprouts has been reported as a cancer chemopreventive agent. Soybean (Glycine max) is one of the most important food sources worldwide. It can be consumed directly or made into vegetable oil, soy milk, infant formula, tofu, soy flour, and so forth. About 40% of its dry weight is composed of proteins, offering all of the amino acids essential to human nutrition, and making it a good substitute for animal products. In addition to providing high quality protein with low saturated fat and high dietary fiber, soybean has possible therapeutic properties against cancers, cardiovascular diseases and different chronic diseases. Therefore soybean is a good sample to be studied as a dietary source of selenium.
The aim of this study is to elucidate the selenium metabolites in soybean quantitatively and qualitatively using a combination of HPLC-ICP-MS and ESI-ITMS (electrospray ionization - ion trap mass spectrometry).
ExperimentalInstrumentationAn Agilent 7500ce ICP-MS equipped with an Octopole Reaction System (ORS) collision/reaction cell and fitted with a MicroMist nebulizer was used for the detection of selenium. Standard plasma conditions were used. Daily optimization was performed — instrument conditions can be found in Table 1.
Chromatographic separations were performed using an Agilent 1100 liquid chromatographic system equipped with a binary pump, an autosampler, a vacuum degasser, a thermostatted column compartment, and a diode array detector. Chromatographic conditions are summarized in Table 1.
A 100 μL syringe pump, running at 18 μL/h, was connected to an Agilent HPLC-Chip/Trap XCT Ultra with a nanospray interface, operating in ultra scan positive ion mode with the maximum accumulation time of 300 ms. Other operating conditions are given in Table 1.
Selenium Speciation in Soybean using HPLC-ICP-MS and Electrospray Ionization (ESI) Ion Trap (IT) MSQilin Chan and Joseph A. Caruso University of Cincinnati/Agilent Technologies Metallomics Center of the Americas, Department of Chemistry, University of Cincinnati, Cincinnati, OH, USA

103www.agilent.com/chem/icpms
Table 1. HPLC, ICP-MS, SEC and Chip-ESI-ITMS instrument operating conditions
Agilent 7500ce ICP-MS
RF power 1500 W Plasma gas flow rate 15.0 L/min Carrier gas flow rate 0.97 L/min Isotopes monitored 77Se, 78Se, 80Se Collision gas H2 (3.5 mL/min)
SEC
Column Superdex 200 10/300 GL (GE Healthcare) Mobile phase 30 mM tris-HCl, pH 7.5 Flow rate 0.6 mL/min Injection volume 100 μL
Agilent HPLC-Chip/Trap XCT Ultra ESI-ITMS
Needle voltage 2000 V Drying temperature 325 °C Drying gas N2 (3.0 L/min) CID gas He Mass range 100–500 m/z
SamplesThe soybean plants were grown in a greenhouse. The soil was supplemented with sodium selenite during the growth cycle. The samples were cleaned, freeze-dried and ground.
The samples were microwave digested in 50% nitric acid. Total selenium concentrations were then measured by ICP-MS (Figure 1).
Figure 1. Total selenium concentration in the four compartments of soybean plant
ResultsResults obtained from SEC-ICP-MS analysis indicate that 82% of the total selenium in the bean compartment is incorporated into high molecular weight species, possibly proteins. The ability of soybean to produce high protein levels, and to accumulate reasonable amounts of selenium suggests that this may be a model plant to find Se-containing proteins, which remain unidentified to date.
Ion-pairing reversed-phase (IPRP)-HPLC-ICP-MS analysis was used to separate the selenium metabolites, which were then identified by Chip-ESI-ITMS. The MS, MS2 and MS3 spectra provide high confidence identification of selenomethionine (Figure 2).
Agilent 1100 HPLC
Column Agilent Zorbax SB-C18 Mobile phase 0.02% HFBA, 2% MeOH Flow rate 1.0 mL/min Injection volume 50 μL
75
1636
151
0
50
100
150
200
Bean Pod Leaf Root
Se c
once
ntra
tion
(mg
kg-1 )

104
Figure 2. ESI-ITMS spectra of the selenium fraction from IPRP-HPLC (a) and a standard selenomethionine compound (b)
ConclusionsA comprehensive selenium profile of Se-enriched soybean was elucidated using a multi-technique method involving both atomic and molecular MS detection. The combined data of selenium species in the bean clearly demonstrate that there is an effective transition between low molecular weight selenium such as inorganic selenium or selenomethionine and high molecular weight selenospecies such as Se-containing proteins.
100 120 140 160 180 200 2200.0
0.5
1.0
1.5
100 120 140 160 180 200 2200
2
4
6
8
100 120 140 160 180 200 2200
1
2
3
4
108.6
162.7152.6
134.6
122.5
Inte
nsity
(x10
5 )
180.6
Inte
nsity
(x10
5 )
MS
MS2
MS3
197.8
Inte
nsity
(x10
6 )
197.8
180.6
100 120 140 160 180 200 2200
2
4
6
100 120 140 160 180 200 2200
3
6
9
12
15
100 120 140 160 180 200 2200
2
4
6
8 MS2
MS3
MS
197.8
197.8
180.7In
tens
ity (
x106 )
Inte
nsity
(x10
4 ) 108.7
122.7
134.7
152.7162.7
180.7
Inte
nsity
(x10
6 )
a) b)
Additional InformationChan, Q., Afton, S. E. & Caruso, J. A. (2010). Selenium speciation profiles in selenite-enriched soybean (Glycine max) by HPLC-ICP-MS and ESI-ITMS. Metallomics, 2, 147–153.

105www.agilent.com/chem/icpms
Keywordsphytochelatins, arsenic, cadmium, mercury, Ceratophyllum demersum, Zea mays, ESI-qMS, electrospray ionization, ICP-MS, heteronuclear phytochelatins
IntroductionHeavy metals and arsenic can be effectively detoxified in plant cells by complexation with phytochelatins ((γ-Glu-Cys)n-Gly (PCn, n = 2-5)), which are synthesized immediately after exposure to toxic elements. Previous investigations have focused mainly on the response of plants to exposure to a single element. This approach doesn’t reflect real environmental situations where a multicomponent stress is more likely to occur. Therefore, in our investigation, the freshwater plant, coontail (Ceratophyllum demersum) was exposed to three elements, arsenic (As, arsenate), cadmium (Cd) and mercury (Hg), in different combinations: As, Cd and Hg separately; As + Cd, As + Hg and Cd + Hg and finally all elements together. The aim of the study was to investigate whether phytochelatins complex with a single element (mononuclear) or with two or three different central ions (heteronuclear).
ExperimentalInstrumentationTo identify the potential complexes, the analysis was carried out using an HPLC (µLC Agilent 1100) coupled simultaneously to an Agilent 7500ce ICP-MS for element detection and ESI-qMS (Agilent MSD 6130) for molecular ion identification. Operating conditions are given in Table 1.
Multi-Elemental Exposure of Freshwater Plants and Identification of Heteronuclear Phytochelatin Complexes by HPLC Electrospray Ionization (ESI) MS/ICP-MSAngelika Stenzel and Jürgen Mattusch Helmholtz Centre for Environmental Research — UFZ, Department Analytical Chemistry, Permoserstr. 15, 04318 Leipzig, Germany
Table 1. HPLC, ICP-MS and ESI-MS instrument operating conditions
Agilent 1100 HPLC
Column Atlantis dC18, 5 µm, 4,6 × 150 mm, 100 Å Flow rate 1 mL/min Injection volume 8 µL Sample temperature 4 °C Acidic mobile A 0.1% FA + 0.1% MeOH in water phases (pH = 2.7) B 0.1% FA + 20% MeOH in water Neutral mobile A 0.1% NH4COOH + 0.1% MeOH in water phases (pH = 6.9) B 0.1% NH4COOH + 20% MeOH in water Gradient Time [min] % B 0 0 3 0 20 75 30 75 31 0 35 0
Agilent 7500ce ICP-MS
Measuring time 2100 s Dwell time 1 s Isotopes monitored 75As, 114Cd, 202Hg RF power 1500 W Carrier gas flow rate 0.67 L/min Make-up gas flow rate 0.1 L/min Sampling depth 8.5 mm
Agilent 6130 MSD ESI-MS
Mass range 100–1000 m/z Polarity Positive Fragmenter voltage 200 V Threshold 100 m/z Step size 0.2 m/z Gain 2.0

106
ReagentsFormic acid (p.a.*), ammonium formate (p.a.), cadmium nitrate tetrahydrate (p.a.), iron sulfate heptahydrate (p.a.), magnesium sulfate heptahydrate (p.a.), mercury nitrate monohydrate (p.a.) and zinc sulfate heptahydrate (p.a.) were purchased from Fluka Chemie AG (Buchs, Switzerland). EDTA-tetrasodiumsalt dihydrate (p.a.) was from Appli Chem GmbH (Darmstadt, Germany), sodium hydrogen arsenate heptahydrate (98%) from ABCR GmbH & Co. KG (Karlsruhe, Germany) and methanol from Riedel-de Haën AG (Seelze, Germany). All other chemicals were obtained from Merck KGaA (Darmstadt, Germany).
Water used was purified with a Milli-Q system (Millipore GmbH, Schwalbach, Germany).
Plant growth and sample preparationThe plants were cultivated in a pond created in the laboratory (1 L water per 1 g plant material). The pond was lit artificially and flushed with air. For optimal growth, Hoagland’s solution (1 mL per 1 L water) was used. In order to expose the plants to the toxic elements, the plants were separated and placed in smaller vessels and the dissolved metal(loid) salts were added. The other conditions were maintained.
After harvesting, the plants were washed with cold water (1–2 min), followed by washing with cold dipotassium hydrogen phosphate solution (10 mM) for 30 minutes and finally with cold water (1–2 min) to remove adhesive metal ions. After this, the plants were dabbed dry with pulp, quick-frozen using liquid nitrogen and crushed immediately. The resulting samples were weighed. Formic acid and ammonium formate solutions (0.2 M for each), respectively, were added for extraction (90 min; 8 °C). The ratio of extractant to sample was 2 mL per gram. After centrifugation (3 min, 5,000/min) the supernatant was transferred into the vials using a syringe filter (0.45 µm, RC, Sartorius).
Results and DiscussionAll plants were cultivated in solutions containing 25 µM As, 1 µM Cd and 25 µM Hg for one day. After single element exposures, the following complexes were identified:
• As-PC2 (tR = 9.92 min), As-PC3 (tR = 20.83 min) and As-(PC2)2 (tR = 25.67 min) using the acidic extractant and mobile phase
• Cd-GS(tR = 1.78 min), Cd-PC2 (tR = 2.23 min) and Cd-PC3 (tR = 2.59 min) using the neutral extractant and neutral mobile phase
• Hg-GS(tR = 1.61 min), Hg-PC2 (tR = 2.15 min), only free PC3 (tR = 2.78 min) and Hg2-(PC2)2 (tR = 5.12 min) using the acidic extractant and acidic mobile phase
• freeGSH(tR = 1.48 min), free PC2 along with Hg-(GS)2 (tR = 1.97 min), Hg-PC3 (tR = 2.56 min) and free PC5 (tR = 7.60 min) using the neutral extractant and mobile phase.
The combined effects of As, Cd and Hg were also investigated and the following results were obtained:
• NovelbinuclearPC-complexes containing As and Cd could be detected under neutral conditions (Figure 1), which were identified as: As-Cd-PC2 (tR = 1.51 min), As-Cd-PC3 (tR = 1.98 min) and As2-Cd2-PC4 (tR = 2.26 min).
• ExposuretoHgandCdleadstocomparableresultsto the As and Cd findings. Under neutral conditions the following binuclear complexes were identified: Cd-Hg-PC2 (tR = 1.65 min), Cd-Hg-PC3 (tR = 1.97 min) and Cd2-Hg2-PC4 (tR = 2.96 min).
• IntheexperimentsinvolvingexposuretoAsandHg and exposure to all three elements together no heteronuclear complexes could be detected.
Application to maizeMaize (Zea mays) was cultivated on soil contaminated with Cd and As and analyzed using the same methodology. Under neutral conditions, complexes with both elements could be detected (Figure 2): As-Cd-PC2 (tR = 1.51 min), As-Cd2-PC3 (tR = 1.73 min) and As3-Cd-PC4 (tR = 2.32 min). Moreover, single mononuclear complexes were found: Cd-PC2 (tR = 1.51 min) and Cd-PC3 (tR = 1.73 min). This means that terrestrial plants are generally able to form complexes of PCs containing two (perhaps more) metals/metalloids as central ions.
* Pro analysi — (Latin) products with a guarantee certificate suitable for the stated application.

107www.agilent.com/chem/icpms
Figure 1. HPLC chromatograms of coontail extracts with multi-elemental ICP-MS detection (As, Cd). Exposure to As (25 µM) and Cd (1 µM) for one day, neutral extraction solution, neutral mobile phase.
Figure 2. HPLC chromatograms of maize plant extracts with multi-elemental ICP-MS detection (As, Cd). Neutral extraction of plants cultivated on contaminated soil, neutral mobile phase.
10000
15000
20000
25000
30000
35000
40000
45000
[Cd-As3-PC4+3H]3+
447
[Cd2-As-PC3+3H]3+ + [Cd-PC3+3H]3+
357 295
[Cd-As-PC2+2H]2+ + [Cd-PC2+3H]3+
363 218
Time (min)
Inte
nsity
(cps
)
ICP As ICP Cd
0 3 5 8
0
100000
200000
[Cd2-PC4-GS+3H]3+
512
[As2-Cd2-PC4+3H]3+ + [Cd2-PC4+3H]3+
459 409
[As-Cd-PC3+2H]2+ + [As-Glu-Cys+H]+
479 308
[As-Cd-PC2+2H]2+ + [Cd-PC2+3H]3+
363 218
Time (min)
Inte
nsity
(cps
)ICP As ICP Cd
0 3 5 8
ICP-MS AsICP-MS Cd
ICP-MS AsICP-MS Cd

108
ConclusionsThe results obtained by single, dual and multiple exposure of fresh water plants and maize to As, Cd and Hg and the formation and stability of PC-complexes can be summarized as follows:
• As-PCs exist under acidic conditions.
• Cd-PCs exist under neutral conditions.
• Hg-PCs exist under neutral and acidic conditions.
• HeteronuclearPC complexes (PC2, PC3, PC4) containing Cd and As as well as Cd and Hg were detected in coontail extracts employing neutral conditions.
• HeteronuclearPCs with Hg and As as well as with all three metals/metalloids in coontail could not be found.
• Forthefirsttime,heteronuclearcomplexes(PC2, PC3, PC4) with As and Cd were identified under neutral conditions in terrestrial plants maize (Zea mays) cultivated in contaminated soil.

109www.agilent.com/chem/icpms
Keywordssubarachnoid hemorrhage, cerebral vasospasm, cerebral spinal fluid, phosphoprotein, Chip HPLC
IntroductionThe combination of subarachnoid hemorrhage (SAH) with cerebral vasospasm (CV) leads to severe debilitation or death of an estimated one million people worldwide every year. A biomarker that would predict CV after a SAH (CV postSAH) has yet to be found. The focus of this study was to explore protein phosphorylation differences in cerebral spinal fluid (CSF) between CV postSAH patients and SAH non-CV patients. CSF samples from non-diseased patients were used as a control.
ExperimentalAn Agilent 1200 Series capillary LC system was used to separate the phosphoprotein species being investigated in this study. An Agilent Zorbax SB-C18 column (0.5 × 150 mm, 5 µm) was used for the separation under gradient conditions. An Agilent 7500cx ICP-MS was used for element-specific detection of phosphorus. Coupling of the ICP-MS with the LC was accomplished through the use of a PEEK coated silica tubing and a DS-5 capillary nebulizer (Cetac Technologies, Omaha, NE). ICP-MS detection of the only phosphorus isotope (m/z = 31) was carried out using helium as the cell gas at a flow rate of 3.7 mL/min and 2 volts of kinetic energy discrimination (QP bias = 16 V, octopole bias = 18 V).
An Agilent 6300 Series HPLC-Chip/Ion Trap XCT system coupled to a 1200 LC was used for species identification. The sample was loaded on a chip nanocolumn. The chip contained a Zorbax 300SB C18 enrichment column (4 mm × 75 μm, 5 μm) and a Zorbax 300SB C18 analytical column (43 mm × 75 μm, 5 μm).
Results and DiscussionTo prove the efficiency of the capLC-ICP-MS method, a study of the detection limit (LOD) for 31P was performed by analyzing a tryptic digest of bovine ß-casein. Detection limits (3σ, n = 7) based on a 2 µL injection volume were 10 ng/mL.
The chromatograms of the CSF control, CSF CV postSAH and CSF SAH samples show distinct differences (Figure 1). The CSF CV postSAH sample presented a peak at 67.2 min that was not present in the CSF control or in the CSF SAH sample and therefore indicates a difference in phosphorus species. Furthermore, a peak at 74.6 min was present in the CSF control, but not in the CSF samples from patients that have suffered from subarachnoid stroke. Fractions for both peaks were collected offline and analyzed with nanoLC-Chip/ITMS for further identification.
Protein Phosphorylations as Potential Biomarkers in Cerebral Spinal Fluid Karolin K. Kroeninga, Julia Kuhlmanna, Renee Eastera, Joseph F. Clarkb, Gail Pyne-Gaithmanb and Joseph A. Carusoa a. University of Cincinnati/Agilent Technologies Metallomics Center of the Americas, Department of Chemistry, University of Cincinnati, Cincinnati, OH, 45221-0172, USA b. Department of Neurology, University of Cincinnati, Cincinnati, OH, 45267-0536, USA
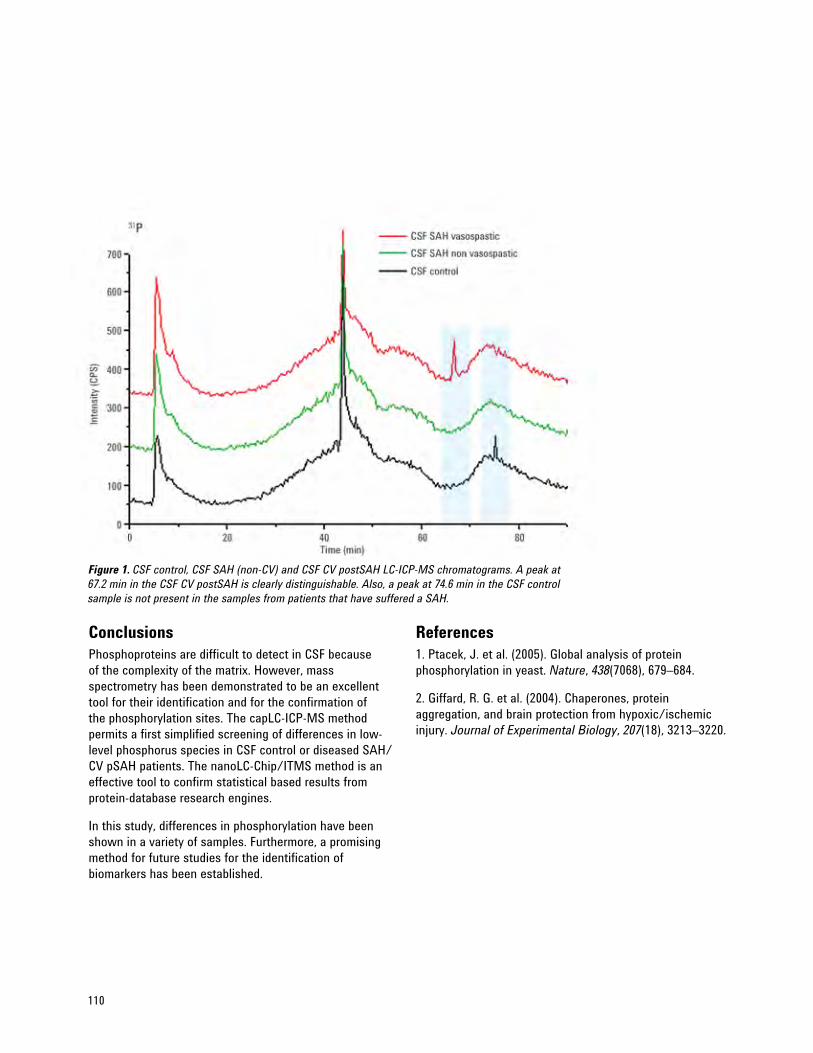
110
References1. Ptacek, J. et al. (2005). Global analysis of protein phosphorylation in yeast. Nature, 438(7068), 679–684.
2. Giffard, R. G. et al. (2004). Chaperones, protein aggregation, and brain protection from hypoxic/ischemic injury. Journal of Experimental Biology, 207(18), 3213–3220.
ConclusionsPhosphoproteins are difficult to detect in CSF because of the complexity of the matrix. However, mass spectrometry has been demonstrated to be an excellent tool for their identification and for the confirmation of the phosphorylation sites. The capLC-ICP-MS method permits a first simplified screening of differences in low-level phosphorus species in CSF control or diseased SAH/CV pSAH patients. The nanoLC-Chip/ITMS method is an effective tool to confirm statistical based results from protein-database research engines.
In this study, differences in phosphorylation have been shown in a variety of samples. Furthermore, a promising method for future studies for the identification of biomarkers has been established.
Figure 1. CSF control, CSF SAH (non-CV) and CSF CV postSAH LC-ICP-MS chromatograms. A peak at 67.2 min in the CSF CV postSAH is clearly distinguishable. Also, a peak at 74.6 min in the CSF control sample is not present in the samples from patients that have suffered a SAH.

Introduction to Field-Flow Fractionation (FFF) ICP-MS 112
Investigation of the Relationship between Salinity and the Adsorption of Different Elements on the 114 Surface of Nanoparticles in Natural Water Samples
Quantitative Characterization of Gold Nanoparticles by Field-Flow Fractionation (FFF) Coupled 117 On-Line with Light Scattering Detection and ICP-MS
Asymmetric Flow Field-Flow Fractionation (AF4) ICP-MS for Speciation of Various Elements in 119 Aggregated Proteins
FFF-ICP-MS
www.agilent.com/chem/icpms

112
Field-flow fractionation (FFF) is a developing on-line fractionation technique that enables the separation of macromolecules, colloids, nano- and microparticles according to size, chemical composition or density with excellent resolution over a size range from a few nanometers up to several microns. Many of the limitations of other separation techniques, including degradation, filtration, decreased resolution or unwanted adsorption, can be overcome by FFF.
The FFF principle was developed by Prof. Calvin Giddings in 1966 [1]. In FFF, separation is performed in an empty channel by application of an external separation field perpendicular to the solvent flow, which leads to an arrangement of the molecules or particles in different flow layers. The parabolic flow profile of the laminar solvent stream has different flow velocities in these solvent layers and, as a result, the analyte molecules or particles are separated.
The FFF technique allows the characterization of a sample without using a stationary phase, which can be a source of bias when using other separation techniques.
Various kinds of fields are available in FFF allowing separation according to different properties (Figure 1):
• InasymmetricflowFFF (AF4), an asymmetric cross-flow field is applied, which leads to separation according to the hydrodynamic volume of the analyte molecules or particles.
• ThermalFFF (TF3) uses a temperature gradient, which enables separation according to chemical composition. The arrangement of the particles or molecules in different flow zones under the influence of a thermal field depends on the Brownian motion (D — diffusion coefficient) and on the thermal diffusion (DT — Soret coefficient). Since DT depends on the sample material and D on the hydrodynamic volume, separation according to size and composition is possible with TF3.
• CentrifugalFFF (CF3) uses a centrifugal field, which is established by rotation of the circular channel. This method is especially suited to particle separation according to differences in density and size.
Size information of the different elution volumes can be obtained by the use of mass or size sensitive detectors, such as light scattering, by calibration of the FFF-channel or by calculation directly from FFF theory.
Since FFF enables the analysis of molar mass or particle size for a wide variety of samples, FFF-ICP-MS coupling is developing towards a key technique that connects both size and structural information in the nanometer and micrometer scale together with elemental composition and concentration data.
Coupling FFF to ICP-MSSince FFF works with a constant outlet flow between 0.1 and 2 mL/min, it can easily be coupled to an ICP-MS system like the Agilent 7500 or 7700 Series via a simple capillary. Additionally, a diode array (DAD) UV detector can be added between the FFF system and the ICP-MS — see Figure 2. The capillary tube should be as small as possible to prevent peak broadening, which could
Figure 1. Schematic showing three different FFF separation principles: asymmetric flow FFF (top); thermal FFF (middle); centrifugal FFF (bottom)
Introduction to Field-Flow Fractionation (FFF)ICP-MSTino Otte Postnova Analytics, Max-Planck-Strasse 14, DE-86899 Landsberg, Germany

113www.agilent.com/chem/icpms
decrease the signal intensity. A split of the flow is not necessary due to the low flow rates in FFF, but it could be used for the introduction of an internal standard or acid for quantification. Standard concentric nebulizers are compatible with FFF-techniques.
Figure 2. Flow schematic of FFF-ICP-MS
Figure 3. Schematic of different concentration techniques in asymmetric flow FFF: focusing (top); slot outlet technology (bottom)
maximizing signal intensity. A further powerful possibility for increasing the concentration during an analysis is slot outlet technology. In this technique the upper solvent layer of the channel, which does not contain analyte molecules or particles, is removed. This increases the concentration of a sample at the channel-outlet dramatically.
Applications of FFF-ICP-MSThe first applications of FFF-ICP-MS included environmental studies of aquatic colloids and their chemical composition as a function of size [2]. In mineralogy, FFF-ICP-MS was first used for the analysis of soil colloids or river sediments [3]. The content of different elements like Al, Fe, Mg or Si was detected as a function of particle size. In 1999, Hasselöv et. al. proposed the coupling of flow-FFF and ICP-MS for monitoring 28 elements in freshwater colloids [4]. In addition to environmental and geological science, various other application fields for FFF-ICP-MS have rapidly developed in the last few years. Examples of the practical use of the method can be found in sectors like agricultural and food science, biological and pharmaceutical research as well as in industrial development of polymers or nanoparticles. Some additional examples of the successful use of FFF-ICP-MS include the analysis of protein-metal complexes, the determination of the uranium content in bacteria cells or the investigation of the impact of new nanoparticles on health and the environment.
ConclusionsAlthough FFF-ICP-MS has been used in a wide range of applications to date, it remains a relatively unknown and under used hyphenation technique. It is however a powerful technique that can provide an excellent tool for research activities in the future.
Additional Information More information on FFF is available at: www.field-flow-fractionation.com
References1. Giddings, J. C. (1966). Separation Sci., 1, 123–125.
2. Beckett, R., Hotchin, D. M. & Hart, B. T. (1990). J. Chromatogr. A., 517, 435–447.
3. Chittleborough, J. D., Hotchin, M. D. & Beckett, R. (1992). Anal. Chem. 64(18), 2036–2041.
4. Hasselöv, M., Lyven, B., Haraldson, C. & Sirinawin, W. (1999). Anal. Chem., 71(16), 3497–3502.
FFF systemFFF system UV detectorUV detector ICP-MS
Sample FocusingFlow In Focus Flow Flow Out
Membrane
Parabolic Flow Profile
Cross Flow Out
AF4 focus technology uses a second inlet stream, which acts as a counter current to the injection flow. As a result, the sample will be focused in a narrow zone at the beginning of the channel. This can concentrate even highly dilute solutions, since the duration of the focus step is not restricted. In addition, the technique avoids most of the peak broadening caused by longitudinal diffusion of the sample molecules in the FFF channel. A second tool for optimization of the peak height is the step-less adjustable separation field in all FFF techniques, which selectively allows a sensitive regulation of the fractionation power. Thus, the relationship between peak height and size separation can be optimized with regard to
One challenge in coupling ICP-MS with on-line separation techniques is the dilution of the narrow dispersed fractions. In addition, many samples often contain very low amounts of the analyte. Often preconcentration of the sample prior to injection into the separation system is necessary. This is not the case for asymmetric flow FFF (AF4) because of the variety of sample concentration possibilities that can be applied on-line before and during the separation of the samples (Figure 3).

114
Keywordsnanoparticles, environment, river water, field-flow fractionation, FFF, asymmetric field-flow fractionation, AF4, ICP-MS, fractogram
IntroductionNanotechnology has developed into an important topic across many areas of science. Knowledge of the particle size and shape of a nanomaterial is essential for its application as well as for investigation of its behavior in the environment [1–3]. In addition, the speciation and quantification of specific elements per size distribution is very important. Because many metals that show bioactivity are adsorbed on the surface of nanospecies or complex with organic molecules, this information provides an understanding of the various environmental processes in play [4]. Moreover, it is vital to analyze synthetic nanoparticles present in the environment as recent studies have raised concerns about their toxicity [5–6].
Field-flow fractionation (FFF) is a very powerful technique that can be used for the separation of environmental or synthetic particles across a very broad size range in various sample types.
ExperimentalA Postnova AF2000 MT asymmetric field-flow fractionation (AF4) system was coupled simultaneously to an Agilent 1260 diode array detector (DAD) UV detector, operating at 280 nm, for particle detection, and to an Agilent 7700x ICP-MS for element specific information.
Investigation of the Relationship between Salinity and the Adsorption of Different Elements on the Surface of Nanoparticles in Natural Water Samples T. Otte, E. Moldenhauer and T. Klein, Postnova Analytics, Max-Planck-Strasse 14, DE-86899 Landsberg, Germany N. Fellner, R. Wahlen and U. Nötzel, Agilent Technologies, Waldbronn, Germany H. C. Teien, Norwegian University of Life Sciences, Aas, Norway
Table 1. AF4 and ICP-MS instrument operating conditions
Agilent 7700x ICP-MS
Nebulizer MicroMist RF power 1550 W Sampling depth 8.0 mm Carrier gas flow rate 0.70 L/min Dilution gas flow rate 0.35 L/min He cell gas flow rate 4 mL/min Elements acquired Pb and Mg in no gas mode Elements acquired Si, Al, S, Fe and Zn in He mode
Postnova AF2000 MT AF4
Flow rate 0.5 mL/min Injection volume 1000 µL Sample concentration Not known, natural water samples, no treatment Buffer/Eluent H2O + 0.9% ammonium acetate Channel Metal-free, 330 × 60 mm outside; 276 × 20 mm inside Spacer thickness 350 µm Detector flow rate 0.5 mL/min Focus time 15 min Focus flow rate during 3.3 mL/min injection-focusing step Carrier flow rate during 0.2 mL/min injection-focusing step Transition time 0.5 min focus-elution Cross flow 3 mL/min linear decay in 20 min
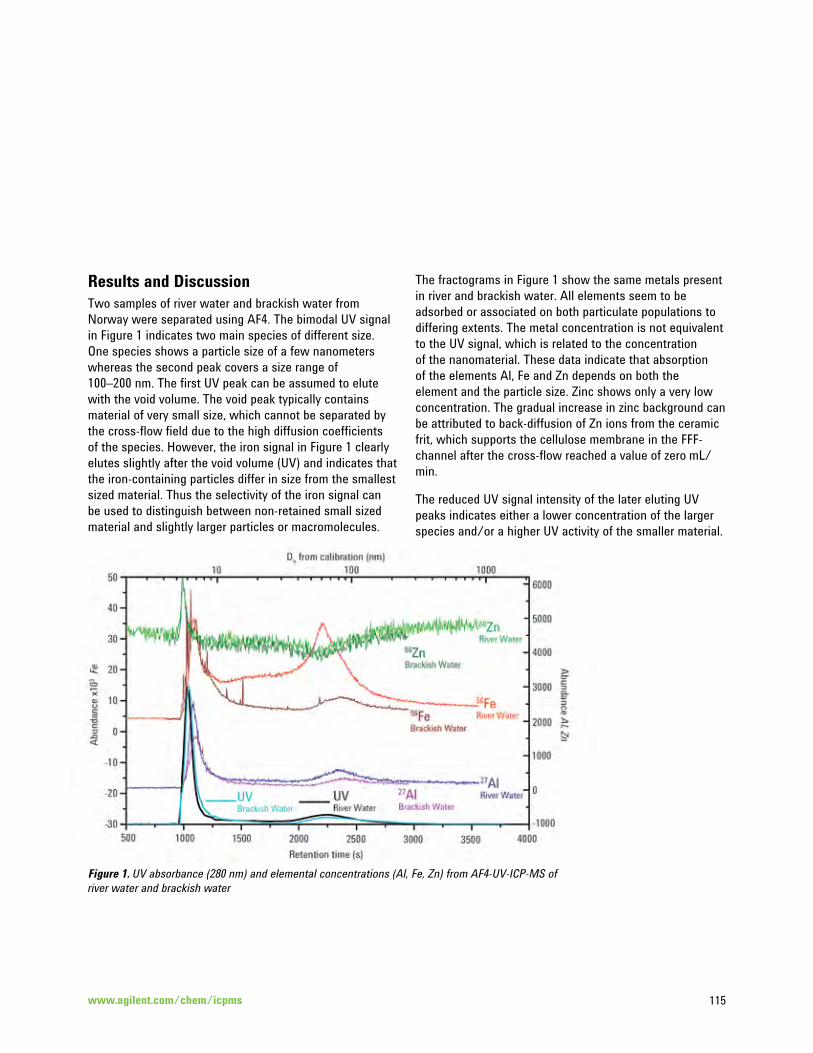
115www.agilent.com/chem/icpms
Results and DiscussionTwo samples of river water and brackish water from Norway were separated using AF4. The bimodal UV signal in Figure 1 indicates two main species of different size. One species shows a particle size of a few nanometers whereas the second peak covers a size range of 100–200 nm. The first UV peak can be assumed to elute with the void volume. The void peak typically contains material of very small size, which cannot be separated by the cross-flow field due to the high diffusion coefficients of the species. However, the iron signal in Figure 1 clearly elutes slightly after the void volume (UV) and indicates that the iron-containing particles differ in size from the smallest sized material. Thus the selectivity of the iron signal can be used to distinguish between non-retained small sized material and slightly larger particles or macromolecules.
The fractograms in Figure 1 show the same metals present in river and brackish water. All elements seem to be adsorbed or associated on both particulate populations to differing extents. The metal concentration is not equivalent to the UV signal, which is related to the concentration of the nanomaterial. These data indicate that absorption of the elements Al, Fe and Zn depends on both the element and the particle size. Zinc shows only a very low concentration. The gradual increase in zinc background can be attributed to back-diffusion of Zn ions from the ceramic frit, which supports the cellulose membrane in the FFF-channel after the cross-flow reached a value of zero mL/min.
The reduced UV signal intensity of the later eluting UV peaks indicates either a lower concentration of the larger species and/or a higher UV activity of the smaller material.
Figure 1. UV absorbance (280 nm) and elemental concentrations (Al, Fe, Zn) from AF4-UV-ICP-MS of river water and brackish water

116
In both water samples, Fe and Al are the ions of the highest interest. Al is reportedly toxic for salmon, depending on the form of the Al ions. Cationic Al hydroxides are reported to be more toxic than anionic ones [7]. As a result, the solubility and toxicity of aluminum is expected to vary with the difference in pH and salinity between riverine and brackish water samples. The traces of Al, Fe and Zn from river and brackish water were overlaid in Figure 1 in order to show the differences between both samples.
The concentration and size of the particles in both samples is nearly the same as indicated by the UV signals. The particle size distribution seems to be independent of salinity. Figure 1 also shows that the Zn content is also the same and that most of the Zn is eluting with the void volume in association with the lowest sized material.
In contrast, there are significant differences in the concentrations of Al and Fe, which can be a result of the varying salinity. The river water shows a higher content of both elements adsorbed on the colloid particles. The Fe signal intensity is preferably increased at the upper size fractions of the river water. However, the Al concentration is lower over the whole size range in brackish water than in river water.
The change of the metal concentration with salinity supports the hypothesis that the predominant particulate material is not Fe or Al as in case of hematite particles (Fe2O3) but rather, the metal ions are associated with the particle surface. If the adsorption tendency changes, the content of dissolved Al will vary accordingly. This is a possible explanation for the localized, limited appearance of dead salmon in Norway. The different salinity and particle content could influence the concentration of dissolved Al ions, which may reach a toxic level under certain conditions.
ConclusionsThe influence of different salinities on the adsorption behavior of metals on the surface of colloidal particles was shown using the example of trace elements in natural waters. Different size fractions were shown to be selectively associated with different metals.
AF4-UV-ICP-MS can provide information about environmental systems in multiple dimensions such as the related migration processes as well as the biological impact of colloidal toxins. The easy injection of untreated environmental samples in the AF4-ICP-MS demonstrated the robustness of this kind of hyphenation. The integration of AF4 and ICP-MS provides great flexibility in the separation and characterization of small particles and macromolecules according to size and other parameters.
References1. Beckett, R. & Hart, B. T. (ed.) (1986). The role of particulate matter in the transport and fate of pollutants. Water Studies Centre, Chisholm Institute of Technology, Melbourne, Australia.
2. Stumm, W. & Wiley (ed.) (1992). Chemistry of the Solid-Water Interface. New York.
3. Stolpe, B., Guo, L., Shiller, A. M. & Hassellöv, M. (2010). Mar. Chem., 118, 119–128.
4. Waddell, R., Lewis, C., Hang, W., Hassell, C. & Majidi, V. (2005). Spectros. Rev., 40, 33–69.
5. Hussain, S. M., Hess, K. L., Gearhart, J. M., Geiss, K. T. & Schlager, J. J. (2005). Tox. in Vitro, 19, 975–983.
6. Kim, Y.-J., Yang, S. I. & Ryu, J.-C. (2010). Mol. Cell Tox., 6, 119–125.
7. Poléo, A. B. S. & Hytterød, S. (2003). J. Inorg. Biochem., 97, 89–96.

117www.agilent.com/chem/icpms
Keywordsnanoparticles, NPs, gold, polystyrene, PS, bioactive, field-flow fractionation, FFF, asymmetric field-flow fractionation, AF4, multi-angle light scattering, MALS, dynamic light scattering, DLS, ICP-MS
IntroductionSince gold (Au) nanoparticles (NPs) can be successfully stabilized in suspension and have a reactive surface and unique optical properties, their applications within biology and medicine as carriers of bioactive molecules are of great interest. However, most techniques used for detection of Au NPs in biological matrices give qualitative information only. In this work, an analytical platform coupling asymmetric flow field-flow fractionation (AF4) with multi-angle light scattering (MALS), dynamic light scattering (DLS) and ICP-MS was established and used for separation, size determination and quantitative analysis of Au NPs in aqueous suspension.
ExperimentalAn Agilent 1200 Series autosampler and high performance liquid chromatography (HPLC) pump (Agilent Technologies, Santa Clara, CA, USA) were used to inject NP working suspensions and to deliver the carrier flow, respectively. An AF4 Eclipse 3 (Wyatt Technology Corporation, Santa Barbara, CA, USA) instrument was used to regulate the cross-flow and detector flow of the carrier liquid delivered by the Agilent HPLC pump in the AF4 separation channel. The optimized AF4 settings and flows used for the separation of Au or polystyrene NPs are detailed in Table 1. The AF4 channel was connected to a light scattering detector (17-channel MALS) operated with a laser at 658 nm and equipped with a one-channel DLS. The MALS detector was set to a time sampling interval of 1 s per data point, and the DLS detector was set to a time sampling interval of 2 s per data point. Data from the light scattering detectors were processed using the ASTRA V software (Wyatt Technology Corporation). The Agilent 7500ce ICP-MS instrument was used for all ICP-MS analyses. The
instrument was run with an RF power of 1550 W and tuned for optimum sensitivity and low oxide ratio according to the manufacturer’s instructions. The ICP-MS was run in time-resolved acquisition mode (300 ms integration time per point with 1 repetition). Mixtures of three polystyrene NPs between 20 nm and 100 nm in diameter and mixtures of three gold NPs between 10 nm and 60 nm in diameter were separated by AF4. Furthermore, a 30 nm certified Au NP was also analyzed. The geometric diameters of the separated polystyrene NPs and the hydrodynamic
Quantitative Characterization of Gold Nanoparticles by Field-Flow Fractionation (FFF) Coupled On-Line with Light Scattering Detection and ICP-MSBjørn Schmidt, Katrin Loeschner, Jens J. Sloth, and Erik H. Larsen National Food Institute, Technical University of Denmark, Mørkhøj Bygade 19, DK-2860 Søborg, Denmark
Table 1. AF4 instrument operating conditions, including fractionation program
Wyatt Technologies Eclipse 3 AF4
Channel length 154 mm Spacer height 350 μm Membrane type Polyethersulfone 10 kDa MWCO Carrier liquid 0.05% SDS, 3% MeOH, and 20 μg Rh/L composition in Milli-Q water Elution flow rate 0.5 mL/min Cross flow rate 1 mL/min Focus flow rate 2 mL/min Injection flow rate 0.2 mL/min Make-up liquid 3% MeOH and 2% HNO3 in Milli-Q water composition Make-up liquid flow 0.5 mL/min rate Step 1: Elution 0–1 min with cross-flow Step 2: Focus flow 1–3 min Step 3: Injection 3–9 min with focus flow Step 4: Focus flow 9–10 min Step 5: Elution 10–60 min with cross-flow Step 6: Elution 60–70 min without cross-flow

118
diameters of the Au and polystyrene NPs were determined on-line by MALS and DLS, respectively. The three separated Au NPs and the 30 nm Au NP (Figure 1) were quantified by ICP-MS and recovered at 50 to 95% of the injected masses, which ranged between approximately 8 ng to 80 ng of each nanoparticle size. Au NPs adhering to the membrane in the separation channel was found to be a major cause for incomplete recoveries. The lower limit of detection ranged between 0.02 ng and 0.4 ng Au, depending on nanoparticle diameter.
ConclusionsA hyphenated instrumental platform consisting of AF4 with MALS and DLS detection coupled to ICP-MS was established and successfully used for separation and quantitative characterization of polystyrene and Au NPs. The determined size of the separated NPs, which was based on on-line DLS and MALS measurements, gave
Figure 1. AF4-DLS-ICP-MS fractogram of a mixture of 10, 20 and 60 nm Au nanoparticles (ICP-MS trace in line). Dots are the calculated hydrodynamic diameter from the DLS measurement (right Y-axis). The 30 nm Au NP fractogram is overlaid.
values in accordance with stated or certified values. Quantification of the separated Au NPs by the ICP-MS corresponded to mean recoveries of 50%, 95%, and 67% for the 10, 20, and 60 nm Au NPs, respectively. The incomplete recoveries were partially caused by adhesion of Au NPs to instrument surfaces and not by agglomeration. Detection limits for Au NPs analyzed by the hyphenated platform were at the sub nanogram level.
Reference1. Schmidt, B., Loeschner, K., Hadrup, N., Mortensen, A., Sloth, J. J., Koch, C. B. & Larsen, E. (2011). Quantitative characterization of gold nanoparticles by field-flow fractionation coupled on-line with light scattering detection and inductively coupled plasma mass spectrometry. Anal. Chem., 83, 2461–2468.
0
0.2
0.4
0.6
0.8
1
1.2
1.4
1.6
1.8
2
10 15 20 25 30 35 40 45Retention time (min)
Au/R
h - R
atio
0
10
20
30
40
50
60
70
80
90
100Hydrodynam
ic diameter (nm
)
10 nm Au NPs
30 nm Au NPs
20 nm Au NPs
60 nm Au NPs

119www.agilent.com/chem/icpms
Keywordsnanoparticles, NPs, aggregates, bovine serum albumin, BSA, phosphorus, copper, zinc, sulfur, field-flow fractionation, FFF, asymmetric field-flow fractionation, AF4, ICP-MS
IntroductionIn an attempt to distinguish between a single protein and its aggregates, a bovine serum albumin (BSA) sample was separated using asymmetric flow field-flow fractionation (AF4). In AF4, sample separation is achieved by applying a cross-flow field, that is, a flow perpendicular to the carrier flow. A semipermeable membrane holds back the analyte particles allowing the cross-flow to leave the channel. In this study, the outlet of the AF4-channel was first connected to a UV detector and then to an ICP-MS for elemental analysis of 31P, 34S, 63Cu and 66Zn. The element distribution across the size range of the BSA sample and its different aggregates was determined.
ExperimentalA Postnova AF2000 AT System was coupled using a simple PEEK capillary to an Agilent 1260 diode array detector (DAD) operating at 280 nm followed by an Agilent 7700x ICP-MS. Operating conditions are given in Table 1.
Results and Discussion A frequently analyzed BSA standard with monomers, dimers and trimers of known size was used to show the capability of AF4-ICP-MS for the study of metal adsorption to biological materials under well-defined conditions. Figure 1 shows the different element signals from the UV DAD and ICP-MS plotted against the elution volume. Runs were performed in normal helium mode (Figure 1, top) and high energy helium mode (Figure 1, bottom). High energy helium mode [1] is an operating mode available to ORS3 systems (7700 Series only) where the ORS3 cell is operated at a higher helium flow and with a higher bias voltage. This mode efficiently removes the most challenging polyatomic species and improves the measurement of elements such as Se, S and P.
Asymmetric Flow Field-Flow Fractionation (AF4) ICP-MS for Speciation of Various Elements in Aggregated ProteinsT. Otte, E. Moldenhauer and T. Klein, Postnova Analytics, Max-Planck-Strasse 14, DE-86899 Landsberg, Germany N. Fellner, R. Wahlen and U. Nötzel, Agilent Technologies, Waldbronn, Germany H. Goenaga Infante, V. Nischwitz, LGC, Queens Road, Teddington, Middlesex, TW11 OLY, UK
Table 1. AF4 and ICP-MS instrument operating conditions
Agilent 7700x ICP-MS
RF power 1550 W Sampling depth 8.0 mm Carrier gas flow rate 0.70 L/min Dilution gas flow rate 0.35 L/min Helium cell gas flow rate 4 mL/min Helium cell gas flow rate 10 mL/min (high energy helium mode) Nebulizer MicroMist
Postnova Analytics AF2000 MT AF4
Flow rate 0.5 mL/min Injection volume 16.9 µL Sample concentration 2 mg/mL Buffer/eluent H2O + 0.9% ammonium acetate Channel Metal-free, 330 × 60 mm outside; 276 × 20 mm inside Spacer thickness 350 µm Detector flow rate 0.5 mL/min Focus time 4 min Focus flow rate during 4.3 mL/min injection-focusing step Carrier flow rate during 0.2 mL/min injection-focusing step Transition time 1 min focus-elution Cross flow 4 mL/min constant for 30 min; linear decay in 5 min

120
Figure 1, top, shows that it is possible to separate the BSA into its components beginning with the monomer that shows the highest diffusion and the lowest hydrodynamic diameter. Size information can be calculated from the elution times using FFF-equations or by calibration of the FFF-channel with narrow dispersed standards. An alternative is the direct detection of the molar mass or radius by using a technique such as light scattering.
There are significant amounts of phosphorus, copper, zinc and sulfur adsorbed in the different BSA species. All elements except phosphorus were identified within the BSA components. The UV signal is directly related to the concentration of the protein while the intensity of the element traces depends on the sorption tendency of the different aggregates. The high sensitivity of the ICP-MS makes it possible to clearly distinguish between
Figure 1. Fractogram of a BSA protein standard separated using AF4-UV-ICP-MS. Abundance of various elements across the size range is given by the AF4 retention time. Top: Helium mode, size calculated from FFF-theory. Bottom: High energy helium mode.

121www.agilent.com/chem/icpms
monomers, dimers, trimers and higher aggregates. Figure 1, bottom, shows the impact of using optimized ICP-MS conditions for sulfur. There is a visible improvement in the signal-to-noise ratio of the signal with high energy helium collision conditions.
The copper signal in Figure 1, bottom, shows an increased intensity of the dimer and trimer peak compared with the corresponding UV-signals. This indicates that there is significantly more copper adsorbed inside the dimer and trimer fractions of the BSA than in the monomer. It is known that specific metal-protein interactions exist for BSA and copper [2]. A possible explanation for the observed results could be that the aggregated BSA offers better possibilities for complexation of copper than the monomer, or the copper even supports the aggregation process itself. As a consequence of the selective copper adsorption, the trimer is more visible in the ICP-MS trace than in the UV trace, as are the higher aggregates with retention times between approximately 850 to 1000 s.
The UV signal in the fractograms shown in Figure 1 was scaled to the same range as the most intensive monomer signal of the detected element from ICP-MS with the aim to compare the relationship between protein and element concentration. While the UV signal is directly related to the concentration, the element concentration is related to the amount of the isotope that is associated or adsorbed to the protein.
Figure 2. Overlay of the ICP-MS signals for 34S before and after optimization of the helium flow with UV signal (concentration) from AF4-UV-ICP-MS
It is very difficult to detect sulfur with ICP-MS in ultra low concentrations due to interference from O2
+ and NO+ [3]. However the effectiveness of high energy helium mode for S detection is demonstrated in Figure 2. ICP-MS signals for 34S are shown at the lower (typical) helium flow rate of 4 mL/min (blue trace) and at the high energy helium mode flow rate of 10 mL/min (red trace). The overlay of UV and element trace indicates that no size-specific sulfur adsorption is existent for the BSA. The increased helium flow rate leads to impressive signal amplification and, as a result, even the dimer peak at a retention time of approximately 800 s is clearly visible by ICP-MS.
The comparison of UV and element signal indicates that the amount of sulfur in the different BSA-species is equal to the detected concentration. No selective adsorption/association tendency was found for sulfur or zinc, unlike copper (Figure 1).
400 600 800 10001000
1500
2000
2500
3000
3500
4000
4500
0.05
0.06
0.07
0.08
Abun
danc
e
Retention time (s)
34S - High He mode34S - Low He mode
UV
UV signal

122
ConclusionsFFF-ICP-MS hyphenation is a powerful tool for the investigation of biological samples. FFF delivers excellent size separation over a broad range while the ICP-MS provides element speciation, quantification and the isotopic ratio data. High energy helium mode further improves ICP-MS sensitivity for this application. The findings can be used to better understand biological structures and their interaction with metals.
References1. Enhanced Helium Mode Cell Performance. (2011, February). Agilent publication number 5990-7573EN.
2. Pinto, E. M., Soares, D. M. & Brett, C. M. A. (2008). Electrochim. Acta., 53, 7460–7466.
3. Mason, P. R. D., Kaspers, K. & Van Bergen, M. J. (1999). J. Anal. Atom. Spectrom., 14, 1067–1074.

Introduction to ‘Other’ Speciation Techniques 124
Absolute Quantification of a Metalloprotein using Species-Specific Isotope Dilution Methodology 125 and Gel Electrophoresis (GE) Laser Ablation (LA) ICP-MS
Contribution of Capillary Electrophoresis (CE) ICP-MS to Metalloprotein Analysis 127
Determination of Roxarsone and its Transformation Products using Capillary Electrophoresis (CE) 129 Coupled to ICP-MS
OTHER SPECIATION TECHNIQUES
www.agilent.com/chem/icpms

124
This final chapter includes less common or newly emerging speciation techniques, which nonetheless serve to answer questions that the other techniques cannot. Mainly, these are electrophoretic techniques coupled to ICP-MS. In the simplest form, electrophoretic techniques result in the separation of the species of interest in space rather than time. A common technique used for the separation of biomacromolecules including peptides, proteins, and nucleotides is gel electrophoresis (GE), using gels made from agarose or polyacrylamide. In gel electrophoresis, a solution containing a mixture of analytes is applied to one end of a gel, either in a rectangular slab as in slab gel electrophoresis, or a gel filled capillary as in capillary gel electrophoresis.
Capillary electrophoresis (CE) is a related technique in which the capillary is filled with conductive liquid buffer rather than a gel. After application of the sample, subsequent application of a high voltage across the length of the gel or capillary causes migration of the analytes along the length parallel to the applied voltage. Their rate (and direction) of migration depends on a variety of factors such as their overall charge and three-dimensional structure as well as the pH of the buffer and characteristics of the gel. In capillary (gel) electrophoresis, the analytes are detected as they elute from the end of the capillary, much like chromatographic techniques. In slab gel electrophoresis, the voltage is removed before all the analytes have reached the other end of the slab, resulting in a spatial separation along the length of the slab. Slab gel electrophoresis can be performed in one or two dimensions depending on the complexity of the sample mixture. The gel can then be stained to reveal the presence of the separated components. Alternatively, radio labeled components can be detected by photographic techniques.
More recently, the gel can be scanned by a laser ablation device connected to an ICP-MS. As the laser moves across the gel, the components are vaporized and transported in a flowing gas stream to the ICP-MS for detection. Like any separation technique, care must be taken to ensure that the separation technique does not change the nature of the analytes. For example, many metalloproteins contain metals that are solvent-exposed and are thus easily stripped away by the high voltage applied across the length of the gel.
Introduction to ‘Other’ Speciation Techniques

125www.agilent.com/chem/icpms
Keywordsmetalloprotein, metalloenzyme, superoxide dismutase, SOD, copper, zinc, isotopically enriched, gel electrophoresis, GE, laser ablation, LA, ICP-MS, LA-ICP-MS
IntroductionIt has been suggested that metalloproteins can be separated using gel electrophoresis (GE), using sodium dodecyl sulfate (SDS), and detected via a metal label using off-line laser ablation (LA-) ICP-MS. The problem however is the loss of the metal label during separation, staining, drying or blotting, and matrix dependent behavior in the gel both in the direction of and orthogonal to the migration lane. Consequently quantification against a standard is not straightforward.
A metalloenzyme such as superoxide dismutase (SOD) contains two copper and two zinc atoms, which can be replaced easily by isotopically enriched metals. An enzyme activity assay has shown that isotopically enriched copper and zinc bind at the correct side to the same motif, so that an isotopically labeled standard should behave in the same way as the analyte [1].
ExperimentalA controlled drying process was applied to non-denaturing gels using glycine without staining (Precast Novex 4–20% Tris-Glycine Gels (Invitrogen), Novex Tris-Glycine Native 2X Sample Buffer 1:1 to the different samples). A volume of 20 µL of the prepared sample was loaded into an XCell Surelock Mini-cell electrophoresis system and a tris glycine running buffer was used. Run conditions were 125 V for 130 min or until the bromophenol blue dye had reached the bottom of the gel described previously [2]. For the LA-ICP-MS measurements, the microscope slides were transferred into the ablation chamber and then measured using an UP213 (New Wave) laser ablation connected to an ICP-MS. Staining was carried out only after laser ablation. The UP213 was coupled directly to the torch of the Agilent 7500c ICP-MS using a fluence of 3.5 J/cm2, a scan rate of 25 μm/s, 250 μm spot size and repetition rate of 20 Hz. Argon was used as the carrier gas in both systems to transport the ablated material to the torch of the ICP-MS. Laser ablation of the gel lanes was performed using single line scans. Each lane was ablated three to four times.
The ICP-MS signal was first optimized (torch position, electrostatic lenses, and so forth) under wet plasma conditions for stability and maximum counts for copper and zinc using a standard solution containing copper and zinc at 10 μg/L. The laser ablation system was then configured and further optimization was carried out under dry plasma conditions. The carrier gas was optimized by monitoring the signal intensity from single line scans of an element-doped gel. The following isotopes were measured: 63Cu, 65Cu, 64Zn, 66Zn, 67Zn, 68Zn and 13C (as internal standard) with 100 ms dwell time (Figure 1).
Absolute Quantification of a Metalloprotein using Species-Specific Isotope Dilution Methodology and Gel Electrophoresis (GE) Laser Ablation (LA) ICP-MSJörg Feldmann, Eva M. Krupp, Andrea Raab, Sandra Brauckmann and Christian Deitrich TESLA (Trace Element Speciation Laboratory), University of Aberdeen, Meston Walk, AB24 3UE, Scotland, UK

126
Figure 1. GE-LA-ICP-MS using off-line non-denaturing GE followed by LA-ICP-MS scanning of the gel: lines Cu and Zn response and ratios obtained from 23 μg natural and 22 μg 65Cu, 68Zn enriched SOD; 68Zn (top), 65Cu (second top), 63Cu (second bottom), 64Zn (bottom); 65Cu/63Cu (light gray) and 68Zn/64Zn (dark gray)
The stability of the metal-protein complex under non-denaturing conditions during one-dimensional polyacrylamide gel electrophoresis (1-D PAGE) was confirmed and the performance of the method evaluated. SOD was quantified between 4 and 64 μg with a recovery rate between 82 and 110% in a standard. Detection limits may be submicrogram SOD level. By using an isotopically enriched, species-specific metalloprotein standard, migration, loss of metal during sample/gel preparation, and species transformation are effectively cancelled out by the calibration.
ConclusionsThe work discussed here represents, for the first time, the initial development of a complete method for the determination and quantification of superoxide dismutase directly.
References 1. Deitrich, C. L., Raab, A., Pioselli, B., Thomas-Oates, J. E. & Feldmann, J. (2007). Analytical Chemistry, 79, 8381–8390.
2. Raab, A., Pioselli, B., Munro, C., Thomas-Oates, J. & Feldmann, J. (2009). Electrophoresis, 30, 303–314.
3. Deitrich, C. L., Braukmann, S., Raab, A., Munro, C., Pioselli, B., Krupp, E. M., Thomas-Oates, J. E. & Feldmann, J. (2010). Analytical and Bioanalytical Chemistry, 397, 3515–3524.
The paper has been published previously [3].
10 15 20 25 30 35
-0.005
0.000
0.005
0.010
0.015
0.020
0.025
0.030
-2
0
2
4
6
8
Sign
al in
tens
ity re
lativ
e to
13C
Migration distance (mm)
Ratio

127www.agilent.com/chem/icpms
Keywordsproteins, DNA, biological, CE, capillary electrophoresis, metalloprotein, sulfur, sulphur
IntroductionIn recent years, metal speciation has found widespread acceptance in the field of biological compounds analysis. Indeed, many proteins contain metal ions either within their own structures or bound to some of their active sites. The toxicological effects of many metals can be related to their ability to interfere with the functions of essential biological molecules, for example proteins and DNA. For proteins, these functions are amazingly diversified: structural role, transport through the cells, catalysis and so forth. The determination of metallic species in biological systems, particularly metalloproteins and proteins possessing an affinity for metals, is therefore of fundamental importance. Hyphenated capillary electrophoresis (CE) ICP-MS is presented as an alternative analytical tool for this purpose since it combines high separation efficiency and sensitivity, and is appropriate for the analysis of small sample volumes.
ExperimentalSamples and reagentsCarbonic anhydrase from bovine erythrocytes, bovine serum albumin and phosvitin from egg yolk were all purchased from Sigma. The separation buffer and the sheath liquid (12.5 mM) were prepared by dissolving Na2B4O7.10H2O (Merck) in ultra-pure water.
Instrumentation and methodSeparations were carried out using an untreated fused silica capillary (75 µm id × 80 cm) fitted to a Beckman P/ACE MDQ instrument. Prior to the first use, the capillary was flushed with methanol, NaOH (0.1 M) and water for 10 min at 20 psi. Between runs, the capillary was washed with the electrolyte buffer for 5 min at 5 psi. Samples were hydrodynamically injected (around 50 nL) and separated under 25 kV at 20 °C using a 12.5 mM sodium borate buffer pH 9.2. An Agilent 7700 ICP-MS equipped with a DS-5 microflow nebulizer (CETAC) was used for the detection of 31P, 63Cu, 65Cu, 64Zn, 66Zn and 34S. Instrumental operating conditions are summarized in Table 1.
Contribution of Capillary Electrophoresis (CE) ICP-MS to Metalloprotein AnalysisAgnès Hagege1,2 1. SBTN, CEA Marcoule, 30207 Bagnols-sur-Cèze, France 2. Laboratoire des Interactions Protéine-Métal, UMR 6191, 13108 Saint Paul Lez Durance, France
Table 1. ICP-MS instrument operating conditions
Agilent 7700 ICP-MS
Isotopes monitored 31P, 63Cu, 65Cu, 64Zn, 66Zn, 34S RF power 1450 W Sampling depth 6 mm Carrier gas flow rate 0.9 L/min ORS mode He 4.5 mL/min He 8.5 mL/min Deflect = 0 Deflect = -65 V Plate bias = -60 V Plate bias = -150 V QP bias = -15 V QP bias = -96 V OP bias = -18 V OP bias = -100 V
The hyphenation between the capillary electrophoresis and ICP-MS was made through a micro-cross piece (Figure 1). The electrical connection was achieved using a ground electrode positioned in one of its inlets. The sheath liquid was introduced at 3 µL/min flow rate, using a syringe infusion pump connected to another inlet on the micro-cross.
Figure 1. Schematic of the CE-ICP-MS interface
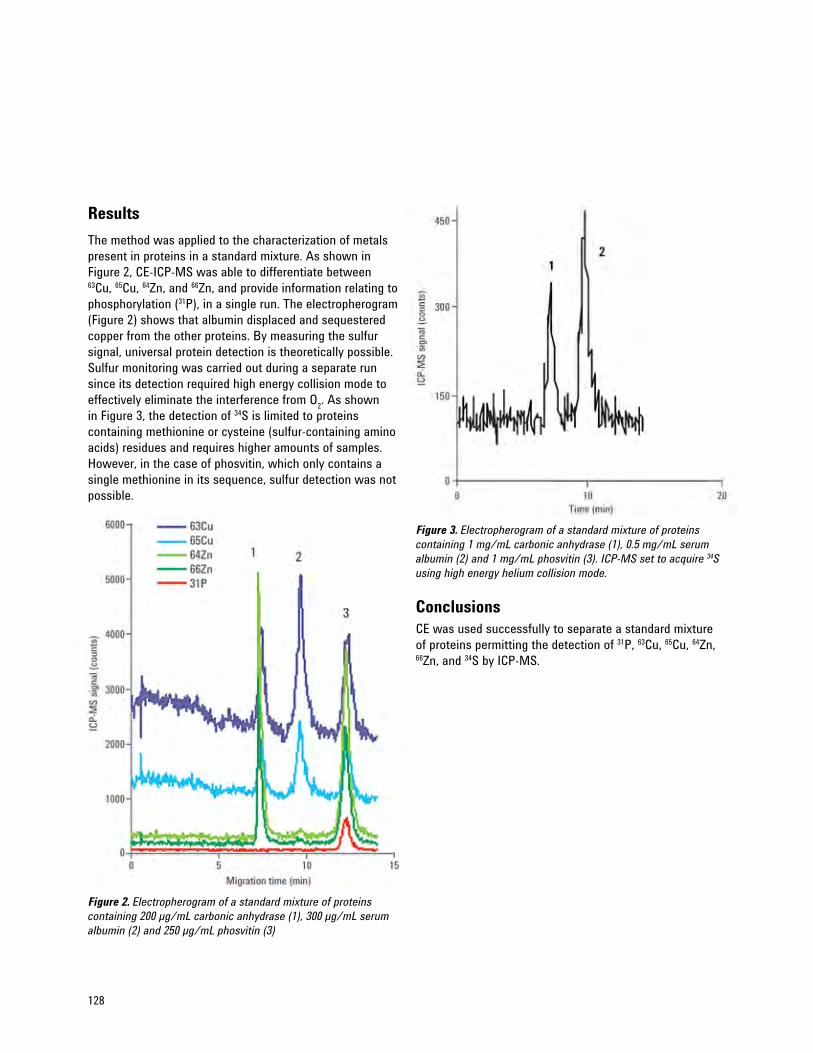
128
ResultsThe method was applied to the characterization of metals present in proteins in a standard mixture. As shown in Figure 2, CE-ICP-MS was able to differentiate between 63Cu, 65Cu, 64Zn, and 66Zn, and provide information relating to phosphorylation (31P), in a single run. The electropherogram (Figure 2) shows that albumin displaced and sequestered copper from the other proteins. By measuring the sulfur signal, universal protein detection is theoretically possible. Sulfur monitoring was carried out during a separate run since its detection required high energy collision mode to effectively eliminate the interference from O2. As shown in Figure 3, the detection of 34S is limited to proteins containing methionine or cysteine (sulfur-containing amino acids) residues and requires higher amounts of samples. However, in the case of phosvitin, which only contains a single methionine in its sequence, sulfur detection was not possible.
Conclusions CE was used successfully to separate a standard mixture of proteins permitting the detection of 31P, 63Cu, 65Cu, 64Zn, 66Zn, and 34S by ICP-MS.
Figure 3. Electropherogram of a standard mixture of proteins containing 1 mg/mL carbonic anhydrase (1), 0.5 mg/mL serum albumin (2) and 1 mg/mL phosvitin (3). ICP-MS set to acquire 34S using high energy helium collision mode.
Figure 2. Electropherogram of a standard mixture of proteins containing 200 µg/mL carbonic anhydrase (1), 300 µg/mL serum albumin (2) and 250 µg/mL phosvitin (3)

129www.agilent.com/chem/icpms
Keywordsroxarsone, 3-nitro-4-hydroxyphenyl-arsonic acid, animal feed, chickens, arsenic, capillary electrophoresis, CE, ICP-MS
IntroductionRoxarsone (3-nitro-4-hydroxyphenyl-arsonic acid) is one of the most widely used growth-promoting and disease-controlling feed additives in the United States. Many broiler chickens are fed roxarsone to promote weight gain and control parasites. Most of the roxarsone is believed to be excreted unchanged, and the resulting arsenic-containing waste is commonly recycled as fertilizer. Once in the environment, roxarsone can easily degrade into much more mobile and toxic arsenic (As) species. While HPLC coupled to ICP-MS has been used for the determination of As species including roxarsone degradation products, it is limited in its resolution. Capillary electrophoresis (CE) has the advantages of simple hardware and high efficiency. When coupled with ICP-MS for detection, CE-ICP-MS can provide a sensitive, highly selective method for the determination of roxarsone and its transformation products.
Determination of Roxarsone and its Transformation Products using Capillary Electrophoresis (CE) Coupled to ICP-MSCharlita Rosal and G. Momplaisir US EPA/ORD/NERL-ESD, Las Vegas, NV, USA
ExperimentalInstrumentationA Beckman P/ACE 5500 Capillary Electrophoresis unit was coupled to an Agilent 7500c ICP-MS using the Burgener MiraMist CE nebulizer (Figure 1). 30 kV was applied to achieve electrophoretic separation through a 75-μm × 93-cm uncoated, fused silica capillary. Capillary temperature was set at 22 °C. Because of the very low CE flow (ca 181 nL/min), make-up flow is required to achieve efficient nebulization while providing closure of the CE electrical circuit during separation. Make-up flow was set to 20 μL/min and consisted of 1% nitric acid with 3% methanol containing germanium as the internal standard at 100 ng/mL. CE and ICP-MS conditions are shown in Table 1.
Figure 1. Cutaway view of Burgener MiraMist CE interface
CE capillary to CE instrument
Argon
Pt electrode
Make-up solution at 20 µL/min Run through Pt electrode for postive contact.

130
Standards and reagentsStock solutions (100 mg/L As) of arsenite (As(III)), arsenate (As(V)), dimethylarsinate (DMA), monomethylarsonate (MMA), 3-amino-4-hydroxyphenylarsonic acid (3-AHPAA), 4-hydroxyphenylarsonic acid (4-HPAA), ortho-arsanilic acid (o-ASA), and roxarsone were prepared in deionized water (18 MW resistivity) and diluted into working standards in 10% running buffer in DI water.
CE-ICP-MS operationInitially, the ICP-MS was tuned and optimized for response at m/z 75 with the CE disconnected by introducing a 10-μg/L solution of arsenate via a syringe pump. The CE capillary was preconditioned with 0.1 M NaOH followed by a rinse with DI water. After connecting the CE to the ICP-MS via the MiraMist CE nebulizer, the analytical run consisted of these steps:
1. Column is pre-rinsed for 3 minutes each with 0.1 M NaOH and 20 mM phosphate buffer.
2. 10-second pressure sample injection.
3. 30-minute separation at 30 kV.
4. Nebulization and detection by ICP-MS.
ResultsUp to eight arsenic species in standards were separated by CE-ICP-MS in about 25 minutes with sensitivity superior to CE with UV detection (Figure 2). Absolute limits of detection (3 s) based on a 30-nL injection volume were calculated as approximately 55 to 130 fg as arsenic.
Figure 2. Electropherogram of standard containing eight As species (20 ng/mL)
Arsenic species (in order of elution)1. As(III) 2. DMA 3. 3-AHPAA 4. 4-HPAA 5. o-ASA 6. MMA 7. 3-NHPAA 8. As(V)
1
2
3
45
67
8
Arsenic compounds
Time (min)
Resp
onse
Table 1. CE and ICP-MS instrument operating conditions
Beckman P/ACE 5500 CE
Voltage 30 kV Capillary 75-μm id × 93-cm fused silica Running buffer 20 mM sodium phosphate, pH 5.7 Pre-analysis rinse 0.1 M sodium hydroxide (3 min), running buffer (3 min) Post-analysis rinse 0.1 M sodium hydroxide (3 min), DI water (3 min)
Agilent 7500c ICP-MS
RF power 1350 W Nebulizer Burgener MiraMist CE Plasma gas flow rate 14.8 L/min Auxiliary gas flow rate 0.92 L/min Carrier gas flow rate 1 L/min Make-up gas flow rate 0.25 L/min Sampling depth 6.3 mm Make-up gas flow rate 20 μL/min Masses monitored 72, 75 Integration time 0.70 s per point

131www.agilent.com/chem/icpms
Conclusions Taking into account the small injection volume (low nL) when compared to other techniques such as HPLC (μL), the sensitivity using CE-ICP-MS is extremely high. However, migration time reproducibility, especially when running extracts of manure samples, was poorer than hoped. One cause is due to incomplete ionization of the silica capillary walls at the buffer pH of 5.7, which can affect the electro-osmotic flow. A second cause is matrix effects from high concentrations of dissolved solids in the samples. Additional sample cleanup, including protein precipitation, significantly improved the migration time reproducibility. Internal standard correction was also shown to improve retention time reliability.
Additional InformationRosal, C., Momplaisir, G. & Heithmar, E. (2005). Roxarsone and transformation products in chicken manure: Determination by capillary electrophoresis-inductively coupled plasma-mass spectrometry. Electrophoresis, 26, 1606–1614.
Notice: Although this work was reviewed by US EPA and approved for publication, it may not necessarily reflect official Agency policy. Mention of trade names or commercial products does not constitute endorsement or recommendation for use.
Reprinted from 1st Edition Agilent Handbook of Hyphenated ICP-MS Applications, August 2007.

132
Agilent wishes to thank all the contributors who graciously gave their time and shared their work in order to make this compendium of hyphenated ICP-MS applications the useful document we hope you find it to be. The contributors include many of the global thought leaders in the fields of elemental and molecular speciation. The individual authors are listed with each application brief.
In order to keep this handbook as up-to-date with new research as possible, no attempt was made to independently review the submissions for technical accuracy. However most of the briefs were abstracted from recently published, peer reviewed journal articles. The references are included with each brief. In all cases, the submissions were reviewed and edited by Agilent ICP-MS specialists; however, Agilent cannot guarantee that no errors (technical or editorial) are present.
Agilent also wishes to thank Karen Morton, for her tireless effort in all the tasks required to bring a document of this scope to completion. Without Karen’s superb technical, editorial and organizational skills, this handbook would still be on my to-do list.
Steven Wilbur — Technical Editor
If you would like to contribute a paper to a future edition of the ‘Handbook of Agilent Hyphenated ICP-MS Applications’, please send an e-mail to Steven Wilbur at [email protected].
Acknowledgements

133www.agilent.com/chem/icpms
AAF4 11, 12. See also asymmetric field-flow fractionationaggregates 119, 120, 121alkane 72amino acid 95amino acids 51, 60, 102, 128aminomethylphosphonic acid 60AMPA 11, 12. See also aminomethylphosphonic acidanimal feed 42, 129anion exchange 11, 12, 14, 32, 33, 35, 36, 38, 44, 47antimony 10, 44, 45, 46, 47arsenate 20, 21, 105, 106, 130arsenic 6, 10, 11, 12, 13, 14, 15, 16, 17, 18, 19, 20, 22, 44,
45, 80, 81, 99, 100, 101, 105, 129, 130arsenic species 11, 15, 17, 18, 19, 22, 130inorganic arsenic 10, 13, 14, 15, 20
arsenite 11, 20, 21, 99, 130arsenobetaine 20, 21arsenolipids 100, 101arsine 11, 12, 80AsH3 11, 80, 81. See also arsineAs(III) 6, 11, 13, 14, 15, 16, 20, 21, 130. See also arseniteAs(V) 6, 11, 13, 14, 15, 16, 20, 21, 130. See also arsenateasymmetric field-flow fractionation 114, 117, 119
BBCR-464 23, 24, 25BCR-627 17, 18, 19BDE-209 68, 69bioactive 117biological 2, 6, 19, 36, 46, 54, 57, 75, 79, 82, 84, 97, 113,
116, 117, 119, 122, 127biothiol 94biothiols 93blood 54, 75, 76, 77, 96
blood plasma 54, 77bovine serum albumin 119, 127brominated flame retardants 68BSA 119, 120, 121. See also bovine serum albuminbutyltin 82
Ccadmium 105, 106capillary electrophoresis 124, 129cation exchange 11, 17, 19CE 5, 62, 124, 127, 128, 129, 130, 131. See also capillary
electrophoresisCeratophyllum demersum 105cerebral spinal fluid 109
cerebral vasospasm 109chemopreventive agent 102chemotrapping 11, 12chickens 129Chip HPLC 109chrome 36, 45chromite ore processing residue 36, 38chromium 10, 32, 35, 36, 37, 38
chromium speciation 32, 36, 38hexavalent chromium 32, 37, 38
CIC 20, 21, 22, 43. See also compound independent calibra-tion
clinical 5, 54, 56, 75, 76, 82, 92compound independent calibration 20, 42, 43, 66, 70, 71copper 54, 119, 120, 121, 125, 128COPR 36, 38. See also chromite ore processing residueCr6+ 32, 36. See also chromium — hexavalentcrude oil 6, 29, 30, 31, 72, 73, 74cysteine 26, 27, 28, 39, 51, 98, 128
DDBT 83, 84, 85, 86, 88. See also dibutyltindibutyltin 83dietary 13, 16, 32, 39, 42, 82, 100, 102dimethylarsine 11dimethylarsinic acid 11, 15, 20, 21dioctyltin 86DLS 117, 118. See also dynamic light scatteringDNA 127dogfish liver 23, 24, 27
DOLT-4 24, 25dogfish muscle 17, 18, 19, 27
DORM-2 17, 18, 19, 27, 28DOT 85, 86, 88. See also dioctyltindrinking water 6, 13, 32, 33, 34, 95dynamic light scattering 117
Eelectrospray ionization 6, 10, 41, 92, 93, 95, 98, 100, 102,
105enriched stable isotopes 51environment 19, 23, 26, 29, 32, 36, 46, 68, 82, 93, 113, 114,
129environmental 2, 5, 6, 10, 15, 26, 29, 38, 44, 46, 60, 92, 105,
113, 114, 116EPA 29, 30, 31, 32, 36, 38, 70, 75, 76, 129, 131
Method 3200 29, 30, 75, 76Method 6800 29, 31, 36, 38, 75, 76
ESI-ITMS 102, 103, 104. See also electrospray ionization
Index

134
ESI-MS 19, 39, 92, 93, 94, 95, 96, 97, 98, 99, 100, 101, 105. See also electrospray ionization
ESI-qMS 105. See also electrospray ionizationethylene 80, 81ethylmercury 31, 76
Ffatty acids 100, 101FFF 5, 112, 113, 114, 115, 117, 119, 120, 122. See also field-
flow fractionationfield-flow fractionation 5, 114, 117, 118, 119fish muscle 26, 28flame retardants 6, 68, 77fluorescence detector 51food 5, 6, 13, 14, 15, 23, 32, 39, 42, 85, 86, 88, 92, 95, 102,
113contact materials 85, 88food safety 10, 13, 14, 85, 88
fractogram 114, 118
Ggasoline 70, 71GC-ICP-MS 11, 23, 66, 67, 68, 69, 70, 71, 72, 73, 74, 75, 76,
77, 78, 79, 80, 81, 82, 84, 85, 88, 89, 90GC-TOFMS 77GE 124, 125, 126. See also gel electrophoresisgel electrophoresis 124, 125, 126gluphosinate 60glutathione 93glycoprotein 54glyphosate 60, 61gold 117, 118
Hherbicides 6, 60, 61heteroatom 20, 51, 53heteroatoms 51, 72heteronuclear phytochelatins 105hexavalent chromium 32, 37, 38Hg2+ 23, 24, 25, 31, 76, 93. See also mercuryHPLC-ESI-MS-MS 95, 96, 97HPLC-ICP-MS 5, 10, 11, 12, 13, 14, 15, 16, 17, 19, 23, 24, 25,
26, 28, 30, 31, 32, 39, 40, 41, 44, 45, 46, 48, 50, 57, 93, 94, 95, 96, 98, 99, 100, 101, 102, 103, 104
HPLC-PDA-FD-ICP-MS 51, 52human blood plasma 77
Iinorganic arsenic 10, 13, 14, 15, 20iodine 51ion chromatography 5, 20, 32, 36ion-pairing reversed-phase 41, 61, 102ion trap 102isotopically enriched 30, 75, 125, 126
LLA 125, 126. See also laser ablationLA-ICP-MS 125, 126laser ablation 124, 125LC-ICP-MS 20, 29, 38, 42, 43, 60, 62, 64, 92, 99, 110lipid extract 58, 59lipid extracts 57, 59
MMALS 117, 118. See also multi-angle light scatteringmarine samples 17, 19Me2AsH 11. See also dimethylarsineMeAsH2 11. See also monomethylarsinemercury 6, 23, 26, 28, 29, 75, 93
mercury(II) 26mercury species 23, 24, 25, 26, 29, 30, 31, 75, 76, 93
MeSeCys 102. See also methylselenocysteinemetabolomics 51metalloenzyme 125metalloporphyrins 72, 74metalloprotein 125, 127metalloproteins 124, 125, 127methionine 51, 53, 128methylmercury 23, 24, 26, 27, 28, 75, 93methylselenocysteine 39, 102mineral water 33, 34monomethylarsine 11monomethylarsonic acid, 20motor fuel 70multi-angle light scattering 117
Nnanoparticle 118nanoparticles 113, 114, 117, 118, 119natural gas 11, 12, 29nickel 23, 67, 72, 73nitrogen addition 80NPs 117, 118, 119. See also nanoparticlesNRCC DORM-2 Dogfish Muscle 17, 18, 27nutritional 6, 10, 39, 42, 102

135www.agilent.com/chem/icpms
Ooctyltin 82, 83, 84, 86organotin 48, 50, 82, 84, 85, 86, 87, 88ORS 58, 59, 61, 98, 100, 102, 127oxygen 10, 23, 46, 48, 57, 62, 64, 67, 68, 90, 98, 99, 100
PPBDE 68, 69. See also polybrominated diphenyl etherPC 58, 59, 93, 98, 106, 108. See also phosphatitylcholine;
See also phytochelatinsPCs 98, 106, 108. See also phytochelatinspeptides 98, 99, 124petrochemical refining 80petroleum 6, 29, 71, 72pharmaceutical 32, 39, 113phenylmercury 23, 24phenyltin 82, 83, 86phosphatitylcholine 58phospholipids 57, 58, 59phosphoprotein 109phosphoproteins 110phosphoric acid triesters 77, 78, 79phosphorus 6, 10, 51, 57, 58, 59, 60, 61, 109, 110, 119, 120photodiode array detector 51phytochelatins 93, 98, 99, 105plants 46, 47, 51, 93, 94, 98, 99, 102, 103, 105, 106, 107, 108plasticizer 77, 79polybrominated diphenyl ether 68polystyrene 117, 118polyvinyl chloride 77, 78, 79protein 36, 51, 54, 92, 102, 103, 109, 110, 113, 119, 120,
121, 126, 128proteins 51, 53, 54, 77, 96, 102, 103, 104, 124, 127, 128.
See also glycoprotein; See also metalloprotein; See also phosphoprotein; See also selenoproteins
proteomics 51PS 59, 117. See also polystyrenePVC 77, 78, 85, 86, 87. See also polyvinyl chloride
Rrefining 72, 80reversed-phase 39, 40, 41, 61, 93, 94, 100, 102, 103rice 11, 13, 14, 15, 16, 93, 94river water 34, 114, 115, 116RoHS 32, 68roxarsone 129, 130
SSb(III) 44, 45. See also antimonySb(V) 44, 45. See also antimonyscallop kidney 17, 18seawater 48, 50SEC-ICP-MS 54, 55, 56, 102, 103. See also size-exclusion
chromatographysediments 6, 26, 46, 47, 113selenium 6, 10, 39, 41, 42, 43, 51, 53, 95, 96, 97, 102, 103,
104selenized yeast 39, 40, 41selenomethionine 41, 43, 51, 53, 102, 103, 104selenoneine 95, 96, 97selenoproteins 39, 95, 96selenosugars 95SeMet 40, 41, 42, 43, 51, 53. See also selenomethionineserum 54, 55, 56, 119, 127, 128SIDMS 29, 30, 31, 36, 37, 38, 75, 76. See also speciated
isotope dilution mass spectrometrySimDis 72, 73, 74. See also simulated distillationsimulated distillation 72size-exclusion chromatography 54, 56, 102SOD 125, 126. See also superoxide dismutasesoil 11, 12, 13, 15, 26, 38, 44, 46, 47, 93, 103, 106, 107, 108,
113solid-phase microextraction 48, 75, 76, 77, 79speciated isotope dilution mass spectrometry 36, 38, 75SPME 48, 49, 50, 75, 76, 77, 78, 79. See also solid-phase
microextractionstibines 11subarachnoid hemorrhage 109sulfur 6, 10, 51, 53, 67, 70, 71, 72, 90, 98, 99, 119, 120, 121,
127, 128sulphur. See sulfursuperoxide dismutase 125, 126supplements 39, 42
TTBT 48, 49, 82, 83, 84, 85, 86, 88. See also tributyltintellurium 51tetramethylarsonium 16thiophene 70, 71TMA 11, 16. See also tetramethylarsoniumTPhT 48, 49, 83, 84, 85, 86, 88. See also triphenyltintributyltin 48, 82, 83trimethylarsine 11trimethylselenonium 95trimethyltin 48triphenylphosphate 77

136
triphenyltin 48, 82, 83tripropyltin 48, 82, 85tuna 17, 18, 19, 23, 24, 27, 96
BCR-464 23, 24, 25BCR-627 17, 18, 19tuna muscle 23, 24
Uurine 20, 21, 22, 82, 83, 84
Vvanadium 72, 73volatile organometallic compounds 11, 12VOMC 11. See also volatile organometallic compounds
Wwater 6, 10, 11, 13, 17, 29, 32, 33, 34, 35, 36, 37, 39, 40, 41,
44, 45, 46, 48, 50, 60, 67, 75, 83, 93, 95, 98, 100, 105, 106, 108, 114, 115, 116, 117, 127, 130
drinking water 6, 13, 32, 33, 34, 95mineral water 33, 34river water 34, 114, 115, 116seawater 48, 50
wheat germ extract 51, 53
Yyeast 39, 40, 41, 42, 43, 57, 58, 59, 110
Saccharomyces cerevisiae 57, 59Se-enriched 42selenized 39, 40, 41
ZZea mays 105, 106, 108zinc 106, 115, 119, 120, 121, 125

137www.agilent.com/chem/icpms
This page is intentionally left blank.

For more information
Learn more: www.agilent.com/chem/icpms
Buy online: www.agilent.com/chem/store
U.S. and Canada 1-800-227-9770 [email protected]
Europe [email protected]
Asia Pacific [email protected]
This information is subject to change without notice.
© Agilent Technologies, Inc. 2007, 2012 Printed in the USA February 23, 20125990-9473EN


![[PPT]Liquid Chromatography Fundamentals - Theory · Web viewLiquid Chromatography Fundamentals - Theory Keywords HPLC, LC, HPLC theory, HPLC fundamentals, teaching HPLC, learning](https://static.fdocuments.net/doc/165x107/5b1aa2c67f8b9a3c258de481/pptliquid-chromatography-fundamentals-theory-web-viewliquid-chromatography.jpg)