
Handbook of Contrast Echocardiography - University of Macau Library
73
Harald Becher . Peter N Burns Handbook of Contrast Echocardiography Left ventricular function and myocardial perfusion Peter N Burns Professor of Medical Biophysics and Radiology University of Toronto Imaging Research Sunnybrook and Women’s Health Science Centre 2075 Bayview Avenue Toronto, Ontario Canada M4N 3M5 [email protected] Harald Becher Professor of Cardiology University of Bonn Rheinische Friedrich-Wilhelms-Universität Medizinische Universitätsklink und Poliklink II Kardiologie/Pneumologie Sigmund-Freud-Straße 25 53105 Bonn Germany [email protected] Copyright © 2000 by Harald Becher and Peter N Burns. This book is protected by copyright. All rights are reserved, whether the whole part of material is concerned, specifically the rights of translation, reprinting, reuse of illustrations, recitation, broadcasting, reproduction on microfilm. This electronic copy was downloaded under the conditions of the End User License Agreement which accompanies it. Use and storage of this document signifies agreement with the terms of the Agreement. The files may not be altered without prior written permission of the copyright owners. No text, figures, tables or images may be displayed or reproduced, except for personal use, in any form or by any means, electronic, mechanical, photocopying, recording, or otherwise, without prior written permission of the copyright owners. The use of general descriptive names, registered names, trademarks, etc. in this publication does not imply, even in the absence of a specific statement, that such names are exempt from the relevant protective laws and regulations and therefore free for general use.
Transcript of Handbook of Contrast Echocardiography - University of Macau Library

Harald Becher . Peter N Burns
Handbook of Contrast EchocardiographyLeft ventricular function and myocardial perfusion
Peter N BurnsProfessor of Medical Biophysics and RadiologyUniversity of TorontoImaging ResearchSunnybrook and Women’s Health Science Centre2075 Bayview AvenueToronto, OntarioCanada M4N [email protected]
Harald BecherProfessor of CardiologyUniversity of BonnRheinische Friedrich-Wilhelms-UniversitätMedizinische Universitätsklink und Poliklink IIKardiologie/PneumologieSigmund-Freud-Straße 2553105 [email protected]
Copyright © 2000 by Harald Becher and Peter N Burns. This book is protected by copyright. All rights are reserved, whether the wholepart of material is concerned, specifically the rights of translation, reprinting, reuse of illustrations, recitation, broadcasting, reproductionon microfilm.
This electronic copy was downloaded under the conditions of the End User License Agreement which accompanies it. Use and storageof this document signifies agreement with the terms of the Agreement. The files may not be altered without prior written permission ofthe copyright owners. No text, figures, tables or images may be displayed or reproduced, except for personal use, in any form or by anymeans, electronic, mechanical, photocopying, recording, or otherwise, without prior written permission of the copyright owners.
The use of general descriptive names, registered names, trademarks, etc. in this publication does not imply, even in the absence of a specificstatement, that such names are exempt from the relevant protective laws and regulations and therefore free for general use.
Kardio-Kap 3 for pdf 06.06.2000 18:25 Uhr Seite 1

Kardio-Kap 3 for pdf 06.06.2000 18:25 Uhr Seite 2

3 Assessment of Myocardial Perfusionby Contrast Echocardiography
So much for the circulation! If it is either hindered or perverted oroverstimulated, how many dangerous kinds of illnesses and surprisingsymptoms do not ensue?
William Harvey, De Motu Cordis et Sanguinis, 1578–1657
Kardio-Kap 3 for pdf 06.06.2000 18:25 Uhr Seite 3

Myocardial PerfusionImaging
No other application of ultrasound contrastagents elicits the enthusiasm evoked by myo-cardial perfusion imaging. We believe that inthe forseeable future contrast echo will replacescintigraphy as the reference method for per-fusion imaging. This optimism is based onwidespread experience with intracoronary con-trast echocardiography where optimal imagingconditions are found. For intravenous contrastperfusion imaging, we hope that the followingsections will demonstrate that the technologyis ready to yield images of diagnostic quality,but that optimisation and standardisation ofclinical approaches are still necessary. Thischapter aims to provide a first step.
3.1 Physiology and pathophysiology of myocardial perfusion
3.1.1 Normal perfusion
The vascular compartments in the myocardiumcomprise the larger arteries, the arterioles, thecapillary network and the smaller and largerintramyocardial veins (1) (Figure 1). Followingan intracoronary bolus injection of micro-bubble contrast, an effect is subsequently seenin the different compartments. All currentlyavailable echo contrast agents are pure intra-vascular tracers which traverse the capillary bedof the myocardium following intravenousinjection. For assessment of perfusion it isnecessary to detect blood in the capillarycompartment which contains more than 90percent of the intramyocardial blood volume.
Quantitation of perfusion is aimed at measu-ring the intravascular blood volume and thevelocity of blood flow through the vessels, fromwhich flow rate can be derived. Specific tech-niques are discussed in Chapter 4.
The distribution of intramyocardial vessels is not uniform in the left ventricular (LV)myocardium. Vessel density is highest in thesubendocardial layers. Myocardial oxygenconsumption of the endocardial layers is higherthan that of the epicardial layers, because the endocardium contributes more to wallthickening and is also subject to the highestintramyocardial pressures (2). This spatial non-uniformity of myocardial perfusion is furthercomplicated by the temporal changes in myo-
82 Handbook of Contrast Echocardiography
Fig. 1 Scale in the vascular system. 90 percent ofthe intramyocardial blood volume lies within thecapillaries, and this is the objective of the contrastperfusion study. Capillary flow is characterised byvelocities of 1 mm/s or less.
Kardio-Kap 3 for pdf 06.06.2000 18:25 Uhr Seite 82

83Perfusion Imaging
cardial blood flow (MBF) and myocardialblood volume (MBV). The cyclic changes ofMBF are similar to the changes found in theepicardial vessels. The increase in global myo-cardial blood flow during stress or pharma-cological intervention is described in §3.2.Briefly, blood flow through the myocardiumcan be increased by up to three or four times,provided there is no obstruction in the epicar-dial or intramyocardial arteries.
3.1.2 Acute myocardial infarction
Transmural myocardial infarction is character-ised by areas of significantly reduced or non-existent flow, which has caused necrosis of themyocytes. Myocyte necrosis is associated withnecrosis of the vascular cells and local loss ofmicrovascular integrity. During transmural
myocardial infarction, necrosis occurs first inthe subendocardial myocardium (3). Withlonger occlusions, a front of necrosis movesprogressively across the wall involving thetransmural thickness of the ischemic zone(Figure 2). The resultant infarct size dependsnot only on the perfusion bed of the occludedvessel and on the onset of reperfusion, but alsoon the presence of collateral vessels. Aftersuccessful recanalisation of an occluded infarctvessel, necrotic zones still have zero flow (noreflow), whereas salvaged myocardium withpreserved microvascular integrity is reperfused.It takes some time before mechanical functionrecovers after an ischemic event. Stunned myo-cardium is defined as salvaged myocardiumwhich is still akinetic but will regain itscontractility within subsequent weeks. Theonly current diagnostic procedure for earlyassessment of reperfusion is myocardial scinti-graphy.
3.1.3 Chronic ischemic heart disease
At rest, up to 90 percent of stenoses of epicardialvessels do not result in a change in overall MBFin the perfusion bed because of compensatoryvasodilation of peripheral vessels. There are,however, differences between the epicardialand subendocardial layers (4). Subendocardialintramural vessels are maximally dilated,whereas subepicardial vessels are not. A vasodi-lator stimulus will augment transmural flow dueto dilation of subepicardial vessels and decreaseof the driving pressure. Because subendocardialvessels are already maximally dilated, the fall indriving pressure will result in a fall of flow,whereas subepicardial flow improves and totalflow is maintained or increased. Thus the trans-mural steal phenomena from stenosed tonormal vessels may be created. However, the
Nonnecrotic, salvaged, butstunned myocardium
Necrotic myocytes withoutgross microvascular damage
Myocyte necrosis withgross microvascular damage
Viable subepicardium
Nonischemic tissue
LV Cavity
RISKZONE
Fig. 2 Acute myocardial infarction showing thesubendocardial necrotic zone and viable subepi-cardial tissue. The extent of wall necrosis increaseswith length of coronary occlusion and absence ofcollaterals. Modified from Braunwald (3).
Kardio-Kap 3 for pdf 06.06.2000 18:25 Uhr Seite 83

84
transmural gradient is not uniform for a wholehypoperfused segment. Ischemic myocardiumcan show a heterogeneous pattern with normallyperfused areas supplied by collaterals near scarsor hypoperfused tissue.
Coronary stenoses may affect the volume ofblood within the perfusion bed as well as itsblood flow (5). Myocardial blood flow isthought to decrease in the stenosed bed in thepresence of hyperemia (6). This decrease mayexplain the differences in maximal signal inten-sities between normally and hypoperfusedmyocardial segments on contrast echo. Thereduced blood volume is thought to be broughtabout by a decrease in capillary density,possibly reflecting the tendency to regulate fora constant capillary perfusion pressure.
3.2 Currently available imaging methods for myo-cardial perfusion imaging
Perfusion imaging has two major objectives –assessment of ischemia and assessment of myo-
cardial viability. In clinical cardiology there arethree established methods to achieve this.
3.2.1 Stress ECG
The probability of a positive stress electrocardio-gram (ECG) is only 50 percent in patients withsingle vessel disease (stenoses > 70 percent) (7,8). Stress ECG provides only limited informa-tion on the extent of ischemia. However, it isthe initial method of choice provided there areno contraindications, because it is a simple andinexpensive way of demonstrating induciblemyocardial ischemia (Figure 3). If positive,stress ECG can be used for control studies afterintervention.
3.2.2 Stress echo
Stress echocardiography has become the mostimportant diagnostic method, in spite of thefact that by imaging left ventricular wall motion,it addresses perfusion only indirectly. Thesensitivity and specificity are between 80 and90 percent according to a recent meta-analysis(9). Even under optimal imaging conditions,
Handbook of Contrast Echocardiography
Fig. 3 Traditionally diagnostic path for assessmentof inducible ischemia in patients with exertionalchest pain and risk factors (University of Bonn).
Clinical methods for assessmentof myocardial ischemia
Stress ECG Limited sensitivity
Stress echocardiography Wall motion as indirectmarker of perfusion
Doppler echocardiography Limited to LADperfusion bed
Myocardial scintigraphy Still the gold standard
Contrast echocardiography The future …
Kardio-Kap 3 for pdf 06.06.2000 18:25 Uhr Seite 84

85Perfusion Imaging
analysis of LV wall motion is inferior to thedisplay of a perfusion mismatch which precedesthe wall abnormality in the ischemic cascade(Figure 4). Classically, flow must be reduced to 50 percent in at least 5 percent of the myo-cardium to detect new wall motion abnormal-ities (10). Thus, an echocardiographic per-fusion method should enable us to detect myo-cardial ischemia earlier, providing higher sensi-tivity in the detection of coronary arterydisease. Moreover, there are some importantclinical situations in which wall motion cannotbe used as an indicator of perfusion. One is theevaluation of patients following thrombolysisof an acute myocardial infarction. Stunned butreperfused myocardium has the same mechan-
ical properties as an unperfused segment, sothat clinical decisions cannot be based on wallmotion analysis alone.
3.2.3 Coronary flow reserve (CFR)
Doppler echocardiographic measurement offlow at rest and during exercise is a well-vali-dated method for assessment of flow reserve inthe left anterior descending (LAD) territory –particularly if contrast enhanced Dopplertracings are used. Coronary flow reserve (CFR)should be included in every perfusion studyinvolving the LAD. However, because of thelimitations of the method (§3.12–17) and inorder to evaluate the perfusion provided by the circumflex and right coronary arteries,additional methods are needed.
3.2.4 Myocardial scintigraphy
Myocardial scintigraphy is the only establishedclinical method which directly addresses myo-cardial perfusion. However, scintigraphy isexpensive and is not as widely available as echo-cardiography. In many European countriesscintigraphic studies are not performed in thecardiology department, whereas echocardio-graphic studies are always carried out in anexperienced cardiological setting. Perfusionscintigraphy is known to be less compromisedby submaximal stress because perfusion mis-match comes earlier (11, 12). In many centresstress echo is the first choice and scintigraphicstudies are confined to patients with poorechocardiographic windows. Theoretically,myocardial scintigraphy should be moresensitive than stress echo in the detection ofinducible myocardial ischemia (see Figure 4).
Fig. 4 The ischemic cascade
• Reporting is usually qualitative
• Perfusion changes preceed wall motion
abnormalities
• Sensitivity and specificity are limited
• Induction of ischemia is necessary
• Risk of submaximal stress
Why are wall motion abnormalitiesnot sufficient for the diagnosis of
coronary artery disease?
Kardio-Kap 3 for pdf 06.06.2000 18:25 Uhr Seite 85

86
In fact, the difference between both methods ismarginal due to the technical limitations ofscintigraphy (9). Thus the potential of per-fusion imaging by contrast ultrasound is notthwarted by scintigraphy. Nevertheless, scinti-graphy is widely considered to be the clinical‘gold standard’ for perfusion imaging, againstwhich contrast echo will initially be judged. Inthe future, the roles of the two methods arelikely to become complementary.
3.2.5 Myocardial Contrast Echo
There is a clear role for a reproducible, non-invasive, real-time method for imaging myo-cardial perfusion. Myocardial contrast echo(MCE) offers a pure intravascular tracer, betterspatial resolution, the potential for quantita-tion and real-time imaging during rest, stressand interventional studies. Ultrasound is morewidely available, portable and less costly thanother methods and remains in the hands of thecardiologist. It is likely to offer complementarydiagnostic information to existing methods.
3.3 Indications and selection of methods
3.3.1 Indications
The potential of contrast echo has beendemonstrated in numerous animal studies andhumans using intracoronary injections ofcontrast. However, only few data are availablefrom clinical studies using intravenous injec-tions of contrast. The following guidelines arebased on a review of the current literature andon our clinical experience of intravenouscontrast echo performed in more than 300patients over the last three years (13–19). Sofar there are two clinical situations where wehave begun to establish and validate themethod:
1. Acute transmural infarctionContrast echo can be used to determine theinfarction size and to assess reperfusion. Thisindication was the first objective of intra-coronary contrast echo, because it can be treatedas a yes/no decision (contrast demonstrableversus no contrast) and may be performed with-out further quantification. Several studies haveshown that the area of risk correlates well withthat demonstrated using thallium imaging (13).Infarct size and myocardial salvage followingreperfusion can be monitored with contrastechocardiography (14). The presence of contrastindicates myocellular viability in patients withrecent myocardial infarction (15).
2. Coronary artery stenosisDetection and functional assessment has beenevaluated in preliminary clinical studies (19).Reduction of contrast in a region of interestand reduced velocity of the contrast micro-bubbles can be used to detect significant
Handbook of Contrast Echocardiography
• Better spatial resolution: transmural distribution
of perfusion is shown
• Real-time control of imaging
• Uses a pure intravascular tracer
• Inexpensive, portable, uses no ionising radiation
• Patients stay in a specialised cardiological
environment.
Why myocardial perfusion with echo?
Kardio-Kap 3 for pdf 06.06.2000 18:25 Uhr Seite 86

87Perfusion Imaging
Prior/post or without coronary angiography:
• Infarct size MCE
• Reperfusion/no reflow MCE
Clinical indications for myocardial contrast echocardiography (MCE)and coronary flow reserve (CFR)
Acute Myocardial Infarction
Chronic Ischemic Heart Disease
Without coronary angiography:
• Detection of myocardial ischemia MCE
(selection for coronary angiography)
Exclusion of myocardial ischemia*
In conjunction with coronary angiography:
• Functional significance of LAD stenosis MCE and/or CFR
• Functional significance of other coronary arteries MCE
• Normal coronary arteries: ‘false’ positive stress test CFR
to confirm cardiac origin of chest pain
• Microvascular disease CFR
* Optimal display of the entire myocardium is necessary for this indication, a prerequisite not usually fulfilled with current technology.
** No clinical trials have yet been performed.
stenoses of the epicardial vessels during physicaland pharmacological stress.
Myocardial contrast echocardiography stillsuffers from limited display of the myocardium(few scanplanes available, poor imaging condi-tions in certain regions, see §3.11). It maytherefore be questioned whether it is possibleto exclude significant stenoses using currenttechnology. However, an abnormal finding inan MCE study, if performed properly, can betaken to represent myocardial ischemia with areasonable level of confidence. For the timebeing, MCE should be used in combinationwith a regular stress echo protocol assessingwall motion abnormalities when detection of
inducible myocardial ischemia is the indica-tion. Thus trainees can learn the new methodand take advantage of the better sensitivity ofMCE compared to wall motion analysis.Should they fail, there still is the data of theestablished methods. With the introduction ofreal-time perfusion imaging, wall motion andperfusion can be assessed together, without thepresent time-consuming combination of imag-ing modes. This will help facilitate the accept-ance of myocardial contrast into the clinicalstress echo lab.
Measurement of coronary flow reserve com-pletes an MCE study when the significance ofan LAD stenosis has to be evaluated. In patients
Kardio-Kap 3 for pdf 06.06.2000 18:25 Uhr Seite 87

88
with normal coronary arteries and chest pain,CFR measurements can be used to confirm orexclude the cardiac origin of the chest pain.Coronary flow reserve provides a quantitativemeasure whereas reading of MCE studiesgenerally relies on visual assessment. For didac-tic reasons assessment of CFR is described in aseparate section (§3.12). In clinical practice,evaluation of CFR of the LAD should be part ofa global perfusion study which includes tissueperfusion. It should be noted that the quanti-tative approaches for MCE described inChapter 4 are in rapid development.
3.3.2 Selection of patients and contraindications
With currently available ultrasound equipmentand approved contrast agents, we are stillworking at the margins of the machine’s abili-ty to obtain adequate contrast in the myocar-dial tissue. If the acoustic window is poor,myocardial contrast usually is suboptimal. Thesuccess of a contrast study can often be anti-
cipated from the image quality at baseline.Unlike LV opacification studies, where contrastis indicated for suboptimal baseline imaging,only those patients in whom image quality is good should be accepted for a myocardialcontrast study. Using tissue harmonic B-mode,patients should have an image quality whichwould enable a non-contrast stress echo to besuccessful. For the contrast agent itself, contra-indications might rarely result from the specificformulation of the shell or surfactant. For per-fusion stress echo, the contraindications areidentical to those of a non-contrast study.
3.3.3 Selection of the imaging method
Intravenous administration of contrast resultsin a very low concentration of bubbles in themyocardium which can be evaluated only byusing contrast specific imaging modalities. Fourcontrast specific imaging modes are available(see Table and Chapter 1). All have strengthsand weaknesses: some are better suited to per-
Handbook of Contrast Echocardiography
Contrast specific imaging methods for assessment of myocardial perfusion
Harmonic Harmonic Pulse Power pulseB-mode power Doppler inversion inversion
Bubble-to-tissue Moderate Very good Good Very good
sensitivity
Off-line background Yes No Yes No
subtraction needed
LV-myocardium Poor Good Moderate Good
delineation
Wall motion artifacts None Can be severe Moderate Few
Real-time imaging No No No Yes
Kardio-Kap 3 for pdf 06.06.2000 18:25 Uhr Seite 88

89Perfusion Imaging
fluorocarbon, some to air-filled microbubbles:some are not available in all scanners. Becauseintramyocardial vessels make up less than 10percent of myocardial volume, even withcontrast specific imaging methods, myocardialcontrast signals are weak compared to those inthe LV cavity. Dissolution and disruption ofmicrobubbles by intramural pressure and ultra-sound exposure further reduces myocardialcontrast. Thus for every contrast methodoptimal adjustment of the echo machine iscrucial to gain maximum sensitivity.
3.3.3.1 Harmonic power Doppler (HPD)Harmonic power Doppler (HPD) is the currentmethod of choice for myocardial perfusionstudies using intravenous infusions of an airbased agent such as Levovist (20–24).Harmonic power Doppler is supplied bydifferent manufacturers under different names(harmonic power angio, loss of correlation imag-ing, etc). In the following chapters, the term is used to represent the whole group which
function in a technically similar manner. Thephysics of harmonic power Doppler is de-scribed in §1.3.3.2; the specific settings foreach system are discussed in §3.6. When usingHPD with air-filled contrast agents, themethod relies on the detection of bubbleechoes which are undergoing rapid change as aresult of disruption by the ultrasound beam. Itis therefore a high Mechanical Index (MI)method. Since these signals can be obtainedfrom stationary or slowly moving micro-bubbles, the entire myocardial microcircula-tion can be detected. The appearance of contrastin the myocardium can easily be visualisedsince pre-contrast recordings exhibit no HPDin the myocardium (Figure 5). No backgroundsubtraction is needed and this is a majoradvantage over B-mode techniques. Anotheradvantage is the better segmentation of myo-cardium from the cavities, which is a prerequi-site for further quantitative analysis. The signalintensities in the LV cavity and myocardiumusually differ by at least 15 dB. The only
Fig. 5 Harmonic power Doppler recordings (four chamber view) before (a) and during (b) Levovist infusion.Myocardial contrast is clearly visible.
a) b)
Kardio-Kap 3 for pdf 06.06.2000 18:25 Uhr Seite 89

90 Handbook of Contrast Echocardiography
clinically relevant limitations are wall motionartifacts, which can be avoided by carefuladjustment of the scanplane and the instru-ment controls in most patients.
3.3.3.2 Harmonic B-modeHarmonic greyscale images offer higher framerate and no motion artifacts (19, 25, 26). Theproblem with greyscale techniques (harmonicB-mode and pulse inversion) is that at highmechanical index myocardial tissue givesstrong tissue harmonic echoes and the contrasteffect must be extracted from the sum of base-line grey level and the additional effect of thecontrast agent (Figures 6, 7). The small increasein grey level which can be achieved with intra-venous contrast is hardly visible in areas wherethe tissue grey level is high (Figure 7). Forreliable evaluation, a sophisticated and time-consuming procedure, offline background sub-traction, is necessary. Background subtractionof non-contrast recordings from contrastimages is the prerequisite for quantification ofmyocardial contrast using the greyscale modal-
ities, and is discussed in §3.9.2 and Chapter 4.Even with this, background subtraction inechocardiography remains less satisfactory thanother imaging methods such as digital angio-
Fig. 6 Harmonic B-mode (four chamber view) before (a) and during (b) Levovist infusion. Because the tissueharmonic is strong in the septum, perfusion enhancement is better seen in the lateral wall.
Fig. 7 Rationale for harmonic power Doppler in per-fusion imaging. Left: in harmonic B-mode, contrastenhancement of the perfusing blood must exceed thealready strong echo from the tissue harmonic inorder to be detected. Right: with harmonic powerDoppler, the echo from the tissue is eliminated,except for tissue motion artifact, so that the samedose of agent produces a greater degree of perfusionenhancement.
a) b)
Kardio-Kap 3 for pdf 06.06.2000 18:25 Uhr Seite 90

91Perfusion Imaging
graphy or scintigraphy. Only a few studies havebeen successful in using harmonic B-mode forassessment of fixed perfusion defects and in-ducible ischemia (19).
3.3.3.3 Pulse inversion imagingPulse inversion imaging offers the improvedresolution and sensitivity compared toharmonic B-mode (27). However, at high MI,the tissue harmonic imposes the same limit onthe pulse inversion image as it does on theharmonic image (Figure 8). The simplestscheme of pulse inversion (see §1.3.3) uses twoconsecutive pulses. If the tissue is stationary,only bubbles will create a different echobetween the two pulses. If the tissue movesbetween pulses, its location between pulses willcreate a different signal similar to that of thebubble, rendering the method susceptible tomotion artifact. Like harmonic B-mode, pulseinversion creates a need for background subtrac-tion and offers limited segmentation of myo-cardial tissue from the cavities. If, however,motion artifacts can be overcome by appro-
priate setting of the trigger and adjustment ofthe pulse repetition frequency, pulse inversionis probably the modality of choice for offlinesubtraction (See Figure 6 in Chapter 4).
3.3.3.4 Power pulse inversion (PPI)Recently, pulse inversion Doppler, also knownas power pulse inversion (PPI) has been intro-duced as the latest contrast specific imagingmethod (Figure 9). The new technique providesthe ability to image the myocardial bloodvolume at acoustic powers sufficiently low to cause little bubble destruction. Real-timeperfusion imaging is therefore possible (28).The display of cavity and myocardial contrastis similar to that of power Doppler, so that back-ground subtraction is not required (Figure 9).With this method, it is possible to displaymyocardial thickening, wall motion and per-fusion simultaneously. If the encouraging pre-liminary clinical results are confirmed in dailyroutine patients, power pulse inversion andrelated low MI real-time techniques will formthe method of choice in the future.
Fig. 8 Pulse inversion imging at high MI before (a) and during (b) Levovist infusion. The baseline signals inthe septum are higher than in the lateral wall, making enhancement more difficult to see.
a) b)
Kardio-Kap 3 for pdf 06.06.2000 18:25 Uhr Seite 91

92 Handbook of Contrast Echocardiography
3.4 Special considerations for myocardial contrast
There are some general requirements whichapply to all perfusion imaging studies. Theserequirements are described here; particularsettings for the different imaging techniqueswill follow in §3.6. Stress testing, reading andinterpretation of the findings are common toall imaging modes and are discussed in§3.7–3.9.
3.4.1 Impact of the scanplane
The adjustment of the scanplane has a substan-tial impact on the success of a myocardialcontrast study. First the standard apical planesshould be found and optimised as usual(Figure 10). For myocardial contrast studiesthe grey level in the lateral and anterior wall isa good indicator of how well these segmentscan be filled with contrast. With regular adjust-
Fig. 9 Power pulse inversion at low MI before (a) and during (b) Definity infusion. Almost no colour is seenwithin the myocardium at baseline. During infusion intense enhancement is seen within the LV cavity and theentire myocardium. MI = 0.1, framerate = 10 Hz.
Scanplanes
(§3.4.1)
Triggered
imaging
(§3.4.2)
Contrast
administration
(§3.5)
Machine settings
(§3.6)
At least two apical views
Consider modified scanplanes
to improve display of
lateral/anterior wall
Mandatory, except power
pulse inversion technique
Continuous infusion
recommended
Different from non-contrast
imaging
Special considerations for myocardial contrast studies
a) b)
Kardio-Kap 3 for pdf 06.06.2000 18:25 Uhr Seite 92

ment of the scanplane, the lateral wall (fourchamber view) and anterior wall (two chamberview) often have weak or almost no grey withinthe myocardium. This indicates that local
acoustic power is far less than for instance inthe septum with high grey levels (Figure 11).The reason for the weaker signals in thesesegments is attenuation of ultrasound causedby the interposition of pulmonary tissue orribs. For non-contrast imaging this hetero-geneity in grey levels is not a problem as longas endocardial borders are delineated. Forcontrast studies, however, a reduction in localacoustic power results in reduced or even nocontrast signals, which may be misinterpretedas a perfusion defect. Scanplanes should there-fore be adjusted in such a way that lateral andanterior walls are displayed with grey myo-cardium. This can be achieved by slightlychanging the scanhead position and movingthe lateral or anterior wall further to the centreof the imaging sector (Figure 11). Adjustmentof the scanplane should be carried out beforeinjection of contrast. During infusion ofcontrast the scanplanes should not be changed.
Parasternal views are less suitable for myo-cardial contrast studies than apical views.Usually the contrast within the right ventricle
93Perfusion Imaging
Fig. 10 Positioning the forearm for extendedperiods when the sonographer is seated to the rightof the patient. In order to avoid changing the scan-plane during acquisition of triggered images, theforearm is laid on the bed. Scanning without supportof the forearm is very strenuous.
Fig. 11 Adjustment of the four chamber view for a myocardial contrast study. With regular scanning thelateral wall is almost black (a). A slight modification of the scanhead position results in good grey levels inthe lateral wall (b).
a) b)
Kardio-Kap 3 for pdf 06.06.2000 18:25 Uhr Seite 93

94 Handbook of Contrast Echocardiography
attenuates the propagation of ultrasound to thedeeper parts of the heart, so that inferior andposterior segments cannot be evaluated in manypatients. In some patients it is possible tomodify the scanplane in such a way that theright ventricle is out of the plane.
3.4.2 Triggered imaging
The disruption of microbubbles by continuousexposure to ultrasound prevents contrastappearing in the myocardium during real-timescanning at high MI. Intermittent or triggeredimaging refers to the interruption of ultrasoundexposure between the acquisition of one or more imaging frames (Figure 12). During thisinterval, the disrupted contrast within the myo-cardium is replenished and there are again
Fig. 12 Triggered imaging: the scanhead only trans-mits ultrasound for acquisition of single high powerframes (black bars), which can be chosen by settingthe trigger. The time interval between the acquiredframes can be varied by changing the number ofcardiac cycles. This schematic illustration demon-strates triggering on each, then on every 7th cardiaccycle.
Fig. 13 Harmonic power Doppler, four chamber view, different degrees of myocardial contrast duringinfusion of Levovist: real time imaging (a), triggered imaging once every cardiac cycle (b), every third cardiaccycle (c) and every 5th cardiac cycle (d).
a) b)
c) d)
Kardio-Kap 3 for pdf 06.06.2000 18:25 Uhr Seite 94

95Perfusion Imaging
enough microbubbles to be imaged for thenext frame. The frames which are sampled canbe selected by trigger markers on the ECG(Figure 12). The sampled image is frozen onthe screen of the echo machine until acquisi-tion of the following frame. The introduction ofintermittent imaging signalled the initial break-through in intravenous myocardial contrastechocardiography (29, 30) and is explained in§1.3.4. In order to replenish the arterial andcapillary bed of the myocardium completely, atleast 10 seconds are needed. If the percentageof contrast replenishment is plotted againsttime interval between the imaging frames, anexponential curve is found, the asymptote ofwhich represents full replenishment (seeChapter 4). This means that most replenish-ment of contrast is found within a periodwhich clinically corresponds to pauses of 5 to 7cardiac cycles. Therefore trigger rates higherthan once every 7th cardiac cycle are usually notnecessary.
3.4.2.1 Incremental triggered imagingIt is not possible to predict the optimal triggerintervals in individual patients. The ‘best’triggering interval is dependent on cardiac out-put, dose of echo contrast and the actualattenuation. The recommended protocolstherefore include varying trigger intervals witha maximum of one frame every fifth cardiaccycle (Figure 13). In our experience this is longenough to provide a myocardial contrast strongenough to distinguish between perfusionabnormalities in most patients. The incrementalpulsing technique is not only suitable for find-ing the ‘best’ individual trigger but it can alsohelp quantifying the severity of stenosis.
3.4.2.2 Double or multiple triggerIn double or multiple triggering, the singledestruction image is replaced by a short series
of imaging frames, acquired in rapid succession(Figure 14). As before, the first frame after thereperfusion interval destroys all of the bubblesin the scanplane and creates the ‘perfusion’image. The second and subsequent frames donot show perfusion of the myocardium, but doshow cavity flow, as sufficient time has elapsedto allow the faster moving cavity blood to washnew bubbles into the scan plane. Motion arti-facts from tissue will also be present in the sub-sequent frames. One may therefore deducethat only those echoes present in the first frameand absent in subsequent frames are due to per-fusion. This is the main use of multiple trigger-ing. Some systems show the triggered framesside by side, which is especially helpful forinterpretation (Figure 15).
3.4.2.3 Flash echo During intermittent imaging and acquisition ofsingle frames which are frozen until the nextframe is sampled, the sonographer does not havecontrol of the scanplane and may lose it becauseof respiratory or other thoracic motion. Aningenious solution to this problem is to scancontinuously in a ‘scout’ mode during the
Fig. 14 Double frame triggering: short insonifica-tion for acquisition of two frames alternating withperiods with no transmission of ultrasound (one ormore cardiac cycles).
Kardio-Kap 3 for pdf 06.06.2000 18:25 Uhr Seite 95

interval with low emission power (MI < 0.2)which does not disrupt the bubbles (Figure 16).With low MI harmonic imaging, contrast canbe displayed in the cavities but not in the myo-cardium; cardiac structures can be displayed forcorrection of the scanplane if the patient
breathes or moves. Destruction frames at highMI are triggered as before, creating the perfusionimage. Multiple triggering may also be used.
3.4.2.4 Power pulse inversion flash echoThe superior sensitivity of power pulse inversion
96 Handbook of Contrast Echocardiography
Fig. 15 The double trigger technique: The top panel shows a four chamber view using harmonic Doppler andmultiple frame triggering. Every six beats, two high power ultrasound frames are made to disrupt the bubbleswithin the myocardium. The right panel shows the second frame, where some of the myocardial signal is nowabsent. This corresponds to bubbles that have been destroyed, an indirect sign of perfusion. The lower twoimages are from the same patient at a single beat trigger. Imaging every beat does not give enough time tofill the myocardium with bubbles. Therefore, the coloured myocardium is not a sign of perfusion. Persistenceof myocardial harmonic power Doppler signals in the second frame suggests motion artifact rather than per-fusion.Courtesy of J Luis Zamorano, University of Madrid, Spain
Kardio-Kap 3 for pdf 06.06.2000 18:25 Uhr Seite 96

97Perfusion Imaging
(PPI) in detecting bubbles at low MI means thatintermittent imaging is not needed for powerpulse inversion to achieve display of myocardialcontrast, because low transmit power results inonly minor destruction of microbubbles.However, even with PPI, triggering may stillprovide a benefit. During continuous imagingof perfusion at low MI, a single high powerframe may be used to disrupt the contrast agentwithin the myocardial tissue and then to assessreperfusion in real-time (see §4.2.3.3). Realtime dynamics of myocardial contrast replenish-ment provides additional information to thesteady signal intensities seen during infusion.
3.4.2.5 Systolic versus diastolic trigger
Contrast imaging is often improved whenframes are sampled during systole rather thanduring diastole. The small systolic cavity causes
less attenuation compared to diastole and thethickened myocardium facilitates further quan-titative analysis, for instance by allowing regionsof interest to be positioned without touchingthe cavity. Moreover, the myocardium movesto the centre of the imaging sector where sensi-tivity to contrast is better than in the lateralsectors of the imaging field. However, myo-cardial blood flow is highest during diastoleand especially subendocardial vessels aresqueezed during systole. Since myocardialcontrast echo evaluates the blood volume andthe replenishment which takes several cardiaccycles, it is probably irrelevant which portionof the cardiac cycle is chosen for data acquisi-tion. Positioning the trigger point is easy withharmonic B-mode, where just the frame at thetop of T-wave should be selected. In powerDoppler, wall motion artifacts may be present,requiring the sonographer to take specialmeasures to suppress these artifacts or look forother frames with fewer artifacts (for specificsuggestions see §3.6.1.1).
3.5 Choice of agent and method of administration
3.5.1 Continuous infusion versus bolus injection
Until recently, bolus injections have been wide-ly used for myocardial contrast echo. They stillmay be used for a rest study in acute trans-mural myocardial infarction, providing qualita-tive information as to whether there is a per-fusion defect or reperfusion. For all otherindications, the contrast agent should beadministered as an infusion (Figure 17, 18).Although administration by bolus saves sometime, there are a number of disadvantages,
Fig. 16 Flash imaging: continuous scanning withlow transmit power using low transmit power is per-formed to adjust the scanplane without display ofmyocardial contrast. Single frames are acquired withhigh transmit power to image myocardial contrast.The power pulse inversion method uses the samesequence of frames allowing display of myocardialcontrast signals in real-time at low transmit power.Single or multiple periods of insonification may beused to destroy the myocardial microbubbles and toassess myocardial contrast replenishment.
Kardio-Kap 3 for pdf 06.06.2000 18:25 Uhr Seite 97

most notably the comparatively short time fordata acquisition, frequent artifacts and greatlyreduced ability to quantify the resulting data.Wei et al. offer the following reasons for usingan infusion (31, 32): 1. It is relatively easy to adjust the dose of
contrast agent to the patient’s particular imaging conditions.
2. Blooming and contrast shadowing, regular occurrences with administration by bolus,can be considerably reduced by titrating the infusion rate for each individual.
3. Loosing the scanplane – not an uncommon occurrence in intermittent imaging – does not result in loss of the study.Recordings can be repeated under compar-
98 Handbook of Contrast Echocardiography
Fig. 17 Infusion of Levovist for myocardial contrast echocardiography. A PULSAR system (Medrad Inc.) filledwith two vials of 4 g Levovist (a) with a short tube connected with the venous cannula in a cubital vein (b).
Fig. 18 Set-up for infusion of undiluted perfluorocarbon agents.The undiluted agent is infused at low speed,a saline infusion at high speed prevents settlement of the microbbubbles within the tubes and the vein. Thisallows continuous infusion of Optison, but agitating the pump is necessary during infusion (left). For Definity thisset-up is recommended only for real-time perfusion imaging, but agitation is not necessary (right).
a) b)
Kardio-Kap 3 for pdf 06.06.2000 18:25 Uhr Seite 98

99Perfusion Imaging
able conditions or additional, modified planes can be imaged.
4. The infusion can be started or modified by the same person who is performing the ultrasound recordings. Repeated adminis-trations of bolus usually require an extra pair of hands.
5. A simple quantification of myocardial contrast effect can only be achieved by using a stable contrast infusion.
3.5.2 Preparation of contrastinfusion
For infusion of Levovist, a venous line shouldbe introduced into a cubital vein. For other
agents and vasodilator stress, forearm veins canbe used. Preparation of the contrast agentshould not begin before the pre-contrastscanning has shown that the patient is suitablefor a myocardial contrast study (good imagequality, no contraindications). When harmonicpower Doppler is used, the triggered framesshould show no wall motion artifacts and good‘spontaneous contrast’ in the LV cavity.
3.5.3 Adjustment of infusion rate
Optimisation of infusion rate is performed byvisual evaluation of contrast intensities in theapical and basal segments using triggered imag-ing (one frame every 5th beat is best to begin
Fig. 19 Impact of the infusion rate on the display of myocardial contrast (harmonic power Doppler, modifiedfour chamber view with optimal display of the lateral wall, infusion of Levovist). a) Dose too low, fullopacification of LV, but weak contrast signals within the myocardium. b) Dose too high, contrast shadowing,strong signals in the nearfield but no signals at greater depth. c) Dose too low, septum signal intensities arelow compared to the lateral wall suggesting a perfusion deficit. d) Optimal dose with similar signal intensitiesin septum and lateral wall.
a) b)
c) d)
Kardio-Kap 3 for pdf 06.06.2000 18:26 Uhr Seite 99

100 Handbook of Contrast Echocardiography
Contrast Contents Dilution Required Cannula Loading Initial
agent of vial number size bolus infusion
of vials rate
Levovist 4 g granulate add water to 2 vials 18 gauge 2 ml 1.5– 5 ml/min*
400 mg/ml
Optison** Suspension undiluted 1 vial 20 gauge 0.3 ml 7 ml/h
for injection (3 ml vial)
Definity Suspension 1.3 ml in 1 vial 18–20 0.5 ml 6 ml/min
for injection 50 ml gauge
(1.3 ml vial) saline
* Depending on ultrasound imaging system
** Not stable in a regular infusion pump, special set-up necessary (Figure 18) (33)
Dosing of ultrasound contrast agents for myocardial perfusion
with). Weak signals in the entire myocardiumindicate underdosing of contrast (Figure 19).An optimal infusion results in homogeneouscontrast enhancement in the apical and basalsegments. In this situation cavity contrast satu-rates and strong cavity signals can be seen withinthe left atrium as well as the left ventricle.Intense signals in the nearfield but weak orabsent signals at a greater depth indicatecontrast shadowing: the infusion rate shouldbe reduced. Guidelines as to how to adjust theinfusion rate for some different agents arelisted in the Table. Because of the time neededto reach a steady state, adjustment of doseshould not be performed in intervals of lessthan one minute.
3.6 Instrument settings
For successful studies correct adjustment of the imaging system to the specific acousticproperties of the contrast agent is essential. In
contrast echo some parameters which are nottouched in routine B-mode and Doppler echo-cardiography become crucial. The trainee inmyocardial contrast echo must learn how tomanipulate some controls of the echo machinewhich he or she has never used before. Carefuladjustment is necessary, as even minor devia-tions from the optimal setting may result in adramatic reduction in sensitivity. First, initialsettings are given which may be stored asscanner ‘presets’. Next, we provide guidelinesfor optimising settings for each individualpatient’s conditions. This adjustment of instru-ment controls is performed before infusion ofcontrast, so that during the contrast infusionitself no further changes are usually necessary.
3.6.1 Harmonic power Doppler
In harmonic power Doppler, the aim is toachieve complete disruption of the contrastagent in the myocardium and to display the
Kardio-Kap 3 for pdf 06.06.2000 18:26 Uhr Seite 100

101Perfusion Imaging
power Doppler signal without also displayingtissue motion artifact. The most importantmachine settings are listed below. Please notethat the effect of machine settings varies withindividual machine architecture. The recom-mendations that follow are for initial settingsand should be read in conjunction with thosesuggested by the manufacturer.
3.6.1.1 Setting the trigger pointDuring spontaneous respiration the triggerpoint is set at the top of the T-wave andintermittent imaging is performed with oneframe each cardiac cycle. After recording ofseveral cardiac frames in triggered mode, avisual check should be made as to whether wallmotion artifacts are superimposed on the myo-cardium (Figure 20). It is essential that nocolour signals should be visible within themyocardium before injection of contrast.Within the LV cavity there may be some spon-taneous harmonic power Doppler contrastthroughout the entire cardiac cycle. Wallmotion artifacts must be evaluated during
triggered imaging, as artifacts in continuousimaging will be different.
If wall motion artifacts are visible, the follow-ing manoeuvres may be undertaken:
1. Changing the trigger point by advancing ordelaying in single increments. This will beeffective in most patients. If no systolic framecan be found without wall motion artifacts,diastolic triggering can be set with a triggershortly before the onset of the P-wave.
2. Controlled breathing or breathold. In patientswith wall motion artifacts induced by respira-tory movements, holding the breath can betolerated only for frames with a high triggerrate. For longer trigger intervals ‘controlledbreathing’ is recommended: the patient isasked to breathe shallowly and arrest inspira-tion when the imaging frame is obtained. Thepatient should have some practice with thistechnique before baseline and contrast record-ings are performed.
Fig. 20 Selection of the trigger position for intermittent imaging: four chamber view, two consecutive framesacquired during baseline: a) shows optimal trigger point with no wall motion artifacts, b) is not usefulbecause of wall motion artifacts in the lateral wall and the septum. Note intracavitary harmonic powerDoppler signals in both frames.
a) b)
Kardio-Kap 3 for pdf 06.06.2000 18:26 Uhr Seite 101

102 Handbook of Contrast Echocardiography
3. Increasing the PRF. By reducing the periodbetween, this reduces motion artifact. It alsoreduces sensitivity to the contrast agent.
4. Increasing wall filter setting. This also elim-inates some of the contrast signal, so should beused carefully.
5. Increasing the colour threshold. This is asomewhat perilous measure that will eliminate
any of the contrast signal whose strength isbelow that of the moving tissue. Not recom-mended!
6. Decreasing the colour gain. A last resort,which can often reduce sensitivity to thecontrast agent to the point that it will not beseen on infusion. If a gain adjustment must bemade, a satisfactory level to eliminate artifactshould be established before contrast, but
Harmonic power Doppler perfusion studies: settings
Initial settings for all systems (preset):
Scanhead Lowest frequency
Transmit power Mechanical Index (MI) > 1.2
Receive gain Default
Display-Mode Standard monochromatic map
Dynamic range Maximum
Persistence Disabled
Line density Lowest value
Sensitivity Medium
Wall filter High
PRF 1500 kHz (Optison/Definity), 2500 kHz (Levovist)
Scanplane Conventional planes
Optimise in tissue harmonic mode (see text) then reduce
receive gain for tissue harmonic
Imaging field Adjust box so that the entire LV-myocardium is included
Focus Below mitral valve (apical planes),
Below posterior wall (parasternal view)
HP system: move towards apex if apical defect present
Trigger Systole (peak of T-wave)
Double trigger, if available
Once every cardiac cycle (increase during infusion of contrast)
Carefully adjust to avoid wall motion artifacts (see text)
Individual adjustment of instrument controls:
Kardio-Kap 3 for pdf 06.06.2000 18:26 Uhr Seite 102

103Perfusion Imaging
implemented only after arrival of the contrast,when its effect on the study can be seen.
If double frame acquisition is available, bothconsecutive frames should be checked for wallmotion artifacts, as they are acquired at slightlydifferent points in the cardiac cycle.
3.6.2 Harmonic B-mode
Harmonic B-mode may be used if the availableinstrument does not provide harmonic powerDoppler or if the offline subtraction method hasbeen chosen. Harmonic response increases withtransmit intensity of ultrasound, so a high MI isrecommended (see Table). The user should beprepared, however, to see strong pre-contrastechoes from tissue harmonics. In fact, a good
Harmonic B-mode for myocardial perfusion: settings
Initial settings for all systems (preset):
Individual adjustment of instrument controls:
Scanhead Lowest frequency
Transmit power Mechanical index (MI) > 1.2
Receive gain Default
Compression None
Dynamic range Maximum
Persistence Disabled
Line density Lowest value
Scanplanes Find conventional planes then reduce
receive gain (see text)
Focus Below mitral valve (apical planes),
Below posterior wall (parasternal view)
Transmit power Reduce initial level if apical defect or swirling is seen
Increase MI if global contrast is too weak
Receive gain May be reduced slightly to suppress myocardial
tissue echo
TGC As in standard imaging
Lateral gain (HP) As in non-contrast imaging
Trigger Systole (peak of T-wave)
Once every cardiac cycle (increase during infusion
of contrast)
Kardio-Kap 3 for pdf 06.06.2000 18:26 Uhr Seite 103

104 Handbook of Contrast Echocardiography
Mode Harmonic power angio Also known as: coded harmonic angio;
colour power angio; harmonic power Doppler.
Transducer Lowest, eg 1.5/3.0 MHz Lower frequencies give better bubble
frequency disruption and hence sensitivity,
but slightly poorer resolution.
Output power High: MI > 1.0 High MI is essential for bubble disruption.
(MI) Usually the maximum is best.
Colour box Embrace entire MI reduces at edges of sector, making
size/position myocardium of interest imaging there less reliable.
Focus Level of mitral valve Focus affects uniformity of exposure
conditions in image. With some systems
(eg HP Sonos 5500), it is necessary to
move focus to apex to see perfusion there.
Pulse repetition 2.5–4.0kHz Also known as: Doppler scale. Highest possible.
frequency (PRF) Lower PRF increases sensitivity to both contrast
but also tissue motion. Air agents (eg Levovist)
work better at high PRF than perfluorocarbon
agents (eg Optison or Definity).
Trigger Mid T-wave (initial setting) Note that trigger often affects MI. Adjust trigger
to minimise motion artifacts and adjust other
controls with trigger active.
Frames 2–4 This controls the number of frames
acquired at each trigger. The first frame
shows contrast combined with artifacts,
subsequent frames show artifacts only.
Dual display On (if available) With multiframe trigger, a dual image display
showing first and a subsequent frame can help
interpretation of contrast perfusion study.
Colour gain Decrease to the point that Adjust gain last, after trigger, PRF, filter
motion artifacts are just and other colour settings have been
visible in pre-contrast image adjusted to minimise motion artifact.
B-mode gain Sufficient to see Excessively high B-mode gain can cause grey
endocardium to overwrite colour in image.
Control Setting Comments
Understanding machine settings for harmonic power Doppler perfusion studies
Kardio-Kap 3 for pdf 06.06.2000 18:26 Uhr Seite 104

105Perfusion Imaging
way to predict whether adequate contrast signalswill be obtained in the lateral wall is to checkwhether clear tissue harmonic echoes can beseen in these areas. Thus one first ensures thatthere is a good tissue harmonic echo using anormal gain setting, after which the receive gainis reduced in readiness for the contrast study. Atbaseline the myocardium should be almostblack and only the endocardial borders shouldbe visible.
As with power Doppler, the position of thetransmit focus and the line density affectbubble disruption. Reduction of line densitycompared to that used for non-contrast imag-ing and placing the focus below the mitralvalve helps to make insonation more homo-geneous. Dynamic range should be as high aspossible to ensure that small changes in contrastsignals are not overlooked. Compression andother forms of nonlinear processing which
Colour priority Maximum Also known as: Angio priority. Forces
colour to overwrite grey level in image.
Colour threshold Minimum Removes low level contrast signals:
must be set to zero
Line density Minimum Reducing line density limits inadvertent
bubble destruction (that is, bubble
destruction that does not contribute to
the image). Increasing frame rate setting
may also decrease line density.
Frame rate Medium – High Higher frame rates may decrease
line density
Persistence Zero Also known as: frame averaging. Contrast
signals are typically present in a single
frame. Averaging may reduce their value.
Ensemble length Medium – High (8 pulses) Also known as: Doppler sensitivity, packet length.
This determines the number of pulses sent along
each scan line. A high number improves both
bubble disruption rate and sensitivity to the agent.
Lower settings can be used for Levovist.
Dynamic range High Too low dynamic range will create an
‘on/off’ display of colour; too high will increase
background noise and blooming from the cavity
Wall Filter Medium – Low Also known as: low velocity reject.
Eliminates signals from slowly moving structures
such as tissue. At too high a level, will also reject
contrast echoes. Use the lowest setting possible,
while still eliminating motion artifact from tissue.
Control Setting Comments
Kardio-Kap 3 for pdf 06.06.2000 18:26 Uhr Seite 105

106 Handbook of Contrast Echocardiography
Pulse inversion imaging for myocardial perfusion: settings
Initial settings for all systems (preset):
Transmit power Mechanical Index (MI) = 0.3 for triggered imaging
Receive gain Default
Compression None
Dynamic range Maximum
Persistence Disabled
Line density Regular
Individual adjustment of instrument controls:
Scanplanes Corresponding to conventional planes.
Optimise before injection of contrast (see text), then
reduce receive gain
Focus Below mitral valve (apical planes),
Below posterior wall (parasternal view)
Receive gain Adjust to be just above the noise level
TGC As in standard imaging
Trigger Systole (peak of T-wave)
Once every cardiac cycle (increase during infusion of contrast)
Adjust to reduce motion artifact
enhance the display of diagnostic informationin non-contrast echocardiography serve only tocorrupt the interpretation of regional myo-cardial perfusion echoes. Therefore no com-pression should be used for myocardialcontrast echo. Positioning of the trigger is easywith harmonic B-mode and the double trigger(frame) technique is not required to check forartifacts. However, the double frame techniquemay be used for subtraction during contrastinfusion.
3.6.3 Pulse inversion imaging
Similar adjustments are necessary for the pulseinversion method as for harmonic B-mode. Todate, there is limited experience with thismethod, so the recommendations listed in theTable are preliminary. The pulse inversionmethod has a remarkable sensitivity forcontrast at low transmit power settings and ismuch more effective than harmonic powerDoppler or harmonic B-mode at low MI. It istherefore recommended to work with lowerMIs with pulse inversion imaging than withharmonic B-mode, as the reduction in tissue
Kardio-Kap 3 for pdf 06.06.2000 18:26 Uhr Seite 106

107Perfusion Imaging
harmonic improves myocardial perfusioncontrast. With lower MI, a lower infusion ratemay also be more effective. For quantitativeanalysis, which should be the aim of everymyocardial contrast study, triggered imaging isstill as necessary as it is with the other imagingmethods. With triggered imaging the contrasteffect increases with increasing transmit power.Spatial resolution is much better with pulseinversion than with power Doppler or har-
monic B-mode. The potential problem ofmotion artifact in greyscale pulse inversionimaging means that special attention should bepaid to the trigger point and to the pulserepetition frequency, as with harmonic powerDoppler. In some systems, increasing the pulserepetition frequency can be achieved simply byincreasing the framerate, which will tend toreduce motion artifact at the expense of someloss of sensitivity to the agent.
Power pulse inversion for real-time myocardial perfusion: settings
Transmit power Mechanical index (MI) = 0.15
PRF 2500 Hz
Dynamic range Low
Sensitivity Medium
Persistence Disabled
Line density Low (increases frame rate)
Penetration depth 12.7 cm
Focus 10 cm
Receive gain Default
Individual adjustment of instrument controls:
Transmit power Good window : MI = 0.09–0.11
Moderate window: MI = 0.11–0.14
Scanplanes Corresponding to conventional planes
optimise before injection of contrast (see text)
TGC Depth 1 ~ 30 optimise to suppress tissue harmonics
Depth 2 > 50 optimise to suppress tissue harmonics
Depth 3–8 maximum
Trigger* Optional – peak of the R wave
Once every 15th cardiac cycle
Double frame (MI = 0.5)
Initial settings for all systems (preset):
* can be used to destroy microbubbles in myocardium for real-time destruction-reperfusion measurement (see §4.2.3)
Kardio-Kap 3 for pdf 06.06.2000 18:26 Uhr Seite 107

108 Handbook of Contrast Echocardiography
3.6.4 Power pulse inversion
This is the only method which currently allowsreal-time perfusion imaging. Preliminarysettings are listed in the Table. In practice,‘real-time’ means frame rates of up to about26 Hz. Very low transmit power (MI = 0.09–0.15) is the essential prerequisite for visualisingmyocardial contrast in real-time. With currenttechnology effective myocardial contrast canonly be achieved with perfluorocarbon agents.Higher doses are needed: bolus injections of0.5–1.0 ml of Optison or infusion rates of0.5 ml/min provide good myocardial contrast.Single or double frames with high transmitpower may be used to destroy the microbubbleswithin the myocardium and to assess re-plenishment in real-time (see §4.2.3.3). Notriggering is necessary.
3.7. Image acquisition
As with conventional stress echocardiography,all recordings should be digitally stored andanalysed offline. Capabilities for digital image
storage are provided in all harmonic echomachines, using direct connection to aDICOM network or by magneto-optical(MO) discs. Before each contrast study, acheck must be made to see whether there isenough space to store the study. Videotape is auseful backup and also forms a continuousrecord. During data acquisition shallowbreathing is recommended. Holding the breathis not useful for triggered imaging, becausemany cardiac patients are unable to do so forsufficiently long to cover several frames at longtrigger intervals. It usually takes at least twominutes before the myocardial microbubbleconcentration has reached a steady state. Thuscontrast recordings should be started threeminutes after contrast infusion has beeninitiated (Figure 21). The recommendedrecordings for all imaging modalities exceptpower pulse inversion imaging are shown inthe Table.
Power pulse inversion imaging can be per-formed in real-time. At least 5 cardiac cyclesshould be sampled in each view. Breatholdingis often useful to obtain reproducibleconsecutive cycles.
Recommended image files to document a myocardial contrast study
• four chamber view • four chamber view • four chamber view• two chamber view • two chamber view • two chamber view• long axis • long axis • long axis
• Each file should include at least 5 frames, triggered 1:1, 1:3 and 1:5.
• With real-time imaging at least 3 cardiac cycles should be recorded, followed by the destruction bursts and the variable period of myocardial contrast replenishment which is completed within 10 cardiac cycles.
• Baseline recordings are necessary in PPI and HPD to prove, that tissue harmonics and wall motion harmonics are eliminated. With B-mode harmonic and pulse inversion imaging baseline recordings areneeded for background subtraction.
RestBaseline Stress
Kardio-Kap 3 for pdf 06.06.2000 18:26 Uhr Seite 108

109Perfusion Imaging
Fig. 21 Protocol for resting and stress studies.
3.8 Stress testing during myocardial contrast echo
3.8.1 Exercise and dobutamine stress
During myocardial contrast echo, stress can beperformed with any of the available methods,though the special imaging conditions makepharmacological stress more suitable. Exercisestress (exercise or treadmill) provides thegreatest myocardial oxygen consumption com-pared to other methods (10). However, scann-ing during and after exercise is difficult becauseof increased respiratory and cardiac motion. At peak stress it is sometimes a problem tokeep or reproduce the same scanplane, becausethe patient may be unable to hold his or herbreath. Because myocardial contrast echorequires recording a series of consecutive trig-gered frames, physical exercise is a challengingprocedure for the echocardiographer. Withpulse inversion imaging or harmonic powerDoppler, wall motion artifacts are accentuatedfollowing an increase in heart rate and inotro-
pic state leading to further reduction of imagequality. Finally, the need to adjust the triggerpoint to the varying heart rate further compli-cates the method.
Dobutamine infusion only slightly reducesthese difficulties. At peak stress there are prob-lems similar to those found during physicalexercise, where the enhanced cardiac andrespiratory motion limits scanning, particularlywith harmonic power Doppler and pulse inver-sion. Thus vasodilator stress is our method ofchoice for myocardial stress contrast echo-cardiography.
3.8.2 Vasodilator stress
During dipyridamole and adenosine infusionthe changes in heart rate are moderate and theinotropic state is not altered significantly. As aresult, oxygen consumption is not increased.Ischemia only develops with additional hori-zontal or vertical steal (Figure 22), which isfound in up to 50 percent of patients with sig-
Kardio-Kap 3 for pdf 06.06.2000 18:26 Uhr Seite 109

110 Handbook of Contrast Echocardiography
nificant stenoses. Only these patients developwall motion abnormalities. Thus wall motionabnormalities are found less frequently withvasodilator stress than with exercise or dobuta-mine. However, blood flow in the perfusionbed supplied by a significantly stenosed arteryincreases only marginally (or decreases whensteal phenomena develop) compared to thethree to four fold increase in areas supplied bynon-stenotic arteries, and a perfusion mis-match can be displayed with high sensitivity(34, 35).
The myocardial segments not affected bycoronary artery stenosis will show an increasein signal intensities corresponding to theirnormal flow reserve whereas hypoperfusedareas will show no increase in signal intensities
or even a decrease due to a steal. Evaluation ofvasodilator stress images can be performed byvisual judgement or by using post-processingand quantitative analysis (see §4.2). Sincevasodilator stress is not widely used for con-ventional stress echocardiography, the doseregimen and side effects and contraindicationsare reviewed in the Tables. Side-effects arecommon, particularly for adenosine stress, butthey are benign. Dipyridamole and adenosinehave extra-cardiac effects which limit scanningduring infusion of contrast. The most import-ant is dyspnea which causes deep breathingand threatens loss of the imaging plane. Thepatient must be informed about this phenom-enon before starting the adenosine infusion.Many patients can tolerate the discomfort ifthey are informed before the examination.
Fig. 22 Effects of adenosine on intramyocardial vessels in normal epicardial coronary arteries and in thepresence of a stenosis. At baseline (a) the blood flow in the perfusion bed of the stenosed coronary artery isnot different from areas without stenoses due to maximal dilatation of the arterioles and collateral flow. Withadenosine (b) arteriolar resistance decreases in the normally perfused territory resulting in a 3- to 4-foldincrease of blood flow in the normal myocardium. In the presence of a significant stenosis blood flow doesnot increase, but may decrease due to reduced collateral flow (steal phenomenon).
baseline
myocardium myocardium
adenosinea) b)
Kardio-Kap 3 for pdf 06.06.2000 18:26 Uhr Seite 110

3.8.3 Combined assessment ofwall motion andmyocardial perfusion
Myocardial contrast echocardiography can beperformed in conjunction with a routine stressecho protocol for wall motion analysis (see§3.3.1). With real-time perfusion imagingsimultaneous assessment of perfusion and wall
motion is possible using a constant infusion ofcontrast (Figure 23). With triggered imagingcontrast infusion should be confined to MCErecordings for two reasons: contrast is notneeded for left ventricular opacification (LVO)because good acoustic windows are recom-mended for perfusion studies. Furthermore,the doses for MCE using triggerd imaging arelower than for real-time LVO studies and
111Perfusion Imaging
Ease of Induced ischemia Modality of
scanning choice
Physical exercise difficult needed 2 D harmonic PPI
Dobutamine difficult needed 2 D harmonic PPI
Dipyridamole easier not necessary all modalities
Adenosine easier not necessary all modalities
Choosing a stress modality for harmonic power Doppler
Fig. 23 How to integrate an MCE study using triggered imaging into a routine stress echo protocol for wallmotion analysis. With adequate baseline images contrast infusion can be confined to MCE recordings.
Kardio-Kap 3 for pdf 06.06.2000 18:26 Uhr Seite 111

112 Handbook of Contrast Echocardiography
adjusting infusion speeds to LVO or MCE isdifficult with the time constraints of a stress test.
3.9 Reading myocardial contrast echocardiograms
Reading MCE studies involves steps which aresimilar to those of a regular stress echo forevaluation of LV wall motion, which mayparallel a perfusion study. In each view thesegments defined by the American Society ofEchocardiography (ASE) are evaluated and thecorresponding segments at rest and duringstress are compared. Reading and interpreta-tion of perfusion studies needs to be performedoffline. Visual assessment of perfusion, how-ever, is mandatory during the stress phase of thecontrast study: if perfusion defects developunder stress, the stress should be stopped. Thefollowing guidelines for reading and inter-pretation apply to all imaging techniques. Theevaluation of triggered images is in principlenot different to that of images made with real-time perfusion imaging. There are several waysto deal with the stored recordings:• Visual judgement of original single frames
and cine loops,• Visual judgement of post-processed images,• Quantitative analysis of original or
postprocessed images Original recordings can be used for harmonicpower Doppler and power pulse inversion,whereas evaluation of recordings obtained withharmonic B-mode is more difficult. When usinga greyscale technique at high MI, the contrastsignals need to be separated from the tissue har-monic signals present at baseline. Because this isso difficult to appreciate subjectively from thecompressed grey levels seen on the screen, back-ground subtraction and colour coding must be
applied before visual judgement is attemptedfrom harmonic B-mode recordings.
3.9.1 Visual assessment of unprocessed recordings
Visual assessment is practicable with powerDoppler and power pulse inversion recordings.High MI greyscale images should not be as-sessed in this way. However, once softwaretools for background subtraction and colourcoding of the myocardial contrast signals havebeen applied, visual judgement of processedgreyscale images uses the same criteria as thosefor the assessment of unprocessed powerDoppler images. Visual judgement mainlyrelies on the signal intensities of myocardialcontrast, which reflects relative myocardialblood volume. In order to get an idea of myo-cardial blood flow, one needs to evaluate thechanges in the signal intensities with time. Avery rough estimate of flow is provided by thetime needed to achieve visible myocardial
Visual grading of myocardial contrast: separate scores for
each of the six ASE myocardial segments of the scanplane
0 No contrast enhancement
1 Poor contrast enhancement, incomplete
filling of segment
2 Moderate contrast enhancement,
complete filling
3 Strong contrast enhancement
X Unsuccessful (artifacts, attenuation,
blooming, etc)
Kardio-Kap 3 for pdf 06.06.2000 18:26 Uhr Seite 112

contrast following the disruption of myo-cardial contrast by high power frames (36).With the power pulse inversion method thisreplenishment can be recorded in real-time.Using the other methods and triggered imaging,one can determine lowest trigger interval atwhich myocardial contrast becomes visible.
3.9.1.1 Normal perfusionThe dose regimen and machine settings listedin §3.6 provide moderate or strong contrastenhancement at the longer trigger intervals(1:3–1:5). At shorter intervals (1:1–1:3), thecontrast pattern is patchy or reticular, repre-senting the larger intramyocardial vessels.More homogeneous opacification is foundwith intervals above 1:3 (Figure 24). Withoptimal display, myocardial contrast involvesthe entire myocardial thickness (Figures 25,26). Isolated epicardial contrast is caused bydisplay of epicardial vessels and may be foundduring wash-in of contrast following a bolusinjection but not during infusion and triggeredimaging. In power Doppler mode, isolated epi-
cardial colour signals represent wall motionartifacts rather than vascular contrast (see§3.11.4).
Before MCE studies are evaluated, the readershould judge the corresponding scanplanes forwall motion. At rest all segments without wallmotion abnormalities should show contrastenhancement. Missing or incomplete myo-cardial contrast in a normally contractingmuscle is an artifact! Incomplete myocardialcontrast enhancement may often be found innormals – particularly in the basal segments.These basal dropouts represent attenuationrather than real perfusion defects – especiallywhen the defect does not end in the myo-cardium. During stress these segments often fillin. Coronary stenoses usually involve mid andapical segments, so that isolated basal defectsseem to have only minor clinical impact.
The variation of exposure to transmitted ultra-sound in different parts of the image shouldalways be taken into account in a visual
113Perfusion Imaging
Fig. 24 Example of successful visualisation of all segments in modified four chamber view during Levovistinfusion.
Kardio-Kap 3 for pdf 06.06.2000 18:26 Uhr Seite 113

114 Handbook of Contrast Echocardiography
Fig. 25 Normal perfusion: SPECT, horizontal axis (a) and harmonic power Doppler, four chamber view (b). Courtesy of Francesco Gentile, University of Milan, Italy
Fig. 26 Harmonic power Doppler, four chamber view, Optison infusion. Two frames showing normal findingswith excellent delineation of cavity from myocardial signals. Note the intense spots within the myocardiumwhich represent intramyocardial vessels. In the right frame the myocardial contrast scores of the six segmentsare shown.Courtesy of Joanne Sandelski and Steve Feinstein, Rush University, Chicago IL, USA
a) b)
Kardio-Kap 3 for pdf 06.06.2000 18:26 Uhr Seite 114

assessment. When perfusion is normal, signalsof varying intensity are found in the individualmyocardial segments (Figures 26, 27). This isbecause the effective mechanical index is notthe same at all points in the image plane. Inlateral regions, the transducer transmits lessintense pulses; in deep regions attenuationreduces the intensity progressively (Figure 28).
Dropouts in the entire lateral wall (four cham-ber view) and the anterior wall (two chamberview) should be rare when the imaging guide-lines are followed. If lateral or anterior drop-outs cannot be eliminated, the diagnostic valueof an MCE study is limited. However, in somecircumstances, it is not necessary to achievegood contrast signals in the entire myocardium.For instance, in a perfusion study for the as-sessment of the significance of an LAD stenosis,lateral dropout can be tolerated.
During stress an increase in myocardial signalintensity is observed. Due to an increase of
myocardial blood flow, myocardial opacifica-tion is seen at lower trigger intervals than in therest study. With real-time imaging, a corres-ponding reduction of contrast replenishmenttime is found. At rest it usually takes three ormore cardiac cycles to fill the myocardium,
115Perfusion Imaging
Fig. 27 Mean Doppler power in patients with nor-mal myocardial perfusion (four chamber view): notethe differences between the myocardial segmentsduring infusion of Levovist.
Fig. 28 Normal perfusion, harmonic power Doppler, two chamber view (infusion of Levovist). a) shows earlyLV filling during wash-in of contrast with some wall motion artifacts in the inferior wall. Note the lower greysignal intensities in the anterior wall compared to the inferior wall because of lower local acoustic power. Withoptimised dosing of contrast infusion (b), intense contrast signals are found in the entire inferior wall. Thedisplay of contrast in the anterior wall is excellent in the apical and mid segments but not in the basal segment.Courtesy of Gerd P Meyer, University of Hanover, Germany
a) b)
Kardio-Kap 3 for pdf 06.06.2000 18:26 Uhr Seite 115

whereas myocardial contrast is seen within asingle cardiac cycle during adenosine infusion.
A side-by-side display of the baseline and stressframes or loops is recommended when readingperfusion stress studies. The best approach forvisual assessment is the comparison of the samesegments at baseline and during stress. If weakor no signals are seen in a segment, one shouldcheck for echoes in the deeper-lying segments.With septal and inferior defects, the oppositewall can also be compared. Note that this pro-cedure does not work in reverse. If no strongsignals are detectable in the compared seg-ments, the diagnosis of a perfusion defect isnot safe.
3.9.1.2 Perfusion defectTo date, myocardial scintigraphy has been theonly clinical method to image myocardial per-fusion. Myocardial contrast echocardiographyaims to replace scintigraphic techniques andpartly uses the same kind of reading. However,display of myocardial perfusion is different forthe two modalities. Often scintigraphic defectsdo not match the size of MCE defects. Thepoor spatial resolution and the special process-ing of myocardial scintigraphy result in per-fusion deficits which usually extend over theentire thickness of the LV wall. It is known,though, that perfusion abnormalities ofteninvolve subendocardial layers with preservedflow in subepicardial layers. Due to its betterspatial resolution, MCE has provided for thefirst time display of subendocardial ischemia(Figure 29). It too is capable of showing patchyand transmural patterns of perfusion defects,however (Figure 30).
As with myocardial scintigraphy, perfusiondefects with contrast echo are classified as fixedor reversible. A fixed defect is marked by a
relative decrease in signal intensity comparedto the adjacent myocardium, visible at rest andduring exercise. It may be subendocardial ortransmural. The apparent degree of a perfusiondefect depends on the amount of contrast pre-sent in the vessels of normally perfused myo-cardium compared to the vessels within thehypoperfused area. Even in a scar after a trans-mural infarction, it will be seen that somevessels are visible. High amounts of contrastwithin these vessels may cause intense signalsand even blooming which may obscure thevisual delineation of the hypoperfused areas.Since the amount of myocardial contrast isdependent on the trigger interval and the infu-sion rate of the contrast agent, the display of aperfusion deficit is variable (Figure 31).Perfusion defects may decrease or even dis-appear with increasing contrast dose or triggerinterval! This is particularly true for harmonicpower Doppler studies where blooming ismore evident than with the other imagingmodalities. Careful evaluation of all imagessampled at different trigger intervals is manda-tory: frames with blooming or saturation mustnot be used for evaluation. Due to these limita-tions, the absolute size of a perfusion defectshould not be estimated. It is sufficient tospecify the segments in which contrast patternslook abnormal.
Reversible defects appear normal at rest butbecome visible during stress, where a markedincrease of signal intensity is observed in normalmyocardium, compared to a slight increase oreven a decrease in the defect area. Thus, duringpeak stress reversible defects show a relativedecrease in signal intensity compared toadjacent normal myocardium. Usually thedelineation is enhanced at lower trigger inter-vals, when normally perfused tissue exhibits amoderate or strong contrast enhancement. The
116 Handbook of Contrast Echocardiography
Kardio-Kap 3 for pdf 06.06.2000 18:26 Uhr Seite 116

117Perfusion Imaging
Fig. 29 Harmonic B-mode, four chamber view, continuous infusion of Levovist, post apical myocardialinfarction. a) Subendocardial perfusion defect. b) Transmural defect in corresponding plane of ThalliumSPECT at rest.Courtesy of Ricardo Ronderos, Universidad Nacional de La Plata, Argentina
Fig. 30 Real-time resting myocardial contrast studies using power pulse inversion imaging following 0.3mlOptison. (a) Normal patient. (b) Patient with an extensive resting apical perfusion defect due to previousinfarction. Power pulse inversion frame rates were 15Hz at an MI of 0.1– 0.15.Courtesy of Thomas Porter and Feng Xie, University of Nebraska, NE, USA
a) b)
a) b)
Kardio-Kap 3 for pdf 06.06.2000 18:26 Uhr Seite 117

118 Handbook of Contrast Echocardiography
Fig. 31 Harmonic power Doppler, four chamber view, infusion of Levovist. Example of shorter pulsing inter-val revealing apical perfusion defect. A defect is hardly visualised at 5:1 pulsing interval (a), but clearly visibleat 1:1 (b).
flow in perfusion beds distal to a significantcoronary stenosis is not changed by stress,therefore longer intervals are needed to opacifythe myocardium. With longer trigger intervalsthe hypoperfused volume of tissue stillcontains less microbubbles than the adjacentnormally perfused areas. However, the differ-ences in bubble concentration between normaland hypoperfused areas may not be sufficientlyhigh to provide adequate visualisation of theperfusion deficit, which can therefore be over-looked. Real-time perfusion imaging of replen-ishment following one or several destructionframes, provides multiple frames with different
concentrations of myocardial contrast. There-fore, the opportunity to create an optimal dis-play of a perfusion defect should be higherthan with triggered imaging. Clinical studiesare in progress to investigate this hypothesis.
Evaluation of the perfusion defects is furthercomplicated by effect of respiratory andscanhead movement on the signal intensities.Visual judgement should always be made usinga series of frames rather than single ones.Because of the high number of frames neededfor-side-by-side comparisons of rest and stressimages, arrangement of digitally stored data ona computer is most convenient. Having therecordings on a computer further facilitates theuse of advanced methods for quantitativeanalysis, which may complete the visual evalu-ation (see Chapter 4). Since conventional stressecho is often performed in conjunction with aperfusion study, acquisition analysis of MCErecordings is ideally implemented into thestress echo recording package on the scanner.
Calling a perfusion defect
A visually evident contrast defect is considered pre-
sent when there is a relative decrease in contrast
enhancement in one region compared with other
adjacent regions, which have the same or worse
imaging conditions.
a) b)
Kardio-Kap 3 for pdf 06.06.2000 18:26 Uhr Seite 118

119Perfusion Imaging
3.9.2 Visual assessment of post-processed recordings
Post processing of myocardial perfusion imagesis necessary when harmonic B-mode or pulseinversion imaging is used (Figure 32). This isbecause of the small incremental enhancementprovided by contrast over the backgroundtissue harmonic echo. Several offline imaginganalysis tools are available for this task, whichrequires digital recording of both baseline andcontrast enhanced images. Before subtractiontwo tasks must be carried out. First, grey levelsin the image, which are logarithmicallymapped from the echo level received by thescanner, must be converted to a linear scale. Ifthis is not done – for example if two imagesrecorded on videotape are simply subtracted –
the resulting image will depend on machinesettings, attenuation and other factors un-related to the amount of contrast in the myo-cardium, and essentially be meaningless.Second, the images must be aligned so that thesubtracted quantities correspond to the sameanatomic area. Because the heart has complexmovement and because the baseline andcontrast images are acquired at different times,this is not a trivial challenge. The process isdescribed in detail in §4.2.2.
3.9.3 Reporting visual judgement
We have developed reporting forms for per-fusion studies similar to those used in conven-tional stress echocardiography (Figure 33).
Normal perfusion Moderate or strong Moderate or strong signals
contrast enhancement at low trigger interval (1:1)
(score 2 or 3) at least at higher
trigger intervals (1:3 or 1:5) Increase of signal
(contrast enhancement in intensities at higher
basal segments may be poor) trigger intervals
Fixed perfusion defect No or poor contrast No or poor contrast
(Subendocardial or transmural) enhancement enhancement
(score 0 or 1)* (score 0 or 1)*
Reversible perfusion defect Moderate or adequate Poor signals at low
(subendocardial or transmural) contrast enhancement trigger interval (1:1)*
(score 2 or 3) at least
at higher trigger
intervals (1:3 or 1:5)
* Moderate or strong enhancement in adjacent segments with similar or worse imaging conditions
Rest Stress
Criteria for visual assessment of MCE studies
Kardio-Kap 3 for pdf 06.06.2000 18:26 Uhr Seite 119

120 Handbook of Contrast Echocardiography
First, the segments in each scanplane are evalu-ated for contrast enhancement using the threestep scoring as shown in §3.9.1. If a segmentcannot be evaluated because of wall motionartifacts or attenuation, it is marked with an‘X’. This is repeated for the rest and stressimages, which are then compared. To describethe changes between baseline and stress record-ings, a judgement is made as to whether thereis increased (+), decreased (-), no change (0) incontrast compared to baseline. If no signals arevisible in a segment at both baseline and stress,this segment cannot be used for assessment ofstress changes and is marked with an ‘X’.
Visual judgement is summarised using thefollowing statements:
1. Which segments can be evaluated? It is notalways necessary to have the information for theentire myocardium. If, for instance, the studyis performed to assess the hemodynamic rel-evance of an LAD stenosis, it is sufficient to seeseptal and anterior segments. In this casenormal or abnormal findings only pertain tothe LAD territory. This is different from myo-cardial scintigraphy, where perfusion is alwaysevaluated in the entire myocardium.
2. Judgement as to whether those segmentsseen are normal or abnormal according to thecriteria listed in the following Tables.
3. The results of the advanced methods foranalysis of myocardial contrast studies may be
Fig. 32 B-mode harmonic recordings (four chamber view) after background subtraction and colour coding,comparison with SPECT. Effect of increasing pulsing intervals of an anteroapical (a) and inferoposterior (b)myocardial infarction.Courtesy of Jonathan Lindner and Sanjiv Kaul, University of Virginia, Charlottesville, VI, USA
a)
b)
Kardio-Kap 3 for pdf 06.06.2000 18:26 Uhr Seite 120

121Perfusion Imaging
When is a perfusion defect real?
Criteria for a real perfusion defect (four chamber view)
Decrease of contrast enhancement in: compared to:
Apical septum Mid and basal septum, lateral wall
Mid septum Mid and basal lateral wall
Basal septum Basal lateral wall
Apical lateral wall Mid and basal lateral wall
Mid lateral wall Basal lateral wall
Basal lateral wall Not available
Criteria for a real perfusion defect (two chamber view)
Decrease of contrast enhancement in: compared to:
Apical inferior wall Mid and basal inferior wall, anterior wall
Mid inferior wall Mid and basal anterior wall
Basal inferior wall Basal anterior wall
Apical anterior wall Mid and basal inferior wall
Mid anterior wall Basal inferior wall
Basal anterior wall Not available
added to the report as soon there are referencevalues (see Chapter 4).
4. A brief indication as to which coronaryartery is thought to be involved.
3.10 Interpretation of myocardial contrast echo: clinical profiles
3.10.1 Acute myocardial infarction
In acute transmural myocardial infarctionthere is a high grade or complete reduction of
perfusion in a particular area of the myo-cardium. Therefore no, or only slight contrastwill be found in this area following intravenousinjection of the contrast agent (Figure 34). Aslong as there is complete occlusion of the epi-cardial vessel, the entire wall will show eitherno contrast signals or reduced filling if collateralblood flow is present. After restoration of bloodflow, contrast will fill in those areas with pre-served microvascular integrity, which is a pre-requisite for myocardial viability (Figure 35).Thus areas with complete necrosis will showno refilling with contrast after successful re-opening of the occluded coronary artery.Preliminary clinical studies have demonstratedthe usefulness of contrast echo in the evalua-tion of patients with acute myocardial infarc-tion (14, 15, 17, 36–42). Figure 36 shows a
Kardio-Kap 3 for pdf 06.06.2000 18:26 Uhr Seite 121

122 Handbook of Contrast Echocardiography
Fig. 33 Report form for visual assessment of a myocardial perfusion study.
Kardio-Kap 3 for pdf 06.06.2000 18:26 Uhr Seite 122

123Perfusion Imaging
Fig. 34 Harmonic power Doppler (apical two chamber view, Levovist infusion). Apical and anterior wall per-fusion defect (arrows) shown in anterolateral myocardial infarction.Courtesy of Folkert Ten Cate, Thoraxcenter, Rotterdam, Netherlands
flow chart for the use of contrast echo in thesetting of acute myocardial infarction.Although only preliminary clinical studies areavailable, the lack of effective alternatives forassessment of reperfusion may be sufficientjustification for using contrast echo if theguidelines for exclusion of false defects aretaken into account.
3.10.2 Scar or fibrosis versus viable myocardium
Necrotic tissue and the evolving scar are dis-played as fixed defects. They have no or mini-mal rest perfusion, because the microvascularnetwork has been damaged irreversibly duringischemia (Figures 37, 38, 39). In contrast, viablemyocardium – stunned or hibernating – still hasits microvascular network, which can be imaged
Fig. 35 Harmonic Power Doppler, four chamber view, Levovist infusion. Large apical defect in acute apico-septal infarction (a) and after successful reperfusion (b).Courtesy of Luciano Agati, University of Rome, Italy
a) b)
Kardio-Kap 3 for pdf 06.06.2000 18:26 Uhr Seite 123

using contrast echo. It should be rememberedthat contrast echo provides information onmicrovascular integrity, not myocyte function.Absence of signal in an infarcted area repre-sents no reflow or a fibrotic scar in the chronicphase. Whether the presence of contrast in themyocardium is an indicator of viabilityremains to be established. Studies using intra-arterial injections of contrast do suggest thatthe presence of signal in areas of damagedmyocardium indicates viability (15), but littledata are available for intravenous contrastimaging. Until trials establish ranges, evalua-tion of viability should be confined to differen-tiating between a definite lack of contrast anda strong and convincing contrast effect. Studiesmay be used in combination with othermethods such as low dose dobutamine stress orpositron emission tomography (PET).
It has been shown that the appearance ofcontrast and full filling may often be delayedmarkedly because the area of interest is sup-plied mainly by collaterals. Thus quantitativeanalysis should include longer trigger intervals(e. g. 1:10) to detect late filling.
3.10.3 Coronary artery stenosis
Perfusion defects during exercise, but normalperfusion at rest are the typical findings in thevisual assessment of significant coronarystenoses (see §3.9.1.2). Figures 40–43 showexamples with different imaging methods.Only with very severe stenosis is resting bloodflow reduced and the defect visible at rest. Inmoderate epicardial stenosis (50–85 percent),myocardial blood flow is maintained at restbecause the post-stenotic arterioles dilate.During exercise or pharmacological stress per-fusion defects can be displayed because theability to increase blood flow is reduced inregions supplied by coronary arteries with sig-nificant stenosis.
Reduction of myocardial blood flow is associ-ated with a reduction of myocardial bloodvolume. Since ultrasound contrast agents are
124 Handbook of Contrast Echocardiography
Fig. 36 Use of myocardial contrast echo in themanagement of acute transmural myocardial infarc-tion.
Fig. 37 Extended inferior infarction due to no reflowfollowing reopening of the right coronary artery, twochamber view, harmonic power Doppler. Dotted linerepresents endocardial border. Note the absence ofsignals in the papillary muscle and entire inferiorwall, compared to the signals in the anterior wall.There are only a few small epicardial vesselsdisplayed on the inferior wall (arrows).
Kardio-Kap 3 for pdf 06.06.2000 18:26 Uhr Seite 124

125Perfusion Imaging
pure intravascular tracers, the myocardialcontrast signals have been used as an estimateof myocardial blood volume. The prerequisitefor using contrast signals as an estimate of localblood volume is that the concentration ofmicrobubbles in the blood is not different inthe areas which are compared. This is true witha non-destructive imaging mode such as PPI.With a destructive bubble imaging techniquelike HPD myocardial contrast strength repre-sents myocardial blood volume only if longtrigger intervals are used (>1:5, see Chapter 4).
With shorter trigger intervals the speed ofreplenishment of the disrupted microbubblesheavily determines myocardial contrast signalstrength. During stress flow rate is increased in
Fig. 38 Apicoseptal scar following myocardial infarc-tion (harmonic power Doppler, four chamber view,Levovist infusion). Decreased signals in a thin suben-docardial layer (arrow) compared to subepicardiallayers.
Fig. 39 Myocardial perfusion imaging at rest in apatient with remote inferior myocardial infarction.Left panel shows venous myocardial contrast echo-cardiography, harmonic B-mode, Levovist infusion,pulsing rate 1:7, background subtraction and colourcoding. In the two chamber view a contrast defect ofthe inferior wall is visible. Corresponding verticallong axis on MIBI SPECT (b) shows missing traceruptake in the same region.Courtesy of Christian Firschke, Deutsches Herz-zentrum, Technische Universität München, Germany
Fig. 40 Schematic changes in fixed and reversibleperfusion defects in a two chamber view. Relativereduction of signal intensities is seen in the apicalmyocardium compared to the neighbouring segmentsat rest and during stress in a fixed defect, whereasthe reversible defect is displayed only during stress.Note the increase in myocardial opacification ob-served during stress in normal myocardium.
baselinerest
normal
reversible defect
fixed defect
contrastrest
contraststress
a) b)
Kardio-Kap 3 for pdf 06.06.2000 18:27 Uhr Seite 125

regions supplied by normal epicardial coronaryarteries and disrupted microbubbles are re-plenished during shorter time intervals than atrest. This is not possible in areas supplied bycoronary arteries with significant stenosis.
Thus, at short trigger intervals myocardialcontrast reflects flow, and is reduced in ische-mic segments compared to areas supplied bynormal coronary arteries.
126 Handbook of Contrast Echocardiography
Fig. 41 Normal response to adenosine stress (harmonic power Doppler, four chamber view). Note increasein myocardial signal intensities in the adenosine recording (b) over the baseline image (a).
Fig. 42 Myocardial perfusion imaging at rest andwith stress in a patient with a 58 percent diameterstenosis of mid LAD (segment 8) considered ofuncertain functional relevance. Small reversibletracer uptake defect of the apical myocardium(arrow) on TC99m Sestamibi SPECT: horizontal longaxis at rest (a) and with exercise (b). Correspondinghomogeneous myocardial contrast during intraveousinfusion of Levovist in the four chamber view at rest(c) and small contrast defect (arrow) during infusionof adenosine (d).Courtesy of Christian Firschke, Deutsches Herz-zentrum, Technische Universität München, Germany
a) b)
c) d)
a) b)
Kardio-Kap 3 for pdf 06.06.2000 18:27 Uhr Seite 126

127Perfusion Imaging
Fig. 43 Visual judgement of rest and adenosine stress images (harmonic power Doppler, four chamber view,trigger 1:3) in a patient with exertional chest pain using the report form presented in Fig. 29. Reduction ofapical contrast signal intensity and no increase in septal signal strength compared to marked enhancementin the lateral wall. Corresponding findings in a Sestamibi SPECT, coronary angiography revealed 90 percentproximal LAD stenosis.
3.11 Pitfalls andtroubleshooting
3.11.1 Inadequate myocardial contrast
Weak or absent myocardial contrast does notalways mean impaired myocardial perfusion,
but may be caused by technical problems. Forreliable evaluation of perfusion, a minimumquantity of microbubbles need to be present inthe myocardial vessels. However, completeabsence of myocardial contrast despite cavityenhancement is often caused by inappropriatemachine settings. Inadequate contrast doseshould be considered after scanplane and
Kardio-Kap 3 for pdf 06.06.2000 18:27 Uhr Seite 127

128 Handbook of Contrast Echocardiography
instrument controls have been re-checked (seeTable). Strong myocardial and cavity contrastsignals in the nearfield but inadequate signalsat greater depth are often caused by attenuationby the agent, which can be obviated by reducingthe rate of agent infusion. In some instances,however, focus position in the nearfield canresult in a similar contrast image.
Weak or absent myocardial contrast after aninitially adequate display may also be due todisplacement of the scanhead. Triggered imag-ing is a challenge for both the investigator andthe patient. Dyspnea during vasodilator stressand atypical chest pain cause deep breaths andloss of the imaging plane. In this situation it isnecessary to leave the triggered mode and touse continuous scanning to readjust the scan-plane (with harmonic power Doppler, har-monic B-mode should be used for optimisingthe scanplane). Beware that at high MI, thisprocess depletes the systemic level of the agentduring the infusion, to the extent that onemust wait for about two minutes for the con-trast level to recover before starting to scanagain. After readjustment of the scanplane,triggered imaging can be initiated to completethe protocol, discarding the first frame.
Appparent defects in the lateral wall often donot represent a real perfusion deficit, but in-adequate myocardial contrast. Similarly, false-positive defects may be found in the anteriorwall. Extracardiac attenuation by ribs and pul-
monary tissue may be the reasons for loweramounts of acoustic power being delivered tothe lateral wall in the four chamber view and theanterior wall in the two chamber view.Sometimes this is so severe that completeshadowing of the deeper-lying structuresoccurs. Shadowing is recognised by the abruptweakening of echoes distal to a point in thescan line. This shadowing line is often foundlaterally of the endocardial border and so issometimes only identifiable with the contrast
Weak/absent contrast in the entire myocardium
1. Check scanplane in harmonic B-mode
2. Check machine settings
3. Check venous line, stopcock
4. Check infusion pump: running, correct setting
If all are set correctly, increase infusion speed
Weak/absent myocardial contrast at greater depth
but strong signals in the nearfield
1. Check whether focus position is correct
2. Check for contrast shadowing, reduce infusion
speed if necessary
Weak/absent myocardial contrast after initial
adequate display
Displacement of the scanhead
Readjust during continuous harmonic B-mode
Check for systemic depletion of bubbles following
real-time imaging
Weak/absent myocardial contrast in the lateral
sectors of the imaging field
1. Rule out extra-cardiac shadowing (ribs,
pulmonary tissue)
2. Check myocardial grey level in harmonic B-mode
3. Adjust scanplane to show lateral structures in
centre of sector
4. Exclude attenuation by cavity contrast (reduced
intensity of cavity signals close to the lateral wall)
Troubleshooting for inadequatemyocardial contrast
• Inadequate myocardial contrast
• Contrast shadowing
• Blooming
• Wall motion artifacts
Pitfalls in myocardial contrast echocardiography
Kardio-Kap 3 for pdf 06.06.2000 18:27 Uhr Seite 128

129Perfusion Imaging
agent. If shadowing is detected, the scanplaneshould be modified using continuous har-monic B-mode so that the lateral wall iscentred in the imaging field. The aim is for thelateral and anterior walls to be displayed withgrey myocardium. However, difficulty with thelateral wall is common even when thesemeasures have been taken. An apparent isolateddefect in the lateral wall should thereforealways be treated with caution.
3.11.2 Contrast shadowing
Weak or absent myocardial contrast at greaterdepth when there are strong signals in the near-field is probably caused by cavity bubblesshadowing distal regions (Figures 44, 45).Shadowing by the contrast agent is a particularproblem for myocardial contrast echo, becausehigher concentrations of bubbles are needed.Those present in the nearfield attenuate thesound to the point that bubble disruption doesnot occur at greater depth. Thus the basalseptum (four chamber view), basal inferior wall(two chamber view) and particularly basal
lateral wall (four chamber view) can have‘pseudo’ defects in healthy subjects. Theproblem is more serious for parasternal thanfor apical views, because the ultrasound mustpenetrate both the RV and LV cavities to reachthe inferior or posterior LV wall. The RV mayattenuate more, because it contains largerbubbles wich have not been filtered by thelungs. So far there is no way to compensate forattenuation, but there are some guidelines forits reduction.
Most important is to use the lowest effectivedose of contrast. Particularly for quantitativeanalysis, it is an advantage not to have a brightmyocardium with large quantities of micro-bubbles. When the patient is scheduled for astress study a dramatic increase in signal inten-sity must be anticipated. The protocols pro-vided in the tables on pages 103, 104 and 107,108 aim for the highest sensitivity with thelowest doses of contrast. Since the optimal dosefor the individual cannot be predicted, itshould be determined empirically, and adjust-ment of a contrast infusion is the best way todo this. Note that changes in infusion rate takeup to two minutes to become effective, so
Fig. 44 Contrast shadowing due overdosing of contrast (a). With no power Doppler signals at greater depth,better penetration after reduction of infusion rate (b).
a) b)
Kardio-Kap 3 for pdf 06.06.2000 18:27 Uhr Seite 129

130 Handbook of Contrast Echocardiography
Fig. 45 False defect due to attenuation in the basal posterolateral wall using harmonic power Doppler mode(long axis view). (a) Defect using standard scanplane. After changing transducer position with posterolateralwall located closer to the centre of the sector, the false defect disappeared (b).
Fig. 46 Perfusion imaging artifacts: 63-year-old man with recent anterior MI and mid LAD occlusion, doubleframe triggered harmonic power Doppler, four chamber view. Notice the different scanplane with a larger LVcavity in frame two compared to frame one. Although consecutive frames are acquired, there has beenconsiderable cardiac movement in between due to the low frame rate of harmonic power Doppler. The basalseptal defect is caused by attenuation, the infarcted area is hardly visualised because of blooming or wallmotion artifacts.Courtesy of Jim Thomas, Cleveland Clinic, OH, USA
a) b)
Kardio-Kap 3 for pdf 06.06.2000 18:27 Uhr Seite 130
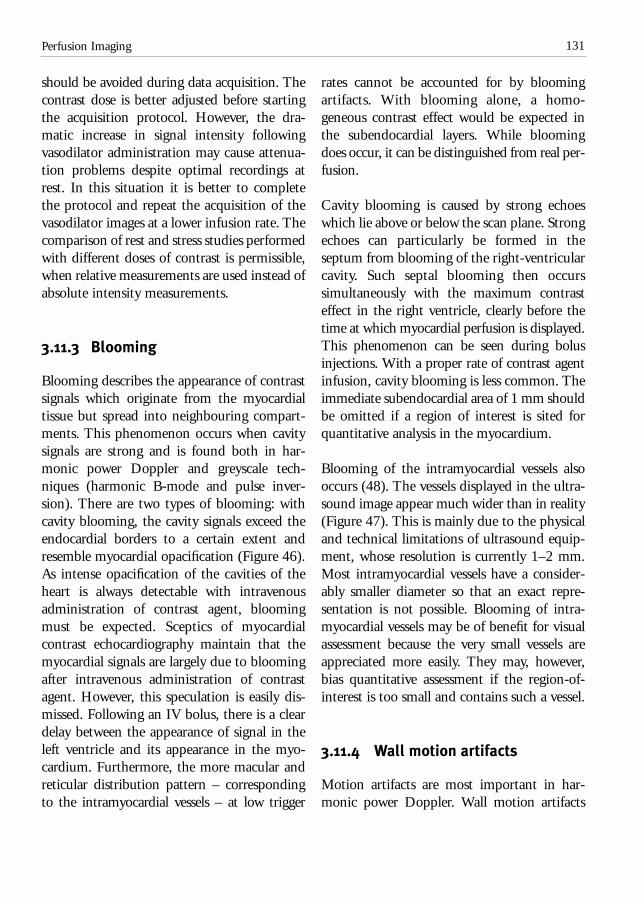
131Perfusion Imaging
should be avoided during data acquisition. Thecontrast dose is better adjusted before startingthe acquisition protocol. However, the dra-matic increase in signal intensity followingvasodilator administration may cause attenua-tion problems despite optimal recordings atrest. In this situation it is better to completethe protocol and repeat the acquisition of thevasodilator images at a lower infusion rate. Thecomparison of rest and stress studies performedwith different doses of contrast is permissible,when relative measurements are used instead ofabsolute intensity measurements.
3.11.3 Blooming
Blooming describes the appearance of contrastsignals which originate from the myocardialtissue but spread into neighbouring compart-ments. This phenomenon occurs when cavitysignals are strong and is found both in har-monic power Doppler and greyscale tech-niques (harmonic B-mode and pulse inver-sion). There are two types of blooming: withcavity blooming, the cavity signals exceed theendocardial borders to a certain extent andresemble myocardial opacification (Figure 46).As intense opacification of the cavities of theheart is always detectable with intravenousadministration of contrast agent, bloomingmust be expected. Sceptics of myocardialcontrast echocardiography maintain that themyocardial signals are largely due to bloomingafter intravenous administration of contrastagent. However, this speculation is easily dis-missed. Following an IV bolus, there is a cleardelay between the appearance of signal in theleft ventricle and its appearance in the myo-cardium. Furthermore, the more macular andreticular distribution pattern – correspondingto the intramyocardial vessels – at low trigger
rates cannot be accounted for by bloomingartifacts. With blooming alone, a homo-geneous contrast effect would be expected inthe subendocardial layers. While bloomingdoes occur, it can be distinguished from real per-fusion.
Cavity blooming is caused by strong echoeswhich lie above or below the scan plane. Strongechoes can particularly be formed in theseptum from blooming of the right-ventricularcavity. Such septal blooming then occurssimultaneously with the maximum contrasteffect in the right ventricle, clearly before thetime at which myocardial perfusion is displayed.This phenomenon can be seen during bolusinjections. With a proper rate of contrast agentinfusion, cavity blooming is less common. Theimmediate subendocardial area of 1 mm shouldbe omitted if a region of interest is sited forquantitative analysis in the myocardium.
Blooming of the intramyocardial vessels alsooccurs (48). The vessels displayed in the ultra-sound image appear much wider than in reality(Figure 47). This is mainly due to the physicaland technical limitations of ultrasound equip-ment, whose resolution is currently 1–2 mm.Most intramyocardial vessels have a consider-ably smaller diameter so that an exact repre-sentation is not possible. Blooming of intra-myocardial vessels may be of benefit for visualassessment because the very small vessels areappreciated more easily. They may, however,bias quantitative assessment if the region-of-interest is too small and contains such a vessel.
3.11.4 Wall motion artifacts
Motion artifacts are most important in har-monic power Doppler. Wall motion artifacts
Kardio-Kap 3 for pdf 06.06.2000 18:27 Uhr Seite 131

132 Handbook of Contrast Echocardiography
have already been mentioned in §3.6.1.1 as apitfall during contrast enhanced power Dopplerfor LV opacification, where they usually do nothave a great impact on endocardial borderdelineation. During assessment of myocardialperfusion, wall motion artifacts can distort thedisplay of myocardial contrast. They canmimic tissue perfusion signals if they are noteliminated by the pre-contrast settings.However, even after successful suppression ofwall motion artifacts at baseline some may beencountered during contrast enhancement.These may be due to unexpected respiratory orthoracic movement and occur with the contrastsignals from intramyocardial vessels. Suchartifacts are often confined to a few frames,which should be excluded from furtherprocessing.
Using short trigger intervals only the largervessels are filled with contrast. Their character-istic pattern is easy to distinguish from wallmotion artifact, which often is not confined tomyocardial tissue (Figure 48). At longer triggerintervals, perfusion contrast becomes morehomogeneous and recognition of wall motionartifacts more difficult. They can be recognisedas flash-like coloured areas (changing fromframe to frame) which often overlay epi- orpericardial layers of the lateral wall (four cham-ber view), but may be found in other regionssuch as near the mitral valve and the septum.Structures with high backscatter and fastmovement parallel to the beam are prone toproduce motion artifacts, which are oftentherefore found in fibrotic pericardial layersand perivalvular tissue.
Fig. 47 Vessel blooming in harmonic power Doppler in a patient with previous apicoseptal infarction (fourchamber view). (a) shows recording at a trigger rate of 1:1 with display of blooming intramyocardial vessels –particularly in the lateral wall. (b) A homogenous myocardial contrast pattern is found in the lateral wall using1:4 trigger rate due to additional filling of small intramyocardial vessels. Notice the reduced contrast in theseptum compared to the lateral wall.
a) b)
Kardio-Kap 3 for pdf 06.06.2000 18:27 Uhr Seite 132
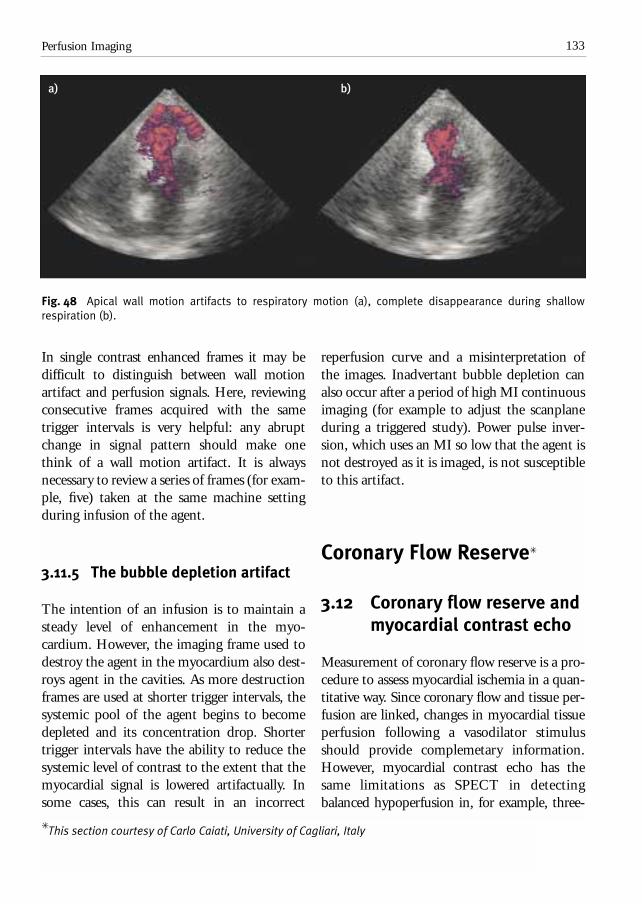
133Perfusion Imaging
Fig. 48 Apical wall motion artifacts to respiratory motion (a), complete disappearance during shallowrespiration (b).
In single contrast enhanced frames it may bedifficult to distinguish between wall motionartifact and perfusion signals. Here, reviewingconsecutive frames acquired with the sametrigger intervals is very helpful: any abruptchange in signal pattern should make onethink of a wall motion artifact. It is alwaysnecessary to review a series of frames (for exam-ple, five) taken at the same machine settingduring infusion of the agent.
3.11.5 The bubble depletion artifact
The intention of an infusion is to maintain asteady level of enhancement in the myo-cardium. However, the imaging frame used todestroy the agent in the myocardium also dest-roys agent in the cavities. As more destructionframes are used at shorter trigger intervals, thesystemic pool of the agent begins to becomedepleted and its concentration drop. Shortertrigger intervals have the ability to reduce thesystemic level of contrast to the extent that themyocardial signal is lowered artifactually. Insome cases, this can result in an incorrect
reperfusion curve and a misinterpretation ofthe images. Inadvertant bubble depletion canalso occur after a period of high MI continuousimaging (for example to adjust the scanplaneduring a triggered study). Power pulse inver-sion, which uses an MI so low that the agent isnot destroyed as it is imaged, is not susceptibleto this artifact.
Coronary Flow Reserve✳
3.12 Coronary flow reserve and myocardial contrast echo
Measurement of coronary flow reserve is a pro-cedure to assess myocardial ischemia in a quan-titative way. Since coronary flow and tissue per-fusion are linked, changes in myocardial tissueperfusion following a vasodilator stimulusshould provide complemetary information.However, myocardial contrast echo has thesame limitations as SPECT in detectingbalanced hypoperfusion in, for example, three-
a) b)
✳ This section courtesy of Carlo Caiati, University of Cagliari, Italy
Kardio-Kap 3 for pdf 06.06.2000 18:27 Uhr Seite 133

134 Handbook of Contrast Echocardiography
vessel disease, small vessel disease, leftventricular hypertrophy and assessment ofgradual changes in perfusion. Here, we discussa technique which has been validated in a seriesof clinical studies. It provides reliable measure-ments of coronary flow reserve in the LADusing pulsed wave Doppler echocardiography.While corresponding quantitative measure-ments are being developed for myocardialcontrast echocardiography, assessment of CFRhas an important role in the diagnosis of myo-cardial ischemia.
3.12.1 What is coronary flow reserve?
Absolute coronary flow reserve represents themaximal possible increase of flow that canoccur in a single coronary vessel (49).Coronary flow reserve is usually expressed asthe ratio of maximal to basal flow. Since flow isdirectly related to the driving pressure andinversely related to resistance (Poiseuille’s law),maximal flow can be elicited by drugs such asadenosine and dipyridamole which lowerresistance by vasodilating the coronary tree.
These drugs act in two ways. First, a directendothelium-independent mechanism, vaso-dilates the coronary microvessels of less than170 µm in diameter, where 70 percent of totalcoronary resistance occurs. Second, a flow-mediated endothelium dependent mechanismvasodilates the coronary arterioles proximal to170 µm in diameter, where 25 percent of totalcoronary resistance occurs (50).
3.13 Available methods – need for contrast enhancement
In the clinical setting CFR is usually measuredusing one of two approaches: either invasiveintracoronary Doppler (51, 52) by catheter or transducer-tipped angioplasty guide wire, or non-invasively by quantitative positronemission tomography (PET) (51). The formermeasures velocity while the latter measuresabsolute myocardial flow. Both methods areprecise, but limited in their clinical applicability.The intracoronary Doppler flow wire is perfor-mable only with catheterisation, implies a cer-tain risk for the patient and is expensive. Forthese reasons it is not easily performable andespecially not repeatable. The major limita-tions of PET scanning are its scarcity, its costand radiation exposure to the patient. Becauseof the clinical importance of CFR there is aneed for a simple, non-invasive, repeatable andinexpensive tool capable of this functionalevaluation.
Transesophageal Doppler echocardiography(TEE) was proposed some years ago as a semi-invasive tool for measuring CFR by blood flowvelocity in the proximal LAD at baseline andafter maximally lowered coronary resistancewith dipyridamole (52). There is no doubt that
Definition: Ratio of maximal to basal flow
Normal values: More than 2.0
Causes of reduction: 1. Coronary artery stenosis
> 50 percent lumen
reduction
2. No coronary stenosis, eg
Syndrome X
Hypertensive heart disease
Hypercholesteremia
Diabetes
Coronary flow reserve
Kardio-Kap 3 for pdf 06.06.2000 18:27 Uhr Seite 134

135Perfusion Imaging
TEE evaluation of CFR offers considerablediagnostic potential. However, broader appli-cability of this new technique has been ham-pered by three major limitations: 1) inability toobtain an adequate Doppler signal in allpatients; 2) only pre-stenotic CFR is measur-able (sampling is obtained few millimetresbehind the main left coronary artery bifurca-tion); 3) the semi-invasiveness of esophagealintubation, which makes the approach quiteunpopular with patients.
The first of the three above mentioned limita-tions has been overcome to a great extent bythe utilisation of echocontrast agent capable ofincreasing Doppler signal intensity and signalto noise ratio not only in cardiac cavities, butalso in coronary arteries after intravenous in-jection (53, 54). The second has been solved bythe combined use of second harmonic imagingand contrast agents (55), which together makecoronary flow velocity and flow reserve feasibleby the transthoracic approach (56–60).Diagnostic signals are assessable in only 55percent of patients before contrast and inalmost all patients after contrast enhancement.The transthoracic measurement of CFR in theLAD concurs very closely with Doppler flowwire CFR measurements. The reproducibilityof CFR measurements is high. The 95 percentconfidence interval for variation between thetwo measurements is -0.32 to +0.32. Thus,contrast enhanced transthoracic Doppler pro-vides feasible, reliable and reproduciblemethod for assessment of CFR in the LAD.
3.14 Coronary flow reserve: indications and selection of methods
Since CFR measurements are confined to midand distal LAD, isolated use of CFR toevaluate myocardial ischemia is not warrantedin patients with an unknown coronary angio-gram. CFR may be used in conjunction withmyocardial contrast echo. Both techniquesneed the same kind of preparations and use thesame stress protocols (infusions of contrast anda vasodilator). The additional time for sampl-ing the LAD flow is a minor issue compared tothe more time consuming recording of tissueperfusion. However, if an LAD lesion is pre-sent, diagnostic confidence is improved whentwo different approaches are used.
CFR measurements have special relevance aftercoronary angiography. In the case of an LADstenosis it can be used for integrating anatomicinformation by catheter or for serial examina-tion of patients undergoing angioplasty of theLAD (60). For this indication isolated use ofCFR might be considered to save contrastagent, as it requires somewhat less agent thanperfusion measurements. One of the mainadvantages of this method over the traditionalnon-invasive stress tests such as stress echo orstress myocardial scintigraphy in following-upan LAD angioplasty is its quantitative informa-tion. As a consequence, even sub-clinical,subtle modification of the functional status ofthe dilated LAD might be unveiled.
Normal coronary arteries in patients with chestpain and/or positive stress test are anothersituation where CFR should be assessed. Theclinical syndrome of ‘coronary insufficiencywith normal coronary arteriogram’ is found in
Kardio-Kap 3 for pdf 06.06.2000 18:27 Uhr Seite 135

136 Handbook of Contrast Echocardiography
approximately 10–20 percent of patients withexercise-induced coronary insufficiency. Anabnormal CFR finding confirms the cardiacorigin of the chest pain and rules out falsepositive stress testing. CFR can be impaired bya variety of disorders of the microcirculation.Pharmacologic interventions of these disorderscan be easily assessed by CFR measurement.Diabetes, arterial hypertension or hyperchole-steremia, for example, are associated withimpaired CFR (61–63).
3.14.1 Selection of patients
A suboptimal ultrasound window, a majorconcern in any ultrasound approach, does not
reduce the feasibility of CFR measurements ifthe combination of second harmonic imagingand a contrast agent is used. In our experiencethe feasibility of almost 100 percent has beenconfirmed in large series of patients includingthose with large body habitus (59, 62).
Contrast enhancement should always be usedeven when good Doppler quality is achieved atbaseline without enhancement. Contrast helpsmaintain good monitoring of the Dopplersignal from the LAD during hyperemia, wherevasodilators induced hyperpnea and tachycar-dia make an adequate blood flow Dopplerrecording more difficult. In cases with goodsignal at baseline a very small amount ofcontrast can be used just for the hyperemicportion of the study.
Clinical methods to assess CFR
Positron emission Non-invasive, global and Scarce
tomography (PET) regional myocardial perfusion Radiation exposure
reserve objectively assessable Expensive
Intracoronary Precise post-stenotic CFR
Doppler flow wire assessement
Evaluation of relative and Invasive and risky
fractional coronary flow reserve Expensive
Difficult to repeat
Transesophageal Widely available Semi-invasive
Doppler Limited prediction of
echocardiography (TEE) coronary stenosis
Limited to LAD
Transthoracic Non invasive, widely available Limited to LAD
contrast Doppler Optimal prediction of coronary
echocardiography stenosis
Technically feasible with harmonic
contrast imaging
Pros ConsMethodology
Kardio-Kap 3 for pdf 06.06.2000 18:27 Uhr Seite 136

137Perfusion Imaging
3.15 How to perform a CFR study
3.15.1 Intravenous lines
Two intravenous lines are needed for studiesusing adenosine as vasodilator. An indwellingcannula (20 gauge or less) is inserted into acubital vein for the infusion of the contrastagent. Another line is necessary for infusion ofadenosine, this line can have a smaller size (22gauge). Interactions between adenosine andcontrast agents are unlikely, but have not beensystematically evaluated so far. Thus infusingadenosine and contrast agent via the same linecannot be recommended. If dipyridamole isused for induction of hyperemia, only onevenous line is needed, because the vasodilatoreffect persists after dipyridamole has beeninfused and simultaneous infusion with theecho contrast agent is not necessary.
3.15.2 Contrast agent
All available contrast agents can be used toenhance Doppler signals. Infusion of thecontrast agent is necessary to maintain thesame level of contrast enhancement duringbaseline and hyperemia. This method ofadministration has the advantage of maintain-ing enhancement over several minutes, withoutaffecting the peak intensity that is attained. In comparison to myocardial contrast echo,doses of echo contrast are much lower.Anexample of a dose regimen for Levovist is:one vial prepared using a concentration of300 mg/ml. The agent is administered byinfusion using an infusion pump connectedover a special 50-cm connector tubing. Theinitial infusion rate is 1 ml/min. This rate canbe increased to a maximum of 2 ml/min ordecreased to a minimum of 0.5 ml/min,according to the quality of the Doppler signalobtained.
3.15.3 Protocols to induce hyperemia
The dipyridamole and adenosine protocolswhich are established for regular stress echo andSPECT are useful for assessment of CFR too(see Figures 49, 50). For dipyridamole, only onevenous line is necessary but more contrastagent is needed: because of the delay betweenthe start of the drug and achieving completevasodilatatory effect (6–8 minutes for the low
Indications for transthoracicDoppler of LAD flow
• Before coronary angiography
Suspected LAD stenosis (previous anterior
infarction, stress ECG, stress echo, myocardial
scintigraphy)
Myocardial contrast echo
• After coronary angiography – LAD stenosis
Significance of stenosis
(in combination with myocardial contrast)
• After coronary angiography – normal coronary
arteries
To confirm cardiac origin of chest pain
To control therapeutic interventions
CFR in the ‘difficult’ echo patient
CFR measurements can be performed in patients
with poor windows where myocardial contrast
echocardiography is not recommended
Kardio-Kap 3 for pdf 06.06.2000 18:27 Uhr Seite 137

138 Handbook of Contrast Echocardiography
dose and 12–14 min for the high dose), twoseparate contrast infusions need to be given.This also implies that LAD flow needs to be re-imaged during dipyridamole as the spot isusually lost at the end of the contrast enhance-ment for the baseline acquisition.
Intravenous adenosine (140 µg/kg/min over 6 minutes) seems superior to dipyridamole.First, adenosine acts rapidly, achieving peakeffect in about 55 seconds compared to about100 seconds with dipyridamole (64). Thisshortens the hyperemic part of the study to2–3 minutes so that a single contrast infusionof 11 ml volume is sufficient for all of theexamination. Second, because the enhance-ment of the Doppler signal is obtained withoutinterruption, the Doppler recording is moreeasily and accurately performed. Third, unlikedipyridamole, adenosine in doses >100 µg/kghas been shown to be nearly equivalent topapaverine to produce maximal coronary vaso-
dilation. Fourth, the short duration of theexamination combined with the promptreversibility of the side effects, if any, aftertermination of the infusion make this drug safeand acceptable to the patient. The only short-comings of adenosine are 1) the need of twointravenous lines, 2) the higher cost, and 3) thefrequently induced hyperpnea. Hyperpnea,however, may be disturbing for the patient, butrarely causes degradation of image quality.
Steps to perform a CFR study
1. Insert an indwelling cannula (20 gauge) into a
cubital vein. Connect the line for contrast infusion
2. Insert an indwelling cannula (22 gauge or more)
into a forearm vein (only for adenosine). Connect
the line with adenosine infusion
3. Prepare contrast agent and adenosine infusion
4. Search for LAD flow using fundamental colour
Doppler
5. Start contrast infusion
6. Search for LAD flow using harmonic colour Doppler
7. Switch to fundamental (harmonic) PW Doppler,
record LAD flow at rest
8. Start adenosine infusion
9. Record LAD flow during hyperemia
Fig. 49 Protocol for dipyridamole stress,DIP1 = 0.56 mg/kg over 4 minutes, DIP2 = 0.28 mg/kg over 2 minutes
Fig. 50 Adenosine protocol for CFR studies
Kardio-Kap 3 for pdf 06.06.2000 18:27 Uhr Seite 138

3.15.4 Image orientation for visualising blood flow in the LAD
A systematic attempt must be made to recordflow in the distal or in the mid part of the LAD(Figure 51). The approach for the distal partconsists first in obtaining a short axis of the leftventricular apex and of the anterior groove.Thereafter, a search for coronary flow in theanterior groove is started. When a diastolicflow, circularly-shaped vessel is recognised inthe anterior groove area, it is brought into thecentral part of the ultrasound field by anglinglaterally and slightly above the central ray ofthe scan plane. At this point, the transducershould be rotated counterclockwise to obtainthe best long axis colour view. Alternatively, inorder to achieve a better alignment betweenflow and the ultrasound beam, a modified
foreshortened two chamber view can be ob-tained by sliding the transducer superiorly andmedially from an apical two chamber position.In this way visualisation of the epicardial partof the anterior wall is obtained with less pul-monary interference. The mid part of the LADis visualised by a low parasternal short axis viewof the base of the heart modified by a slightclockwise rotation of the beam in order tobring into view the anterior groove area andthereby the mid portion of the LAD that runsover the left border of the right ventricular out-flow tract (post-pulmonary tract). Pulsed waveflow Doppler recording in the LAD is firstattempted at baseline in fundamental mode,and after contrast in harmonic mode.
3.15.5 Instrument settings
All the setting adjustments described here havebeen established using the Acuson Sequoiasystem. First, regular tissue harmonic modewith the default settings is used to obtain ashort axis of the left ventricular apex and of theanterior groove. Then fundamental colourDoppler is used to search the LAD. As soon asLAD flow has been identified, the contrastinfusion is started and harmonic colourDoppler mode initialised. The harmoniccolour Doppler setting should be adjusted to maximise scanning sensitivity withoutreducing the frame rate. The pulse repetitionfrequency is decreased by changing the colour Doppler velocity scale (between 11 and25 cm/s), gate size should be maximallyincreased, gain increased until noise begins toappear faintly and colour Doppler box sizekept small. Colour transmit power is turned upto the maximum level. Increasing ultrasoundenergy to maximum level (destruction mode) isimportant during contrast administration in
139Perfusion Imaging
Fig. 51 Plane orientation for acquisition of LADflow: the mid part of the LAD is visualised by a lowparasternal short axis view of the base of the heartmodified by a slight clockwise rotation of the beam inorder to bring into view the anterior groove area.
Kardio-Kap 3 for pdf 06.06.2000 18:27 Uhr Seite 139

140 Handbook of Contrast Echocardiography
order to maximise harmonic production by themicrobubbles and so for optimising coronaryflow recording with harmonic colour Doppler.
With fundamental spectral Doppler, gain andtransmit power are slightly reduced (-4 and -7 dB respectively) in order to avoid excessive
spectral blooming during contrast administra-tion. During contrast administration thissetting does not generally need to be modifiedexcept on some occasions where, duringspectral recording transmit power needs to belowered a little in order to reduce disturbingvertical spikes caused by ultrasound breaking
Transducer NormalScanning modality Tissue harmonic Transmit power Maximum (0 dB), as optimised for tissue harmonicsGeneral gain Default (0 dB)TGC Keep low; (high B-mode gain hampers colour flow display)Depth Reduce depth (to increase frame rate)
Transducer NormalScanning modality Fundamental velocity colour Doppler (2.5 MHz)Transmit Power Maximum (0 dB)Sample volume size Maximum (3) (to increase sensitivity)Gain Set high, at the level at which noise begins to appear faintly Colour Doppler box size Keep as small as possible (to increase frame rate)Pulse repetition frequency Decrease to improve sensitivity (velocity range 14-18 cm/s) (PRF)
Transducer NormalScanning modality Harmonic colour Doppler (1.7 MHz transmit/3.5 MHz receive)Transmit Power Maximum (0 dB) (destruction mode)Gain Unchanged or slightly reducedColour Doppler box size UnchangedPulse repetition frequency Unchanged or a little increased (to reduce flash artifacts(PRF) caused by the increased heart rate)
B-mode and colour Doppler for CFR: settings
B-Mode:
Colour Doppler before contrast:
Colour Doppler after contrast:
Kardio-Kap 3 for pdf 06.06.2000 18:27 Uhr Seite 140

141Perfusion Imaging
bubbles, the so called ‘bubble noise’ phenom-enon (see §3.17.4). To measure coronary flow,colour flow imaging is used as a guide. Samplevolume is positioned at the location of thevessel. Because of the absence of ventricularcontraction in diastole, the position of the leftanterior descending coronary artery is morestable in this part of the cardiac cycle, thusfacilitating sample volume positioning.
3.15.6 Combination with myocardial contrast echo (MCE)
CFR measurements may be made in conjunc-tion with myocardial contrast echocardio-graphy. For this purpose the MCE study has tobe performed with an adenosine infusion. After
the MCE protocol has been completed, theadenosine infusion and contrast infusion aremaintained and LAD flow is recorded. Usuallytransmit power needs to be reduced to avoidblooming and saturation of the LAD flowsignals. Afterwards adenosine infusion isstopped but the contrast infusion continuedand 20 seconds later the baseline LAD flow isrecorded. This procedure can be performedwithin one minute, if the right plane for inter-rogating the LAD is quickly found. With somepractice the sonographer will be able to easilyfind the LAD, because the colour and PWsignals are very strong during contrastenhancement. The time to search for the LADcan further be reduced if the sonographer hasidentified the imaging plane during the base-line study.
Transducer 2–3 MHz sectorScanning modality Fundamental (2.5 MHz)Sample volume size 4 mmTransmit power From –4 to –7 dBGain From –4 to –7 dBDynamic range Default (50 dB)
Transducer 2–3 MHz sectorScanning modality Fundamental (2.5 MHz)Sample volume size 4 mmTransmit Power Unchanged or slightly reduced (to reduce “bubble
noise”)Gain Unchanged or a slightly reduced (to reduce blooming)Dynamic range Default (50 dB)
Spectral Doppler for CFR: settings
Spectral Doppler before contrast:
Spectral Doppler after contrast:
Kardio-Kap 3 for pdf 06.06.2000 18:27 Uhr Seite 141

142 Handbook of Contrast Echocardiography
3.16 Image acquisition and interpretation
Once adequate Doppler spectra are visible,recordings are started. It is useful to store ashort period in colour mode with the cursorand sample volume in the LAD, to establishthe Doppler angle, which must remain con-stant. For PW Doppler, at least five framesshould be stored on videotape and/or cineloop.Recording of hyperemic flow velocity by PWDoppler is started as soon as the colour signalshows an increase in velocity, or in any case,
within two minutes of the beginning of theadenosine infusion. It is continued until the 5th
minute. If the Doppler angle or LAD segmentappears different during the infusion to thatseen at baseline, a new baseline velocity record-ing must be made. This can be done fiveminutes after the end of the infusion. It is bestto maintain monitoring throughout the wash-out phase.
The recordings are analysed offline using thetools available in every Doppler system (Figure52). Velocity-time integrals (VTI) are obtainedby tracing the envelope of the Doppler spectra.
Fig. 52 Contrast enhanced pulsed wave Doppler tracings of LAD flow at rest (top) and during adenosineinfusion (bottom). CFR is assessed by tracing the envelope of the Doppler spectra and calculating the velocity-time integrals. The ratio of adenosine to baseline data represents CFR.Courtesy of Heinz Lambertz, Deutsche Klinik für Diagnostik Wiesbaden, Germany
Kardio-Kap 3 for pdf 06.06.2000 18:27 Uhr Seite 142

143Perfusion Imaging
An average of at least 3 cardiac cycles is made.The ratio of VTI during hyperemia to the VTIat baseline is the coronary flow reserve. If aCFR > 2.0 is considered normal and CFR < 2.0 abnormal, the sensitivity and specificityfor detecting a >75 percent diameter LADstenosis is 91 and 76 percent respectively.
3.16.1 Significance of an LADstenosis
Coronary angiography provides little insightinto the physiological significance of coronarystenoses, especially those of intermediateseverity (65). Understanding functionalimpact of a stenosis is important for clinicaldecision making, as PTCA can be deferredsafely in patients with intermediate stenosisbut an adequate CFR value (66) as shown onFigure 53.
Coronary angiography (Figure 53 a) showed anapparently significant stenosis in the mid-LAD. In order to confirm its functional sig-nificance, a TTE CFR was performed (Figure53 b) which showed a normal CFR. This was
in agreement with adenosine/baseline 99 mTc-Sestamibi SPECT that did not show anyreversible perfusion defect.
3.16.2 Follow-up of an LAD stenosis after PTCA
After PTCA, CFR recovers dramatically,reaching the lower limit of the normal range.The baseline diastolic/systolic ratio also returnsto normal. The normalisation of diastolic/systolic ratio after PTCA could be a morespecific index for successful recanalisation thanCFR since CFR can still be depressed immedi-ately after intervention (so-called ‘micro-circulation stunning’) (67). Figure 54 is a typi-cal example. Before PTCA the CFR was flat; inaddition the ratio of the diastolic to systolicvelocity is 1 (which is abnormal). After PTCAthe ratio increased.
3.17 Pitfalls and trouble-shooting
3.17.1 Angle of the vessel to the beam
One of the basic assumptions of the method isthat the Doppler angle is kept constantthroughout the examination. One way to reachthis goal is to maintain the same view through-out the examination with no interruption ofimaging. In this respect the use of adenosineprotocol has eased the method enormously.However, in some cases there can still be someuncertainty. It is a good idea to check theconstancy of the Doppler angle by verifyingthat the depth of the sample volume is thesame throughout the examination. This onlymakes sense if the tomographic plane does not
Fig. 53a Coronary angiogram in a patient with pro-longed chest pain: 60 percent stenois in the mid LAD(arrow)
Kardio-Kap 3 for pdf 06.06.2000 18:27 Uhr Seite 143

change. If during hyperemia the Doppler angleor the LAD segment in the colour imageappears different to that visualised at baseline,a new baseline velocity recording should bemade in the wash-out phase. This manouvreworks better with adenosine because of itsrapid reversibility.
3.17.2 Displacement of the sample volume
It is important that a CFR measurement ismade in the post-stenotic territory. Post-stenoticCFR is much more accurate than pre-stenoticCFR in assessing the residual vasodilatorycapacity of the vascular bed caused by a nar-rowed coronary artery (68). In fact, coronaryflow reserve measured in regions with branchesproximal to the lesion is unreliable becauseflow is concurrently assessed for regions ofvarying vasodilatatory reserve, so that the resultreflects a weighted average of these potentiallydisparate zones.
The measurement of CFR can also be invali-dated if it is taken at the stenosis site itself.Worse still, one can measure blood flow vel-ocity in one segment of the artery at baselineand, with the effect of tachycardia and hyper-pnea, in a slightly different segment duringhyperemia. If a stenotic jet is inadvertentlyimaged only during stress, a false-normal CFRcan result. To avoid these problems, it is usefulat baseline to explore a tract of the artery as longas possible and check that the flow is homo-geneous. If abnormally high flow is detected inone portion of the artery, the sample volumeshould be placed as distally as possible from thestenosis site, making sure that in the new loca-tion flow velocity is in the normal range. Thisposition should be maintained throughout theexamination.
3.17.3 Flow in the mammary artery
Flow in mammary artery can be mistaken forcoronary flow. It can, however, easily be recogn-
144 Handbook of Contrast Echocardiography
Fig. 53b Transthoracic contrast enhanced PW Doppler: Normal increase of LAD flow during adenosine infusion
Kardio-Kap 3 for pdf 06.06.2000 18:27 Uhr Seite 144

145Perfusion Imaging
Fig. 54 CFR measurements before and one week after PTCA of a subocclusive proximal LAD stenosis. BeforePTCA (top panel) the spectra of LAD flow were flat with a ratio of the systolic to the diastolic velocities of one.Almost no change was found between baseline (left) and adenosine recordings (right). After PTCA (bottompanel) the typical pattern of normal coronary flow is recorded with higher velocities in diastole than in systole.
ised by its lack of cardiac motion and by the pre-valent systolic velocity component of itsDoppler signal.
3.17.4 Bubble noise
Small bubbles enhance the Doppler signalwithout affecting the echo statistics, so that thecharacter of the spectral Doppler sound doesnot change. Larger bubbles, on the other hand,
pass through the sensitive volume as single,highly reflective scatterers and create transientswhich are readily heard as ‘popping’ sounds.They give rise to the familiar bidirectional‘spike’ in the Doppler spectrum (Chapter 1).The same effect is also caused by bubbleswhich are disrupted by the ultrasound pressureas they pass through the sample volume.Agents such as Levovist, as they disintegrate inthe blood stream, appear to aggregate intolarger collections of gas, which are capable of
Kardio-Kap 3 for pdf 06.06.2000 18:27 Uhr Seite 145

146 Handbook of Contrast Echocardiography
producing this artifactual echo appearance inthe wash-out phase. The PW Doppler record-ings in Figure 55 show the typical spikes of anair based agent which is breaking up as a resultof its passage through the heart and lungs.Bubble noise can be avoided by reducing thetransmit power (that is the MI, not the gain!).
3.17.5 Interpretation problems: impact of preload
Increase of preload caused by aortic or mitralregurgitation, anemia, high cardiac output, etc.
reduces CFR by increasing basal flow throughan increase in oxygen consumption. On theother hand, an increased heart rate reducesCFR by increasing basal flow and at same timedecreasing maximal flow (69). Thus, anyreduction of absolute CFR must always beinterpreted in the light of the hemodynamicconditions. A general increase of basal flowvelocit, is often detectable in these circum-stances.
3.17.6 Impact of blood pressure
Blood pressure has little effect on CFR sincealterations in aortic pressure within the limitsof autoregulation produce parallel increases inbasal and maximal coronary flow, so that CFRremains the same (69). This is true if bloodpressure variations affect both baseline andhyperemia in a uniform way. However, a dropin blood pressure can occur only in the hyper-emic part of the study as a consequence of theadenosine effect on systemic arterial resistance.When this occurs, even small blood pressure
Pitfalls in CFR measurement
Technical problems
• Angle of the vessel to the beam
• Displacement of the sample volume
• Inadvertant scanning of internal mammary artery
• Bubble noise
• Impact of preload, blood pressure, vasodilation
Fig. 55 Bubble noise: the Doppler spectrum is composed of a series of spikes which represent disruption ofthe microbubbles.
Interpretation problems
Kardio-Kap 3 for pdf 06.06.2000 18:27 Uhr Seite 146

variations can induce large variation of maxim-al coronary blood flow since, with the removalof autoregulation by adenosine, the relationbetween blood flow and blood pressurebecomes very steep (69). CFR can therefore beaffected profoundly by adenosine-inducedblood pressure variations. Blood pressure mustalways be monitored carefully even though sig-nificant adenosine-induced blood pressurevariation, in our experience, affects less than 10percent of patients. A variation of more than30 mm Hg in blood pressure during adenosinewith respect to baseline invalidates the CFRmeasurement.
3.17.7 Vasodilation during hyperemia
One reason for errors in assessing coronaryflow reserve with this Doppler method andadenosine could be flow-mediated dilation ofthe epicardial vessels during hyperemia (70). Ifthis phenomenon should occur, CFR as thesimple ratio of two velocities would underesti-mate true coronary flow reserve, since maximalvelocity would be reduced as consequence ofvasodilatation. Current knowledge suggeststhat this effect is limited in patients witharteriosclerosis and intravenous application ofadenosine and dipyridamol, but further studiesare needed to shed more light on this issue.
3.18 Summary
For echocardiography, contrast agents presenta unique opportunity to add assessment ofmyocardial perfusion to the examination of the patient with ischemic disease. From atechnical point of view, the examination is achallenging one which requires both training
and experience. There is no question that asthe technology of both the contrast agents andthe imaging instruments improve, so theexamination will become easier to perform.The advent of real-time, low MI perfusionimaging is one of the most significant advancesin this regard. Triggered harmonic powerDoppler remains the most sensitive availablemethod, but it is hampered by very low frame-rates and the challenge of recognising andminimising motion artifact. The integration ofthese techniques with the stress echo is funda-mental to its success and initial experience isvery promising. There is every reason to expectthat real-time contrast perfusion stress echowill be a routine procedure in the near future.Quantitative assessment of coronary flowreserve from contrast enhanced measurementof velocity in apical vessels is a well-validatedstress procedure that can provide informationthat is more limited in anatomic domain buteasier to acquire than perfusion imaging. Withboth these methods, contrast ultrasound offersthe opportunity to provide quantitative per-fusion information previously unavailable in asimple, real-time procedure.
3.19 References
1. Marcus ML. Anatomy of coronary vasculature. In: Marcus ML (editor) The coronary circulation in health and disease. McGraw Hill, New York 1983: 3–21
2. Myers JH, Stirling MC, Choy M et al. Direct measurement of inner and outer wall thickening dynamics with epicardial echocardiography: Circulation 1986, 74: 164–172
3. Braunwald E, Kloner RA. Myocardial reperfusion:A double-edge sword? J Clin Invest 1985; 76:1715
4. Epstein SE, Cannon RO, Talbot TL. Hemodynamic principles in the control of coronary blood flow.Am J Cardiol 1985; 56:8E
147Perfusion Imaging
Kardio-Kap 3 for pdf 06.06.2000 18:27 Uhr Seite 147

148 Handbook of Contrast Echocardiography
5. Kaul S, Jayaweera AR. Coronary and myocardial blood volumes: noninvasive tools to assess the coronary microcirculation? Circulation 1997; 96: 719–724
6. Wei K, Jayaweera Ar, Firoozan S et al. Quantification of myocardial blood flow using ultrasound-induced destruction of microbubbles administered as a constant venous infusion. Circulation 1998; 97:473–483
7. Schlant RC, Blomquist CG, Brandenburg RO et al. Guidelines for exercise testing: A report of the JointAmerican College of Cardiology-American Heart Association Task Force on Assessment of cardio-vascular procedures. Circulation 1986; 74 (suppl III):653A
8. Gianrossi R, Detrano R, Mulvihill D et al. Exercise-induced ST depression in the diagnosis of coronaryartery disease. A meta analysis. Circulation1989; 80:87
9. Armstrong WF, Mueller TM, Kinney EL,Tickner EG, Dillon JC, Feigenbaum H. Assessment of myocardial perfusion abnormalities with contrast-enhanced two-dimensional echocardiography. Circulation 1982; 66(1):166–173
10. Marwick TH, Nemecc JJ, Pashkow FJ et al.Accuracy and limitations of exercise echocardiography in a routine clinical setting. J Am Coll Cardiol 1992; 19:74–81
11. Elhendy A, Geleijnse ML, Roelandt JRTC, et al. Dobutamine-induced hypoperfusion without transient wall motion abnormalities: less severe ischemia or less severe stress? J Am Coll Cardiol 1996; 27:323–9
12. Geleijnse ML, Salustri A, Marwick TH et al. Should the diagnosis of coronary artery disease be based on the evaluation of myocardial fucntion or perfusion? Eur Heart J 1997; 18 (suppl D):D68–D77
13. Kaul S. Myocardial contrast echocardiography.15 years of research and development. Circulation 1997; 96:3745–3760
14. Kaul S, Pandian NG, Okada RD et al. Contrast echocardiography in acute myocardial ischemia: I.In vivo determination of total left ventricular ‘area ar risk’. J Am Coll Cardiol 1984; 4:1272–1282
15. Ragosta M, Camarano GP, Kaul S, Powers E, Gimple LW. Microvascular integrity indicates myocellular viability in patients with recent myo-cardial infarction: new insights using myocardial contrast echocardiography. Circulation 1994; 89:2562–2569
16. Distante A, Rovai D. Stress echocardiography and myocardial contrast echocardiography in viability assessment. European Heart Journal 1997;18:714–715
17. Sabia PJ, Powers ER, Jayaweera AR, Ragosta M, Kaul S. Functional significance of collateral blood flow in patients with recent myocardial infarction: a study using myocardial contrast echocardiography. Circulation 1992; 85: 2080–2089
18. Cheirif J, Desir RM, Bolli R, Mahmarian JJ,Zoghbi WA, Verani MS, Quinones MA. Relation of perfusion defects observed with myocardial contrast echocardiography to the severity of coronary stenosis: correlation with thallium-201 single-photon emission tomography. J Am Coll Cardiol 1992; 19(6):1343–1349
19. Kaul S, Senior R, Dittrich H, Raval U, Khattar R, Lahiri A. Detection of coronary artery disease with myocardial contrast echocardiography: comparison with 99mTc-sestamibi single-photon emission computed tomography. Circulation 1997; 96(3):785–792
20. Agrawal DI, Malhotra S, Nanda NC, Truffa CC, Agrawal G, Thakur Ac, Jamil F, Taylor GW, Becher H. Harmonic Power Doppler Contrast Echocardiography: Preliminary experimental results. Echocardiography 1997; 14,6:631–635
21. Becher H, Tiemann K, Schlief R, Lüderitz B,Nanda NC. Harmonic Power Doppler Contrast Echocardiography: Preliminary clinical results. Echocardiography 1997; 14,6:637–642
22. Tiemann K, Becher H, Bimmel, Schlief R, Nanda N. Stimulated acoustic emission. Nonbackscatter contrast effect of microbubbles seen with harmonic power Doppler imaging. Echocardiography 1997;14:65–69
23. Becher H. Power Doppler. In: Rush-Presbyterian-St.Luke's Clinical Use of Contrast Echocardio-graphy. (1998) Am J Cardiol – a continuing education
24. Becher H, Tiemann K, Powers J. Power Harmonic Imaging – clinical application in contrast echo-cardiography. Medica Mundi 1999; 43(2):26–30
25. Porter TR, Li S, Kilzer K et al. Effect of significant two-vessel versus one-vessel coronary artery stenosis on myocardial contrast effects observed with inter-mittent harmonic imaging after intravenous contrast injection during dobutamine stress echocardio-graphy. J Am Coll Cardiol 1997; 30:1399–1406
Kardio-Kap 3 for pdf 06.06.2000 18:27 Uhr Seite 148

149Perfusion Imaging
26. Marwick TH, Brunken R, Meland N et al. Accuracy and feasability of contrast echocardiography fordetection of perfusion defects in routine practice: comparison with wall motion and technetium-99m sestamibi SPECT. J Am Coll Cardiol 1998; 38,5:1260–1269
27. Hope-Simpson D, Chin CT, Burns PN. Pulse Inversion Doppler: A new method for detecting non-linear echoes from microbubble contrast agents. IEEE Transactions UFFC 1999; 46:376–382
28. Tiemann K, Lohmeier S, Kintz S et al. Real-time contrast echo assessment of myocardial perfusion at low emission power: First experimental and clinical results using power pulse inversion imaging. Echocardiography 1999; 16:799–809
29. Porter TR, Xie F. Transient myocardial contrast after initial exposure to diagnostic ultrasound pressures with minute doses of intravenously injected micro-bubbles: demonstration and potential mechanisms. Circulation 1995; 92:2391–2395
30. Porter TR, Li S, Jiang L, Grayburn P, Deligonul U. Real-time visualization of myocardial perfusion and wall thickening in human beings with intravenous ultrasonographic contrast and accelerated inter-mittent harmonic imaging. J Am Soc Echocardiogr 1999; 12(4):266–271.
31. Wei K, Jayaweera AR, Firoozan S et al. Basis for detection of stenosis using venous administration of microbubbles during myocardial contrast echo-cardiography: bolus or continuous infusion? J Am Coll Cardiol 1998; 32:252–260
32. Albrecht T, Urbank A, Mahler M et al. Prolongation and optimization of Doppler enhancement with a microbubble US contrast agent by using continuous infusion: preliminary experience. Radiology 1998; 207:339–347
33. Miller JJ, Tiemann K, Podell S, Becher H, Doerr Stevens JK, Kuvelas T, Greener Y, Killam AAL, Goenechea J, Dittrich HC. Infusion of Optison for left ventricular opacification and myocardial contrast echocardiography. J Am Soc Echocardiogr 1999 (in press)
34. Wilson RF, Wyche K, Christensen BV et al. Effects of adenosine on human coronary arterial circulation. Circulation 1990; 82:1595–1606
35. Johnston DL, Daley JR, Hodge DO, Hopfenspirger MR, Gibbons RJ. Hemodynamic responses and adverse effects associated with adenosine and dipyridamole pharmacologic stress testing: a comparison in 2000 patients. Mayo Clin Proc 1995; 70: 331–336
36. Wei K, Jayaweera AR, Firoozan S et al. Quantification of myocardial blood flow with ultra-sound induced destruction of microbubblesadministered as a continuous infusion. Circulation 1998; 97:473–483
37. Ito H, Tomooka T, Sakai N et al. Lack of myo-cardial perfusion immediately after successful thrombolysis: A predictor of poor recovery of left ventricular function in anterior myocardial infarction. Circulation 1992; 85:1699–1705
38. Agati L, Funaro S, Veneroso G, Lamberti A, Altieri C, Bilotta F, Benedetti G, De Castro S, Autore C, Fedele F. Assessment of myocardial reperfusion after acute myocardial infarction using harmonic power Doppler and Levovist: Intravenous versus intracoronary contrast injection. Eur Heart J 1999; 20 (abstract supplement):362
39. Iliceto S, Galiuto L, Marchese A et al. Functional role of microvascular integrity in patients with infarct-related artery patency after acute myocardial infarction. Eur Heart J 1997; 18:618–624
40. Kloner RA; Ganote CE, Jennings RB.The ‘no-reflow’ phenomen after tempory coronary occlusion in the dog. J Clin Invest 1974; 54:1496–1508
41. Firschke C, Basini R, Patiga J et al. Contrast echocardiographic evaluation of myocardial salvage after reperfusion therapy in acute myocardial infarction. Eur Heart J 1999; 20 (abstract supplement):363
42. Horcher J, Blasini R, Martinoff S, Schwaiger M, Schömig A, Firschke C. Myocardial perfusion in acute coronary syndrome. Circulation1999; 99:e1
43. Firschke C, Lindner JR, Wei K, Goodman NC, Skyba DM, Kaul S. Myocardial perfusion imaging in the setting of coronary artery stenosis and acute myocardial infarction using venous injection of a second-generation echocardiographic contrast agent. Circulation 1997; 96(3):959–967.
44. Macioch JE, Sandelski J, Ostoic TA, Johnson MS,In M, Thew ST, Liebson PR, Becher H, Holoviak M,Feinstein SB. Clinically reproducible myocardial perfusion studies with contrast echo in 82 consecutivepatients:correlation to cardiac cath or nuclear imaging in 36 patients. Echocardiography 1998;15[6, part2]:98
45. Porter TR, Xie F, Kilzer K, Deligonul U. Detection of myocardial perfusion abnormalities during dobutamine and adenosine stress echocardiography with transient myocardial contrast imaging after minute quantities of intravenous perfluorocarbon-exposed sonicated dextrose albumin. J Am Soc Echocardiogr 1996; 9(6):779–786
Kardio-Kap 3 for pdf 06.06.2000 18:27 Uhr Seite 149

150 Handbook of Contrast Echocardiography
46. Porter TR, Li S, Kricsfeld D, Armbruster RW. Detection of myocardial perfusion in multiple echo-cardiographic windows with one intravenous injection of microbubbles using transient response second harmonic imaging. J Am Coll Cardiol 1997; 29(4):791–799.
47. Firschke C. Venous myocardial contrast echocardio-graphy can guide clinical decision making in the catheterization laboratory. Circulation 1998;
48. Lentz C, Tiemann, K, Köster J, Schlosser T, Goenechea J, Becher H. Does color blooming limitate assessment of myocardial perfusion using harmonic power Doppler? Eur Heart J 1999; 20 (abstract supplement):359
49. Gould KL, Lipscomb K, Hamilton GW. Physiologic basis for assessing critical coronary stenosis. Instantaneous flow response and regional distributionduring coronary hyperemia as measures of coronary flow reserve. Am.J.Cardiol. 1974; 33:87–94.
50. Doucette JW, Corl PD, Payne HM, Flynn AE,Goto M, Nassi M, Segal J. Validation of a Doppler guide wire for intravascular measurement of coronary artery flow velocity. Circulation 1992; 85:1899–1911.
51. Demer LL, Gould KL, Goldstein RA, Kirkeeide RL, Mullani NA, Smalling RW, Nishikawa A, Merhige ME. Assessment of coronary artery disease severity by positron emission tomography. Comparison with quantitative arteriography in 193 patients. Circulation 1989; 79:825–835
52. Iliceto S, Marangelli V, Memmola C, Rizzon P. Transesophageal Doppler echocardiography evaluation of coronary blood flow velocity in base-line conditions and during dipyridamole-induced coronary vasodilation. Circulation 1991; 83:61–69
53. Iliceto S, Caiati C, Aragona P, Verde R, Schlief R, Rizzon P. Improved Doppler signal intensity in coronary arteries after intravenous peripheral injection of a lung-crossing contrast agent (SHU508A) . J.Am.Coll.Cardiol. 1994; 23:184–190.
54. Caiati C, Aragona P, Iliceto S, Rizzon P. Improved Doppler detection of proximal left anterior descending coronary artery stenosis after intravenous injection of a lung-crossing contrast agent: a trans-esophageal Doppler echocardiographic study. J.Am.Coll.Cardiol. 1996; 27:1413–1421
55. Powers JE, Burns PN, Souquet J. Imaging instrumentation for ultrasound contrast agents. In: Nanda NC, Schlief R, Goldberg BB, eds. Advances in echo imaging using contrast enhancement. Kluwer Academic Publishers, 1997:139–170
56. Caiati C, Montaldo C, Zedda N, Bina A, Iliceto S. New noninvasive method for coronary flow reserveassessment: contrast-enhanced transthoracic second harmonic echo Doppler. Circulation 1999; 99:771–778.
57. Lambertz H, Tries HP, Stein T, Lethen H. Noninvasive assessment of coronary flow reserve with transthoracic signal-enhanced Doppler echo-cardiography. J.Am.Soc.Echocardiogr. 1999; 12:186–195.
58. Mulvagh SL, Foley DA, Aeschbacher BC, Klarich KK, Seward JB. Second harmonic imaging of an intravenously administered echocardiographic contrast agent: Visualization of coronary arteries and measurement of coronary blood flow. J.Am.Coll.Cardiol. 1996; 27:1519–1525.
59. Caiati C, Montaldo C, Zedda N, Montisci R, Ruscazio M, Lai G, Cadeddu M, Meloni L, Iliceto S. Validation of a new non-invasive method (contrast-enhanced transthoracic second harmonic echo Doppler) for the evaluation of coronary flow reserve. Comparison with intra-coronary Doppler flow wire. J.Am.Coll.Cardiol. 1999; 34:1193–1200
60. Caiati C, Zedda N, Montaldo C, Montisci R,Iliceto S. Contrast-enhanced transthoracic second harmonic echo Doppler with adenosine: a non-invasive, rapid and effective method for coronary flow reserve assessment. J.Am.Coll.Cardiol. 1999; 34:122–130.
61. Gould KL, Martucci JP, Goldberg DI, Hess MJ, Edens RP, Latifi R, Dudrick SJ. Short-term cholesterol lowering decreases size and severity of perfusion abnormalities by positron emission tomo-graphy after dipyridamole in patients with coronary artery disease. A potential noninvasive marker of healing coronary endothelium. Circulation 1994; 89:1530–1538.
62. Arora GD, Reeves WC, Movahed A. Alteration of coronary perfusion reserve in hypertensive patients with diabetes. J.Hum.Hypertens. 1994; 8:51–57.18
63. Pitkänen OP, Nuutila P, Raitakari OT, Rönnemaa T, Koskinen PJ, Iida H, Lehtimäki TJ, Laine HK, Takala T, Viikari JS, Knuuti J. Coronary flow reserve is reduced in young men with IDDM. Diabetes 1998; 47:248–254.
64. Rossen JD, Quillen JE, Lopez AG, Stenberg RG, Talman CL, Winniford MD. Comparison of coronary vasodilation with intravenous dipyridamoleand adenosine. J.Am.Coll.Cardiol. 1991; 18:485–491
65. White CW, Wright CB, Doty DB, Hiratza LF, Eastham CL, Harrison DG, Marcus ML. Does visual
Kardio-Kap 3 for pdf 06.06.2000 18:27 Uhr Seite 150

151Perfusion Imaging
interpretation of the coronary arteriogram predict the physiologic importance of a coronary stenosis? N.Engl.J.Med. 1984; 310:819–824
66. Kern MJ, Donohue TJ, Aguirre FV, Bach RG, Caracciolo EA, Wolford T, Mechem CJ, Flynn MS, Chaitman B. Clinical outcome of deferring angio-plasty in patients with normal translesional pressure-flow velocity measurements. J.Am.Coll.Cardiol. 1995; 25:178–187.
67. Wilson RF, Johnson MR, Marcus ML, Aylward PE, Skorton DJ, Collins S, White CW. The effect of coronary angioplasty on coronary flow reserve. Circulation 1988; 77:873–885.
68. Donohue TJ, Kern MJ, Aguirre FV, Bach RG, Wolford T, Bell CA, Segal J. Assessing the hemo-dynamic significance of coronary artery stenoses: analysis of translesional pressure-flow velocity relations in patients. J.Am.Coll.Cardiol. 1993; 22:449–458.
69. McGinn AL, White CW, Wilson RF. Interstudy variability of coronary flow reserve. Influence of heart rate, arterial pressure, and ventricular preload. Circulation 1990; 81:1319–1330.
70. Takeuchi M, Nohtomi Y, Kuroiwa A. Does coronary flow reserve assessed by blood flow velocity analysis reflect absolute coronary flow reserve? [see comments]. Cathet.Cardiovasc.Diagn. 1996; 38:251–254.
Kardio-Kap 3 for pdf 06.06.2000 18:27 Uhr Seite 151