Handbook of Automated Data Quality Control Checks and ... · NDBC Technical Document 09-02 Handbook...
78
NDBC Technical Document 09-02 Handbook of Automated Data Quality Control Checks and Procedures National Data Buoy Center Stennis Space Center, Mississippi 39529-6000 August 2009 U.S. DEPARTMENT OF COMMERCE Secretary National Oceanic and Atmospheric Administration Administrator National Data Buoy Center Director
Transcript of Handbook of Automated Data Quality Control Checks and ... · NDBC Technical Document 09-02 Handbook...

NDBC Technical Document 09-02
Handbook of Automated Data Quality Control
Checks and Procedures
National Data Buoy Center Stennis Space Center, Mississippi 39529-6000 August 2009
U.S. DEPARTMENT OF COMMERCE Secretary
National Oceanic and Atmospheric Administration Administrator
National Data Buoy Center Director
2
3
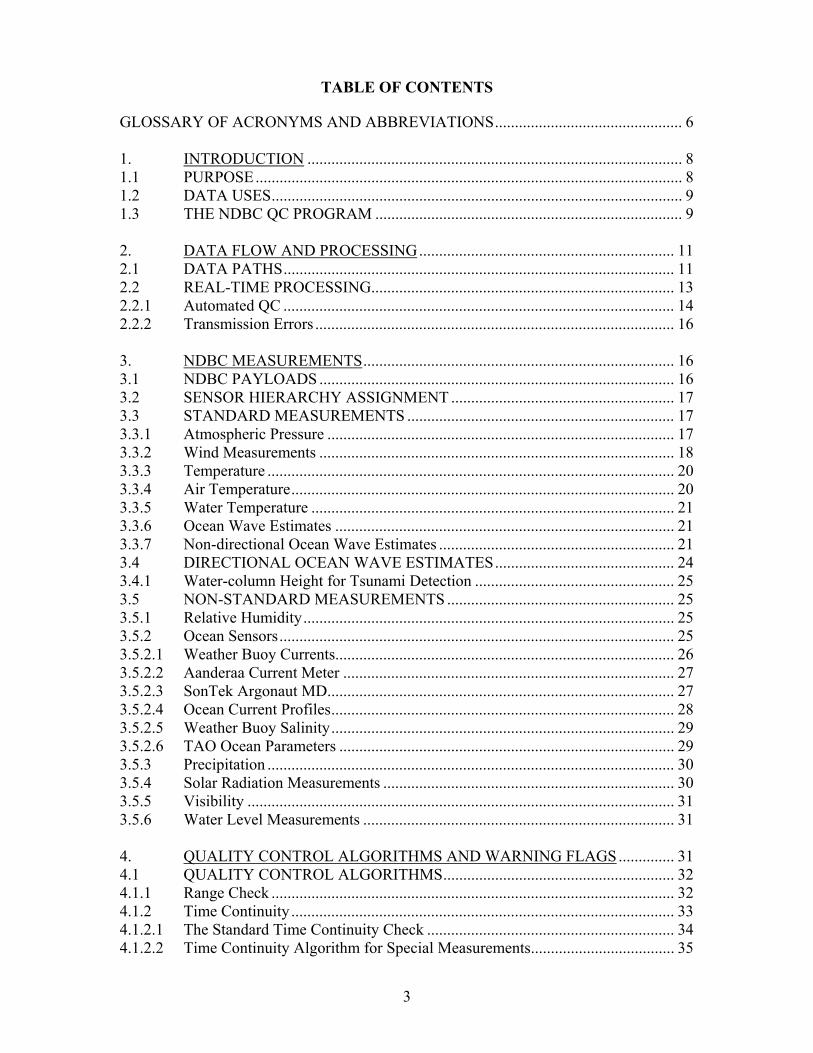
TABLE OF CONTENTS
GLOSSARY OF ACRONYMS AND ABBREVIATIONS............................................... 6 1. INTRODUCTION .............................................................................................. 8 1.1 PURPOSE........................................................................................................... 8 1.2 DATA USES....................................................................................................... 9 1.3 THE NDBC QC PROGRAM ............................................................................. 9 2. DATA FLOW AND PROCESSING................................................................ 11 2.1 DATA PATHS.................................................................................................. 11 2.2 REAL-TIME PROCESSING............................................................................ 13 2.2.1 Automated QC .................................................................................................. 14 2.2.2 Transmission Errors .......................................................................................... 16 3. NDBC MEASUREMENTS.............................................................................. 16 3.1 NDBC PAYLOADS ......................................................................................... 16 3.2 SENSOR HIERARCHY ASSIGNMENT ........................................................ 17 3.3 STANDARD MEASUREMENTS ................................................................... 17 3.3.1 Atmospheric Pressure ....................................................................................... 17 3.3.2 Wind Measurements ......................................................................................... 18 3.3.3 Temperature ...................................................................................................... 20 3.3.4 Air Temperature................................................................................................ 20 3.3.5 Water Temperature ........................................................................................... 21 3.3.6 Ocean Wave Estimates ..................................................................................... 21 3.3.7 Non-directional Ocean Wave Estimates ........................................................... 21 3.4 DIRECTIONAL OCEAN WAVE ESTIMATES............................................. 24 3.4.1 Water-column Height for Tsunami Detection .................................................. 25 3.5 NON-STANDARD MEASUREMENTS ......................................................... 25 3.5.1 Relative Humidity............................................................................................. 25 3.5.2 Ocean Sensors................................................................................................... 25 3.5.2.1 Weather Buoy Currents..................................................................................... 26 3.5.2.2 Aanderaa Current Meter ................................................................................... 27 3.5.2.3 SonTek Argonaut MD....................................................................................... 27 3.5.2.4 Ocean Current Profiles...................................................................................... 28 3.5.2.5 Weather Buoy Salinity...................................................................................... 29 3.5.2.6 TAO Ocean Parameters .................................................................................... 29 3.5.3 Precipitation ...................................................................................................... 30 3.5.4 Solar Radiation Measurements ......................................................................... 30 3.5.5 Visibility ........................................................................................................... 31 3.5.6 Water Level Measurements .............................................................................. 31 4. QUALITY CONTROL ALGORITHMS AND WARNING FLAGS.............. 31 4.1 QUALITY CONTROL ALGORITHMS.......................................................... 32 4.1.1 Range Check ..................................................................................................... 32 4.1.2 Time Continuity ................................................................................................ 33 4.1.2.1 The Standard Time Continuity Check .............................................................. 34 4.1.2.2 Time Continuity Algorithm for Special Measurements.................................... 35

4
4.1.3 Storm Limits ..................................................................................................... 36 4.1.4 Hierarchy Reversal and Duplicate Sensor Checks............................................ 36 4.1.5 Internal Consistency.......................................................................................... 37 4.1.6 Wave Validation Checks................................................................................... 38 4.1.6.1 Wind Wave Algorithms .................................................................................... 38 4.1.6.2 Directional Wave Validation Report ................................................................ 40 4.1.6.3 Swell Direction Check ...................................................................................... 40 4.1.6.4 High Frequency Spectral Spikes....................................................................... 40 4.1.6.5 Wave Height Verses Average Wave Period ..................................................... 40 4.1.6.6 Wave Direction vs. Wind Direction.................................................................. 41 4.2 NCEP FIELDS.................................................................................................. 41 4.2.1 Continuous Wind Checks ................................................................................. 41 4.2.2 Ocean Sensor Algorithms and Checks.............................................................. 42 4.2.2.1 Aanderaa Current Meter Quality Assurance (QA) ........................................... 42 4.2.2.2 SonTek Argonaut MD Quality Assurance (QA) .............................................. 43 4.2.2.3 Quality Control of the ADCP Data from NDBC Weather Buoys .................... 44 4.2.2.4 Quality Control of the ADCP Data from the Oil and Gas Industry.................. 45 4.2.2.5 Weather Buoy Salinity...................................................................................... 46 4.3 NDBC FLAGS.................................................................................................. 46 4.3.1 Hard Flags......................................................................................................... 46 4.3.1.1 D Flag — Delete Sensor from NWS Report..................................................... 47 4.3.1.2 H Flag — Sensor Hierarchy Has Reversed....................................................... 47 4.3.1.3 L Flag — Failed Range Limits Test ................................................................. 47 4.3.1.4 M Flag — Missing Sensor Data........................................................................ 47 4.3.1.5 N Flag – Negative Spectral Wave Density ....................................................... 47 4.3.1.6 R Flag — Related Measurement Failed............................................................ 47 4.3.1.7 S Flag — Invalid Statistical Parameter............................................................. 48 4.3.1.8 T Flag — Transmission Parity Error ................................................................ 48 4.3.1.9 U Flag – Discrete Wave Parameters are not valid ............................................ 48 4.3.1.10 V Flag — Failed Time-Continuity Test........................................................ 48 4.3.1.11 W Flag — WPM Transmission Errors.......................................................... 48 4.3.2 Soft Flags .......................................................................................................... 48 4.3.2.1 a and b Flags — Above or Below Regional and Seasonal Limits .................... 48 4.3.2.2 c Flag — Calm Sea State Flag or Corrected Value .......................................... 49 4.3.2.3 d Flag — Failed Standard Deviation Check (Continuous Winds Only)........... 49 4.3.2.4 f Flag — Failed Hourly Time Continuity Check .............................................. 49 4.3.2.5 g Flag — Failed Gust-to-Mean Speed Ratio Check ......................................... 49 4.3.2.6 i Flag — Continuous and Hourly Wind Speeds Don’t Agree .......................... 49 4.3.2.7 j Flag — Continuous Wind Transmission Error ............................................... 49 4.3.2.8 k Flag — Deltas Between Duplicate Sensors Too High................................... 49 4.3.2.9 m Flag — Failed Spectral Time-Continuity Check(C11) .................................. 49 4.3.2.10 n Flag — Failed NCEP Model Comparison ................................................. 50 4.3.2.11 p Flag — Failed Wave Height/Wave Period Check (Wave Periods Only) .. 50 4.3.2.12 q Flag — Failed Directional-Wave Algorithm ............................................. 50 4.3.2.13 r Flag — Relate Measurement Failed (Continuous Winds Only)................. 50 4.3.2.14 s Flag — Failed Stuck Compass Check........................................................ 50 4.3.2.15 t Flag — Tendency Deltas Between Duplicate Sensors Too High............... 50

5
4.3.2.16 v Flag — Failed Humidity Verses Visibility Check..................................... 50 4.3.2.17 w Flag — Failed Wave Direction Verses Wind Direction Check ................ 50 4.3.2.18 x and y Flags — Failed Wind-Wave Algorithm Limits ............................... 51 4.3.2.19 z Flag — Failed Average Bow Azimuth Verses Wind Direction................. 51 4.4 DATA QUALITY REPORTS AND GRAPHICS............................................ 51 4.5 REPORTS AND GRAPHICS .......................................................................... 51 4.5.1 The NDBC Visualization Tools Suite (VTS) ................................................... 51 4.5.2 The NDBC Plotting Server ............................................................................... 52 4.5.3 User Specified Reports ..................................................................................... 52 5. REFERENCES ................................................................................................. 54 APPENDIX A: NDBC WEATHER STATION MEASUREMENT IDENTIFIERS ..... 56 APPENDIX B: RELATIVE HUMIDITY CONVERSIONS .......................................... 62 APPENDIX C: ATMOSPHERIC VISIBILITY MEASUREMENTS ............................ 63 APPENDIX D: QUALITY CONTROL ALGORITHMS............................................... 65 APPENDIX E: QUALITY CONTROL FLAGS............................................................. 74 APPENDIX F: TSUNAMETER ASCII IDS................................................................... 75
LIST OF FIGURES Figure 1. C-MAN and Moored Buoy Data Paths Using GOES Satellites ...................... 12 Figure 2. C-MAN and Moored Buoy Data Paths Using Iridium Satellites .................... 13 Figure 3. DART® II Data Flow ....................................................................................... 14 Figure 4. NDBC Realtime Processing at NWSTG ......................................................... 15 Figure 5. TAO Data path Using Service Argos/CLS ...................................................... 30 Figure 6. Sample Output from Using Palao-Gilhousen Wind-Wave Algorithm ............ 39
LIST OF TABLES
Table 1. Accuracies Achieved During Field Comparisons ............................................. 10 Table 2. Statistical Wave measurment Descriptions ....................................................... 23 Table 3. Default Upper and Lower Limit Values ........................................................... 33 Table 4. General Values of Time Continuity Limit Values ............................................ 35
6
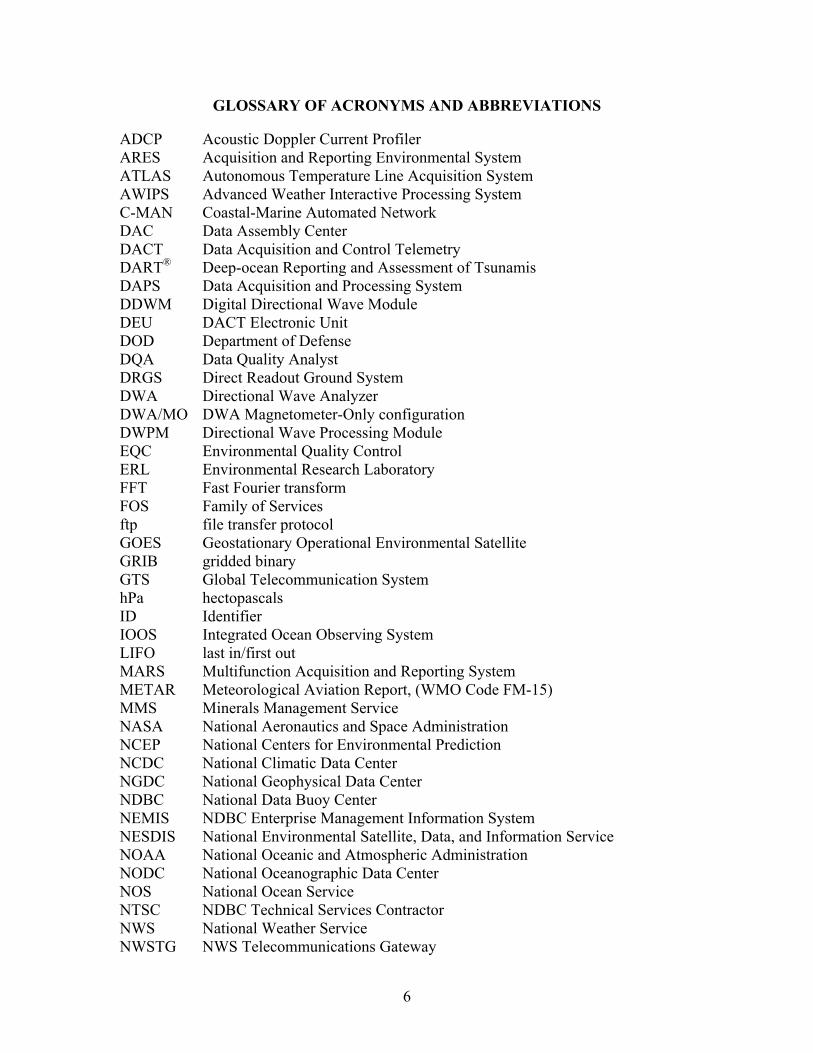
GLOSSARY OF ACRONYMS AND ABBREVIATIONS
ADCP Acoustic Doppler Current Profiler ARES Acquisition and Reporting Environmental System ATLAS Autonomous Temperature Line Acquisition System AWIPS Advanced Weather Interactive Processing System C-MAN Coastal-Marine Automated Network DAC Data Assembly Center DACT Data Acquisition and Control Telemetry DART® Deep-ocean Reporting and Assessment of Tsunamis DAPS Data Acquisition and Processing System DDWM Digital Directional Wave Module DEU DACT Electronic Unit DOD Department of Defense DQA Data Quality Analyst DRGS Direct Readout Ground System DWA Directional Wave Analyzer DWA/MO DWA Magnetometer-Only configuration DWPM Directional Wave Processing Module EQC Environmental Quality Control ERL Environmental Research Laboratory FFT Fast Fourier transform FOS Family of Services ftp file transfer protocol GOES Geostationary Operational Environmental Satellite GRIB gridded binary GTS Global Telecommunication System hPa hectopascals ID Identifier IOOS Integrated Ocean Observing System LIFO last in/first out MARS Multifunction Acquisition and Reporting System METAR Meteorological Aviation Report, (WMO Code FM-15) MMS Minerals Management Service NASA National Aeronautics and Space Administration NCEP National Centers for Environmental Prediction NCDC National Climatic Data Center NGDC National Geophysical Data Center NDBC National Data Buoy Center NEMIS NDBC Enterprise Management Information System NESDIS National Environmental Satellite, Data, and Information Service NOAA National Oceanic and Atmospheric Administration NODC National Oceanographic Data Center NOS National Ocean Service NTSC NDBC Technical Services Contractor NWS National Weather Service NWSTG NWS Telecommunications Gateway

7
ORG Optical Rain Gauge PAR Photosynthetically Active Radiation PCC Profiler Control Center PDM Profiler Data Management psu practical salinity unit QA Quality Assurance QC Quality Control s or sec second or seconds SRG Siphon Rain Gauge SSC Stennis Space Center TAO Tropical Atmosphere Ocean VEEP Value Engineered Environmental Payload WA Wave Analyzer WDA Wave Data Analyzer WMO World Meteorological Organization WPM Wave Processing Module
8
1. INTRODUCTION
The National Data Buoy Center (NDBC), a part of the National Oceanographic and Atmospheric Administration’s (NOAA) National Weather Service (NWS), operates and quality controls data from more than 100 moored buoys, 50 Coastal-Marine Automated Network (C-MAN) stations, 55 Tropical Atmosphere Ocean (TAO), and 39 Deep-Ocean Reporting and Assessment of Tsunamis (DART®) tsunameter stations. NDBC quality controls and distributes environmental data from more than 570 partner stations such as Integrated Ocean Observing System (IOOS) (approximately 300 stations) , National Ocean Service (NOS) (approximately 200 stations), and Minerals Management Service (MMS) stations (approximately 70 stations) in addition to NDBC operated moored buoy and C-MAN stations. See the NDBC webpage at http://www.ndbc.noaa.gov/ioos.shtml for a description of the IOOS program at NDBC. These stations acquire environmental data used primarily for preparing weather warnings, analyses, and forecasts. Buoys are also used to provide ground-truth measurements for space-based observation platforms and to establish long-term environmental records for engineering applications, climate research, and air-sea interaction studies. NDBC has developed the capability to make a variety of measurements, including:
• Atmospheric pressure • Wind direction, speed, and gust • Air and water temperature • Wave energy spectra (non-directional and directional) • Water-column height (Tsunami Detection) • Relative humidity • Ocean current velocity • Precipitation • Salinity • Solar radiation • Visibility • Water level and water quality.
The NDBC, IOOS, NOS, and MMS network is comprised of sites offshore and along most of the U.S. coastline, including Alaska, Hawaii, and the Great Lakes. The importance of accurate data from these stations cannot be over emphasized. The maritime community has come to rely on the data for the safe conduct of operations, and the network often provides the only real-time measurements available from remote, data sparse areas.
1.1 PURPOSE
This handbook describes the automated quality control (QC) procedures used to ensure the accuracy of NDBC measurements. It may be used as a tutorial for newcomers to NDBC or as a reference for experienced personnel. This handbook incorporates much of the material contained in Tapered QC, NDBC Technical Document 98-03, August 1998, and supersedes two earlier versions of this handbook, dated January, 1996 and February, 2003.

9
1.2 DATA USES
The primary user of real-time NDBC data is the NWS which uses the data for the issuance of warnings, analyses, forecasts and for initializing numerical models. The general public has access to the data in real-time via the NDBC web site. NOAA and external users can access the data in real time via NOAAPORT. See http://www.weather.gov/noaaport/html/noaaport.shtml for more information. Each month, the data that have been collected during the previous month from NDBC operated moored buoys and C-MAN stations undergo further quality control by NDBC and are processed for archival at the National Climatic Data Center (NCDC), Asheville, NC, and the National Oceanographic Data Center (NODC), Silver Spring, MD. Historical data are also available at the NDBC web site. Only data that have passed all automated QC checks and manual review, and have met NDBC standards for accuracy, are archived.
TAO data and DART® data are archived post-deployment rather than monthly. TAO data undergo a delayed mode QC process prior to archival at NODC. DART® data are not Quality Controlled prior to archival. Data are packaged and sent to the National Geophysical Data Center (NGDC) for archival.
Partner data are not archived at NCDC or NODC by NDBC; it is the responsibility of the partners to archive their data. Historical data from these partner stations can be found on NDBC’s website.
1.3 THE NDBC QC PROGRAM
The primary objective of the NDBC QC program is to ensure that NDBC and partner sensor systems provide measurements that are within NDBC total system accuracy. NDBC total system accuracy may be defined as the difference between the NDBC measurement and the true ambient value. It is a function of sensor accuracy, errors induced by the buoy or platform, and to some extent, the accuracy to which we can monitor the measurement in its remote environment. See the NDBC Web page, http://www.ndbc.noaa.gov/rsa.shtml for the system accuracies for the various NDBC payloads (i.e. onboard processors).
However, NDBC believes that the accuracy achieved is often considerably better than these stated accuracies based on special field comparisons. These comparisons between duplicate sensors on the same buoy or inferred through post calibrations are given in Table 1. Also listed in Table 1 are the standards required by the WMO (2006). When duplicate sensors were available, the accuracies were computed in an established manner by computing a root mean square combination of bias (or mean difference over the course of a month) and the standard of deviation of differences.
These accuracies are often considerably better than the total system accuracies. For example, the total system accuracy for wind speed is plus or minus 1 m/s. There are two reasons why NDBC states the system accuracies conservatively. First, this states the degree to which we can quality control the measurement in the field. Monitoring tools, such as comparison with numerical models, graphical displays, and the results of any analyses, do not allow us to determine a 0.5 m/s error in wind speed. Second, there are some rare environmental conditions, such as high waves, which may temporarily

10
preclude us from achieving the desired accuracies.
Table 1. Accuracies Achieved During Field Comparisons.
Measurement WMO Requirement
NDBC Accuracy
Basis
Air Temperature 0.1 deg. C 0.09 deg. C Duplicate sensor comparison
Water Temperature* 0.1 deg. C 0.08 deg. C Duplicate sensor comparison
Dew Point 0.5 degrees C 0.31 deg. C Post calibration
Wind Direction 10 deg 9.26 degrees Adjacent buoy comparison
Wind Speed 0.5 m/s or 10% 0.55 m/s Duplicate sensor comparison
Sea Level Pressure 0.1 hPa 0.07 hPa Duplicate sensor comparison
Wave Height 0.2 m or 5% 0.2 m Comparison to standard
Wave Period 1 s 1 s** Comparison to standard
Wave Direction 10 deg 10 deg Comparison to standard * Water temperature is taken by a buoy internal thermistor. Ocean Temperature is
taken with direct water contact. ** Resolutions for periods greater than 10 seconds are greater than 1 second.
An NDBC Technical Services Contractor (NTSC) staffed by engineers, meteorologists, computer scientists, and other specialists, provides support in response to technical directives initiated by NDBC. Data quality analysts in the NDBC Data Assembly Center review the day-to-day quality of data and delete questionable data from those data sets destined for archival, and prohibit questionable data from further public release. Physical and computer scientists in the NDBC Data Systems Department develop, test, and implement automated QC procedures.
The NDBC QC program may be viewed in two parts. First, there are real-time automated QC checks done exclusively by computers at the NWS Telecommunications Gateway (NWSTG) in Silver Spring, MD. The first category of these are gross error checks that detect communication transmission errors and total sensor failure. Data flagged by these checks are virtually certain to be erroneous. These checks, however, can be overridden when storms or other unusual environmental phenomena are anticipated that would generate out of the ordinary, but valid measurements. The second category of automated checks identifies data that may not be grossly in error, but for some reason, suspect. Data so identified will be released, but will undergo additional scrutiny within 24 hours by NTSC data quality analysts. They perform manual inspection using computer-generated analytical aids, graphical displays, and the results of any automated QC checks to identify the often subtle degradation of systems and sensors. Analysts integrate and compare NDBC data with relevant NWS and National Environmental Satellite, Data, and Information Service (NESDIS) products, such as weather observations, numerical

11
weather analyses and forecasts, weather radar, and satellite images.
2. DATA FLOW AND PROCESSING
A discussion of the flow and processing of NDBC data will be useful in understanding the NDBC QC process. This section describes the most important data paths that are used by NDBC and its users to acquire NDBC data. The major steps involved in applying automated QC during the data production process are also briefly described.
2.1 DATA PATHS
The data paths involving the transmission of data from C-MAN and moored buoy platforms are shown in Figure 1 for GOES and Figure 2 for Iridium Satellite LLC, referred to as Iridium describing both the service and system.
For NDBC operated platforms, the acquisition and telemetry of sensor data on each platform are controlled by an onboard microprocessor referred to as “the payload”. Data are transmitted in different ways. Data are primarily transmitted from the platform via a Geostationary Operational Environmental Satellite (GOES) (Fig 1) to the NESDIS Data Acquisition and Processing System (DAPS) at Wallops Island, VA; (NDBC has a local Direct Readout Ground Station (DRGS) to collect sensor data when the Wallops Island line or system is down). Then, data at DAPS/DRGS are routed to redundant NDBC computer systems at NWSTG where these systems decode the data, perform automated QC checks, and generate reports in standard World Meteorological Organization (WMO) format.1 After the NDBC computers process the data, they are sent to a message routing system at NWSTG where data are released. These real-time reports are released in collective bulletins to users via the NWS Family of Services (FOS) network, the Global Telecommunication System (GTS), and NOAAPORT. WMO bulletins received at NDBC via NOAAnet are used to update real-time observations on the NDBC Web site. Separate, private bulletins that are sent only to NDBC are also generated at the NWSTG to transmit the processed data and quality control flags. These bulletins contain the complete set of data acquired at all NDBC operated stations, and are used to update the NDBC Oracle® database at Stennis Space Center, Mississippi (SSC), in near real-time. Data quality analysts at NDBC access the database to note the occurrence of flagged data and conduct further quality control.
1 C-MAN stations report using a U.S. National code form, C-MAN code that closely resembles WMO FM12 SYNOP code.

12
Figure 1. C-MAN and Moored Buoy Data Paths Using GOES Satellites.
Some stations transmit data via Iridium satellites to the Iridium gateways in either Hawaii or Arizona. (Fig 2) The data are then routed to an NDBC server designated for Iridium data at the NWSTG. The data are then routed to the same redundant computer systems that GOES data are routed to at NWSTG. At this point, the data from Iridium stations go through the process described above for stations transmitting data via GOES. Stations with Iridium communications have two-way communications capability, and the communications from NDBC to the buoys is referred to as back channel capability. NDBC can send commands directly to the buoy. The NDBC personnel use an application that connects to the server designated for Iridium data at the NWSTG and issues a command. That command is routed to the Iridium gateway, then to the Iridium satellite, and down to the payload it was intended for. Back channel commands allow NDBC to troubleshoot or maintain a payload remotely. Data management information and parameters, to properly process the data, are maintained and updated in the NDBC database at SSC. When changes are made in the NDBC database, the information on the redundant NDBC computers at NWSTG is also updated. This information mainly consists of scaling parameters, QC thresholds, or instructions to prevent the release of measurements from failed sensors. Payload management information in Platform Data Tables, such as GOES channels, are maintained and updated at NDBC. NDBC personnel telnet into the servers and/or speak with personnel at DAPS to manage the information.
The DRGS permits processing of raw data at NDBC for test purposes or as a backup to update the database if a system failure occurs at NWSTG or DAPS. Partner stations provide NDBC with data in different ways. For most partners, NDBC will create ftp accounts for partners to send their data. NDBC obtains NOS’s data from their ftp server. Other partners allow NDBC to extract data using web services. All partner data are routed to the redundant NDBC computers at the NWSTG where they go through the same QC process as NDBC operated stations.

13
Figure 2. C-MAN and Moored Buoy Data Paths Using Iridium Satellites.
DART® II buoys transmit data similarly to weather buoys that use Iridium satellites. Sensors on the ocean floor send data to the buoy acoustically. The buoy records and transmits data to a server in Tempe, AZ via Iridium satellites. The data are then routed to an NDBC server, co-located with NWSTG, where they are processed and disseminated in the same fashion as weather buoy data. The Tsunami Warning Centers and NDBC can send instructions to the sensor via back channel communications as described previously.
2.2 REAL-TIME PROCESSING
The vast majority of automated quality control checks are performed during real-time processing on the NDBC computers at the NWSTG. A few checks require data that are not available during processing at NWSTG but are applied by programs run at NDBC after the data are inserted into the database. A program that compares NDBC measurements with numerical model fields is an example.

14
Figure 3. DART® II Data Flow.
2.2.1 Automated QC
The flow of data during real-time processing at the NWSTG is depicted in Figure 4. When unprocessed data arrive at the NWSTG from partners, DAPS, or Iridium, it is routed to a queue where it awaits the QC process. The first step involves extracting the raw message data and converting them to meaningful geophysical units. This process not only involves decoding the raw data, but also applying scaling factors and performing calculations for derived data. This is also the first point in the process where automated QC routines are applied. The raw data are checked for errors as a result of truncated or garbled messages. Wave and continuous wind measurements are hard flagged and not released if the message strings containing these data have errors. Other measurements, missing as a result of transmission errors, are also identified and individually flagged at this point in the process. The next steps are the application of the QC algorithms where measurements are checked against QC parameters and hard or soft flagged if necessary. Data are also stored for use in subsequent hour’s time continuity algorithms. Measurements identified as erroneous with hard flags are deleted from release, and the appropriate encoded messages are generated and grouped under the appropriate geographic bulletin header for transmission. Private bulletins are generated and transmitted to NDBC which contain all measurements and flags to update the NDBC database. A process monitor permits personnel at NDBC to monitor the flow of information at the NWSTG.
During each step in the process, a parameter manager applies the appropriate parameters which include such items as scaling coefficients, quality control limits, sensor hierarchy designations, and output bulletin organization. The parameters are updated and maintained by data analysts through the National Data Buoy Center Enterprise Management Information System (NEMIS) interface to the NDBC Oracle® database. Whenever changes are made, they are transmitted to update the NWSTG parameter files.

15
Figure 4. NDBC Real-Time Processing at NWSTG.

16
2.2.2 Transmission Errors
Raw messages received at the NWSTG from the DAPS and Iridium are flagged with a special character if they are identified as being truncated or as having transmission parity errors. The data extraction routines will attempt to decode all the available data in the raw message, regardless if the message has been flagged as containing errors. Measurements which can’t be decoded as a result of transmission errors are identified and flagged as missing. Wave and continuous wind measurements are hard flagged and not released if the message strings containing these data are found to have errors. If the need arises, a station may be set to not release any data if the messages from the DAPS or Iridium are flagged as having transmission errors. This feature is rarely used since the data extraction routines are very robust and have been found to rarely decode and release erroneous data as a result of transmission errors. The feature is set using a parameter control in the NEMIS database interface, and subsequently at NWSTG.
3. NDBC MEASUREMENTS
Brief descriptions of NDBC measurements and the associated instruments, sensors, and techniques used to make these measurements are given in this section. Under each general measurement category is a brief description of the sensor and its basic principle of operation. The descriptions of sensors for NDBC’s partner stations are not included in this section. However, the same automated quality control checks are performed on their parameters.
There are some diagnostic, or housekeeping, measurements that are acquired each hour at NDBC stations to monitor station performance. These measurements (e.g., battery voltage and charge current) are monitored by the NDBC data quality analysts and engineering personnel for system performance assessment and troubleshooting. These measurements are maintained in the NDBC database but are not archived at the NCDC or NODC. There are also certain measurements that are not checked directly, such as the relative wind direction and the components of the wind. Unless measurements are used in automated QC checks, they may not be described in this section. A listing of the most commonly used NDBC geophysical and engineering measurement IDs is given in Appendix A and Appendix F.
3.1 NDBC PAYLOADS
There are a number of payloads used to acquire and transmit NDBC measurements. The payloads, now being used operationally, were developed at different times, and differ significantly in size, power consumption, and computational power. The following payloads are in use:
• Data Acquisition and Control Telemetry (DACT) Electronic Unit (DEU) • Value Engineered Environmental Payload (VEEP) • Multifunction Acquisition and Reporting System (MARS) • Automated Reporting Environmental System (ARES) • Advance Modular Payload System (AMPS) • TAO (Next Generation ATLAS)
17
• Deep-ocean Assessment and Reporting of Tsunamis (DART® II)
The oldest onboard buoy electronic systems are the DACT and VEEP payloads, which were both developed in the 1980's. The MARS payload became operational in 1995. It was designed to provide improved versatility and reliability over previous payloads. The ARES payload became operational in the early 2000’s. It incorporates a more sophisticated processor and provides additional housekeeping information over what is available from the MARS. The AMPS is the most recent payload to be developed and is presently undergoing field trials for operational use. It was developed to process the growing need for climate data as well as report real time meteorological and oceanographic data. Each payload calculates measurements from a time series of samples taken at a particular sampling rate and interval. When applicable, payloads are noted in the discussions that follow. NDBC plans to update its payload capabilities by retiring the DACT, VEEP, and MARS payloads by replacing them with the AMPS payload.
3.2 SENSOR HIERARCHY ASSIGNMENT
All moored buoy and C-MAN stations have redundant anemometers and all buoys have redundant barometers. One of the two redundant sensors is chosen as the primary sensor. The other is designated as the secondary or backup sensor. This hierarchy determines which of the sensors’ data are released at the NWSTG. Data from the primary sensor are released if they pass automated gross error QC checks. A measurement from a secondary sensor will be released if the primary sensor measurement cannot be released, and the measurement from the secondary sensor passes QC checks. The hierarchy order is not altered. If the data quality analyst determines that the secondary sensor is performing better than the primary sensor, the hierarchies will be changed through a manual modification to the databases.
The hierarchy order also determines the sensor from which data are archived at the national centers. Normally, data from the sensor indicated as primary are extracted for archival. If data from a primary sensor have been flagged for failing QC, data from the secondary sensor will be automatically extracted for archival if that sensor has not been flagged as failing QC.
3.3 STANDARD MEASUREMENTS
The standard suite of sensors on moored buoys sample wind speed, peak 5-sec gust; wind direction; barometric pressure; air temperature; water temperature; and non-directional ocean wave energy spectra, from which significant wave height and dominant wave period are determined. The same package is used at C-MAN sites, but, depending on the location of the C-MAN site, water temperature and wave sensors may not be included. For the tsunameters, water-column height is the standard measurement.
3.3.1 Atmospheric Pressure
Atmospheric pressure and its variability in both time and space are crucially important in synoptic meteorological analysis and forecasting. All NDBC platforms measure atmospheric pressure by means of digital aneroid barometers. Pressure is found from the electrical capacitance across parallel pressure-sensitive plates. The capacitance between

18
the plates increases as pressure increases. The following pressure measurements are made.
• Station pressure (SBAR1 or SBAR2) is the actual measurement made at the station in hectopascals (hPa) by the two barometers at the elevation of the barometer.
• Sea level pressure (BARO1 or BARO2) is the pressure reduced to sea level from the station pressure in units of hPa. For most NDBC stations, this is very close to the station pressure. The greatest difference between sea level pressure and station pressure will be from Great Lakes sites. The conversion to sea level pressure is made using the procedures described in the NWS Technical Procedures Bulletin No. 291 (NWS 1980), (NDBC/NTSC 2007), and (WBAN 1964). Automated QC checks are performed on all barometric pressure measurements.
Many buoys that are climatologically in the path of hurricanes or intense low pressure systems have the capability of measuring supplemental one-minute average pressure data. These data are recorded after the hourly pressure data fall below a predetermined threshold (e.g. 1008 hPa in the tropics.) IDs associated with supplemental pressure data are as follows.
• The minimum 1-minute barometric pressure in hPa (MN1MSLP1 and MN1MSLP2) from the primary and secondary barometer is the minimum 1 minute mean barometric pressure for the entire hour.
• The time (MSLPMIN1 and MSLPMIN2) is the minute within the hour that MN1MSLP1 and MN1MSLP2 occurred.
3.3.2 Wind Measurements
Wind measurements are the most important measurements made by NDBC. They are essential for the marine weather forecaster. Wind measurements are made at all NDBC weather stations. NDBC uses 4-blade, impeller-driven, wind-vane sensors. The final measurements are statistical estimates of the wind from time series of instantaneous wind samples taken at a minimum rate of 1 Hertz (Hz) over a particular length of time. The sampling rate is a function of the payload. CMAN stations use a 2-minute data-acquisition period, and moored buoys use an 8-minute acquisition period. The following standard wind measurements are produced each hour.
• Wind direction (WDIR1, WDIR2) is the direction from which the wind is blowing in degrees clockwise from true north. It is a unit vector average of the record of wind direction.
• Wind speed (WSPD1, WSPD2) is the scalar average of the wind speed in meters per second (m/s) over the sampling interval. C-MAN stations report wind speed in knots. All wind speeds are archived in m/s.
• Wind speed maximum (GUST1, GUST2) is the highest wind speed (WSPD1 or WSPD2) in the wind record. GUST1 or GUST2 is found from the highest 5-second running mean of the record.
19
NDBC has also developed the capability to continuously sample the wind on moored buoys and at C-MAN stations. Continuous-wind data are accumulated in segments of 10 minutes, yielding 600 samples per segment, and six 10-minute segments each hour. After each segment period, the mean of the segment is calculated and stored in a temporary buffer. The accumulations are also stored for later hourly statistical processing. The payload saves the most recent six accumulations. At the end of each 10-minute segment, the oldest data, now more than an hour old are removed from memory and replaced with the most recent.
At the end of an acquisition period, statistical processing is performed, and the output message is updated with the new statistics and six 10-minute segments. Statistical processing includes the calculation of the mean for both direction and speed and the standard deviation of the speed. The hour's data do not represent data from minute 0 to minute 59. Rather, it represents the latest, complete six 10-minute segments before the end of the last acquisition. The 10-minute segments are, however, bounded by minutes 0, 10, 20, etc.
Continuous-wind measurement IDs have a number from 1 to 6 attached to them. The Last In First Out (LIFO) numbering scheme is used such that the first whole 10-minute period immediately prior to the beginning of standard hourly data acquisition is labeled 1; the 10-minute period immediately before that is labeled 2, and so on. For most C-MAN stations, 1 corresponds to the period from minute 50 to minute 59 of the hour, 2 corresponds to the period from minute 40 to minute 49, and 6 corresponds to the period from minute 0 to minute 9. For most moored buoys with continuous winds, 1 corresponds to the period from minute 40 to minute 49. The measurement IDs associated with continuous winds are as follows:
• Continuous-wind speed (CWS1, CWS2, CWS3, CWS4, CWS5, CWS6) is the mean wind speed from the primary anemometer in m/s during a respective 10-minute period.
• Continuous-wind direction (CWD1, CWD2, CWD3, CWD4, CWD5, CWD6) is the mean wind direction, in degrees true, during a respective 10-minute period. Direction is the mean unit vector wind direction.
• Secondary (or optional) wind speed (OWS1, OWS2, OWS3, OWS4, OWS5, OWS6) is the same as CWS1 through CWS6, but from the secondary wind sensor.
• Secondary (or optional) wind direction (OWD1, OWD2, OWD3, OWD4, OWD5, OWD6) is the same as CWD1 through CWD6, but from the secondary wind sensor.
• Maximum gust (MXGT1, MXGT2) is the maximum 5-second wind speed during the full hour for wind sensors 1 and 2, respectively.
• Direction of maximum gust (DIRMXGT1, DIRMXGT2) is the 5-second direction in degrees true associated with MXGT1 and MXGT2, respectively.
• Time of maximum gust (MXMIN1, MXMIN2) is the nearest minute during the observation hour associated with MXGT1 and MXGT2, respectively.
• Average wind speed (AVGSPD1, AVGSPD2) is the mean wind speed over a full hour in m/s from wind sensor 1 or 2, respectively. This is the scalar average of the

20
6 measurements, CWS1 through CWS6 or OWS1 through OWS6, respectively. • Average wind direction (AVGDIR1, AVGDIR2) is the unit vector mean of all
wind directions over a full hour, expressed in degrees true from wind sensor 1 or 2, respectively. This is the average of 6 measurements, CWD1 through CWD6 or OWD1 through OWD6, respectively.
• Standard deviation of continuous-wind speed (CWSTD1, CWSTD2) is the standard deviation of the wind speed over 1 hour from wind sensor 1 and 2, respectively.
Wind measurements undergo range, consistency, standard deviation, and gust-to-speed ratio checks.
Wind speed at 10 m above site elevation (WSPD11, WSPD21) and 20 m above site elevation (WSPD12, WSPD22) are derived from an algorithm (Liu et al., 1979) that uses the height of the anemometer, the wind speed (WSPD1 or WSPD2), a constant relative humidity of 85%, a constant sea-level pressure of 1013.25, and the air (ATMP1 or ATMP2) and water temperature (WTMP1). If either the air or water temperature are unavailable, then the neutral stability is assumed. Assuming neutral stability can introduce an error of up to 5 percent. If both are missing then neither 10 nor 20-m wind speeds are made.
Many buoys that are climatologically in the path of hurricanes or intense low pressure systems have the capability of measuring supplemental one-minute average wind data. IDs associated with supplemental winds are as follows:
• The maximum 1-minute wind speed in m/s and direction (MX1MGT1 and MX1MGT2) (DMX1MGT1 and DMX1MGT2) from the primary and secondary anemometers is the maximum 1 minute mean wind speed and direction for the entire hour.
• The time (MX1MMIN1 and MX1MMIN2) is the minute within the hour that MX1MGT1, MX1MGT2, DMX1MGT1, DMX1MGT2 occurred.
3.3.3 Temperature
Temperature is one of the basic NDBC measurements. Electronic thermistors are used to make all temperature measurements which are updated in degrees Celsius (ºC). Temperature measurements undergo both range limit and time-continuity checks and are important for deriving sea level pressure (BARO1) and standard-height wind speeds (WSPD11, WSPD21, WSPD21, WSPD22).
3.3.4 Air Temperature
Air temperature measurements (ATMP1, ATMP2) are generally very reliable; however, it is important to note that the physical position of temperature sensors can adversely affect measurements. Air temperature housings can lead to non-representative readings in low wind conditions. Air temperature is sampled at a rate of 1Hz during the sampling period.

21
3.3.5 Water Temperature
While there are generally few problems with water temperature measurements (WTMP1, WTMP2), it should be noted that the depth of water temperature sensors vary with buoy hull or C-MAN site, and that the temperature probes on buoys are attached to the inside of the hull. Since buoy hulls are highly thermally conducting, the temperatures measured may reflect the average temperature of the water around the submerged hull rather than the temperature of the water nearest the probe. The temperature sensors at C-MAN sites do make point measurements, but the sensors are at fixed distances relative to the bottom; therefore, the thermistor is at different depths throughout the day owing to changing water levels. In highly stratified water, especially during afternoon hours in calm wind conditions, the water temperature reported from a station may be 2 to 3 °C below the skin temperature of the water. Limit and time continuity checks are performed on water temperature measurements.
3.3.6 Ocean Wave Estimates
Sea state estimates are probably the most complex measurements made by NDBC and are extremely important to marine forecasters, mariners, ocean engineers, and scientists. On a buoy, all of the basic wave measurements are derived in some way from the estimated energy spectra of a time series of buoy2 motion (see NDBC Technical Document 03-01 for complete details on NDBC’s wave measurements).
Sea state is a description of the properties of sea surface waves at a given time and place. This might be given in terms of the wave spectrum, or more simply in terms of the significant wave height and some measure of the wave period (AMS, 2000). NDBC moored weather buoy stations provide a measurement of the spectral variance density (IAHR, List of Sea State Parameters) which will be referred to as spectral wave density in the remainder of this document. NDBC derives all non-directional wave parameters, heights and periods, steepness, etc. from spectral wave densities. Furthermore, many NDBC buoys measure the directional wave spectrum and from that NDBC derives mean and principal wave directions, and first and second normalized polar coordinates from the Fourier coefficients that NDBC disseminates through the WMO FM-65 WAVEOB alphanumeric codes (WMO, 1995).
Most of NDBC’s wave quality control tests are applicable to all NDBC systems. In some cases, different parameter identifiers are used, but the same battery of tests are performed. Any system-specific tests or attributes will be noted.
3.3.7 Non-directional Ocean Wave Estimates
NDBC uses accelerometers to measure buoy heave motion. Accelerometers, fixed to remain vertically relative to the hull or stabilized parallel to the earth vertical, are used in buoys and make the vast majority of ocean wave measurements. Vertical stabilization, when used, is achieved through use of the Hippy 40 sensor. This expensive sensor has
built-in mechanical systems for keeping the accelerometer vertical as the buoy and sensor
2 NDBC no longer makes wave measurements at C-MAN stations using laser wave height sensors.

22
tilt.
NDBC operational non-directional-wave measurement systems report estimates of acceleration or displacement spectra. If not directly reported, displacement spectra are derived from acceleration spectra as part of the calculations involved in the shore-side processing of the wave data. From these spectra, average wave period (AVGPD), dominant wave period (DOMPD), significant wave height (WVHGT), and Steepness are calculated. These non-directional-wave parameters are defined as follows:
Average wave period, in seconds, corresponds to the wave frequency that divides the wave spectrum into equal areas.
Dominant wave period or peak wave period, in seconds, is the wave period corresponding to the center frequency of the frequency band with the maximum non-directional spectral density.
Significant wave height, Hm0, is estimated from the variance of the wave displacement record obtained from the displacement spectrum according to following equation:
21
)(40 ⎥⎦⎤
⎢⎣⎡∫= ff dffSH u
lm
where:
S(f) is the spectral density of displacement, df is the width of the frequency band, fu is the upper frequency limit, and fl is the lower frequency limit.
Limit, time-continuity, and relational checks are performed on WVHGT. Further checks are made on the statistical data of the acceleration or displacement time series: The statistics must obey the fundamental relationships between the statistics:
• Means must fall between the maximums and the minimums, • Minimums must be less than maximums, • Maximums must be more than the minimums, and • Standard deviations should not be larger than the difference between the
minimum and maximum. • QMEAN or QMEANRAW should tend to near zero during the entire data
acquisition period.
Significant deviations from zero of QMEAN may indicate sensor failure (particularly in the case of the Hippy 40), or that the buoy has lost trim (in the case of a fixed accelerometer). For these reasons, limit checks are performed on QMEAN. In some cases, because of corruption of the data, these relationships are violated.
23
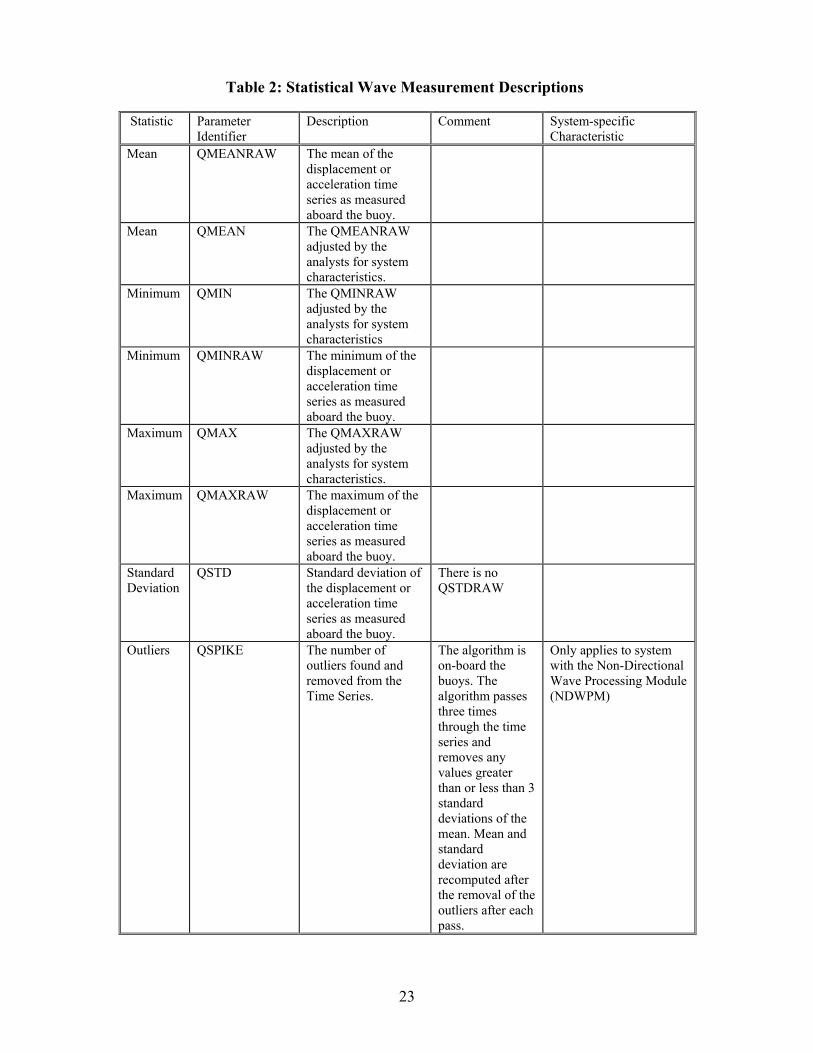
Table 2: Statistical Wave Measurement Descriptions
Statistic Parameter Identifier
Description Comment System-specific Characteristic
Mean QMEANRAW The mean of the displacement or acceleration time series as measured aboard the buoy.
Mean QMEAN The QMEANRAW adjusted by the analysts for system characteristics.
Minimum QMIN The QMINRAW adjusted by the analysts for system characteristics
Minimum QMINRAW The minimum of the displacement or acceleration time series as measured aboard the buoy.
Maximum QMAX The QMAXRAW adjusted by the analysts for system characteristics.
Maximum QMAXRAW The maximum of the displacement or acceleration time series as measured aboard the buoy.
Standard Deviation
QSTD Standard deviation of the displacement or acceleration time series as measured aboard the buoy.
There is no QSTDRAW
Outliers QSPIKE The number of outliers found and removed from the Time Series.
The algorithm is on-board the buoys. The algorithm passes three times through the time series and removes any values greater than or less than 3 standard deviations of the mean. Mean and standard deviation are recomputed after the removal of the outliers after each pass.
Only applies to system with the Non-Directional Wave Processing Module (NDWPM)

24
3.4 DIRECTIONAL OCEAN WAVE ESTIMATES
Directional wave measurement systems require, in addition to the measurement of vertical acceleration or heave (displacement), buoy azimuth, pitch and roll. These allow east-west slope and north-south slope to be computed. NDBC uses several different methods and sensor suites for the measurement of these angles.
The following buoy motion statistical values are reported by the DWA for use in both automated and manual QC:
• AORIG is the buoy azimuth, in degrees, at the beginning of the data acquisition period. The buoy azimuth is defined as the direction of the buoy bow clockwise from true north.
• SDAMIN is the maximum angular excursion counterclockwise of AORIG, in degrees, that the buoy made during the data acquisition period.
• SDAMAX is the maximum angular excursion clockwise of AORIG, in degrees, that the buoy made during the data acquisition period.
• DELTAMIN is the greatest rate of counter clockwise direction change between two consecutive samples, in degrees per second, during the acquisition period.
• DELTAMAX is the greatest rate of clockwise direction change between two consecutive samples, in degrees per second, during the acquisition period.
• ANGPMEAN is the mean of all pitch angles, positive bow up, in degrees, measured during the data acquisition period.
• ANGPMAX and ANGPMIN are the single maximum and minimum pitch angle measurements, positive bow up, in degrees, during the data acquisition period, respectively.
• ANGRMEAN is the mean of all roll angles, positive port up, in degrees, measured during the data acquisition period.
• ANGRMAX and ANGRMIN are the single maximum and minimum pitch angle measurements, positive port up, in degrees, during the data acquisition period, respectively.
• TILTMAX is the single maximum deflection of the buoy mast from the vertical, in degrees, during the data acquisition period. This value must be greater than or equal to all of the following four measurements:
– ANGPMAX – ANGPMIN – ANGRMAX – ANGRMIN
• TOTMAG is the mean magnitude of the vector sum of B1, which is the measurement of the horizontal and vertical components of the earth magnetic field by the magnetometer along the bow and starboard axes of the buoy.
The WPM, DDWM, and DWPM report the above, plus some additional housekeeping quantities, including statistics of east-west and north-south buoy slope (ZXMEAN-MAX-MIN and ZYMEAN-MAX-MIN). The WPM does not, report magnetometer statistics under the ID of TOTMAG. A comparable quantity, B1MEAN is reported as an

25
additional parameter – the mean of the horizontal magnetometers is reported as B1MEAN.
Limit checks are performed on directional-wave environmental and housekeeping measurements to see that they lie within a normal range
3.4.1 Water-column Height for Tsunami Detection
The NDBC tsunameters use DART® II technology and report water-level (actually water-column height) based on pressure and temperature measurements made at the sea-floor and converted to a water-column height by multiplying the pressure by a constant 670 mm per pound per square inch absolute. As with other systems, NDBC assigns ascii ids to the decoded and derived parameters and thus they can be subject to many of the same quality control checks as any ascii ids. There are more than 120 ascii ids to handle the tsunameter data (Appendix F ) because the tsunameters can return two hours of one-minute water-column heights per message when in Event Mode. However, automated QC (Range Check) is only applied to the standard and event mode water-column heights (TSHT1, TSHT2, TSHT3, and TSHT4).
3.5 NON-STANDARD MEASUREMENTS
3.5.1 Relative Humidity
Humidity sensors used by NDBC employ a circuit that measures humidity through the change in capacitance of a thin polymer as it is exposed to variations in water vapor. A gas permeable membrane protects the electronic parts from spray and particulate matter but allows air to enter the instrument housing. The sensor is temperature sensitive and incorporates a temperature probe to provide a temperature correction in the calculation of relative humidity. The sensor samples at a rate of 1Hz during the sampling period. There are five NDBC humidity measurement IDs associated with the ARES and AMPS payloads for expressing humidity: raw relative humidity (RRH), relative humidity (RH1), in units of percent (%); raw dew point (DEWPTRAW), and dew point (DEWPT1 and DEWPT2), in units of °C. The humidity sensor provides RRH and ATMP2. DEWPTRAW is derived on the payload using RRH and ATMP2. The payload transmits the values of DEWPTRAW, RRH, and ATMP2. At the NWSTG, DEWPT1 is calculated using ATMP1 and RRH. RH1 is calculated using DEWPT1 and ATMP1. DEWPT2 is usually the same as DEWPTRAW except under saturated conditions. It may be released as dew point along with ATMP2 if the primary air temperature sensor (ATMP1) has failed. DEWPT1 and DEWPT2 are set to not exceed air temperature under saturated conditions. Payloads previous to ARES and AMPS calculate and transmit DEWPT1 directly. The quantities RRH and ATMP1 are not transmitted, and ATMP2 and DEWPT2 are not available. The relative humidity-to-dew point conversions are given in Appendix B. Range limit checks are performed on DEWPT1 and RH1, and standard time continuity checks are performed on RH1.
3.5.2 Ocean Sensors
In order to understand and predict the ocean, its properties must be monitored. NDBC helps to monitor the ocean by collecting surface currents, ocean current profiles, near
26
surface temperature and water quality parameters. Included in the water quality parameters are turbidity, redox potential (Eh), pH, chlorophyll-a, and dissolved oxygen. These data are collected within the Weather Buoy and Tropical Atmosphere Ocean (TAO) programs. Weather buoy data are quality controlled in real-time and distributed over the Global Telecommunications System (GTS). TAO data are transmitted several times each day from the buoy using the Service Argos system. The TAO data are not quality controlled before being disseminated over the GTS. Daily quality control is applied in the Data Assembly Center and “bad” data may be prohibited from being disseminated the following day.
In this portion of the document, global quality control criteria will be assigned. As more ocean data are collected, regional and then buoy specific quality control criteria are possible.
The Quality Assurance of Real-Time Oceanographic Data (QARTOD) working group started with a small group of data managers and data providers located in the U.S., in the winter of 2003. QARTOD is a continuing multi-agency effort formed to address the quality assurance and quality control issues of the Integrated Ocean Observing System (IOOS) community. The first workshop was held at the NOAA NDBC office at Stennis Space Center, MS in the winter of 2003. Over 80 participants attended with the primary task of developing minimum standards for calibration, quality assurance (QA) and quality control (QC) methods, and metadata. The workshop resulted in a report that summarized the recommendations on these issues and on future workshops. QARTOD II (second workshop) was held February 28-March 2, 2005 in Norfolk, VA, and focused on QA/QC issues in HF radar measurements and wave and current measurements’ unique calibration and metadata requirements. QARTOD III was held on November 2-4, 2005 at the Scripps Institution of Oceanography, La Jolla, CA. It continued the work on waves and current measurements, as well as commencing work on CTD measurements and HF Radar. QARTOD IV was held at the Woods Hole Oceanographic Institution on June 21 - 23, 2006. Related materials are posted on the QARTOD website: http://qartod.org.
QARTOD addresses the challenges related to the collection, distribution and description of real-time oceanographic data. One of the primary challenges facing the oceanographic community will be the fast and accurate assessment of the quality of data streaming from the IOOS partner systems. Operational data aggregation and assembly from distributed data sources will be essential to the ability to adequately describe and predict the physical, chemical, and biological state of the coastal ocean. These activities demand a trustworthy and consistent quality description for every observation distributed as part of IOOS. Significant progress has been accomplished in previous workshops towards the definition of requirements both for data evaluation and relevant data flags for real-time QC.
3.5.2.1 Weather Buoy Currents
Surface currents are collected to support commerce, safety of operation, search and rescue, oil spill response, and currents near harbor entrances that impact ocean transportation. The surface data are also useful for comparison to High Frequency Radar-generated surface current data. NDBC acquires these measurements using buoy-mounted
27
acoustic Doppler samplers. Surface currents are presently being collected using either the SonTek Argonaut MD or the Aanderaa Doppler Current Sensor.
Quality control of surface currents consists of monitoring measurements provided by the sensor and by analyzing the output currents. Two different current measuring systems are currently in use and the first quality control checks differ for each. Both include a measure of the transmitted beam strength, the received beam stream strength, number/percentage of good pings, and values of sensor movement (tilt/roll/pitch, etc).
3.5.2.2 Aanderaa Current Meter
The Aanderaa Doppler Current Sensor (DCS) 4100 is a true vector averaging sensor for measuring current speed and direction in the ocean.
The following identifiers are in addition to those provided above:
• SCMSPD and SCMDIR1 are the current speed and direction measured by the sensor,
• SCMPINGS is the number of good pings collected during a sample by the sensor,, • SCMTILTX is the average number of degrees of tilt in the x direction during a
sampling period, • SCMTILTY is the average number of degrees of tilt in the y direction during a
sampling period.
3.5.2.3 SonTek Argonaut MD
The SonTek Argonaut MD is a three-axis, vector averaging, acoustic Doppler current meter, capable of measuring water motion at a “single point” in the ocean. At NDBC, the SonTek sensor is either mounted via hull penetration, or in the bridle below the buoy and points downward through the legs of the bridle. The data are collected hourly.
• SCMNOIS1, SCMNOIS2, and SCMNOIS3 are the noise levels of the emitted beams, in decibels (db), for each of the three SonTek beams,
• SCMDB1, SCMDB2, and SCMDB3 are the returned power levels, in counts, for the three beams,
• SCMSD1, SCMSD2,and SCMSD3 are the standard deviations of the east, north, and downward components of the currents in cm/s,
• SCMROLSD is the standard deviation of the roll values collected by the sensor, • SCMPITSD is the standard deviation of the pitch values collected by the sensor, • SCMCMPSD is the standard deviation of the compass values collected by the
sensor, • SCMPINGP is the percentage of good pings during the sampling period of the
sensor, • SCMBATT is the reported value of the battery voltage.

28
3.5.2.4 Ocean Current Profiles
Ocean current profiles provide the motion of the ocean in the water column. This information is essential for assessing oil response, search and rescue, stresses on offshore platforms, and input and validation for ocean models. At NDBC, these data are currently acquired from downward-looking, buoy- or cage-mounted systems. On offshore oil platforms, the current profiles may be downward looking from a number of levels in the water column, or upward-looking from a bottom-mounted system.
NDBC currently uses the Teledyne RDI Acoustic Doppler Current Profiler (ADCP) as the primary sensor for collection of ocean current profile data. ADCPs emit short-duration, high-frequency pulses of acoustic energy along narrow beams. Scatterers (assumed to be passive nekton and plankton) within the water column return the backscattered energy and the ADCPs resolve the along-beam Doppler frequency shifts into orthogonal earth coordinates to obtain ocean currents at various levels in the water column. The Teledyne RDI ADCPs use four transducers, which allow redundancy and provides a better measure of the homogeneity of flow. TRDI has established a set of QA tests to insure that the data returned from the sensor is of good quality.
The following data are provided by the TRDI ADCPs. These data can be used to evaluate the quality of the data from the instrument. For the three components of the velocity vector and for the error velocities, the first two characters indicate the measurement type, and the last three characters indicate the bin number:
• UV001-UV023 are the east-west current components for each beam and depth bin. East is positive and west is negative in units of cm/s.
• VV001-VV023 are the north-south current components for each beam and depth bin. Positive indicates a northward current and negative values indicate a southward current in cm/s.
• WV001-WV023 are vertical current components (cm/s) for each beam and depth bin . Positive is upward and negative is downward. The vertical components are generated from the paired horizontal velocities. While it has been found that the values are not useable as true vertical velocities (Winant, et al., 1994), they do indicate whether the horizontal velocities are reliable.
• EV001-EV023 are error velocities calculated internally for each depth bin. The error velocities are a measure of the homogeneity of the flow. High error velocities indicate that the horizontal velocities are unreliable.
• PGT01-PGT23 and PGF01-PGF23 are percent good three and four beam solutions, respectively, and are provided for the quality control algorithms. The values for percent good three and four beams use the first three characters to indicate the parameter and the last two characters to indicate the bin. The percentage of good three beams solutions indicates that one beam has been rejected due to an insufficient number of pings in the bin passing various error thresholds. Percent good four beams indicates measurements with four beam solutions.
• EA101-EA123, EA201-EA223, EA301-EA323, and EA401-EA423 are echo amplitudes reported for each beam and depth bin. The first two characters indicate that this is an echo amplitude measurement, the third character indicates the beam,
29
and the last two characters indicate the bin number. The amplitudes are a measure of the signal strength intensity returned to the transducer. High echo intensities indicate solid targets (bottom, surface, structures, etc.) and low echo amplitudes can alert to insufficient scatterers in the water column.
• CMAG101-CMAG123, CMAG201-CMAG223, CMAG301-CMAG323, and CMAG401-CMAG423 are correlation magnitudes that are a measure of how much the particle distribution in the water has changed between pulse measurements in each beam and bin. Higher correlations indicate a more precise measurement of velocity. The first four characters indicate that this parameter is related to correlation magnitude, the fifth character indicates the beam, and the last two characters indicate the bin being described.
3.5.2.5 Weather Buoy Salinity
Salinity is required to measure the presence and movement of water masses in the ocean. Salinity is a derived product and some instruments provide the salinity directly (through internal calculations) and others provide the conductivity, temperature, and depth required to calculate the salinity. Salinity measurements have been made at a number of C-MAN stations and recently at a number of coastal buoys. Several different instruments have been used to measure the salinity. NDBC salinity measurements are based on the practical salinity scale using the empirical relationship between the salinity and conductivity of seawater. The salinity units are reported in practical salinity units (psu).
Salinity (ZSAL1) is calculated from the conductivity (ZCOND1) and temperature (ZTMP1) collected by the SeaBird 39-SM or the Falmouth Scientific Instruments (FSI) unit. Salinity (ZSSAL) is also provided by the Ocean Sensor Module (OSM), a derivative of the SeaKeepers 1000. Salinity is provided directly from the OSM unit.
3.5.2.6 TAO Ocean Parameters
The Pacific Marine Environmental Laboratory (PMEL) provides Legacy sensors in the Tropical Atmosphere Ocean (TAO) array that provide the following data.
• ATLAS Conductivity Sensor – conductivity data from 1 meter depth provided every 10 minutes. The conductivity data are combined with temperature data to provide a surface salinity value, also. Additional sensors at multiple depths are provided from equatorial moorings.
• ATLAS Temperature Sensor – ocean temperature data from 11 depths (1 meter to 500 meters) provided every ten minutes (10 sensors via an inductive modem cable and one serially).
• ATLAS Fixed Depth Current Meter – current speed and direction at four or five depths at four equatorial moorings. The data are transmitted to the surface buoy daily.
• ATLAS Water Pressure Sensor – ocean pressure data provide from 300 and 500 meter depths. The sensors indicate high current and acts of vandalism that cause the sensors to rise toward the surface.

30
The ocean parameters are averaged in the TAO legacy payload into a daily average for each parameter and depth and transmitted via Service Argos.
Figure 5. TAO Data Path Using Service Argos/CLS.
3.5.3 Precipitation
Siphon Rain Gauges (SRG) have been installed on some moored buoys. No automated QC checks are performed on SRG data. The data are manually checked for correct operation of the sensor.
There are six measurement IDs associated with siphon rain gauges. The measurement IDs are as follows:
• RAINT1ORT is the calculated 10 minute rainfall rate. • RAIN1MIN is the uncorrected one minute rainfall rate. • RAINDYPC is the daily rainfall percentage. • RAINDYRT is the daily rainfall rate. • RAINDYSD is the daily rainfall standard deviation. • RAINHRAC is the hourly rainfall accumulation.
3.5.4 Solar Radiation Measurements
Solar radiation is an important influence on physical, biological, and chemical processes near the air-sea interface, and is therefore of interest to scientists and engineers. Solar radiation measurements taken at the surface have been used to calibrate visible range radiometers aboard satellites. The sensor is placed as high as possible on the platform to avoid shadows. NDBC has supported a number of sponsors by providing measurements of radiation from sensors mounted above (SRAD1) and below (ZRAD1, ZRAD2, and ZRAD3) the water’s surface. Measurement IDs, such as ZRAD, and the unit of measure have varied depending on the application. Solar radiative flux is measured in Watts per square meter and Photosynthetically Active Radiation (PAR) is measured in micromols

31
per square meter per second. Automated QC for these measurements has typically been limited to upper limit checks.
3.5.5 Visibility
Visibility sensors have been placed on some C-MAN stations where visibility is a critical concern for safe navigation. The sensor measures the extinction of light across a small volume of air between an emitter and a collector. It is important to note that these are measurements at a single point and extrapolated, and that there are several similar but different definitions. Appendix C explains some of the various terms used. The NDBC measurement IDs for visibility are: VISIB3 and VISIB4. VISIB4 is the raw visibility reading from the Belfort visibility sensor. The units of measurement are the nautical mile (nmi) and kilometer (km) (1 km = 0.621 mi = 0.541 nmi). VISIB3 is the reported visibility. It is important to note that for VISIB3, all range values greater than or equal to 6.95 nmi are reported as 6.95 nmi.
NDBC archives visibility measurements in nmi. There is an automated QC check that flags visibility and humidity measurements if the visibility is determined to be too high or too low in relation to the measured humidity.
3.5.6 Water Level Measurements
NDBC provides water level measurements at a few C-MAN stations. NDBC provides these measurements to allow NWS forecasters to monitor storm surge, and these measurements are not intended for navigation or shoreline boundary purposes. Such measurements are made at several C-MAN stations using pulse-sounding tide gauges. A total of 31 measurement IDs are reported each hour: ten 2-minute tide averages (TGAUG01 through TGAUG10), ten counts of the number of failed samples made during each 2-minute period (TGCNT01 through TGCNT10), standard deviations of each of the10 averages (TGSTD01 through TGSTD10), and an hourly tide measurement (TIDE1). A 2-minute estimate is made every 6 minutes. The measurements and standard deviations are given in units of feet.TGAUG01, TGCNT01, and TGSTD01 correspond to measurements made during the first 2-minute measurement period of each hour. The hourly measurement, TIDE1, is the same as TGAUG01. Because negative water level values cannot be transmitted over public bulletins, 10 is added to each TGAUGXX and TIDE1 value. The measurement is stored in the NDBC database and in historical files with 10 added to the value. The measurement is displayed in real time on the NDBC web site without 10 being added to the value. NDBC does not calculate Mean Lower Low Water Level. Instead, the lowest water levels for each day over the history of the station are averaged periodically and updated, then the average is set to 0. If adjustments are required, they will be applied either through the database, or directly to the software on the payload. Automated range and time-continuity checks are performed on TIDE1 and TGAUG01-10.
4. QUALITY CONTROL ALGORITHMS AND WARNING FLAGS
This section describes the algorithms used to assign QC flags to NDBC measurements. The basic mechanism used to flag a measurement is to compare it with a threshold value which, when exceeded, assigns a flag. Algorithms differ by measurement and by how the

32
thresholds are derived. Some thresholds are fixed, and some are a function of season or location. The various flags and how they should be interpreted are also described.
4.1 QUALITY CONTROL ALGORITHMS
The number and the complexity of the algorithms have grown steadily over the years. The first developed, the simplest, and the most extensively used algorithm is the range check that simply compares measurement values against pre-established limits stored in the NDBC database. Other simple checks are the time continuity and consistency checks. The vast majority of automated checks are performed in real-time during processing at the NWSTG. There are a few that are performed at NDBC on measurements soon after entering the database. Appendix D provides additional examples and details of selected algorithms to augment the discussions that follow.
There are two types of flags that can be assigned to a measurement as a result of the automated QC process. A hard flag, or EQC flag for Environmental Quality Control, is assigned to a measurement when there is virtually no doubt that it is degraded. Hard flags will remain with the affected parameter and prevent it from being released or archived unless hard flagged manually. A soft flag is assigned to a measurement to indicate that there may be some question about its validity. Soft-flagged measurements will be archived unless it is removed manually by a qualified data analyst. Capital letters are used to denote hard flags, and lower case letters are used to denote soft flags.
Some measurements are dependent on others. For example, the dew point is calculated from the air temperature and relative humidity. If either is degraded, then the dew point will be incorrect. To prevent any propagation of error into derived measurements, a QC routine determines whether any hard flagged data are used in deriving other data. If so, the latter are flagged as related with an R, indicating they are based on flagged data.
Some measurements are closely related to other measurements in such a way that if one measurement is bad the other is also likely to be bad. Examples are wind speed and gust, and wave spectrum and height. If a measurement is related in this manner to another measurement that has been hard flagged, it will be R flagged, and will not be released. Some relationships are hard coded in the QC routines while others are assigned and maintained in the database by data analysts using database interface to NEMIS.
4.1.1 Range Check
The simplest of the automated QC checks is the range limit check. It consists of comparing a measurement with pre-established upper and lower limits. If the measurement is greater than the hard upper limit or less than the hard lower limit, that measurement will be L flagged and will not be released in real time or archived. There are also flexible range checks that vary according to geographic area and season. They work in the same way, but do not prevent the release or archival of a measurement. An a flag indicates a measurement is above a soft limit, and a b flag indicates a measurement is below a limit.
Although range limit checks are station dependent, stations are often grouped into climatologically similar regions. All stations within one of these regions will have the

33
same hard EQC and soft seasonal limits. The NMCA areas are resident within the NEMIS and are maintained using the database interface.
The hard limits are set at three standard deviations from mean climatology values taken from the U.S. Navy Marine Climatic Atlas of the World, Version 1.0, March 1992. They may also be adjusted when new record high and low values are observed from NDBC stations within the area. The hard EQC and soft seasonal limits for each region can be viewed using the database interface. For those parameters that are not supported by the Navy Marine Climatic Atlas, default hard limits in Table 3 are used.
Soft seasonal limits are usually set at two standard deviations from the mean climatology value for a specific area and month.
Range check for the tsunameter water-column heights is set at ± 5 meters from the mean height. The analysts periodically re-compute the mean height. No soft seasonal limits are applied to the tsunameter range checks.
Table 3. Default Upper and Lower Limit Values.
Parameter Lower Upper Dominant Wave Period (s)
1.95 26
Average Wave Period (s) 0 26 Solar Radiation (w/m2) 0 W 1500 Dew Point (°C) -30 40 Precipitation (mm/hr) 0 400 ADCP Current (cm/s) -200 200 Salinity (ppt) 10 70 PAR (µmol m2/s) 0 2500 Relative Humidity (%) 25 102
Water-Column Height (Tsunameter)
-5 m of the mean +5 m of the mean
4.1.2 Time Continuity
Time continuity checks track the change over time of a particular variable. NDBC has derived empirically limits that are used to check the time rate of change of pressure, temperature, wind speed, wave period, wave height, and relative humidity. As with range checks, there are both hard and soft seasonal time continuity checks. A hard flag is indicated by a V and a soft flag by an f.
NDBC uses two different time continuity algorithms. While the basis for each is the same, i.e., comparing the time rate of change in a quantity with a given threshold, the derivations of the limits used for the checks are different. A standard hard time continuity

34
check is used on most NDBC measurements, and some special measurements undergo checks that were derived using statistical formulations unique to the type of measurement..
4.1.2.1 The Standard Time Continuity Check
The standard time continuity check developed at NDBC is based on the following expression:
))(1(2 Τ−=Τ Rσσ
where Τσ is the standard deviation about the mean difference between measurements at a specific time and the corresponding measurements Τ hours later, x(t+Τ ). σ is an estimate of the standard deviation of an ensemble of measurements, and R(Τ ) is the autocorrelation function of an ensemble of measurements for a time lag, Τ .
Statistics were gathered for a number of stations ranging from the Gulf of Alaska to the Gulf of Mexico. It was determined that there is an approximate linear relationship between R(Τ ) and Τ for values of Τ less than 12 hours. Therefore, σ was recast as follows:
Τ=Τ σσ c
This is a practical representation of the general change of a normally distributed meteorological or oceanographic variable with time. The mean 1- to 24-hour changes in atmospheric pressure were determined for a number of stations, and it was found that c equal to 0.58 provided a suitable limit for the naturally allowable change in barometric pressure with time, yielding the following:
Τ=Τ σσ 58.0
This equation is used to check: • Pressure (BARO1, BARO2) • Temperature (ATMP1, ATMP2) • Wind speed (WSPD1, WSPD2) • Wave period (AVGPD) • Wave height (WVHGT) • Relative humidity (RH1)
The time continuity check compares the difference between the last acceptable measurement with the current measurement, Δx, with Τσ . If Δx is greater than Τσ , then the measurement fails, is flagged, and is deleted. If Τ is greater than 3 hours, then 3 hours is used. Special logic is added in the algorithm for checking relative humidity. This is to prevent erroneous flagging during frontal passage when large changes in relative humidity can occur.

35
In practice, it has not been necessary to use station-specific values of the standard deviation of measured variables. The general values in use are listed in Table 4. As with the general range limits, it has been necessary to depart from the general values of Τσ for some stations. For example, since sea surface temperatures at stations close to the Gulf Stream can change abruptly, Τσ for water-temperature measurements off the east coast has been increased to 12.1 °C, based on actual units.
Table 4. General Values of Time Continuity Parameters
Variable σ Sea-Level Pressure (hPa) 21.0 Air Temperature (°C) 11.0 Water Temperature (°C) 8.6 Wind Speed (m/s) 25.0 Wave Height (m) 6.0 Average Wave Period (s) 31.0 Relative Humidity (%) 20.0
There are four exceptions to the time continuity test due to the very rapid changes that occur in wind, pressure, air temperature, and wave height during the passage of tropical cyclones and severe extratropical cyclones. First, air pressure measurements that fail the first time continuity check are re-accepted and released if both BAROcurrent and BAROprevious are less than 1000 hPa. Second, wind speed measurements that fail the first time continuity check are re-accepted and released if both BAROcurrent and BAROprevious are less than 995 hPa. Third, ATMP1 measurements that fail the first time continuity check are re-accepted and released if either WSPDcurrent is greater than 7 m/s or if the wind direction change (WDIRcurrent compared with WDIRprevious) is greater than 40°. Finally, WVHGT measurements that fail the first time continuity check are re-accepted and released if the current wind speed is equal to or greater than 15 m/s.
Soft seasonal time continuity checks are also applied to standard NDBC measurements. Like range checks, they are applied according to geographic region. The soft seasonal time-continuity limits for each region can be viewed using the database interface.
4.1.2.2 Time Continuity Algorithm for Special Measurements
Some measurements require an algorithm for time continuity that is much simpler than the standard time continuity algorithm. Let Δx/Δt be the time rate of change of a variable, let Τ be the time between consecutive measurements, and let k(Τ ) be an empirical function (or constant) that defines the maximum allowable change for a givenΤ. Any measurement x(t+ Τ ) will pass the time continuity check if the following expression is true:
ΤΤ≤Τ−Τ+ )()()( ktxtx
36
The function k(Τ ) is determined empirically for each measurement to which this algorithm is applied. This algorithm is applied to check the time continuity of wave height and ADCP current measurements. The algorithm for this check, as it is applied to ADCP measurements, and the standard time continuity check can be seen in Appendix D.
4.1.3 Storm Limits
Hard range and time continuity limits can be removed in advance of unusual weather situations, such as hurricanes and severe winter storms. The data quality analyst can deactivate the checks by station at NWSTG through the NEMIS interface to the database. When the abnormal situation has passed, the regular range-limit and time-continuity limits are reactivated by the data quality analyst.
4.1.4 Hierarchy Reversal and Duplicate Sensor Checks
NOTE: This algorithm is not used at NDBC, but remains in the handbook as a reference.
Sensor hierarchy of duplicate sensors (WDIR, WSPD, BARO, and related measurements) determines which of the sensors’ data will be released at the NWSTG. Normally, hierarchy is manually set by the data analyst and is not changed unless the primary sensor fails or suffers an obvious deterioration in performance. Often, sensor degradation is sudden, as may be caused by a severe storm, or of such short duration it goes undetected by a data analyst. To overcome this, hierarchy is reversed automatically under certain conditions. This is a powerful algorithm that prevents the release of data from a primary sensor that has suddenly degraded in relation to the secondary sensor. The algorithm identifies data from the primary sensor as degraded when it exceeds region and season specific differences in relation to the secondary sensor in a particular way. When this occurs, the primary sensor is hard flagged with an H and hierarchy is reversed, thus releasing the measurement from the sensor formerly identified as secondary. Sensor hierarchy is reversed only when the data from the secondary sensor has not already been hard flagged. Hierarchy will remain reversed until it is manually reset, or another automatic reversal occurs. Details of the hierarchy reversal algorithm can be found in Appendix D.
This capability can be disabled for some stations that have legitimate reasons for larger than normal differences between two anemometers. For example, bird roosting effects or wake turbulence could cause these differences.
Several other tools have been developed that assign a soft flag to measurements from redundant sensors that suddenly diverge or do not track together. One check identifies when the difference between measurements of duplicate sensors is too high based on established regional and seasonal limits. Both measurements will be k flagged when this occurs. Another check identifies when the time-continuity of differences between measurements of duplicate sensors exceeds regional and seasonal limits. The measurements will be t flagged, and one of the two sensors will be suspect if

37
0102120111 ,)()()()( ttTtxtxtxtx >>−−−
where )(1 tx and )(2 tx are measurements from duplicate sensor, and T is a threshold value determined from past experience.
At present, only hourly changes are compared ( 1t - 1t = 1 h). The algorithm is not used if any of the four measurements in the left side of above equation are missing. Seasonal and regional limits that apply to these checks can be viewed by selecting the NMCA regions tab in the Set-Up Tables tool in the Station Configuration Menu in the NEMIS interface to the database.
4.1.5 Internal Consistency
Internal consistency checks are based on a physical relationship between measurements. There are both hard and soft internal consistency checks. Examples of hard internal consistency checks are:
• GUST1(2) is hard flagged with an L and not released if it is less than WSPD1(2). • Mean, maximum and minimum have (QMEAN, QMAX, and QMIN) are hard
flagged with an S if QMEAN does not fall between QMIN and QMAX. This will prevent the release of all wave related measurements.
• If BATT1 is below 10.5 volts, BARO1 and BARO2 measurements are R flagged. • Low voltage has caused the barometric pressures, BARO1 and BARO2, to report
incorrect values.
Examples of soft internal-consistency checks include the following:
• If the ratio of wind gust (GUST) to wind speed (WSPD) is greater than a maximum value, which is a function of wind speed, wind gust is g flagged. This check is also applied to hourly maximum gust (MXGT) and hourly average wind speed (AVGSPD). Details are in Appendix D.
• Hourly wind speed (WSPD) and the continuous wind speed (CWS), whose time interval include the averaging period of wind speed, are compared. If the absolute difference is greater than 2.0 m/s (buoy) or 3.0 m/s (C-MAN), continuous winds are i flagged.
• Wind direction (WDIR) and average buoy “bow” azimuth (FWDIR) are x flagged if they differ by more than 35 deg and if wind speed is greater than 7 m/s. This check is only applied to 3-m discus buoys that have fins which keep the buoy bow headed into the wind.
• If visibility is either too high or too low relative to the reported dew point depression, RH1, DEWPT1, and VISIB3 are soft flagged with a v.
Some data are deleted or adjusted for practical considerations:
• GUST1 is labeled as missing with an M flag if the gust speed is less than 0.5 m/s. • If DEWPT1 is not less than or equal to the ATMP1, it is set equal to ATMP1 and
c flagged.
38
4.1.6 Wave Validation Checks
Wave checks have been developed that use limit or internal consistency to validate the accuracy of directional and non-directional wave measurements. Some of these checks are applied during real-time processing while others are run at NDBC after wave data are resident in the database.
4.1.6.1 Wind Wave Algorithms
There are two QC methods that compare the wind to wave energy. The Lang algorithm (1987) is used for hour-by-hour checking and assigns soft-flags. The Palao-Gilhousen algorithm (1993) looks at a months’ worth of data to find more elusive sensor degradation, but does not assign flags to the data, it is more a of a visual QC technique (Figure 6).
The statistical wind-wave comparison algorithm developed by Lang uses a relationship between high frequency wave energy and wind speed. The sum of the spectral energy (densities) in the frequency range from 0.20 to 0.27 Hz during the current hour are compared with the square of the mean of the wind speed of the current and previous three hours. When measured wave energy falls beyond pre-established limits when compared to the wind energy, WVHGT is soft flagged. An x assigned to WVHGT indicates wave energy is higher than expected relative to wind speed. A y indicates wave energy is lower than expected. The Lang algorithm performs well but has limitations, especially during cases of light winds and at stations with fetch restrictions. Because of these limitations, observations can be incorrectly flagged as erroneous. The failure of the Lang algorithm could also indicate a problem with the winds sensor, but the algorithm does not assign flags to the wind parameters because it is expected that the wind QC check will catch those.
The Palao-Gilhousen wind-wave algorithm represents a departure from the earlier NDBC QC schemes. Rather than looking at data points hourly, this algorithm looks at hundreds of hours of data. The basis of the algorithm is similar to that of the Lang algorithm: to compare the sum of the observed wave energy values in the range 0.3 through 0.35 Hz to upper and lower limits based on the square of the corresponding 4-hour average wind speed. Limits are not universal. It has been found that buoys of like-hull type exhibit similar wave response characteristics. Therefore, the wind-wave algorithm is dependent on hull type. It has also been found that Great Lakes stations require unique limits. No flags are assigned by the Palao-Gilhousen algorithm check.
Through the use of this tool, the characteristic relationship of wind to wave energy can be visualized. The plots are divided into sectors and the conditional probability density distribution calculated. The density distribution decomposes the entire data cloud into probabilities of occurrences per sector. The upper and lower limits are delineated by the 0.1 percent contour. A month of wind-to-wave observations are depicted on scatter plots superimposed on the station's characteristic 0.1 percent contour. A significant number of points falling outside of the contour may indicate sensor degradation. An example of output from the algorithm is shown in Figure 6. The points inside the outer contour indicate good correlation between wind and wind-wave energy.

39
Figure 6. Example of Output from Palao-Gilhousen Wind-Wave Algorithm.
40
4.1.6.2 Directional Wave Validation Report
The Directional Wave Validation Report is generated daily by a data analyst using a program that conducts a series of hourly checks on specific directional and non-directional wave environmental and housekeeping measurements. All checks unique to this report are limit checks set and are maintained by the data analyst, and are based on each station's geographical location, hull type, and type of directional wave system employed. The flags on this listing are for review only. Unlike the hard and soft flags assigned for real-time processing, which are also indicated on the report, these do not become part of the NDBC database. Measurements that fail to pass one or more of these checks are manually analyzed to determine if degradation of directional wave data has occurred.
4.1.6.3 Swell Direction Check
Buoys near the coast with directional wave systems should not measure significant swell energy coming from shore. For example, the west coast buoy at station 46042, near Monterey Bay, is sheltered from any long-period swell coming from directions 355° clockwise to 135° because of the coastline. Lower and upper limits of the sector, from which swell energy should not come, can be specified using the Wave System Profile page of the NEMIS interface. Each hour the non-directional wave spectrum in the frequency bands from 0.03- to 0.10-Hz is checked for spectral wave energy (C11) that is both greater than 0.5m2/Hz and at least 5 percent of the wave energy of the frequency band with the highest energy (C11MAX). If any of the frequency bands meets the above two conditions and has a corresponding mean wave direction (ALPHA1) from a sheltered direction, then the wave measurements for that hour are soft flagged with a q.
4.1.6.4 High Frequency Spectral Spikes
In general, the spectral energy of wind generated waves decays with increasing frequency (f) proportionally with f-4. Studies have shown that the maximum hourly change of spectral density at higher frequencies is also proportional to f-4. At frequencies above 0.08 Hz, the limit of hourly spectral density change can be represented by:
4006.0))((( −= fdt
fsd (m2/Hz/hr).
This relationship is used to identify anomalous spikes in the high frequency portion of wave displacement spectra. When hourly changes in spectral density exceed the above limit, wave height is m flagged.
4.1.6.5 Wave Height Verses Average Wave Period
WVHGT and AVGPD are compared in a manner similar to how GUST1 or GUST2 is compared to WSPD1 or WSPD2. The threshold value is calculated for two ranges of average period. If the test fails, WVHGT is p flagged. For wave periods of up to 5 seconds, flags will result when the WVHGT exceeds the threshold hmax as given by:

41
455.2max
AVGPDh += (AVGPD ≤ 5s)
For measurements of AVGPD greater than 5 seconds hmax is defined by:
216.1max −⋅= AVGPDh (AVGPD ≥ 5s).
4.1.6.6 Wave Direction vs. Wind Direction
If the difference between mean wave direction (ALPHA1) at 0.35 Hz and wind direction are greater than 25 deg, mean wave direction (MWDIR) is w flagged. This check is only made if wind speed is greater than 7 m/s, the wind direction has not varied by more than 30 deg since the previous report, and wave spectral density at 0.35 Hz is greater than 0.003 m2/Hz.
4.2 NCEP FIELDS
One program at NDBC uses NCEP numerical model fields to determine if sensor performance has degraded. This is particularly valuable for offshore buoys whose remoteness do not permit comparison with other stations. The program compares NDBC measurements with first-guess fields (6-hour forecasts) generated by the NCEP Aviation Model. The fields are pulled from the NCEP ftp site in GRIB format four times daily, corresponding to valid times of 00Z, 06Z, 12Z, and 18Z. The model fields used in the comparison include sea level pressure, the10-m winds, and relative humidity and air temperature at 2-m. Sea surface temperature fields are from a daily sea surface analysis. The program opens the GRIB file, extracts the fields of interest, and interpolates gridded values from a 1.0 by 1.0 degree global grid to station locations. Differences between model output and corresponding station measurements are checked against allowable tolerances. If any are exceeded, the measurements are n flagged. Tolerances can be a function of the measurement being compared or another measurement, and can vary by geographic location. Model output quantities interpolated to station locations are provided measurement IDs and retained in the database. They may be treated as any other database measurement. The algorithms used to compute tolerances are contained in Appendix D.
4.2.1 Continuous Wind Checks
The range limit, time continuity, and dual sensor checks that are performed on continuous winds are the same as those applied to hourly winds. Continuous wind measurements involving speed will not be released if the hourly wind speed fails hard QC checks, nor will those involving direction, if the hourly wind direction fails QC. There are a few additional checks that only apply to continuous winds.
The continuous wind portion of a raw message is checked for transmission errors during real-time processing. If a single error is detected, the individual measurement is T flagged. If more than one error is detected, then all continuous winds from both sensors are T flagged and not released.
42
The standard deviation check of speeds measured during the hour is properly correlated to the hourly average wind speed. It can be shown that the standard deviation of the wind increases with increasing wind speed. The maximum allowable standard deviation is defined by the relation
v142.08.0 +=σ
where v is either WSPD1 or WSPD2 and σ is the maximum allowable standard deviation. The relation for the minimum allowable standard deviation is defined by
v07.0=σ )/8( smv ≤
and
v142.057.0 +−=σ )/8( smv >
Measurements with a standard deviation falling outside these limits will produce a d flag.
4.2.2 Ocean Sensor Algorithms and Checks
Oceanographic quality control flags at NDBC differ from meteorological flags. NDBC uses a system of pass, suspect and fail.
4.2.2.1 Aanderaa Current Meter Quality Assurance (QA)
Number of pings
PASS PINGS ≥ 110 FAIL PINGS < 110
The horizontal tilts
PASS SCMTILTX ≤ 25° FAIL SCMTILTX > 25°
PASS SCMTILTY ≤ 25° FAIL SCMTILTY > 25°
The preceding checks must pass for SCMDIR1 and SCMSPD1 to pass.
Environmental quality control checks include current direction, current speed and vertical velocities:
PASS 0.01° ≤ SCMDIR1 ≤ 360° FAIL SCMDIR1 < 0.01° FAIL SCMDIR1 > 360°
PASS SCMSPD ≤ 100 cm/s

43
FAIL SCMSPD > 100 cm/s
PASS Wv3 ≤ 0.05 * SCMSPD FAIL Wv3 > 0.05 * SCMSPD
4.2.2.2 SonTek Argonaut MD Quality Assurance (QA)
Values for the system power:
SCMDB1, SCMDB2, and SCMDB3 values agree within 50%
Values for the standard deviation of the orthogonal components of the currents:
PASS SCMSD1, SCMSD2, and SCMSD3 ≤ 2.0 SUSPECT Only two of SCMSD1, SCMSD2, or SCMSD3 ≤ 2.0 FAIL Only one or none of SCMSD1, SDMSD2, or SCMSD3 ≤ 2.0
Values for the system noise:
PASS 20 ≤ SCMNOISX ≤ 30 SUSPECT 30 < SCMNOISX ≤ 45 FAIL SCMNOISX < 20 or 45 < SCMNOISX
Values for the standard deviation of roll and pitch:
PASS SCMROLSD ≤ 5° SUSPECT 5° < SCMROLSD ≤ 20° FAIL 20° < SCMROLSD
PASS SCMPITSD ≤ 5° SUSPECT 5° < SCMPITSD ≤ 20° FAIL 20° < SCMPITSD
Values for the standard deviation of compass heading:
PASS SCMCMPSD ≤ 10° SUSPECT 10° < SCMCMPSD ≤ 25° FAIL 25° < SCMCMPSD
Values for the ping percentage:
PASS PINGP ≥ 90% FAIL PINGP < 90%
Value of the battery voltage:
PASS SCMBATT ≥ 10 volts FAIL SCMBATT < 10 volts

44
4.2.2.3 Quality Control of the ADCP Data from NDBC Weather Buoys
QC algorithms for the 75, 300, 600, and 1200 kHz TRDI ADCPs are provided. In order to extend the life of the ADCPs, several sampling rates are required; one second sampling, two second sampling, and 2.5 second sampling over a five minute period. The number of pings is related to the sampling rate and fewer pings result in longer life for the batteries and the ADCP. The criteria below cover all circumstances.
One second sampling interval over 300 seconds (5 minutes) to account for buoy motion due to waves. The size and number of the bins do not impact the threshold values.
Error Velocity:
Pass ≤ 5 cm/s 5 cm/s < Suspect ≤ 20 cm/s Fail > 20 cm/s
Percent Good Thresholds:
Pass ≥ 19% 19% > Suspect ≥ 15% Fail < 15%
Correlation Magnitude Thresholds:
Pass ≥ 115 115 > Suspect ≥ 63 Fail < 63
Vertical Velocity Thresholds:
Pass ≤ 10 cm/s 10 cm/s < Suspect ≤ 20 cm/s Fail > 20 cm/s
Horizontal Speed Thresholds:
Pass ≤ 100 cm/s 100 cm/s < Suspect ≤ 150 cm/s Fail > 150 cm/s
Two second sampling interval over 300 seconds (5 minutes) to account for buoy motion due to waves. All values are the same except:
Percent Good Thresholds:
Pass ≥ 38% 38% > Suspect ≥ 30% Fail < 30%
The sampling rate of the 150 kHz must be 2 seconds or greater. At 2 seconds, the following percent good thresholds apply:
Pass ≥ 56% 56% > Suspect ≥ 45% Fail < 45%
In water shallower than 1500 meters, the sampling rate for the 75 kHz ADCP is 2.5 seconds, due to possible interactions with the bottom contaminating the return signal. All the above thresholds apply, except:
Percent Good Thresholds:
Pass ≥ 48% 48% > Suspect ≥ 38% Fail < 38%

45
4.2.2.4 Quality Control of the ADCP Data from the Oil and Gas Industry
The oil and gas industry generally powers ADCPs by external power from the production or drilling rigs. This allows for more energy to be used to acquire current profiles.
QC algorithms for the 38 and 75 kHz ADCPs are provided. The 38 kHz ADCP operates in narrow-beam and broad-beam modes and the QC data for both are presented.
Error Velocity:
Pass ≤ 15 cm/s 15 cm/s < Suspect ≤ 30 cm/s Fail > 30 cm/s
Percent Good Thresholds:
38 kHz:
Pass ≥ 25% 25% > Suspect ≥ 22% Fail < 22%
75 kHz:
Pass ≥ 10% 10% > Suspect ≥ 5% Fail < 5%
Correlation Magnitude Thresholds:
38N kHz:
Pass 3beam ≥ 110 Suspect 2beam ≥ 110 Fail 1beam ≥ 110
38W kHz:
Pass 3beam ≥ 190 Suspect 2beam ≥ 190 Fail 1beam ≥ 190
75 kHz:
Pass 3beam ≥ 64 Suspect 2beam ≥ 64 Fail 1 beam ≥ 64
Vertical Velocity Thresholds:
Pass ≤ 30 cm/s 30 cm/s < Suspect ≤ 50 cm/s Fail > 50 cm/s
Horizontal Speed Thresholds:
Pass ≤ 125 cm/s 125 cm/s < Suspect ≤ 250 cm/s Fail > 250 cm/s
In order to account for beam interactions with the bottom, surface, and in-water structures, the echo intensities are used. For the oil and gas data, the following test is performed on all bins after the 15th bin:
PASS No adjacent bin differences > 30 counts for any single beam SUSPECT Adjacent bin differences > 30 counts on 1 beam FAIL Adjacent bin differences > 30 counts on 2 or more beams
46
The individual bin status is assigned based on the following:
PASS All tests in the bin were Pass SUSPECT Fewer than half bin tests were flagged Fail FAIL More than half bin tests were flagged Fail
Finally, a profile flag is assigned based on the following:
PASS All bin status results were Pass SUSPECT Fewer than half of bin status were Fail FAIL More than half of bin status were Fail
4.2.2.5 Weather Buoy Salinity
Salinity (ZSAL1) is calculated from the conductivity (ZCOND1) and temperature (ZTMP1) collected by the SeaBird 39-SM or the Falmouth Scientific Instruments (FSI) unit.
PASS -2° C ≤ ZTMP1 ≤ 40° C (Water temperature EQC limits are often substituted) PASS 0 ≤ ZCOND1 ≤ 7 Siemens/m PASS 0 ≤ ZSAL1 ≤ 42 psu. (Station specific limits are often substituted)
Salinity is also provided by the Ocean Sensor Module (OSM), a derivative of the SeaKeepers 1000. Salinity is provided directly from the OSM unit.
PASS -2° C ≤ ZSTMP1 ≤ 40° C (Water temperature EQC limits are often substituted) PASS 0 ≤ ZSCOND ≤7 Siemens/m PASS 0 ≤ ZSSAL ≤ 42 psu Station specific limits are often substituted)
4.3 NDBC FLAGS
The use of flags is indispensable in the NDBC data QC effort. Flags signal to the data quality analyst that a measurement has failed one or more automated data QC checks. Flags can appear on any of several reports and graphical displays available to the data analyst. The previous section discussed the various QC algorithms and the flags they would trigger. This section describes the various meanings behind the flags without the detail of the previous section. An abbreviated version of flag meanings is given in Appendix E.
4.3.1 Hard Flags
Hard flags prevent a measurement from being released in real-time and must be manually removed before a measurement can be archived. Most QC displays that show the presence of flags can only indicate one flag. When a measurement fails two or more hard QC checks, the flag with the higher priority is printed.

47
4.3.1.1 D Flag — Delete Sensor from NWS Report
If measurements from a sensor are not to be released in real-time, the D flag for that measurement is set. It is manually set by a data analyst who has assessed the reliability of the sensor. A D flag does not mean that a measurement has necessarily failed any automated QC checks.
4.3.1.2 H Flag — Sensor Hierarchy Has Reversed
Hierarchy of dual sensors is reversed automatically under certain conditions. A measurement from the primary sensor is identified as degraded when it exceeds region and season specific differences in relation to the secondary sensor in a particular way. When this occurs, the primary sensor is hard flagged with an H and hierarchy is reversed. Hierarchy will remain reversed until it is manually changed or another hierarchy reversal occurs. The algorithm is discussed in Section 4.1.4.
4.3.1.3 L Flag — Failed Range Limits Test
If a measurement is less than a lower limit or greater than an upper limit, then an L flag is set. L is also used to flag wind gust (GUST1 or GUST2) if it is less than the corresponding wind speed (WSPD1 or WSPD2).
In addition, NDBC applies the L flag to wave direction parameters, MWD, SWDIR, or WWDIR, when the applicable period occurs outside of the normal operational range of the system. As an example, NDBC flags the wave directions for periods less than or equal to 5 seconds from 10- and 12-meter hulls because studies have shown that these directions are often unreliable.
4.3.1.4 M Flag — Missing Sensor Data
The M flag is assigned to missing measurements as a result of corrupted or truncated messages during real-time processing. Also, if data are missing in the database as result of a message not being received at the NWSTG, an M is assigned. In most data extraction reports, an M flag will appear next to the default value (0.0) if data are missing.
4.3.1.5 N Flag – Negative Spectral Wave Density
NDBC assigns the N flag to WVHGT if the spectral wave density for any frequency band is a negative number. Having retired the covariance (autocorrelation) wave analysis, the present use of Fast Fourier Transforms to perform the spectral analysis precludes there being any negative spectral wave density values.
4.3.1.6 R Flag — Related Measurement Failed
Measurements may be defined in the database as related. An R flag is assigned to a measurement if a measurement to which it is related is hard flagged.
48
4.3.1.7 S Flag — Invalid Statistical Parameter
Mean, maximum, and minimum heave (QMEAN, QMAX and QMIN) are hard flagged with an S if QMEAN does not fall between QMIN and QMAX. When an S flag is set, WVHGT is also T flagged, and no wave related measurements are released.
4.3.1.8 T Flag — Transmission Parity Error
If a single error is encountered in the continuous winds portion of a message, the individual measurement having the error will be T flagged. If more than one error is encountered in the continuous winds portion of a message, all continuous wind measurements, from both sensors, are T flagged. For non-WPM wave systems, if an error is encountered anywhere in the waves portion of a message all wave data are T flagged. T flag is also assigned to DART® data when the checksum test fails.
4.3.1.9 U Flag – Discrete Wave Parameters are not valid
NDBC assigns the U flag to the DOMPD and MWD measurements when the WVHGT is below the low-energy threshold. In low energy situations (see c Flag), the discrete parameters, such as DOMPD and MWDIR, can vary radically from report to report with very small and unimportant changes in the spectral density. In February 2008 the low-energy threshold was set at 0.15 meters, but changed in June 2008 to 0.25 meters to be consistent with encoding of the wave parameters in WMO messages.
4.3.1.10 V Flag — Failed Time-Continuity Test
The V flag is set when a measurement exceeds the allowable change in a variable over time. Several algorithms for calculating the allowable change are used. They are discussed Section 4.1.
4.3.1.11 W Flag — WPM Transmission Errors
If the WPM portion of a raw message is short, or if parity errors or checksum failures are detected, WVHGT will be W flagged, and all wave related data will not be released. This is similar to the T flag assigned to non-WPM wave messages.
4.3.2 Soft Flags
Soft flags are set on measurements that are suspect. These flags alert the data quality analyst to take a closer than normal look at the measurement and other related measurements to determine the quality of the data. Data that have been soft-flagged will continue to be released and archived until the data quality analyst decides that the data are bad and should no longer be released.
4.3.2.1 a and b Flags — Above or Below Regional and Seasonal Limits
The a and b flags are set on a measurement if its value falls above (a) or below (b) regional and monthly limits. Regional and seasonal limits are discussed in section 4.1.1.

49
4.3.2.2 c Flag — Calm Sea State Flag or Corrected Value
In February 2008, NDBC ceased the correcting of wave parameters to zero when WVHGT was less than 0.15 m. Instead NDBC now retains the original measurements, but uses the U flag on the discrete parameters of DOMPD and MWDIR (see U Flag). In June 2008, the threshold was changed to 0.25 meters to be consistent with encoding of the wave parameters in WMO messages.
When DEWPT1is greater than the corresponding ATMP1, DEWPT1 is set equal to ATMP1 and c flagged. The same is true for DEWPT2 and ATMP2.
4.3.2.3 d Flag — Failed Standard Deviation Check (Continuous Winds Only)
When continuous wind measurements fail the standard deviation check discussed in section 4.1.9, they are d flagged.
4.3.2.4 f Flag — Failed Hourly Time Continuity Check
Measurements that exceed seasonal time rate of change (time continuity) limits are f flagged. Seasonal limits are described in Section 4.1.2.1.
4.3.2.5 g Flag — Failed Gust-to-Mean Speed Ratio Check
A g flag is assigned to wind gust (GUST1 or GUST2) measurements when the gust-to-mean speed (WSPD1or WSPD2) ratio exceeds established limits that are a function of wind speed.
4.3.2.6 i Flag — Continuous and Hourly Wind Speeds Don’t Agree
If the difference between standard wind speed and the corresponding continuous wind speed exceeds established limits, then continuous wind speeds are i flagged.
4.3.2.7 j Flag — Continuous Wind Transmission Error
If one transmission error is detected anywhere in the continuous winds portion of a message, the measurement having the error is T flagged and all other continuous wind measurements are j flagged. If more than one error is detected, all continuous winds are T flagged and not released.
4.3.2.8 k Flag — Deltas Between Duplicate Sensors Too High
If the difference between measurements from dual sensors is greater than the regional and seasonal limits, both are k flagged. The check is described in Section 4.1.4.
4.3.2.9 m Flag — Failed Spectral Time-Continuity Check(C11)
If spikes in the high frequency wave spectrum are detected, WVHGT is m flagged. The check is described in Section 4.1.7.4.
50
4.3.2.10 n Flag — Failed NCEP Model Comparison
If a measurement exceeds limits established for comparison with NCEP model fields, it is n flagged.
4.3.2.11 p Flag — Failed Wave Height/Wave Period Check (Wave Periods Only)
WVHGT and AVGPD are compared in a manner similar to GUST1 or GUST2 is compared with WSPD1 or WSPD2. The threshold value is calculated for two ranges of average period. If the test fails, AVGPD is p flagged. The algorithm is discussed in Section 4.1.7.5.
4.3.2.12 q Flag — Failed Directional-Wave Algorithm
When mean wave directions (ALPHA1) in the low frequency range imply that swells are coming from shoreward, a q flag is assigned to WVHGT. The directional-wave algorithm that assigns this flag is described in Section 4.1.7.3.
4.3.2.13 r Flag — Relate Measurement Failed (Continuous Winds Only)
If a related message has failed a QC check then the measurement is r flagged. This applies to continuous winds only.
4.3.2.14 s Flag — Failed Stuck Compass Check
If raw compass measurements (RCOMP) do not change over three consecutive reports, RCOMP and wind direction (WDIR) are s flagged. This indicates that the compass may have failed, and as a result, wind directions may be inaccurate.
4.3.2.15 t Flag — Tendency Deltas Between Duplicate Sensors Too High
The time rate of change of the differences between measurements of dual sensors are compared. If the difference is too much, based on seasonal and regional thresholds, a t flag is assigned to both measurements. WSPD1 and WSPD2 and BARO1 and BARO2 are compared. The check is discussed in Section 4.1.4.
4.3.2.16 v Flag — Failed Humidity Verses Visibility Check
If visibility is either too high or too low when compared to the reported dew point depression, RH1, DEWPT1, and VISIB3 are soft v flagged
4.3.2.17 w Flag — Failed Wave Direction Verses Wind Direction Check
If the difference between mean wave direction (ALPHA1) at 0.35 Hz and wind direction are greater than 25 deg, mean wave direction (MWDIR) is w flagged.
51
4.3.2.18 x and y Flags — Failed Wind-Wave Algorithm Limits
When wind generated wave energy is higher than expected based on the recent wind speed measurements wave height (WVHGT) is assigned an x flag. When wind generated wave energy is lower, it is y flagged. The algorithm is discussed in Section 4.1.7.1.
4.3.2.19 z Flag — Failed Average Bow Azimuth Verses Wind Direction
Wind direction (WDIR) and average buoy bow azimuth (FWDIR) are z flagged if they differ by more than 35 deg and if wind speed is greater than 7 m/s. This check is only applied to buoys equipped with fins (e.g. 3-meter discus buoys).
4.4 DATA QUALITY REPORTS AND GRAPHICS
Flags that have been assigned to measurements through automated QC checks are retained in the NDBC database. There are variety of reports and graphic displays available to the data analyst for reviewing data that have been flagged. Some of these applications are run on a daily basis, in batch mode, and others are initiated by the data analyst as required (National Data Buoy Center, 1998). In either case, measurements are extracted from the database and displayed in tables or graphical format. Any flags that have been assigned to a measurement are indicated on the display. This section will describe some of the applications used in this process.
4.5 REPORTS AND GRAPHICS
There are a variety of reports and graphics that can be generated by the analyst to extract and view measurements from the NDBC database. They offer a degree of flexibility to suit a variety of needs by data quality analysts.
4.5.1 The NDBC Visualization Tools Suite (VTS)
The VTS is the primary tool used by data quality analyst to validate data. It provides analysts with multiple ways of evaluating data. The suite allows analysts to view data in tabular form and in graphical form using time series plots.
The VTS provides measurements taken over a 24 hour period in tabular form. Primary station measurements are included in the suite, as are the difference between measurements of dual sensors. Some important housekeeping measurements are also contained in the suite, including battery voltage and current. Flags are indicated by coloring the data that have flags applied and displaying the flag adjacent to the data. Different color schemes are used to describe which flag was applied.
The VTS includes customized pre-generated plots. Time series plots include both 24 hour and 72 hour graphs. The 24 hour plots allow for a more detailed evaluation, and 72 hour plots allow analysts to see larger temporal tendencies. Analysts view sensor data independently with flags and analysts can define related measurements to be plotted on the same time-series plot. For instance, air temperature can be plotted against the air temperature of a nearby station or against numerical model data. Analysts may choose to view air temperature and wind direction on the same graph. A sharp change in wind

52
direction and air temperature at the same time may correlate to a frontal passage, thus giving physical justification for a sharp rate of change of a parameter. The analysts have the flexibility to relate any set of available parameters to each other allowing for an efficient evaluation of data (Sears, 2008).
4.5.2 The NDBC Plotting Server
The plotting server retrieves data from the Oracle® database and delivers it in graphical format to the user’s Web browser. Available plots include:
• Single and Stacked Time Series: Plots of any station measurement contained in the NDBC database may be plotted. Gridded model fields interpolated to station location. Up to three measurements from two stations may be plotted on a single plot. Stacked plots offer the user the option to plot up to six measurements for a given station on up to three stacked plots. Time periods are user specified.
• General Purpose Scatter Plots: These permit plotting any two measurements available in the database. The measurements may be from the same or different stations.
• Spectral Wave Plots: These provide the option of plotting wave spectral density, spectral direction, or both.
• Wave Energy vs. Wind Speed Scatter Plots: These plots are useful for determining if wind-wave energy is high or low relative to wind speed, and if a heave sensor may be degraded. Their use is described in Section 4.1.6.1.
• The Vertical Profile Plot program accesses the production Oracle® database to retrieve and plot CTD/Ocean Current data for the specified date/time for the selected stations. The user may select one or more measurements provided that no more than two units of measure are plotted.
• DART® Event Plots retrieve and encode all data from designated time periods. • Station Position Plots: These display station position in relation to a station’s
watch circle.
4.5.3 User Specified Reports
The NDBC Oracle® database interface offers the user a variety of reports that will extract and display data. These are intended primarily as computer screen displays, but they may be printed if required by the user. These include:
• MET DIFFS: This is the same as the pre-generated report discussed in Section 5.1.1, but the user may specify the stations and time period of the report.
• Time Tabulation (TIME TAB) Report: Allows the user to specify up to 10 measurements from a single station to create a measurement vs. time display. This application is useful for extracting and writing data to files for use in other applications.
• Meteorological Measurements by Station (MET MEAS) Report: This report displays a listing of all measurements expected from a station, their value, and any flags that have been assigned. Single or multiple hours may be requested. The report is useful in determining what environmental and housekeeping measurements are actually being reported by a station.
53
• Station Location Report: This report displays station position in a table over a time period specified by the user for each of the station’s applicable locating systems (GPS, LORAN, etc.). The distance from mooring in nautical miles and as a percentage of the watch circle are indicated for each position.
• Wave Summary Report: This report displays the primary wave measurements (WVHGT, DOMPD, and AVGPD) and non-directional and directional spectral values for each frequency for a specified hour. Other environmental and statistical housekeeping measurements relevant to determining the health of the wave measuring system are also displayed.
54
5. REFERENCES
American Meteorological Society, 2000: Glossary of Meteorology, Second Edition.
Brown, H., and Gustavson, R., 1990: Infrared laser wave height sensor, Proc. Marine Instrumentation '90, 141-150.
Grasshoff, K., 1983: Determination of salinity, Methods of Seawater Analysis, K. Grasshoff, M. Ehrhardt, K. Kremling, Eds., Verlag Chemie, Weinheim, pp. 31-59.
Lang, N.C., 1987: An algorithm for the quality checking of wind speeds measured at sea against measured wave spectral energy, IEEE J. of OCEAN. ENG., OE-12(4), 560-567.
Liu, W.T., Katsaros, K.B., and Businger, J.A., 1979: Bulk parameterization of air-sea exchanges of heat and water vapor including the molecular constants at the interface, J. Atmos. Sciences, 36, 17221735.
National Data Buoy Center/NTSC, 2007: Sea level pressure reduction, NDBC Technical Services Contract Instruction/Procedure D07-053.
National Data Buoy Center, 1998: Tapered QC, NDBC Technical Document 98-03.
National Data Buoy Center,1996: Nondirectional and directional wave data analysis procedures, NDBC Technical Document 96-01, January.
National Weather Service, 1980: Computer calculated sea level pressure for automatic weather stations, NWS Technical Procedures Bulletin No. 291, November 14.
Palao, I.M. and Gilhousen, D.B, 1993: A Re-derivation of the NDBC Wind-Wave Algorithm, Proc. of WAVE'93, Second International Symposium, New Orleans, LA July 25-28, 1993, published by American Society of Civil Engineers, pp. 569-575.
Saucier, W.J., 1955: Principles of Meteorological Analysis, University of Chicago Press, p. 9.
Sears, I., 2008: An Overview of Quality Control Procedures For Buoy Data at the National Oceanic and Atmospheric Administration’s National Data Buoy Center. Proceedings of the Environmental Information Management Conference.
Tetens, O., 1930: Zeitschrift für Geophysik, Vol. VI.
Winant, C., Mettlach, T., Larson, S., 1994: Comparison of buoy-mounted 75-kHz Acoustic Doppler Current Profilers with vector-measuring current meters. Journal Atmospheric and Oceanic Technology, Volume 11, 1317-1333
WBAN, 1963: Manual of Barometry, Vol 1, Ed 1, U.S. Government Printing Office, Washington, D.C.
55
WMO, 2006: Guide to Meteorological Instruments and Observations, WMO-No. 8, Seventh Edition, World Meteorological Organization, Geneva, Switzerland.
WMO, 1995: WMO No. 306 Manual on Codes, Alphanumeric Codes, Volume 1, Geneva, Switzerland.
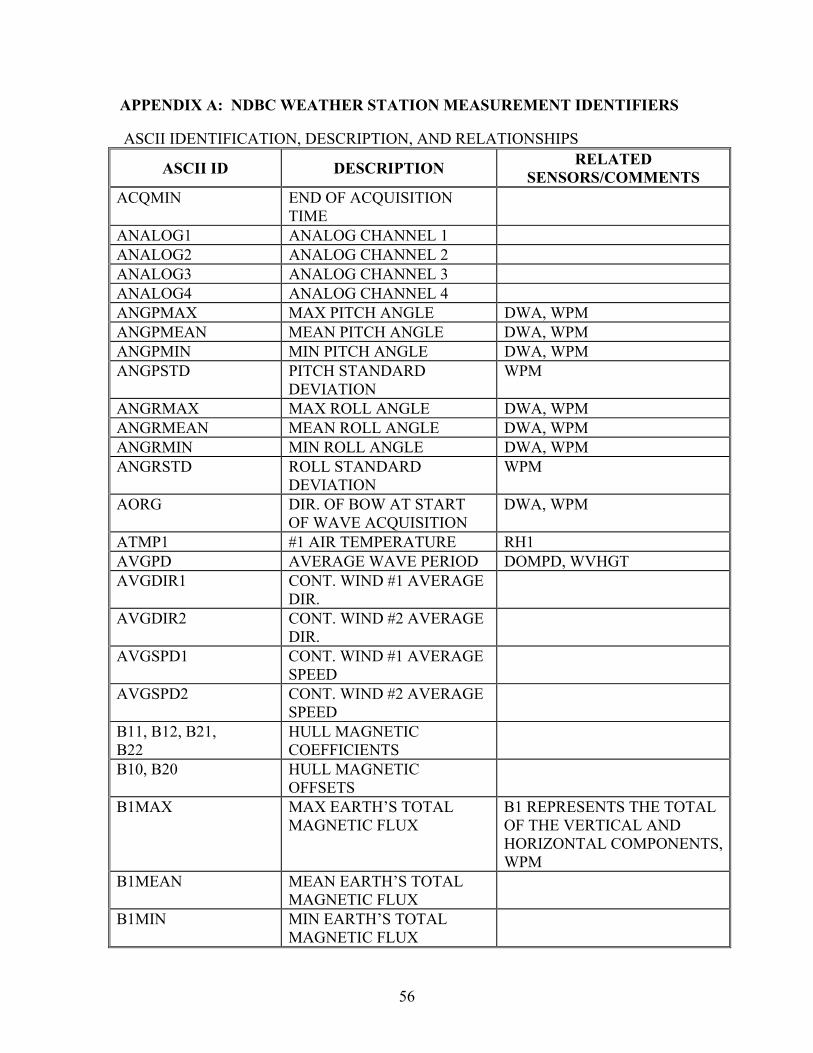
56
APPENDIX A: NDBC WEATHER STATION MEASUREMENT IDENTIFIERS
ASCII IDENTIFICATION, DESCRIPTION, AND RELATIONSHIPS
ASCII ID DESCRIPTION RELATED SENSORS/COMMENTS
ACQMIN END OF ACQUISITION TIME
ANALOG1 ANALOG CHANNEL 1 ANALOG2 ANALOG CHANNEL 2 ANALOG3 ANALOG CHANNEL 3 ANALOG4 ANALOG CHANNEL 4 ANGPMAX MAX PITCH ANGLE DWA, WPM ANGPMEAN MEAN PITCH ANGLE DWA, WPM ANGPMIN MIN PITCH ANGLE DWA, WPM ANGPSTD PITCH STANDARD
DEVIATION WPM
ANGRMAX MAX ROLL ANGLE DWA, WPM ANGRMEAN MEAN ROLL ANGLE DWA, WPM ANGRMIN MIN ROLL ANGLE DWA, WPM ANGRSTD ROLL STANDARD
DEVIATION WPM
AORG DIR. OF BOW AT START OF WAVE ACQUISITION
DWA, WPM
ATMP1 #1 AIR TEMPERATURE RH1 AVGPD AVERAGE WAVE PERIOD DOMPD, WVHGT AVGDIR1 CONT. WIND #1 AVERAGE
DIR.
AVGDIR2 CONT. WIND #2 AVERAGE DIR.
AVGSPD1 CONT. WIND #1 AVERAGE SPEED
AVGSPD2 CONT. WIND #2 AVERAGE SPEED
B11, B12, B21, B22
HULL MAGNETIC COEFFICIENTS
B10, B20 HULL MAGNETIC OFFSETS
B1MAX MAX EARTH’S TOTAL MAGNETIC FLUX
B1 REPRESENTS THE TOTAL OF THE VERTICAL AND HORIZONTAL COMPONENTS, WPM
B1MEAN MEAN EARTH’S TOTAL MAGNETIC FLUX
B1MIN MIN EARTH’S TOTAL MAGNETIC FLUX
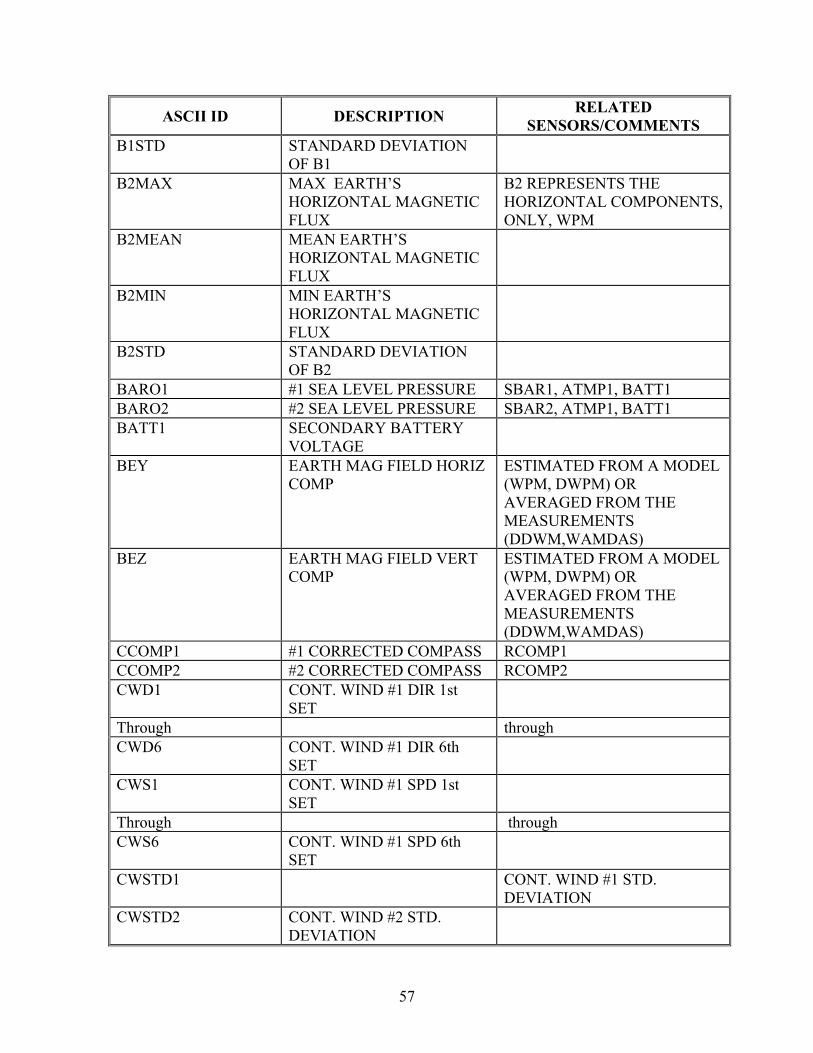
57
ASCII ID DESCRIPTION RELATED SENSORS/COMMENTS
B1STD STANDARD DEVIATION OF B1
B2MAX MAX EARTH’S HORIZONTAL MAGNETIC FLUX
B2 REPRESENTS THE HORIZONTAL COMPONENTS, ONLY, WPM
B2MEAN MEAN EARTH’S HORIZONTAL MAGNETIC FLUX
B2MIN MIN EARTH’S HORIZONTAL MAGNETIC FLUX
B2STD STANDARD DEVIATION OF B2
BARO1 #1 SEA LEVEL PRESSURE SBAR1, ATMP1, BATT1 BARO2 #2 SEA LEVEL PRESSURE SBAR2, ATMP1, BATT1 BATT1 SECONDARY BATTERY
VOLTAGE
BEY EARTH MAG FIELD HORIZ COMP
ESTIMATED FROM A MODEL (WPM, DWPM) OR AVERAGED FROM THE MEASUREMENTS (DDWM,WAMDAS)
BEZ EARTH MAG FIELD VERT COMP
ESTIMATED FROM A MODEL (WPM, DWPM) OR AVERAGED FROM THE MEASUREMENTS (DDWM,WAMDAS)
CCOMP1 #1 CORRECTED COMPASS RCOMP1 CCOMP2 #2 CORRECTED COMPASS RCOMP2 CWD1 CONT. WIND #1 DIR 1st
SET
Through through CWD6 CONT. WIND #1 DIR 6th
SET
CWS1 CONT. WIND #1 SPD 1st SET
Through through CWS6 CONT. WIND #1 SPD 6th
SET
CWSTD1 CONT. WIND #1 STD. DEVIATION
CWSTD2 CONT. WIND #2 STD. DEVIATION

58
ASCII ID DESCRIPTION RELATED SENSORS/COMMENTS
DELTAMAX MAX RATE OF ROTATION DWA DELTAMIN MIN RATE OF ROTATION DWA DEWPT1 #1 DEW POINT RH1, ATMP1 DIRMXGT1 CONT. WIND #1 DIR MAX
GUST
DIRMXGT2 CONT. WIND #2 DIR MAX GUST
DNIMPV DAY/N IMPULPHYSIK VG DOMPD DOMINANT WAVE PERIOD AVGPD, WVHGT FWDIR FORWARD DIRECTION
(MEAN HEADING OF THE BUOY DURING THE WAVE ACQUISITION PERIOD)
DWA, WPM
GPSLAT GPS LATITUDE GPSLON GPS LONGITUDE GPSSEC HOURS SINCE MIDNIGHT GUST1 #1 WIND MAX 5" GUST GUST2 #2 WIND MAX 5" GUST IPCURR INPUT CURRENT MAGVAR LOCAL MAGNETIC
VARIATION (DECLINATION)
DIRECTIONAL WAVE SYSTEMS
MWDIR MEAN WAVE DIRECTION MXGT1 CONT. WIND #1 MAX 5"
GUST
MXGT2 CONT. WIND #2 MAX 5" GUST
MXMIN1 CONT. WIND #1 MIN OF MXGT1
MXMIN2 CONT. WIND #2 MIN OF MXGT1
ORG11 MEAN PRECIP (MINS 51-05) ORG12 STD DEV (MINS 51-05) ORG13 MAX PRECIP (MINS 51-05) ORG14 MEAN PRECIP (MINS 06-20) ORG15 STD DEV (MINS 06-20) ORG16 MAX PRECIP (MINS 06-20) ORG17 PCT. OF RAIN (MINS 51-20) ORG21 MEAN PRECIP (MINS 21-35) ORG22 STD DEV (MINS 21-35) ORG23 MAX PRECIP (MINS 21-35)
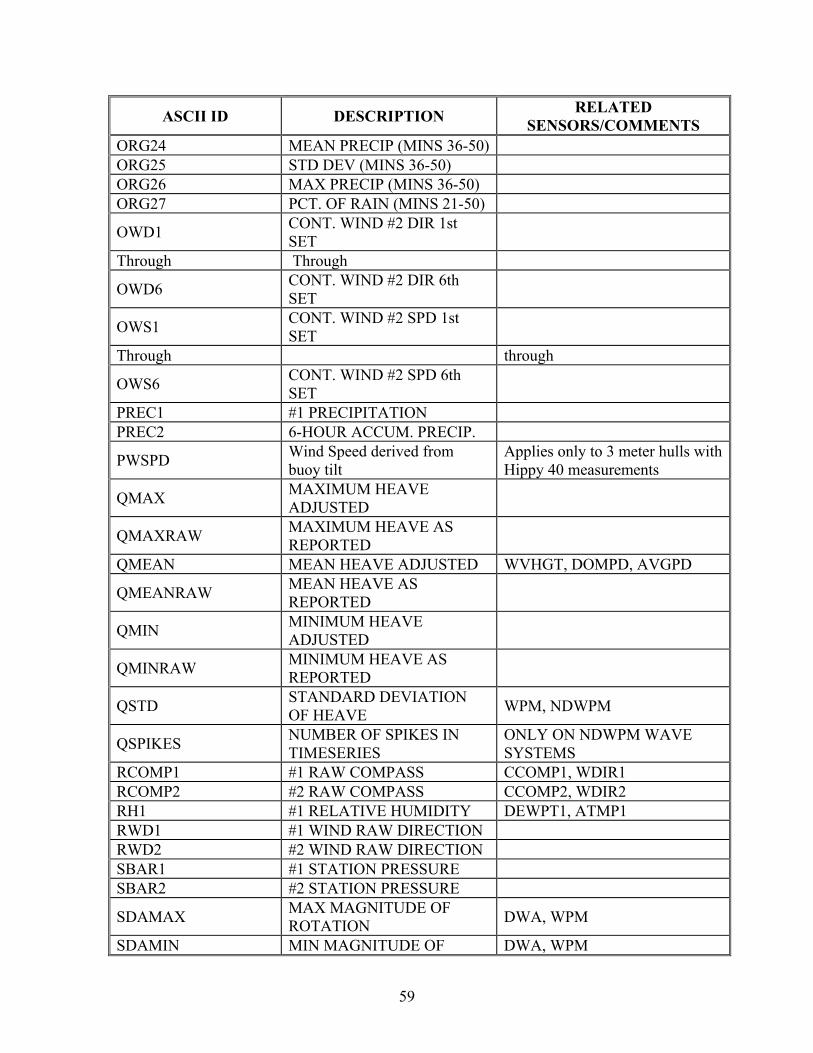
59
ASCII ID DESCRIPTION RELATED SENSORS/COMMENTS
ORG24 MEAN PRECIP (MINS 36-50) ORG25 STD DEV (MINS 36-50) ORG26 MAX PRECIP (MINS 36-50) ORG27 PCT. OF RAIN (MINS 21-50)
OWD1 CONT. WIND #2 DIR 1st SET
Through Through
OWD6 CONT. WIND #2 DIR 6th SET
OWS1 CONT. WIND #2 SPD 1st SET
Through through
OWS6 CONT. WIND #2 SPD 6th SET
PREC1 #1 PRECIPITATION PREC2 6-HOUR ACCUM. PRECIP.
PWSPD Wind Speed derived from buoy tilt
Applies only to 3 meter hulls with Hippy 40 measurements
QMAX MAXIMUM HEAVE ADJUSTED
QMAXRAW MAXIMUM HEAVE AS REPORTED
QMEAN MEAN HEAVE ADJUSTED WVHGT, DOMPD, AVGPD
QMEANRAW MEAN HEAVE AS REPORTED
QMIN MINIMUM HEAVE ADJUSTED
QMINRAW MINIMUM HEAVE AS REPORTED
QSTD STANDARD DEVIATION OF HEAVE WPM, NDWPM
QSPIKES NUMBER OF SPIKES IN TIMESERIES
ONLY ON NDWPM WAVE SYSTEMS
RCOMP1 #1 RAW COMPASS CCOMP1, WDIR1 RCOMP2 #2 RAW COMPASS CCOMP2, WDIR2 RH1 #1 RELATIVE HUMIDITY DEWPT1, ATMP1 RWD1 #1 WIND RAW DIRECTION RWD2 #2 WIND RAW DIRECTION SBAR1 #1 STATION PRESSURE SBAR2 #2 STATION PRESSURE
SDAMAX MAX MAGNITUDE OF ROTATION DWA, WPM
SDAMIN MIN MAGNITUDE OF DWA, WPM

60
ASCII ID DESCRIPTION RELATED SENSORS/COMMENTS
ROTATION SRAD1 #1 SOLAR RADIATION SWDIR SWELL DIRECTION SWHGT SWELL HEIGHT SWPD SWELL PERIOD TGAUG01 TIDE HEIGHT, 1st SET Through Through TGAUG10 TIDE HEIGHT, 10th SET TGCNT01 TIDE COUNTS, 1st SET Through Through TGCNT10 TIDE COUNTS, 10th SET TGSTD01 TIDE STD. DEV., 1st SET Through Through TGSTD10 TIDE STD. DEV., 10th SET TIDE TIDE HEIGHT TILTMAX MAXIMUM BUOY TILT DWA, WPM TOTMAG TOTAL MAG DWA
UV001 EAST WATER VEL.COMP. #01 ADCP
through through ADCP
UV023 EAST WATER VEL.COMP #23 ADCP
VISIB1 VISIBILITY VISIB2 VISIBILITY VISIB3 VISIBILITY
VV001 NORTH WATER VEL.COMP. #01 ADCP
through Through ADCP
VV023 NORTH WATER VEL.COMP. #23 ADCP
WSPD1 #1 WIND SPEED GUST1, WSPD11, WSPD12 WSPD11 #1 WIND 10 METER SPEED WSPD12 #1 WIND 20 METER SPEED WSPD2 #2 WIND SPEED GUST2, WSPD21, WSPD22 WSPD21 #2 WIND 10 METER SPEED WSPD22 #2 WIND 20 METER SPEED WTMP1 WATER TEMPERATURE #1
WV001 VERT. WATER VEL.COMP. #0 ADCP
through Through ADCP
WV020 VERT. WATER VEL.COMP. #20 ADCP

61
ASCII ID DESCRIPTION RELATED SENSORS/COMMENTS
WVAGE WAVE AGE DWA
WVHGT SIGNIFICANT WAVE HEIGHT AVGPD, DOMPD, QMAX
WWDIR WIND WAVE DIRECTION WWHGT WIND WAVE HEIGHT WWPD WIND WAVE PERIOD
ZXMAX MAX BUOY EAST-WEST SLOPE WPM
ZXMIN MEAN BUOY EASTWEST SLOPE WPM
ZXMIN MIN EAST-WEST BUOY SLOPE WPM
ZXSTD STANDARD DEVIATION OF SLOPE WPM
ZYMAX MAX NORTH-SOUTH BUOY SLOPE WPM
ZYMEAN MEAN NORTH-SOUTH BUOY SLOPE WPM
ZYMIN MIN NORTH-SOUTH BUOY SLOPE WPM
ZYSTD STANDARD DEVIATION OF SLOPE WPM
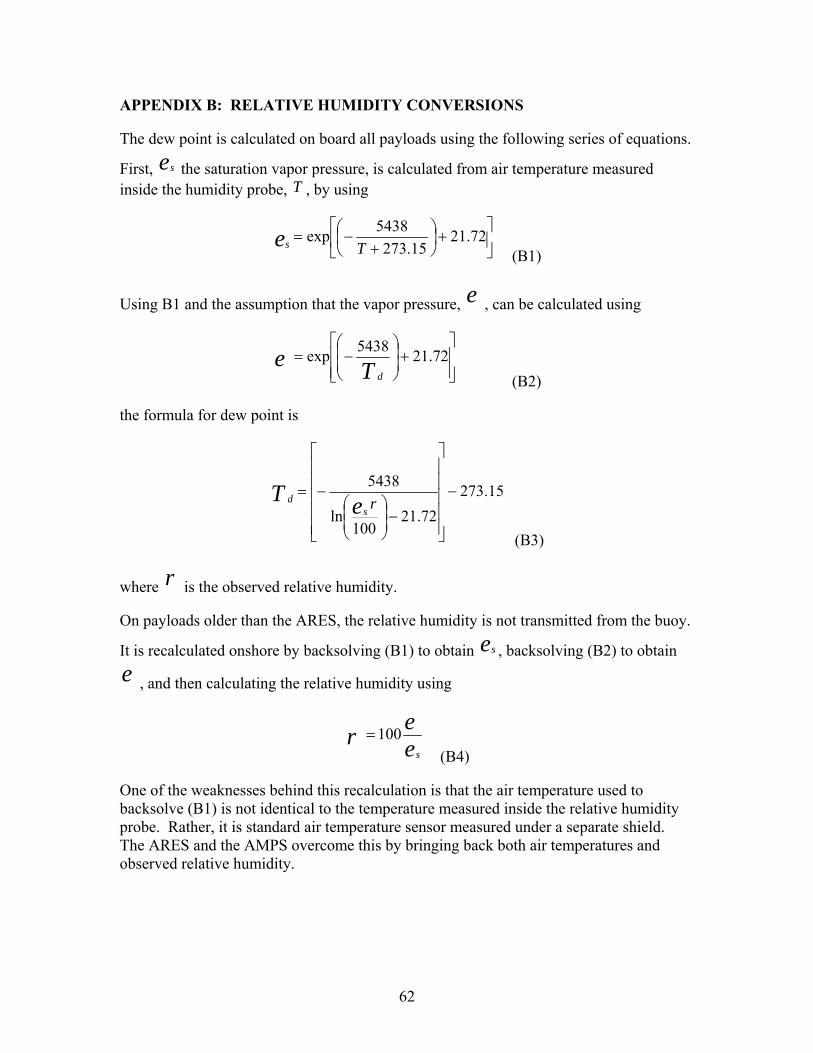
62
APPENDIX B: RELATIVE HUMIDITY CONVERSIONS
The dew point is calculated on board all payloads using the following series of equations.
First, es the saturation vapor pressure, is calculated from air temperature measured inside the humidity probe, T , by using
⎥⎦
⎤⎢⎣
⎡+⎟
⎠⎞
⎜⎝⎛
+−= 72.21
15.2735438exp
Tes (B1)
Using B1 and the assumption that the vapor pressure, e , can be calculated using
⎥⎥⎦
⎤
⎢⎢⎣
⎡+⎟
⎟⎠
⎞⎜⎜⎝
⎛−= 72.215438exp
Ted (B2)
the formula for dew point is
15.27372.21
100ln
5438−
⎥⎥⎥⎥⎥
⎦
⎤
⎢⎢⎢⎢⎢
⎣
⎡
−⎟⎟⎠
⎞⎜⎜⎝
⎛−=
reTs
d
(B3)
where r is the observed relative humidity.
On payloads older than the ARES, the relative humidity is not transmitted from the buoy.
It is recalculated onshore by backsolving (B1) to obtain es , backsolving (B2) to obtain e , and then calculating the relative humidity using
eer
s
100= (B4)
One of the weaknesses behind this recalculation is that the air temperature used to backsolve (B1) is not identical to the temperature measured inside the relative humidity probe. Rather, it is standard air temperature sensor measured under a separate shield. The ARES and the AMPS overcome this by bringing back both air temperatures and observed relative humidity.
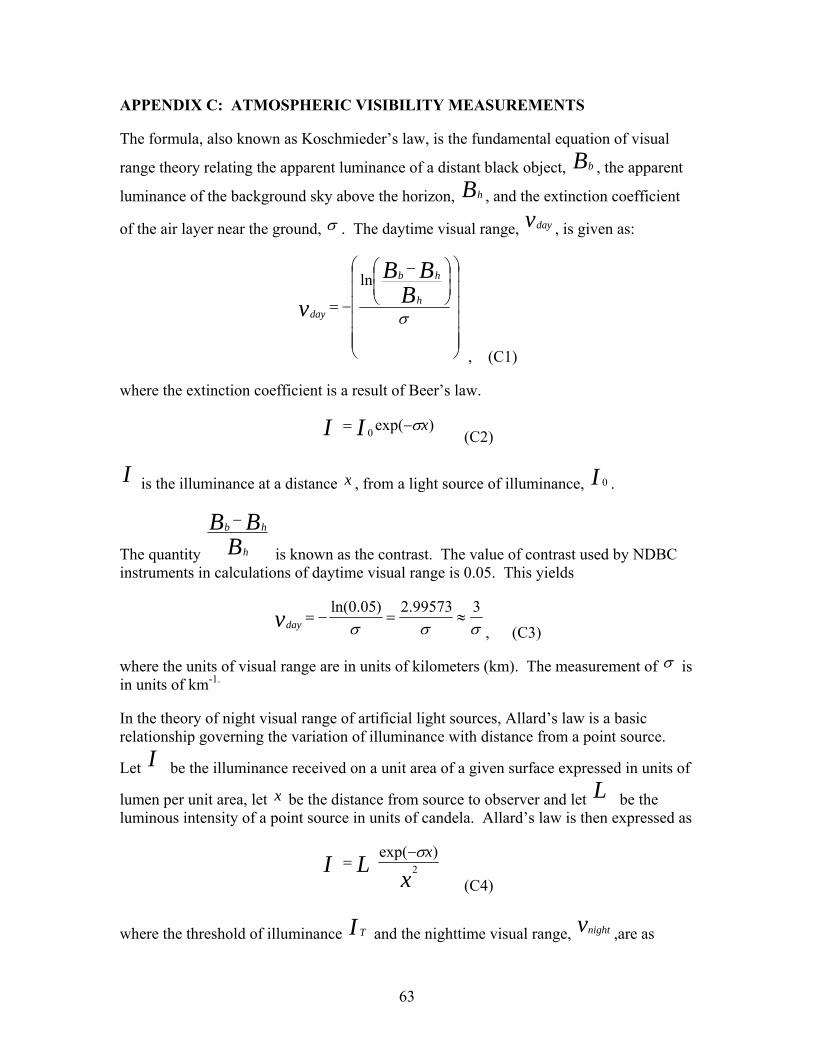
63
APPENDIX C: ATMOSPHERIC VISIBILITY MEASUREMENTS
The formula, also known as Koschmieder’s law, is the fundamental equation of visual
range theory relating the apparent luminance of a distant black object, Bb , the apparent
luminance of the background sky above the horizon, Bh , and the extinction coefficient
of the air layer near the ground, σ . The daytime visual range, vday , is given as:
⎟⎟⎟⎟⎟⎟
⎠
⎞
⎜⎜⎜⎜⎜⎜
⎝
⎛⎟⎟⎠
⎞⎜⎜⎝
⎛ −
−=σB
BBv h
hb
day
ln
, (C1)
where the extinction coefficient is a result of Beer’s law.
)exp(0 xII σ−= (C2)
I is the illuminance at a distance x , from a light source of illuminance, I 0 .
The quantity BBBh
hb −
is known as the contrast. The value of contrast used by NDBC instruments in calculations of daytime visual range is 0.05. This yields
σσσ399573.2)05.0ln(
≈=−=vday , (C3)
where the units of visual range are in units of kilometers (km). The measurement of σ is in units of km-1.
In the theory of night visual range of artificial light sources, Allard’s law is a basic relationship governing the variation of illuminance with distance from a point source.
Let I be the illuminance received on a unit area of a given surface expressed in units of
lumen per unit area, let x be the distance from source to observer and let L be the luminous intensity of a point source in units of candela. Allard’s law is then expressed as
xLI x2
)exp( σ−=
(C4)
where the threshold of illuminance I T and the nighttime visual range, vnight ,are as
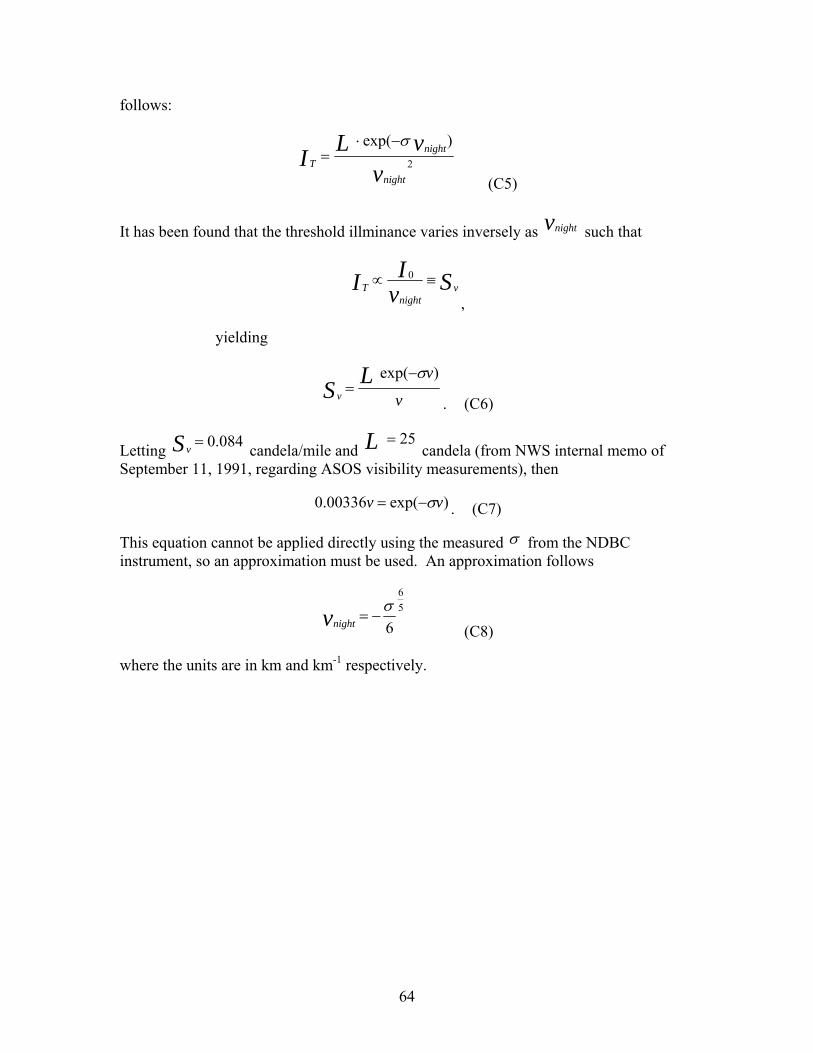
64
follows:
2
)exp(
vvLI
night
nightT
σ−⋅=
(C5)
It has been found that the threshold illminance varies inversely as vnight such that
SvII vnight
T ≡∝ 0
,
yielding
v
vLSv
)exp( σ−=
. (C6)
Letting 084.0=Sv candela/mile and 25=L candela (from NWS internal memo of
September 11, 1991, regarding ASOS visibility measurements), then
)exp(00336.0 vv σ−= . (C7)
This equation cannot be applied directly using the measured σ from the NDBC instrument, so an approximation must be used. An approximation follows
56
6σ
−=vnight (C8)
where the units are in km and km-1 respectively.

65
APPENDIX D: QUALITY CONTROL ALGORITHMS
This Appendix is intended to provide details and/or examples of QC algorithms beyond what is covered in the main sections of the Handbook. The most important EQC algorithms are covered, as are some others that are to complex to be discussed in the main sections of the Handbook.
Perform “Transmission Parity Error” Checks: T and W Flags
T and W Flags check for errors in continuous winds portion of the raw message and “T” flag individual measurements with errors.
If more than one error is encountered in the continuous winds “T” flag all continuous wind measurements from both sensors.
For non-WPM wave systems, if an error is encountered anywhere in the waves portion, “T” flag all waves.
For DART® systems, “T” flags indicate a checksum error
For WPM systems, “W” flag all wave related measurements if the wave message is short, there is a checksum error, or parity errors are detected.
Perform Time Continuity Check: V Flag
V Flag checks the amount of change in each measurement's value over the given time period (“V” flag). This is done by computing the amount of change between the current value and the last good value and then comparing this change to the time continuity limit and delta time for that measurement. Following is the algorithm used for time continuity:
delta_time = (last good time - current time) delta_value = ABS(last good value - current value) if an ADCP station and a horizontal water current velocity measurement (UV0xx,VV0xx) then if (delta_time = 1) then if (delta_value > 13.14) set the "V" flag else if (delta_value > 11.26) set the "f" flag else if (delta_time = 2) then if (delta_value > 19.35) set the "V" flag else if (delta_value > 16.59) set the "f" flag else if (delta_time = 3) then if (delta_value > 24.96) set the "V" flag else if (delta_value > 21.39)
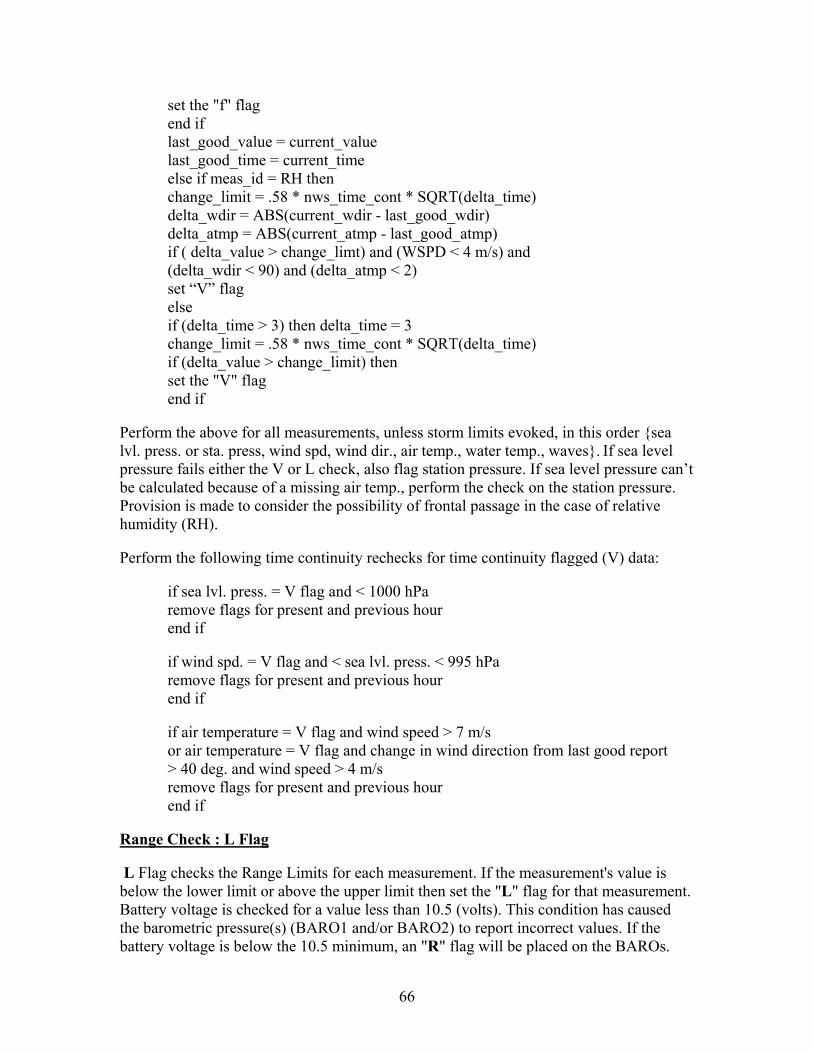
66
set the "f" flag end if last_good_value = current_value last_good_time = current_time else if meas_id = RH then change_limit = .58 * nws_time_cont * SQRT(delta_time) delta_wdir = ABS(current_wdir - last_good_wdir) delta_atmp = ABS(current_atmp - last_good_atmp) if ( delta_value > change_limt) and (WSPD < 4 m/s) and (delta_wdir < 90) and (delta_atmp < 2) set “V” flag else if (delta_time > 3) then delta_time = 3 change_limit = .58 * nws_time_cont * SQRT(delta_time) if (delta_value > change_limit) then set the "V" flag end if
Perform the above for all measurements, unless storm limits evoked, in this order {sea lvl. press. or sta. press, wind spd, wind dir., air temp., water temp., waves}. If sea level pressure fails either the V or L check, also flag station pressure. If sea level pressure can’t be calculated because of a missing air temp., perform the check on the station pressure. Provision is made to consider the possibility of frontal passage in the case of relative humidity (RH).
Perform the following time continuity rechecks for time continuity flagged (V) data:
if sea lvl. press. = V flag and < 1000 hPa remove flags for present and previous hour end if
if wind spd. = V flag and < sea lvl. press. < 995 hPa remove flags for present and previous hour end if
if air temperature = V flag and wind speed > 7 m/s or air temperature = V flag and change in wind direction from last good report > 40 deg. and wind speed > 4 m/s remove flags for present and previous hour end if
Range Check : L Flag
L Flag checks the Range Limits for each measurement. If the measurement's value is below the lower limit or above the upper limit then set the "L" flag for that measurement. Battery voltage is checked for a value less than 10.5 (volts). This condition has caused the barometric pressure(s) (BARO1 and/or BARO2) to report incorrect values. If the battery voltage is below the 10.5 minimum, an "R" flag will be placed on the BAROs.

67
if measurement != (.NE.) V flagged: then if m={sea lvl. press., sta. press., air temp., water temp.}: then if measurement < lower limit or measurement > upper limit: L Flag the measurement else if m = {wind speed, dom. Wave pd., sig. wave ht.}: then If measurement > upper limit: L Flag the measurement end If
Duplicate Sensor Validation Section: H Flag
NDBC does not presently perform this check. It is being left in the manual as a reference in the event of reimplementation
Wind Direction Check
If both directions and at least one speed are working3 and at least one speed is > 2.5 m/s:
Compute difference between wind directions: then if this difference > 25°4, and at least one speed from the previous report5 is > 2.5 m/s: Compute differences of wind direction for both sensors from previous report then if sensor with smallest difference is #2 hierarchy for wind direction: Switch hierarchies6 for both regular & continuous winds. end If
Wind Speed Check
If both wind speeds are working:
Compute difference between two wind speeds: if the difference is > 1.5 m/s: then if sensor with highest speed is #2 hierarchy for wind speeds: Switch hierarchies4 for both regular & continuous wind speeds and wind gusts end if
Sea Level Pressure Check
If both sea level pressures (SLPs) are working:
Compute difference between two sea level pressures 3 Working means that the measurement is not “D” flagged, nor has the measurement been “L” or “V” flagged by the just-completed range limits and time continuity checks. 4 Tolerances that are italicized must be made region-specific. 5 Previous report means last previously working report if it happened in the last 3 hours. 6 Report the lower hierarchy (backup) sensor and continue to report the backup for ensuing reports.

68
else If both station pressures are working: Compute difference between two station pressures Else difference = -99 end If if difference != -99: then if difference > 1.0 hPa: then if sensor with lowest pressure difference since last report is #2 hierarchy: Switch hierarchies for SLP and SBAR end if
Gust-to-Speed Ratio Test: g flag
Perform this check to validate both the standard wind gust and the maximum hourly gust. First, compare the standard (8 minute or 2 minute averaged) wind speed, WSPD , to the wind gust, GUST, measured in that time period. Then, if a station is equipped with continuous winds, use this algorithm to compare the highest gust during an hour (let GUST = MXGT) to the average wind speed in an hour (let WSPD = AVGSPD).
GZERO = 1.98 - ( 1.887*exp(-0.18*GUST)) RATIOMAX = 1.5 + (1.0/GZERO) RATIO = GUST/WSPD if (WSPD < 0.3) then RATIOMAX = RATIOMAX + 5.0 else If ( WSPD < 1.0) then RATIOMAX = RATIOMAX + 3.0 else If ( WSPD < 3.0) then RATIOMAX = RATIOMAX + 0.7 else If ( WSPD < 6.0) then RATIOMAX = RATIOMAX + 0.35 else RATIOMAX = RATIOMAX + 0.2 end If if RATIO > RATIOMAX flag with a g else if if RATIO <= 0.9 flag with a g end if
Continuous Winds Speed Validation Algorithm: i Flag
The only continuous wind speed validated is the single, 10-minute average continuous wind speed (CWS) whose time interval includes the 2- or 8-minute averaged standard wind speed (WSPD). If standard wind speed averaging interval is greater than or equal to 8 minutes and the Met. acquisition time ends at minute 50 (typically a buoy):

69
compute absolute difference between CWS and WSPD if absolute difference >2.0 m/s “i” flag CWS end if else If the Met. acquisition time ends at minute 0 (typically a C-MAN station): If absolute difference>3.0m/s “i” flag CWS end if
Otherwise: Don’t check
NCEP Fields: n Flag
Comparing NDBC measurements with NCEP fields interpolated to station location is a powerful way to identify sensor degradation. Though the checks are essentially range checks, some of the checks have range limits that vary in a simple manner with geography and values of other measurements.
For the following NCEP-produced 6-hour forecast fields, valid at 00, 06, 12, and 18Z, calculate the absolute value of the difference: (interpolated value - the measurement):
Sea Level Pressure
Pressure variation at low latitudes is less than at high latitudes. Model performance is better in areas of high pressure where there is less of a gradient.
if Latitude < 30 degrees: then i f difference > 2.5 hPa: flag with an n else if Obs. Sea Lvl. Pressure > 1008 hPa: then if difference > 2.5 hPa: flag with an n else if Obs. Sea Lvl. Pressure > 995 hPa: then if difference > 4.0 hPa: flag with an n else if difference > 6 hPa: flag with an n end if
Air Temperature
Near the West Coast model performance is sometimes poor because of the tight temperature gradients between the sea and nearby inland areas.
difference = (interpolated value - the measurement) if Longitude > 110 W and < 129W: then If difference > 10°C .OR. difference < -5 °C: flag with an n
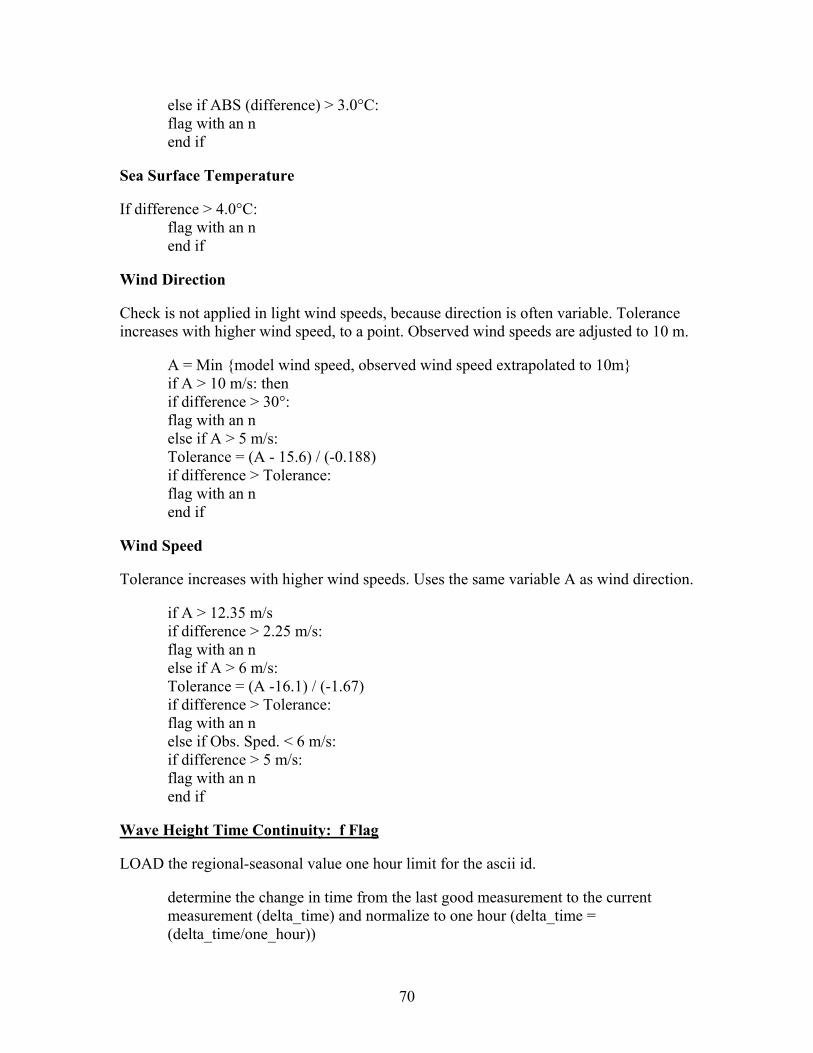
70
else if ABS (difference) > 3.0°C: flag with an n end if
Sea Surface Temperature
If difference > 4.0°C: flag with an n end if
Wind Direction
Check is not applied in light wind speeds, because direction is often variable. Tolerance increases with higher wind speed, to a point. Observed wind speeds are adjusted to 10 m.
A = Min {model wind speed, observed wind speed extrapolated to 10m} if A > 10 m/s: then if difference > 30°: flag with an n else if A > 5 m/s: Tolerance = (A - 15.6) / (-0.188) if difference > Tolerance: flag with an n end if
Wind Speed
Tolerance increases with higher wind speeds. Uses the same variable A as wind direction.
if A > 12.35 m/s if difference > 2.25 m/s: flag with an n else if A > 6 m/s: Tolerance = (A -16.1) / (-1.67) if difference > Tolerance: flag with an n else if Obs. Sped. < 6 m/s: if difference > 5 m/s: flag with an n end if
Wave Height Time Continuity: f Flag
LOAD the regional-seasonal value one hour limit for the ascii id.
determine the change in time from the last good measurement to the current measurement (delta_time) and normalize to one hour (delta_time = (delta_time/one_hour))
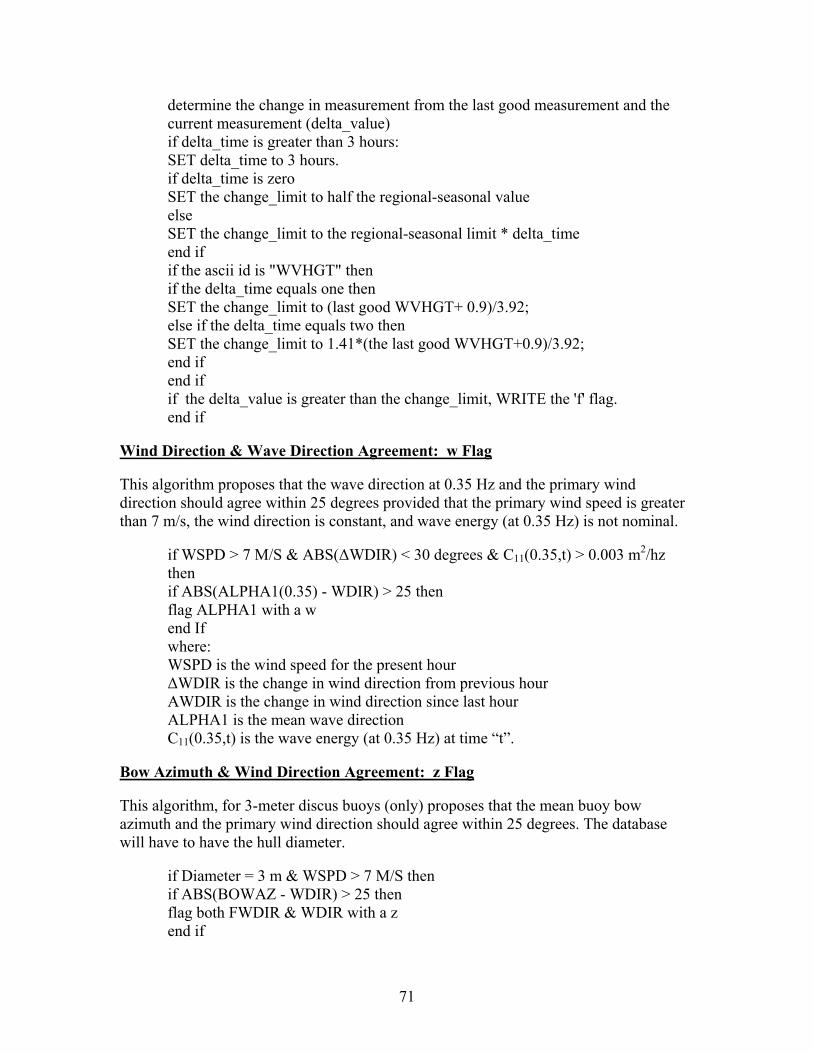
71
determine the change in measurement from the last good measurement and the current measurement (delta_value) if delta_time is greater than 3 hours: SET delta_time to 3 hours. if delta_time is zero SET the change_limit to half the regional-seasonal value else SET the change_limit to the regional-seasonal limit * delta_time end if if the ascii id is "WVHGT" then if the delta_time equals one then SET the change_limit to (last good WVHGT+ 0.9)/3.92; else if the delta_time equals two then SET the change_limit to 1.41*(the last good WVHGT+0.9)/3.92; end if end if if the delta_value is greater than the change_limit, WRITE the 'f' flag. end if
Wind Direction & Wave Direction Agreement: w Flag
This algorithm proposes that the wave direction at 0.35 Hz and the primary wind direction should agree within 25 degrees provided that the primary wind speed is greater than 7 m/s, the wind direction is constant, and wave energy (at 0.35 Hz) is not nominal.
if WSPD > 7 M/S & ABS(ΔWDIR) < 30 degrees & C11(0.35,t) > 0.003 m2/hz then if ABS(ALPHA1(0.35) - WDIR) > 25 then flag ALPHA1 with a w end If where: WSPD is the wind speed for the present hour ΔWDIR is the change in wind direction from previous hour AWDIR is the change in wind direction since last hour ALPHA1 is the mean wave direction C11(0.35,t) is the wave energy (at 0.35 Hz) at time “t”.
Bow Azimuth & Wind Direction Agreement: z Flag
This algorithm, for 3-meter discus buoys (only) proposes that the mean buoy bow azimuth and the primary wind direction should agree within 25 degrees. The database will have to have the hull diameter.
if Diameter = 3 m & WSPD > 7 M/S then if ABS(BOWAZ - WDIR) > 25 then flag both FWDIR & WDIR with a z end if

72
where:
WDIR is the observed wind direction BOWAZ is the buoy azimuth angle DIAMETER is diameter of the buoy hull FWDIR is the forward direction of the buoy.
Water Level Time Continuity Algorithm: f Flag
The algorithm is based on the standard Time Continuity Check discussed in Section 4 of the Handbook which calculates an allowable deviation between successive measurements:
στ = 0.58 σ sqrt(τ) where: στ is the allowable water level change between sensors σ is the standard deviation of an ensemble of water level data τ is the time delta (in hours) between measurements.
The above equation was modified to quality control water level. The only modification necessary is to calculate the appropriate σ value. One year of water level data from several stations indicated an average value of 0.81 for σ. In testing the above algorithms, it was found that many data points would have been flagged erroneously due to small τ values (6-minutes or 0.10 hours). Therefore, the algorithm was modified as follows to accommodate small time deltas:
στ = 0.58 3σ sqrt(τ)
For a 6-minute time delta and σ equal to 0.81, this equation allows a maximum change in water level of 0.45 feet. This is a reasonable 6-minute change in water level. If the measurement fails the tolerance, the “f” flag is set.
if change in water level > στ flag water level with an f end if
Humidity versus Visibility Check: v Flag
Flag observations when the where the visibility appears high:
if V > 3 (Ta – Td) + 4, and (Ta – Td) < 1 flag visibility with a v end if
And in the low visibility case when:
if V < .5 (Ta – Td) – 1, and 4 < (Ta – Td) < 10 or, V < 4, and (Ta – Td) > 10
73
flag visibility with a v end if
where:
V is visibility in nm, Ta is air temperature, and Td is dew-point temperature in deg C.

74
APPENDIX E: QUALITY CONTROL FLAGS
EQC Hard Flags (by hierarchy - highest to lowest):
T Transmission parity error (Applies to continuous winds and non-WPM wave data, and DART® data).
M Missing sensor data (A result of a garbled or missing message).
W A WPM wave message is short, missing a checksum, or parity errors are detected.
D Delete measurement from release and archive (A Data Analyst or automated QC has failed the sensor).
S Invalid statistical parameter (in waves, QMEAN is not between QMIN and QMAX, flags WVHGT).
V Failed time continuity. L Failed range limits. H Hierarchy reversal has occurred (BARO, WSPD, WDIR only). R A related measurement has failed a hard QC check.
Small Flags (in alphabetical order): a Measurement is above monthly, regional limit. b Measurement is below monthly, regional limit. d Failed standard deviation test (continuous winds only). f Measurement failed hourly time continuity.
g Failed gust-to-mean wind speed ratio (applies to standard and continuous winds).
i Continuous and hourly wind speeds don’t agree.
j One, and only one, transmission error detected in the continuous wind string of a message (all continuous wind measurements are flagged, if more than one error detected, than flag is upgraded to a T flag).
k Difference between duplicate measurements is too high.
m High frequency spikes detected in the wave spectrum (C11), WVHGT is flagged.
n Measurement failed comparison with NCEP model fields. p Failed wave height to wave period comparison test. q Swell direction is from an improbable direction. r Related measurement failed (continuous winds only). S Stuck raw compass ( RCOMP and WDIR are flagged). t Tendency difference between duplicate sensors is too high. v Failed relative humidity verses visibility check. w Failed wind direction verses wave direction check. x Wind wave energy is too high for prevailing wind speed. y Wind wave energy is too low for prevailing wind speed. z Failed bow azimuth verses wind direction check.
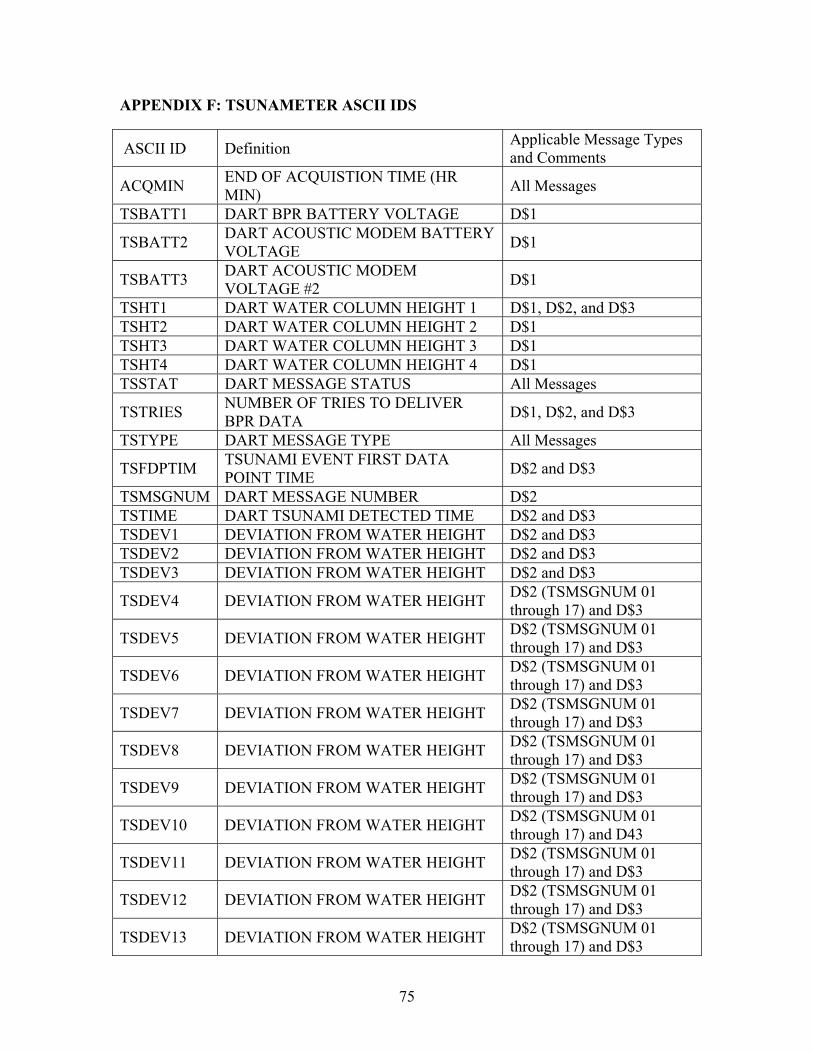
75
APPENDIX F: TSUNAMETER ASCII IDS
ASCII ID Definition Applicable Message Types and Comments
ACQMIN END OF ACQUISTION TIME (HR MIN) All Messages
TSBATT1 DART BPR BATTERY VOLTAGE D$1
TSBATT2 DART ACOUSTIC MODEM BATTERY VOLTAGE D$1
TSBATT3 DART ACOUSTIC MODEM VOLTAGE #2 D$1
TSHT1 DART WATER COLUMN HEIGHT 1 D$1, D$2, and D$3 TSHT2 DART WATER COLUMN HEIGHT 2 D$1 TSHT3 DART WATER COLUMN HEIGHT 3 D$1 TSHT4 DART WATER COLUMN HEIGHT 4 D$1 TSSTAT DART MESSAGE STATUS All Messages
TSTRIES NUMBER OF TRIES TO DELIVER BPR DATA D$1, D$2, and D$3
TSTYPE DART MESSAGE TYPE All Messages
TSFDPTIM TSUNAMI EVENT FIRST DATA POINT TIME D$2 and D$3
TSMSGNUM DART MESSAGE NUMBER D$2 TSTIME DART TSUNAMI DETECTED TIME D$2 and D$3 TSDEV1 DEVIATION FROM WATER HEIGHT D$2 and D$3 TSDEV2 DEVIATION FROM WATER HEIGHT D$2 and D$3 TSDEV3 DEVIATION FROM WATER HEIGHT D$2 and D$3
TSDEV4 DEVIATION FROM WATER HEIGHT D$2 (TSMSGNUM 01 through 17) and D$3
TSDEV5 DEVIATION FROM WATER HEIGHT D$2 (TSMSGNUM 01 through 17) and D$3
TSDEV6 DEVIATION FROM WATER HEIGHT D$2 (TSMSGNUM 01 through 17) and D$3
TSDEV7 DEVIATION FROM WATER HEIGHT D$2 (TSMSGNUM 01 through 17) and D$3
TSDEV8 DEVIATION FROM WATER HEIGHT D$2 (TSMSGNUM 01 through 17) and D$3
TSDEV9 DEVIATION FROM WATER HEIGHT D$2 (TSMSGNUM 01 through 17) and D$3
TSDEV10 DEVIATION FROM WATER HEIGHT D$2 (TSMSGNUM 01 through 17) and D43
TSDEV11 DEVIATION FROM WATER HEIGHT D$2 (TSMSGNUM 01 through 17) and D$3
TSDEV12 DEVIATION FROM WATER HEIGHT D$2 (TSMSGNUM 01 through 17) and D$3
TSDEV13 DEVIATION FROM WATER HEIGHT D$2 (TSMSGNUM 01 through 17) and D$3

76
ASCII ID Definition Applicable Message Types and Comments
TSDEV14 DEVIATION FROM WATER HEIGHT D$2 (TSMSGNUM 01 through 17) and D$3
TSDEV15 DEVIATION FROM WATER HEIGHT D$2 (TSMSGNUM 01 through 17) and D$3
TSDEV16 DEVIATION FROM WATER HEIGHT D$3 TSDEV17 DEVIATION FROM WATER HEIGHT D$3 TSDEV18 DEVIATION FROM WATER HEIGHT D$3 TSDEV19 DEVIATION FROM WATER HEIGHT D$3 TSDEV20 DEVIATION FROM WATER HEIGHT D$3 TSDEV21 DEVIATION FROM WATER HEIGHT D$3 TSDEV22 DEVIATION FROM WATER HEIGHT D$3 TSDEV23 DEVIATION FROM WATER HEIGHT D$3 TSDEV24 DEVIATION FROM WATER HEIGHT D$3 TSDEV25 DEVIATION FROM WATER HEIGHT D$3 TSDEV26 DEVIATION FROM WATER HEIGHT D$3 TSDEV27 DEVIATION FROM WATER HEIGHT D$3 TSDEV28 DEVIATION FROM WATER HEIGHT D$3 TSDEV29 DEVIATION FROM WATER HEIGHT D$3 TSDEV30 DEVIATION FROM WATER HEIGHT D$3 TSDEV31 DEVIATION FROM WATER HEIGHT D$3 TSDEV32 DEVIATION FROM WATER HEIGHT D$3 TSDEV33 DEVIATION FROM WATER HEIGHT D$3 TSDEV34 DEVIATION FROM WATER HEIGHT D$3 TSDEV35 DEVIATION FROM WATER HEIGHT D$3 TSDEV36 DEVIATION FROM WATER HEIGHT D$3 TSDEV37 DEVIATION FROM WATER HEIGHT D$3 TSDEV38 DEVIATION FROM WATER HEIGHT D$3 TSDEV39 DEVIATION FROM WATER HEIGHT D$3 TSDEV40 DEVIATION FROM WATER HEIGHT D$3 TSDEV41 DEVIATION FROM WATER HEIGHT D$3 TSDEV42 DEVIATION FROM WATER HEIGHT D$3 TSDEV43 DEVIATION FROM WATER HEIGHT D$3 TSDEV44 DEVIATION FROM WATER HEIGHT D$3 TSDEV45 DEVIATION FROM WATER HEIGHT D$3 TSDEV46 DEVIATION FROM WATER HEIGHT D$3 TSDEV47 DEVIATION FROM WATER HEIGHT D$3 TSDEV48 DEVIATION FROM WATER HEIGHT D$3 TSDEV49 DEVIATION FROM WATER HEIGHT D$3 TSDEV50 DEVIATION FROM WATER HEIGHT D$3 TSDEV51 DEVIATION FROM WATER HEIGHT D$3 TSDEV52 DEVIATION FROM WATER HEIGHT D$3 TSDEV53 DEVIATION FROM WATER HEIGHT D$3 TSDEV54 DEVIATION FROM WATER HEIGHT D$3
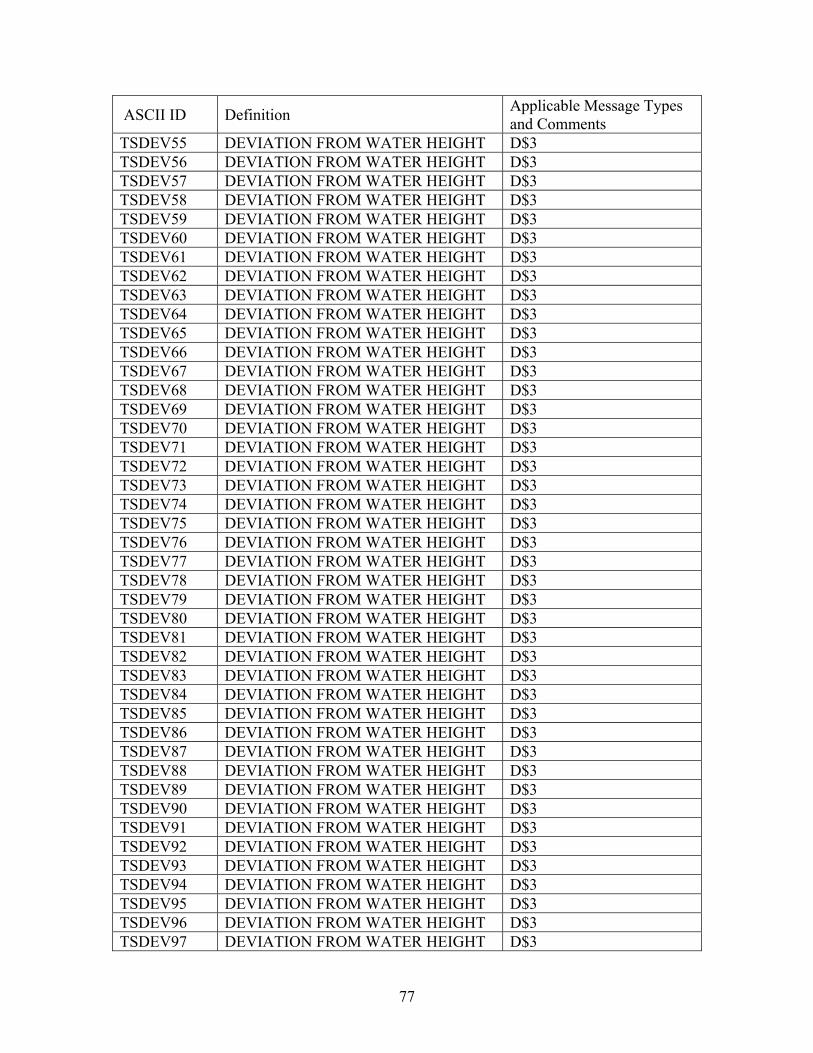
77
ASCII ID Definition Applicable Message Types and Comments
TSDEV55 DEVIATION FROM WATER HEIGHT D$3 TSDEV56 DEVIATION FROM WATER HEIGHT D$3 TSDEV57 DEVIATION FROM WATER HEIGHT D$3 TSDEV58 DEVIATION FROM WATER HEIGHT D$3 TSDEV59 DEVIATION FROM WATER HEIGHT D$3 TSDEV60 DEVIATION FROM WATER HEIGHT D$3 TSDEV61 DEVIATION FROM WATER HEIGHT D$3 TSDEV62 DEVIATION FROM WATER HEIGHT D$3 TSDEV63 DEVIATION FROM WATER HEIGHT D$3 TSDEV64 DEVIATION FROM WATER HEIGHT D$3 TSDEV65 DEVIATION FROM WATER HEIGHT D$3 TSDEV66 DEVIATION FROM WATER HEIGHT D$3 TSDEV67 DEVIATION FROM WATER HEIGHT D$3 TSDEV68 DEVIATION FROM WATER HEIGHT D$3 TSDEV69 DEVIATION FROM WATER HEIGHT D$3 TSDEV70 DEVIATION FROM WATER HEIGHT D$3 TSDEV71 DEVIATION FROM WATER HEIGHT D$3 TSDEV72 DEVIATION FROM WATER HEIGHT D$3 TSDEV73 DEVIATION FROM WATER HEIGHT D$3 TSDEV74 DEVIATION FROM WATER HEIGHT D$3 TSDEV75 DEVIATION FROM WATER HEIGHT D$3 TSDEV76 DEVIATION FROM WATER HEIGHT D$3 TSDEV77 DEVIATION FROM WATER HEIGHT D$3 TSDEV78 DEVIATION FROM WATER HEIGHT D$3 TSDEV79 DEVIATION FROM WATER HEIGHT D$3 TSDEV80 DEVIATION FROM WATER HEIGHT D$3 TSDEV81 DEVIATION FROM WATER HEIGHT D$3 TSDEV82 DEVIATION FROM WATER HEIGHT D$3 TSDEV83 DEVIATION FROM WATER HEIGHT D$3 TSDEV84 DEVIATION FROM WATER HEIGHT D$3 TSDEV85 DEVIATION FROM WATER HEIGHT D$3 TSDEV86 DEVIATION FROM WATER HEIGHT D$3 TSDEV87 DEVIATION FROM WATER HEIGHT D$3 TSDEV88 DEVIATION FROM WATER HEIGHT D$3 TSDEV89 DEVIATION FROM WATER HEIGHT D$3 TSDEV90 DEVIATION FROM WATER HEIGHT D$3 TSDEV91 DEVIATION FROM WATER HEIGHT D$3 TSDEV92 DEVIATION FROM WATER HEIGHT D$3 TSDEV93 DEVIATION FROM WATER HEIGHT D$3 TSDEV94 DEVIATION FROM WATER HEIGHT D$3 TSDEV95 DEVIATION FROM WATER HEIGHT D$3 TSDEV96 DEVIATION FROM WATER HEIGHT D$3 TSDEV97 DEVIATION FROM WATER HEIGHT D$3

78
ASCII ID Definition Applicable Message Types and Comments
TSDEV98 DEVIATION FROM WATER HEIGHT D$3 TSDEV99 DEVIATION FROM WATER HEIGHT D$3 TSDEV100 DEVIATION FROM WATER HEIGHT D$3 TSDEV101 DEVIATION FROM WATER HEIGHT D$3 TSDEV102 DEVIATION FROM WATER HEIGHT D$3 TSDEV103 DEVIATION FROM WATER HEIGHT D$3 TSDEV104 DEVIATION FROM WATER HEIGHT D$3 TSDEV105 DEVIATION FROM WATER HEIGHT D$3 TSDEV106 DEVIATION FROM WATER HEIGHT D$3 TSDEV107 DEVIATION FROM WATER HEIGHT D$3 TSDEV108 DEVIATION FROM WATER HEIGHT D$3 TSDEV109 DEVIATION FROM WATER HEIGHT D$3 TSDEV110 DEVIATION FROM WATER HEIGHT D$3 TSDEV111 DEVIATION FROM WATER HEIGHT D$3 TSDEV112 DEVIATION FROM WATER HEIGHT D$3 TSDEV113 DEVIATION FROM WATER HEIGHT D$3 TSDEV114 DEVIATION FROM WATER HEIGHT D$3 TSDEV115 DEVIATION FROM WATER HEIGHT D$3 TSDEV116 DEVIATION FROM WATER HEIGHT D$3 TSDEV117 DEVIATION FROM WATER HEIGHT D$3 TSDEV118 DEVIATION FROM WATER HEIGHT D$3 TSDEV119 DEVIATION FROM WATER HEIGHT D$3


](https://static.fdocuments.net/doc/165x107/588c56cf1a28ab82218b5379/ndbc-guidepdf-24m.jpg)