Handbook London 2007 1 kbr General approaches to data quality and Internet generated data associate...
24
Handbook London 2007 1 kbr General approaches to data quality and Internet generated data associate professor Karsten Boye Rasmussen [email protected] Institute of Marketing and Management University of Southern Denmark Campusvej 55, DK-5230 Odense M, Denmark +45 6550 2115 fax: +45 6593 1766 Areas: organization and information technology, business intelligence 'it, communication and organization' www.itko.dk
-
Upload
lynn-johnson -
Category
Documents
-
view
216 -
download
0
Transcript of Handbook London 2007 1 kbr General approaches to data quality and Internet generated data associate...
HandbookLondon 2007
1 kbr
General approaches to data quality and Internet generated data
associate professor Karsten Boye [email protected] of Marketing and ManagementUniversity of Southern DenmarkCampusvej 55, DK-5230 Odense M, Denmark+45 6550 2115 fax: +45 6593 1766
Areas: organization and information technology, business intelligence
'it, communication and organization' www.itko.dk

HandbookLondon 2007
2 kbr
Internet improving data quality
concepts and dimensions of data qualityconsequences of having poor data quality! - the
intuitive approachwhat are you talking about? - empirical approachwhat can the system talk about? - the ontological 'fitness for use' - metadata and the dimension of
'documentality'
categories of data generated on or in relation to the Internet
primary data (being generated for this particular use) and secondary
data response (survey questionnaire S-R) non-reactive sources:e-mails, blogs, Internet web-logs (on hits, visits,
users, etc.), commercial transaction data mixing methods
data being: validated, used, and plentiful

HandbookLondon 2007
3 kbr
The intuitive approach to data quality
data quality metrics proportion experiencing problems with data
quality'that 75% of 599 companies surveyed
experienced financial pain from defective data'
'about 14% of the potential taxes due are not collected'
summarized metric of the financial loss'poor data management is costing global
businesses more than $1.4 billion per year'
error rates of data fields about 1-5 per centbut are they all equal?

HandbookLondon 2007
4 kbr
Intuitive dimensions
Some OK dimensions
The intuitive approach certainly lacks method with rigor
A somewhat unsystematic and sporadic description
Accuracy closeness to correct value Currentness data are correct; not out-of-date Completeness a data collection has values for all attributes of all
entities Consistency when two or more values are required to agree
Table 1. Data quality dimensions and definitions (Fox et al., 1994).

HandbookLondon 2007
5 kbr
The empirical approach to data quality
also in committee work
Intrinsic Data Quality - Accuracy of data
Contextual Data Quality - Relevancy of data
Representational Data Quality - Representation of data
Accessibility Data Quality - Accessibility of data
Believability Accuracy Objectivity Reputation
Value-added Relevancy Timeliness Completeness Appropriate amount of data
Interpretability Ease of understanding Representational consistency Concise representation
Accessibility Access security
Table 2. Data quality (Wang & Strong, 1996:20)

HandbookLondon 2007
6 kbr
The theoretical foundation of data quality
Information System (IS) as a representation of the Real World system (RW)
The ontological approach (Wand & Wang, 1996)
The data representation and recording (Fox et al., 1994)
The conceptual view (Levitin & Redman, 1995)The systems approach (Huang et al., 1999:34)the semantics part of the semiotic approach
(Price and Shanks, 2004)

HandbookLondon 2007
7 kbr
Three categories of 'deficiencies'
a quite "binary" view
Representation outcome
Multiplicity RW : IS
Explanation
Proper 1:1 1:n
Proper representation exists when a state from the information system can be mapped to a single state in the real world. Redundancy (superfluous states) is allowed in the information system.
Incomplete 1:0 Incomplete representation occurs when a state in the real world does not have a representation in the information system. The mapping is not exhaustive. We do not have the information.
Ambiguous n:1 Ambiguous representation occurs when a single state in the information system is covering more than one state in the real world. This situation precludes the proper inverse mapping to the real world.
Meaningless 0:1 Meaningless representation occurs when a state in the information system cannot be mapped to any state in the real world system. We have data but no connection to the real world. The data is analytically meaningless.
Table 4. Representational mapping of the possible states of the Real World (RW) and the Information System (IS) (from Wand & Wang, 1996:90)

HandbookLondon 2007
8 kbr
Media approach to data quality
Syntactic quality is thus how well data corresponds to stored meta-data, which can be exemplified by conformance to contingencies of the database
Semantic quality is how the stored data corresponds to the represented external phenomena
Pragmatic quality is how data is suitable and worthwhile for a given use
("semiotics", Price and Shanks)

HandbookLondon 2007
9 kbr
Fitness for use
The 'proof of the pudding' for data quality is the use of the data
'All the news that's fit to print' New York Times
semiotic framework with degree of objectivity ranging from the syntactic 'completely objective' to the pragmatic 'completely subjective'
'fitness for use' is subjectivity
'The single most significant source of error in data analysis is misapplication of data that would be reasonably accurate in the right context'
Error 40 The relativity moves the attention from the data to the user

HandbookLondon 2007
10 kbr
Use, metadata and documentality
data is description - of realitydescription of data - is metadataDDI 'The Data Documentation Initiative'
The quality measures of validity, reliability, accuracy, precision, bias, representativity, etc.
only available through the documentation of the data
the metadata
high documentality means the dataset is a 'pattern' and 'model'

HandbookLondon 2007
11 kbr
Errors in survey data
survey is the "ability to estimate with considerable precision the percentage of a population that has a particular attribute by obtaining data from only a small fraction of the total population" (Dillman, 2007)
Sampling error Surveying only some not all the population
Coverage error Not an equal or known chance of being sampled
Measurement error Bad instrument, poor question wording
Non-response error Respondents being different from the non-respondents
Table 5. The four sources of survey error (Dillman, 2007:9-11)

HandbookLondon 2007
12 kbr
Internet & Research
a shift in the medium for data collectionself administered web surveys e-mail surveys
e-mail with linksthe link points to a web-questionnairea mixed-mode within the Internet media
e-mail with attached questionnairethe questionnaire in software formats (Word of PDF)
e-mail text without attachments or links - answering mail
3-5 questions
PLUS completely new type of direct recording of
actual behavior in electronic non-reactive data

HandbookLondon 2007
13 kbr
Web survey - some problems
uneven accessibility to the Internet unevenness in regard to the technical abilitiesbandwidth, computing power, and software (web-
browsers)
however general web-site competences exist
and telephone ownership is now too widespread - an other medium needed
no random mail generation

HandbookLondon 2007
14 kbr
Web survey - the many pros
some reliable e-mail registers do exist
random selection - but not random generated ;-)
CAxI (Computer assisted telephone interviewing)
more complicated structures possible in the answering
software will enforce consistent rule following
experiments using different sequencing of questions
the use of paradata in web (later)

HandbookLondon 2007
15 kbr
Web survey - the respondent
Internet coverage, sampling, and the right respondent
sampling is not secured by a large number of respondents
the problem of self-selection a systematic biashave to secure the right - or at least only one
respondent on the inquiry the new problem of a 150 per cent answer ratelog-in procedure with a PIN-code is recommended

HandbookLondon 2007
16 kbr
Web survey - success and hazard
quicker turnaround than through the postal or face-to-face questionnaire
raising the data quality by securing timely datathe Internet surveys have a much lower
'marginal cost'
with the Internet and supportive software for web surveys
many more surveys are taking placemaybe too manyrespondents tend to be more reluctant to
participate in surveys

HandbookLondon 2007
17 kbr
Secondary data – a richness of data
The data is ready to use
data is being made available and retrievableraising the data quality through a higher
documentation level... a long list ...
for some areas the complete data is availableas the data in the operational system of the company
who bought what when and where?
the electronic traces left by the behavior
HandbookLondon 2007
18 kbr
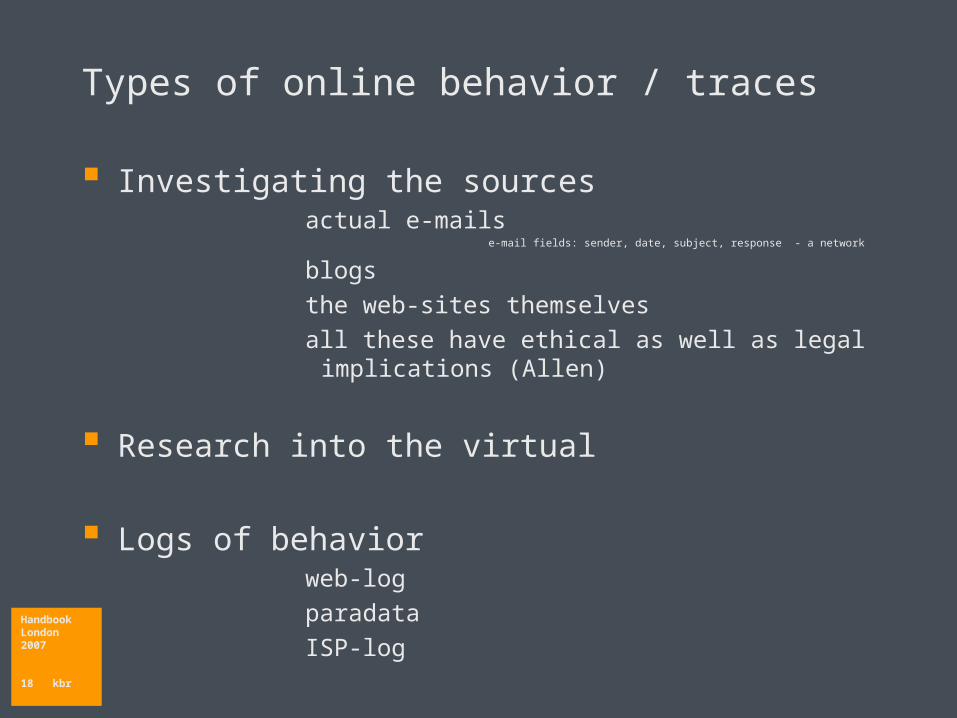
Types of online behavior / traces
Investigating the sourcesactual e-mails
e-mail fields: sender, date, subject, response - a network
blogsthe web-sites themselves all these have ethical as well as legal
implications (Allen)
Research into the virtual
Logs of behaviorweb-logparadataISP-log

HandbookLondon 2007
19 kbr
Web-log analysis
hits, pages, visits, users of a web-site
cookies and explicit user log-in'click-stream analysis' CLF pages where the session stops? patterns of web-movements that explain the
stopsgoing in circles on a web site? behavior from non-buyers and buyers
Host
IP address
Time Request Status Bytes
133.225.107.171 - - [04/ J an/2007:06:29:24 -0700] "GET /home/ HTTP/1.0" 200 2935
133.225.107.171 - - [04/ J an/2007:06:29:32 -0700] "GET /home/pubs.html HTTP/1.0" 200 1204
133.225.107.171 - - [04/ J an/2007:06:29:37 -0700] "GET /home/ iq.html HTTP/1.0" 200 2516
133.225.107.171 - - [04/ J an/2007:06:29:37 -0700] "GET /home/getacro.gif HTTP/1.0" 200 1090
HandbookLondon 2007
20 kbr
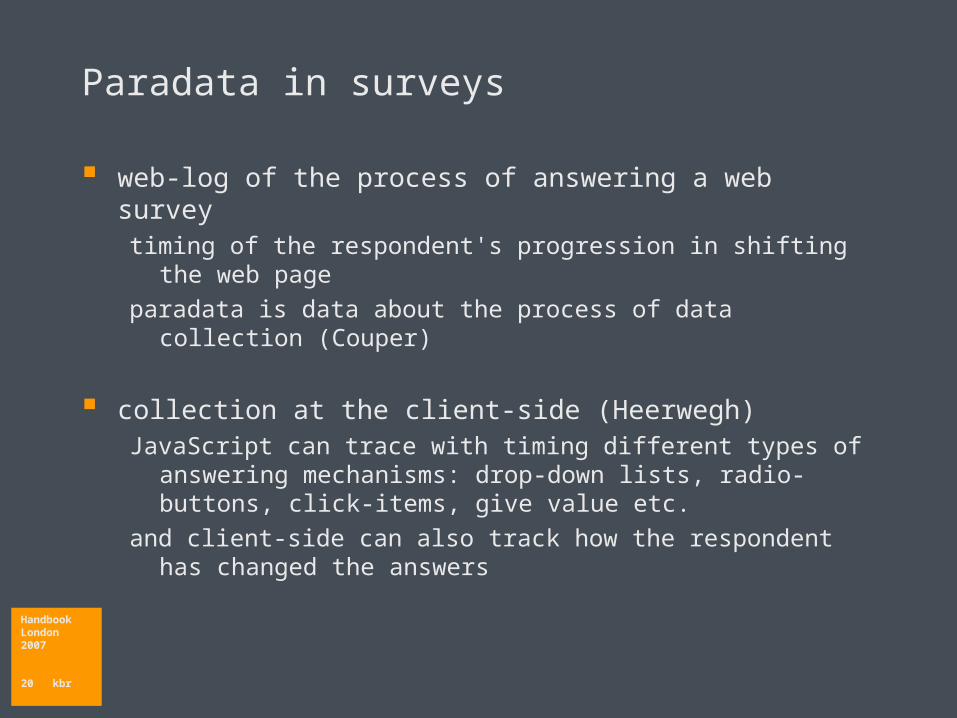
Paradata in surveys
web-log of the process of answering a web surveytiming of the respondent's progression in shifting the web
pageparadata is data about the process of data collection
(Couper)
collection at the client-side (Heerwegh)JavaScript can trace with timing different types of answering
mechanisms: drop-down lists, radio-buttons, click-items, give value etc.
and client-side can also track how the respondent has changed the answers

HandbookLondon 2007
21 kbr
Analyzing virtual communities
Amazon first among communities of costumers making customer comments and evaluations
available to other customers
many more sites of communities are being added
blogs are kind-of research in the dating sitespotential in personal links as in Linkedin.comor the links contained in the web itself
and in the constructed virtual reality of 'Second Life'
or other "games"

HandbookLondon 2007
22 kbr
Mixed modes and mixed methods
modes of surveys with questionnaires postal, with interviewer, face-to-face or
telephone, or web-modemixed-mode has the ability to reduce non-
response'sequential mixed-mode ... do not pose any
problems' (de Leeuw)but different modes often produce different
results (Dillman)the 'unimode design' later a mode-specific design taking full
advantage of the mode
'mixed methods' more the combination of qualitative and quantitative methods - and S-R and non-reactive data

HandbookLondon 2007
23 kbr
Conclusion
more data is out therewith high syntactic qualitywith high validity by interest from sourcesand by data - as traces of actual behavior

HandbookLondon 2007
24 kbr ? Thanks
Karsten Boye Rasmussen SDU


![Kbr[1] report](https://static.fdocuments.net/doc/165x107/58ee95a31a28ab4c658b45d1/kbr1-report.jpg)