
Half-yearly results for six months ended 30 September 2017 · Half-yearly results for six months...
37
Half-yearly results for six months ended 30 September 2017 15 November 2017
Transcript of Half-yearly results for six months ended 30 September 2017 · Half-yearly results for six months...

Half-yearly results for six months ended 30 September 201715 November 2017
Strategic and operational overview
Brian Cassin, Chief Executive Officer

3 © Experian Public
First-half results highlights
Revenue growths are stated on a constant currency basis.
• Organic revenue growth 4%, total growth 5%• EBIT margin flat at actual rates, Benchmark EPS up 6%• Strong B2B performance, organic growth up 7%, expect H2 to edge higher• Good progress in Consumer Services:
• Strong start for IdentityWorks• CreditMatcher going well• Outstanding response to new services in Brazil
• Completed c. two thirds of US$600m share repurchase programme• First interim dividend up 4%
Financial and strategic progress
Shareholder returns

4 © Experian Public
Regional highlightsNorth America B2B• Good momentum in B2B
• Several new product introductions, for example:• Ascend• eResolve• Text For Credit• PowerCurve Collections
• Fannie Mae to add Experian trended data to Desktop Underwriter
• Securing new client wins in health• Experian data usage grows in digital marketing
campaigns

5 © Experian Public
• Adding new features and expanding our offers every 60-90 days:• Identity Lite – basic protection $4.99 per month• Family Plan – protects entire family $29.99 per month
Regional highlightsNorth America Consumer Services – IdentityWorks
6 © Experian Public
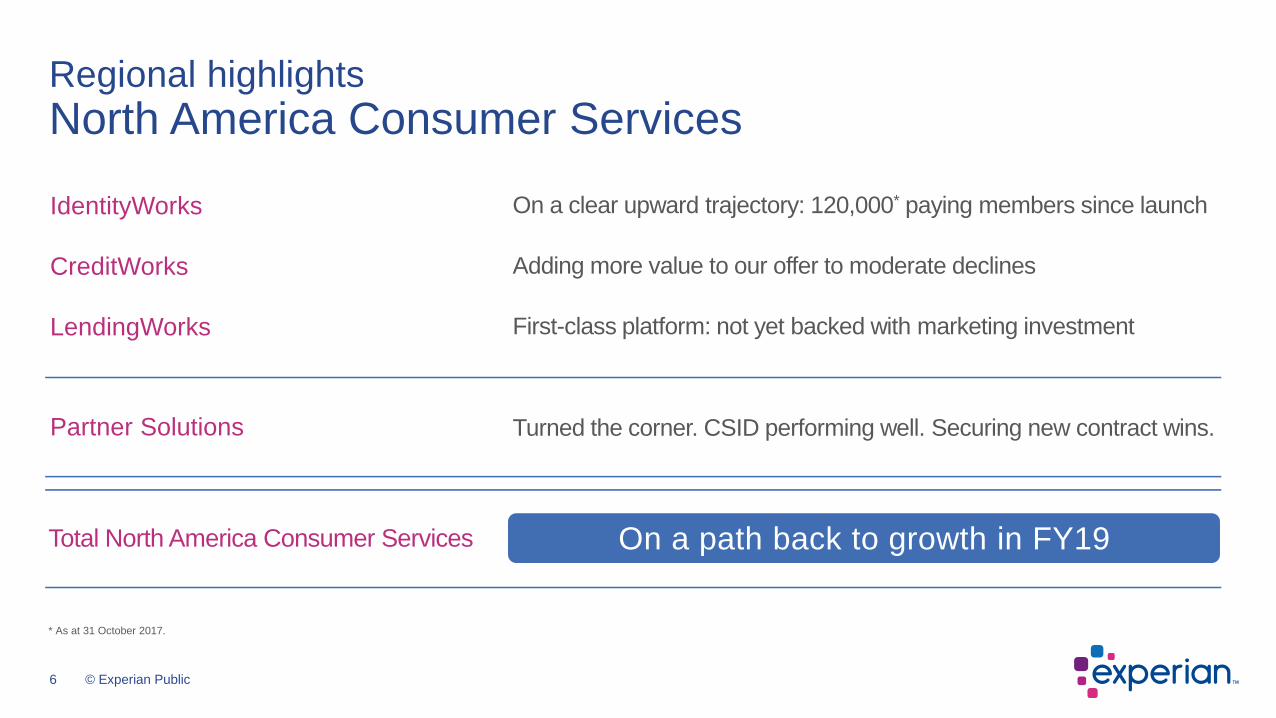
Regional highlightsNorth America Consumer Services
IdentityWorks
CreditWorks
LendingWorks
Partner Solutions
Total North America Consumer Services
On a clear upward trajectory: 120,000* paying members since launch
Adding more value to our offer to moderate declines
First-class platform: not yet backed with marketing investment
Turned the corner. CSID performing well. Securing new contract wins.
On a path back to growth in FY19
* As at 31 October 2017.
7 © Experian Public
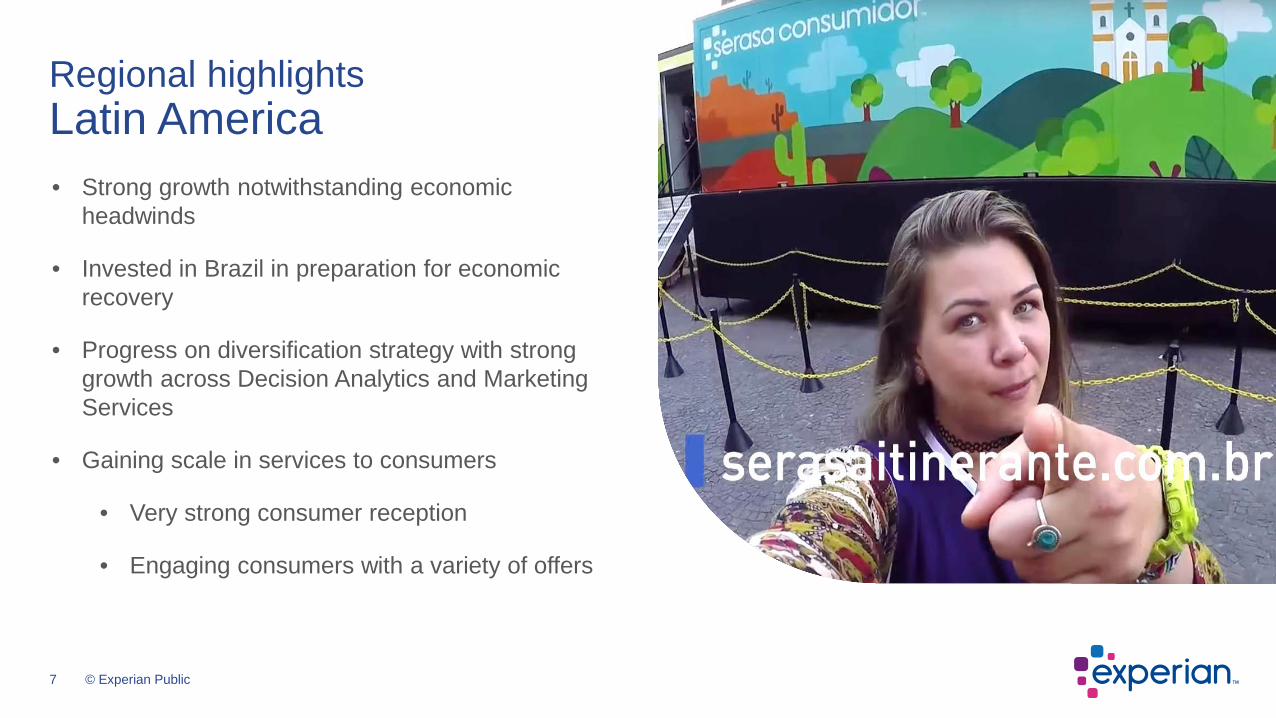
Regional highlightsLatin America• Strong growth notwithstanding economic
headwinds
• Invested in Brazil in preparation for economic recovery
• Progress on diversification strategy with strong growth across Decision Analytics and Marketing Services
• Gaining scale in services to consumers
• Very strong consumer reception
• Engaging consumers with a variety of offers

8 © Experian Public
Regional highlights
• Pursuing sizeable opportunities in new market segments
• Making good progress in price comparison and background checking
• Consumer Services
• Gaining scale in CreditMatcher
• Reduced revenue drag through H2 FY18
• Double-digit revenue growth in the half
• Driven by new business wins for global Experian products, for example PowerCurve
• Early stage investments to address new markets
UK and Ireland EMEA/Asia Pacific
9 © Experian Public
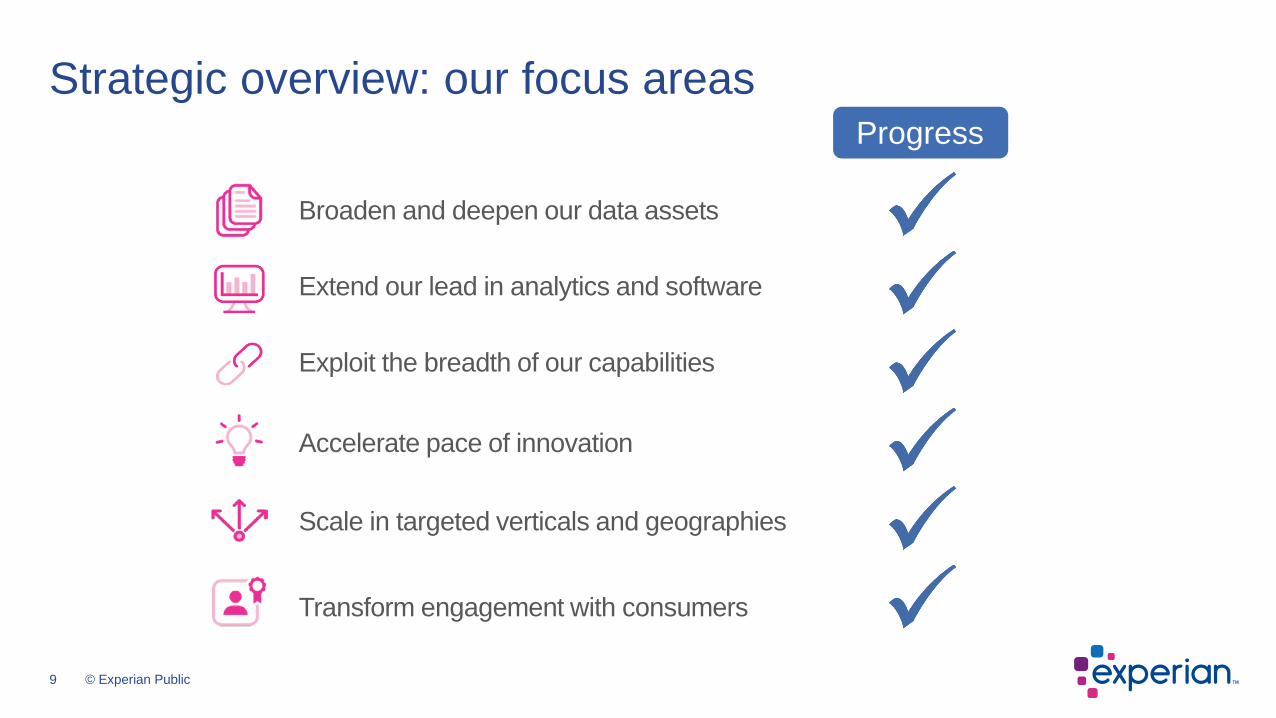
Strategic overview: our focus areas
Broaden and deepen our data assets
Extend our lead in analytics and software
Transform engagement with consumers
Accelerate pace of innovation
Exploit the breadth of our capabilities
Scale in targeted verticals and geographies
Progress

10 © Experian Public
Broaden and deepen our data assets US consumer credit data
220m current coverage
Alternative financial data Rent bureau
Clarity62m total (24m thin)
20m total (9m thin & no hit)Over 1,000 data furnishers
Account aggregation
Wireless95% have mobile phones
UtilitiesElectric, gas, water, waste
Organic build
270m potential coverage

11 © Experian Public
Sandbox
Attributes Scores
Credit data
Clientdata
Alternativedata
Software tools and AI
Create
Analytics database
Extend our lead in analytics and scoringExperian Ascend analytical sandbox
Strong client reception for Ascend since launch
Original sandbox
• 10% sample credit file
• Not real-time data (3.5 days – weeks old
• Analytics by client staff
• No data visualisation
• 5 years of historic data (back to 2012)
• Full-file access
• Near-real-time data (daily/hourly updates)
• Artificial Intelligence tools
• Data visualisation via Tableau
• 10+ years of depersonalised data
New Ascend sandbox

12 © Experian Public
Accelerate the pace of innovationTransform technology to enable faster growth
Accelerate pace of innovation
• 33 CrossCore deals signed• Text For Credit – momentum building• PowerCurve Collections – strong client reception
Transforming our technology
Safeguard all data
• Real-time access to data• Build once, deploy anywhere• Greater utilisation of more data
• Continued investment in robust information security environment
13 © Experian Public
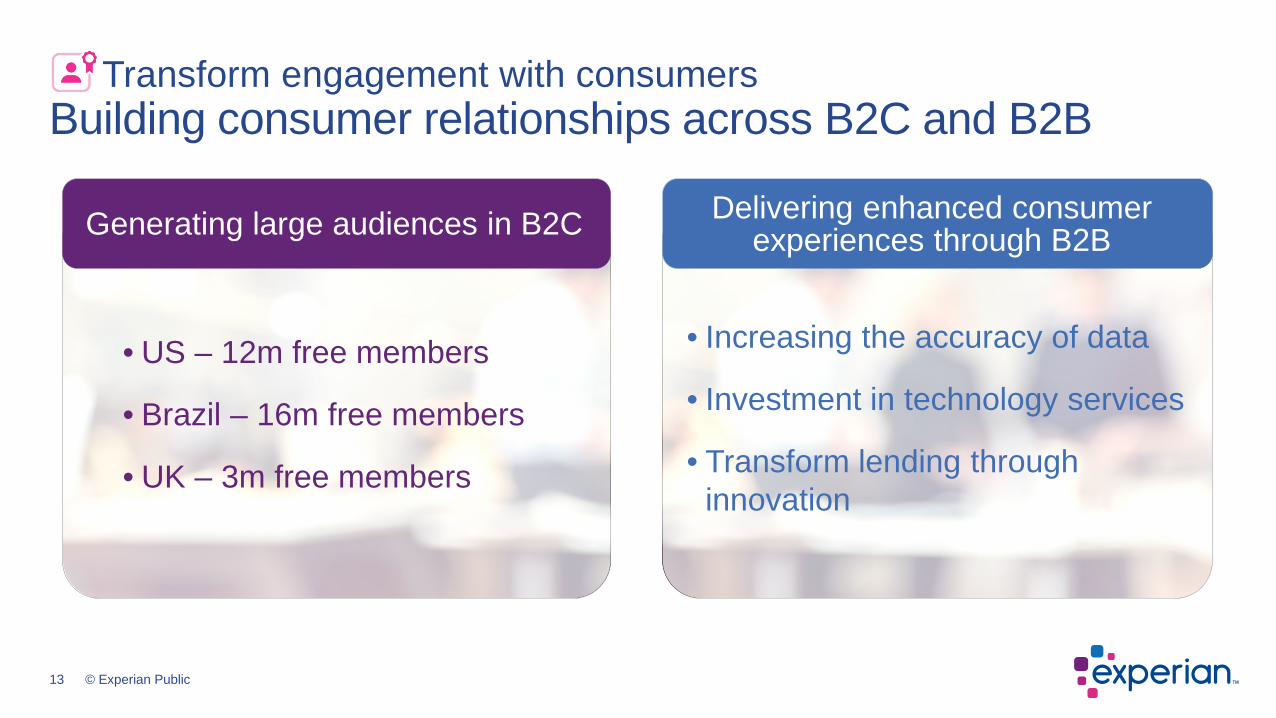
Transform engagement with consumersBuilding consumer relationships across B2C and B2B
Delivering enhanced consumer experiences through B2B
• US – 12m free members
• Brazil – 16m free members
• UK – 3m free members
• Increasing the accuracy of data
• Investment in technology services
• Transform lending through innovation
Generating large audiences in B2C

14 © Experian Public
• Good progress in the first half
• B2B delivering strong momentum and investments will enable us to sustain growth
• Actions taken in Consumer show good promise
Summary
14

Financial review
Lloyd Pitchford, Chief Financial Officer

16 © Experian Public
Highlights – first half FY18
Certain financial data have been rounded within this presentation. As a result of this rounding, the totals of data presented may vary slightly from the arithmetic totals of such data.Revenue, Benchmark EBIT growths and Benchmark EBIT margin are on an ongoing activities basis.
Margin progression
Total revenue growth
Organic revenue growth
Benchmark EBIT margin
Dividend per share growth 4%First interim dividend
Operating cash conversion 68%Operating cash flow
Benchmark EPS growth 6%Earnings
26.5%EBIT
5%Revenue Growth
Actual rates
Constant rates
4%
5%
-10 bps 0 bps
Benchmark EBIT growth 5%5%
17 © Experian Public
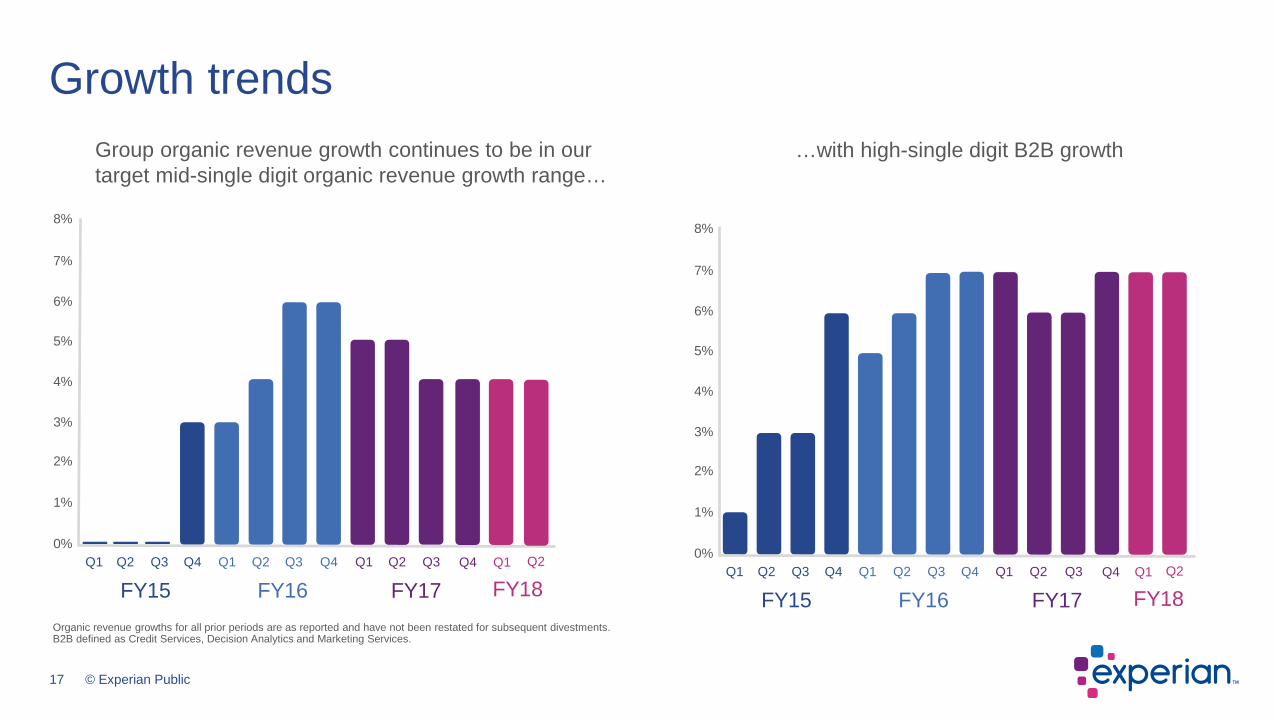
Growth trends
Organic revenue growths for all prior periods are as reported and have not been restated for subsequent divestments.B2B defined as Credit Services, Decision Analytics and Marketing Services.
Group organic revenue growth continues to be in our target mid-single digit organic revenue growth range…
…with high-single digit B2B growth
7%
6%
5%
4%
3%
2%
1%
0%
8%
Q1 Q2 Q3 Q4 Q1 Q2 Q3 Q4 Q1 Q2 Q3
FY15 FY16 FY17Q4
FY18Q1 Q2
7%
6%
5%
4%
3%
2%
1%
0%
8%
Q1 Q2 Q3 Q4 Q1 Q2 Q3 Q4 Q1 Q2 Q3
FY15 FY16 FY17Q4
FY18Q1 Q2

18 © Experian Public
First-half revenue growth
1 At actual FX rates.2 Restated for the divestment of the email/cross-channel marketing business (CCM).
FY18 H1 revenue before
FX
FY18 H1 reported revenue
North America B2B
ForeignExchangeUK and
Ireland B2BEMEA/
Asia PacificLatin America
+7% +7% +3% +11%
2,190
Acquisitions
+4% Group organic revenue growth+5% total revenue growth
+5%1 total revenue growth
FY17 H1 restatedrevenue2
2,236
2,086
Consumer Services
-8%
NA: -4%UK&I: -18%
US$million

19 © Experian Public
Benchmark EBIT margin – by region
1 Restated for the divestment of the email/cross-channel marketing business (CCM).
FY18 H1 reported Benchmark EBIT margin at actual
rates
Foreignexchange
26.4%
FY18 H1 Benchmark EBIT margin at prior year FX rates
26.5%
0.8%
Latin AmericaEMEA/
Asia Pacific
(0.1)%
(1.3)%
FY17 H1 restated Benchmark EBIT margin at actual
rates1
North America
B2B
0.1%
26.5%
UK and Ireland
B2B
0.3%0.2%
North America and UK
Consumer Services

20 © Experian Public
Revenue 2017 2016 Total growth Organic growth
Credit Services 697 652 7% 7%
Decision Analytics 83 77 8% 8%
Marketing Services 104 93 12% 12%
Business-to-Business 884 822 8% 7%
Consumer Services 374 360 4% (4)%
Total revenue 1,258 1,182 6% 4%
Benchmark EBIT – ongoing activities 395 377 5%
Benchmark EBIT margin 31.4% 31.9%
Six months ended 30 SeptemberUS$million
North America
All results are Benchmark figures and are on an ongoing activities basis.Growth at constant exchange rates.

21 © Experian Public
Revenue 2017 2016 Total growth Organic growth
Credit Services 340 311 4% 4%
Decision Analytics 28 20 35% 35%
Marketing Services 13 9 30% 30%
Total revenue 381 340 7% 7%
Benchmark EBIT – ongoing activities 118 107 5%
Benchmark EBIT margin 31.0% 31.5%
Latin AmericaSix months ended 30 SeptemberUS$million
All results are Benchmark figures and are on an ongoing activities basis.Growth at constant exchange rates.

22 © Experian Public
Revenue 2017 2016 Total growth Organic growth
Credit Services 124 122 7% 5%
Decision Analytics 98 102 3% 3%
Marketing Services 70 74 0% 0%
Business-to-Business 292 298 4% 3%
Consumer Services 86 112 (18)% (18)%
Total revenue 378 410 (2%) (3%)
Benchmark EBIT – ongoing activities 112 122 (3)%
Benchmark EBIT margin 29.6% 29.8%
UK and IrelandSix months ended 30 SeptemberUS$million
All results are Benchmark figures and are on an ongoing activities basis.Growth at constant exchange rates.

23 © Experian Public
Revenue 2017 2016 Total growth Organic growth
Credit Services 73 73 (1)% (1)%
Decision Analytics 79 64 25% 25%
Marketing Services 21 18 13% 13%
Total revenue 173 154 11% 11%
Benchmark EBIT – ongoing activities (14) (17) 11%
Benchmark EBIT margin (8.1)% (11.0)%
EMEA/Asia PacificSix months ended 30 SeptemberUS$million
All results are Benchmark figures and are on an ongoing activities basis.Growth at constant exchange rates.
24 © Experian Public
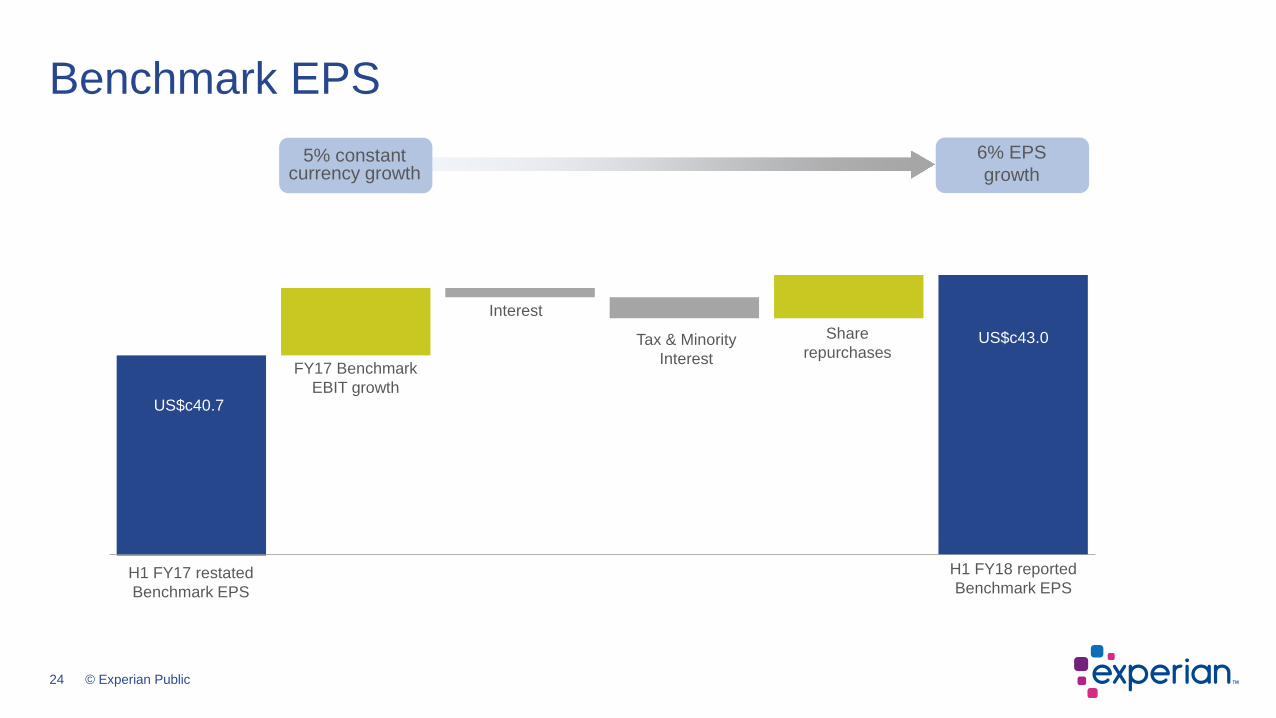
Benchmark EPS
H1 FY18 reported Benchmark EPS
Interest
Tax & Minority Interest
Share repurchases
US$c40.7
FY17 Benchmark EBIT growth
US$c43.0
H1 FY17 restated Benchmark EPS
6% EPS growth
5% constant currency growth
25 © Experian Public
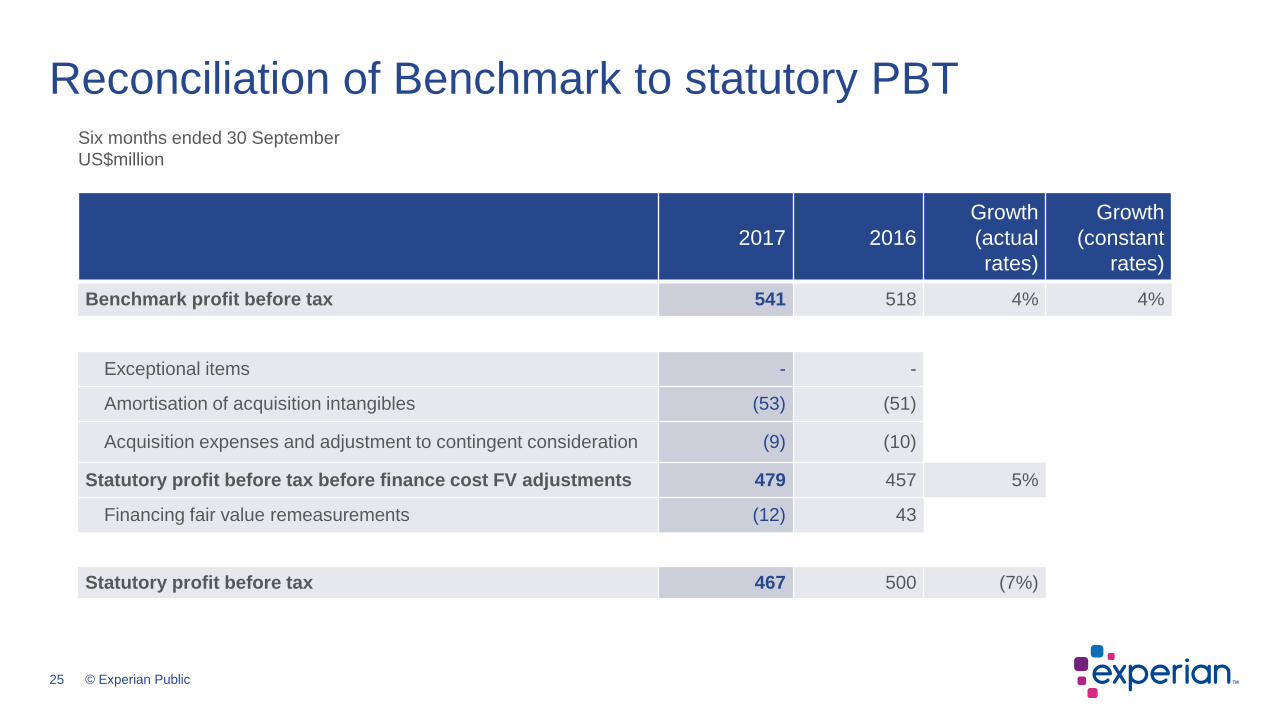
2017 2016Growth(actual rates)
Growth(constant
rates)Benchmark profit before tax 541 518 4% 4%
Exceptional items - -
Amortisation of acquisition intangibles (53) (51)
Acquisition expenses and adjustment to contingent consideration (9) (10)
Statutory profit before tax before finance cost FV adjustments 479 457 5%
Financing fair value remeasurements (12) 43
Statutory profit before tax 467 500 (7%)
Reconciliation of Benchmark to statutory PBTSix months ended 30 SeptemberUS$million

26 © Experian Public
Benchmark cash flow
Benchmark EBIT Benchmark operating cash
flow
Working capital and other
Net capital expenditure
Amortisation and depreciation
Benchmark free cash flow
Net interest paid Tax paid on
operating activities
581 (187)
159
393
(37)
(66) (1)
28968%conversion of Benchmark
EBIT into Benchmark operating cash flow
73%conversion of Benchmark earnings into Benchmark
free cash flow
Dividends to minorities
(160)
US$million

27 © Experian Public
Net debt
Net debt at 1 April 2017
Net share purchases
Equity dividends paidBenchmark
free cash flowAcquisitions and minority investments
Net debt at30 September 2017
FX and other3,173 32(289)
389
264
111
3,403
CCM disposal
(277)
2.1xNet debt /
Benchmark EBITDA
2.2xNet debt /
Benchmark EBITDA
US$million

28 © Experian Public
Modelling considerations for FY18
Acquisitions and investments • Four bolt-ons; pro forma revenue of c.US$60m
Net interest • Expected to be c.$85m
Tax • Benchmark tax rate between 26% and 27%
Capital expenditure • Capital expenditure 9-10% of revenue
Share repurchases • Full year WANOS* expected to be in the region of 917m shares.
* Weighted average number of shares.

29 © Experian Public
Summary and outlook
• Good financial and strategic progress in the first half
• Strong B2B performance
• B2C trajectory improving
• Outlook for FY18
• Mid single-digit organic revenue growth; H2 weighted
• Stable margins at constant currency
• Benchmark earnings per share growth
• Continued focus on strategic initiatives and capital framework

Closing summary
Brian Cassin, Chief Executive Officer

31 © Experian Public
Closing summary
31
Foundations laid for a stronger future

Appendix

33 © Experian Public
Appendix – FY17 H1 restated for CCM divestment
H1 FY17 as reported (inc
CCM)Adjustment
H1 FY17 as restated (ex
CCM)
H2 FY17 (inc CCM) Adjustment
H2 FY17 (ex CCM)
FY17 (inc CCM) Adjustment FY17
(ex CCM)
Group Results
Revenue North America 1,262 (80) 1,182 1,363 (88) 1,275 2,625 (168) 2,457Latin America 342 (2) 340 391 (1) 390 733 (3) 730UK and Ireland 423 (13) 410 409 (12) 397 832 (25) 807EMEA/Asia Pacific 209 (55) 154 244 (57) 187 453 (112) 341Total Revenue 2,236 (150) 2,086 2,407 (158) 2,249 4,643 (308) 4,335
EBIT Total EBIT 574 (21) 553 679 (33) 646 1,253 (54) 1,199
EBIT Margin 25.7% 26.5% 28.2% 28.7% 27.0% 27.7%
Organic growth North America 5% 1% 6% 3% 0% 3% 4% 1% 5%Latin America 7% 0% 7% 10% 0% 10% 9% 0% 9%UK and Ireland 1% 1% 2% -1% 1% 0% 0% 1% 1%EMEA/Asia Pacific 8% (1%) 7% 9% 2% 11% 9% 0% 9%Total 5% 0% 5% 4% 0% 4% 4% 1% 5%

34 © Experian Public
AppendixExperian American Depositary Receipt (ADR) program
For ADR shareholder enquiries, please contact:Shareholder RelationsBNY Mellon Depositary ReceiptsPO Box 30170College StationTX 77842-3170United States
T: + 1 201 680 6825 (From the US: 1-888-BNY-ADRS, toll free)
E: [email protected]: www.mybnymdr.com
Experian ADR shares trade on the OTCQX under the following information:Symbol EXPGYCUSIP 30215C101Ratio 1 ADR : 1 ORDCountry United KingdomEffective Date October 11, 2006Underlying SEDOL B19NLV4Underlying ISIN GB00B19NLV48U.S. ISIN US30215C1018Depositary BNY Mellon

35 © Experian Public
AppendixContacts
ExperianCardinal Place80 Victoria StreetLondon Tel: +44 (0)203 042 4200SW1E 5JL Website: www.experianplc.com
Nadia Ridout-Jamieson Peg SmithChief Communications Officer Executive Vice-PresidentEmail: [email protected] Email: [email protected]
Sarah SchibliInvestor Relations and Communications ManagerEmail: [email protected]
AppendixContacts

36 © Experian Public
18 January 2018 Third quarter trading update (FY18)
17 May 2018 Full year results (FY18)
13 July 2018 First quarter trading update (FY19)
18 July 2018 Annual General Meeting
AppendixEvent calendar

37 © Experian Public
• This presentation is being made only to, and is only directed at, persons to whom this presentation may lawfully be communicated(“relevant persons”). Any person who is not a relevant person should not act or rely on this presentation or any of its contents.
• Information in this presentation relating to the price at which relevant investments have been bought or sold in the past or the yield on such investments cannot be relied upon as a guide to the future performance of such investments.
• This presentation does not constitute or form part of, and should not be construed as, an offering of securities or otherwise constitute an invitation, inducement or recommendation to any person to underwrite, subscribe for or otherwise acquire securities in anycompany within the Experian group (the “Group”).
• Certain statements made in this presentation are forward looking statements. Such statements are based on current expectations and are subject to a number of risks and uncertainties that could cause actual events or results to differ materially from any expected future events or results expressed or implied in these forward-looking statements. Forward-looking statements speak only as of the date of this presentation.
• This presentation contains certain non-GAAP financial information. The Group’s management believes that these measures provide valuable additional information in understanding the performance of the Group or the Group’s businesses because they provide measures used by the Group to assess performance. Although these measures are important in the management of the business, they should not be viewed as replacements for, but rather as complementary to, the GAAP measures.
AppendixDisclaimer


