HALF YEAR INVESTOR PRESENTATION - PIPE … 2008 Half Yearly... · Malcolm Thompson FINANCE GM SALES...
40
HALF YEAR INVESTOR PRESENTATION 13 February 2008
Transcript of HALF YEAR INVESTOR PRESENTATION - PIPE … 2008 Half Yearly... · Malcolm Thompson FINANCE GM SALES...

HALF YEAR INVESTOR PRESENTATION
13 February 2008

Click to edit Master title style
HALF YEAR INVESTOR PRESENTATION
BEVAN SLATTERYChief Executive Officer

Click to edit Master title style
HALF YEAR INVESTOR PRESENTATION
Key Highlights
� Continued strong growth in revenue (46%) and profit (40%) acrossall business areas including peering, telehousing, intercapital and dark fibre.
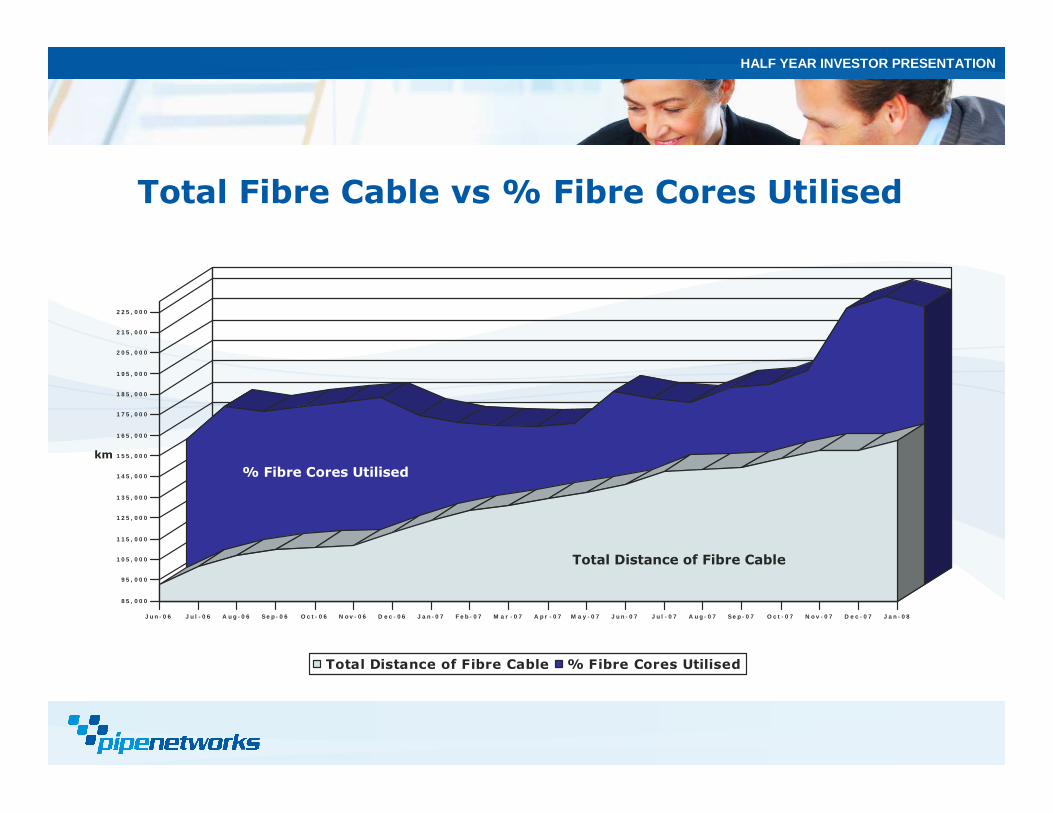
� Fibre network grew to over 1,000km with growth in further expansion expected to slow, however utilisation increasing above20% for the first time.
� Restructure and boost of PIPE Networks executive team after announcement of PPC-1 (Project Runway) and resignation of Co-Founder and CTO Steve Baxter from Executive duties in June 2008.Steve will remain as non-Exec Director and major shareholder.
� Commencement of PPC-1 (formerly Runway) our cable system to Sydney.

Click to edit Master title style
HALF YEAR INVESTOR PRESENTATION
1,807
929
5,101
Movement
$(,000)
40%2,3493,278NPAT
44%4,1015,908EBITDA
46%11,16216,263Revenue
Movement
%
HY 2007$ (,000)
HY 2008
$ (,000)
Results for Announcement to the Market
Summary of Financial Information
30%29%Profit before tax / revenue
10%8%Profit after tax / equity interests
58.5794.91Net tangible assets per security (NTA)
5.987.38Diluted earnings per security
5.997.39Basic earnings per security (EPS)
HY2007HY 2008EPS, NTA and Ratios

Click to edit Master title style
HALF YEAR INVESTOR PRESENTATION
Network Coverage
22%
160
35,730,635
162,644,738
1,014,391
January 2008
141,006,32592,916,35210,664,088Metres of fibre Optic Cores Installed
162164143Average fibre cores per metre of
cable
17.5%16%19%% of fibre core metres utilised
24,675,19114,420,3722,138,654Metres of fibre optic cores used
869,304559,51174,347Metres of fibre cable installed
June 2007June 2006June 2005
Click to edit Master title style
HALF YEAR INVESTOR PRESENTATION
8 5 , 0 0 0
9 5 , 0 0 0
1 0 5 , 0 0 0
1 1 5 , 0 0 0
1 2 5 , 0 0 0
1 3 5 , 0 0 0
1 4 5 , 0 0 0
1 5 5 , 0 0 0
1 6 5 , 0 0 0
1 7 5 , 0 0 0
1 8 5 , 0 0 0
1 9 5 , 0 0 0
2 0 5 , 0 0 0
2 1 5 , 0 0 0
2 2 5 , 0 0 0
J u n - 0 6 J u l - 0 6 A u g - 0 6 Se p - 0 6 O c t - 0 6 N o v - 0 6 D e c - 0 6 J a n - 0 7 F e b - 0 7 M a r - 0 7 A p r - 0 7 M a y - 0 7 J u n - 0 7 J u l - 0 7 A u g - 0 7 Se p - 0 7 O c t - 0 7 N o v - 0 7 D e c - 0 7 J a n - 0 8
Total Distance of Fibre Cable % Fibre Cores Utilised
Total Distance of Fibre Cable
% Fibre Cores Utilised
Total Fibre Cable vs % Fibre Cores Utilised
km

Click to edit Master title style
HALF YEAR INVESTOR PRESENTATION
PRODUCT GROWTH

Click to edit Master title style
HALF YEAR INVESTOR PRESENTATION
Product Growth
� New Intercap network is performing strongly and is almost contributing $1,000,000 in annualised GP within 8 months of commencement.
� Dark Fibre revenues continue to grow strongly at above 40% driven by Australia’s insatiable bandwidth requirements.
� Data Centre – “DC3” already full (completed in June 07) with DC4 under construction and expected to be fully leased by the time of completion on July 1, 2008.
� Peering revenue continuing to grow at steady rate.
� Over $300,000 per month of new billable revenue already under contract which is being provisioned and due to start billing between now and July 1, 2008. The company will not see the effect of this until 2008/9 financial year.

Click to edit Master title style
HALF YEAR INVESTOR PRESENTATION
PROJECT RUNWAY
THE SYDNEY TO GUAM CABLE

Click to edit Master title style
HALF YEAR INVESTOR PRESENTATION
PPC-1 – An Investment in Australia’s Future
� Approx 6,900km fibre cable connecting Sydney to Guam.
� 2 Pair fibre system with 96 x 10G wavelengths per pair (1.92Tb/s).
� Latest system design technology leap-frogging current systems.
� Cost of approx AU$200M.
� Interconnects Australia, PNG, Guam and beyond with partnership VSNL.
� Q2 2009 RFS (ready for service) date.

Click to edit Master title style
HALF YEAR INVESTOR PRESENTATION
PPC-1 Map
Sydney
Guam
Brisbane
Popondetta
Madang
PPC-2
Click to edit Master title style
HALF YEAR INVESTOR PRESENTATION
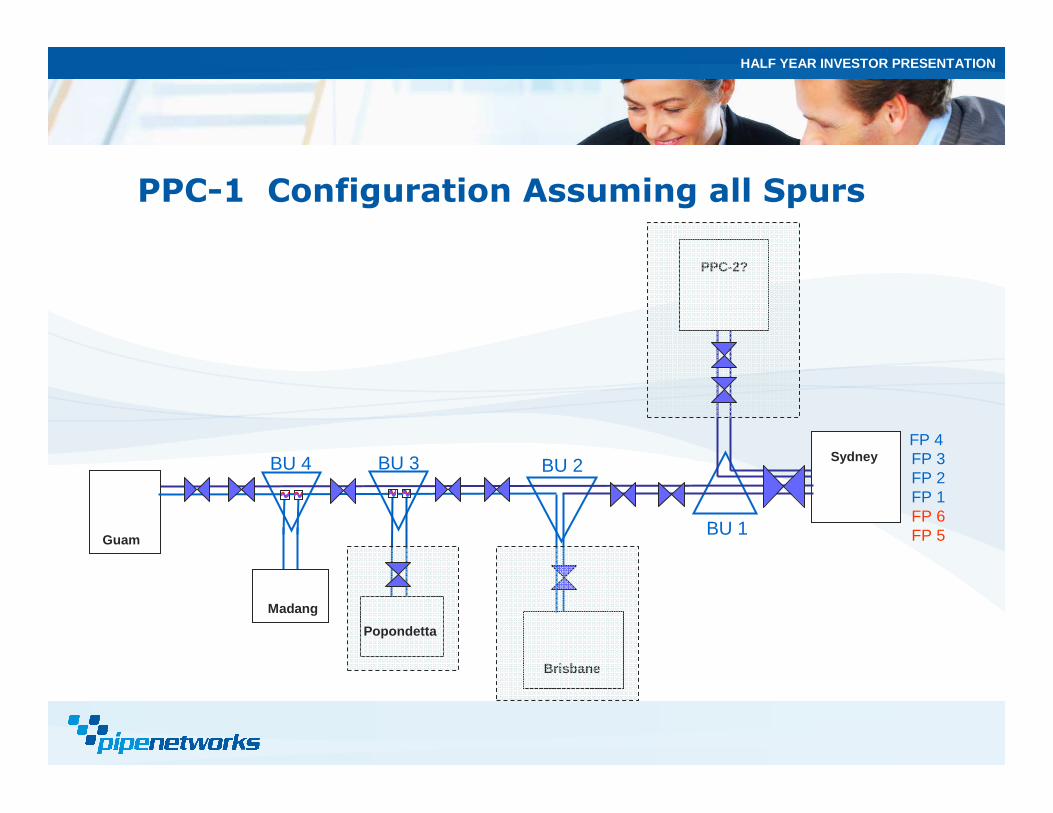
PPC-1 Configuration Assuming all Spurs
Guam
SydneyBU 4FP 4 FP 3FP 2FP 1FP 6FP 5
BU 2
BU 1
Popondetta
BU 3
Madang
PPC-2?
Brisbane

Click to edit Master title style
HALF YEAR INVESTOR PRESENTATION
Why Guam?
� Strategic Hub for Asian Cable Systems.
� Very Stable – US Territory with US Defense relocating its Okinawa Base to Guam including over 10,000 Marines and an estimated additional 30,000 support staff.
� Onward Capacity to US and Japan through onward capacity agreements with VSNL.
� Also Onward Capacity to Japan, China, Hong Kong through other existing systems and also additional capability through the new AAG cable system currently planned for completion in 2009.

Click to edit Master title style
HALF YEAR INVESTOR PRESENTATION
The International Capacity Market
� PPC-1 will be only one of two (2) cables connecting the east coast of Australia to Asia (via Guam) the fastest growing region in terms of Internet capacity.
� Growing trend in both higher speeds connections and Ethernet based transport (such as PPC-1).
� The move towards video content demands higher speeds, higher quotas and bigger pipes.
� Global telecommunications research leader Telegeography has estimated that Australia’s international traffic requirements will increase 22% per annum on a compounding basis resulting in a 10-fold increase over the next 10 years (report attached).
Click to edit Master title style
HALF YEAR INVESTOR PRESENTATION
The International Capacity Market (Historical)

Click to edit Master title style
HALF YEAR INVESTOR PRESENTATION
The International Capacity Market (Forecast)

Click to edit Master title style
HALF YEAR INVESTOR PRESENTATION
Funding
� No immediate requirement to raise capital due to strong balance sheet.
� Should the Board decide to raise additional capital it may do so via a number of means including issuing new capital in PIPE International to a strategic investor(s) or possibly within PIPE Networks via share placement, rights issue and/or SPP.
� Majority of the project will be funded by construction finance which is being finalised by management. However any construction finance is expected to be 100% secured by customer IRU (indefeasible right of use) contracts. These contracts are long term capacity deals which are payable upfront within 30 days of system completion.

Click to edit Master title style
HALF YEAR INVESTOR PRESENTATION
Funding cont’d
� Any additional sales contracts attractive a very high level of profitability.
� Upon completion, cable vehicle will be debt free within 6 monthswhile project vehicle is expected to be NPAT positive within the first 12 months of operation.
� Company believes there is significant opportunity to secure further capacity agreements prior to commencement of the system. Depending on size and volume, these sales could significantly improve current forecasts and cashflow.

Click to edit Master title style
HALF YEAR INVESTOR PRESENTATION
PPC-1 Funding
September 2008
June 2009
July 2009
$40mSecondary Debt by PWKConvertible to Capacity
$25mConvertible Note by PWK
$100m
Proposed Project Finance100% secured against
IRU contracts
$35mOnward Capacity
(Non-cash capacity swap arrangement)
$40mPWK Capacity
(Extinguish Secondary Debt)
$25mPWK Equity(Extinguish
Convertible Note)
$100mIRU Sales
(Extinguish Project Finance)
$35mCapacity Swap
(Extinguish Onward Capacity Commitment)
Post Completion
$0m
$40m
$65m
$165m
$200m

Click to edit Master title style
HALF YEAR INVESTOR PRESENTATION
Structure

Click to edit Master title style
HALF YEAR INVESTOR PRESENTATION
What will PPC-1 mean for PIPE Networks
� Brings PIPE Networks into the international marketplace.
� Creates a significant asset with over 90% spare capacity available for sale. Much like our existing metro fibre assets, any additional sale can potentially attract a high level of profitability.
� Project to be fully funded by investment and capacity agreements.
� No change to 2008 and 2009 financial years guidance at this stage.
� Service contracts from PPC-1 to contribute $20M+ in additional revenues to the Group in 2010 FY and beyond.

Click to edit Master title style
HALF YEAR INVESTOR PRESENTATION
LOOKING FORWARD
Click to edit Master title style
HALF YEAR INVESTOR PRESENTATION
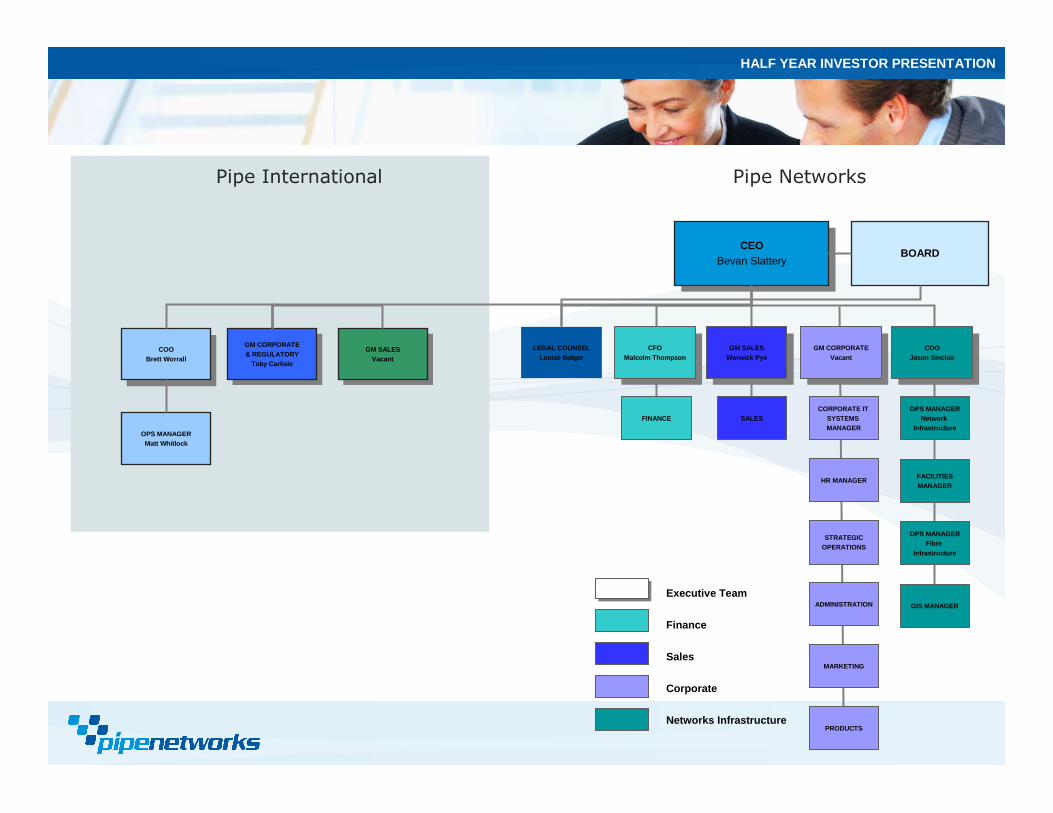
Corporate Restructure
� Co-Founder Steve Baxter stepping down from Executive duties in July 2008 allowing a re-think of corporate structure. Steve to continue as a Non-Executive Director.
� Injection of highly skilled and experienced managers into the key COO roles of PIPE Networks and PIPE International.
� Promotion of key staff involved in the formation of PPC-1 into PIPE International.
� Working to fill remaining outstanding positions now that corporate restructure has been approved by the Board.
Click to edit Master title style
HALF YEAR INVESTOR PRESENTATION
Pipe International Pipe Networks
CEOBevan Slattery
CEOBevan Slattery
LEGAL COUNSELLouise Bolger CFO
Malcolm Thompson
CFOMalcolm Thompson
FINANCE
GM SALESWarwick Pye
GM SALESWarwick Pye
SALES
GM CORPORATEVacant
GM CORPORATEVacant
CORPORATE IT SYSTEMS MANAGER
HR MANAGER
STRATEGICOPERATIONS
ADMINISTRATION
MARKETING
PRODUCTS
COOJason Sinclair
COOJason Sinclair
OPS MANAGERNetwork
Infrastructure
FACILITIESMANAGER
OPS MANAGERFibre
Infrastructure
GIS MANAGER
BOARD
COOBrett Worrall
COOBrett Worrall
OPS MANAGERMatt Whitlock
GM CORPORATE& REGULATORY
Toby Carlisle
GM CORPORATE& REGULATORY
Toby CarlisleGM SALES
Vacant
GM SALESVacant
Finance
Sales
Corporate
Networks Infrastructure
Executive Team
Click to edit Master title style
HALF YEAR INVESTOR PRESENTATION
The ‘Federation’ Project
� PIPE Networks announces the expansion of its metro networks in Perth and Adelaide in order to provide a ‘national’ metro footprint.
� Expected to be completed by June 2008.
� $2.5M capital expenditure this half.
� Expect the metro networks to breakeven from an operational cost basis within first 6 months of completion.
� Upgrading and extending existing Intercap network to Adelaide and Perth. Expect the Intercap network to breakeven within 6 months of completion.

Click to edit Master title style
HALF YEAR INVESTOR PRESENTATION
Going from Strength to Strength
� Company experiencing record sales and overall improvement in quality of earnings through increase recurring revenue compared to installation earnings. Company signed new contracts with over $1.3M+ in new monthly recurring revenue for the 12 months previous. Impact of sales won’t be fully appreciated until 2008/09.
� Outstanding network coverage reducing annual capex in existing markets.
� New products such as Intercap and DC3 are already profitable.
� Strong balance sheet – strong cashflow.
� Building greater depth in Management team.
� Combining a national metro footprint with an intercapital network and an international link makes PIPE one of Australia’s largest telecommunications infrastructure providers.

Click to edit Master title style
HALF YEAR INVESTOR PRESENTATION
19,478
10,698
45,208
FY 2009 (f)
$(,000)
17,0007,2694,921NPAT
32,00013,0488,705EBITDA
73,00034,01824,277Revenue
FY 2010 (f)
$(,000)
FY 2008 (f)$ (,000)
FY 2007 (a)
$ (,000)
Financial projections –excluding PPC-1
Full Year Projections(Assuming no further significant sales on PPC-1)
+49%
+47%
+33%
FY 08-09 (f)
$(,000)
+59% +48%+74%NPAT
+64% +50%+82%EBITDA
+63% +40%+84%Revenue
FY 09-10 (f)
$(,000)
FY 07-08 (f)$ (,000)
FY 06-07 (a)
$ (,000)
Growth year on year

Click to edit Master title style
HALF YEAR INVESTOR PRESENTATION
THANK YOUThis concludes our presentation

Click to edit Master title style
HALF YEAR INVESTOR PRESENTATION
BRISBANE
Level 17
127 Creek Street
Brisbane
QLD, 4000
PIPE NETWORKS
Phone: +61 7 3233 9800
Fax: +61 7 3233 9880
Email: [email protected]
Web: www.pipenetworks.com
SYDNEY
Suite 9
135 King Street
Sydney
New South Wales, 2000
MELBOURNE
Suite 8
499 St Kilda Road
Melbourne
Victoria, 3004
ADELAIDE
Suite 2
132 Franklin Street
Adelaide
South Australia , 5000
HOBART
Suite 2
29 Elizabeth Street
Hobart
Tasmania, 7000

Australian Submarine Cable Market Analysis for Pipe Networks TeleGeography Research
2 of 35
I. Australian International Capacity Market Trends
Supply
Virtually all of the international telecommunications trafficbetween Australia and the rest of the world is carried by fiber-optic submarine cables. The amount of lit internationalcapacity on submarine cables connected to Australia has risennearly 10-fold between 2000 and 2007, from 56 Gbps to 575Gbps. The market for capacity to Australia is dominated by theSouthern Cross Cable Network and the Australia-Japan Cable,which account for 97 percent of lit supply (see Figure 1.Historical Lit Capacity of Australian Submarine Cables, 2000-2007 (Gbps)). The older SeaMeWe-3 and JASURAUSsystems operate on the west coast of Australia and provide acombined 15 Gbps of capacity.
Figure 1. Historical Lit Capacity of Australian Submarine Cables, 2002-2007 (Gbps)
! 2000 2001 2002 2003 2004 2005 2006 2007
PacRim West 1 1 1 1Southern Cross 40 160 300 480 480 480 480 480Australia-Japan Cable 80 80 80 80 80 80 80SeaMeWe-3 10 10 10 10 10 10 10 10JASURAUS 5 5 5 5 5 5 5 5Total 56 256 396 576 575 575 575 575Notes: Data as of year-end. Lit capacity presented in unprotected terms. PacRim West was retired in December2004.
After virtually no change in lit capacity on existing submarinecables connected to Australia between 2003 and 2007, supplyis poised to soar. During 2008 the lit capacity of cableconnected to Australia will grow substantially due to upgradesby Southern Cross and the Australia-Japan Cable. By the endof 2008, lit capacity will reach 1,195 Gbps, an increase of 108percent over 2007. The addition of the Pipe Pacific Cable-1 in2009 will add another 100 Gbps of capacity to the market.TeleGeography expects that by 2018 over 5 Tbps of litcapacity will be needed to serve Australia (see Figure 2Forecasted Lit International Capacity for Australia, 2007-2018(Gbps)).

Australian Submarine Cable Market Analysis for Pipe Networks TeleGeography Research
3 of 35
Figure 2. Forecasted Lit International Capacity for Australia, 2007-2018 (Gbps)
0
1,000
2,000
3,000
4,000
5,000
6,000
2007 2008 2009 2010 2011 2012 2013 2014 2015 2016 2017 2018
Lit Inte
rnational C
ap
acity t
o A
ustr
alia
(G
bp
s)
Notes: Data as of year end. Lit capacity presented in unprotected terms. Data for 2007 is historical. Data for 2008 to2018 are forecasted.
Demand
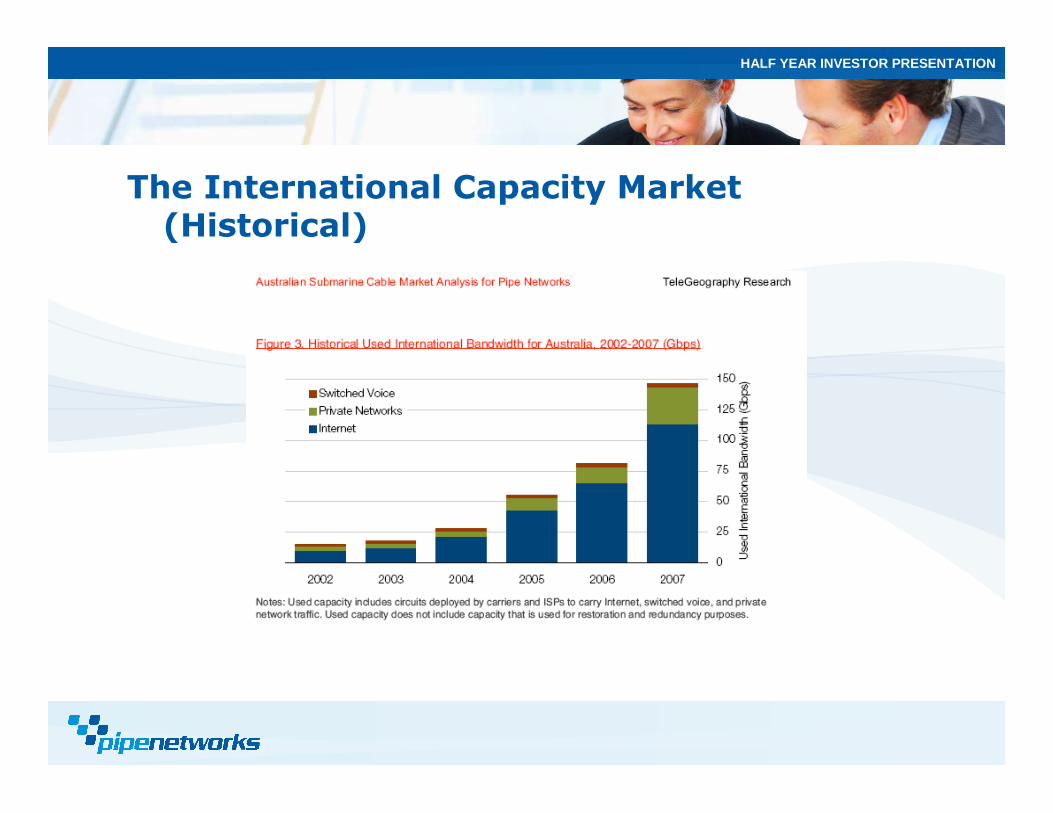
TeleGeography’s assessment of international capacitydemand is based on how carriers “use” their capacity. Networkcapacity usage is grouped into three general types: Internetbackbone networks, public switched voice networks, andprivate networks (primarily ATM, frame relay, dedicated intra-company links, and research and educational networks).Overall, between 2002 and 2007, used international capacityconnected to Australia increased from 15.4 Gbps to 146.1Gbps, a compounded annual growth rate of 57 percent (seeFigure 3. Historical Used International Bandwidth for Australia,2002-2007). By far, the largest contributor to capacity usageon international links to Australia is Internet backbones.Internet capacity accounts for approximately 78 percent of allused capacity, with the remainder of the capacity used to carryswitched voice traffic and private network traffic.

Australian Submarine Cable Market Analysis for Pipe Networks TeleGeography Research
4 of 35
Figure 3. Historical Used International Bandwidth for Australia, 2002-2007 (Gbps)
0
25
50
75
100
125
150
2002 2003 2004 2005 2006 2007
Used
Inte
rnational B
and
wid
th (G
bp
s)
Switched Voice
Private Networks
Internet
Notes: Used capacity includes circuits deployed by carriers and ISPs to carry Internet, switched voice, and privatenetwork traffic. Used capacity does not include capacity that is used for restoration and redundancy purposes.
The increased adoption of broadband has fueled the demandfor more Internet backbone capacity. The total amount oftraffic generated by end-users increased dramatically asconsumers switch from dial-up modems to higher bandwidthtechnologies such as Digital Subscriber Line (DSL) and cablebroadband. In Australia, the number of broadband subscribershave increased 15-fold between 2002 and 2007.
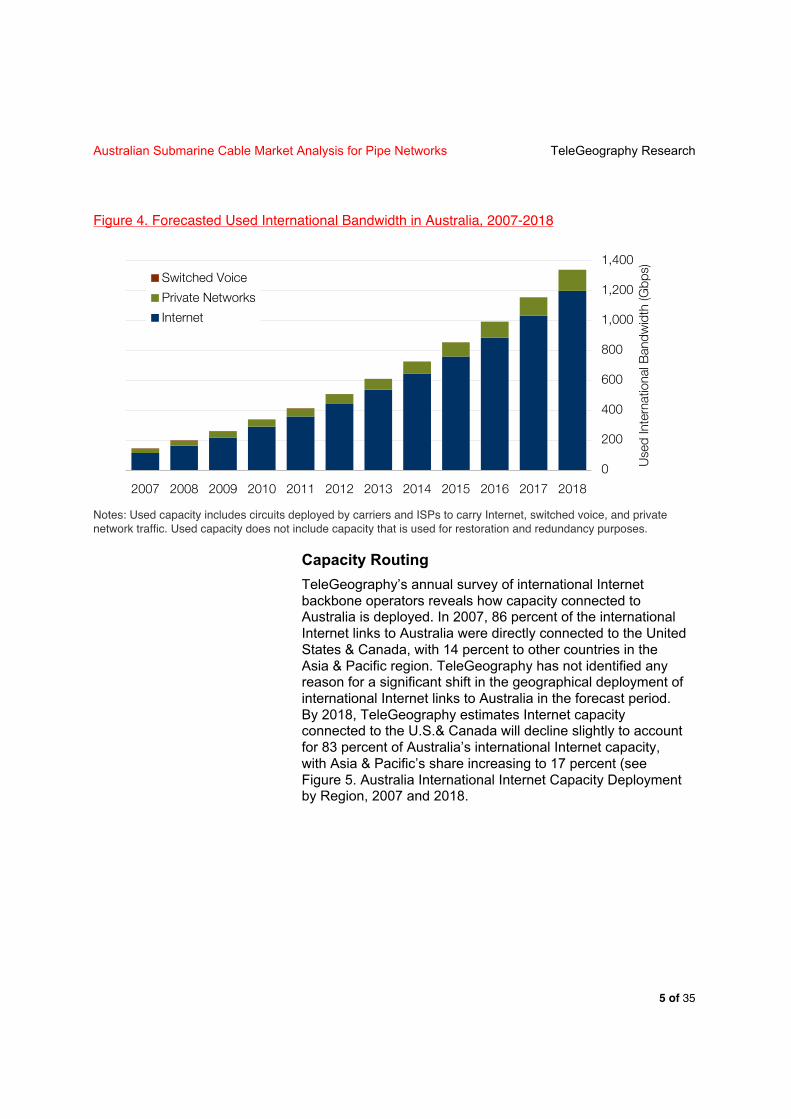
Broadband users tend to spend more time using the Internetand use bandwidth-intensive applications more frequently thannarrowband users. Thus, even as we anticipate the pace ofbroadband subscriber growth to slow, increased broadbandaccess speeds and the continued growth of video content areexpected to fuel demand growth. International bandwidthdemand in Australia is expected to grow at a compoundedannual rate of 22 percent between 2007 and 2018 (see Figure4. Forecasted Used International Bandwidth in Australia, 2007-2018). At this pace, the amount of used internationalbandwidth in Australia will approximately double every threeyears.
Australian Submarine Cable Market Analysis for Pipe Networks TeleGeography Research
5 of 35
Figure 4. Forecasted Used International Bandwidth in Australia, 2007-2018
0
200
400
600
800
1,000
1,200
1,400
2007 2008 2009 2010 2011 2012 2013 2014 2015 2016 2017 2018
Used
Inte
rnational B
and
wid
th (G
bp
s)
Switched Voice
Private Networks
Internet
Notes: Used capacity includes circuits deployed by carriers and ISPs to carry Internet, switched voice, and privatenetwork traffic. Used capacity does not include capacity that is used for restoration and redundancy purposes.
Capacity Routing
TeleGeography’s annual survey of international Internetbackbone operators reveals how capacity connected toAustralia is deployed. In 2007, 86 percent of the internationalInternet links to Australia were directly connected to the UnitedStates & Canada, with 14 percent to other countries in theAsia & Pacific region. TeleGeography has not identified anyreason for a significant shift in the geographical deployment ofinternational Internet links to Australia in the forecast period.By 2018, TeleGeography estimates Internet capacityconnected to the U.S.& Canada will decline slightly to accountfor 83 percent of Australia’s international Internet capacity,with Asia & Pacific’s share increasing to 17 percent (seeFigure 5. Australia International Internet Capacity Deploymentby Region, 2007 and 2018.

Australian Submarine Cable Market Analysis for Pipe Networks TeleGeography Research
6 of 35
Figure 5. Australia International Internet Capacity Deployment by Region, 2007 and 2018
2007Asia &
Pacific
14%
Europe
0%
U.S. &
Canada
86%
2018Asia &
Pacific
17%
Europe
0%
U.S. &
Canada
83%
Notes: Capacity deployment based on international router-to-router links between Australia and other regions.Deployment of capacity is not a proxy for direction of Internet traffic flows.
Capacity Prices
Wholesale Circuit Capacity
The Australian trans-Pacific circuit market, like most subseamarkets, has two primary sellers of wholesale bandwidth:cable owners and carriers that purchase large volumes ofcapacity and resell to other buyers. Cable operators tend to

Australian Submarine Cable Market Analysis for Pipe Networks TeleGeography Research
7 of 35
focus their efforts on high capacity sales, while resellerstypically sell more lower-rate circuits (STM-1 and below).Consequently, resellers often price these low-capacity circuitsmore aggressively than the cable operators themselves.TeleGeography is only able to present market prices for theselow capacity circuits, in order to ensure the confidentiality ofthe contributors. (Southern Cross and the Australia-JapanCable are the only sellers of high-capacity circuits)
Median monthly STM-1 lease prices on the Los Angeles-Sydney route have tumbled from $104,113 in 2002 to $36,000in 2007. Although this represents a decrease of 65 percent inthe five-year period, the majority of the price erosion occurredbetween 2002 and 2005. In the past two years prices havedeclined only 28 percent (see Figure 6. Median Monthly STM-1 Prices for Los Angeles-Sydney, 2002-2007).
Figure 6. Median Monthly STM-1 Prices for Selected Routes, 2002-2007
$0
$20,000
$40,000
$60,000
$80,000
$100,000
$120,000
2002 2003 2004 2005 2006 2007
Med
ian M
onth
ly S
TM
-1 L
ease
Pric
e (U
SD
) Los Angeles-SydneyLondon-New YorkLos Angeles-TokyoMiami-Sao PauloHong Kong-Tokyo
Notes: Prices are medians as of Q4 each year and exclude installation fees.
Australian Submarine Cable Market Analysis for Pipe Networks TeleGeography Research
8 of 35
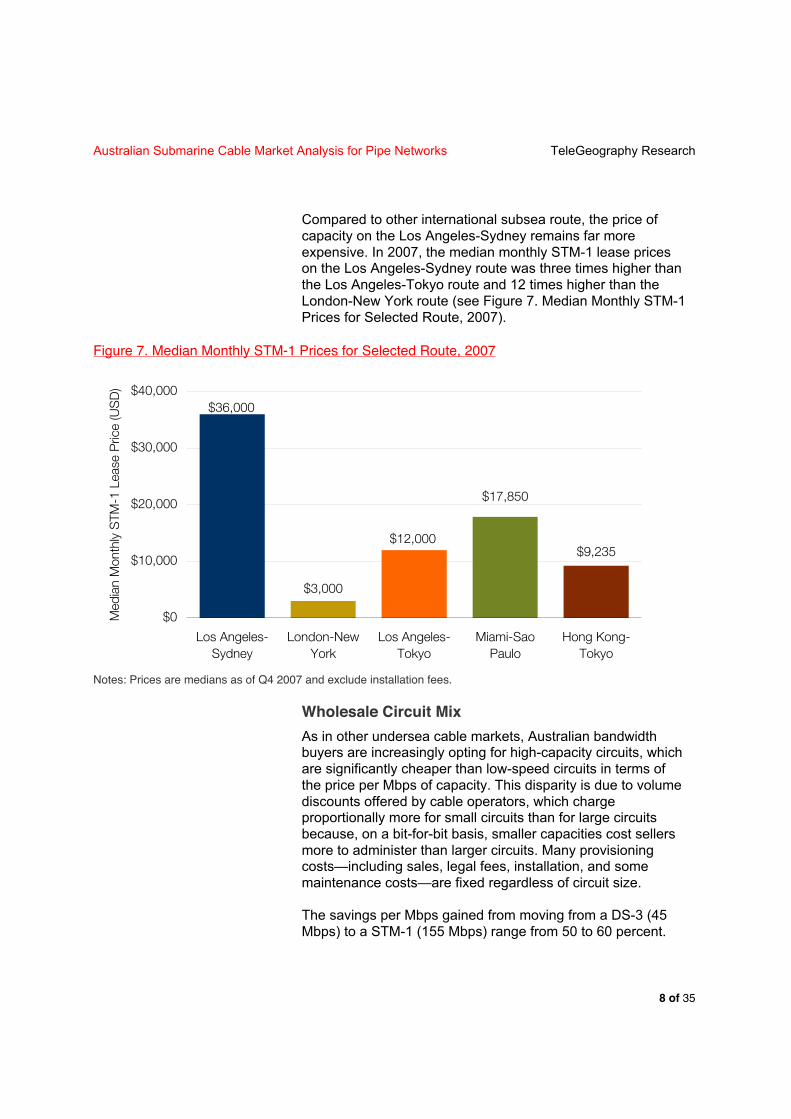
Compared to other international subsea route, the price ofcapacity on the Los Angeles-Sydney remains far moreexpensive. In 2007, the median monthly STM-1 lease priceson the Los Angeles-Sydney route was three times higher thanthe Los Angeles-Tokyo route and 12 times higher than theLondon-New York route (see Figure 7. Median Monthly STM-1Prices for Selected Route, 2007).
Figure 7. Median Monthly STM-1 Prices for Selected Route, 2007
$12,000
$17,850
$9,235
$3,000
$36,000
$0
$10,000
$20,000
$30,000
$40,000
Los Angeles-
Sydney
London-New
York
Los Angeles-
Tokyo
Miami-Sao
Paulo
Hong Kong-
Tokyo
Med
ian M
onth
ly S
TM
-1 L
ease
Pric
e (U
SD
)
Notes: Prices are medians as of Q4 2007 and exclude installation fees.
Wholesale Circuit Mix
As in other undersea cable markets, Australian bandwidthbuyers are increasingly opting for high-capacity circuits, whichare significantly cheaper than low-speed circuits in terms ofthe price per Mbps of capacity. This disparity is due to volumediscounts offered by cable operators, which chargeproportionally more for small circuits than for large circuitsbecause, on a bit-for-bit basis, smaller capacities cost sellersmore to administer than larger circuits. Many provisioningcosts—including sales, legal fees, installation, and somemaintenance costs—are fixed regardless of circuit size.
The savings per Mbps gained from moving from a DS-3 (45Mbps) to a STM-1 (155 Mbps) range from 50 to 60 percent.
Australian Submarine Cable Market Analysis for Pipe Networks TeleGeography Research
9 of 35
Consequently, bandwidth buyers have experienced significantunit cost reductions as their capacity purchases haveincreased. At the same time, cable operators’ revenues havenot grown at a proportional rate to increasing purchasevolumes.
TeleGeography data on the circuit composition of internationallinks connected to Australia document how bandwidthcustomers are steadily migrating to higher-rate circuits. Thecumulative effect of this shift on the overall circuit mix issubstantial. In 2002, STM-1 circuits represented 49 percent oftotal international Internet bandwidth to Australia. By 2007,STM-1 circuits declined to 21 percent of Australia’sinternational bandwidth (see Figure 8. Historical AustraliaInternational Capacity Circuit Mix, 2002-2007). While themigration to higher-capacity circuits has resulted in significantincreases in carriers' volume sales (as measured by Mbps ofcapacity sold), rapid declines in the effective unit price of thiscapacity have offset some of the expected revenue gains.

Australian Submarine Cable Market Analysis for Pipe Networks TeleGeography Research
10 of 35
Figure 8. Historical Australian International Capacity Circuit Mix, 2002 and 2007
2002
DS-3
39%
STM-1
49%
STM-4
8%
E-1
4%
2007
STM-4
21%
STM-16
24%STM-64
34%
Ethernet
9%
STM-1
7%Other
5%
The shift to higher-capacity circuits will continue in 2008-2018forecast period. The changes in products purchased are notjust moving towards higher capacity products but also the typeof products. TeleGeography expects the share of wavelengthsand Ethernet products to increase as carriers phase out SDHservices (see Figure 9. Forecasted Australia InternationalCapacity Circuit Mix, 2008-2018).

Australian Submarine Cable Market Analysis for Pipe Networks TeleGeography Research
11 of 35
Figure 9. Forecasted Australian International Capacity Circuit Mix, 2008-2018
0%
20%
40%
60%
80%
100%
2008 2009 2010 2011 2012 2013 2014 2015 2016 2017 2018
Share
of In
tern
atio
nal B
and
wid
th b
y P
rod
uct
Typ
e
Ethernet
Wavelengths
SDH
Wholesale IP Transit Prices
While the wholesale circuit prices to Australia discussedpreviously are based on international links, IP transit prices arelocal; that is, carriers and content providers purchase IP transitat a single node. In every case the price is determined by themarket at the geographic point of interconnection and the portsize into the backbone provider network—for instance, a STM-1 (155 Mbps) port in Sydney. IP Transit price levels inAustralia are largely a reflection of the relatively highunderlying costs of international capacity to Australia.
Since 2005 IP transit prices have tumbled in Sydney. Theaverage monthly price of an STM-1 port fell from $409 perMbps in 2005 to $175 per Mbps, a decline of 57 percent (seeFigure 10. IP Transit Prices for Selected Cities, 2005-2007).The average price for a FastE (100 Mbps) port declined 61percent to $165 per Mbps during the same period.

Australian Submarine Cable Market Analysis for Pipe Networks TeleGeography Research
12 of 35
Figure 10. Average IP Transit Prices for Selected Cities, 2005-2007
STM-1 Ports
! 2005 2006 2007
Sydney $409 $298 $175Los Angeles $33 $32 $28London $37 $36 $27Tokyo $83 $81 $64Hong Kong $76 $74 $60Singapore $239 $179 $105
FastE Ports
! 2005 2006 2007
Sydney $423 $295 $165Los Angeles $30 $30 $23London $37 $32 $25Tokyo $100 $99 $77Hong Kong $90 $93 $68Singapore $261 $190 $94Notes: Data shown are monthly price per Mbps for full-port capacity, excluding installation fees. Data as of Q4 ofeach year.
Despite the rapid decline of IP transit price in Australia since2005, prices remain well above those present in other majorcities around the world. In 2007, the price per Mbps of a FastEport in Sydney was more than seven times as expensive as acomparable port in Los Angeles. As a result, Australian ISPsroutinely opt to acquire trans-Pacific capacity on a submarinecable and then purchase IP transit in Los Angeles or SanFrancisco instead of Sydney.