Half Year 2018 Earnings Update - marketscreener.com · © SBM Offshore 2018. All rights reserved. ...
45
© SBM Offshore 2018. All rights reserved. www.sbmoffshore.com Half Year 2018 Earnings Update August 9, 2018
Transcript of Half Year 2018 Earnings Update - marketscreener.com · © SBM Offshore 2018. All rights reserved. ...

© SBM Offshore 2018. All rights reserved. www.sbmoffshore.com
Half Year 2018
Earnings Update
August 9, 2018

2 © SBM Offshore 2018. All rights reserved. www.sbmoffshore.com
Disclaimer
The companies in which SBM Offshore N.V. directly and indirectly owns investments are separate legal entities. In this presentation “SBM
Offshore” and “SBM” are sometimes used for convenience where references are made to SBM Offshore N.V. and its subsidiaries in general.
These expressions are also used where no useful purpose is served by identifying the particular company or companies.
This presentation contains forward-looking statements concerning the financial condition, results of operations and businesses of SBM. All
statements other than statements of historical fact are, or may be deemed to be, forward-looking statements. Forward-looking statements are
statements of future expectations that are based on management’s current expectations and assumptions and involve known and unknown
risks and uncertainties that could cause actual results, performance or events to differ materially from those expressed or implied in these
statements. Forward-looking statements include, among other things, statements concerning the potential exposure of SBM to market risks
and statements expressing management’s expectations, beliefs, estimates, forecasts, projections and assumptions. All forward-looking
statements contained in this presentation are expressly qualified in their entirety by the cautionary statements contained or referred to in this
section. Readers should not place undue reliance on forward-looking statements. Each forward-looking statement speaks only as of the date
of this presentation. Neither SBM Offshore N.V. nor any of its subsidiaries undertakes any obligation to publicly update or revise any forward-
looking statement as a result of new information, future events or other information. In light of these risks, results could differ materially from
those stated, implied or inferred from the forward-looking statements contained in this presentation.
© 2018. This presentation is the property of SBM Offshore N.V. or any of its subsidiaries (together referred as “SBM”) and contains material
protected by intellectual property rights, including copyrights, owned by SBM. The trademark "SBM Offshore", the SBM logomark and the
SBM trademark “Fast4ward” which covers a proprietary and patented SBM technology, are registered marks owned by SBM.
All copyright and other intellectual property rights in this material are either owned by SBM or have been licensed to SBM by the rightful
owner(s) allowing SBM to use this material as part of this presentation. Publication or other use, explicitly including but without limitation to
the copying, disclosing, trading, reproducing, or otherwise appropriating of information, illustrations etc., for any other purposes, as well as
creating derivative products of this presentation, is prohibited without the prior express written consent of SBM.

3 © SBM Offshore 2018. All rights reserved. www.sbmoffshore.com
Leading Global FPSO Contractor
> 50 FLOATING PRODUCTION
SYSTEMS DELIVERED
2 LARGE PROJECTS UNDER
CONSTRUCTION
> 300 years CUMULATIVE OPERATING
EXPERIENCE
+ 55% OIL PRODUCTION CAPACITY
SINCE 2014
1st
FAST4WARDTM CONCEPT
TO PROJECT AWARD
15 UNITS IN OPERATION
WORLDWIDE

© SBM Offshore 2018. All rights reserved. www.sbmoffshore.com
1H 2018 Review
Macro View
Company Positioning
1H 2018 Financials
Outlook
5 © SBM Offshore 2018. All rights reserved. www.sbmoffshore.com
2nd Success in Guyana
FEED contract awarded for 2nd FPSO Liza field offshore Guyana
Construction and Installation, Lease and Operate contracts awarded for
a period of up to 2 years, subject to project sanction
Making Fast4WardTM a reality
Oil production capacity of 220,000 bbls/day
source: SBM Offshore (general Fast4WardTM rendering)
source: ExxonMobil
> 4 billion boe
discovered since 2015
TM
source: ExxonMobil

6 © SBM Offshore 2018. All rights reserved. www.sbmoffshore.com
Total Overview Directional1
(1) Directional view, presented under IFRS8 Segment reporting, represents a pro-forma accounting policy, which assumes all lease contracts are classified as operating leases and all vessel investees are proportionally consolidated.
This explanatory note relates to all Directional in this document.
(2) Net debt as of June 30, 2018 includes a lease liability recognized for US$202 following the early adoption of IFRS 16.
Revenue
US$808 million
Underlying EBITDA
US$414 million
Pro-forma Backlog
US$16.1 billion
Net Debt2
US$2.3 billion
1H 2018 Financial Highlights

7 © SBM Offshore 2018. All rights reserved. www.sbmoffshore.com
Health, Safety and Environment
Greenhouse gas emissions
Flaring
Energy consumption
Oil released in produced water
2017 Safety performance sustained during 1H 2018
Health &
Safety
Environment
On track to meet 2018 Environmental targets
SDGs
Embedding Sustainable Development Goals
1
(1) Includes Shell, BP, Total, Chevron, Woodside, ExxonMobil, ENI, Statoil

8 © SBM Offshore 2018. All rights reserved. www.sbmoffshore.com
Normalized Business Relations with Petrobras
Start of internal
investigation and
immediate remedial
measures
2012 2014
US$240 million out-
of-court settlement
with Dutch
Prosecutor’s office
2017
Resolution with US
DoJ resulting in
payment of
US$238 million in
penalties
2018
Leniency
Agreement with
AGU1, CGU2 and
Petrobras in line
with US$299
million provision;
MPF3 not a party to
the agreement
(1) AGU (Advocacia Geral da União – “AGU”)
(2) CGU (Ministério da Transparência e Controladoria-Geral da União)
(3) MPF (Ministério Público Federal)
Excluded from
new business
with Petrobras
Normalized
business with
Petrobras
The Company has re-engaged with the MPF3 to discuss impact of the Leniency Agreement on the Improbity Lawsuit
and the request for provisional measures

© SBM Offshore 2018. All rights reserved. www.sbmoffshore.com
1H 2018 Review
Macro View
Company Positioning
1H 2018 Financials
Outlook

10 © SBM Offshore 2018. All rights reserved. www.sbmoffshore.com
Supply Gap
Lack of investment since
2014
Supply gap projected
Investment required
Not if,
but when
World Oil Supply and Demand
Existing supply + planned fields Extra recovery existing fields Demand range
Millio
n b
bls/d
Source: IEA

11 © SBM Offshore 2018. All rights reserved. www.sbmoffshore.com
0
20
40
60
80
100
120
140
TM
Shale2
Deepwater
30
35
40
45
50
55
60
0 2 4 6 8 10
Ave
ra
ge
B
re
nt B
re
ak
-e
ve
n P
ric
e
(U
S$
/b
bl)
Average Payback Time (years)
Deepwater is Competitive
Deepwater continues to gain
competiveness
>50% Deepwater projects
more competitive than shale
Traditional Deepwater longer
cycle
Deepwater cycle
time is key
Source: Goldman Sachs, Rystad Energy, BofAML
(1) Goldman Sachs Top Projects 2018 cost curve by win zone (prospective projects)
(2) Top five shale plays used as representative example
(3) Size of bubble corresponds to greenfield Capex expected to be sanctioned in 2018
US$100 billion Greenfield cost3
Project Economics
Oil Projects Cost Curve1
Shale
Deepwater
Traditional
Bre
ak
-e
ve
n P
ric
e
(b
bl/U
S$
)
Cumulative Peak Oil Production (kboe/d)
5,000
10,000
15,000
0

12 © SBM Offshore 2018. All rights reserved. www.sbmoffshore.com
Source: SBM Offshore research, company presentations
(1) Award FPSO Liza 2 subject to authorizations
Overall FPSO Market
Four awards to date in 2018
Up to 10 awards expected in
2018
2019 acceleration anticipated
Improving outlook
5
1
3
1
2
1
2
3
1 11
3
6
3
7
0
2
4
6
8
10
12
14
16
18
2005 2006 2007 2008 2009 2010 2011 2012 2013 2014 2015 2016 2017 e2018e2019
Historical and Estimated Total FPSO Market Awards
SBM Offshore Awards FPSO Awards FPSO Awards Bear Case FPSO Awards Bull Case

© SBM Offshore 2018. All rights reserved. www.sbmoffshore.com
1H 2018 Review
Macro View
Company Positioning
1H 2018 Financials
Outlook

14 © SBM Offshore 2018. All rights reserved. www.sbmoffshore.com
Vision Statement
SBM Offshore believes the oceans will provide the world with
safe, sustainable and affordable energy for generations to come
We share our experience to make it happen

15 © SBM Offshore 2018. All rights reserved. www.sbmoffshore.com
We Commit to Optimize, Transform, Innovate
Optimize
Best in Class
Transform
Standardization
Innovate
Gas & Renewables
floating solutions
Future
growth
Operational
excellence
16 © SBM Offshore 2018. All rights reserved. www.sbmoffshore.com
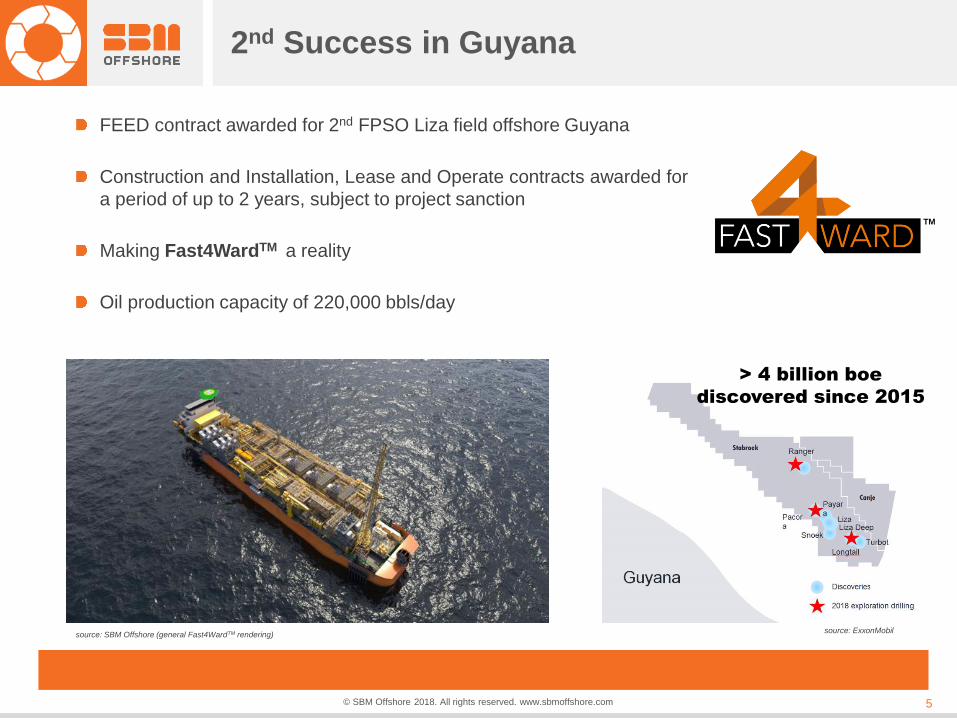
99.2%
99.4%
99.1%
99.1%
96.8%
98.3%
97.0%
2012 2013 2014 2015 2016 2017 1H 2018
Fleet Uptime
Lease and Operate
Strong track record: 99%
historical uptime
Producing ~10% of global
Deepwater oil
FPSO Capixaba life-time
extension and maintenance
Leading operator

17 © SBM Offshore 2018. All rights reserved. www.sbmoffshore.com
Fast4Ward™ Philosophy
Our ambition is to transform the
business by reducing cycle time to
energy delivery, de-risking
projects, and improving quality &
safety. This is what we refer to as
Fast4Ward™
Fast4Ward™ is based
on five key principles
1. Client first
2. Standardization
3. Flawless execution
4. Integrated supply chain
5. Enabling digital solutions
Fast4Ward™ Better Performance, Delivered Faster
TM

18 © SBM Offshore 2018. All rights reserved. www.sbmoffshore.com
The Answer
TM
Reducing cycle
time
Up to 12 months faster;
Up to US$1 bn NPV gain
De-risking
projects
Enabling lower
break-evens
Standardized hull and
topsides
Oil@
US$80/bbl
Oil@
US$50/bbl
-
400
800
1,200
1,600
2,000
3 months 6 months 9 months 12 months
US
$ m
illio
n N
et P
re
se
nt V
alu
e
Months of schedule gain
NPV impact accelerated delivery
Less engineering hours
Integrated supply chain
Greater safety and reliability
Fast4Ward™ Better Performance, Delivered Faster
Lower Capex and Opex

19 © SBM Offshore 2018. All rights reserved. www.sbmoffshore.com
Time is Money
0%
10%
20%
30%
40%
50%
30 40 50 60 70 80 90 100 110 120
Oil C
om
pa
ny IR
R
US$/bbl
Time to First Oil Scenarios1
1 yr gain
On time delivery
1 yr delay
2 yr delay
3 yr delay
300
500
700
900
1,100
30 50 70 90 110
US$/bbl
Estimated NPV Gain 12 Months Acceleration to First Oil1
(US$ million, rounded)
Fast4WardTM accelerates first
oil up to 12 months
Up to US$1 billion gain
Improves break-even up to
US$10 per barrel (IRR 15%)
Delivering
major gains
Source: Barclays
(1) Company estimate, based on Barclays data using a 10% discount rate, reflects major world-class greenfield development
20 © SBM Offshore 2018. All rights reserved. www.sbmoffshore.com
TM
0.5
0.7
0.9
1.1
1.3
1.5
1.7
0.5 0.7 0.9 1.1 1.3 1.5 1.7 1.9
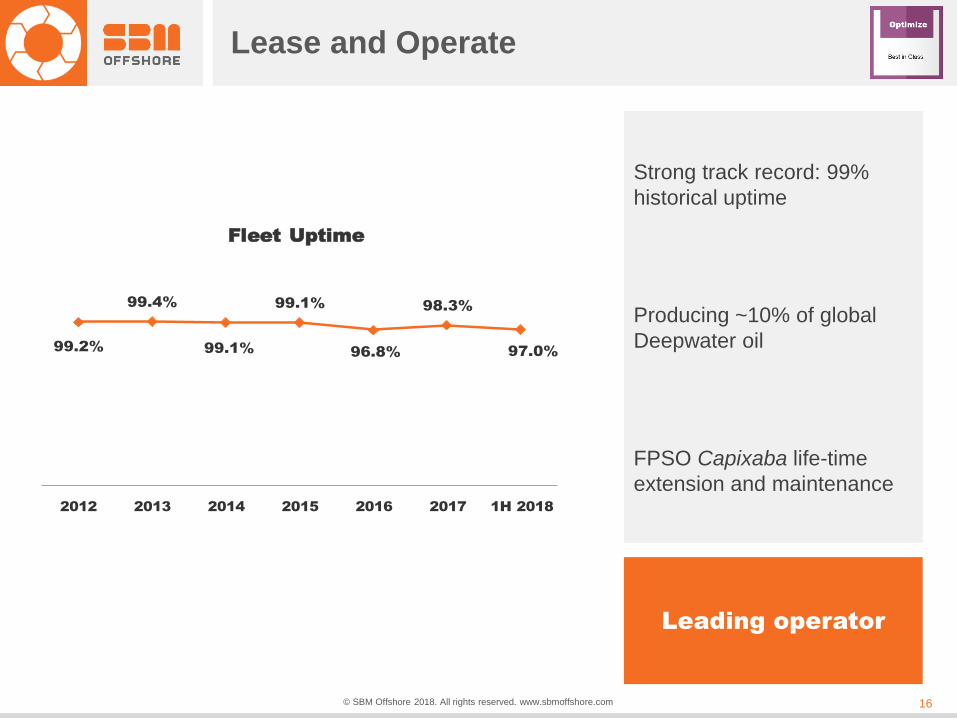
De-risking Delivery
Delivery is challenging
Fast4WardTM: lower risk and
higher return
Standardization and supply
chain integration
Experience matters
Source: Goldman Sachs, Rystad Energy, SBM Offshore company research
(1) Profitability Index = NPV/ Initial investment. Risk score is Goldman Sachs internal method based on technical and political risk
Risk
Deepwater
Pro
fita
bility
FPSO delivery delay (months)
FP
SO
p
ro
je
cts
Oil production sources

21 © SBM Offshore 2018. All rights reserved. www.sbmoffshore.com
New Age new-build
FLNG/LPG FEED
Associated gas project
offshore Cameroon
Gas and Renewables
Changing Energy Mix
Source: IEA
FLNG FEED

© SBM Offshore 2018. All rights reserved. www.sbmoffshore.com
1H 2018 Review
Macro View
Company Positioning
1H 2018 Financials
Outlook

23 © SBM Offshore 2018. All rights reserved. www.sbmoffshore.com
835 808
Total Overview Directional1
1H 2017 1H 2018 1H 2017
Revenue (US$ millions) EBITDA (US$ millions)
1H 2018
2.9
2.3
16.816.1
Pro-Forma Backlog (US$ billions)
FY 2017
1H 2018
FY 2017
1H 2018
Net Debt2 (US$ billions)
431 414
647
(1) Directional view, presented under IFRS8 Segment reporting, represents a pro-forma accounting policy, which assumes all lease contracts are classified as operating leases and all vessel investees are proportionally consolidated.
This explanatory note relates to all Directional in this document.
(2) Net debt as of June 30, 2018 includes a lease liability recognized for US$202 following the early adoption of IFRS 16. For comparison purposes, an amount of US$218 million related to IFRS 16 was added to the net debt position
as of December 2017.
Underlying

24 © SBM Offshore 2018. All rights reserved. www.sbmoffshore.com
Financial Performance per Segment Directional (US$ millions)
Lease and Operate
Turnkey
Other segment: Underlying EBITDA 1H 18 US$(30) million vs 1H17 US$(29) million
25 © SBM Offshore 2018. All rights reserved. www.sbmoffshore.com
(1) Restated for adoption of updated tax calculation method under Directional
(2) DA&I = depreciation, amortization and impairments; NFC = net financing costs; SPA = share of profit of associates
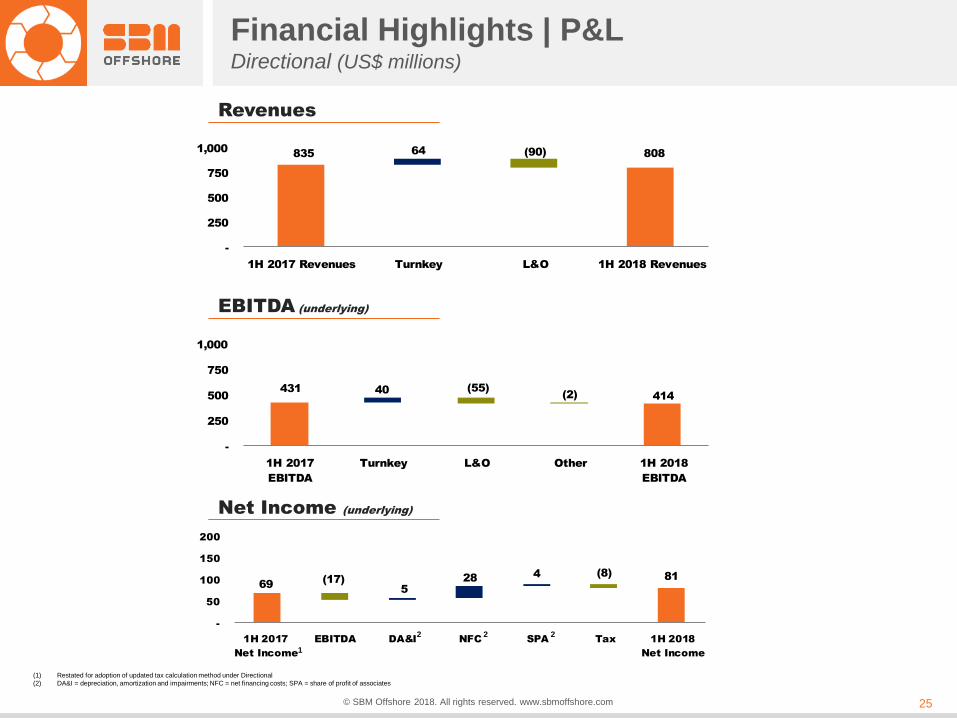
69
81(17)
(8)
5
284
-
50
100
150
200
1H 2017
Net Income
EBITDA DA&I NFC SPA Tax 1H 2018
Net Income
Financial Highlights | P&L Directional (US$ millions)
Revenues
EBITDA (underlying)
Net Income (underlying)
835 808(90)64
-
250
500
750
1,000
1H 2017 Revenues Turnkey L&O 1H 2018 Revenues
431
414
(55)(2)
40
-
250
500
750
1,000
1H 2017
EBITDA
Turnkey L&O Other 1H 2018
EBITDA
1
2 2 2
26 © SBM Offshore 2018. All rights reserved. www.sbmoffshore.com
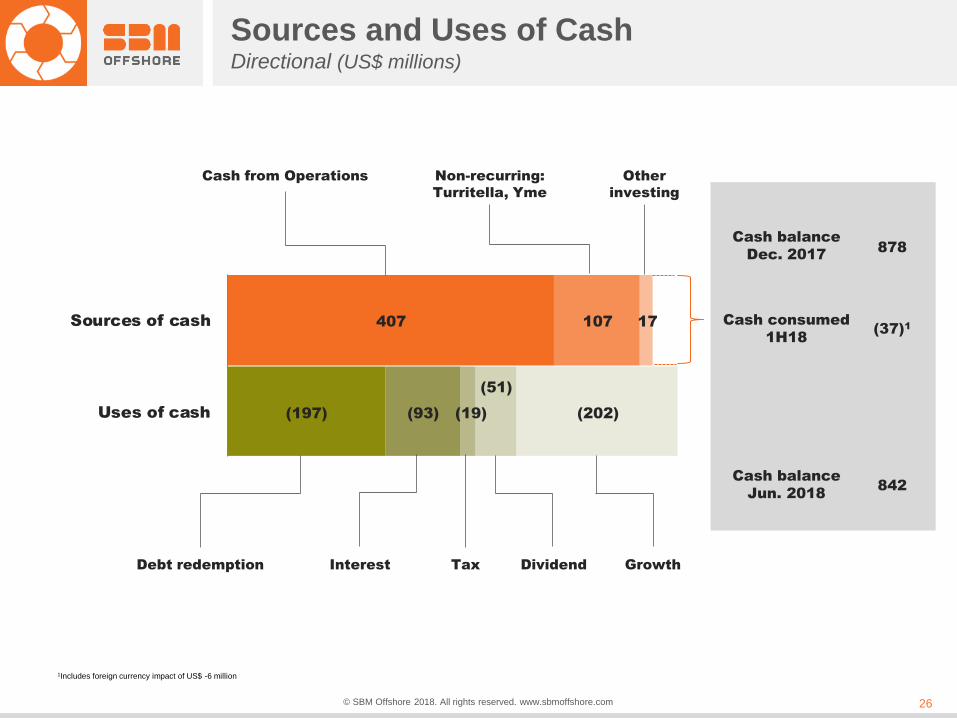
Sources and Uses of Cash Directional (US$ millions)
(197)
407
(93)
107
(19)
17
(51)
(202)Uses of cash
Sources of cash
Cash from Operations
Non-recurring:
Turritella, Yme
Other
investing
Debt redemption Interest Tax Dividend Growth
1Includes foreign currency impact of US$ -6 million
Cash balance
Dec. 2017
Cash balance
Jun. 2018
878
842
(37)1
Cash consumed
1H18

27 © SBM Offshore 2018. All rights reserved. www.sbmoffshore.com
Group Balance Sheet Directional (US$ millions)
Dec-31-17 Jun-30-18
Variance Comment
Property, plant & equipment and
Intangibles 4,692 4,792 100
Asset recognition (IFRS 16) and FPSO Liza 1 project
Capex partially offset by depreciation
Investments in associates and
other financial assets 304 300 (4) JVs net result
Construction contracts 18 34 16 Turnkey activity increase
Trade and other assets 691 784 93 Higher turnkey project activities and Fast4WardTM
Cash and cash equivalents 878 842 (36) See Cash Flow statement
Assets held for sale 332 4 (328) FPSO Turritella disposal
Total Assets 6,915 6,756 (159)
Total equity 1,097 1,360 263 Group results partially offset by dividends paid
Borrowings and lease liabilities 3,565 3,191 (374)
Liability recognition (IFRS 16) partially offsetting
repayment of Turritella and amortization of other
project loans
Provisions 971 813 (158) De-recognition of onerous contract provision (IFRS
16) and Turritella partner compensation
Trade payables, deferred income
and derivatives liabilities 1,282 1,391 109 Higher turnkey project activities
Total Equity and Liabilities 6,915 6,756 (159)

© SBM Offshore 2018. All rights reserved. www.sbmoffshore.com 28
Cash Flow Model and Dividend
* RCF may also be used for M&A and general corporate purposes
Company Cash Flows
Dividend Track Record
2015 2016 2017
Annual Dividend (US$/share) 0.21 0.23 0.25
Y-o-Y Dividend Increase - 10% 9%
Share Repurchase (US$, millions) - 166 -

© SBM Offshore 2018. All rights reserved. www.sbmoffshore.com
1H 2018 Review
Macro View
Company Positioning
1H 2018 Financials
Outlook

30 © SBM Offshore 2018. All rights reserved. www.sbmoffshore.com
0.180
0.3700.390 0.400
0.310 0.3000.270
0.190 0.200 0.190
0.110 0.110
0.040
0.0
0.2
0.4
0.6
2H18 2020 2022 2024 2026 2028 2030 2032 2034 2036
0
0.2
0.4
0.6
0.8
1
1.2
1.4
1.6
2H 2018 2020 2022 2024 2026 2028 2030 2032 2034 2036
Backlog and Borrowings Repayment As of June 30, 2018 (US$ billions)
Directional Borrowings Repayment Profile3
Pro-forma Directional Backlog1
Lease & Operate Turnkey
US$ 16.1 bn
15.4
0.7
Average of 63% of L&O backlog represents operating cash flow
L&O Average Portfolio Duration: 11.4 years2
(1) Backlog is the undiscounted revenue over the confirmed portion of the contract. Includes FPSO Liza contracts
(2) Assumes the exercise of all lease extensions
(3) The difference between current borrowings and the borrowings repayment profile are attributable to capitalized transaction costs, rounding applied on the data labels
0.0
0.2
0.4
0.6
0.8
1.0
2018 2020 2022 2024 2026 2028 2030 2032 2034 2036

31 © SBM Offshore 2018. All rights reserved. www.sbmoffshore.com
2018 Guidance
2018 Directional Revenue guidance of US$1.7 billion, adjusted from US$1.9 billion
due to Company assuming Liza 1 remaining fully Company owned
Lease & Operate Revenue reiterated at around US$1.3 billion
Turnkey Revenue adjusted from around US$0.6 billion to around US$0.4 billion
2018 Underlying Directional EBITDA guidance maintained at around US$750 million:
Includes: changed assumption of partnering for Liza 1 and positive effect from early
adoption IFRS 16 (c. US$30 million)
Excludes: positive one-off effects from Turritella sale (US$217 million) and Yme net
insurance proceeds (US$16 million)

© SBM Offshore 2018. All rights reserved. www.sbmoffshore.com
Appendix

33 © SBM Offshore 2018. All rights reserved. www.sbmoffshore.com
Lease and Operate P&L (US$ millions)
Comments
Vessels In -
Vessels Out Turritella, Yetagun
Underlying EBITDA Decrease mainly driven by Turritella leaving the fleet and planned maintenance
EBITDA Margin 1H 2017: 64.8%
1H 2018: 65.3%
Directional
1H 2017 1H 2018 Variance
Revenue 745 654 (91)
Gross Margin 262 218 (44)
EBIT 250 208 (42)
Depreciation, amortization and impairment (233) (219) 14
EBITDA 482 427 (55)
Underlying EBITDA 482 427 (55)
34 © SBM Offshore 2018. All rights reserved. www.sbmoffshore.com
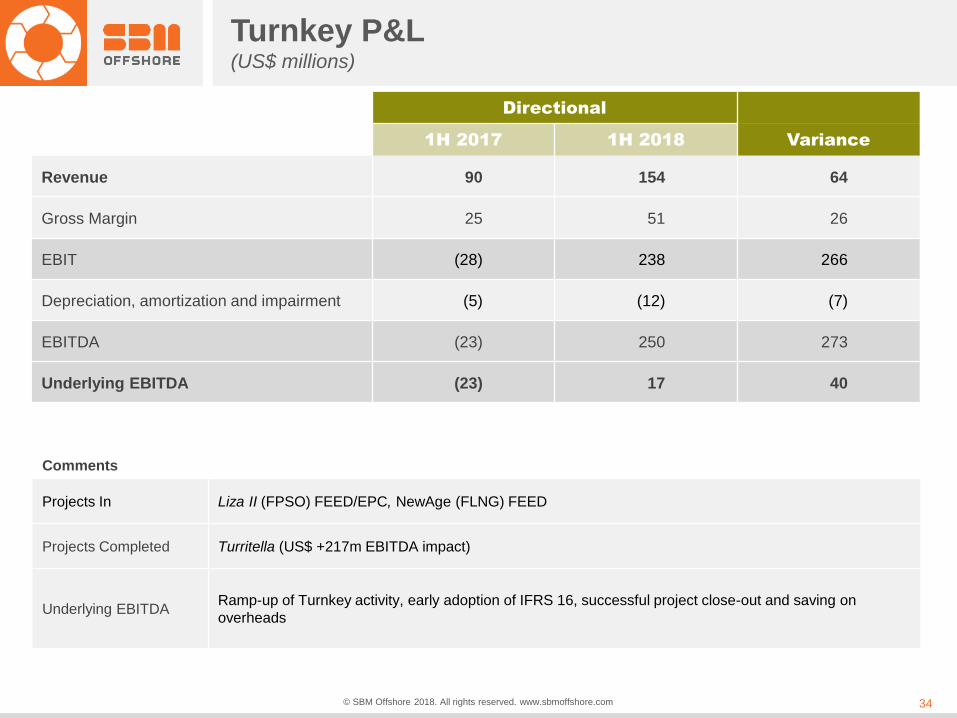
Turnkey P&L (US$ millions)
Comments
Projects In Liza II (FPSO) FEED/EPC, NewAge (FLNG) FEED
Projects Completed Turritella (US$ +217m EBITDA impact)
Underlying EBITDA Ramp-up of Turnkey activity, early adoption of IFRS 16, successful project close-out and saving on
overheads
Directional
1H 2017 1H 2018 Variance
Revenue 90 154 64
Gross Margin 25 51 26
EBIT (28) 238 266
Depreciation, amortization and impairment (5) (12) (7)
EBITDA (23) 250 273
Underlying EBITDA (23) 17 40
35 © SBM Offshore 2018. All rights reserved. www.sbmoffshore.com
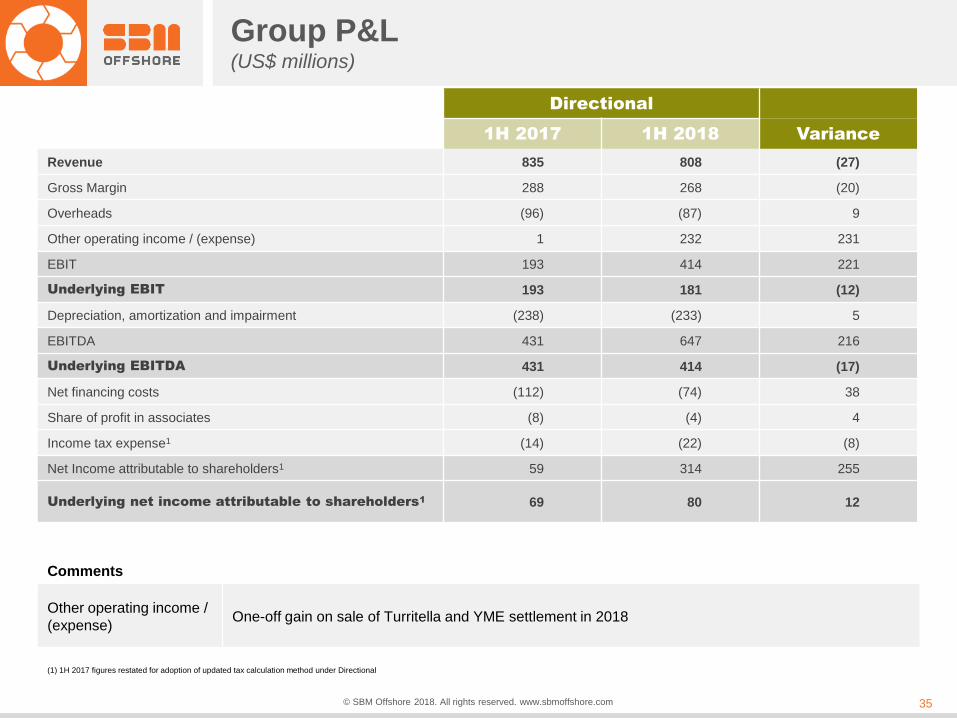
Comments
Other operating income /
(expense) One-off gain on sale of Turritella and YME settlement in 2018
Group P&L (US$ millions)
Directional
1H 2017 1H 2018 Variance
Revenue 835 808 (27)
Gross Margin 288 268 (20)
Overheads (96) (87) 9
Other operating income / (expense) 1 232 231
EBIT 193 414 221
Underlying EBIT 193 181 (12)
Depreciation, amortization and impairment (238) (233) 5
EBITDA 431 647 216
Underlying EBITDA 431 414 (17)
Net financing costs (112) (74) 38
Share of profit in associates (8) (4) 4
Income tax expense1 (14) (22) (8)
Net Income attributable to shareholders1 59 314 255
Underlying net income attributable to shareholders1 69 80 12
(1) 1H 2017 figures restated for adoption of updated tax calculation method under Directional

36 © SBM Offshore 2018. All rights reserved. www.sbmoffshore.com
Cash Flow Statement (US$ millions)
Directional
1H 2018
EBITDA 647
Addition/(release) provision and non-cash items (218)
Changes in operating assets and liabilities (121)
Income taxes paid (19)
Net cash flows from (used in) operating activities 289
Capital expenditures (141)
Other investing activities 10
Addition to and repayments of funding loans 5
Net proceed from disposal of financial assets and other assets 544
Net cash flows from (used in) investing activities 419
Addition and repayments of borrowings and loans (595)
Dividends paid to shareholders (51)
Interests paid (93)
Net cash flows from (used in) financing activities (739)
Foreign currency variations (6)
Net increase/(decrease) in net cash and cash
equivalents (37)
Net cash and cash equivalents as at 31 Dec. ’17 878
Net cash and cash equivalents as at 30 Jun. ’18 842

37 © SBM Offshore 2018. All rights reserved. www.sbmoffshore.com
IFRS 10 & 11
(1) Kikeh lease classification changed from OL to FL effective 1Q14
Joint Ventures Lease Contract
Type SBM Share % Directional IFRS
FPSO N’Goma FL 50% Proportional Equity
FPSO Saxi Batuque FL 50% Proportional Equity
FPSO Mondo FL 50% Proportional Equity
FPSO Cdde de Ilhabela FL 62.25% Proportional Full consolidation
FPSO Cdde de Maricá FL 56% Proportional Full consolidation
FPSO Aseng FL 60% Proportional Full consolidation
FPSO Cdde de Paraty FL 50.5% Proportional Full consolidation
FPSO Cdde de Saquarema FL 56% Proportional Full consolidation
FPSO Kikeh1 FL 49% Proportional Equity
FPSO Capixaba OL 80% Proportional Full consolidation
FPSO Espirito Santo OL 51% Proportional Full consolidation
N’kossa II OL 50% Proportional Equity
Deep Panuke OL 100% 100% Full consolidation
Thunder Hawk OL 100% 100% Full consolidation
FPSO Cidade de Anchieta OL 100% 100% Full consolidation
FPSO Liza FL 100% 100% Full consolidation
Brasa Yard - 50% Equity Equity
PAENAL Yard - 30% Equity Equity
Normand Installer - 49.9% Equity Equity
OS Installer - 25% Equity Equity

38 © SBM Offshore 2018. All rights reserved. www.sbmoffshore.com
Directional Group Net Debt and Borrowings (US$ millions)
Directional Net Debt(1)
1H18 Borrowings(2)
1H18 Undrawn Facilities + Cash
$2,9881H18
Directional
(1) Net debt as of June 30, 2018 includes a lease liability recognized for US$202 following the early adoption of IFRS 16. For comparison purposes, an amount of US$218 million related to IFRS 16 was added to the net debt position as of December 2017.
(2) The difference between current borrowings and the borrowings repayment profile are attributable to capitalized transaction costs.
Average Cost of Debt

39 © SBM Offshore 2018. All rights reserved. www.sbmoffshore.com
Group Loans & Borrowings (US$ millions)
Net Book Value as of June 30, 2018
Full Amount IFRS Directional
PROJECT FINANCE FACILITIES DRAWN
FPSO Cidade de Paraty 574 574 291
MOPU Deep Panuke 233 233 233
FPSO Cidade de Anchieta 354 354 354
FPSO Cidade de Ilhabela 848 848 528
FPSO N’Goma FPSO 300 0 150
Normand Installer 39 0 0
OS Installer 84 0 0
FPSO Cidade de Maricá 1,263 1,263 707
FPSO Liza (9) (9) (9)
FPSO Cidade de Saquarema 1,315 1,315 736
REVOLVING CREDIT FACILITY Revolving credit facility (2) (2) (2)
OTHER Other long-term debt 284 12 1
Net book value of loans and borrowings 5,283 4,588 2,989

40 © SBM Offshore 2018. All rights reserved. www.sbmoffshore.com
Revised RCF Covenant Definitions
Key Financial Covenant Definition
Solvency Ratio Tangible Net Worth(1) divided by Total Tangible Assets(2) > 25%
Leverage Ratio Consolidated Net Borrowings(3) divided by Adjusted EBITDA(4)
– <4.25x at December 31, 2017
– <3.75x thereafter
Interest Cover Ratio Adjusted EBITDA(4) divided by Net Interest Payable(6) > 4.0
(1) Total Equity (including non-controlling interests) of SBM Offshore N.V. in accordance with IFRS excluding the mark to market valuation of currency and interest derivatives undertaken for hedging purposes
by SBM Offshore N.V. through Other Comprehensive Income.
(2) SBM Offshore N.V’s total assets (excluding intangible assets) in accordance with IFRS Consolidated Statement of Financial position less the mark to market valuation of currency and interest derivatives
undertaken for hedging purposes by SBM Offshore N.V. and included as consolidated total assets in the consolidated financial statements.
(3) Outstanding principal amount of any moneys borrowed or element of indebtedness (excluding money borrowed from partners in joint ventures) aggregated on a proportional basis for the Company’s share
of interest less the consolidated cash and cash equivalents available.
(4) Consolidated earnings before interest, tax and depreciation of assets and impairments of SBM Offshore N.V. in accordance with IFRS except for all lease and operate joint ventures being then
proportionally consolidated, adjusted for any exceptional or extraordinary items, and by adding back the capital portion of any finance lease received by SBM Offshore N.V. during the period.
(5) Consolidated Net Borrowings adjusted by deducting the moneys borrowed or any element of indebtedness allocated to any project during its construction on a proportional basis for the Company’s share of
interest.
(6) All interest and other financing charges paid up, payable (other than capitalized interest during a construction period and interest paid or payable between wholly owned members of SBM Offshore N.V.) by
SBM Offshore N.V. less all interest and other financing charges received or receivable by SBM Offshore N.V., as per IFRS and on a proportional basis for the Company’s share of interests in all lease and
operate joint ventures.

41 © SBM Offshore 2018. All rights reserved. www.sbmoffshore.com
Revolving Credit Facility
Historical and Estimated Awards
Key Characteristics
Amount US$1.0 billion
Tenor
6 years + one-year extension
Door-to-door maturity of 7 years
Accordion
Option
SBM may request an increase of the
Facility to US$1.25 billion
Opening
Margin
70 bps vs. 125 bps applicable in late
2014 under the previous RCF
Financial
Ratios
See previous slide
Permitted
Guarantees
Completion Guarantees including debt
repayment guarantees up to US$6.0
billion
Covenant Calculations
Solvency
Ratio
Tangible Net Worth divided by Total
Tangible Assets
Leverage
Ratio
Consolidated Net Borrowings divided by
Adjusted EBITDA
Interest
Cover
Ratio
Adjusted EBITDA divided by Net Interest
Payable
All covenants are satisfied
Min FY17 1H18
25% 32.5% 35.5%
Max FY17 1H18
3.75 3.0 2.4
Min FY17 1H18
4.0 5.2 5.8

42 © SBM Offshore 2018. All rights reserved. www.sbmoffshore.com
SBM Lease and Operate Portfolio
L&O Portfolio Average Duration: 11.4 years1
Initial Lease Period Confirmed Extension Contractual Extension Option
(1) Assumes the exercise of all lease extensions
Please note: FPSO Anchieta extension date updated; FPSO Turritella, FSO Yetagun removed from overview after purchase and contract expiry; PFC Deep Panuke extension removed
Vessel Name Field Name Client Country 2005 2006 2007 2008 2009 2010 2011 2012 2013 2014 2015 2016 2017 2018 2019 2020 2021 2022 2023 2024 2025 2026 2027 2028 2029 2030 2031 2032 2033 2034 2035 2036 2037 2038 2039 2040 2041
LEASE AND OPERATE
FPSO
1 FPSO Cdde de Anchieta BALEIA AZUL Brazil
2 FPSO N'Goma FPSO BLOCK 15/06 Angola
3 FPSO Capixaba CACHALOTE Brazil
4 FPSO Mondo MONDO Angola
5 FPSO Kikeh KIKEH Malaysia
6 FPSO Saxi Batuque SAXI BATUQUE Angola
7 FPSO Espirito Santo BC-10 Brazil
8 FPSO Aseng ASENG Eq. Guinea
9 FPSO Cdde de Paraty LULA NORDESTE Brazil
10 FPSO Cdde de Ilhabela GUARA NORTE Brazil
11 FPSO Cdde de Maricá LULA ALTO Brazil
12 FPSO Cdde de Saquarema LULA CENTRAL Brazil
13 FPSO Liza Destiny LIZA Guyana
MOPU/Semi-sub
14 Thunder Hawk Semi-sub. MISS. CANYON BLK. USA
15 Deep Panuke PFC DEEP PANUKE Canada
FSO
16 N'kossa II NKOSSA Congo
OPERATE
17 FPSO Serpentina ZAFIRO Eq. Guinea
12/13 12/21
11/14 11/34
11/11 11/3111/26
02/1707/03 08/11
11/18 11/2111/96 11/06
06/12 06/30 06/32
04/10 02/22
08/07 01/22 01/3101/16
12/07 12/2712/22
07/08 06/23 06/28
01/09 12/2812/23
06/13 06/33
07/16 07/36
02/16 02/36
08/09 08/2808/25
11/2911/14 11/26
'20 '39'29
04/22

43 © SBM Offshore 2018. All rights reserved. www.sbmoffshore.com
0
50
100
150
200
250
1 6 11 16 21 26 31 36 41
Cu
mu
la
tive
O
pe
ra
tin
g E
xp
erie
nc
e (Y
rs)
Cumulated FPSOs Built (as main contractor)
Concentrated Industry Experience
Unique track record in EPC,
FPSO delivery and operations
SBM Offshore’s
unique experience = Industry peers, bubble size relates to cumulative throughput capacity of FPSOs built (kboepd)
3 800 kboepd
1 600 kboepd
Source: SBM Offshore research
44 © SBM Offshore 2018. All rights reserved. www.sbmoffshore.com
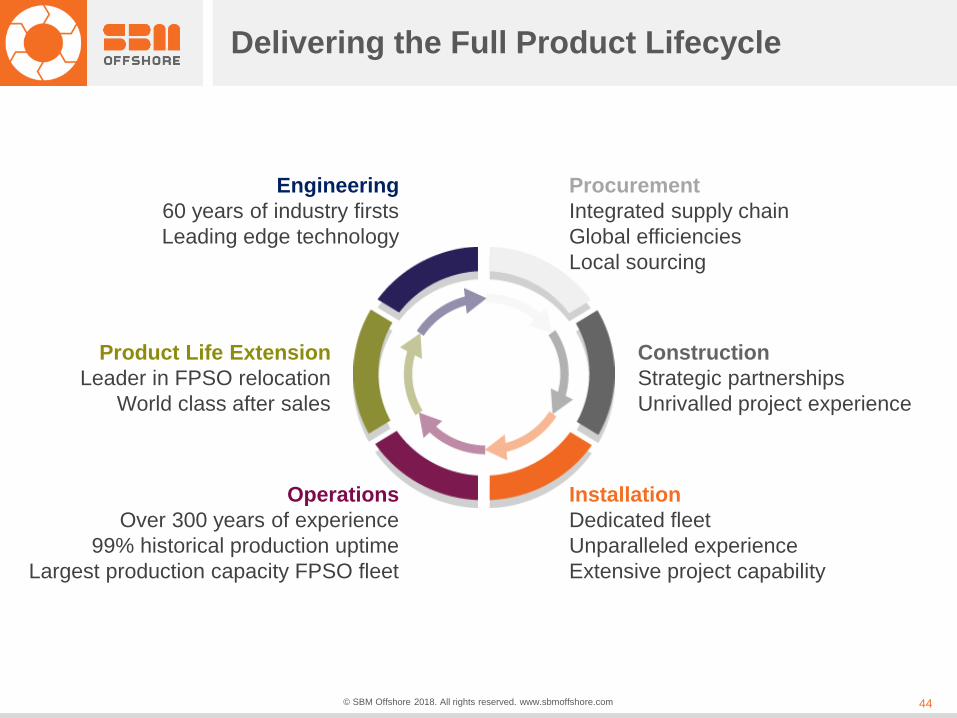
Delivering the Full Product Lifecycle
Product Life Extension
Leader in FPSO relocation
World class after sales
Construction
Strategic partnerships
Unrivalled project experience
Procurement
Integrated supply chain
Global efficiencies
Local sourcing
Installation
Dedicated fleet
Unparalleled experience
Extensive project capability
Operations
Over 300 years of experience
99% historical production uptime
Largest production capacity FPSO fleet
Engineering
60 years of industry firsts
Leading edge technology

© SBM Offshore 2018. All rights reserved. www.sbmoffshore.com