Hale COLLAGE 2017 Lecture 21 Radiative processes from ...
32
Hale COLLAGE 2017 Lecture 21 Radiative processes from energetic particles II: Gyromagnetic radiation Bin Chen (New Jersey Institute of Technology)
Transcript of Hale COLLAGE 2017 Lecture 21 Radiative processes from ...

Hale COLLAGE 2017 Lecture 21
RadiativeprocessesfromenergeticparticlesII:Gyromagneticradiation
BinChen(NewJerseyInstituteofTechnology)

Previouslectures
1) Magneticreconnectionandenergyrelease
2) Particleaccelerationandheating3) Chromosphericevaporation,loop
heatingandcoolinge-
e-
magneticreconnection
Shibata et al. 1995
Followinglectures:Howtodiagnosetheacceleratedparticlesandtheenvironment?• What?• Where?• When?
How?

Outline• Radiationfromenergeticparticles• Bremsstrahlungà Previouslecture• Gyromagneticradiation(“magnetobremsstrahlung”)
• Otherradiativeprocesses• Coherentradiation,inverseCompton,nuclearprocesses
• Suggestedreading:• Synchrotronradiation:Chapter5 of“EssentialRadioAstronomy”byCondon&Ransom2016
• Gyroresonance radiation:Chapter5ofGary&Keller2004• Gyrosynchrotron radiation:Dulk&Marsh1982
• Nexttwolectures:DiagnosingflareenergeticparticlesusingradioandhardX-rayimagingspectroscopy
à Thislectureà Brieflyinthenextlecture
Radiationfromanacceleratedcharge
8/3/10
10
Radio'Emission'
'Thermal'bremsstrahlung'(eAp)' 'Gyrosynchrotron'radia5on'(eAB)' 'Plasma'radia5on'(wAw)'
Larmor'formulae:'radia5on'from'an'accelerated'charge''
Rela5vis5c'Larmor'formulae''
Cases'relevant'to'radio'and'HXR/gammaAray'emission:''
Accelera2on#experienced#in#the#Coulomb#field:'bremsstrahlung'Accelera2on#experience#in#a#magne2c#field:#gyromagne5c'radia5on'
€
dPdΩ
=q2
4πc 3a2 sin2θ
€
P =2q2
3c 3a2
θ"
Larmor formula:
RelativisticLarmor formula:
8/3/10
10
Radio'Emission'
'Thermal'bremsstrahlung'(eAp)' 'Gyrosynchrotron'radia5on'(eAB)' 'Plasma'radia5on'(wAw)'
Larmor'formulae:'radia5on'from'an'accelerated'charge''
Rela5vis5c'Larmor'formulae''
Cases'relevant'to'radio'and'HXR/gammaAray'emission:''
Accelera2on#experienced#in#the#Coulomb#field:'bremsstrahlung'Accelera2on#experience#in#a#magne2c#field:#gyromagne5c'radia5on'
€
dPdΩ
=q2
4πc 3a2 sin2θ
€
P =2q2
3c 3a2
θ"
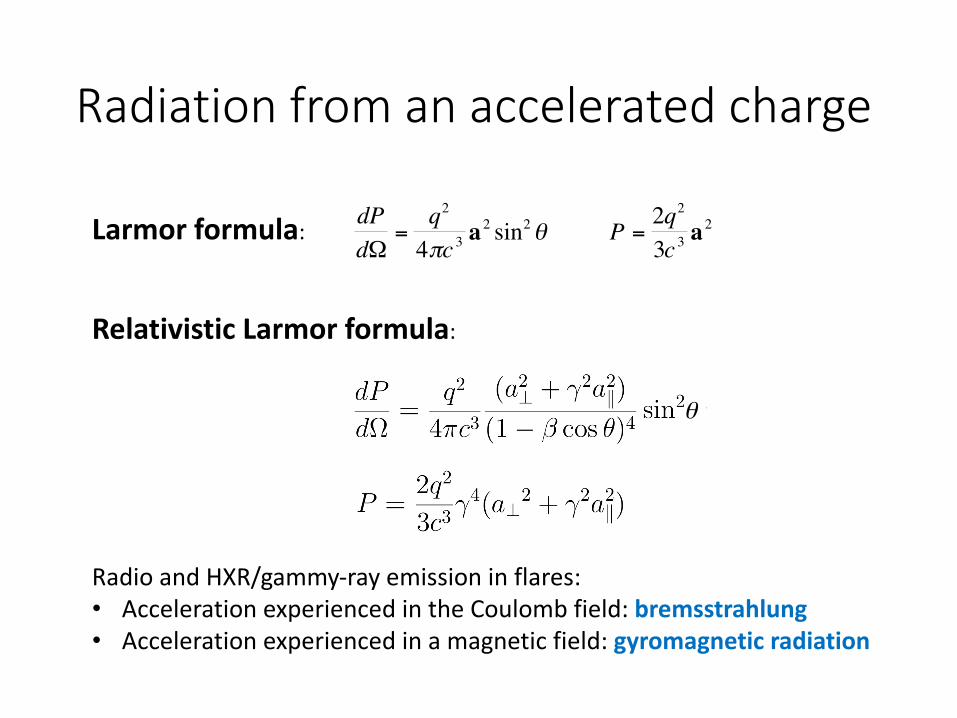
RadioandHXR/gammy-rayemissioninflares:• AccelerationexperiencedintheCoulombfield:bremsstrahlung• Accelerationexperiencedinamagneticfield:gyromagneticradiation

Gyromagneticradiation
• Gyromagneticradiation(sometimescalled“gyroemission”)isduetotheaccelerationexperiencedbyanelectronasitgyratesinaBfieldduetotheLorentzforce.• Accelerationisperpendicular to𝑣"

Gyroemission fromasingleelectron
• Let’sstartfromLarmor’s formula:
• Perpendicularacceleration:𝑎$ = 𝜔'"𝑣$,where𝜔'" isthe(angular)electrongyrofrequency𝜔'" = 2𝜋𝜈'" =
"+,-'
≈ 2𝜋 / 2.8𝐵MHz• (Directionintegrated)Larmor’s equationbecomes:
𝑃 =2𝑒5
3𝑐8 𝜔'"5 𝑣$5
• Relativisticcase:𝑃 = 5"9
8':𝛾<𝜔+5𝑣$5,with𝜔+ =
"+=,-'
= >?-=
8/3/10
10
Radio'Emission'
'Thermal'bremsstrahlung'(eAp)' 'Gyrosynchrotron'radia5on'(eAB)' 'Plasma'radia5on'(wAw)'
Larmor'formulae:'radia5on'from'an'accelerated'charge''
Rela5vis5c'Larmor'formulae''
Cases'relevant'to'radio'and'HXR/gammaAray'emission:''
Accelera2on#experienced#in#the#Coulomb#field:'bremsstrahlung'Accelera2on#experience#in#a#magne2c#field:#gyromagne5c'radia5on'
€
dPdΩ
=q2
4πc 3a2 sin2θ
€
P =2q2
3c 3a2
θ"

Radiationpattern:non-relativistic
• Larmor’s Equation
8/3/10
10
Radio'Emission'
'Thermal'bremsstrahlung'(eAp)' 'Gyrosynchrotron'radia5on'(eAB)' 'Plasma'radia5on'(wAw)'
Larmor'formulae:'radia5on'from'an'accelerated'charge''
Rela5vis5c'Larmor'formulae''
Cases'relevant'to'radio'and'HXR/gammaAray'emission:''
Accelera2on#experienced#in#the#Coulomb#field:'bremsstrahlung'Accelera2on#experience#in#a#magne2c#field:#gyromagne5c'radia5on'
€
dPdΩ
=q2
4πc 3a2 sin2θ
€
P =2q2
3c 3a2
θ"
Dipolepattern
Nullat𝜃 = 0
𝜃
Observer

Radiationpattern:relativistic• Relativisticcase(𝛾 ≫ 1)• Intherestframeoftheelectron
𝑑𝑃E
𝑑ΩE =𝑞5
4𝜋𝑐8 𝒂5sin5𝜃E
• Intheobserver’sframe,radiationpatternfoundfromLorentztransformfromtheelectronrestframe
Nulloccursat𝜃 = ±arccos 1/𝛾
Stronglybeamedforwardalongthedirectionoftheelectron!
Observer

Relativisticgyroemission:sharplypulsedradiation170 Synchrotron Radhtion
Figurn 6.2 Emission cones at variouS points of an accelerated particle's trajectory.
the direction of observation. The distance As along the path can be computed from the radius of curvature of the path, a = As/AB.
From the geometry we have A0 = 2/y, so that As = 2 a / y . But the radius of curvature of the path follows from the equation of motion
AV 4 ym- = - v x B , A t c
Since (Av( = v A 0 and As = v At, we have
A 0 qBsina As ymcv '
wB sin a '
-=-
V a = -
(6.8a)
(6.8b)
Note that this differs by a factor sina from the radius of the circle of the projected motion in a plane normal to the field. Thus A s is given by
2u yw, sin a
As = (6.8~)
The times t, and t, at which the particle passes points 1 and 2 are such that A s = u(t, - t , ) so that
2 y o B sin a '
t , - t ,x
Let t f and tt be the arrival times of radiation at the point of observation
Spectrum of Synchrottwn Radiation: A plalitotiiw Discussion 171
from points 1 and 2. The difference 12” - t;’ is less than t , - t , by an amount As/c, which is the time for the radiation to move a distance As. Thus we have
A t A = 1: - = 2 (1-4). yw, sin (Y
(6. I Oa)
I t should be noted that the factor ( 1 - v / c ) is the same one that enters the Doppler effect [cf. 34.11. Since y>>l. we have
so that
(6.10b) - I
A t ” ~ ( y ~ ~ , s i n a ) .
Therefore, the width of the observed pulses is smaller than the gyration period by a factor y3. The pulse is shown in Fig. 6.3. From our general discussion of spectra associated with particular pulses, 02.3, we expect that the spectrum will be fairly broad, cutting off at frequencies like l / A t A . If we define a critical frequency
a,. E - 3 3 y -w , sina (6.1 la) 2
or
3 3 v c = - y w,sina, 47
f
(6.1 lb)
Figure 6.3 radiation
Time-dependence of the electric fiehi in u pulse of synchrotron
∆𝑡U ∝W
=:>X= W=9>?-
∆𝑡U ∝W
=>X? ∆𝑡U = 𝑡 endofpulse − 𝑡 startofpulse
= ∆𝑥𝑣 +
𝑥 − ∆𝑥𝑐 −
𝑥𝑐 =
∆𝑥𝑣 1 −
𝑣𝑐 ≪
∆𝑥𝑣 = ∆𝑡

Powerspectrum𝑃(𝜈)
• Foranonrelativistic electron,radiationfield𝐸 𝑡 isasinusoidwithfrequency𝜔'"• Powerspectrumisasingletoneattheelectrongyrofrequency

• Astheelectronspeedpicksup,mildbeaming effecttakesplace,𝐸 𝑡 isnon-sinusoidal• Lowharmonicsofelectrongyrofrequency showupinthepowerspectrum
Powerspectrum𝑃(𝜈)
Canyouidentifytwoeffectsinthe𝐸 𝑡 plot?

Powerspectrum𝑃(𝜈)
• Whentheelectronisrelativistic𝐸 𝑡 ishighlypulsed
184 Synchrotron Radiation
t . . ( r ) +
bJ
Figrrre 6lOa in a magnetic field (synchrotron radiation).
Time depmrdence of electric fwiV from a q & ' y mooing parti&
Fipw 6 106 Power spectrum for a.
6.7 DISTINCTION BETWEEN RECEIVED AND EMITTED POWER
In about 1968 (e.g., Pacholczyk, 1970; Ginzburg and Syrovatshi, 1969), it was noticed that a proper distinction between received and emitted power had not been made. (In looking at references before then check your formulas carefully.) The problem is that the received pulses are not at the frequency wB but at an appropriately Doppler-shifted frequency, because of the progressive motion of the particle toward the observer. This can be seen clearly in Fig. 6.11. If T= 27r/wB is the orbital period of the projected motion, then time-delay effects (cf. 94.1), will give a period between the arrival of pulses TA satisfying
2a . X-sin'cr.
*B (6.39)
• Thepowerspectrumshowscontributionfrommanyharmonics
184 Synchrotron Radiation
t . . ( r ) +
bJ
Figrrre 6lOa in a magnetic field (synchrotron radiation).
Time depmrdence of electric fwiV from a q & ' y mooing parti&
Fipw 6 106 Power spectrum for a.
6.7 DISTINCTION BETWEEN RECEIVED AND EMITTED POWER
In about 1968 (e.g., Pacholczyk, 1970; Ginzburg and Syrovatshi, 1969), it was noticed that a proper distinction between received and emitted power had not been made. (In looking at references before then check your formulas carefully.) The problem is that the received pulses are not at the frequency wB but at an appropriately Doppler-shifted frequency, because of the progressive motion of the particle toward the observer. This can be seen clearly in Fig. 6.11. If T= 27r/wB is the orbital period of the projected motion, then time-delay effects (cf. 94.1), will give a period between the arrival of pulses TA satisfying
2a . X-sin'cr.
*B (6.39)

Typesofgyromagneticradiation
• Gyromagneticradiationbehavesverydifferentlywithdifferentelectrondistributions• Aprecisegeneralexpressionvalidforallelectronenergiesisnot available.Instead,weuseapproximateexpressionsforvariouselectronenergyregimes
v Non-relativisticorthermal(𝛾 − 1 ≪ 1):Gyroresonance orcyclotron radiation
vMildlyrelativistic(𝛾 − 1~1 − 5):Gyrosynchrotron radiation
v Ultra-relativistic(𝛾 − 1 ≫ 1):Synchrotronradiation
Thermal
Non-thermal

Transition from C’lotron to Synchrotron Emission 183
Figiin? 6% wfoci@ in a magnetic jieU
Time depednce of electric field from a particle of intemediate
( h )
Figiin? 69b Power spectrum for a
physical broadening mechanism occurs for a distribution of particle en- ergies; then the gyration frequency o, is proportional to l / y , so that the spectra of the particles do not fall on the same lines. Another effect that will cause the spectrum to become continuous is that emission from different parts of the emitting region may have different values and directions for the magnetic field, so that the harmonics fall at different places in the observed spectrum.
The electric field received by the observer from a distribution of par- ticles consists of a random superposition of many pulses of the kind described here. The net result is a spectrum that is simply the sum of the spectra from the individual pulses (see Problem 3.6).
Thermalgyroresonance radiation• AtagivenB,thermalgyroresonance radiationisessentiallya“spectralline”centeredat𝑠𝜈'",where𝑠 = 1, 2, 3… istheharmonicnumber• Particularlyrelevantaboveactiveregionsatmicrowavefrequencies– Why?• Spectralwidthofagivenresonanceline
∆𝜈/𝑠𝜈'" ≈mXn,-'9
�
Verynarrowinthecorona(~1/3000)• Highopacityonlyatthese“resonancelayers”

• Twodifferentwavemodes:ordinary(omode)andextraordinary(xmode,gyrateswiththesamesenseofrotationasanelectron)
• Opacityfortwodifferentwavemodes
Thermalgyroresonance opacity
Whereand
94 SOLAR AND SPACE WEATHER RADIOPHYSICS
coefficient integrated through the layer) as a function of the frequency ∫, theharmonic number s (which determines ∫B = ∫/s and hence B in the layer),and the angle µ between the magnetic field direction and the line of sight:
øx,o(s, ∫, µ) = .0133ne LB(µ)
∫
s2
s!
µs2 sin2 µ
2µ
∂s°1
Fx,o(µ) (5.1)
where LB(µ) is the scale length of the magnetic field (B/@B@l ) evaluated along
the line of sight. For simplicity we have set the refractive index to be unity in(1). Fx,o(µ) is a function of angle which is of order unity for the x mode nearµ = 90±, but decreases sharply at smaller µ, and is smaller in the o mode thanin the x mode. At angles µ away from 90± it is often approximated by
Fx,o(µ) º°1 ° æ cos µ
¢2 (5.2)
with æ = °1 for the x mode and æ = 1 for the o mode. However, thisapproximation is really only appropriate when the two natural electromagneticmodes are perfectly circularly polarized, and at the low harmonics (s = 1,2,3,4)relevant to the corona this is rarely a good assumption. Zlotnik (1968a) presentsaccurate expressions for Fx,o(µ) which correctly handle the mode polarizationproperties. (Note that Zlotnik’s formulae are presented in the limit that therefractive index is unity, and require a small correction when ∫p ª ∫B .)In Figure 5.1 we present exact calculations of ø , the optical depth of a gy-
roresonant layer, for typical coronal conditions (T = 3 £ 106 K, LB = 109 cm)and a fixed frequency of 5 GHz at the appropriate harmonics s = 2, 3 and 4.Both the x (solid lines) and o (dashed lines) modes are shown. For comparison,we also plot the approximation represented by (2) (dotted lines).A number of features should be noted in this figure:
• For typical coronal conditions, the x mode is optically thick (ø ∏ 1)in the s = 2 and 3 layers over a broad range of angles µ. The o mode isoptically thick over most of the s = 2 layer, andmay be at least marginallyoptically thick over a small portion of the s = 3 layer if µ is large. Har-monics greater than s = 4 do not have any significant optical depth in thequiet solar corona.
• At each harmonic and angle the omode opacity is always at least an orderof magnitude smaller than the x mode opacity, despite the fact that (2)predicts that they should be nearly equal for a range of µ around 90±. Theapproximation (2) is adequate for the x mode at small µ, but is poor forthe o mode at all µ, being easily a factor of 2 or more in error even atsmall angles.
𝜇 = 𝑚"𝑐5/𝑘+𝑇
𝜎 = −1 forxmodeand1foromode,𝐿+ isthescalelengthofB
One,charged,par.cle,in,B,�,
�,
�, �,
�, �,�,
�, �, �, �,
�, �, �,
v�,
rg,
B'
q,,m, gyrofrequency:,
Ωc =qBmc
= 2π fc
Ωce = 2×10⁹ rad/s
B100G#
$%
&
'(e$s:,
gyroradius:,
rg =v⊥Ωc
e$s:, rge =1.0cmB
100G!
"#
$
%&
−1ε
1keV!
"#
$
%&
1/2
really,fast,
really,small,
Whichmodehasalargeropacity?Why?

Thermalgyroresonance opacityCoronal Magnetic Field Measurements through Gyroresonance Emission 95
0 20 40 60 80Angle (degrees)
10-2
100
102
104
Gyr
ores
onan
ce o
ptica
l dep
th
X
O
s = 2B = 892 Gn = 10. 109 cm-3
0 20 40 60 80Angle (degrees)
X
O
s = 3B = 595 Gn = 6.7 109 cm-3
0 20 40 60 80Angle (degrees)
X
O
s = 4B = 446 Gn = 5.0 109 cm-3
Figure 5.1. The (integrated) optical depth of the s = 2, 3, 4 gyroresonance layers at 5 GHz(left, middle and right panels, respectively) as a function of the angle µ between the line of sightand the magnetic field direction. The temperature in the source is 3 £ 106 K, and the magneticscale height LB is 109 cm. In each panel the solid line is the optical depth of the layer in the xmode, and the dashed line is the optical depth in the o mode. The dotted lines show the opticaldepth obtained using the circularly-polarized mode approximation (2). The density used for thiscalculation was decreased as s increases to simulate the decrease of ne with height: the valuesare shown in each panel.
• The opacity drops sharply towards small µ in both modes. At angles veryclose to 90±, the o mode opacity dips sharply since it must be a factor ofµ smaller than the x mode opacity exactly at µ = 90± (e.g., Bornatici etal. 1983, Robinson 1991). By (1), the opacity is zero at µ = 0± for s > 1.The sin2s°2 µ-dependence of (1) causes the fall-off towards small µ to bemuch more rapid as s increases.
• For each increase of s by 1, the opacity in a given mode at a given angledrops by slightly more than 2 orders of magnitude. This is largely dueto the µ°s dependence of (1). The importance of this large change inopacity from one layer to the next is that a given harmonic layer is likelyto be either optically thick over a wide range of angles µ, or else opticallythin everywhere.
Typically,opticallythickatS=2(o-mode)and3(x-mode)
𝜈 = 5 GHz𝑇 = 3MK𝐿+ = 10Mm
FromWhite2004

Gyroresonance emissionofasunspotCoronal Magnetic Field Measurements through Gyroresonance Emission 97
0
2.0•103
4.0•103
6.0•103
8.0•103
1.0•104
1.2•104
Hei
ght (
km)
x,o thin
x thick, o thin
x,o thick
-10000 0 10000Radius (km)
0
0.5
1.0
1.5
2.0
2.5
T B (1
06 K)
x mode
o mode
Figure 5.2. Plots of the gyroresonance layers of a dipole sunspot model (upper panel) and thepredicted brightness temperatures resulting from an observation of such a spot (lower panel),viewed nearly vertically (actually 1± off vertical). In the upper panel the thin solid lines aremagnetic lines of force and the dotted lines are the s = 1, 2, 3, 4 gyroresonance layers, withs = 4 the highest and s = 1 the lowest layer. Where the gyroresonance layers are opticallythick (i.e., ø ∏ 1) in the o mode, they have been overplotted with a thick solid line. Except inthe s = 1 layer where the x mode does not propagate, a layer which is optically-thick in theo mode is also thick in the x mode. If a gyroresonance layer is optically thick in the x modebut not in the o mode, it is overplotted with a thick dashed line. In the lower panel, the x-modebrightness temperature is shown by a solid line and the o mode brightness temperature by adashed line. The frequency is 5.0 GHz, the dipole is buried at a depth of 1.2 £ 109 cm, and themaximum field strength at the surface is 2500 G. In the model temperature increases with radialheight from 1.0 £ 106 K at the base of the corona (zero height in this case) to 3.0 £ 106 K atabout 15000 km.
temperature of order 105 K, which provides the outer boundary of theradio source.
• On the s = 3 layer, the omode is only (marginally) optically thick at thelow-lying outer edge of the layer where µ is largest, but the temperature isrelatively low there because of the low altitude. The x mode is opticallythick in the s = 3 layer to within ª 5000 km from the center of the
FromWhite2004

ActualobservationfromtheVLA
MadebyB.ChenforAR12158(unpublished)
Q:Whichpolarizationisthex-mode?
RCP
LCP

from J. Lee

Nonthermalsynchrotronradiation
• Ultra-relativistic(𝛾 − 1 ≫ 1)• Fromasingleelectron,adjacent”spikes”areseparatedinfrequencybyonly∆𝜈 = v?-
=• Fluctuationsinelectronenergy,Bstrength,orpitchanglecause“broadening”ofthespikes• Spectrumisvirtuallycontinuous
184 Synchrotron Radiation
t . . ( r ) +
bJ
Figrrre 6lOa in a magnetic field (synchrotron radiation).
Time depmrdence of electric fwiV from a q & ' y mooing parti&
Fipw 6 106 Power spectrum for a.
6.7 DISTINCTION BETWEEN RECEIVED AND EMITTED POWER
In about 1968 (e.g., Pacholczyk, 1970; Ginzburg and Syrovatshi, 1969), it was noticed that a proper distinction between received and emitted power had not been made. (In looking at references before then check your formulas carefully.) The problem is that the received pulses are not at the frequency wB but at an appropriately Doppler-shifted frequency, because of the progressive motion of the particle toward the observer. This can be seen clearly in Fig. 6.11. If T= 27r/wB is the orbital period of the projected motion, then time-delay effects (cf. 94.1), will give a period between the arrival of pulses TA satisfying
2a . X-sin'cr.
*B (6.39)

Synchrotronspectrum𝑃(𝜈) fromasingleelectron
𝑥 = 𝜈/𝜈'
Mostoftheenergyisemittedat𝜈 ≈ 𝜈',where
isthecriticalfrequency(𝛼 isthepitchangle)
𝜈' =85𝛾5𝜈'" sin 𝛼

Synchrotronspectrumofanopticallythinsource• Oneelectronofelectron𝐸 nearlyemitsallenergyatasinglefrequency𝜈 ≈ 𝛾5𝜈'"• Opticallythinsourceà togetemissivity𝑗v in(ν, 𝜈 + 𝑑𝜈),justadd𝑃 𝜈 = −𝑑𝐸/𝑑𝑡 upfromallelectronswithin(𝐸, 𝐸 + 𝑑𝐸):
𝑗v𝑑𝜈 = −𝑑𝐸𝑑𝑡 𝑓 𝐸 𝑑𝐸
• Assumeapowerlawelectronenergydistribution:𝑓 𝐸 = 𝐶𝑛"𝐸}~
• Theemissivity𝑗v ∝ 𝜈}(~}W)/5

190 Synchrotron Radiation
gives
(6.53)
The source function can be found from
(6.54)
using Eq. (6.53). A simple way of deriving this latter result is to note that S, can be written as S, a v2E where E is a mean particle energy [cf. Eqs. (6.52) and (6.54). The appropriate value for E is the energy of those electrons whose critical frequency equals v, that is, E2a vc = v, so that one obtains the proportionality given in Eq. (6.54). It is of some interest that the source function is a power law with an index - $, independent of the value of p . It should be particularly noted that this index is not equal to - 2, the Rayleigh-Jeans value, because the emission is nonthennal.
For optically thin synchrotron emission, the observed intensity is pro- portional to the emission function, while for optically thick emission it is proportional to the source function. Since the emission and source func- tions for a nonthermal power law electron distribution are proportional to v - ( ~ - ’ ) / ~ and v 5 / 2 , respectively, [cf. eqs. (6.22a) and (6.54)] we see that the optically thick region occurs at low frequencies and produces a low- frequency cutoff of the spectrum (see Fig. 6.12).
log v
Figuw 6 1 2 Synchrotron spectrum from a power-law distribution of electrons.
Synchrotronspectrum:opticallythickregime
• Synchrotronbrightnesscannotbearbitrarilyhighà self-absorptionbecomesimportantatlowfrequencies• Thespectrumhasapowerlawofslope5/2foropticallythicksource
𝜈�/5 𝜈}(~}W)/5

Gyrosynchrotron radiation
• Frommildlyrelativisticelectrons(~1toseveralMeV)• Expressionsfortheemissionandabsorptioncoefficientaremuchmorecomplicatedthanthenonrelativistic(thermalgyroresonance)andultra-relativistic(synchrotron)case
Ramaty 1969
Benka &Holman1992
Petrosian 1981
Dulk &Marsh1982,1985
Klein1987
“exact”approximate

Spectrumisalsomorecomplicated
Klein(1987)

B=100G
B=200G
B=500G
B=1000G
𝜈Um~𝐵8/<

nrel=1x107 cm-3
nrel=5x106 cm-3
nrel=2x106 cm-3
nrel=1x106 cm-3
npk~nrel1/4

q=20o
q=40oq=60o
q=80onpk~q1/2

(Gyro)synchrotronspectrum
1982ApJ...259..350D
SchematicdiagramfromDulk &Marsh1982

Gyrosynchrotron inflares
1 Introduction Solar flares involve the catastrophic release of energy in the low corona. Plasma is heated to temperatures of 2-3 x 10⁷ K and particles are accelerated to relativistic energies on short time scales. A large flare may require the acceleration of 3710 electrons s�1 to energies >20 keV for periods of tens of seconds (Miller et al. 1997). Flares can be accompanied by the ejection of mass by an associated filament eruption and/or a coronal mass ejection. Fig. 1 shows an example of a long-duration flare seen in thermal soft X-rays and nonthermal microwave emission. A schematic illustration of the structure of magnetic flare loops is shown in the left side of Fig. 2. Briefly, magnetic energy release occurs in the low corona through fast magnetic reconnection. It is believed to be a highly fragmented process, with many discrete energy release events occurring. Electrons and ions are promptly accelerated to high energies by a largely unknown mechanism or mechanisms involving quasi-static electric fields, shocks, and/or stochastic processes (Miller et al. 1997). Electrons with small pitch angles propagate along the magnetic field to the chromosphere where they are stopped, emitting nonthermal thick-target bremsstrahlung hard X-ray (HXR) radiation. Electrons with sufficiently large pitch angles remain trapped in magnetic loops until pitch-angle diffusion due to Coulomb collisions or wave-particle interactions cause them to propagate down to the chromosphere where they, too, emit HXR radiation. Chromospheric plasma heated by electron precipitation fills coronal magnetic loops where it emits copious soft-X-rays (SXR). A blast wave and/or fast ejecta produced by the flare may produce MHD shocks in the corona and an associated coronal type II radio burst. Collimated beams of suprathermal electrons may produce fast-drift type III radio bursts.
Fig. 1 Examples of energetic emissions from a solar flare. The upper panels show gyrosynchro-tron emission from nonthermal electrons at 17 and 34 GHz obtained by the Nobeyama Radio-heliograph. The bottom panels shows the corresponding EUV and SXR emission from hot thermal plasma.
FromT.Bastian
FlareobservedbySOHO,GOES,andNobeyama Radioheliograph at17and34GHz• Microwave: gyrosynchotron• EUV/SXR:hotthermalplasma

Bastianetal1998
Aschematicmodelofaflareloop

Summary
• Gyromagneticradiationresultsfromelectronsacceleratedinthemagneticfield• Threedifferentregimesbasedonenergyofthesourceelectrons:gyroresonance,gyrosynchrotron,andsynchrotron• Gyroresonance canbeusedtodiagnoseBfieldsinactiveregions• Gyrosynchrotron canbeusedtoprobeflare-acceleratedelectronsanddiagnoseBfieldinflareloops• Synchrotron ismorerelevanttocosmicsources,butstillpossibleontheSun(e.g.,themysterioussub-THzflarecomponent)