Hagberg falling number test made · • No boiling water bath Safer • No breakable glass tubes...
16
Hagberg falling number test made easier , safer and faster
Transcript of Hagberg falling number test made · • No boiling water bath Safer • No breakable glass tubes...

Hagberg falling number test made
easier, safer and faster

Developed in the early 1960's by Sven
Hagberg at the Cereal Laboratory of the
Swedish Institute for the Crafts and Industries.
Purpose: provide a rapid means of detecting
sprout-damaged wheat or rye
1972: AACC International Method 56-81.03
Falling Number method – 1960's until today

The consequences of using sprouted wheat…


Induction heating system : for a greater safety
and precision
No need to check the water bath level / add water
Heating profile is set to exactly mimic the temperature gradient of a
standard falling number device get the same results

Detects sprout damage
Measures alpha amylase
activity
Uses state-of-the-art
technology for easier and
safer operation
Provides a new testing
method, called
Testogram, for faster test
results (on whole grain)
Amylab FN

Faster results means shorter lines during harvest!!!

First reported in 1997 by Pr. Valery Chernykh
Principle = measure the viscosity during 90 seconds of shaking
– Starch gelatinization, enzymatic hydrolysis (liquefaction) occur within
the first two minutes
– High consistency = low amylase activity
Amylab FN – What is the Testogram method?
Gelatinization Liquefaction

How does Testogram work?

How does Testogram work?

Testogram – example of results
0
100
200
300
400
500
600
700
800
900
1000
0 10 20 30 40 50 60 70 80 90
Forc
e (
g)
Time (s)
Example of results
FN = 168 s
FN = 247 s
FN = 270 s
FN = 390 s
FN = 340 s
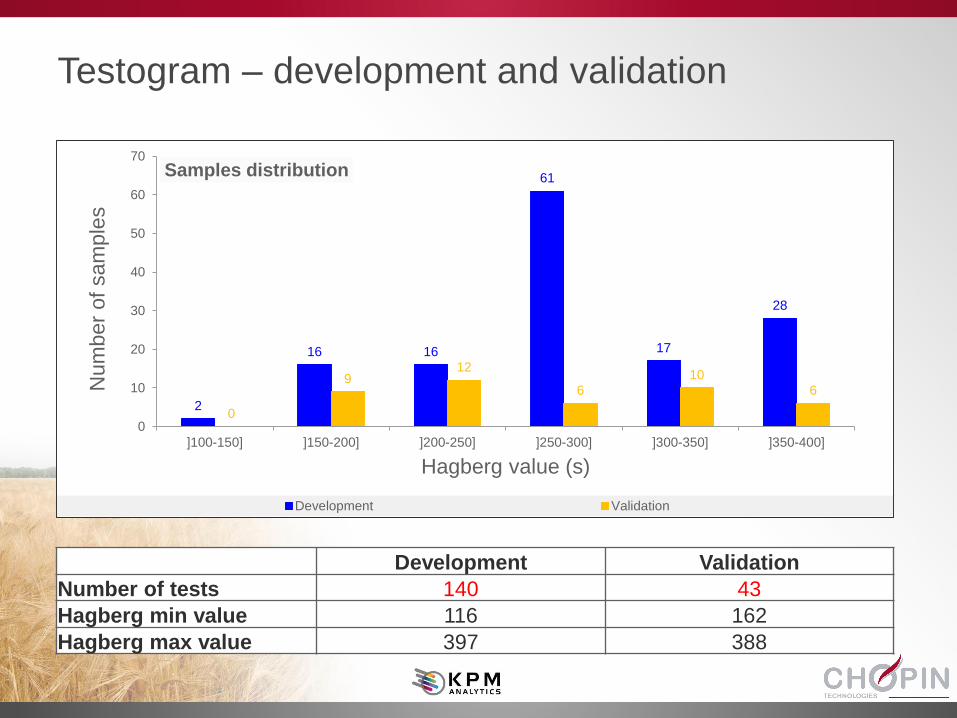
Development Validation
Number of tests 140 43
Hagberg min value 116 162
Hagberg max value 397 388
Testogram – development and validation
2
16 16
61
17
28
0
912
610
6
0
10
20
30
40
50
60
70
]100-150] ]150-200] ]200-250] ]250-300] ]300-350] ]350-400]
Num
ber
of
sam
ple
s
Hagberg value (s)
Samples distribution
Development Validation

Testogram – how accurate is it?
y = 0.9992x – 0.2393R² = 0.9188
y = 0.9895x + 5.434R² = 0.941.
0
50
100
150
200
250
300
350
400
450
0 50 100 150 200 250 300 350 400 450
Hagberg
valu
e (
s)
Hagberg value predicted by Testogram (s)
Development ISO 3093 uncertainty limits Validation

* Average difference between
reference value and Testogram
predicted value
** % of samples predicted within
ISO 3093 uncertainty limits
Testogram – how accurate is it?
Development Validation
r2 0.92 0.94
|Pred-Ref|* 15 s 13 s
% IN** 99 98
0
50
100
150
200
250
300
350
400
450
0 50 100 150 200 250 300 350 400 450
Hagb
erg
va
lue
(s)
Hagberg value predicted by Testogram (s)
Development ISO 3093 uncertainty limits Validation
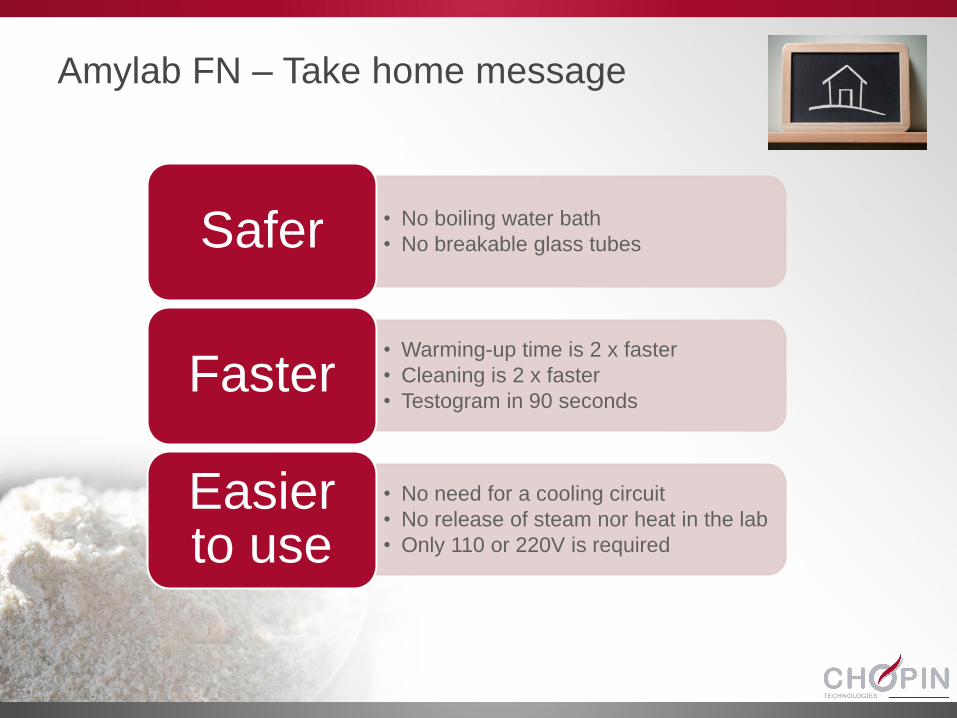
Amylab FN – Take home message
• No boiling water bath
• No breakable glass tubesSafer
• Warming-up time is 2 x faster
• Cleaning is 2 x faster
• Testogram in 90 secondsFaster
• No need for a cooling circuit
• No release of steam nor heat in the lab
• Only 110 or 220V is required
Easier to use

Thank you
for your attention
Questions?